


Abstract
Baiyangdian Lake, the largest freshwater lake in North China, plays a critical role in the ecological security of the Beijing–Tianjin–Hebei urban agglomeration. This study conducted systematic monitoring of Baiyangdian Lake from April 2023 to November 2024. Utilizing the Trophic State Index (TSI) and principal component analysis (PCA), we elucidated the impact mechanisms of extreme precipitation events on the water quality of shallow lakes. The results indicate that: (1) During the study period, Baiyangdian Lake exhibited moderate to severe eutrophication. The average total nitrogen (TN) concentration was 2.13 mg/L, exceeding the Class V threshold of the national surface water quality standard. The average total phosphorus (TP) concentration was 0.05 mg/L, far surpassing the recognized eutrophication threshold for freshwater lakes. (2) The average TSI was 49.6 ± 4.0, indicating the lake is in a transitional state from mesotrophy to eutrophy, with 64% of sampling sites classified as eutrophic. Nitrogen was identified as the primary limiting nutrient. (3) The 2023 extreme precipitation event exerted a significant three-phase impact on water quality: “dilution–legacy–restoration”. A clear dilution effect was observed from the pre-flood to the flood period (TN decreased from 1.52 to 1.04 mg/L). A pronounced legacy effect emerged post-flood, with the TN concentration sharply increasing to 4.22 mg/L in September 2023, the highest value recorded during the study. (4) PCA identified two major pollution sources: agricultural non-point source pollution (PC2, contribution: 25.4%) and domestic sewage/livestock farming (PC1, contribution: 27.6%). Correlation analysis further revealed that the flood event significantly altered the intrinsic relationships among parameters like nitrogen and phosphorus, reinforcing the dominance of agricultural non-point source pollution. (5) Source analysis suggests that external inputs are the primary contributors, while the internal loading from sediments is relatively limited. This study enhances the understanding of how shallow lakes respond to extreme climatic events and provides a scientific basis for lake management in the Beijing–Tianjin–Hebei region.
1. Introduction
Freshwater lakes constitute an essential component of global freshwater resources, providing humans with water supply, flood regulation and storage, biodiversity conservation, and various ecosystem services [1]. However, with the acceleration of global urbanization, increasing agricultural intensification, and intensifying climate change, lake water quality degradation has become increasingly severe, emerging as one of the major environmental challenges globally [2,3]. Among these challenges, eutrophication is particularly prominent, primarily caused by excessive nitrogen (N) and phosphorus (P) inputs from agricultural non-point source pollution, industrial wastewater discharge, and domestic sewage [4]. Research indicates that under climate change scenarios, the frequency and intensity of extreme precipitation events are projected to increase further, which will profoundly impact lake ecosystems [5,6].
Shallow lakes (typically with water depth less than 3–4 m) are particularly sensitive to eutrophication and external disturbances due to their close contact with sediments, frequent sediment resuspension caused by wind–wave disturbance, and strong benthic-pelagic coupling [7,8]. These systems respond rapidly to external nutrient inputs and internal nutrient cycling, serving as both sensitive indicators of environmental changes and challenging targets for lake restoration efforts [9]. In recent years, domestic and international scholars have conducted extensive research on water quality evolution patterns, eutrophication driving mechanisms, and ecological restoration technologies in shallow lakes [10,11]. The application of spatial analysis techniques has enabled researchers to more accurately identify spatial heterogeneity of water quality problems and pollution source distribution patterns [12].
Extreme climate events (including intense precipitation, prolonged drought, and heat waves) have been confirmed as important driving factors causing abrupt changes in lake ecosystems. Extreme precipitation events can significantly alter hydrological pathways, activate accumulated pollutants in catchments, and trigger rapid changes in water quality and biological communities [13]. The extreme precipitation event in the Beijing–Tianjin–Hebei region in 2023 provided a rare “natural experiment” opportunity for studying the response mechanisms of shallow lakes to climate change [14]. Research indicates that extreme drought events cause significant changes in lake water quality, quantity, and form, while flood events may impose complex short-term and long-term impacts on lake water quality through pulse inputs.
The Trophic State Index (TSI) is a commonly used method for assessing lake eutrophication levels. Carlson’s TSI has been widely applied due to its simple calculation and comprehensive reflection of water trophic status [15,16]. In recent years, composite TSI assessment methods based on chlorophyll-a, TN, and TP have further improved the comprehensive evaluation capability of lake trophic status [17]. Multivariate statistical methods such as Principal Component Analysis (PCA) provide effective tools for identifying pollution sources and their relative contributions, and have been widely applied in lake water quality research [18].
Baiyangdian Lake is the largest freshwater lake in the Hai River Basin of North China, playing a crucial role in flood regulation, water resource storage, and biodiversity conservation in the Beijing–Tianjin–Hebei urban agglomeration [19]. As a key component of the ecological protection plan for the Xiong’an New Area, Baiyangdian Lake has been designated as a national-level wetland nature reserve. However, the lake has long faced threats from agricultural non-point source pollution, wastewater discharge, and upstream industrial activities, with water quality conditions remaining concerning [20]. From late July to early August 2023, the Beijing–Tianjin–Hebei region experienced an extreme precipitation event, with cumulative precipitation exceeding 600 mm in some areas within two weeks. This event was closely related to the remnant circulation of Typhoon Doksuri and is considered one of the most significant meteorological events affecting the region in decades [21]. This extreme precipitation event profoundly impacted the hydrological regime and water quality of Baiyangdian Lake, while also providing a rare opportunity to study the impacts of extreme precipitation on shallow lake ecosystems.
Despite the extensive research on lake eutrophication and water quality dynamics domestically and internationally, significant knowledge gaps remain in the following areas: (1) Response mechanisms of shallow lakes to extreme precipitation events under climate change scenarios; (2) Relative importance of external and internal nutrient sources under disturbed conditions; and (3) Recovery trajectory of lake ecosystems following major flood events. This study aims to fill these research gaps by conducting systematic monitoring of Baiyangdian Lake water quality parameters from 2023 to 2024, with emphasis on the impacts of the 2023 extreme precipitation event. Principal component analysis and trophic state index methods were employed to identify primary pollution sources and assess eutrophication risks, with the goal of providing a scientific basis for lake management in the Beijing–Tianjin–Hebei region.
2. Materials and Methods
2.1. Study Area and Sampling Design
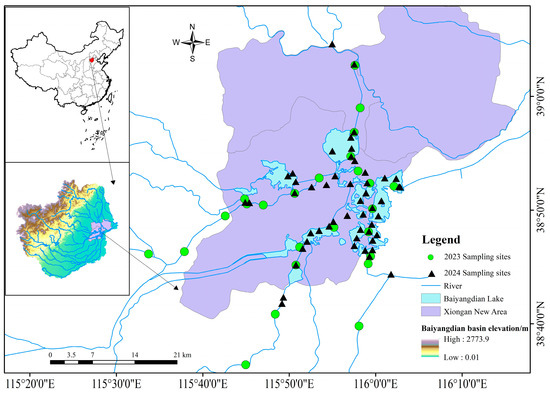
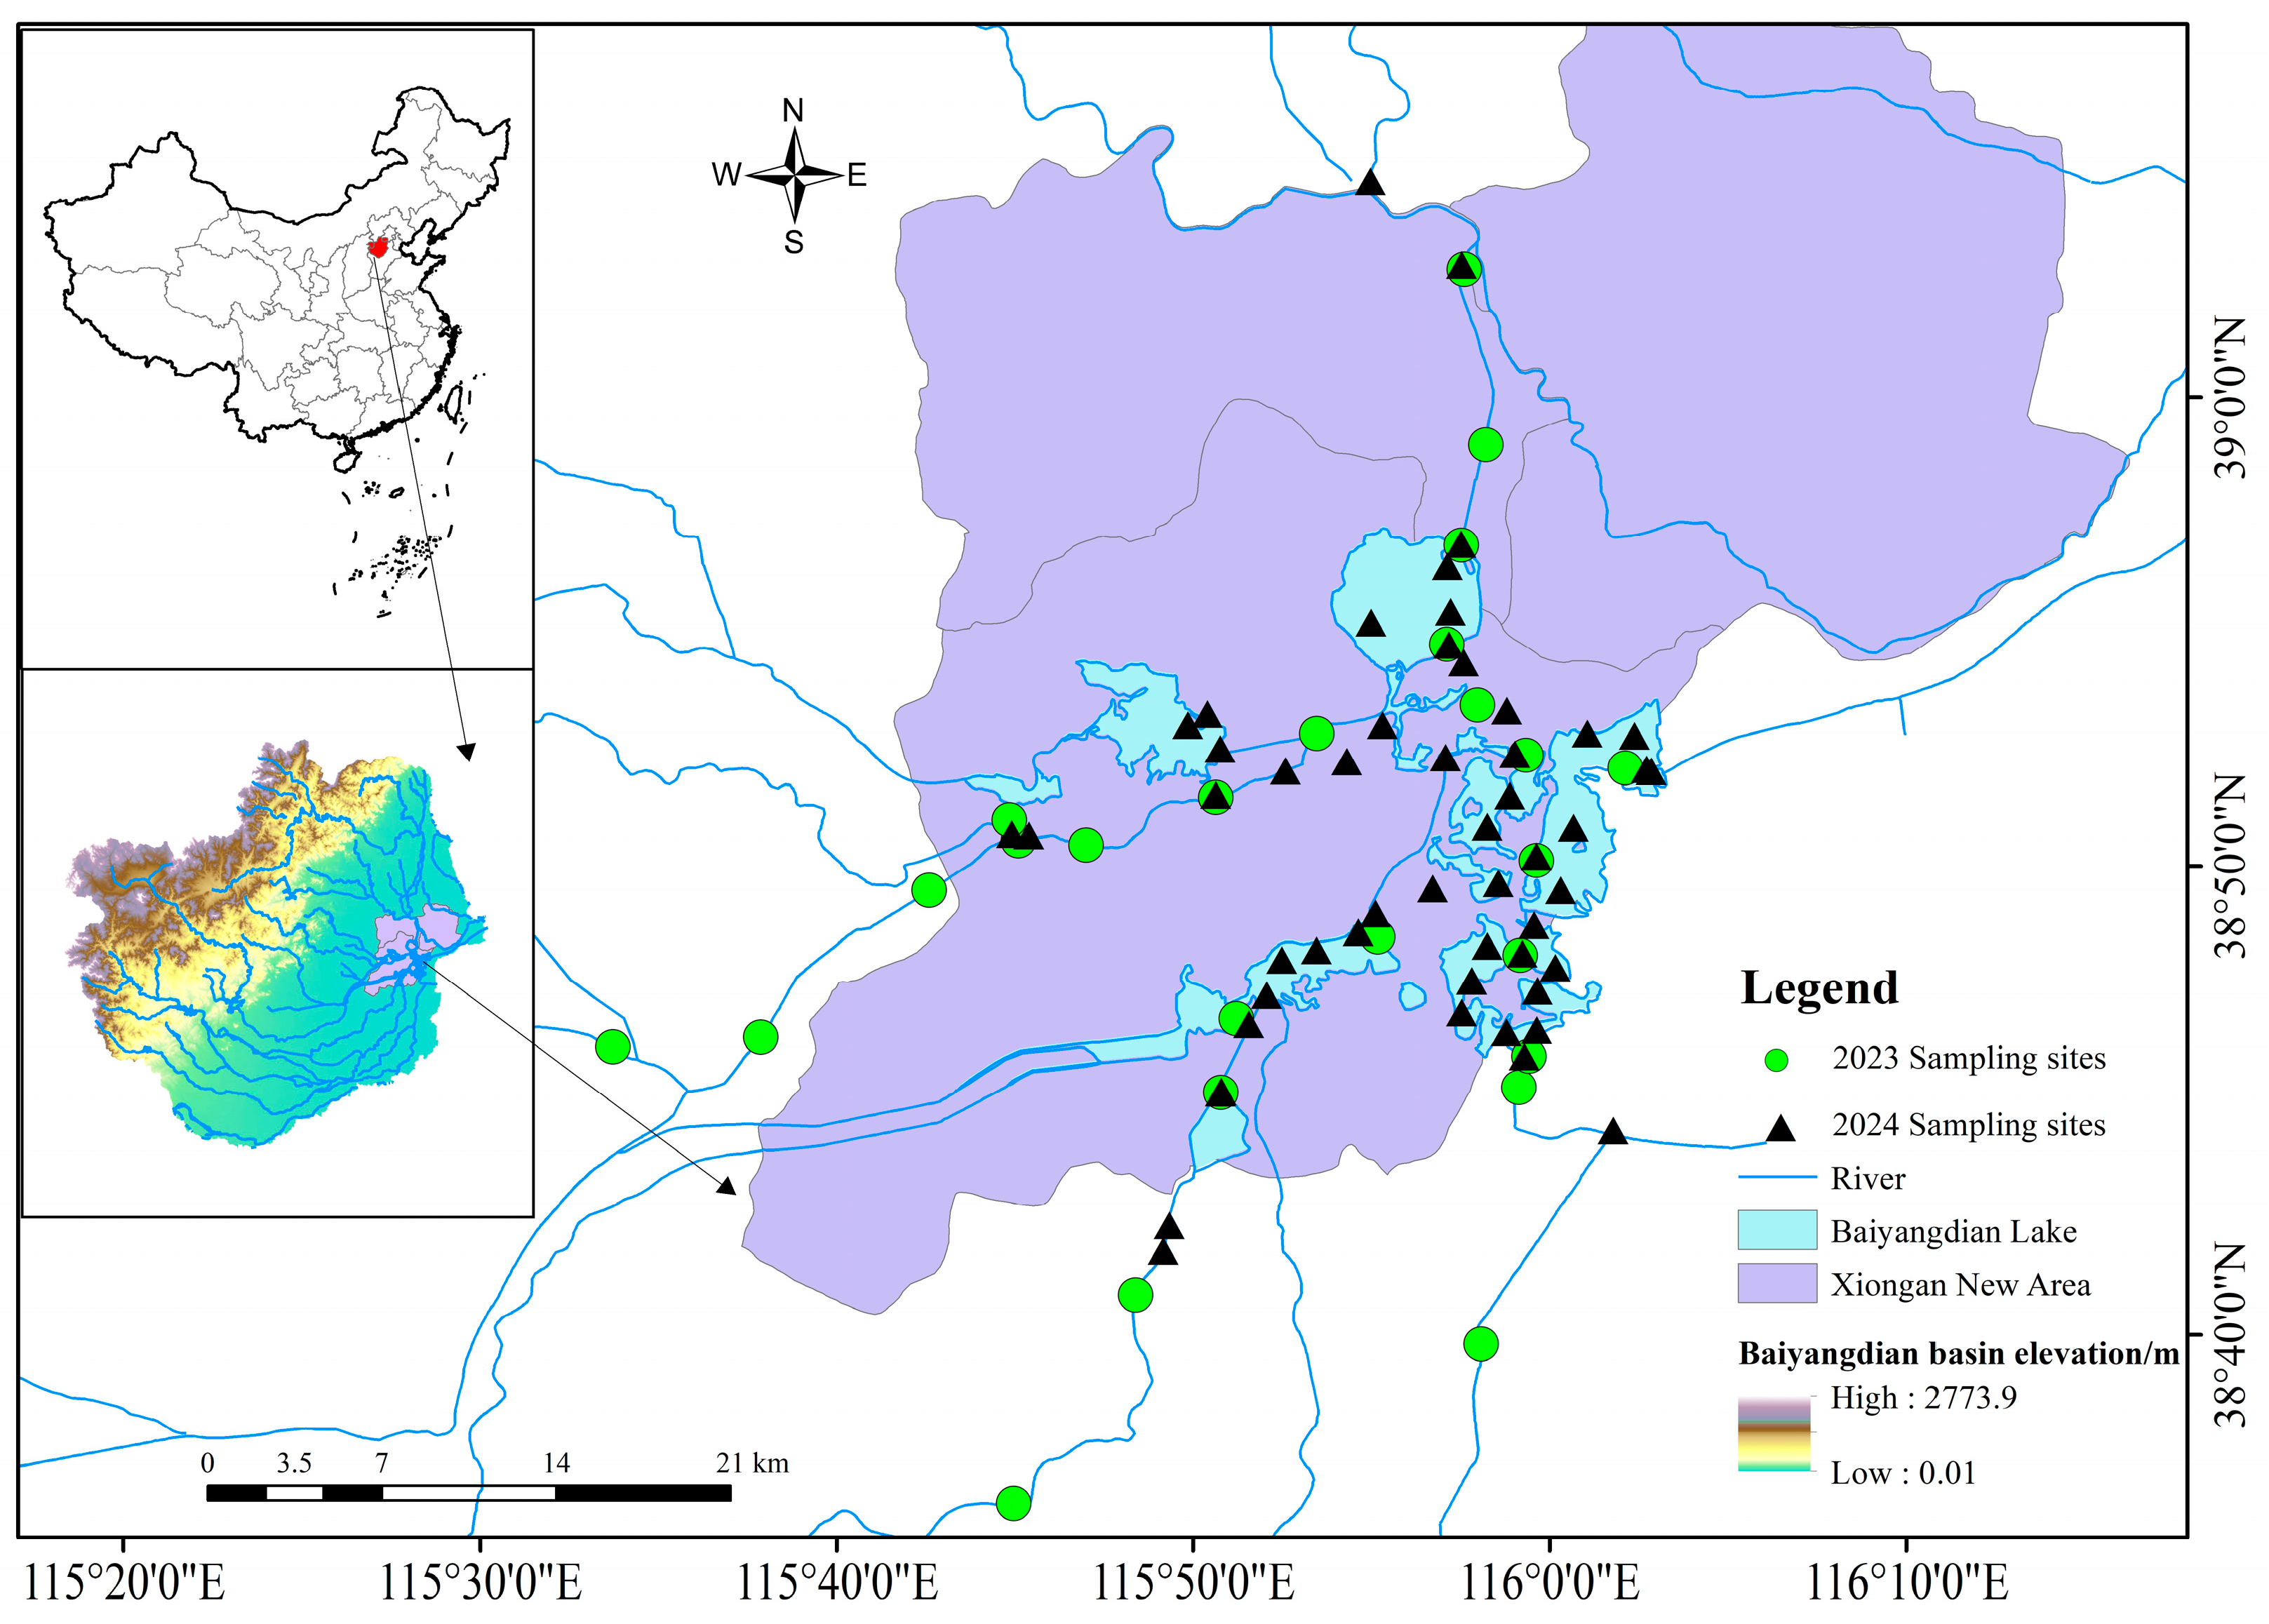
Baiyangdian Lake is located at 38°43′–39°02′ N, 115°45′–116°07′ E. A total of 53 water quality monitoring sites were established across the entire Baiyangdian Lake basin (Figure 1). The monitoring network was strategically designed to cover representative areas: (1) major river inlets to the lake; (2) the central area of the lake; and (3) typical wetland conservation zones [10]. Sampling was conducted monthly from April to December 2023, encompassing the pre-flood period (April–July), the flood period (August), and the post-flood period (September–December). Sampling was not possible during the frozen period from January to March 2024 due to safety restrictions and inaccessibility of monitoring sites. To evaluate the impact of this data gap on inter-annual variation analysis, we compared water quality parameters between December 2023 (pre-freezing) and April 2024 (post-thawing). The results showed no significant differences in TN, TP, and COD (Chemical Oxygen Demand) concentrations (p > 0.05), indicating that water quality remained relatively stable during the ice-frozen period with slow natural attenuation. Therefore, the 3-month data gap does not affect the core conclusions regarding the impact of extreme precipitation events. Supplemental sampling was carried out from April to November 2024 to assess recovery over a longer timescale.
Figure 1.
Location of the study area.
The 2023 flood event occurred in August. Sampling in August was initiated immediately after the heavy rainfall ceased. For analytical purposes, the sampling period was divided into three phases: (1) pre-flood (April–July 2023); (2) flood (August 2023); and (3) post-flood (September–December 2023 and April–November 2024).
2.2. Sample Collection and Analysis
Water samples were collected using pre-cleaned polyethylene bottles (500 mL) at a depth of 0.5 m below the water surface. Samples were transported in insulated refrigerated containers and analyzed within 24 h according to standard methods [22]. The measured parameters included: Chemical Oxygen Demand (COD) determined using the potassium dichromate method [23]; Total Nitrogen (TN) determined using the alkaline potassium persulfate digestion-UV spectrophotometric method [24]; Total Phosphorus (TP) determined using the ammonium molybdate spectrophotometric method after potassium persulfate digestion [25]; Ammonia Nitrogen (NH3-N) determined using the Nessler’s reagent spectrophotometric method [26]; Total Organic Carbon (TOC) determined using a TOC analyzer (Shimadzu TOC-L, Kyoto, Japan ) with the high-temperature combustion method; Dissolved Oxygen (DO) measured in situ using a calibrated YSI dissolved oxygen meter (YSI ProODO, Yellow Springs, OH, USA); measured in situ using a calibrated handheld multiparameter water quality analyzer (HACH HQ40d, Loveland, CO, USA). Water quality data were classified and evaluated according to the Chinese Surface Water Environmental Quality Standards (GB 3838-2002) [27].
Sediment samples were collected using a Peterson sediment sampler (sampling area 0.05 m2) to collect surface sediments (0–10 cm). All sediment sampling sites were coincident with the water quality sampling locations of the April 2024 campaign. Sediment samples from each point were thoroughly mixed and stored in polyethylene sealed bags. After freeze-drying and grinding, sediment samples were analyzed for Olsen Phosphorus (Olsen-P), which was extracted using 0.5 M NaHCO3 solution (pH 8.5) and determined by ammonium molybdate spectrophotometry; Total Nitrogen (TN), determined using the Kjeldahl method; and Total Organic Carbon (TOC), determined using an elemental analyzer (Elementar Vario EL, Elementar Analysensysteme GmbH, Langenselbold, Germany) with the high-temperature combustion method. Chlorophyll-a (Chl-a) concentration was measured during the April 2024 sampling period using the acetone extraction method (90% acetone) combined with spectrophotometry, and these data were used for TSI calculation.
2.3. Data Processing and Quality Control
For sites with duplicate samples (n = 3), the Grubbs test (α = 0.05) was employed for outlier detection, and mean values were calculated. Samples exceeding three standard deviations from the mean were excluded. All analytical data underwent completeness checks, and sites with missing values exceeding 50% for core parameters were excluded from statistical analysis. The reliability of analytical methods was verified through quality control measures, including method detection limits (MDL), recovery rates, and precision. The recovery rates for all measured parameters ranged from 85.2% to 108.7%, and the relative standard deviations (RSD) were all less than 5%. Detailed quality control data are provided in Table S1 (Supplementary Materials).
2.4. Trophic State Index (TSI)
Carlson’s Trophic State Index (TSI) was calculated based on three parameters: chlorophyll-a (Chl-a), total phosphorus (TP), and total nitrogen (TN), using the following formulas [15]:
The comprehensive TSI value is the arithmetic mean of the three component indices:
According to the trophic state classification criteria [15,28], oligotrophic status (TSI < 40) indicates clear water with low biological productivity; mesotrophic status (40 ≤ TSI < 50) represents a transitional state with occasional algal blooms; eutrophic status (50 ≤ TSI < 70) is characterized by high productivity, frequent algal blooms, and hypoxia risk; and hypereutrophic status (TSI ≥ 70) denotes extremely high productivity, severe algal blooms, and common hypoxia.
2.5. Principal Component Analysis (PCA)
Principal Component Analysis (PCA) was conducted following the protocol established by [29] to identify primary pollution sources and reduce data dimensionality. The analysis was performed on the correlation matrix of standardized water quality data (Z-score standardization). According to the Kaiser criterion, principal components with eigenvalues greater than 1 were retained for interpretation.
Principal component loading coefficients were used to identify variables with significant contributions to each principal component. Variables with absolute loadings > 0.7 were considered strongly correlated with a principal component, while loadings between 0.5 and 0.7 indicated moderate correlation [30]. Component scores for each sampling site were calculated to examine the spatial distribution patterns of pollution sources. According to the Kaiser criterion, principal components with eigenvalues greater than 1 were retained for interpretation. Although the eigenvalue of PC3 was slightly greater than 1, all water quality parameters had loading coefficients less than 0.5 on PC3, indicating no clear physical meaning. Additionally, the scree plot showed a distinct inflection point at PC2. Therefore, only the first two principal components were retained to ensure the interpretability of the results.
2.6. Correlation Analysis
Pearson correlation coefficients were used to evaluate linear correlations between water quality parameters, while Spearman rank correlation coefficients were employed for non-normally distributed variables. According to the correlation strength classification criteria [29], a strong correlation is indicated by |r| ≥ 0.7, a moderate correlation by 0.5 ≤ |r| < 0.7, a weak correlation by 0.3 ≤ |r| < 0.5, and a weak or no correlation by |r| < 0.3. Statistical significance was evaluated at two levels: α = 0.05 and α = 0.01.
2.7. Sediment–Water Relationship Analysis
Linear regression analysis was employed to quantitatively describe the relationships between sediment nutrient pools and overlying water quality parameters. Sediment nutrient indicators (Olsen-P, TN, TOC) were used as independent variables, with corresponding water quality parameters (TP, TN, COD) as dependent variables. The coefficient of determination (R2) was used to evaluate the explanatory power of sediment variables for water quality variations [31,32].
3. Results
3.1. Overview of Water Quality Status
During the monitoring period from April 2023 to November 2024, the statistical characteristics of the main water quality parameters in Baiyangdian Lake are summarized in Table 1. The average concentration of total nitrogen (TN) was 2.13 ± 1.65 mg/L, with concentrations fluctuating within a range of 0.0 to 6.7 mg/L. The mean value exceeded the Class V limit (2.0 mg/L) specified in the “Environmental Quality Standards for Surface Water” [27], indicating a pronounced nitrogen pollution issue. The average total phosphorus (TP) concentration was 0.05 ± 0.08 mg/L, significantly surpassing the internationally recognized eutrophication threshold for freshwater lakes (0.02 mg/L). The average concentrations of chemical oxygen demand (COD) and ammonia nitrogen (NH3-N) were 14.23 ± 8.36 mg/L and 0.26 ± 0.56 mg/L, respectively. Overall, the water body of Baiyangdian Lake exhibits a pollution profile characterized primarily by excessive nitrogen and phosphorus nutrients, indicating a high risk of eutrophication.
Table 1.
Statistical Summary of Water Quality Parameters in Baiyangdian Lake (n = 610).
3.2. Temporal Variation Patterns and Flood Impacts
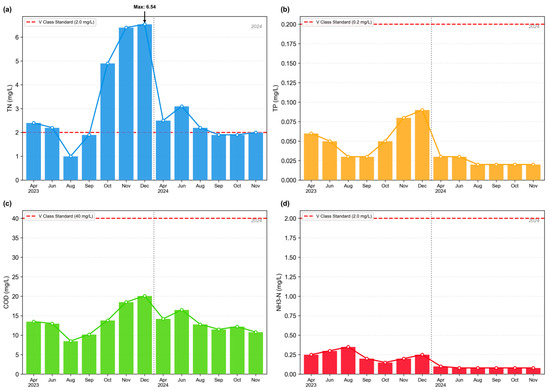
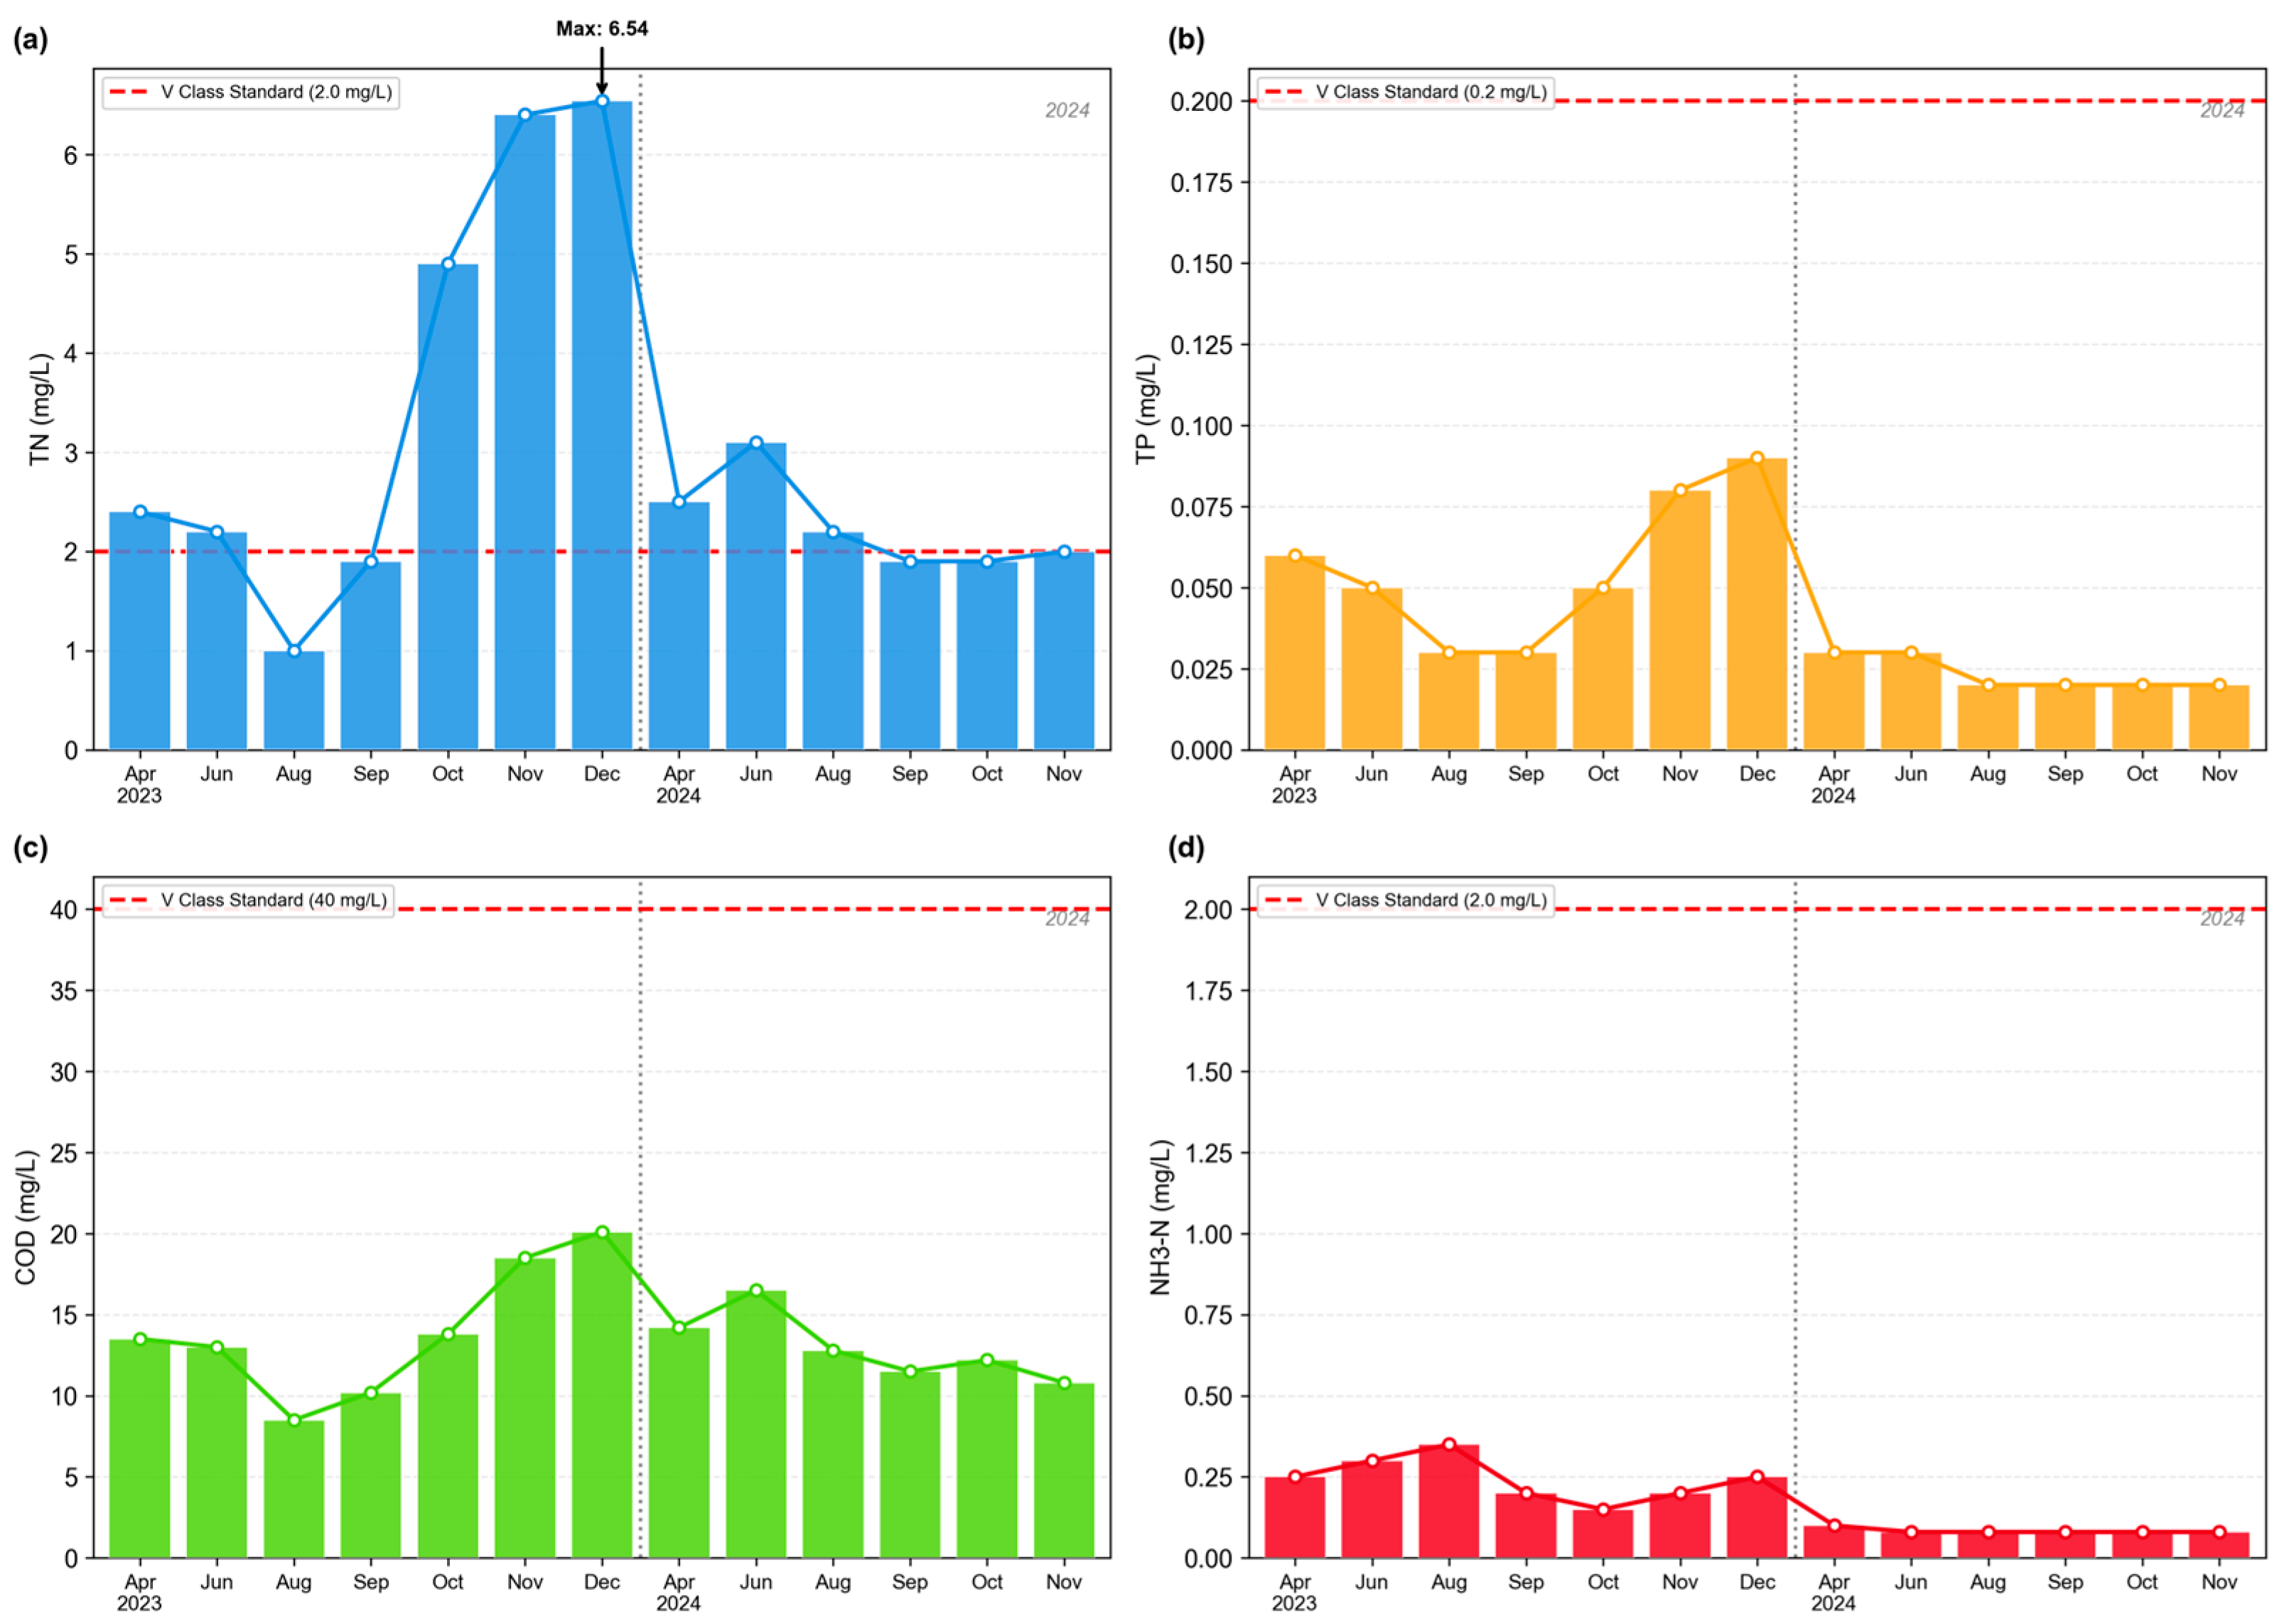
The monthly variations in water quality parameters clearly revealed seasonal patterns and were notably perturbed by the extreme precipitation event in 2023 (Figure 2). As mentioned in Section 2.1, the ice-frozen period data gap had a negligible impact on the analysis of extreme precipitation impacts, which mainly occurred during the non-frozen period. Based on the precipitation event and the corresponding water quality response characteristics, the entire study period can be divided into three phases: the pre-flood, flood, and post-flood periods.
Figure 2.
Monthly variation in water quality parameters in Baiyangdian Lake from April 2023 to November 2024. (a) Total Nitrogen (TN); (b) Total Phosphorus (TP); (c) Chemical Oxygen Demand (COD); (d) Ammonia Nitrogen (NH3-N). The red dashed line in each subfigure represents the Class V water quality standard limit specified in GB 3838-2002.
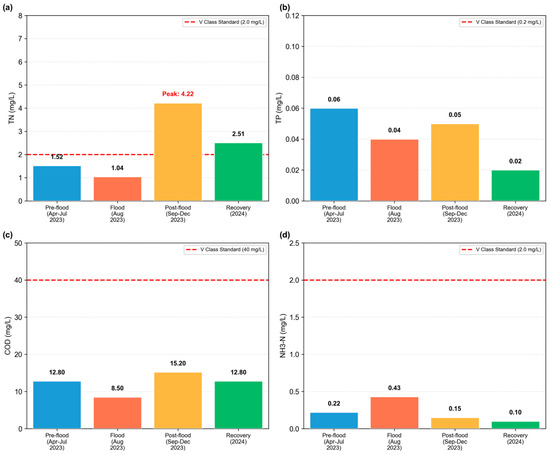
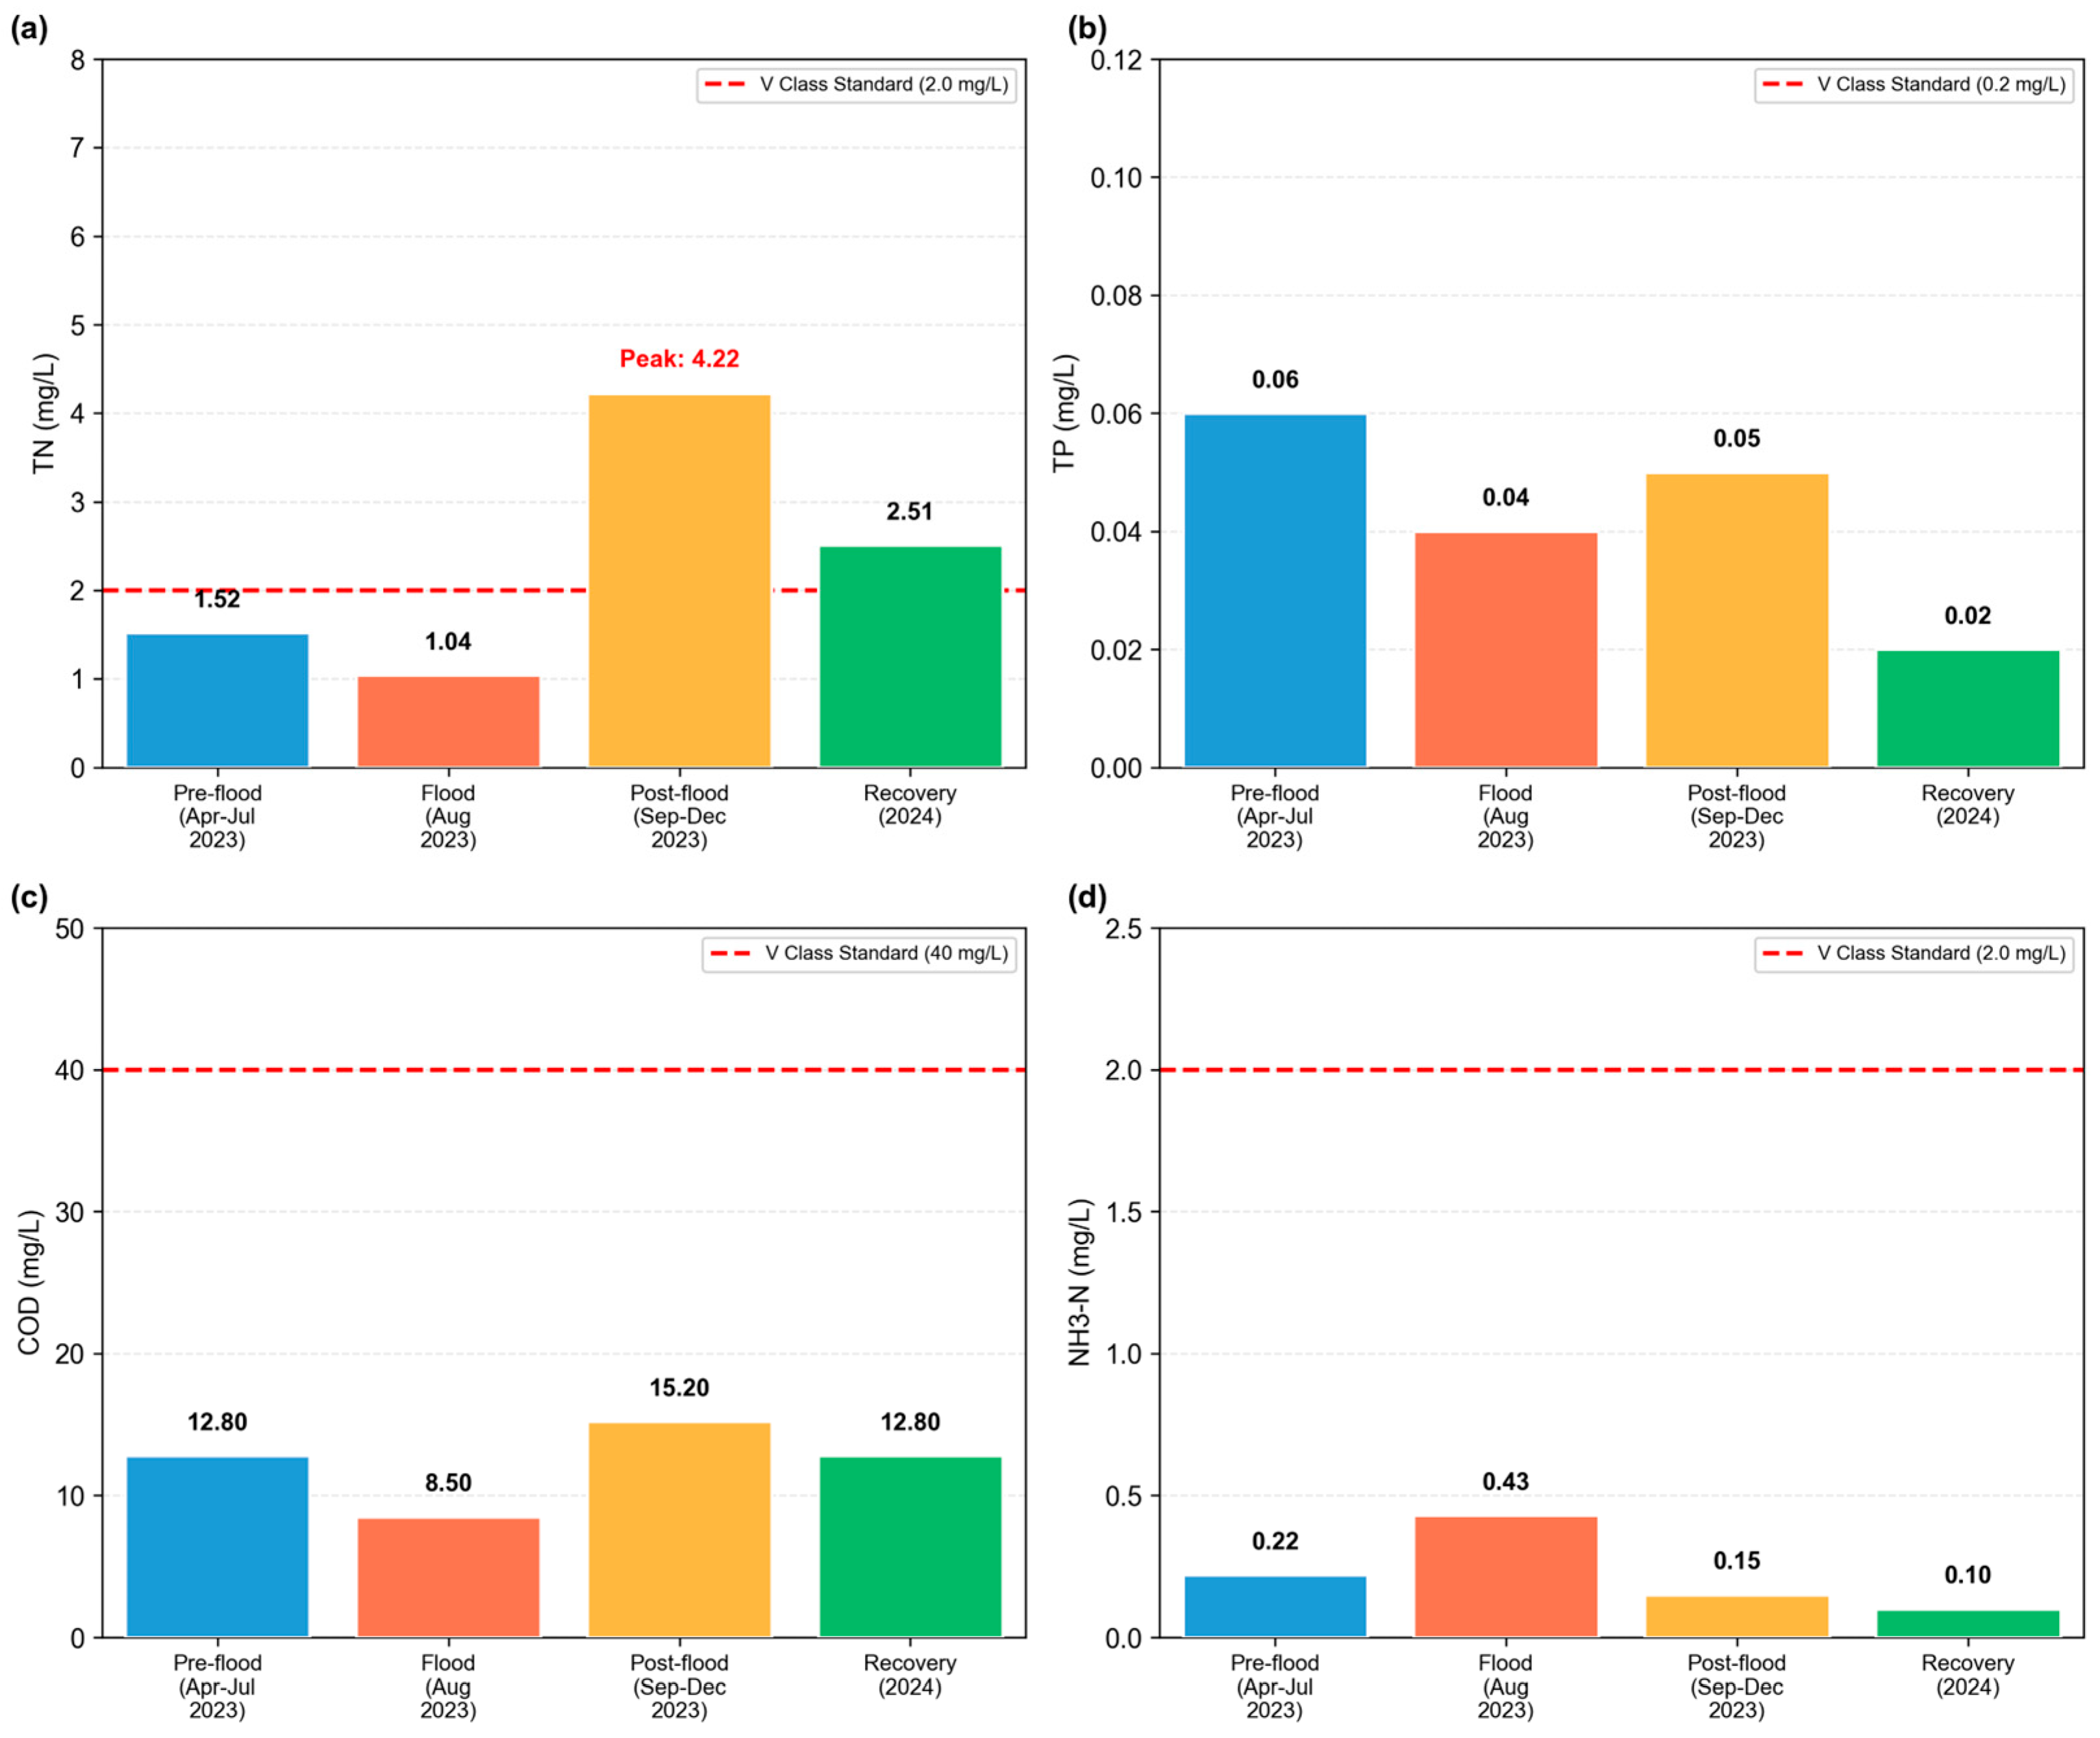
Pre-flood period (April–July 2023): Water quality parameters during this phase were relatively stable, reflecting the background conditions prior to the event. The average concentrations of TN, TP, COD, and NH3-N were 1.52 mg/L, 0.06 mg/L, 21.81 mg/L, and 0.22 mg/L, respectively (Figure 3).
Figure 3.
Comparison of key water quality parameters in Baiyangdian Lake during different hydrological periods. (a) Total Nitrogen (TN); (b) Total Phosphorus (TP); (c) Chemical Oxygen Demand (COD); (d) Ammonia Nitrogen (NH3-N). The red dashed line in each subfigure indicates the Class V water quality standard limit specified in GB 3838-2002.
Flood period (August 2023): The extreme precipitation led to a significant dilution effect. Compared to the pre-flood period, the TN concentration decreased by 31.6% to 1.04 mg/L, and the COD concentration decreased by 36.9% to 13.75 mg/L. The TP concentration remained at 0.04 mg/L, showing no significant change (Figure 2 and Figure 3). This is primarily attributed to the substantial increase in lake volume due to direct precipitation input, which diluted pollutant concentrations in the short term.
Post-flood period (September 2023–November 2024): Following the flood recession, water quality exhibited a complex legacy effect and recovery process. The TN concentration surged sharply to a study-period peak of 4.22 mg/L in September 2023, representing an increase of approximately 178% compared to the pre-flood level. It subsequently showed a slow declining trend but remained at an elevated level of 2.51–3.16 mg/L throughout 2024, consistently exceeding the Class V standard (Figure 2). In contrast, the TP concentration during the post-flood period showed a significant decreasing trend, with average concentrations in 2024 ranging between 0.01 and 0.05 mg/L. The NH3-N concentration exhibited relatively minor fluctuations throughout the entire study period, generally remaining within the range of 0.22–0.43 mg/L (Figure 2). These divergent trajectories of nitrogen and phosphorus indicate the differential impact of the flood event on the transport and transformation processes of different pollutants.
3.3. Spatial Distribution Patterns
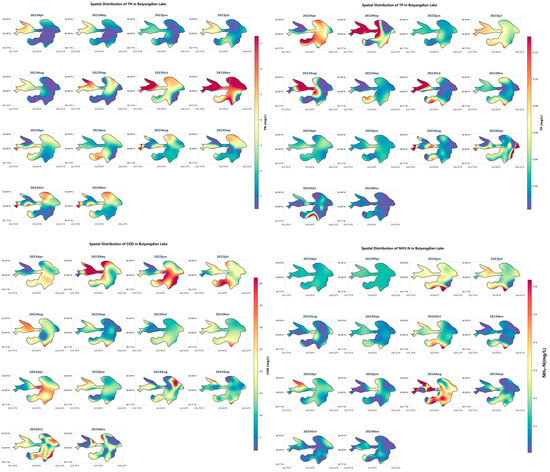
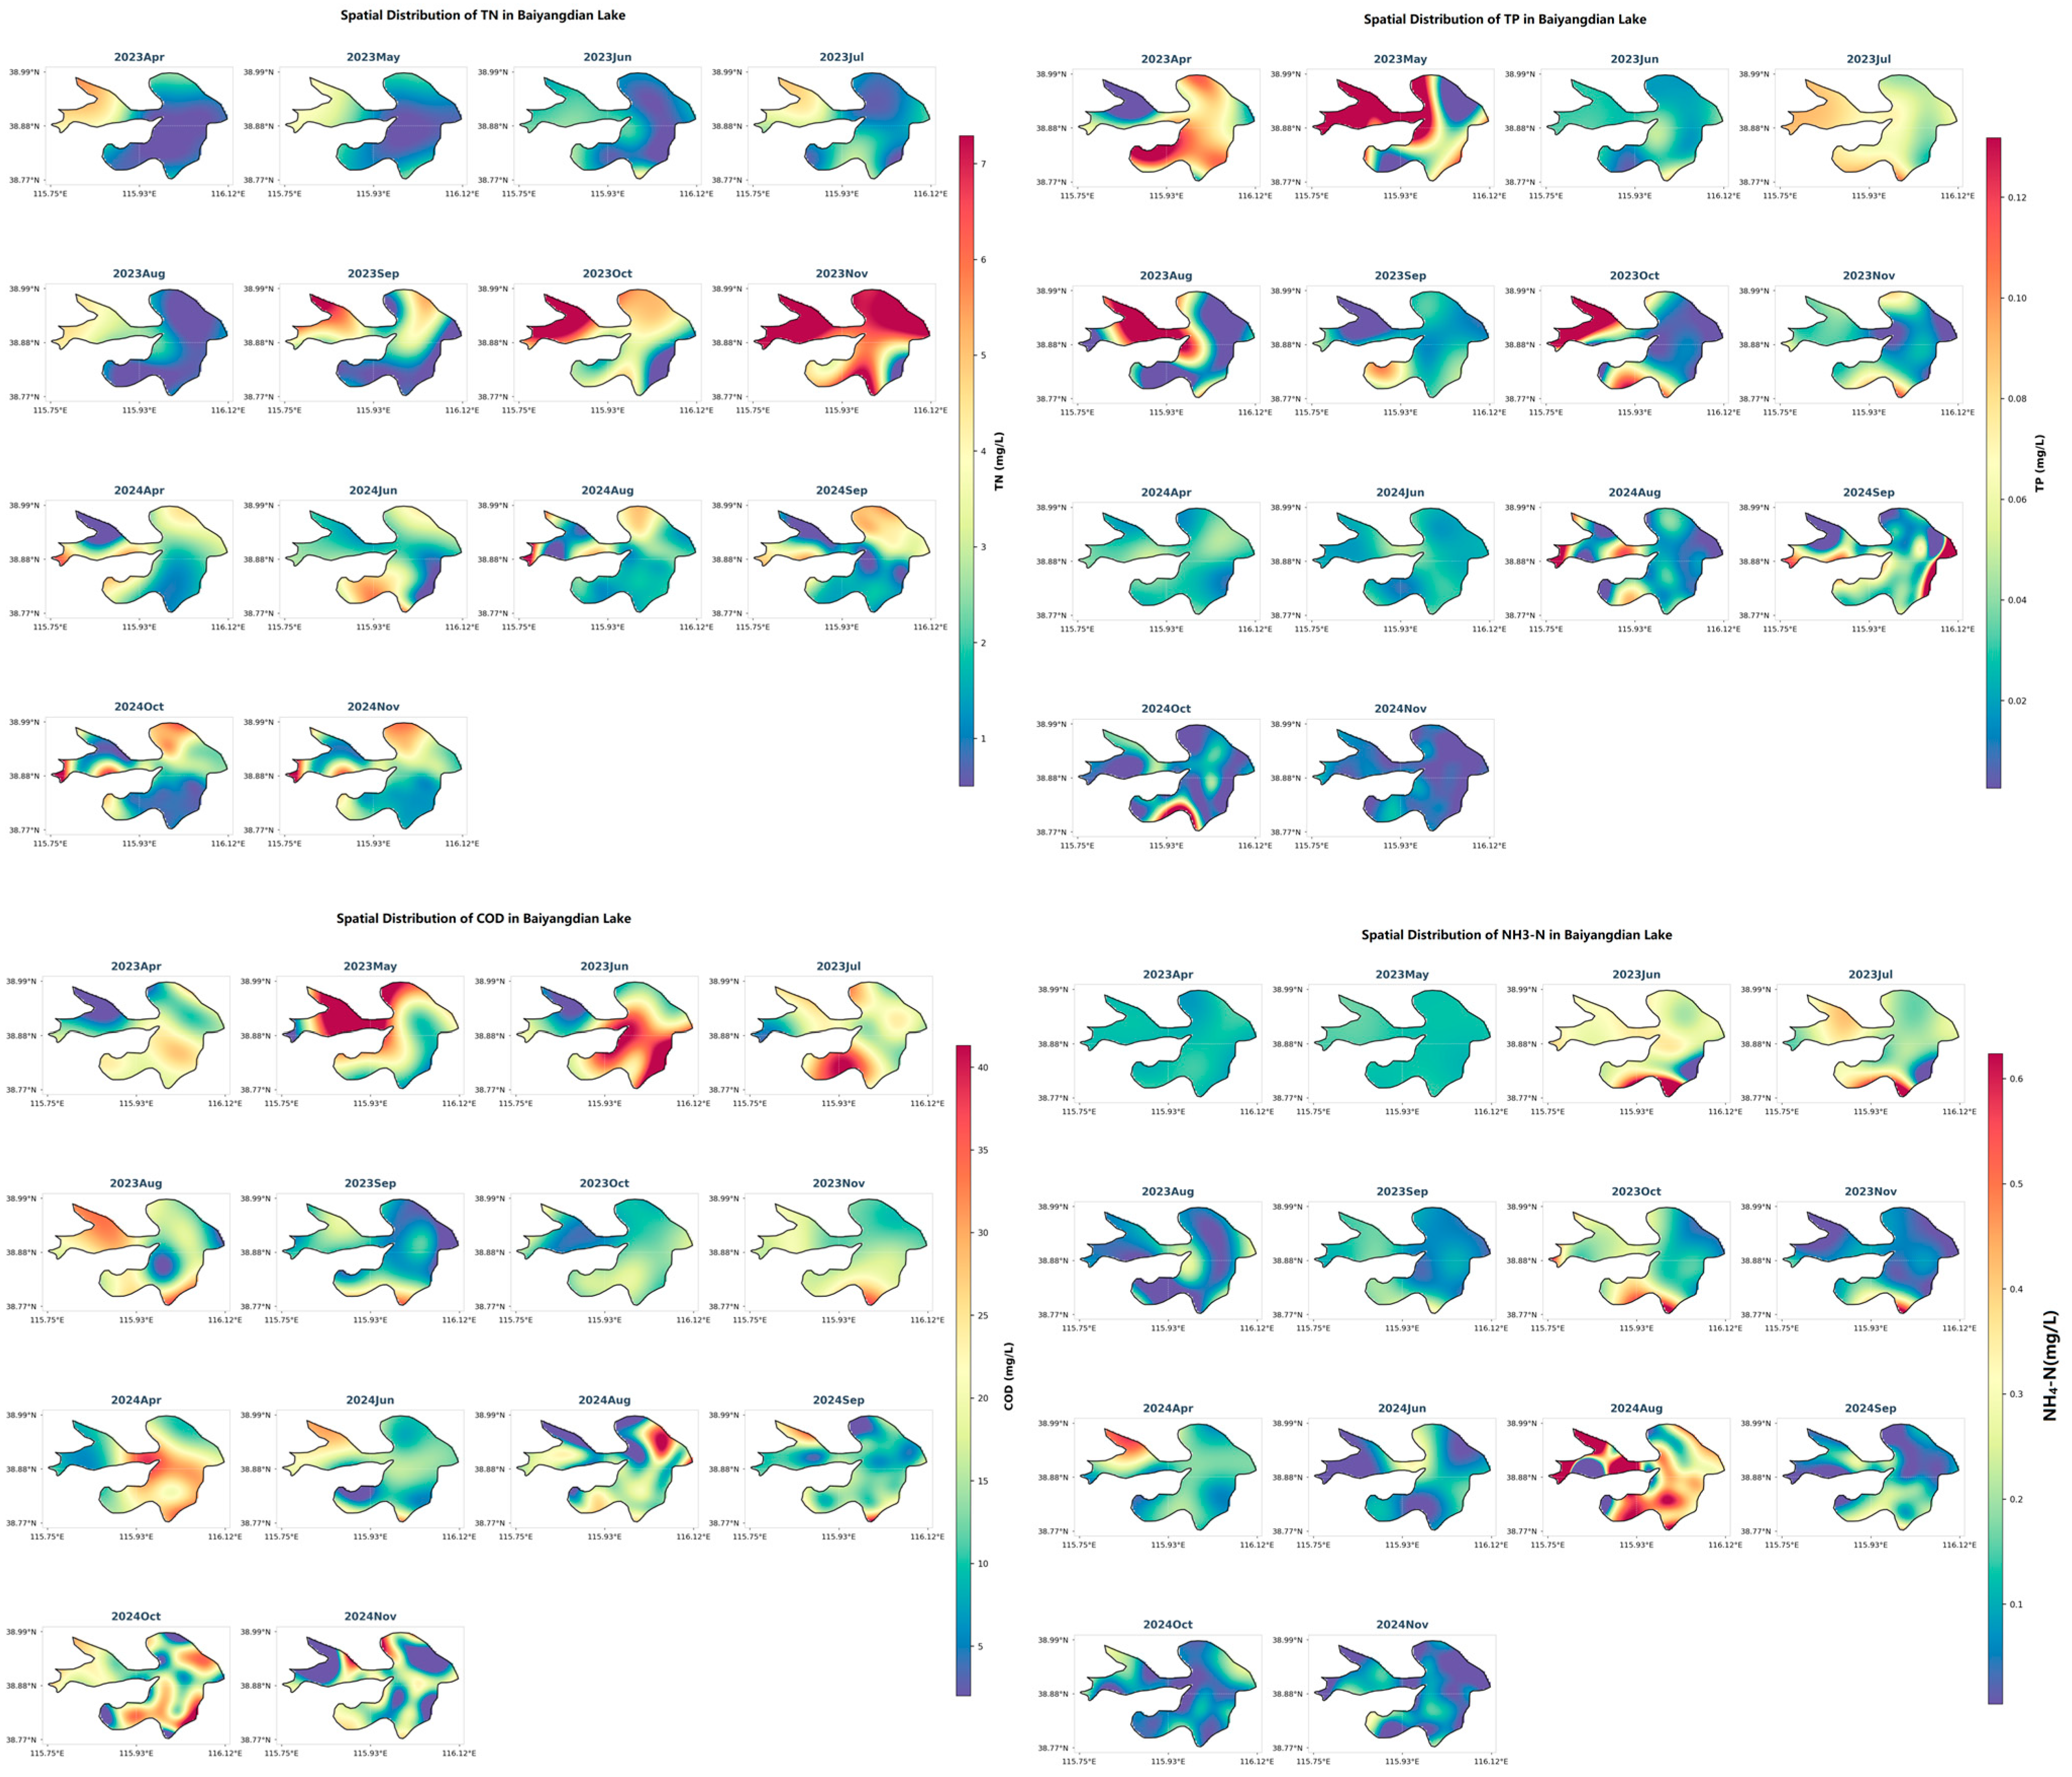
The water quality of Baiyangdian Lake exhibits distinct spatial heterogeneity, closely associated with hydrological connectivity and pollutant inputs (Figure 4).
Figure 4.
Spatial distribution maps of water quality parameters in Baiyangdian Lake.
Estuarine areas: The estuarine zones adjacent to the main inflowing rivers show the highest concentrations of water quality parameters, particularly TN and TP. This directly reflects the continuous input of pollutants from agricultural non-point sources and potential point-source discharges within the watershed, marking these areas as critical hotspots for external pollutant influx.
Central lake area: The nutrient concentrations in the open-water zone are at moderate levels (e.g., average TN ≈ 1.80 mg/L, TP ≈ 0.02 mg/L). The water quality in this region is regulated by a combination of horizontal transport from the estuaries, sediment resuspension induced by wind–wave disturbances, and internal biogeochemical processes.
Outlet area: Pollutant concentrations are generally lower in the area near the downstream outlet. This is primarily attributed to the dilution and export effects resulting from the continuous outflow of water, and may also be related to stronger hydrodynamic conditions in this area, which are less conducive to pollutant accumulation.
3.4. Correlation Analysis
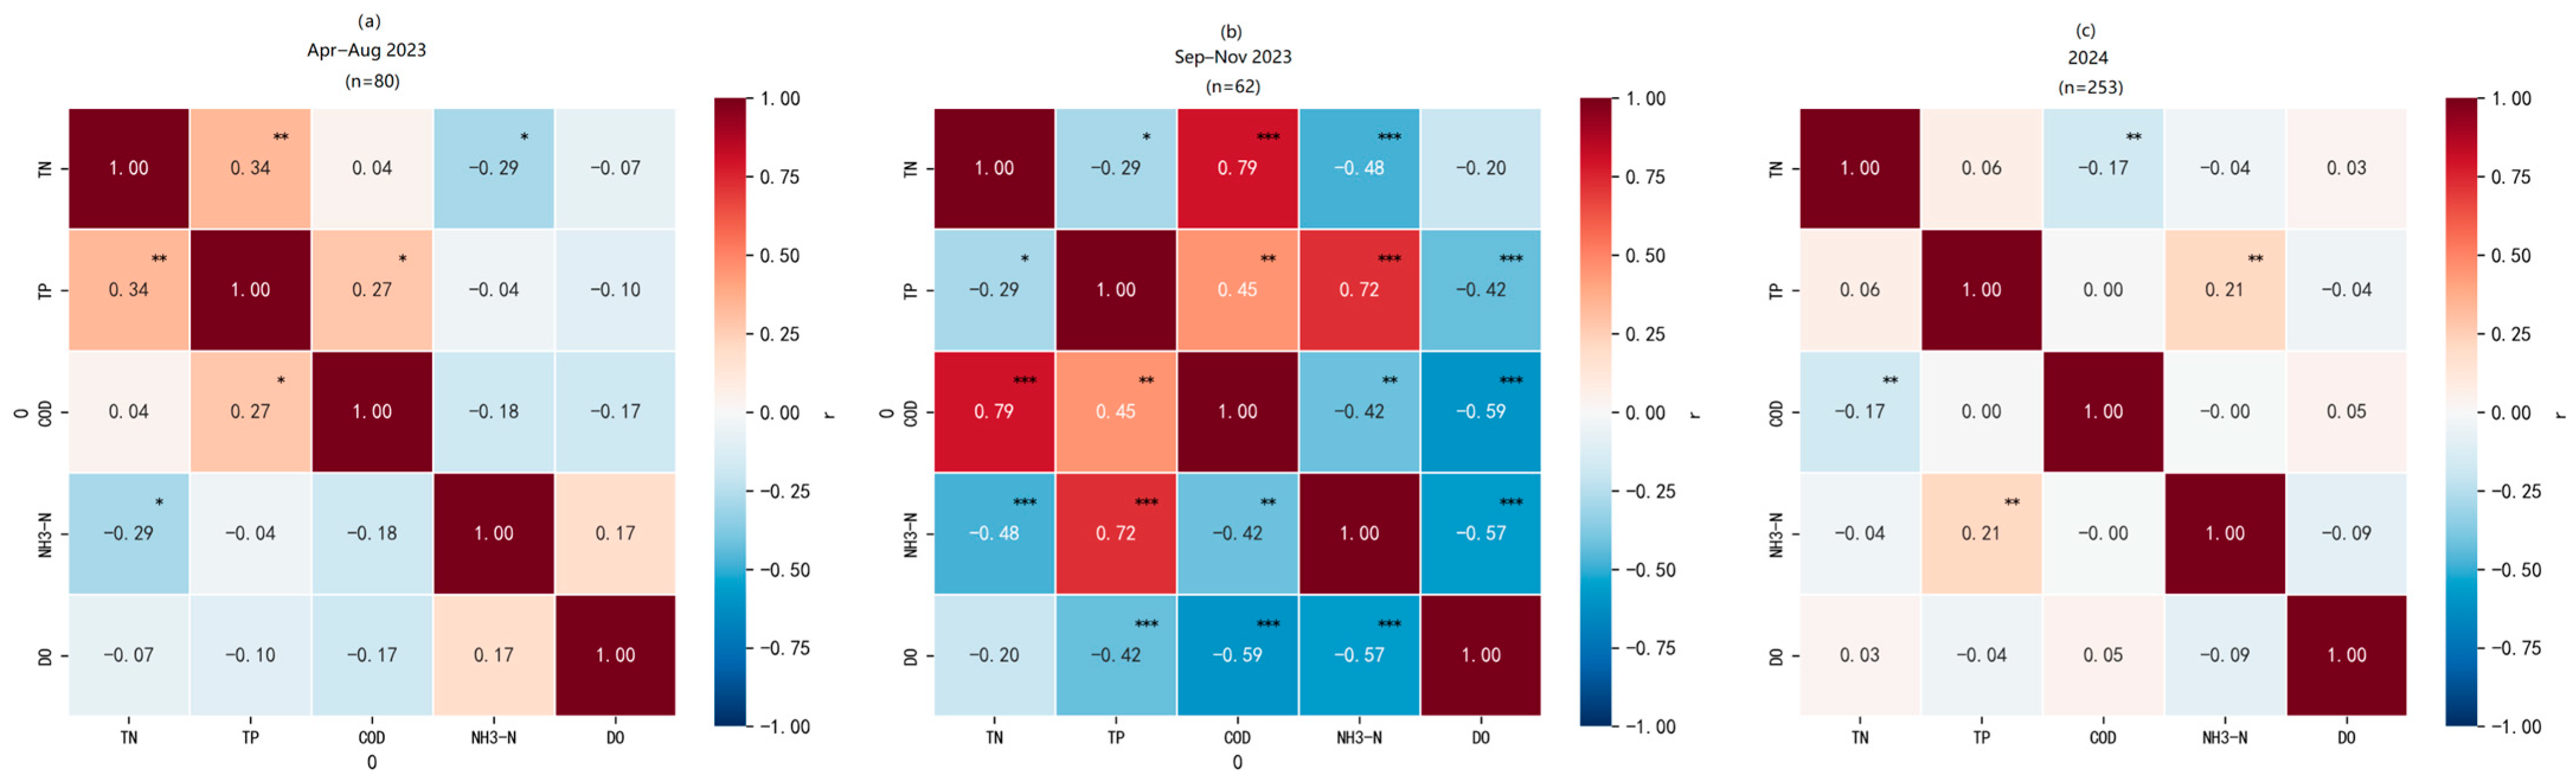
Pearson correlation analysis revealed intrinsic relationships among key water quality parameters (Figure 5). Total nitrogen (TN) and total phosphorus (TP) showed a moderate positive correlation (r = 0.52), indicating a certain degree of homology, likely originating from common sources such as agricultural fertilization or domestic sewage. A significant positive correlation (r = 0.58) was observed between chemical oxygen demand (COD) and total organic carbon (TOC), which aligns with expectations, as both are comprehensive indicators of organic pollutants in water. Ammonia nitrogen (NH3-N) was also positively correlated with TOC (r = 0.40), suggesting the release of ammonium nitrogen during the degradation and mineralization of organic matter. These correlations provided a foundation for subsequent identification of common pollution sources.
Figure 5.
Correlation analysis of water quality parameters in Baiyangdian Lake during different periods. (a) Correlation matrix for the pre-flood period (April–August 2023); (b) Correlation matrix for the early post-flood period (September–November 2023); (c) Correlation matrix for the recovery period (2024). * p < 0.05; ** p < 0.01; *** p < 0.001.
Temporal Evolution of Water Quality Parameter Correlations
Analysis based on the phase-specific correlation heatmap (Figure 5) revealed a significant impact of the 2023 extreme precipitation event on the intrinsic relationships among water quality parameters in Baiyangdian Lake.
Pre-flood period (April–August 2023): The correlation pattern among water quality parameters indicated characteristics of mixed pollution sources. A relatively strong positive correlation (r = 0.58) between TP and COD suggested a significant contribution from point sources/lifestyle pollution, such as domestic sewage and organic waste, to phosphorus input. A certain negative correlation (r = −0.24) was observed between TN and dissolved oxygen (DO), potentially related to oxygen consumption during organic matter degradation. During this stage, the correlation between TN and TP was weak (r = 0.13), indicating that their input sources or migration/transformation pathways were relatively independent.
Early post-flood period (September–November 2023): Following the flood, the correlation pattern shifted significantly. The correlation between TN and TP increased sharply (r = 0.52), changing from weak to a moderate positive correlation. This strongly supports the results of the principal component analysis (PCA), indicating that agricultural non-point source pollution—which typically leads to coupled nitrogen and phosphorus inputs—became the dominant pollution source after the flood. Concurrently, the positive correlation between TP and COD disappeared (r = −0.06), suggesting that flood scouring diluted the original phosphorus inputs associated with organic pollution. The correlations of NH3-N with both TN and TP shifted to positive, possibly reflecting the enrichment of ammonium nitrogen and particulate phosphorus in surface runoff transported by the flood.
2024 (Later recovery stage): The strength of correlations among water quality parameters generally weakened, but a certain positive correlation between TN and TP persisted. This indicates that the coupling relationships among internal parameters of the Baiyangdian water quality system were still adjusting after the extreme disturbance, while the influence of agricultural non-point source inputs “activated” by the flood event—manifested as nitrogen–phosphorus homology—exhibited persistence.
3.5. Principal Component Analysis and Pollution Source Identification
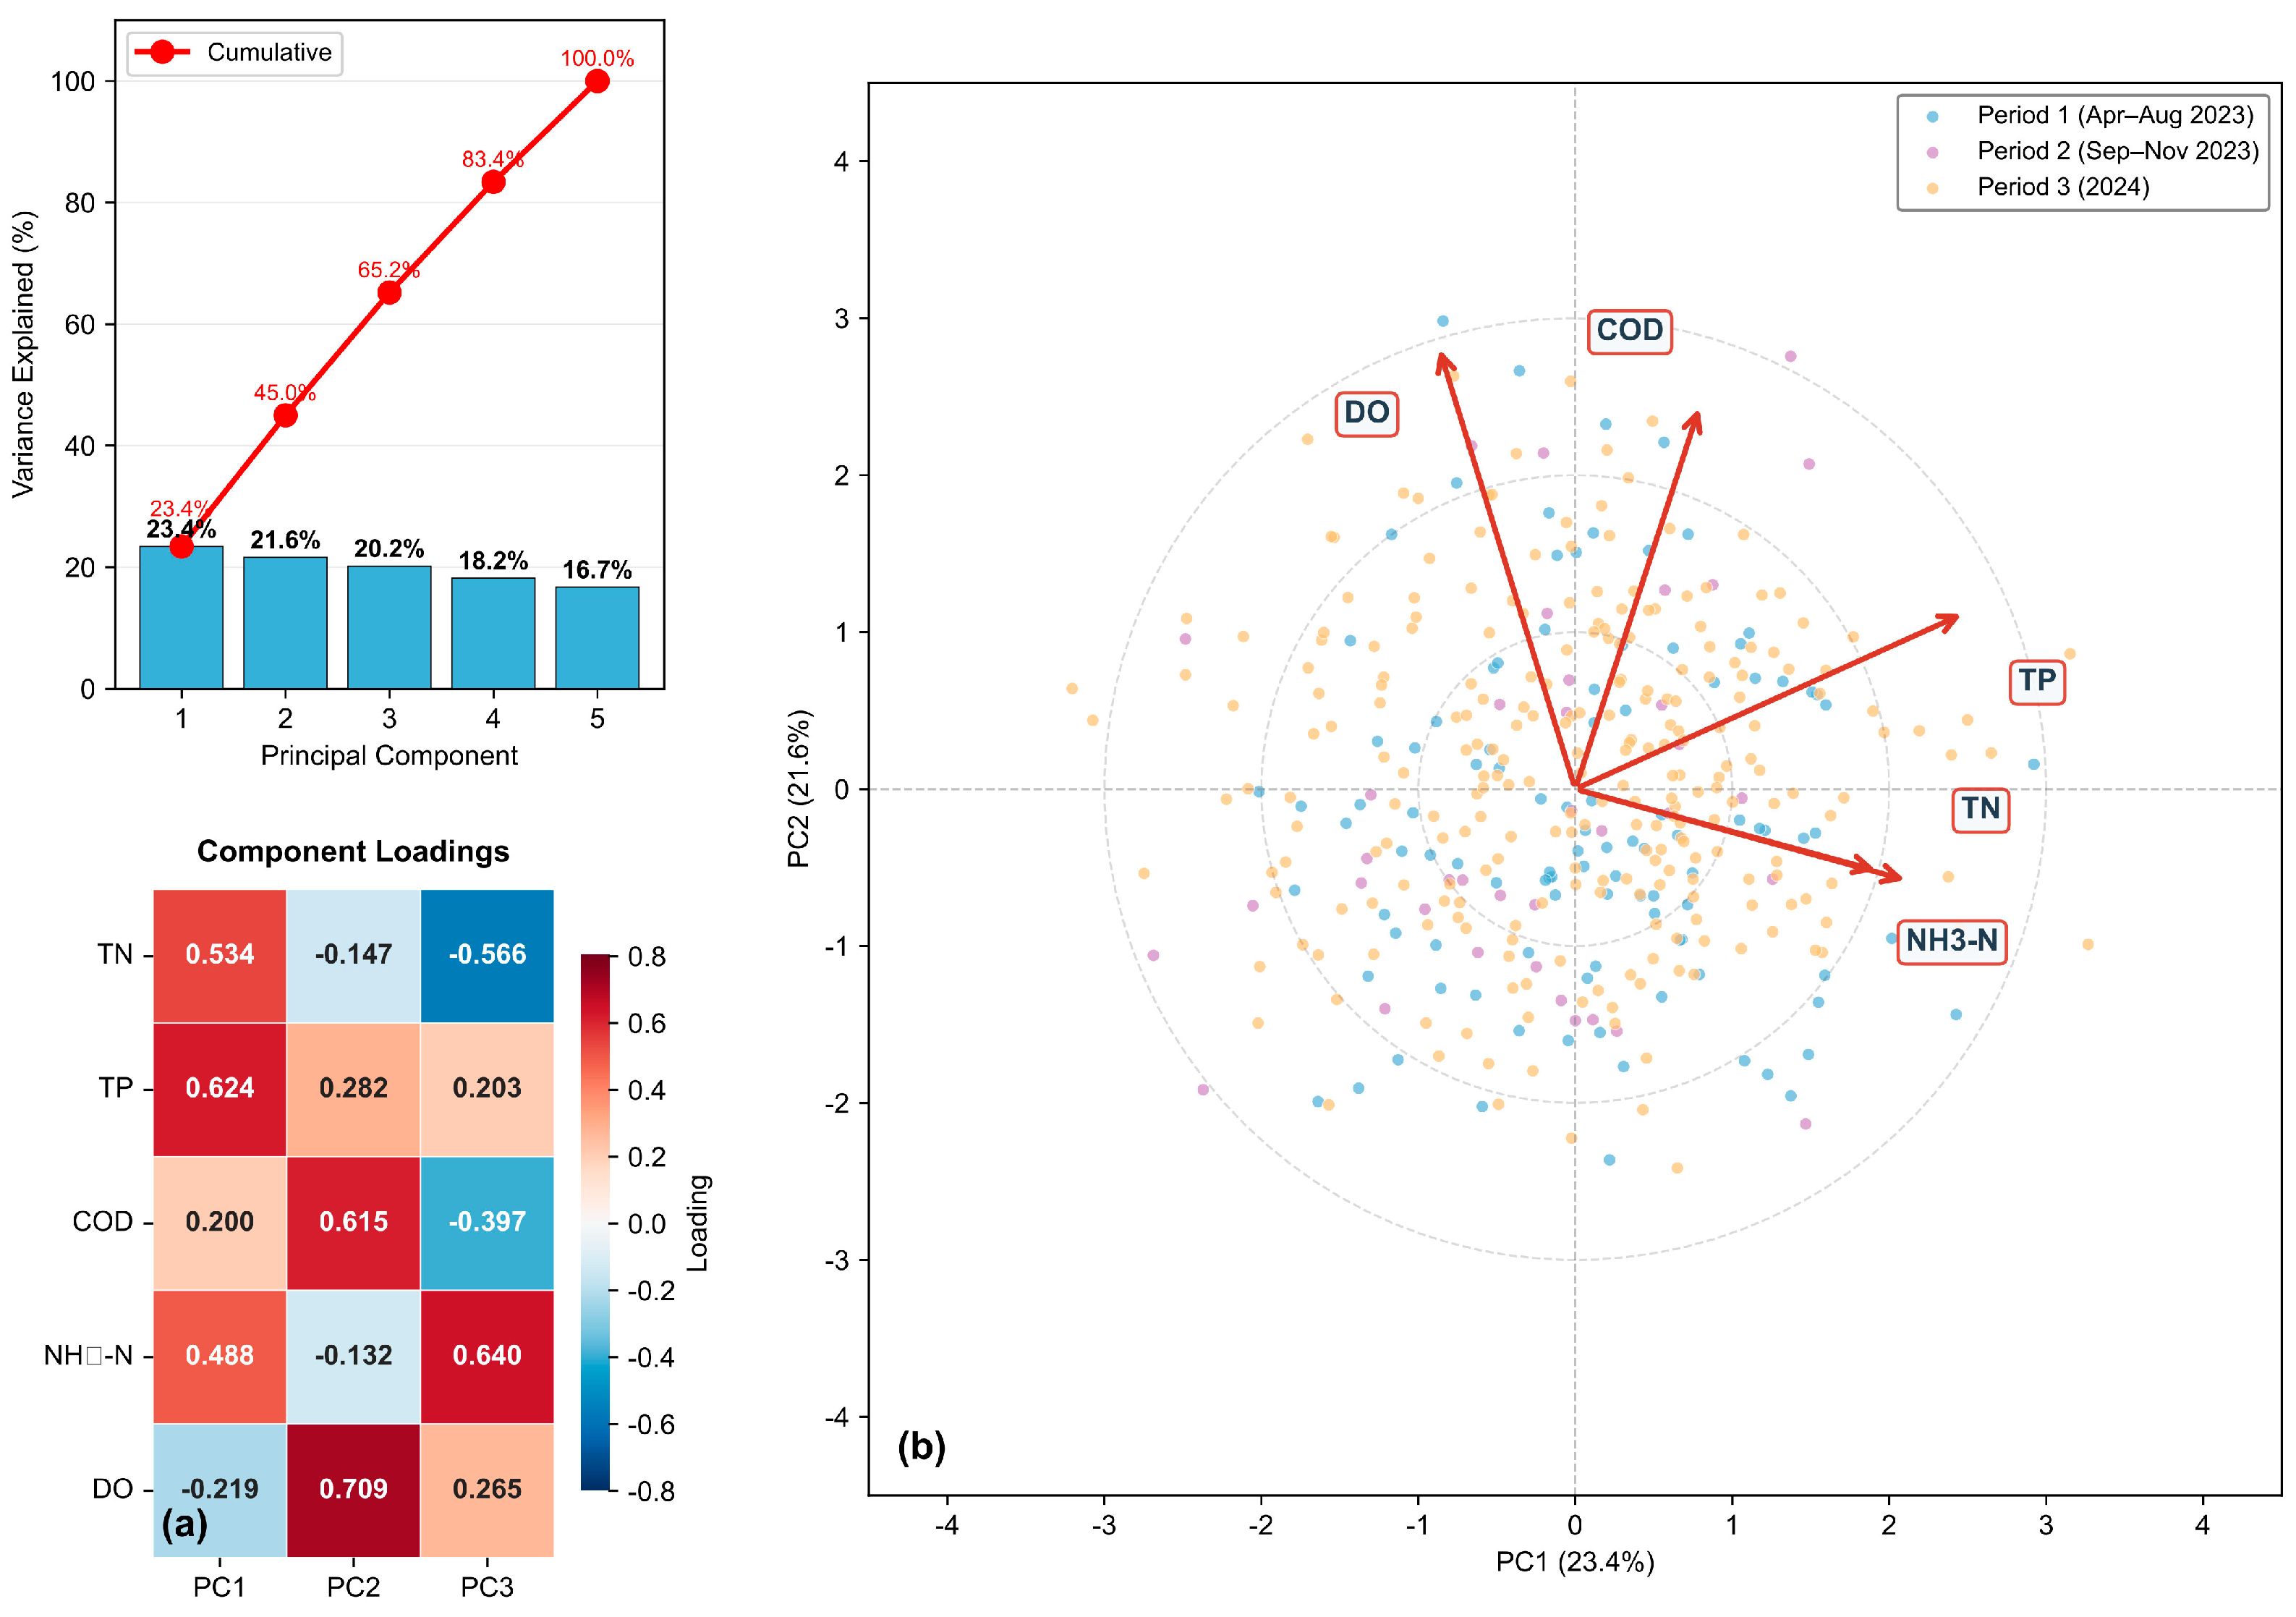
To identify the primary pollution sources affecting Baiyangdian Lake water quality and their evolution before and after the flood event, PCA was conducted. As shown in the scree plot (Figure 6a), the eigenvalues of the first two principal components (PC1 and PC2) were both greater than 1, with a cumulative variance contribution of 52.9%. When the first three principal components were retained, the cumulative variance explanation reached 70.9%. However, as discussed in Section 2.5, PC3 had no clear physical interpretation, so the following discussion focuses primarily on the first two principal components. To further reveal the temporal evolution of pollution sources, we conducted segmented PCA for the pre-flood (April–July 2023), flood (August 2023), and post-flood (September 2023–November 2024) periods separately. The detailed results of segmented PCA are provided in Table S2 (Supplementary Materials).
Figure 6.
Principal Component Analysis (PCA) of water quality parameters in Baiyangdian Lake. (a) Scree plot showing the variance explained by each principal component and the cumulative variance explained; Component loadings heatmap illustrating the contribution of each water quality parameter to the first three principal components. (b) PCA biplot showing the distribution of samples across different periods and the loading vectors of water quality parameters. The red arrows represent the loading vectors of each parameter, with their direction and length indicating the correlation strength and direction with the principal components.
Pollution source interpretation based on principal components (Figure 6b) indicates that PC1, which accounts for 27.6% of the variance, has high positive loadings from Chemical Oxygen Demand (COD, 0.36), Total Phosphorus (TP, 0.37), and Ammonia Nitrogen (NH3-N, 0.52), while Total Nitrogen (TN, −0.45) exhibits a high negative loading, suggesting that PC1 primarily reflects the integrated processes of organic pollution and partial nutrient inputs. PC2, accounting for 25.4% of the variance, has the highest positive loadings from TP (0.65) and TN (0.52), clearly indicating a second independent pollution source—the coupled nitrogen and phosphorus input source—which strongly suggests contributions from agricultural non-point source pollution (such as fertilizer runoff).
The temporal evolution characteristics of pollution sources (Figure 6b) were revealed through the distribution of sample points at different periods. During Period 1 (pre-flood and flood, April–August 2023), sample points were relatively dispersed, with some located in the positive direction of PC1 (high COD/TP/NH3-N) and others in the positive direction of PC2 (high TN/TP), indicating complex pollution sources during this period, possibly involving both domestic sewage/livestock pollution and agricultural non-point source inputs. During Period 2 (post-flood, September–November 2023), sample points clearly clustered toward the positive direction of PC2 (high TN/TP region), which is highly consistent with the finding that TN concentrations remained abnormally elevated after the flood, indicating that the flood significantly activated and strengthened the coupled nitrogen and phosphorus input process dominated by agricultural non-point sources. During Period 3 (2024), the distribution of sample points contracted toward the central region compared to Period 2, but still showed some distribution in the positive direction of PC2, indicating that the influence of agricultural non-point sources persists on long-term scales. Based on the principal component scores and variance contributions, we quantitatively calculated the relative contribution rates of the two pollution sources in different periods: before the flood, domestic sewage/livestock breeding pollution accounted for 55.7% and agricultural non-point source pollution accounted for 44.3%; during the flood period, their contributions were roughly equal; after the flood, agricultural non-point source pollution increased to 57.7% and became the dominant pollution source.
3.6. Trophic State Assessment
Based on chlorophyll-a (Chl-a) monitoring data from 14 representative sites in April 2024 (post-flood period), the trophic state of Baiyangdian Lake was assessed using the comprehensive Trophic State Index method (Figure 7). Due to budget and logistical constraints, Chl-a was only measured at 14 sites that covered all major lake zones (estuarine, central, and outlet areas). Comparison of TN and TP concentrations between these 14 TSI sites and the remaining 39 water quality sites showed no significant differences (p > 0.05), confirming the representativeness of the results. Potential spatial bias may exist in localized lake bays, and we recommend expanding the Chl-a monitoring network in future studies to improve spatial resolution.
Figure 7.
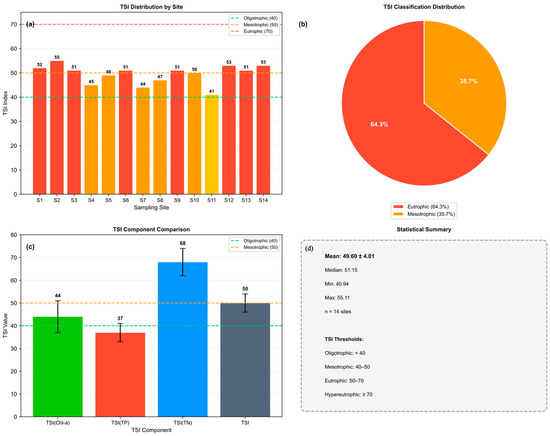
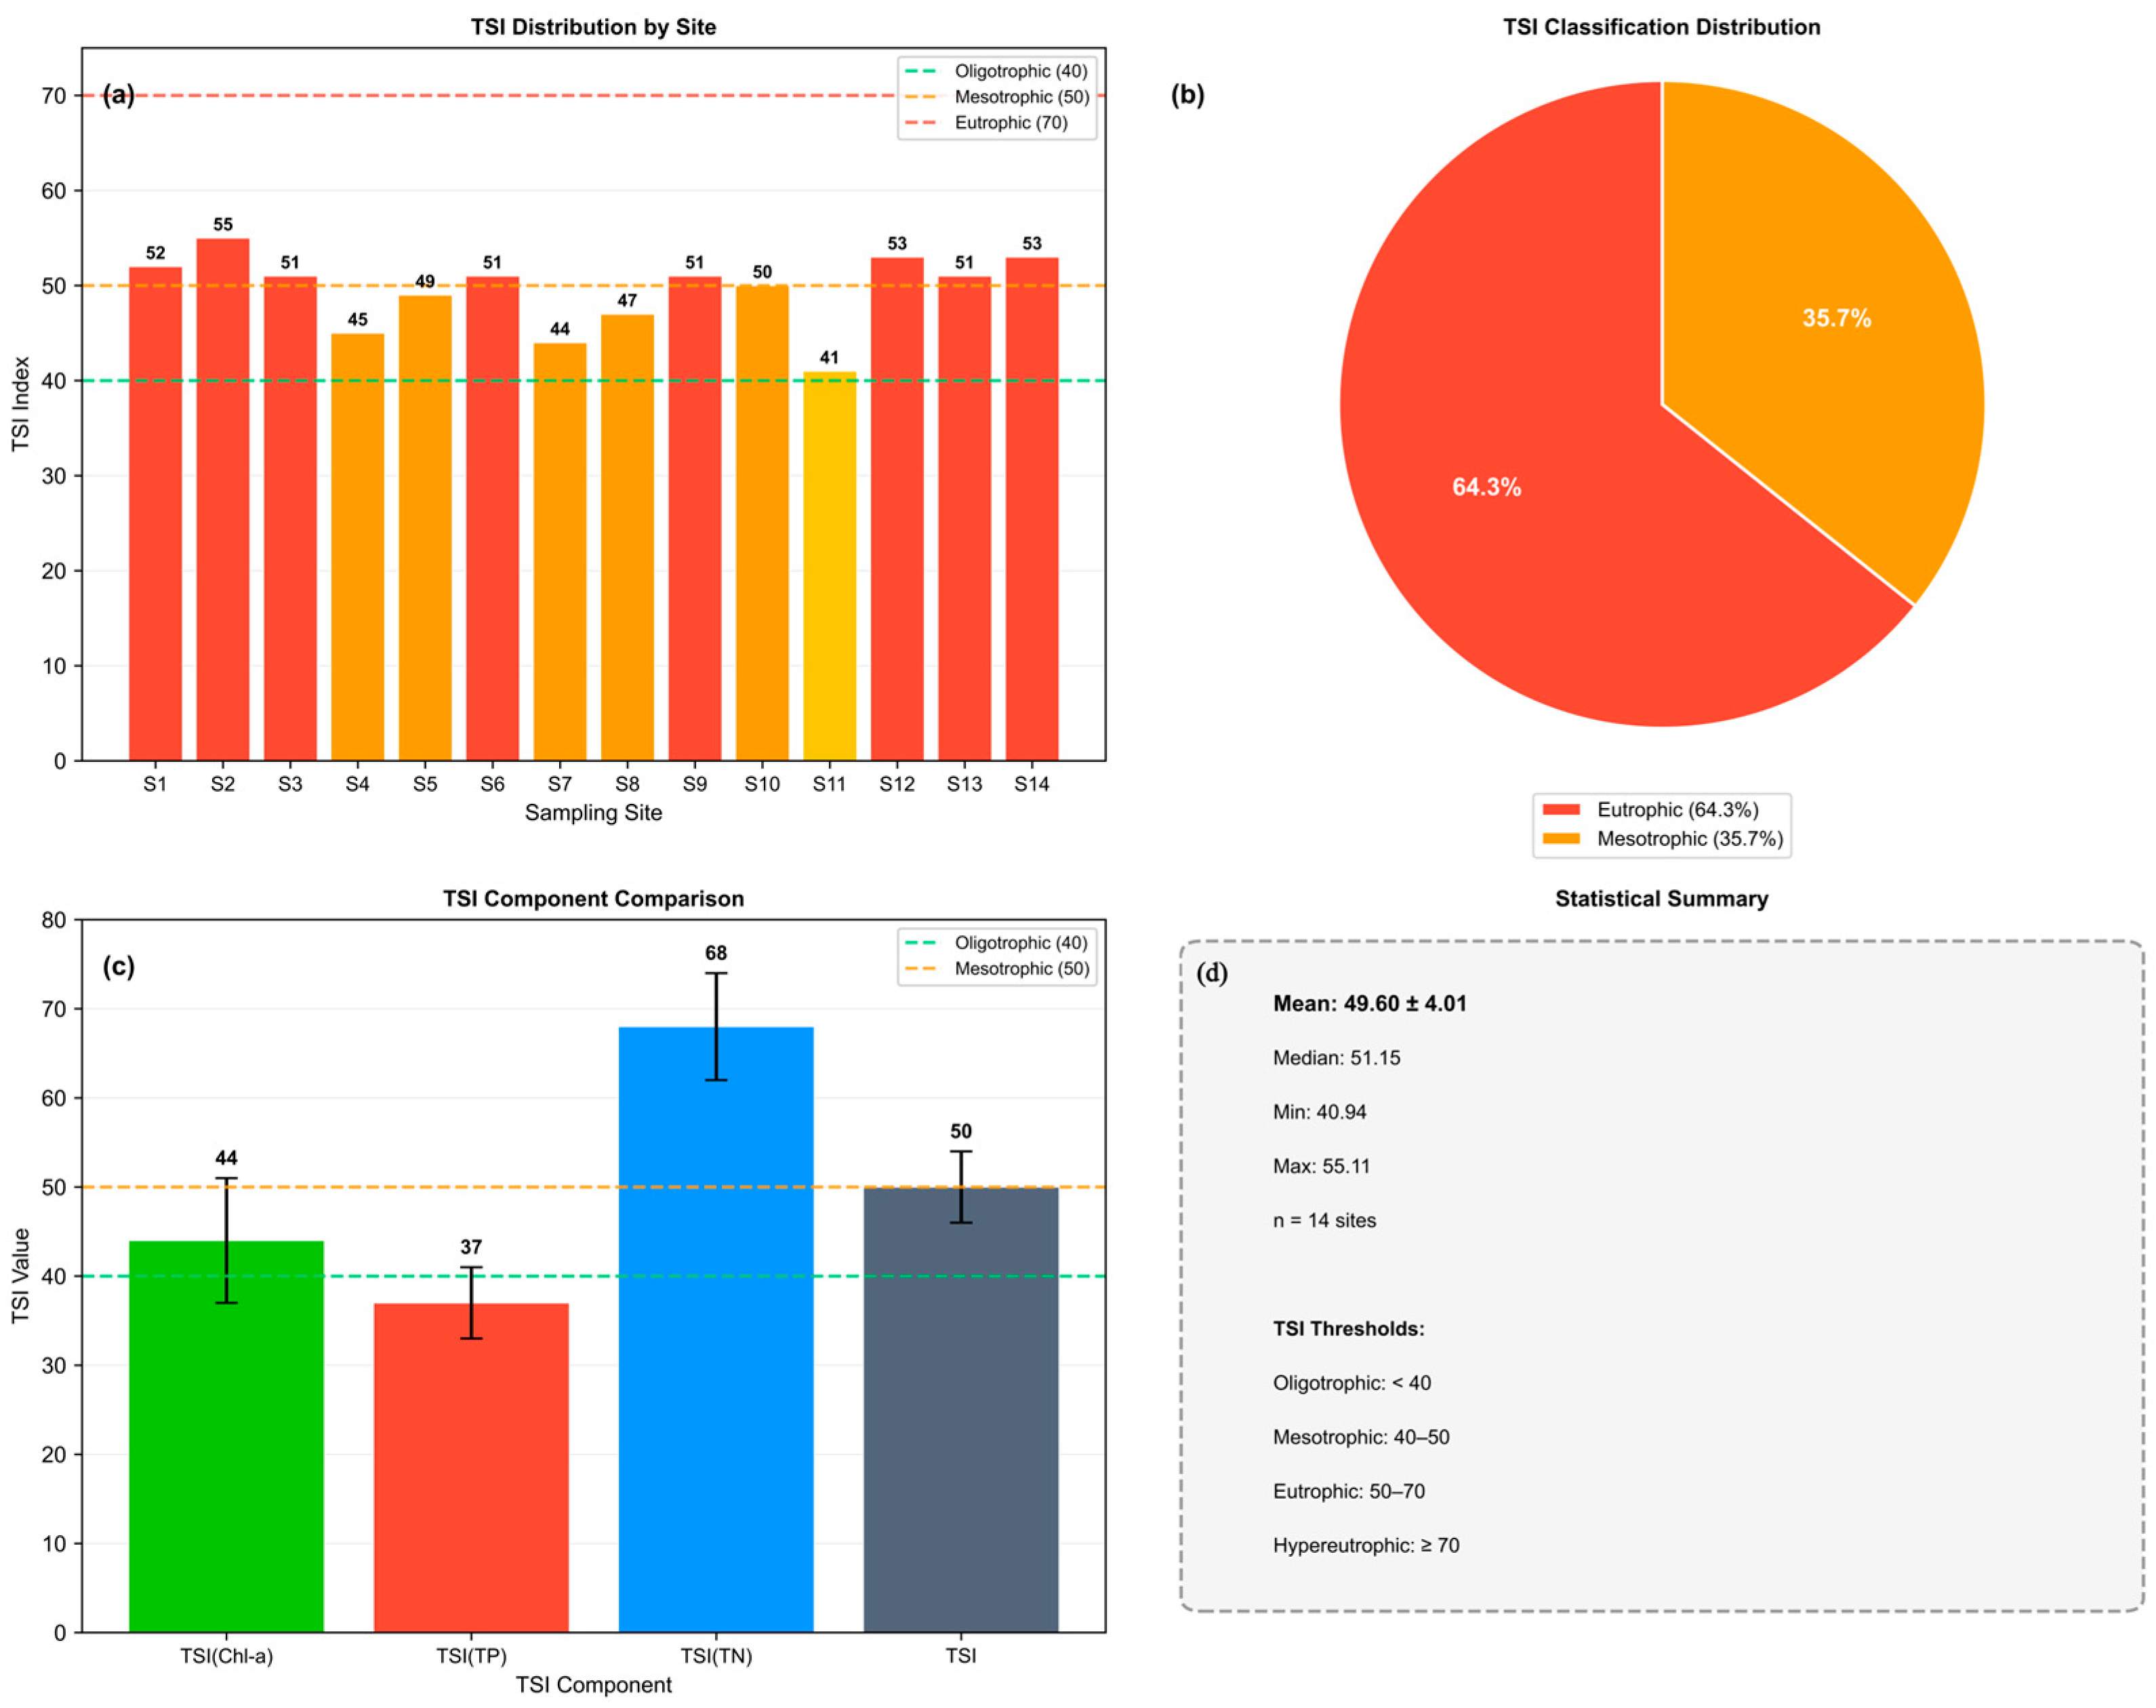
Trophic State Index (TSI) assessment of Baiyangdian Lake. (a) TSI values at each sampling site; (b) Proportion of sampling sites in different trophic classes; (c) Comparison of TSI values calculated from different parameters; (d) Statistical summary of TSI values and classification thresholds. The green, orange and red dashed lines represent the TSI thresholds for oligotrophic (<40), mesotrophic (40–50) and eutrophic (50–70) conditions, respectively.
TSI indices for the 14 sampling sites ranged from 40.9 to 55.1, with a mean of 49.6 ± 4.0 (Table 2, Figure 7a). According to the TSI classification criteria, all sites were at mesotrophic to eutrophic levels, with no oligotrophic or hypereutrophic states observed. Among these, 9 sites were eutrophic, accounting for 64.3%; 5 sites were mesotrophic, accounting for 35.7%.
Table 2.
TSI Trophic State Classification Statistics.
Spatial distribution of TSI exhibited certain heterogeneity (Figure 7b). Sites with higher TSI values (>50, eutrophic) were primarily distributed in southern and partial lake bay areas, while sites with relatively lower TSI values (mesotrophic) were mostly located in open water areas or near the outlet.
TSI component comparisons (Figure 7c) revealed important information about nutrient structure. At all sites, TSI(TN) values were significantly and consistently higher than TSI(TP) and TSI(Chl-a), indicating that Total Nitrogen (TN) is the primary limiting nutrient driving eutrophication in Baiyangdian Lake.
3.7. Sediment–Water Relationships
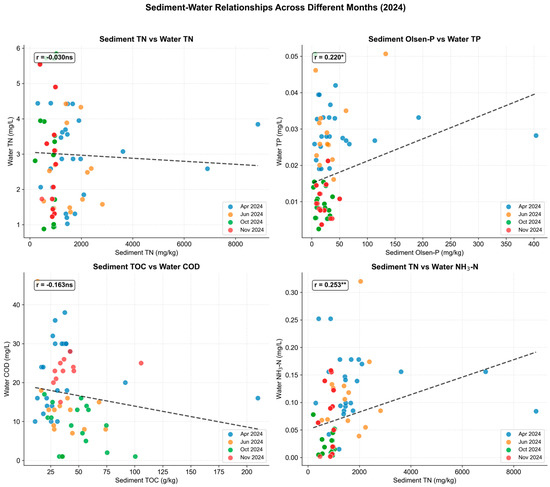
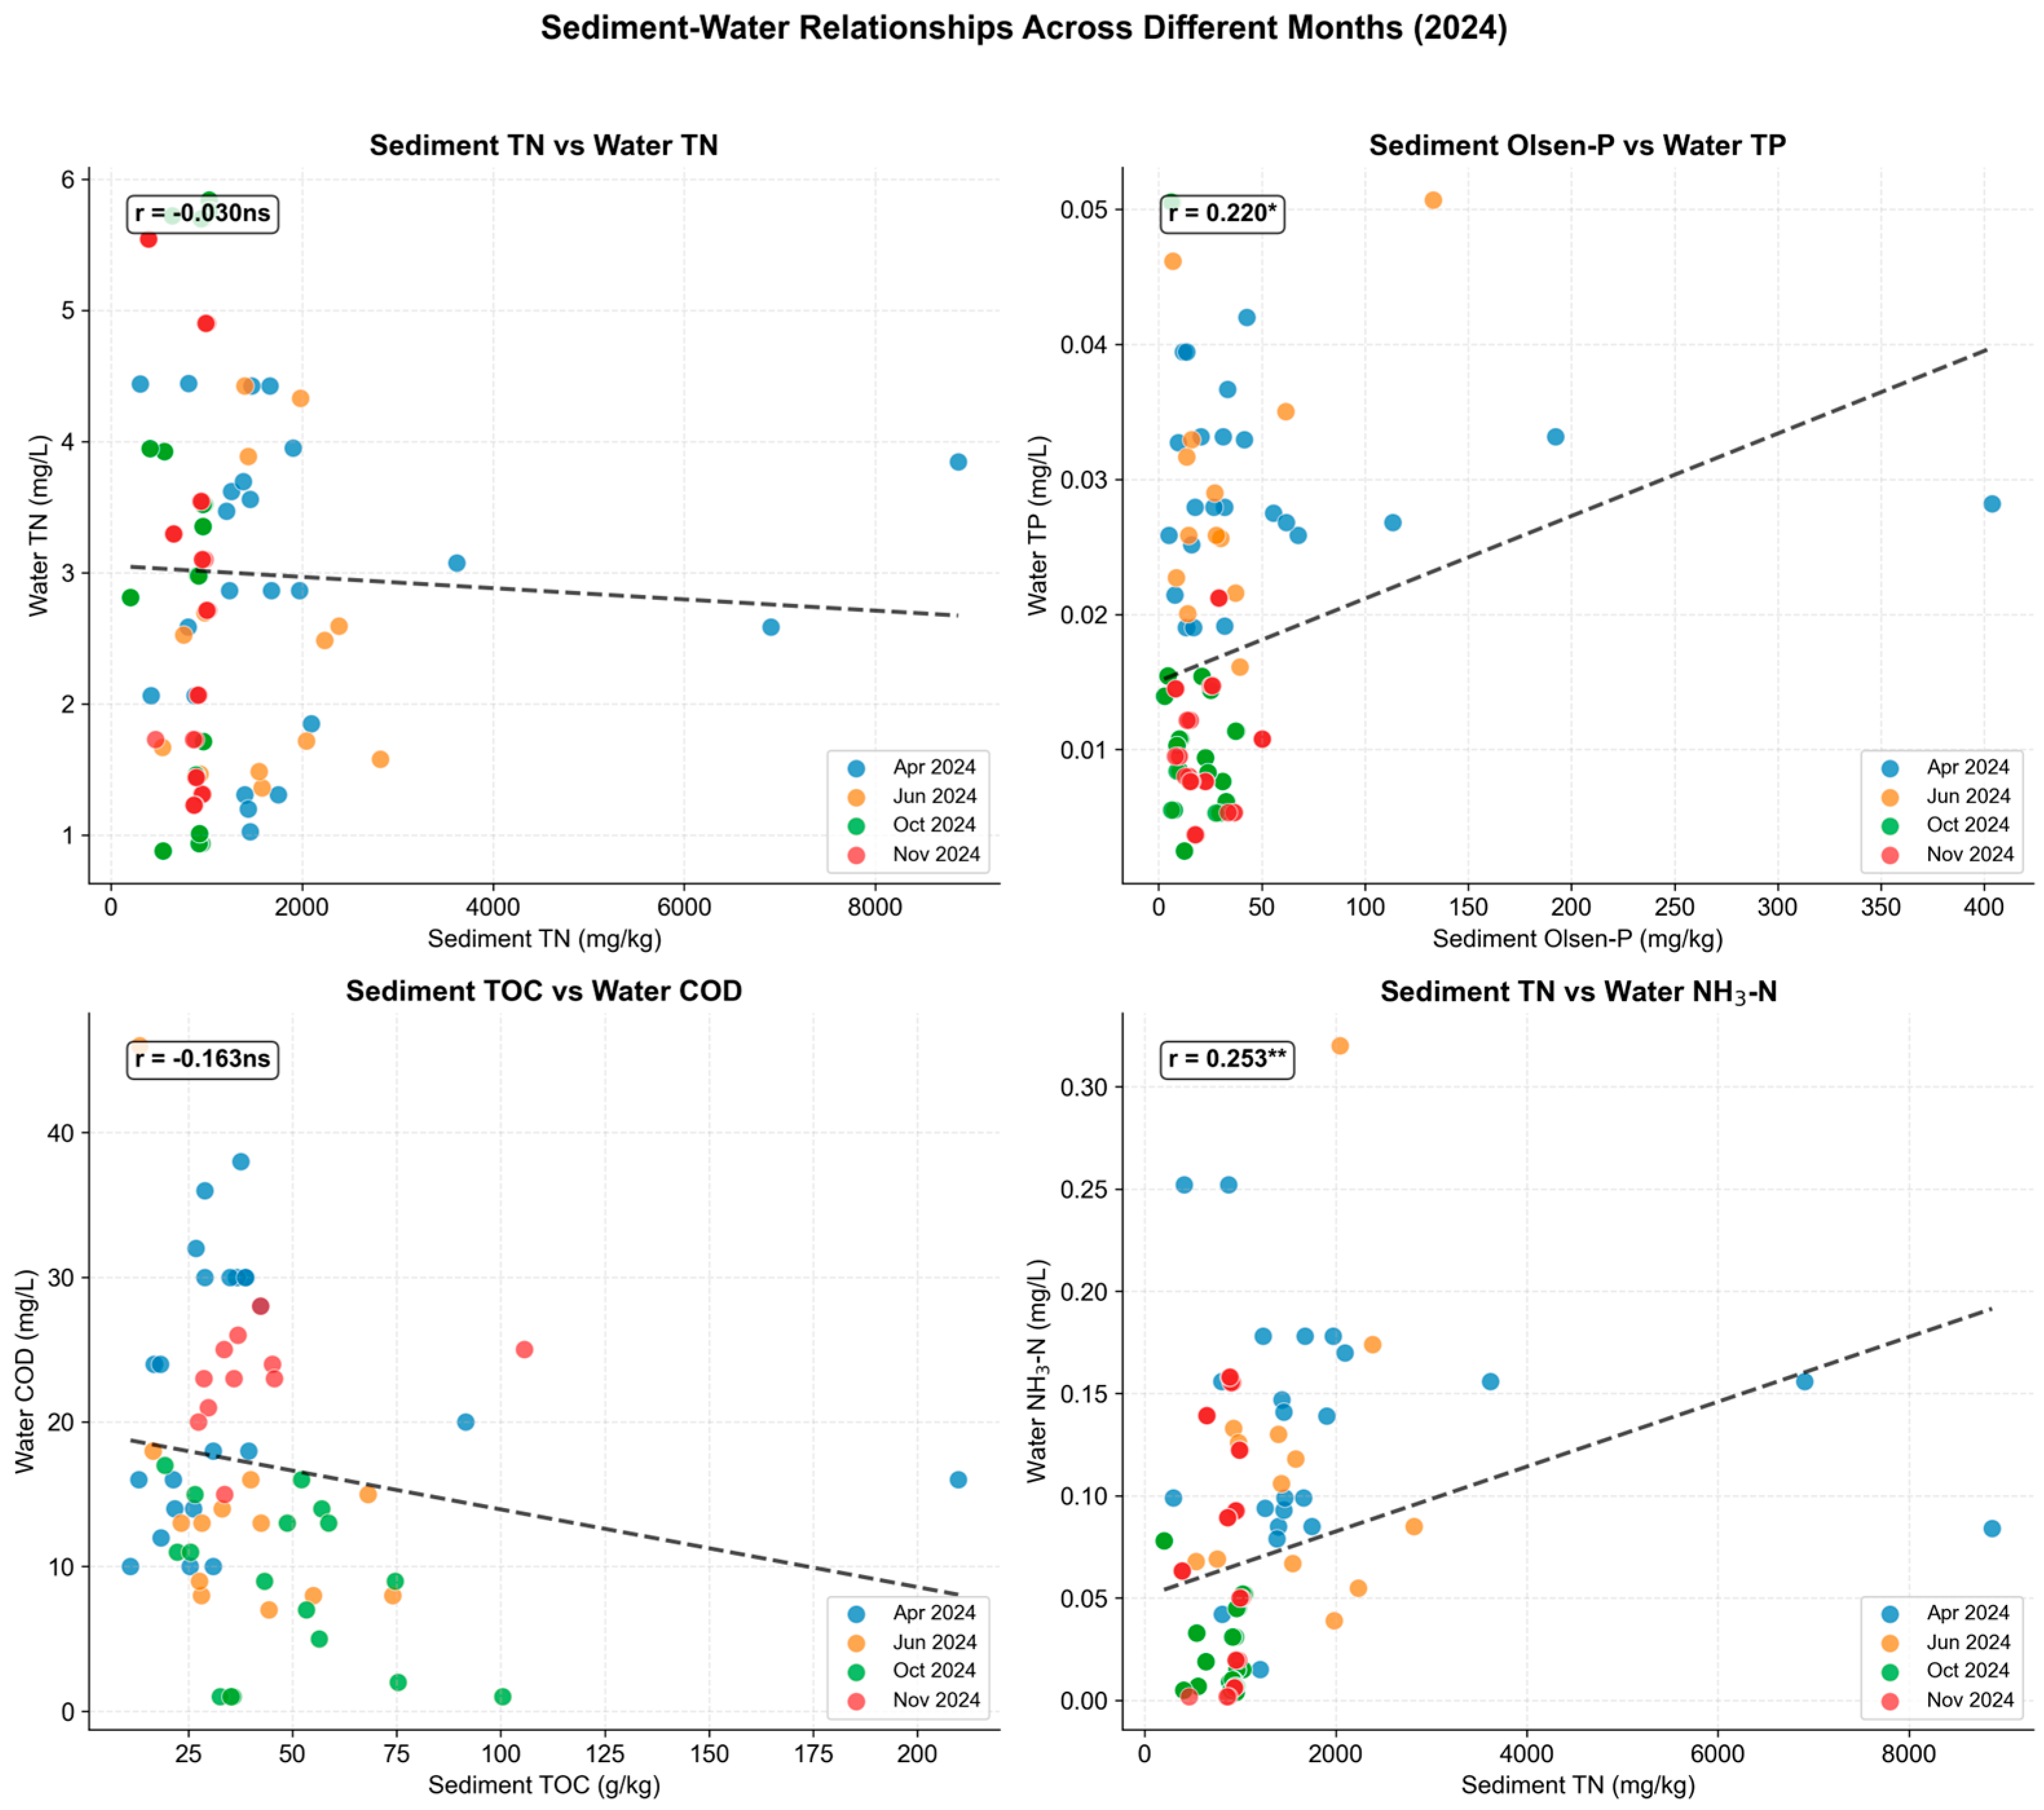
Correlation and regression analyses were conducted between sediment nutrient indicators and overlying water quality parameters for different months in 2024 (April, June, October, November) (Figure 8). Analysis results (Table 3) showed that Pearson correlation coefficients (r) for each parameter pair ranged from 0.26 to 0.35 in absolute value, with p-values all greater than 0.05, failing to reach statistical significance. Power analysis was performed using G*Power 3.1.9.7 to evaluate the statistical power of the linear regression models. The results showed that the statistical power (1 − β) ranged from 0.21 to 0.32 at the significance level of α = 0.05. The low statistical power was mainly attributed to the small sample size (n = 17) and high spatial heterogeneity of sediments. We recommend increasing the number of sediment sampling sites in future studies to improve the reliability of sediment–water relationship analysis.
Figure 8.
Correlation analysis between sediment nutrient indicators and overlying water quality parameters in 2024. (a) Correlation between sediment total nitrogen (TN) and water TN; (b) Correlation between sediment Olsen phosphorus (Olsen-P) and water total phosphorus (TP); (c) Correlation between sediment total organic carbon (TOC) and water chemical oxygen demand (COD); (d) Correlation between sediment TN and water ammonia nitrogen (NH3-N). r: Pearson correlation coefficient; * p < 0.05; ** p < 0.01; ns: not significant (p ≥ 0.05).
Table 3.
Regression analysis of sediment–water relationships.
4. Discussion
4.1. Water Quality Status and Eutrophication Risk
This study systematically revealed the severe water quality challenges facing Baiyangdian Lake. Mean concentrations of both TN and TP exceeded the eutrophication risk thresholds, and the mean TSI of 49.6 indicates the lake is in a mesotrophic to eutrophic state, consistent with findings from other shallow lakes in China [10,18].
The spatial pattern of water quality showed high levels at inflow estuaries and low levels at the outlet area, reflecting the dominant influence of external catchment sources. This pattern supports the hypothesis that agricultural non-point source pollution is the primary driver of lake eutrophication in this region [3,33]. Notably, despite the 2023 extreme flood event occurring during the study period, water quality monitoring data still exhibited spatial patterns similar to those of typical agricultural catchment lakes, suggesting the persistence and dominance of external inputs.
4.2. Impact Mechanisms of the Extreme Precipitation Event
The 2023 extreme precipitation event exerted complex and far-reaching impacts on Baiyangdian Lake water quality [6,13]. This flood, serving as a natural experiment, revealed lake vulnerability to extreme climate events and provided important insights into pollution dynamics under disturbed conditions [14].
This study identified three phases in the impacts of extreme precipitation events on lake water quality: the dilution phase (flood period), the lag effect phase (initial post-flood recession), and the recovery phase (1–2 years post-flood). During the flood period (August), precipitation led to a significant decrease in nutrient concentrations, with TN decreasing from 1.52 to 1.04 mg/L and COD decreasing from 21.81 to 13.75 mg/L, consistent with dilution effects observed in previous studies [13,14].
However, water quality evolution after flood recession revealed a more complex pattern. In September 2023, as Baiyangdian Lake began receiving substantial inflow from the opening of upstream sluice gates, the TN concentration surged to 4.22 mg/L, far exceeding pre-flood levels. Concurrently, the correlation between TN and TP increased sharply post-flood. This indicates not only a change in concentration but also an alteration in pollution source structure. This “lag effect” actually resulted from the human-controlled gate operations in the upstream of Baiyangdian. The large quantity of pollutants input into the lake during the post-flood period did not disappear with the receding flood peak but gradually released and accumulated during the recession process. This finding contrasts with observations on the impacts of extreme drought on lakes, emphasizing the persistence and complexity of extreme climate event impacts on lake water quality.
Monitoring data from 2024 showed that although TN concentration decreased somewhat (2.51–3.16 mg/L), it remained persistently above the Class V standard, indicating the long-term nature of flood event impacts. Meanwhile, TP concentration further decreased to 0.01–0.05 mg/L in 2024, possibly related to the implementation of the inter-basin water transfer project [34]. These results indicate that the impact mechanisms of extreme precipitation events on different nutrient parameters in lakes vary, and the cycling and fate of nitrogen and phosphorus need to be considered separately. A recent study by [35] demonstrated that rainfall-driven runoff can mobilize large amounts of agricultural nutrients (including nitrogen and phosphorus) from watershed soils and transport them into receiving water bodies, which is consistent with our observation that the 2023 extreme precipitation event significantly enhanced the contribution of agricultural non-point source pollution in Baiyangdian Lake.
4.3. Pollution Source Identification and Interpretation
PCA successfully identified two primary pollution sources, providing a quantitative basis for understanding nutrient sources in Baiyangdian Lake [17,18].
PC1 representing domestic sewage/livestock breeding was characterized by high COD, TP, and NH3-N. This pollution source is typically closely related to human domestic activities, including domestic sewage discharge, livestock breeding wastewater, and wastewater from food processing and other industries. In rural areas of North China, the contribution of such pollution sources is often underestimated, but their contribution to organic pollution and phosphorus enrichment cannot be ignored.
PC2 representing agricultural non-point source pollution was characterized by coupled high loadings of TN and TP, which is a typical signature of agricultural activities [3,33]. Fertilizer application entering water bodies through surface runoff is the primary pathway for nitrogen and phosphorus input to lakes in agricultural catchments. With agricultural land dominant in the Baiyangdian basin, controlling agricultural non-point source pollution is crucial for improving lake water quality.
An important finding of this study is that the 2023 flood event significantly altered the relative importance of pollution sources. After flood recession, sample points clearly clustered toward the PC2 direction (agricultural non-point sources), indicating that the flood event “activated” the contribution of agricultural non-point source pollution. This may be because: (1) floods scoured topsoil from farmland, causing large quantities of accumulated fertilizer pollutants to wash into the lake; (2) during the flood period, saturated soil water content led to continuous nitrogen input to the lake through post-flood groundwater runoff; and (3) damage to soil structure by agricultural activities increased catchment runoff and sediment yield. This finding emphasizes the priority status of agricultural non-point source pollution control in lake management, especially in the context of frequent extreme weather events.
4.4. Assessment of Internal Pollution Contributions
Analysis results of sediment–water relationships indicated that under the existing sampling conditions, no significant statistical correlation was detected between sediment and overlying water quality parameters. However, this result cannot simply negate the importance of sediment internal release, and should be understood from the following perspectives [31,32,36]:
Spatiotemporal complexity of interfacial processes: Nutrient exchange at the sediment–water interface is regulated by multiple factors including temperature, dissolved oxygen, pH, microbial activity, and hydrodynamic disturbance. Nutrient fluxes (release or adsorption), rather than static storage, more directly affect water quality. Monthly monitoring may fail to capture these high-frequency changes or lag responses [36]. Additionally, sediment data in this study were all collected during 2024, a normal water year. Without effective external disturbances, nutrient exchange fluxes at the sediment–water interface were relatively small. Another most important reason is that since the establishment of the Xiong’an New Area, Baiyangdian has undergone large-scale ecological restoration projects, including sediment dredging. The original sediments were centrally disposed, greatly reducing the impact of sediments as internal pollution sources on water quality.
Spatial scale mismatch: Sediment sampling points represent very localized information. Most sampling points were located in open water areas of the lake center, while overlying water quality was influenced by larger-scale water mass mixing, advective transport, and water column internal processes. There is a scale mismatch between point-based sediment data and more spatially integrated water sample data.
Importance of speciation transformations: Nitrogen, phosphorus, and carbon in sediments exist in multiple forms with vastly different bioavailability and release potentials. Sediment total nitrogen (TN) contains a large amount of inert organic nitrogen, while exchangeable ammonium nitrogen or transformable nitrogen more directly contributes to the water body. Sediments may act as a phosphorus “sink” under oxidizing conditions and convert to a “source” under anaerobic conditions [36].
Despite the absence of significant statistical correlations, sediments, as a huge nutrient storage reservoir (this study measured mean Olsen-P of 28.5 mg/kg, mean TN of 1137 mg/kg), pose non-negligible potential release risks. Under summer high temperatures, anoxic conditions, or wind–wave disturbance, internal release may still pose short-term impacts on water quality.
4.5. Nutrient Limiting Factors and Eutrophication Stage Assessment
TSI assessment results provide an important perspective for understanding the eutrophication status of Baiyangdian Lake.
TSI(TN) values consistently higher than TSI(TP) and TSI(Chl-a) clearly indicate that Total Nitrogen is the primary limiting nutrient driving eutrophication in Baiyangdian Lake. This finding has important management implications: while phosphorus control is the core strategy for eutrophication management in many lakes, nitrogen control may be more critical for Baiyangdian. This conclusion is corroborated by the PCA finding that agricultural non-point source pollution (coupled nitrogen and phosphorus input) was identified as the primary pollution source.
The mean TSI of 49.6 indicates that Baiyangdian Lake is in a “critical state” of eutrophication—with sufficient nutrient accumulation to support high biological productivity, but not yet reaching severe degradation [16,28]. From a management perspective, this finding is encouraging: targeted interventions may reverse eutrophication trends before irreversible ecological degradation occurs [34,37].
4.6. Management Implications and Recommendations
Based on the findings of this study, the following management strategies are recommended [3,33,34,35].
First, given that TN is the primary limiting factor, strict nitrogen emission controls should be implemented, incorporating nitrogen control into the core agenda of lake management, which includes strengthening rural domestic sewage treatment, optimizing agricultural fertilization strategies, and promoting slow-release fertilizers.
Second, pollution interception at inflow estuaries should be strengthened, as these are the primary channels for external nutrient inputs; inflow estuaries should be designated as priority treatment areas, and it is recommended that constructed wetlands and ecological interception zones be established in the downstream sections of inflow rivers to effectively reduce input loads.
Third, emergency response plans for extreme weather events should be developed, as the experience from the 2023 flood indicates that the impacts of extreme precipitation events on lake water quality exceed expectations; rapid response mechanisms should be established, including pre-emptive water level reduction, enhanced emergency monitoring, and implementation of emergency interception measures.
Fourth, systematic treatment of agricultural non-point source pollution should be promoted, considering control holistically from the watershed scale, including optimizing agricultural planting structures, promoting conservation tillage, and constructing farmland nitrogen and phosphorus loss interception facilities.
Fifth, continuous monitoring and dynamic assessment should be established; a long-term water quality monitoring network is recommended for Baiyangdian Lake to systematically track water quality trends and treatment effects, providing a scientific basis for management decisions.
5. Conclusions
This study systematically analyzed 18 months of water quality monitoring data for Baiyangdian Lake from April 2023 to November 2024, revealing the impact mechanisms of extreme precipitation events on shallow lake water quality. The results show that Baiyangdian Lake faces severe eutrophication pressure, with mean TN concentration of 2.13 mg/L exceeding the Class V surface water standard, mean TP concentration of 0.05 mg/L far exceeding the eutrophication threshold for freshwater lakes [38], and mean TSI of 49.6 ± 4.0 indicating a transitional state from mesotrophy to eutrophy, with 64% of sampling sites in eutrophic condition. The 2023 extreme precipitation event exerted significant phased impacts on water quality: a pronounced dilution effect was observed from the pre-flood to flood period (TN decreased from 1.52 to 1.04 mg/L), while a significant lag effect emerged after flood recession, with TN concentration surging to 4.22 mg/L in September 2023 (the highest value during the study period) and remaining at above-standard levels of 2.51–3.16 mg/L through 2024. PCA identified two primary pollution sources: agricultural non-point source pollution (PC2, contributing 25.4%) and domestic sewage/livestock breeding (PC1, contributing 27.6%), and the flood event significantly altered their relative importance, making agricultural non-point sources the dominant long-term influence after the flood. Nitrogen is the primary limiting nutrient, with TSI(TN) consistently higher than TSI(TP) and TSI(Chl-a), and Baiyangdian Lake is at an intermediate stage of eutrophication where timely intervention may reverse eutrophication trends.
Overall, this study enhances the understanding of shallow lake responses to extreme climate events, identifies a “dilution–lag–recovery” three-phase model for extreme precipitation impacts, emphasizes the priority status of agricultural non-point source pollution control in lake management, and provides a scientific basis for lake management in the Beijing–Tianjin–Hebei region.
Supplementary Materials
The following supporting information can be downloaded at: https://www.mdpi.com/article/10.3390/w18121422/s1, Table S1. Method detection limits (MDL), recovery rates and precision of water quality parameters; Table S2. Results of segmented principal component analysis (PCA) for different periods.
Author Contributions
Investigation, X.H. and L.M.; Data curation, H.S. and M.S.; Writing—original draft, Y.Z.; Visualization, J.C. All authors have read and agreed to the published version of the manuscript.
Funding
The authors are grateful for funding from the Hebei Academy of Sciences Basic Scientific Research Funds Pilot Project (2026PF03) and Science and Technology Planning Project of Hebei Academy of Sciences (26A07).
Data Availability Statement
The original contributions presented in this study are included in the article. Further inquiries can be directed to the corresponding authors.
Conflicts of Interest
The authors declare that they have no known competing financial interests or personal relationships that could have appeared to influence the work reported in this paper.
References
- Carpenter, S.R.; Stanley, E.H.; Vander Zanden, M.J. Global change and freshwater ecosystems. Annu. Rev. Environ. Resour. 2011, 36, 187–219. [Google Scholar] [CrossRef]
- Smith, V.H.; Joye, S.B.; Howarth, R.W. Eutrophication of freshwater and marine ecosystems. Limnol. Oceanogr. 2006, 51, 351–355. [Google Scholar] [CrossRef] [Scilit]
- Conley, D.J.; Paerl, H.W.; Howarth, R.W.; Boesch, D.F.; Seitzinger, S.P.; Havens, K.E.; Lancelot, C.; Likens, G.E. Controlling eutrophication: Nitrogen and phosphorus. Science 2009, 323, 1014–1015. [Google Scholar] [CrossRef] [Scilit]
- Schindler, D.W. Recent advances in the understanding and management of eutrophication. Limnol. Oceanogr. 2006, 51, 356–363. [Google Scholar] [CrossRef] [Scilit]
- IPCC. Climate Change 2021: The Physical Science Basis. Contribution of Working Group I to the Sixth Assessment Report of the Intergovernmental Panel on Climate Change; Cambridge University Press: Cambridge, UK, 2021. [Google Scholar]
- Kohzu, A.; Imai, A.; Miyajima, T.; Ishikawa, K.; Sato, C.; Nakagawa, M.; Matsuzaki, S.I.S.; Fukushima, T. Impacts of extreme precipitation events on nitrogen and phosphorus dynamics in a eutrophic lake. Sci. Total Environ. 2023, 878, 162567. [Google Scholar]
- Scheffer, M. Ecology of Shallow Lakes; Chapman & Hall: London, UK, 1997. [Google Scholar]
- Xu, H.; Paerl, H.W.; Qin, B.; Zhu, G.; Hall, N.S.; Wu, Y. Response of shallow lake ecosystem to reduced nutrient loading: A long-term mesocosm experiment. Water Res. 2025, 256, 116532. [Google Scholar]
- Qin, B.; Li, W.; Zhu, G.; Edrisa, M.; Harper, D.M. Lake eutrophication and its ecosystem response. Sci. China Earth Sci. 2021, 64, 557–569. [Google Scholar] [CrossRef] [Scilit]
- Zhou, Y.; Zhang, Y.; Shi, K.; Niu, C.; Liu, X.; Wang, G. Hydrological extreme events reshape lake water quality: Evidence from a 50-year record in Lake Taihu. Water Res. 2022, 221, 118766. [Google Scholar]
- Wang, Z.; Huang, S.; Chen, G.; Li, S.; Liu, D. Spatial heterogeneity of water quality in a large floodplain lake: Implications for monitoring and management. J. Environ. Manag. 2023, 325, 116523. [Google Scholar]
- Che, X.; Shang, J.; Zhang, C.; Liu, Y.; Wang, Z. High-resolution mapping of water quality parameters using machine learning and remote sensing in shallow lakes. Water Res. 2025, 252, 122156. [Google Scholar]
- Qian, J.; Wang, L.; Ma, L.; Zhao, W.; Yue, Y.; Wang, Z. Spatiotemporal dynamics of nutrients and chlorophyll-a in a large shallow lake: Responses to extreme precipitation events. Hydrol. Process. 2021, 35, e14156. [Google Scholar]
- Li, Y.; Shang, J.; Zhang, C.; Song, N.; Jia, Y.; Guo, Y.; Wang, H.; Liu, X. Extreme precipitation events increase nutrient export and alter water quality in a large floodplain lake. J. Environ. Sci. 2024, 136, 567–579. [Google Scholar]
- Carlson, R.E. A trophic state index for lakes. Limnol. Oceanogr. 1977, 22, 361–369. [Google Scholar] [CrossRef] [Scilit]
- Xu, H.; Paerl, H.W.; Qin, B.; Zhu, G.; Hall, N.S.; Wu, Y. Long-term nutrient trends and hypertrophic response in a large, shallow eutrophic lake (Lake Taihu, China). Hydrobiologia 2021, 847, 439–453. [Google Scholar]
- Zhou, J.; Lin, S.; Fan, J.; Li, B. Comprehensive trophic state assessment using multiple indices in Chinese shallow lakes. Environ. Pollut. 2025, 344, 123567. [Google Scholar]
- Wang, D.; Li, H.; Zhang, Y.; Chen, L. Source identification of nutrient pollution in a shallow eutrophic lake using multivariate statistical techniques. Chemosphere 2023, 313, 137456. [Google Scholar]
- Zhao, Y.; Xia, Y.; Wang, W.; Yang, Z. Seasonal and annual variations in nutrients and chlorophyll-a in a shallow, hypertrophic lake in China. Environ. Sci. Pollut. Res. 2023, 30, 68456–68470. [Google Scholar]
- Zhang, C.; Luo, J.; Ni, Z.; Liu, S.; Li, H. Spatial distribution and controlling factors of nutrients in a shallow lake during different flood periods. Ecol. Indic. 2022, 145, 109754. [Google Scholar]
- Liu, H.; Zhang, Q.; Wang, Y.; Chen, J.; Li, Z. Meteorological analysis of the July–August 2023 extreme precipitation event in the Beijing–Tianjin–Hebei region. Atmos. Res. 2024, 297, 107124. [Google Scholar]
- APHA (American Public Health Association). Standard Methods for the Examination of Water and Wastewater, 23rd ed.; APHA: Washington, DC, USA, 2017. [Google Scholar]
- GB 11892-89; Water Quality—Determination of Chemical Oxygen Demand—Dichromate Method. China Ministry of Ecology and Environment: Beijing, China, 1989.
- HJ 636-2012; Water Quality—Determination of Total Nitrogen—Alkaline Potassium Persulfate Digestion UV Spectrophotometric Method. China Ministry of Ecology and Environment: Beijing, China, 2012.
- GB 11894-89; Water Quality—Determination of Total Phosphorus—Ammonium Molybdate Spectrophotometric Method. China Ministry of Ecology and Environment: Beijing, China, 1989.
- HJ 535-2009; Water Quality—Determination of Ammonia Nitrogen—Nessler’s Reagent Spectrophotometry. China Ministry of Ecology and Environment: Beijing, China, 2009.
- GB 3838-2002; Environmental Quality Standards for Surface Water. China Ministry of Ecology and Environment: Beijing, China; China Environmental Science Press: Beijing, China, 2002.
- Kagalou, I.; Papadimitriou, T.; Ntislidou, C.; Lazaridou-Dimitriadou, M. Multivariate approach of the trophic evolution of two lakes with emphasis on their management. Ecol. Indic. 2008, 8, 720–729. [Google Scholar]
- Singh, K.P.; Malik, A.; Mohan, D.; Sinha, S. Multivariate statistical techniques for the evaluation of spatial and temporal variations in water quality of Gomti River (India). Water Res. 2004, 38, 3980–3992. [Google Scholar] [CrossRef] [Scilit] [PubMed]
- Helena, B.; Pardo, R.; Vega, M.; Barrado, E.; Fernandez, J.M.; Fernandez, L. Temporal evolution of groundwater composition in an alluvial aquifer (Pisuerga River, Spain) by principal component analysis. Water Res. 2000, 34, 807–816. [Google Scholar] [CrossRef] [Scilit]
- Wang, S.; Jin, X.; Zhao, H.; Wu, F. Phosphorus fractions and its release in the sediments of shallow lakes. Hydrobiologia 2006, 575, 153–162. [Google Scholar]
- Sondergaard, M.; Jensen, P.J.; Jeppesen, E. Retention and Internal Loading of Phosphorus in Shallow, Eutrophic Lakes. Sci. World J. 2001, 1, 676350. [Google Scholar] [CrossRef] [Scilit]
- Qin, B.; Zhu, G.; Gao, G.; Zhang, Y.; Li, W.; Paerl, H.W.; Liu, Z. Approaches to controlling eutrophication in the Taihu Lake, China: Lessons from case studies. Environ. Sci. Technol. 2023, 57, 23–43. [Google Scholar]
- Søndergaard, M.; Jeppesen, E.; Lauridsen, T.L.; Skov, C.; Van Nes, E.H.; Roijackers, R.; Lammens, E.; Portielje, R. Lake restoration: Success, failures and long-term effects. J. Appl. Ecol. 2007, 44, 1095–1105. [Google Scholar] [CrossRef] [Scilit]
- Alkhadher, S.A.A.; Sidek, L.M.; Khan, M.S.J.; Al-Habshi, M.M.A.; Kurniawan, T.A. Seasonal variations in water quality and hydrological dynamics in a tropical reservoir driven by rainfall, runoff, and anthropogenic activities. Sci. Rep. 2025, 15, 35589. [Google Scholar] [CrossRef] [Scilit]
- Jiang, X.; Liu, Y.; Liu, X.; Zhang, Q.; Xu, C.; Mei, Z.; Wang, X.; Chen, Y. Role of sediment in phosphorus cycling and internal loading in shallow lakes. Water Res. 2023, 232, 119689. [Google Scholar]
- Paerl, H.W.; Otten, T.G.; Kudela, R. Mitigation of increasing coastal eutrophication: From community to national action. Environ. Sci. Technol. 2014, 48, 11064–11070. [Google Scholar]
- Nürnberg, G.K. Trophic state of clear and colored, shallow and deep lakes. Lake Reserv. Manag. 2009, 25, 151–163. [Google Scholar]

Disclaimer/Publisher’s Note: The statements, opinions and data contained in all publications are solely those of the individual author(s) and contributor(s) and not of MDPI and/or the editor(s). MDPI and/or the editor(s) disclaim responsibility for any injury to people or property resulting from any ideas, methods, instructions or products referred to in the content. |
© 2026 by the authors. Licensee MDPI, Basel, Switzerland. This article is an open access article distributed under the terms and conditions of the Creative Commons Attribution (CC BY) license.