


Abstract
To measure the scale of agricultural water transfer (AWT) from the perspective of food security, this paper establishes an integrated framework for quantifying its actual scale, theoretical transferable scale, and deviation. Based on panel data from 2001 to 2023 of five cities (Anyang, Hebi, Xinxiang, Jiaozuo, Puyang) of the Wei River Basin in Henan Province, China, the actual transfer scale is derived by comparing agricultural water right allocations with net crop irrigation requirements calculated via the FAO 56 Penman Monteith formula; the theoretical transferable scale is estimated using a translog production function grounded in factor substitution theory. By contrasting the two scales, deviations and excessive transfer scenarios are identified. The results show that (1) actual AWT occurred in 59.13% of the city–year observations, exhibiting clear phase-based fluctuations, with positive transfer scale ranging from 0.046 to 13.983 × 10⁸ m3. The largest positive transfer occurred in Puyang in 2002, and Puyang, Jiaozuo, and Xinxiang were the main outflow areas. Factor combinations could release transferable water in 45.22% of the city–year observations, wherein pesticide/fertilizer, agricultural machinery, and grain sown area serve as the main substitutes. Theoretical transferable scale ranged from −60.150 to 186.374 × 10⁸ m3, with a mean of 1.718 × 10⁸ m3 and a median of −0.108 × 10⁸ m3, indicating unstable factor-substitution capacity. (2) Excessive transfer was identified when the actual transfer scale was positive and exceeded the theoretical transferable scale. Under this criterion, 47.82% of observations were excessive transfers, 11.33% were reasonable transfers, and 40.85% showed no transfer. Jiaozuo and Puyang were the core excessive transfer areas, each showing excessive transfer in 16 of the 23 years, while Xinxiang has shown a rising trend in recent years; Anyang, by contrast, effectively controls excesses through water saving technologies. The findings highlight the need for dynamic monitoring, city-specific regulation, and advanced water-saving technologies to balance water allocation with food security.
1. Introduction
Water transfer from agriculture to non-agriculture (hereinafter referred to as agricultural water transfer) is essentially a reallocation of water rights between the agricultural and non-agricultural sectors [1]. Water resources are a vital strategic foundation for agricultural production and food security. However, agricultural water transfer amid advancing industrialization and urbanization is profoundly altering the pattern of water resource allocation and posing a potential threat to food security [2]. In 2024, an estimated 673 million people worldwide experienced hunger. Irrigated land, which accounts for only 23% of arable land, contributed 48% of crop production. However, more than 60% of irrigated land is located in areas with high or extreme water scarcity [3]. As the global population approaches 9.7 billion by 2050, agricultural production (food, feed and fiber) will have to be 50% higher than that of 2012, accompanied by a 25% increase in freshwater consumption [4]. Meanwhile, grain production relies not only on irrigation water but also on precipitation and the regional water cycle [5]. Competition for limited water resources between the agricultural and non-agricultural sectors is intensifying. Many regions continue to face severe and recurring food emergencies. Therefore, in the context of intensified competition for water resources, calculating the scale of agricultural water transfer must consider the bottom line of food security.
China possesses only 9% of the world’s arable land and 6% of its freshwater, yet it supports nearly 20% of the global population [6]. Its per capita water resources are only one-third of the global average, with a highly uneven spatial distribution characterized by water abundance in the south and scarcity in the north [7]. Against this background, major grain-producing regions in northern China provide an appropriate context for examining agricultural water transfer under food-security constraints. These regions face a dual pressure: they are required to maintain stable grain production, while industrialization and urbanization continue to increase non-agricultural water demand. The Wei River Basin in Henan Province is a typical case of this conflict and its location is shown in Figure 1. Henan is one of China’s major grain-producing provinces, and the Wei River Basin is located in the water-scarce northern part of the province. The basin flows through Anyang, Hebi, Xinxiang, Jiaozuo, and Puyang, which together form the main city-level units of the basin within Henan Province, covering 15.6% of the province’s total area. These five cities are not only important grain-producing areas, but also contain industrial sectors such as steel, equipment manufacturing, chemicals, coal power, and petrochemicals. Therefore, they provide a representative setting for examining the competition between agricultural and non-agricultural water use. In 2023, the basin contributed 22.23% of Henan’s grain output, while using 17.9% of its grain sown area and 29.77% of its agricultural water. In recent years, these cities have developed a mixed agro-industrial structure, combining heavy industries (steel, equipment manufacturing, chemicals) with modern services. This clustering effect has intensified competition for water between agriculture and non-agriculture, highlighting the issue of water transfer. This indicates that the region has a high agricultural water dependence relative to its contribution to cultivated area. At the same time, the coexistence of grain production and water-intensive industrial activities increases the risk that agricultural water may be transferred to non-agricultural sectors. Such transfer essentially reallocates water rights across sectors. Failing to define the scale of this transfer accurately could worsen water allocation imbalances and threaten national food security. Therefore, it is necessary to monitor the scale and frequency of agricultural water transfer in the basin to balance increasing non-agricultural water demand with agricultural water security and to reduce the risks associated with excessive transfer. In this context, the Wei River Basin provides a representative case for examining the mechanisms of regional agricultural water transfer under the dual pressures of water reallocation and food security. Accordingly, selecting these five cities as the study area enables this study to evaluate agricultural water transfer in a region where food-security objectives and non-agricultural water demand are closely interconnected.
Figure 1.
Location of the Wei River Basin in Henan Province, China.
A large body of literature has discussed the actual scale and extent of agricultural water transfer. These studies cover different scales, including international [8,9], inter-basin [10,11], inter-regional [12], and inter-sectoral levels [13]. The methods used include the water use structure ratio method [8,14], historical baseline comparison method [13], and water rights trading data-based accounting [10,15]. Some studies have further applied the concept of virtual water and used multi-regional input–output models to track the cross-sectoral flow of water resources embedded in agricultural trade [16,17]. Zhang et al. [18] evaluated virtual water trade in the Yellow River Delta using a multi-regional input–output framework and found that agricultural production can intensify regional water-resource pressure through trade-related water outflows.
A series of studies have used production function methods to measure the theoretical transferable scale of agricultural water transfer. For example, Habibi Davijani et al. [19] modeled industrial water demand as a function of output, water price, and other input prices and examined the optimal allocation of water among agriculture, industry, and urban uses. They found that reasonable water transfer could lead to a 54% increase in economic growth and a 13% increase in employment. In a related study, Ku and Yoo [20] estimated the economic value of industrial water in the Korean manufacturing industry by comparing Cobb–Douglas and translog production functions. Their specification test showed that the translog production function was more appropriate for estimating the data.
In studies examining the relationship between the actual scale and theoretical transferable scale of agricultural water transfer, Taylor and Young [21] were the first to propose a decision-making framework based on the view that actual water transfers exceed the agricultural tolerance threshold. Other studies have examined the red lines for water transfers, taking into account the efficiency of water rights trading, constraints related to ecological and food security [22], and farmers’ willingness and technical feasibility [23].
Although existing studies have examined agricultural water transfer from the perspectives of water rights trading, inter-sectoral allocation, virtual water flows, and production function-based water substitution, two gaps remain. First, most studies measure water transfer mainly from the perspective of water use structure or economic allocation efficiency, while the minimum water requirement for safe grain production is rarely incorporated as a binding constraint. A reasonable agricultural water transfer should not come at the cost of food production or food security. As a result, it remains unclear whether the water transferred out of agriculture is truly surplus after satisfying the food-security baseline. Second, existing studies seldom integrate the actual transferable scale and the theoretical transferable scale into one framework. The former reflects the water balance between agricultural water rights and crop irrigation requirements, whereas the latter reflects the water-saving potential that can be compensated by adjustments in non-water production factors. Without comparing these two scales, it is difficult to distinguish reasonable transfer from excessive transfer.
Food-security-constrained agricultural water transfer differs from conventional water transfer from agriculture to non-agriculture. Under the conventional economic allocation perspective, agricultural water transfer is often evaluated according to economic returns, water rights trading efficiency, or inter-sectoral allocation benefits [8,10,13]. In such studies, water is mainly treated as a reallocable production factor. However, from the perspective of food security, agricultural water also performs a basic security function because it supports the minimum water requirement necessary for stable grain production [24]. Therefore, agricultural water transfer should not be judged only by whether water can be reallocated to sectors with higher economic returns, but also by whether the transfer remains within the safety boundary required for grain production. This perspective of food security changes the threshold setting for agricultural water transfer in two ways. First, the minimum irrigation water requirement for grain production constitutes the lower safety boundary. Agricultural water can be considered available for transfer only after the agricultural water right allocation satisfies the net irrigation water requirement of grain crops. Second, the theoretical substitution capacity of non-water production factors constitutes the upper compensation boundary. Even when agricultural water appears to be surplus, the transferred water should not exceed the amount that can be theoretically compensated by adjustments in production factors while maintaining grain output. If the actual transfer scale exceeds this conditional substitution boundary, the transfer may impose pressure on grain production and is therefore identified as excessive.
As mentioned earlier, the Wei River Basin in Henan Province plays a central role in China’s grain production and faces notable conflicts over agricultural water transfer. Therefore, this study focuses on “water transfer measurement under the constraint of food security” and uses the Wei River Basin in Henan Province as a case study. By combining crop water requirement estimation, agricultural water rights allocation, factor substitution theory, and deviation identification, this paper provides a city-level framework for identifying when agricultural water transfer may exceed the compensatory capacity of grain production. Analyzing the patterns and excess transfers in this region from a food-security perspective is important for China to achieve both food security and optimal water resource allocation.
By introducing both the minimum water requirement for grain production and the theoretical factor-substitution boundary, this study theoretically transforms food security from a qualitative policy concern into a quantitative constraint for identifying agricultural water transfer thresholds, distinguishing reasonable agricultural water transfer from excessive transfer under a food-security framework. The main contributions are as follows: (1) It constructs a model for measuring the actual scale of agricultural water transfer based on the balance between agricultural water rights allocation and net crop irrigation water demand, with the FAO-56 Penman–Monteith formula, and identifies the occurrence of agricultural water transfer in the Wei River Basin of Henan Province. Although the existing literature has conducted research on the scale of water transfer [25,26], the calculation under the bottom line of minimum water requirement for safe food production remains unclear. (2) It constructs a model for measuring the theoretical transferable scale of agricultural water transfer with the factor substitution theory, and quantifies the potential agricultural water available for transfer in the Wei River Basin of Henan Province by calculating the scale of agricultural water that can be substituted through adjustments in key food production factors including agricultural machinery, agricultural labor, and grain sown area. Previous studies have mainly used production functions to estimate water transfer in the industrial sector [27,28]. Few have used the translog production function to examine factor substitution and agricultural water use in the agricultural sector. (3) It assesses the deviation of agricultural water transfer to assess excess transfer, reasonable transfer, and no transfer scenarios in the Wei River Basin of Henan Province by comparing the actual transfer scale with the theoretical transferable scale. No previous studies have analyzed both actual surplus water and theoretical substitution boundaries within the same framework under food-security constraints. The findings can offer useful insights for policymakers and provide strategies for implementing differentiated water use controls and setting early warning thresholds for water rights transfers within the basin.
Based on the above research objectives, this study constructs an integrated framework that includes three modules: measurement of the actual scale of agricultural water transfer, measurement of the theoretical transferable scale, and deviation identification under the food-security constraint. The overall research framework is shown in Figure 2.
Figure 2.
Research framework.
2. Materials and Methods
The scale measurement of agricultural water transfer is divided into three parts: (1) measure the actual scale of water transfer based on agricultural water right allocation quantity and net crop irrigation water requirement; (2) measure the theoretical transferable scale of water transfer based on the factor substitution theory; (3) determine the scenarios of water transfer by calculating the deviation between the two measurements.
2.1. Model for Actual Scale Measurement of Agricultural Water Transfer from the Perspective of Food Security
2.1.1. Measurement of Agricultural Water Right Allocation Quantity
The 2000 agricultural water allocation ratio is used as the base period to calculate the agricultural water right allocation quantity [29]. This selection is based on both methodological and institutional considerations.
First, 2000 is the year immediately preceding the sample period of 2001–2023, and therefore provides a pre-sample benchmark for identifying the initial regional differences in agricultural water use structure. Second, 2000 represents the transition point between the Ninth Five-Year Plan period and the Tenth Five-Year Plan period, which marked the beginning of a new national planning cycle in China. Since water resources management, agricultural development, irrigation infrastructure investment, and resource conservation policies in China are often formulated and implemented within the framework of Five-Year Plans, the year 2000 provides a suitable initial reference point for constructing a comparable baseline across regions.
It should be emphasized that the use of the 2000 coefficient does not imply that China’s agricultural water policies remained unchanged during 2001–2023. In fact, China experienced important water governance reforms during the study period, including the revision of the Water Law and the subsequent implementation of the strictest water resources management system. The purpose of fixing the coefficient at the 2000 level is to capture the initial regional allocation structure of agricultural water use before the major institutional adjustments during the sample period. This treatment also helps avoid potential endogeneity that may arise if later agricultural water allocation ratios are used, because post-2000 agricultural water shares may themselves be affected by policy reforms, urbanization, industrial restructuring, water-saving irrigation technologies, and changes in local water management institutions.
Accordingly, the agricultural water right allocation quantity is calculated as follows:
In Equation (1), represents the agricultural water right allocation quantity for region i in year t; represents the agricultural water rights allocation coefficient for region i, calculated based on the agricultural water allocation ratios of each city in 2000; represents the total water supply for region i in year t.
Although is fixed, remains time-varying through annual changes in . Therefore, this measure combines a comparable initial agricultural water allocation structure with annual variations in regional water supply.
2.1.2. Measurement of Actual Crop Evapotranspiration
Actual crop evapotranspiration is calculated based on the reference crop transpiration formula provided in FAO-56 (FAO Irrigation and Drainage Series No. 56) [30]. The formula is as follows:
First, calculate the daily reference crop evapotranspiration :
In Equation (2), represents the reference crop evapotranspiration for region i on day t; represents the slope of the saturated vapor pressure curve; represents the net radiation; represents the soil heat flux; represents the psychrometric constant; represents the daily mean air temperature; represents the wind speed at a height of 2 m; represents the saturated vapor pressure; and is the actual vapor pressure.
The auxiliary variables in Equation (2) are calculated as follows.
is calculated separately from the daily maximum and minimum air temperatures and :
is calculated based on and :
is calculated from the relative humidity :
calculated from atmospheric pressure , which is further determined by elevation :
Finally, is calculated from the balance between shortwave radiation and longwave radiation :
Next, actual crop evapotranspiration is calculated using method. According to this method, the influence of climate on crop water requirements is quantified by the reference evapotranspiration , while the influence of the crop is represented by the crop coefficient :
where represents the actual crop evapotranspiration for region i, crop j, and day t; represents the crop coefficient for region i, crop j, and day t. Based on the Penman–Monteith equation, FAO-56 provides the physical definition of (Equation (9)), revealing the mechanism by which varies with crop type, growth stage, and climatic conditions:
Due to the occurrence of irrigation with insufficient water supply, the water stress coefficient is introduced to constrain , characterizing the actual daily crop transpiration under conditions of water deficit . The formula becomes the following:
FAO-56 provides the standard typical crop coefficient values for different growth stages. In practical applications, the coefficients are adjusted by combining the standard values and recommended by the FAO with the results of existing studies [31,32,33,34].
Based on experimental evidence from winter wheat in the Huang–Huai–Hai Plain [35], was set to 0.8 as an empirical adjustment coefficient. And for winter wheat and summer corn were determined based on regional experimental studies conducted in Henan Province and nearby areas [36]. Specifically, the winter wheat was taken from the observed coefficients for Zhengzhou, Henan, and the summer corn was taken from the observed coefficients for Xinxiang, Henan. These locations are close to the Wei River Basin in Henan Province and have similar crop growth periods and agro-climatic conditions. Therefore, these regional coefficients are more suitable for estimating crop water requirements in the study area than directly applying generalized FAO-56 default values. The adopted values generally follow the crop coefficient curve recommended by FAO-56, with lower values during the early and late growth stages and higher values during the vigorous growth stage. Some peak-stage values are higher than the typical FAO-56 values, which reflects local field-observed evapotranspiration characteristics under regional climatic and irrigation conditions. The detailed values used in this study are listed in Table 1.
Table 1.
for winter wheat and summer corn used in this study.
2.1.3. Measurement of Net Crop Irrigation Water Requirement
During crop growth, natural precipitation provides some irrigation benefits [37]; therefore, the actual net evapotranspiration of crops can only be determined by excluding the impact of this water supply from the total evapotranspiration. The empirical coefficient method is employed to determine the effective rainfall for region i on day t through the rainfall utilization coefficient [38,39,40]:
Following Chen and Zhou’s approach, the coefficient is assigned according to daily precipitation grades rather than treated as a fixed constant. Specifically, is set to 1.00 when , 0.80 when , 0.75 when , and 0.70 when .
Therefore, the actual net evapotranspiration for region i, crop j, and day t is as follows:
The annual actual net evapotranspiration for region i and crop j is as follows:
The actual crop water requirement is influenced by the grain sown area. Let denote the grain sown area of crop j for region i in year t. Therefore, the net irrigation water requirement of crop j in region i in year t is as follows:
2.1.4. Measurement of the Actual Scale of Agricultural Water Transfer
In resource-constrained water-scarce regions, water supply is chronically tight, and there is intense competition for water among different water-using sectors [41,42]. When the agricultural water right allocation quantity exceeds the net crop irrigation water requirement, the excess agricultural water can be transferred to non-agriculture [43]. This scale represents the actual scale of agricultural water transfer.
In the research area, winter wheat and summer corn are the primary grain crops; the average proportion of their grain sown area relative to the total grain sown area is calculated as a weighted factor for the net crop water requirement. Therefore, the formula for the net crop irrigation water requirement in region i in year t is as follows:
represents the minimum irrigation water requirement for grain production under the food-security constraint, rather than the total water demand of all agricultural subsectors. Agricultural water is also used for vegetables, fruits, cash crops, livestock, and other agricultural activities. These non-grain agricultural water demands are not directly included in . Therefore, the agricultural water transfer scale estimated in this study should be interpreted as an upper-bound estimate under the grain-security constraint, rather than the total surplus water after satisfying the water demand of all agricultural subsectors. Excluding non-grain agricultural water demand may lead to an overestimation of transferable agricultural water.
The actual scale of agricultural water transfer is as follows:
In Equation (16), represents the actual scale of agricultural water transfer in year t; if , it indicates that surplus agricultural water is available for transfer; if , it indicates that agricultural water is already insufficient to meet the minimum requirements for crop growth, and there is no water available for transfer.
2.2. Model for Theoretical Transferable Scale Measurement of Agricultural Water Transfer from the Perspective of Food Security
Taking into account the interactions among various factors and the nonlinear characteristics of the food production system, the translog production function effectively reveals the complex relationships among these factors and their combined impact on output by incorporating cross-terms and quadratic terms of production factors [44,45]. Therefore, the translog production function is employed for measuring the scale of agricultural water that can be substituted through adjustments in key food production factors.
The theoretical transferable scale estimated in this study should be interpreted within the boundary of the grain production system. It does not represent the total transferable water of the entire agricultural sector. Instead, it measures the amount of agricultural water that could theoretically be compensated by observed changes in non-water production factors while maintaining grain output.
In reality, agricultural water is also used for cash crops, vegetables, fruits, aquaculture, livestock, and other agricultural activities. However, consistent city-level water use data for these agricultural subsectors are not available for the entire study period. Therefore, aggregate agricultural water use is used as a proxy for water input in the grain production function. This treatment may introduce uncertainty because part of the observed agricultural water use is not directly used for grain production. Accordingly, the theoretical transferable scale should be interpreted as a conditional reference threshold under the grain-security constraint, rather than as an absolute transferable water quota for the whole agricultural sector.
Total grain output is used as the dependent variable and total agricultural machinery power per capita, agricultural labor, grain sown area, road area per capita, agricultural water use, and pesticide and fertilizer application rates as independent variables. There are multi-level intrinsic relationships among these various factors. For instance, road area per capita affects the deployment of agricultural machinery, the transportation of agricultural inputs, and the distribution of agricultural products; improvements in this area can enhance the operational efficiency of agricultural machinery and optimize the spatial allocation of factors [46,47]. In the sowing and harvesting stages, machinery significantly substitutes for labor, whereas in field management and facility maintenance, the two must be used in conjunction [48,49]. Water fertilizer integration and improved irrigation conditions enhance fertilizer utilization rates, but excessive fertilization can damage soil structure, thereby increasing water demand [50,51]; the output efficiency of grain sown land is constrained by supporting inputs such as machinery, labor, and water; insufficient inputs lead to diminishing marginal returns, requiring a quadratic function to characterize the nonlinear relationship [52,53]; excessive fertilizer application leads to soil degradation and pollution, constraining long-term production capacity [54,55].
To facilitate the analysis, this study makes four basic assumptions:
Assumption 1.
Agricultural production technologies in the region remain constant over the study period;
Assumption 2.
Against the backdrop of a tight balance between water supply and demand, agricultural water security under the food-security constraint is mainly concerned with ensuring water availability for grain production. Therefore, grain production is treated as the priority sector in defining the minimum agricultural water requirement. In addition, water supply in the study area is assumed to be generally constrained, although the degree of water scarcity may vary across cities and years;
Assumption 3.
Agricultural water affects both agricultural output and other input factors;
Assumption 4.
When estimating the elasticity of substitution between water and a specific factor, the inputs of other factors remain fixed.
The constructed translog production function is as follows:
In Equation (17), represents the total grain output for region i in year t, while , , , , , and represent the six types of factor inputs for region i in year t: total agricultural machinery power per capita, agricultural labor force, grain sown area, road area per capita, agricultural water use, and pesticide and fertilizer application rates, respectively. is the intercept term; i denotes the research region; t denotes the year; is the individual effect, representing regional heterogeneity that does not vary over time; is the disturbance term.
2.2.1. Measurement of Output Elasticity
The output elasticity of an input factor refers to the relative change in output resulting from a relative change in the input of that factor, assuming the levels of other production factors remain constant [56]. In this study, it refers to the proportionate increase in output resulting from a 1% increase in the input of each of the six input factors, assuming all other conditions remain unchanged.
Drawing on the research by Blackorby and Russell [57], the output elasticity of each input factor is calculated based on the estimation results from Equation (17). The general form is as follows:
In Equation (18), represents the output elasticity of input factor n for region i in year t, and represents the marginal output of input factor n for region i in year t. represent the various input factors, respectively.
2.2.2. Measurement of Substitution Elasticity
Production function reveals the quantitative relationship between various inputs and outputs at a given level of technology; it can also be used to analyze the substitution relationships among factors [56]. These substitution or complementary relationships between factors influence the relative proportions of production inputs. Based on the analysis of factor substitution theory presented earlier, the substitution elasticity between each factor and agricultural water use can be defined as follows: given that grain output remains constant, the degree of change in the corresponding input ratios resulting from a 1% change in the marginal technical rate of substitution between the factors.
Substitution elasticity between each factor and agricultural water use is derived based on the results from Equations (17) and (18). The general form of the substitution elasticity for input factors is as follows:
In Equation (19), and represent the output elasticities of input factors and , respectively, for region i in year t; , , and are the corresponding coefficients of the quadratic terms in the translog production function; and represent the various input factors. This equation illustrates the substitution or complementarity relationships among the factors, assuming that grain output remains constant.
Therefore, represents the substitution elasticity between input factor n and agricultural water use for region i in year t, with values ranging from . When , it indicates a substitution relationship between the two factors; conversely, it indicates a complementary relationship. The larger the absolute value of , the stronger the correlation between the factors, and the greater the scope for substitution or complementarity.
2.2.3. Measurement of Marginal Rate of Technical Substitution
The marginal rate of technical substitution (MRTS) refers to the technical ratio by which the quantity of one input factor is increased to substitute for another, while keeping grain output constant [56]. In the grain production process, it measures the mutual substitutability among different production factors and reflects the characteristics of production technology as well as the efficiency of factor allocation.
Specifically, the MRTS between the other five input factors and agricultural water use can be understood as the amount of an input factor that must be increased to reduce the unit of agricultural water use, while keeping grain output constant. This ratio is determined by the ratio of the marginal outputs of the two factors and reflects the compensatory capacity of other factors for water resources under conditions of water scarcity.
The MRTS between each of the other five input factors and agricultural water use is calculated based on the estimated coefficients from Equations (17) and (18). According to the formula for factor output elasticity, the general form of the between input factor and input factor can be expressed as the ratio of the marginal outputs of the two factors:
In Equation (20), and represent the output elasticities of input factors and , respectively, for region i in year t; and denote the corresponding quantities of these input factors; and represent the various input factors. This equation shows that the MRTS depends on the product of the ratio of output elasticities and the ratio of input quantities, thereby providing an intuitive reflection of the technical substitution relationships among different input factors in the production process.
2.2.4. Measurement of Theoretical Transferable Scale of Agricultural Water Transfer
In the process of grain production, multiplying the additional quantity of input factor by its MRTS with agricultural water use yields the theoretically substitutable scale of agricultural water resources for each factor, and then yield the scale of agricultural water that can be substituted through adjustments in input factor [56]. The calculation formula is as follows:
where , , , , and denote the additional quantities of these five input factors for region i in year t. If , it indicates that the input of the substitute factor n for region i in year t increased compared to the previous year; otherwise, it decreased. For 2001, the increment was calculated using the 2000 value as the pre-sample reference.
The total scale of agricultural water resources that can be substituted for each input factor is as follows:
In Equation (23), represents the total scale of agricultural water resources substituted by the combination of factors in grain production for region i in year t, the theoretical transferable scale of agricultural water transfer. , , , , and respectively denote the MRTS of total agricultural machinery power per capita, agricultural labor force, grain sown area, road area per capita, and pesticide and fertilizer application rates relative to agricultural water use for region i in year t.
If , it indicates that there is a quantity of water resources available for substitution in the grain production process for region i in year t; otherwise, no such water resources are available.
It should be emphasized that is not an administratively prescribed or exogenously fixed transfer quota. Rather, it is a conditional theoretical boundary derived from the factor substitution capacity of the agricultural production system under the constraint of maintaining grain output. Specifically, measures the amount of agricultural water that could theoretically be substituted by the observed annual increases in non-water production factors, given their MRTS with agricultural water use.
Because the annual changes in production factors may be affected by water availability, policy incentives, and local agricultural adjustment, should be interpreted as a dynamic reference threshold reflecting the realized adaptive capacity of the agricultural production system in each city–year. From the perspective of food security, agricultural water transfer can be considered relatively reasonable only when the actual transfer scale does not exceed the amount of water that can be compensated by factor substitution. If the actual transfer scale exceeds this conditional boundary, the transfer may impose pressure on grain production and is therefore identified as excessive.
2.3. Model for Deviation Identification of Agricultural Water Transfer from the Perspective of Food Security
Based on the results of the previous measurements regarding the actual scale and theoretical transferable scale of agricultural water transfer, a model for identifying the deviation of agricultural water transfer has been established. Its basic form is as follows:
where denotes the deviation of agricultural water transfer for region i in year t. Under the food-security constraint, the deviation identification model is not intended to evaluate agricultural water transfer solely from the perspective of economic efficiency. Instead, it identifies whether actual agricultural water transfer exceeds the compensatory capacity of the grain production system. Therefore, represents the actual transferable scale after satisfying the minimum grain-production water requirement, while represents the theoretical substitution boundary that can be compensated by non-water production factors while maintaining grain output. As calculated earlier, is used as a conditional theoretical reference threshold rather than a strict policy quota. It reflects the maximum agricultural water-saving potential that can be theoretically compensated by observed factor substitution in a given city–year. Therefore, when is positive and does not exceed , the transfer is classified as relatively reasonable under the food-security constraint. Conversely, when exceeds , the transfer is classified as excessive, because the transferred water is greater than the amount that can be theoretically offset by non-water factor adjustments. Based on the measurement of , a case-by-case analysis is conducted:
- (1)
- If , meaning that the region had no surplus agricultural water available for transfer in that year, and no agricultural water transfer occurred.
- (2)
- If , meaning that the region had surplus agricultural water available for transfer in that year. The transfer scenarios must be further assessed:
- ➀
- If , meaning the water transfer has not exceeded the theoretical water-saving limit, constituting a reasonable transfer.
- ➁
- If , meaning the water transfer has exceeded the theoretical water-saving limit, constituting an excess transfer.
2.4. Data Sources
The meteorological variables (including air temperature, wind speed, humidity, solar radiation, and atmospheric pressure) were obtained from the China Meteorological Data Service Center (http://data.cma.cn) (accessed on 3 September 2025). Crop coefficients and water stress coefficients were adjusted on a daily basis based on the standard values recommended by the Food and Agriculture Organization of the United Nations (FAO), incorporating published literature and empirical studies. Data on total water supply and agricultural water use were obtained from various issues of the Henan Provincial Water Resources Bulletin. Data on total grain production, total agricultural machinery power per capita, agricultural labor, grain sown area, road area per capita, pesticide and fertilizer application rates, and other socioeconomic indicators were obtained from various issues of the Henan Provincial Statistical Yearbook, the Henan Survey Yearbook, and the relevant municipal statistical yearbooks. Furthermore, to avoid inconsistencies arising from changes in land accounting methods during the Third National Land Survey (2018–2020), this study uniformly uses continuous crop planted area data—independent of the survey—as the basis for calculating relevant indicators. This process ensures the comparability of data and the robustness of conclusions throughout the entire study period (2001–2023).
3. Results
3.1. Results of the Actual Scale of Agricultural Water Transfer from the Perspective of Food Security
According to Figure 3, from 2001 to 2023, there were significant regional variations in the annual net crop irrigation water requirement in cities of the Wei River Basin in Henan Province. According to the statistical data in Appendix A Table A1, the net irrigation water requirement for wheat remained at a relatively high level overall between 2001 and 2019. It fluctuated relatively steadily from 2002 to 2005, showed a fluctuating upward trend from 2006 to 2012, peaked in multiple cities in 2012, and declined significantly from 2020 to 2023, reaching the lowest level within the study period in 2023. The trend in net irrigation water requirement for corn is similar to that for wheat, but the values are generally lower. The net irrigation water requirement for wheat is generally higher than that for corn; both decrease simultaneously during wet years and increase simultaneously during dry years. From a regional comparison, the values for Xinxiang, Anyang, and Puyang are generally higher than those for Jiaozuo and Hebi. The changing trends across cities were generally synchronous, with no significant phase difference.
Figure 3.
(a) Net irrigation water requirements for wheat in cities of the Wei River Basin in Henan Province; (b) Net irrigation water requirements for corn in cities of the Wei River Basin in Henan Province.
The actual scale of agricultural water transfer in cities of the Wei River Basin in Henan Province was further calculated, with results shown in Figure 4 and Appendix A, Table A2. From a temporal perspective, most cities were characterized by negative values from 2001 to 2005, with all five cities turning to positive values only in 2003; from 2006 to 2013, fluctuations in transfer scale intensified; in 2012, all five cities exhibited negative values, while Xinxiang and Puyang showed positive values in 2011; from 2014 to 2023, most cities remained predominantly negative from 2014 to 2017, but the number of years with positive values increased after 2018, with all five cities displaying positive values in 2021; and from 2022 to 2023, all cities except Anyang showed positive values. From a spatial perspective, Xinxiang was mostly negative from 2001 to 2005 but turned positive after 2018; Puyang was positive in most years; Anyang was negative in most years; Hebi showed relatively small fluctuations between positive and negative values; and Jiaozuo was positive in most years. Among them, a positive value indicates the occurrence of actual transfer of water resources from agriculture to non-agriculture that year, while a negative value indicates that there was no occurrence of actual transfer.
Figure 4.
(a) Actual scale of agricultural water transfer in Anyang; (b) Actual scale of agricultural water transfer in Hebi; (c) Actual scale of agricultural water transfer in Xinxiang; (d) Actual scale of agricultural water transfer in Jiaozuo; (e) Actual scale of agricultural water transfer in Puyang.
3.2. Results of the Theoretical Transferable Scale of Agricultural Water Transfer
3.2.1. Descriptive Statistics
The descriptive statistics of the factors are shown in Appendix A, Table A3. From the perspective of output factors, the total grain output (Y) has a mean of 2.55155 million tons and a standard deviation of 1.0908, with a minimum value of 761,400 tons and a maximum of 4,859,100 tons. This indicates that the Wei River Basin, as an important grain production area in Henan Province, has a relatively stable overall grain output. However, due to differences in arable land endowment, water resources, and production technology, grain output varies across regions. In terms of input factors, total agricultural machinery power per capita (x1) ranges from 4407.134 kW to 13,966.95 kW, showing large differences in mechanization levels across the basin. Some regions have improved grain production capacity by increasing mechanization, providing a capital basis for factor substitution in agricultural water transfer. The average number of agricultural labor (x2) is 936,700, with a standard deviation of 489,360, ranging from 84,600 to 1.9525 million, indicating uneven labor distribution. Grain sowing area (x3) averages 39,4708 hectares, with a standard deviation of 171,603, ranging from 149,900 to 723,460 hectares, reflecting a high concentration of arable land. Road area per capita (x4) averages 189.51 m2, with a standard deviation of 40.28, showing relatively stable infrastructure but regional differences. Agricultural water use (x5), the core factor of this study, averages 899.9 million m3, with a standard deviation of 376.5, ranging from 189.7 million to 2.0 billion m3, reflecting regional differences in agricultural water demand. Pesticide and fertilizer application rates (x6) average 1.89228 million tons, with a standard deviation of 0.41176, indicating relatively concentrated input intensity across regions.
3.2.2. Parameter Estimation
This study employs Stata 17.0 software to conduct econometric analysis. Test results for the standard panel model are presented in Appendix A, Table A4. Using the F-test and the Breusch–Pagan LM test to assess model suitability, a fixed-effects model was selected to estimate the translog production function. In addition, the Modified Wald test, Pesaran CD test, and Wooldridge test were used to examine cross-group heteroskedasticity, within-group autocorrelation, and cross-group contemporaneous correlation.
These results show that the data exhibit first-order within-group autocorrelation and cross-group contemporaneous correlation. Therefore, conventional OLS, FE, or RE estimators may lead to inefficient estimates and unreliable statistical inference if these error structures are ignored. To address this issue, this study employs feasible generalized least squares (FGLS) to estimate the translog production function. The results are presented in column (4) of Appendix A Table A5. For comparison, columns (1) through (3) present the regression results for the fixed-effects (FE), mixed OLS, and random-effects (RE) models, respectively. Based on the FGLS estimates, a likelihood ratio (LR) test was conducted to test the joint significance of the quadratic and interaction terms, and at the 1% significance level, the null hypothesis that all coefficients of the quadratic and interaction terms are zero was rejected. The squared terms and interaction terms of most factor input variables passed the significance test, indicating the existence of complex nonlinear relationships and interaction effects among the various factors of production, thereby validating the rationality of the translog production function model.
The FGLS model does not transform the data into a form that is free from autocorrelation or cross-sectional dependence. Instead, it explicitly accounts for the detected disturbance structure in the estimation process. Specifically, the FGLS specification allows for heteroskedastic panels with cross-sectional contemporaneous correlation and panel-specific AR(1) autocorrelation.
3.2.3. Results of Output Elasticities, Substitution Elasticity and MRTS
In interpreting the translog production function, the coefficients of individual first-order terms should not be interpreted independently as output elasticities. Because the translog specification includes squared and interaction terms, the marginal contribution of each input is jointly determined by the first-order coefficient, the corresponding quadratic term, the interaction terms with other inputs, and the observed input levels. Therefore, the output elasticities provide a more appropriate basis for economic interpretation.
For example, although the coefficients of the first-order and squared terms of grain sown area, namely lnx3 and (lnx3)2, are negative, several interaction terms between grain sown area and other production factors are positive. This suggests that the contribution of grain sown area to grain output depends on its combination with agricultural machinery, labor, infrastructure, agricultural water use, and pesticide/fertilizer inputs. The positive output elasticity of grain sown area shown in Table 2 indicates that, under the observed factor combinations, grain sown area still contributes positively to grain production. Similarly, although the coefficient of the squared term of agricultural water use, namely (lnx5)2, is negative, the marginal effect of agricultural water use may vary across cities due to differences in irrigation efficiency, water scarcity, crop structure, and the coordination of other production inputs. Weak or negative marginal effects in some cities may reflect diminishing returns to agricultural water use or inefficient water allocation rather than a direct negative effect of water on grain production.
Table 2.
Results of factor output elasticities and standard errors in cities of the Wei River Basin in Henan Province.
According to the factor output elasticity results in Table 2, grain sown area is positive and has the highest value among the five cities, ranging from 0.379 to 0.815. It is the core driver of grain production growth in each city. Road area per capita is positive in all five cities, reflecting the positive effect of infrastructure improvement on grain production. Agricultural labor has positive but relatively small values in all five cities, indicating that the marginal contribution of labor is limited. Agricultural water use is positive in Hebi, Anyang, and Puyang, negative in Jiaozuo, and close to zero in Xinxiang, showing regional differences in the marginal contribution of irrigation water. Total agricultural machinery power per capita is positive only in Anyang and Xinxiang, and negative in the other three cities. Pesticide and fertilizer application is positive only in Anyang and Hebi, and negative in the other three cities. This suggests that in some cities, mechanization and fertilizer input have entered a stage of diminishing marginal returns.
The standard errors and 95% confidence intervals further clarify the estimation precision of the output elasticities. Grain sown area has positive output elasticities in all five cities, and its confidence intervals are above zero in most cities, indicating a relatively stable contribution to grain production. By contrast, the elasticities of other inputs show stronger regional heterogeneity.
The substitution elasticities provide a descriptive interpretation of the substitutive or complementary relationships between non-water production factors and agricultural water use. They are not directly used as the input for calculating the theoretical transferable scale. In this study, the theoretical transferable scale is calculated based on factor increments and the MRTS derived from the output elasticities. Therefore, the substitution elasticity results mainly serve as supplementary evidence for understanding factor relationships. Table 3 presents the substitution elasticities of input factors relative to agricultural water use. A positive value indicates that the factor has a substitution relationship with agricultural water use; a negative value indicates that the factor has a complementary relationship with agricultural water use and cannot substitute for the agricultural water used in grain production. It was found that all factors in Anyang, Hebi, and Xinxiang exhibit a substitution relationship with agricultural water use; in Jiaozuo, all four factors except for grain sown area exhibit a substitution relationship; and in Puyang, all four factors except for the agricultural labor exhibit a substitution relationship. In terms of substitution elasticity values, Anyang and Puyang had the highest total agricultural machinery power per capita substitution elasticity, while Jiaozuo had the highest agricultural labor substitution elasticity. The substitution elasticities of each factor in Hebi and Xinxiang were relatively similar.
Table 3.
Results of the substitution elasticities and standard errors of input factors relative to agricultural water use in cities of the Wei River Basin in Henan Province.
The standard errors and 95% confidence intervals indicate that the substitution elasticities differ substantially in estimation precision. Most substitution elasticities are positive, suggesting that non-water inputs generally have the potential to substitute for agricultural water use. However, several estimates show large standard errors and wide confidence intervals, especially and in Jiaozuo and in Puyang. This reflects the high nonlinearity of the substitution elasticity formula and the amplification of uncertainty when some output elasticities are close to zero.
The results of MRTS of input factors relative to agricultural water use are shown in Appendix A, Table A8 and Table A9. Across all indicators, MRTS65 had the highest number of positive values, indicating that fertilizer can better substitute for agricultural water in most cities. MRTS25 fluctuated significantly, showing an unstable substitution relationship. MRTS15, MRTS35, and MRTS45 showed some negative values, indicating a complementary relationship with agricultural water in those years. At the city level, Anyang showed a stable substitution between fertilizer and water, but labor substitution weakened after 2014. In Hebi, all substitution relationships were relatively weak, and mechanization did not significantly substitute for water. In Xinxiang, labor and fertilizer showed large positive values in some years, but the relationship remained unstable. In Jiaozuo, substitution capacity of labor and sown area weakened after 2010. In Puyang, fertilizer was the most prominent substitute for water, while other factors showed limited substitution capacity. Overall, fertilizer exhibits the most widespread substitution relationship with agricultural water across the five cities, while the substitution capacity of other factors varies by city and shows substantial interannual fluctuations.
3.2.4. Results of the Scale of Agricultural Water Resources Substituted by the Combination of Factors in Grain Production
The additional quantity of input factors is shown in Appendix A Table A10 and Table A11. Table 4 further shows the theoretical transferable scale of agricultural water transfer that can be substituted by the combination of factors in grain production. The theoretical transferable scale for each city frequently alternated between positive and negative values: Anyang showed large positive values in 2002 and 2023, and large negative values in 2003, 2008, and 2018; Hebi had small or negative substitution volumes in most years except 2001; Xinxiang experienced dramatic fluctuations, with significant positive values in 2002 and 2022; Jiaozuo and Puyang showed relatively stable substitution volumes, although Puyang recorded a large negative value in 2014. The alternating positive and negative characteristics indicate that the substitution capacity of agricultural water consumption by changes in factor inputs in various cities is unstable. Negative values indicate that factor adjustments in that year would require additional agricultural water to maintain output; thus, any positive actual water transfer would be considered excessive.
Table 4.
Results of the theoretical transferable scale of agricultural water transfer that can be substituted by the combination of factors in grain production in cities of the Wei River Basin in Henan Province (100 million m3).
The extreme values in Table 4 require further interpretation. The theoretical transferable scale is a model-derived substitution potential calculated from the annual increments of substitute factors and their MRTS with agricultural water use. Therefore, unusually large positive or negative values may occur when abrupt changes in production factors occur or when substitution relationships are unstable. Overall, these outliers reflect the sensitivity of the theoretical transferable scale to abrupt factor changes and unstable substitution relationships.
For Xinxiang in 2002, the outlier is associated with the sharp increases in agricultural labor and grain sown area. At the same time, several MRTS between these factors and agricultural water use were positive, indicating that these factor adjustments had theoretical water-saving substitution potential in that year. Therefore, the large positive value reflects an unusually strong theoretical substitution potential under the observed factor combination.
For Puyang in 2014, the outlier reflects a different mechanism. Agricultural labor decreased substantially, while its MRTS showed complementary rather than substitutive relationships with agricultural water use. This indicates that maintaining grain production under that factor structure would require additional agricultural water.
3.3. Results of Deviation Identification of Agricultural Water Transfer from the Perspective of Food Security
Table 5 summarizes scenarios of agricultural water transfer in cities of the Wei River Basin in Henan Province. It reveals that Jiaozuo and Puyang are the core areas of excess water transfers in the basin, while Xinxiang has experienced an increase in the frequency of such transfers in recent years.
Table 5.
Deviation and scenario classification of agricultural water transfer in cities of the Wei River Basin in Henan Province.
From a temporal perspective, excess agricultural water transfer in the basin shows clear phased characteristics. From 2001 to 2005, Anyang, Xinxiang, Jiaozuo, and Puyang all experienced excess transfers to varying degrees, with Puyang having the most years. From 2006 to 2010, Jiaozuo had excess transfers for five consecutive years, making it the core region in this phase; Puyang also had excess transfers in all years except 2010. From 2011 to 2015, Jiaozuo and Puyang continued to show high excess frequencies. Xinxiang had excess transfers in 2011 and 2016, while Anyang only had them in 2003 and 2006. From 2016 to 2023, Xinxiang saw a clear increase in excess frequency, with excess in 2018, 2021, and 2023. Jiaozuo and Puyang maintained high frequencies, Hebi had excess in 2020 and 2023, and Anyang only in 2021. From a spatial perspective, excess transfer patterns vary significantly across the five cities. Puyang and Jiaozuo had the highest frequency, with excess in 16 out of 23 years, accounting for 69.57%, while Hebi had excess in 11 years, Xinxiang in 8 years, and Anyang in only 4 years. This pattern closely relates to local industrial structures. For example, Jiaozuo relies on coal for power and equipment manufacturing, creating strong inelastic industrial water demand that drives agricultural water transfer. Similarly, Puyang, supported by the oilfield, has high water demand from its petrochemical industry, leading to similarly frequent excess transfers.
4. Discussion
To evaluate agricultural water transfer under food-security constraints, this study develops a model for estimating its scale. Using the Wei River Basin in Henan Province as a case study, it analyzed the dynamic process of such transfers between 2001 and 2023. The results show that agricultural water transfer in this basin exhibits significant spatiotemporal fluctuations, with unstable substitution capacity and large inter-city differences. Excess water transfers also show clear regional differentiation. The following sections discuss these findings in light of existing research.
4.1. Main Findings and Consistency with Previous Studies
Regarding the spatiotemporal patterns of water transfer, it is found that the actual transfer scale fluctuated in phases and peaked in 2021. Our findings are similar to Wu et al. [58], who reported significant year-to-year fluctuations in water competition in the Yellow River Basin, with peaks in 2011 and 2023. Together, we confirm that inter-sectoral water competition at the basin scale is highly dynamic under changing water demands. In assessing the substitution effects of production factors on water resources, this study confirms that machinery, labor, and fertilizer can substitute for agricultural water, but substitution elasticities vary significantly across cities. The substitution volumes of factor combinations in each city also frequently alternate between positive and negative values from year to year, indicating that substitution capacity is unstable. This finding is partly consistent with the widely held view that increased investment and technological progress can effectively alleviate water resource pressures [19,20]. In analyzing the patterns of water transfer, the causes of excess transfer, and regional disparities, it is found that Jiaozuo and Puyang are persistent core areas of excess agricultural water transfer, Xinxiang is an emerging area, while Anyang has achieved effective control through water conservation. This spatial pattern closely relates to local industrial structures. Wu et al. [58] noted that the structural dimension of water competition in the Yellow River Basin is the main driver of overall competition, reflecting water demand from energy and food industries. Our cases provide concrete evidence for this mechanism: the rigid industrial water demand in Jiaozuo and Puyang has directly led to the continued displacement of agricultural water rights. Anyang’s effective control measures align with those of Jiang et al. [59], who called for fair and orderly transfers through technology upgrades and standardized management, providing a reference example of Chinese practice.
4.2. In-Depth Analysis of Incremental Contribution
Our model goes further by identifying specific years of water surplus and shortage from a direct water balance perspective constrained by food security, while Wu et al. [58] relied on water footprints and competition indices. In contrast, we define the actual transferable scale by comparing agricultural water right allocation with the net irrigation water requirement for grain production. Therefore, the measurement is directly linked to the food-security baseline rather than only to water use structure or trade-related water flows. Hirsch et al. [60] proposed a mechanism for water rights transfers across seasons: moving water from agriculture to cities during droughts and from cities back to agriculture during wet periods. From this perspective, agricultural water transfer may be considered beneficial if it improves total economic returns. However, this study adopts a different theoretical premise: in major grain-producing regions, agricultural water is not only a reallocable production factor but also a basic input for maintaining grain output. Therefore, agricultural water transfer should be evaluated not only by economic efficiency, but also by whether it exceeds the grain-production safety boundary. These differences suggest that methods based on actual crop water needs and rigid water rights should also be considered when capturing real-time risks to agricultural water security and provide a stronger basis for baseline management. Many studies argue that technological progress, improved irrigation efficiency, and increased non-water inputs can alleviate agricultural water pressure. Our results partly support this view but are more cautious. The theoretical transferable scale frequently alternates between positive and negative values across cities and years, indicating that factor substitution capacity is not stable. In some years, factor adjustments cannot release agricultural water and may even require additional water to maintain grain output. Jiang et al. [59] noted that the lack of adequate compensation for farmers is a major issue in China’s agricultural water transfers, implying that technological progress or factor input increases do not automatically translate into safe water transfer capacity. Their effectiveness depends on the local factor combination, water use efficiency, crop structure, and other conditions. Therefore, a further incremental contribution of this study is to transform the general argument that “technology can reduce water pressure” into a conditional and measurable threshold framework. By integrating crop water requirement estimation, agricultural water right allocation, factor substitution, and deviation identification, this study identifies not only whether agricultural water transfer occurs, but also whether it exceeds the compensatory capacity of the grain production system. This framework provides a more cautious and operational basis for water transfer management in major grain-producing and water-scarce regions.
4.3. Limitations and Future Research
Our analysis quantifies the scale of agricultural water transfer and identifies its patterns from a food security perspective, but it has several limitations. First, crop water demand is calculated based on historical climate averages, which may not capture the nonlinear effects of future extreme weather events on water demand or their potential to amplify risks to agricultural water security. Second, the factor substitution model treats technological progress as exogenous, making it difficult to reflect long-term changes in substitution potential due to technological breakthroughs. Third, the study focuses only on the Wei River Basin, so the conclusions need further validation in other major grain-producing regions. Fourth, owing to the lack of consistent city-level data, water demand from non-grain agricultural subsectors was not separately estimated. Excluding non-grain agricultural water demand could overestimate transferable water. In addition, the assumption of tight water supply equilibrium is a simplified representation of the general water scarcity condition in the study area. The transfer scenarios identified in this study should be interpreted as grain-security-based risk signals rather than absolute judgments on water sufficiency for all agricultural activities. Future research could integrate climate change risk scenarios, such as the method used by Li et al. [61], into the assessment of water transfer scales to improve predictive ability. Researchers could also develop dynamic models with endogenous technological progress and apply the framework validated in this basin to other grain-producing areas with different resource endowments and development stages, such as the Yellow River Basin and the Northeast Black Soil Region. Comparative studies across these regions would help deepen our understanding of both the general patterns and regional specificities of agricultural water transfer. Also, using more detailed subsectoral water use data could improve research accuracy and reduce uncertainty.
5. Conclusions
Given the frequent occurrence of agricultural water transfer during industrialization and urbanization, excessive transfers may pose a serious threat to food security. This study examines five cities in the Wei River Basin of Henan Province from 2001 to 2023 to investigate the patterns of such transfers and the occurrence of excessive transfers. First, the actual scale of agricultural water transfer was measured based on the balance between agricultural water rights and crop water requirements. Next, the theoretical transferable scale was calculated under factor substitution theory. Finally, by comparing the two, the study identified the patterns of agricultural water transfer. The results indicate that:
(1) From 2001 to 2023, the actual scale of agricultural water transfer in cities of the Wei River Basin in Henan Province showed significant spatiotemporal variation and phased fluctuations, with water transfer occurring in 59.13% of the city–year observations. From 2001 to 2005, agricultural water supply was generally insufficient across the basin, and transfer volumes were mostly negative. From 2006 to 2013, transfer fluctuations intensified. The year 2021 had the most widespread transfers during the study period. Spatially, Puyang, Jiaozuo, and Xinxiang were the main transfer regions of water resources. Hebi had a relatively small transfer scale, while Anyang had virtually no surplus water to transfer.
(2) Results of the scale of water resource substitution through factor combinations show that the substitution volumes across cities frequently alternate between positive and negative values, indicating that annual fluctuations in factor inputs lead to instability in agricultural water substitution capacity. Production factors can substitute for agricultural water use. Pesticide/fertilizer, agricultural machinery, and grain sown area are the main substitutes. Among these, Anyang and Puyang have the highest substitution elasticity for agricultural machinery. Jiaozuo shows better labor substitution effects. Xinxiang and Puyang have the most stable substitution relationship for pesticide and fertilizer.
(3) Based on the results of transfer deviation, the characteristics of water transfer among the five cities exhibited significant regional differentiation. The results indicate that 40.85% of the city–year observations witnessed no agricultural water transfer, 11.33% of the city–year observations saw reasonable water transfer, and 47.82% of the city–year observations experienced excessive water transfer. Jiaozuo and Puyang were the core areas of excess transfer within the basin, both remaining in an excess state for 16 out of 23 years, accounting for 69.6%; Hebi had a moderate frequency, with 11 years of excess. Xinxiang has seen a clear increase in excess frequency in recent years, becoming a new key area with 8 excess years. Anyang experienced excess in only 4 years, indicating relatively effective management of agricultural water transfer.
6. Policy Implications
According to the main findings above, the following policy implications are provided.
(1) Establish a dynamic monitoring, early warning, and evaluation system for agricultural water transfer with differentiated city-level management, using agricultural water right allocation, net irrigation water requirement, actual transfer scale, theoretical transferable scale, transfer deviation, and precipitation anomalies as the core indicators. The warning threshold can follow the classification rule used in this study: when , agricultural water transfer should be restricted; when , transfer can be regarded as reasonable; and when , an excessive transfer warning should be issued. Additional monitoring should be conducted during the key irrigation periods of winter wheat and summer corn in high-risk cities. For major outflow regions such as Puyang and Jiaozuo, as well as the emerging risk area of Xinxiang, strictly control transfer scales. For Hebi, where transfer volumes are small, maintain moderate management. For Anyang, which has limited surplus agricultural water, maintain current controls.
(2) Promote water-saving and factor substitution technologies. While strengthening the factor substitution advantages of each city, promote efficient water-saving irrigation technologies, breed drought-resistant and high-yield crop varieties, and improve soil water retention capacity. Through technological improvement and optimized factor combinations, enhance the drought resistance and production capacity of agriculture, thereby reducing water competition pressure at the source. For Xinxiang, prioritize source-side water-saving irrigation rather than relying mainly on factor substitution. For Puyang and Jiaozuo, where excessive transfer is persistent and closely related to strong non-agricultural water demand, agricultural water-saving technologies should be combined with stricter industrial water-saving requirements and reclaimed-water substitution.
(3) Develop an access mechanism for agricultural water transfer, using the theoretical transferable scale as a control boundary. For Puyang and Jiaozuo, in high-risk years, a safety margin can be introduced by setting the annual allowable transfer scale at 80% or 90% of the theoretical transferable scale. For Xinxiang, new transfer approvals should be conditional on demonstrated improvements in irrigation efficiency and reductions in net crop irrigation water requirement. At the same time, accelerate the large-scale development and utilization of unconventional water sources, and thus curb the excessive occupation of agricultural water from the demand side.
Author Contributions
Conceptualization, L.Z. and J.L.; methodology, J.L. and X.W.; formal analysis, X.W.; data curation, J.L. and S.G.; writing—original draft preparation, J.L. and X.W.; writing—review and editing, L.Z.; visualization, J.L. and S.G.; supervision, L.Z.; funding acquisition, L.Z. All authors have read and agreed to the published version of the manuscript.
Funding
This research was funded by the Fundamental Research Funds for the Central Universities, project title “Security Assessment and Prediction of Basin Water Transfer from Agriculture to Non-Agriculture from the Perspective of Food Security” (grant number: B250207060). The APC was funded by the authors.
Data Availability Statement
Data available upon request due to restrictions (privacy: because part of the data is obtained from statistical yearbooks and meteorological data platforms that are subject to access restrictions).
Conflicts of Interest
The authors declare no conflicts of interest.
Appendix A
Table A1.
Results of net irrigation water requirements for crops in cities of the Wei River Basin in Henan Province.
Table A2.
Results of the actual scale of water transfer from agriculture to non-agriculture in cities of the Wei River Basin in Henan Province.
Table A3.
Descriptive statistics of inputs and outputs in the translog production function.
Table A4.
Test results for the standard panel model.
Table A5.
Results of panel regression estimation.
Table A6.
Results of factor output elasticities and 95% confidence intervals in cities of the Wei River Basin in Henan Province.
Table A7.
Results of substitution elasticities and 95% confidence intervals of input factors relative to agricultural water use in cities of the Wei River Basin in Henan Province.
Table A8.
Results of the MRTS of input factors relative to agricultural water use for Anyang, Hebi and Xinxiang of the Wei River Basin in Henan Province.
Table A9.
Results of the MRTS of input factors relative to agricultural water use for Jiaozuo and Puyang of the Wei River Basin in Henan Province.
Table A10.
Results of the additional quantity of input factors for Anyang, Hebi and Xinxiang of the Wei River Basin in Henan Province.
Table A11.
Results of the additional quantity of input factors for Jiaozuo and Puyang of the Wei River Basin in Henan Province.
References
- Wang, T.; Ma, S.; Yan, X.; Pei, E. Agricultural and non-agricultural sectors compete implicitly for water resources in China. Water 2025, 17, 2707. [Google Scholar] [CrossRef] [Scilit]
- Meinzen-Dick, R. Water Reallocation: Challenges, Threats, and Solutions for the Poor; UNDP: New York, NY, USA, 2006. [Google Scholar]
- FAO. The State of the World’s Land and Water Resources for Food and Agriculture 2025; FAO: Rome, Italy, 2025. [Google Scholar]
- FAO; UNICEF; WFP; WHO. The State of Food Security and Nutrition in the World 2025—Addressing High Food Price Inflation for Food Security and Nutrition; FAO: Rome, Italy, 2025. [Google Scholar]
- Pranindita, A.; Teuling, A.J.; Fetzer, I.; Wang-Erlandsson, L. Forests support global crop supply through atmospheric moisture transport. Nat. Water 2025, 3, 1243–1255. [Google Scholar] [CrossRef] [Scilit]
- Li, D.; Zhang, H.; Xu, E. Spatiotemporal changes in the geographic imbalances between crop production and farmland-water resources in China. Agronomy 2022, 12, 1111. [Google Scholar] [CrossRef] [Scilit]
- Fitton, N.; Alexander, P.; Arnell, N.; Bajzelj, B.; Calvin, K.; Doelman, J.; Gerber, J.S.; Havlik, P.; Hasegawa, T.; Herrero, M. The vulnerabilities of agricultural land and food production to future water scarcity. Glob. Environ. Change 2019, 58, 101944. [Google Scholar] [CrossRef] [Scilit]
- Garrick, D.; De Stefano, L.; Yu, W.; Jorgensen, I.; O’Donnell, E.; Turley, L.; Aguilar-Barajas, I.; Dai, X.; de Souza Leão, R.; Punjabi, B. Rural water for thirsty cities: A systematic review of water reallocation from rural to urban regions. Environ. Res. Lett. 2019, 14, 043003. [Google Scholar] [CrossRef] [Scilit]
- Baharanchi, O.G.; Lotfi, A.; Yousefpour, R. Beyond immediate relief: Investigating multi-faceted water management in inter-basin water transfer projects. J. Clean. Prod. 2024, 470, 143243. [Google Scholar] [CrossRef] [Scilit]
- Deng, X.; Song, X.; Xu, Z. Transaction costs, modes, and scales from agricultural to industrial water rights trading in an inland river basin, northwest China. Water 2018, 10, 1598. [Google Scholar] [CrossRef] [Scilit]
- Horn, M.A. Method for Estimating Water Use and Interbasin Transfers of Freshwater and Wastewater in an Urbanized Basin; U.S. Geological Survey: Reston, VA, USA, 2000.
- Zhuang, N.; Wang, M.; Shi, C.; Fu, S.; Yang, Q.; Ding, C.; Ouyang, Y.; Liu, H. Assessing the impacts of inter-basin water transfer projects on ecosystem services in water source areas: Evidence from the Hanjiang River Basin. PLoS ONE 2025, 20, e0323068. [Google Scholar] [CrossRef] [Scilit] [PubMed]
- Zhang, H.; Zhou, Q.; Zhang, C. Evaluation of agricultural water-saving effects in the context of water rights trading: An empirical study from China’s water rights pilots. J. Clean. Prod. 2021, 313, 127725. [Google Scholar] [CrossRef] [Scilit]
- Hansen, K.; Hovhannisyan, V.; Grant, C. An empirical analysis of demand for water rights transfers and leases in western water markets: A simultaneous approach. Agric. Resour. Econ. Rev. 2026, 55, 1–22. [Google Scholar] [CrossRef] [Scilit]
- Garrick, D.E. Water allocation in rivers under pressure: A large-scale collective action dilemma. In Water Allocation in Rivers under Pressure: Water Trading, Transaction Costs and Transboundary Governance in the Western US and Australia; Edward Elgar Publishing: Cheltenham, UK, 2015. [Google Scholar]
- Zhao, X.; Li, Y.; Yang, H.; Liu, W.; Tillotson, M.; Guan, D.; Yi, Y.; Wang, H. Measuring scarce water saving from interregional virtual water flows in China. Environ. Res. Lett. 2018, 13, 054012. [Google Scholar] [CrossRef] [Scilit]
- Deng, G.; Ma, Y.; Li, X. Regional water footprint evaluation and trend analysis of China—Based on interregional input–output model. J. Clean. Prod. 2016, 112, 4674–4682. [Google Scholar] [CrossRef] [Scilit]
- Zhang, F.; Jin, G.; Liu, G. Evaluation of virtual water trade in the Yellow River Delta, China. Sci. Total Environ. 2021, 784, 147285. [Google Scholar] [CrossRef] [Scilit]
- Habibi Davijani, M.; Banihabib, M.; Nadjafzadeh Anvar, A.; Hashemi, S. Multi-objective optimization model for the allocation of water resources in arid regions based on the maximization of socioeconomic efficiency. Water Resour. Manag. 2016, 30, 927–946. [Google Scholar] [CrossRef] [Scilit]
- Ku, S.J.; Yoo, S.H. Economic value of water in the Korean manufacturing industry. Water Resour. Manag. 2012, 26, 81–88. [Google Scholar] [CrossRef] [Scilit]
- Taylor, R.G.; Young, R.A. Rural-to-urban water transfers: Measuring direct foregone benefits of irrigation water under uncertain water supplies. J. Agric. Resour. Econ. 1995, 20, 247–262. [Google Scholar] [CrossRef]
- Ward, F.A.; Michelsen, A. The economic value of water in agriculture: Concepts and policy applications. Water Policy 2002, 4, 423–446. [Google Scholar] [CrossRef] [Scilit]
- Zhang, B.; Fu, Z.; Wang, J.; Zhang, L. Farmers’ adoption of water-saving irrigation technology alleviates water scarcity in metropolis suburbs: A case study of Beijing, China. Agric. Water Manag. 2019, 212, 349–357. [Google Scholar] [CrossRef] [Scilit]
- Droppers, B.; Supit, I.; Van Vliet, M.T.; Ludwig, F. Worldwide water constraints on attainable irrigated production for major crops. Environ. Res. Lett. 2021, 16, 055016. [Google Scholar] [CrossRef] [Scilit]
- Sapino, F.; Hazimeh, R.; Pérez-Blanco, C.D.; Jaafar, H.H. Socioeconomic impact of agricultural water reallocation policies in the Upper Litani Basin (Lebanon): A remote sensing and microeconomic ensemble forecasting approach. Agric. Water Manag. 2024, 296, 108805. [Google Scholar] [CrossRef] [Scilit]
- Chen, X.-n.; Wu, F.-p.; Li, F.; Zhao, Y.; Xu, X. Prediction and analysis of water rights trading volume: Based on the water rights trading in Inner Mongolia, China. Agric. Water Manag. 2022, 272, 107803. [Google Scholar] [CrossRef] [Scilit]
- Shao, S.; Yang, Z.; Yang, L.; Zhang, X.; Geng, Y. Synergetic conservation of water and energy in China’s industrial sector: From the perspectives of output and substitution elasticities. J. Environ. Manag. 2020, 259, 110045. [Google Scholar] [CrossRef] [Scilit]
- Zhao, K.-X.; Xu, F.-R.; Zhou, Y.; Ma, T. The heterogeneous effects of non-hydro renewable energy and water resources on industrial development of the Yellow river and Yangtze river basins. Energy 2024, 301, 131736. [Google Scholar] [CrossRef] [Scilit]
- Molle, F. Cities Versus Agriculture: Revisiting Intersectoral Water Transfers, Potential Gains, and Conflicts; IWMI: Colombo, Sri Lanka, 2006. [Google Scholar]
- Allen, R.G.; Pereira, L.S.; Raes, D.; Smith, M. Crop Evapotranspiration-Guidelines for Computing Crop Water Requirements; FAO Irrigation and Drainage Paper No. 56; FAO: Rome, Italy, 1998. [Google Scholar]
- Zhao, N.; Liu, Y.; Cai, J.; Paredes, P.; Rosa, R.D.; Pereira, L.S. Dual crop coefficient modelling applied to the winter wheat–summer maize crop sequence in North China Plain: Basal crop coefficients and soil evaporation component. Agric. Water Manag. 2013, 117, 93–105. [Google Scholar] [CrossRef] [Scilit]
- Lei, H.; Yang, D. Combining the crop coefficient of winter wheat and summer maize with a remotely sensed vegetation index for estimating evapotranspiration in the North China plain. J. Hydrol. Eng. 2014, 19, 243–251. [Google Scholar] [CrossRef] [Scilit]
- Kang, S.; Zhang, L.; Liang, Y.; Hu, X.; Cai, H.; Gu, B. Effects of limited irrigation on yield and water use efficiency of winter wheat in the Loess Plateau of China. Agric. Water Manag. 2002, 55, 203–216. [Google Scholar] [CrossRef] [Scilit]
- Huang, C.; Ma, S.; Gao, Y.; Liu, Z.; Qin, A.; Zhao, B.; Ning, D.; Duan, A.; Liu, X.; Chen, H. Response of summer maize growth and water use to different irrigation regimes. Agronomy 2022, 12, 768. [Google Scholar] [CrossRef] [Scilit]
- Li, Y.; Zhu, Y.; Li, D.; Gao, Y. Effects of Alternating Drought and Rewatering on Growth, Photosynthesis and Yield of Winter Wheat. J. Irrig. Drain. 2018, 37, 76–82. (In Chinese) [Google Scholar] [CrossRef]
- Peng, S.; Suo, L. Experimental Study on Crop Coefficients and Soil Moisture Correction Coefficients under Water-Saving Irrigation. J. Hydraul. Eng. 2004, 1, 17–21. (In Chinese) [Google Scholar] [CrossRef]
- Gong, X.; Zhang, H.; Ren, C.; Sun, D.; Yang, J. Optimization allocation of irrigation water resources based on crop water requirement under considering effective precipitation and uncertainty. Agric. Water Manag. 2020, 239, 106264. [Google Scholar] [CrossRef] [Scilit]
- Patwardhan, A.S.; Nieber, J.L.; Johns, E.L. Effective rainfall estimation methods. J. Irrig. Drain. Eng. 1990, 116, 182–193. [Google Scholar] [CrossRef] [Scilit]
- Kumar, R.; Kumar, M.; Farooq, Z.; Dadhich, S.M. Evaluation of models and approaches for effective rainfall in irrigated agriculture—An overview. J. Soil Water Conserv. 2017, 16, 32–36. [Google Scholar] [CrossRef] [Scilit]
- Chen, W.; Zhou, S. Impact of precipitation at different growth stages on summer maize output. J. South China Agric. Univ. (Soc. Sci. Ed.) 2022, 21, 91–103. (In Chinese) [Google Scholar] [CrossRef]
- Gleick, P.H. Water in crisis: Paths to sustainable water use. Ecol. Appl. 1998, 8, 571–579. [Google Scholar] [CrossRef]
- Zyoud, S. Mapping and visualizing global knowledge on intermittent water supply systems. Water 2022, 14, 738. [Google Scholar] [CrossRef] [Scilit]
- Huang, C.; Tsai, M.; Lin, W.; Ho, Y.; Tan, C.; Sung, Y. Experiences of water transfer from the agricultural to the non-agricultural sector in Taiwan. Paddy Water Environ. 2007, 5, 271–277. [Google Scholar] [CrossRef] [Scilit]
- Christensen, L.R.; Jorgenson, D.W.; Lau, L.J. Transcendental logarithmic production frontiers. Rev. Econ. Stat. 1973, 55, 28–45. [Google Scholar] [CrossRef] [Scilit]
- Wang, P.; Wu, G. Modernization and Elasticity of Substitution in China’s Grain Production: Evidence from 1991 to 2023. Agriculture 2025, 15, 1247. [Google Scholar] [CrossRef] [Scilit]
- Zhang, X.; Fan, S. How productive is infrastructure? A new approach and evidence from rural India. Am. J. Agric. Econ. 2004, 86, 492–501. [Google Scholar] [CrossRef] [Scilit]
- Fan, S.; Zhang, X. Infrastructure and regional economic development in rural China. China Econ. Rev. 2004, 15, 203–214. [Google Scholar] [CrossRef] [Scilit]
- Schmitz, A.; Moss, C.B. Mechanized agriculture: Machine adoption, farm size, and labor displacement. AgBioForum 2015, 18, 278–296. [Google Scholar]
- Wang, X.; Yamauchi, F.; Otsuka, K.; Huang, J. Wage growth, landholding, and mechanization in Chinese agriculture. World Dev. 2016, 86, 30–45. [Google Scholar] [CrossRef] [Scilit] [PubMed]
- Khan, S.; Anwar, S.; Shaobo, Y.; Gao, Z.; Sun, M.; Ashraf, M.Y.; Ren, A.; Yang, Z. Soil water consumption, water use efficiency and winter wheat production in response to nitrogen fertilizer and tillage. PeerJ 2020, 8, e8892. [Google Scholar] [CrossRef] [Scilit] [PubMed]
- Fan, T.; Stewart, B.; Yong, W.; Junjie, L.; Guangye, Z. Long-term fertilization effects on grain yield, water-use efficiency and soil fertility in the dryland of Loess Plateau in China. Agric. Ecosyst. Environ. 2005, 106, 313–329. [Google Scholar] [CrossRef] [Scilit]
- Chai, J.; Wang, Z.; Yang, J.; Zhang, L. Analysis for spatial-temporal changes of grain production and farmland resource: Evidence from Hubei Province, central China. J. Clean. Prod. 2019, 207, 474–482. [Google Scholar] [CrossRef] [Scilit]
- Chen, Z.; Huffman, W.E.; Rozelle, S. Farm technology and technical efficiency: Evidence from four regions in China. China Econ. Rev. 2009, 20, 153–161. [Google Scholar] [CrossRef] [Scilit]
- Liang, A.; Li, L.; Zhu, H. Protection and utilization of black land and making concerted and unremitting efforts for safeguarding food security promoted by sci-tech innovation—Countermeasures in conservation and rational utilization of black land. Bull. Chin. Acad. Sci. (Chin. Version) 2021, 36, 557–564. (In Chinese) [Google Scholar] [CrossRef]
- Wang, X.; Wang, X.; Sheng, H.; Wang, X.; Zhao, H.; Feng, K. Excessive nitrogen fertilizer application causes rapid degradation of greenhouse soil in China. Pol. J. Environ. Stud. 2022, 31, 1527–1534. [Google Scholar] [CrossRef] [Scilit]
- Greene, W.H. Econometric Analysis, 8th ed.; Pearson Education: New York, NY, USA, 2018. [Google Scholar]
- Blackorby, C.; Russell, R.R. Will the real elasticity of substitution please stand up?(A comparison of the Allen/Uzawa and Morishima elasticities). Am. Econ. Rev. 1989, 79, 882–888. [Google Scholar]
- Wu, F.; Huang, D.; He, Z.; Liu, S. Water competition and drivers for energy-food production in the Yellow River Basin under rigid water resource constraints. Agric. Water Manag. 2025, 322, 109961. [Google Scholar] [CrossRef] [Scilit]
- Jiang, Y.; Luo, Y.; Peng, S.; Wang, W.; Jiao, X. Agricultural water transfers in China: Current issues and perspectives. Procedia Eng. 2012, 28, 363–367. [Google Scholar] [CrossRef] [Scilit]
- Hirsch, Z.M.; Zeff, H.B.; Gupta, R.S.; Vernon, C.R.; Reed, P.M.; Characklis, G.W. Two-way option contracts that facilitate adaptive water reallocation in the western United States. Earth’s Future 2024, 12, e2024EF004434. [Google Scholar] [CrossRef] [Scilit]
- Li, Z.; Wu, Y.; Zhang, G.; Xu, Y.J.; Ni, B.; Hu, B.; Sun, J.; Zhang, Q.; Yu, Y. China’s Black Soil Granary is approaching the climax phase of agricultural water security risk. Agric. Water Manag. 2025, 319, 109780. [Google Scholar] [CrossRef] [Scilit]
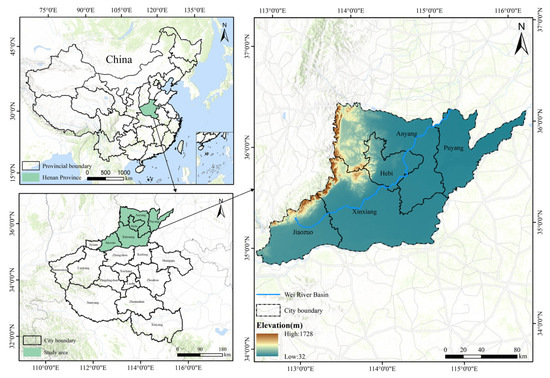
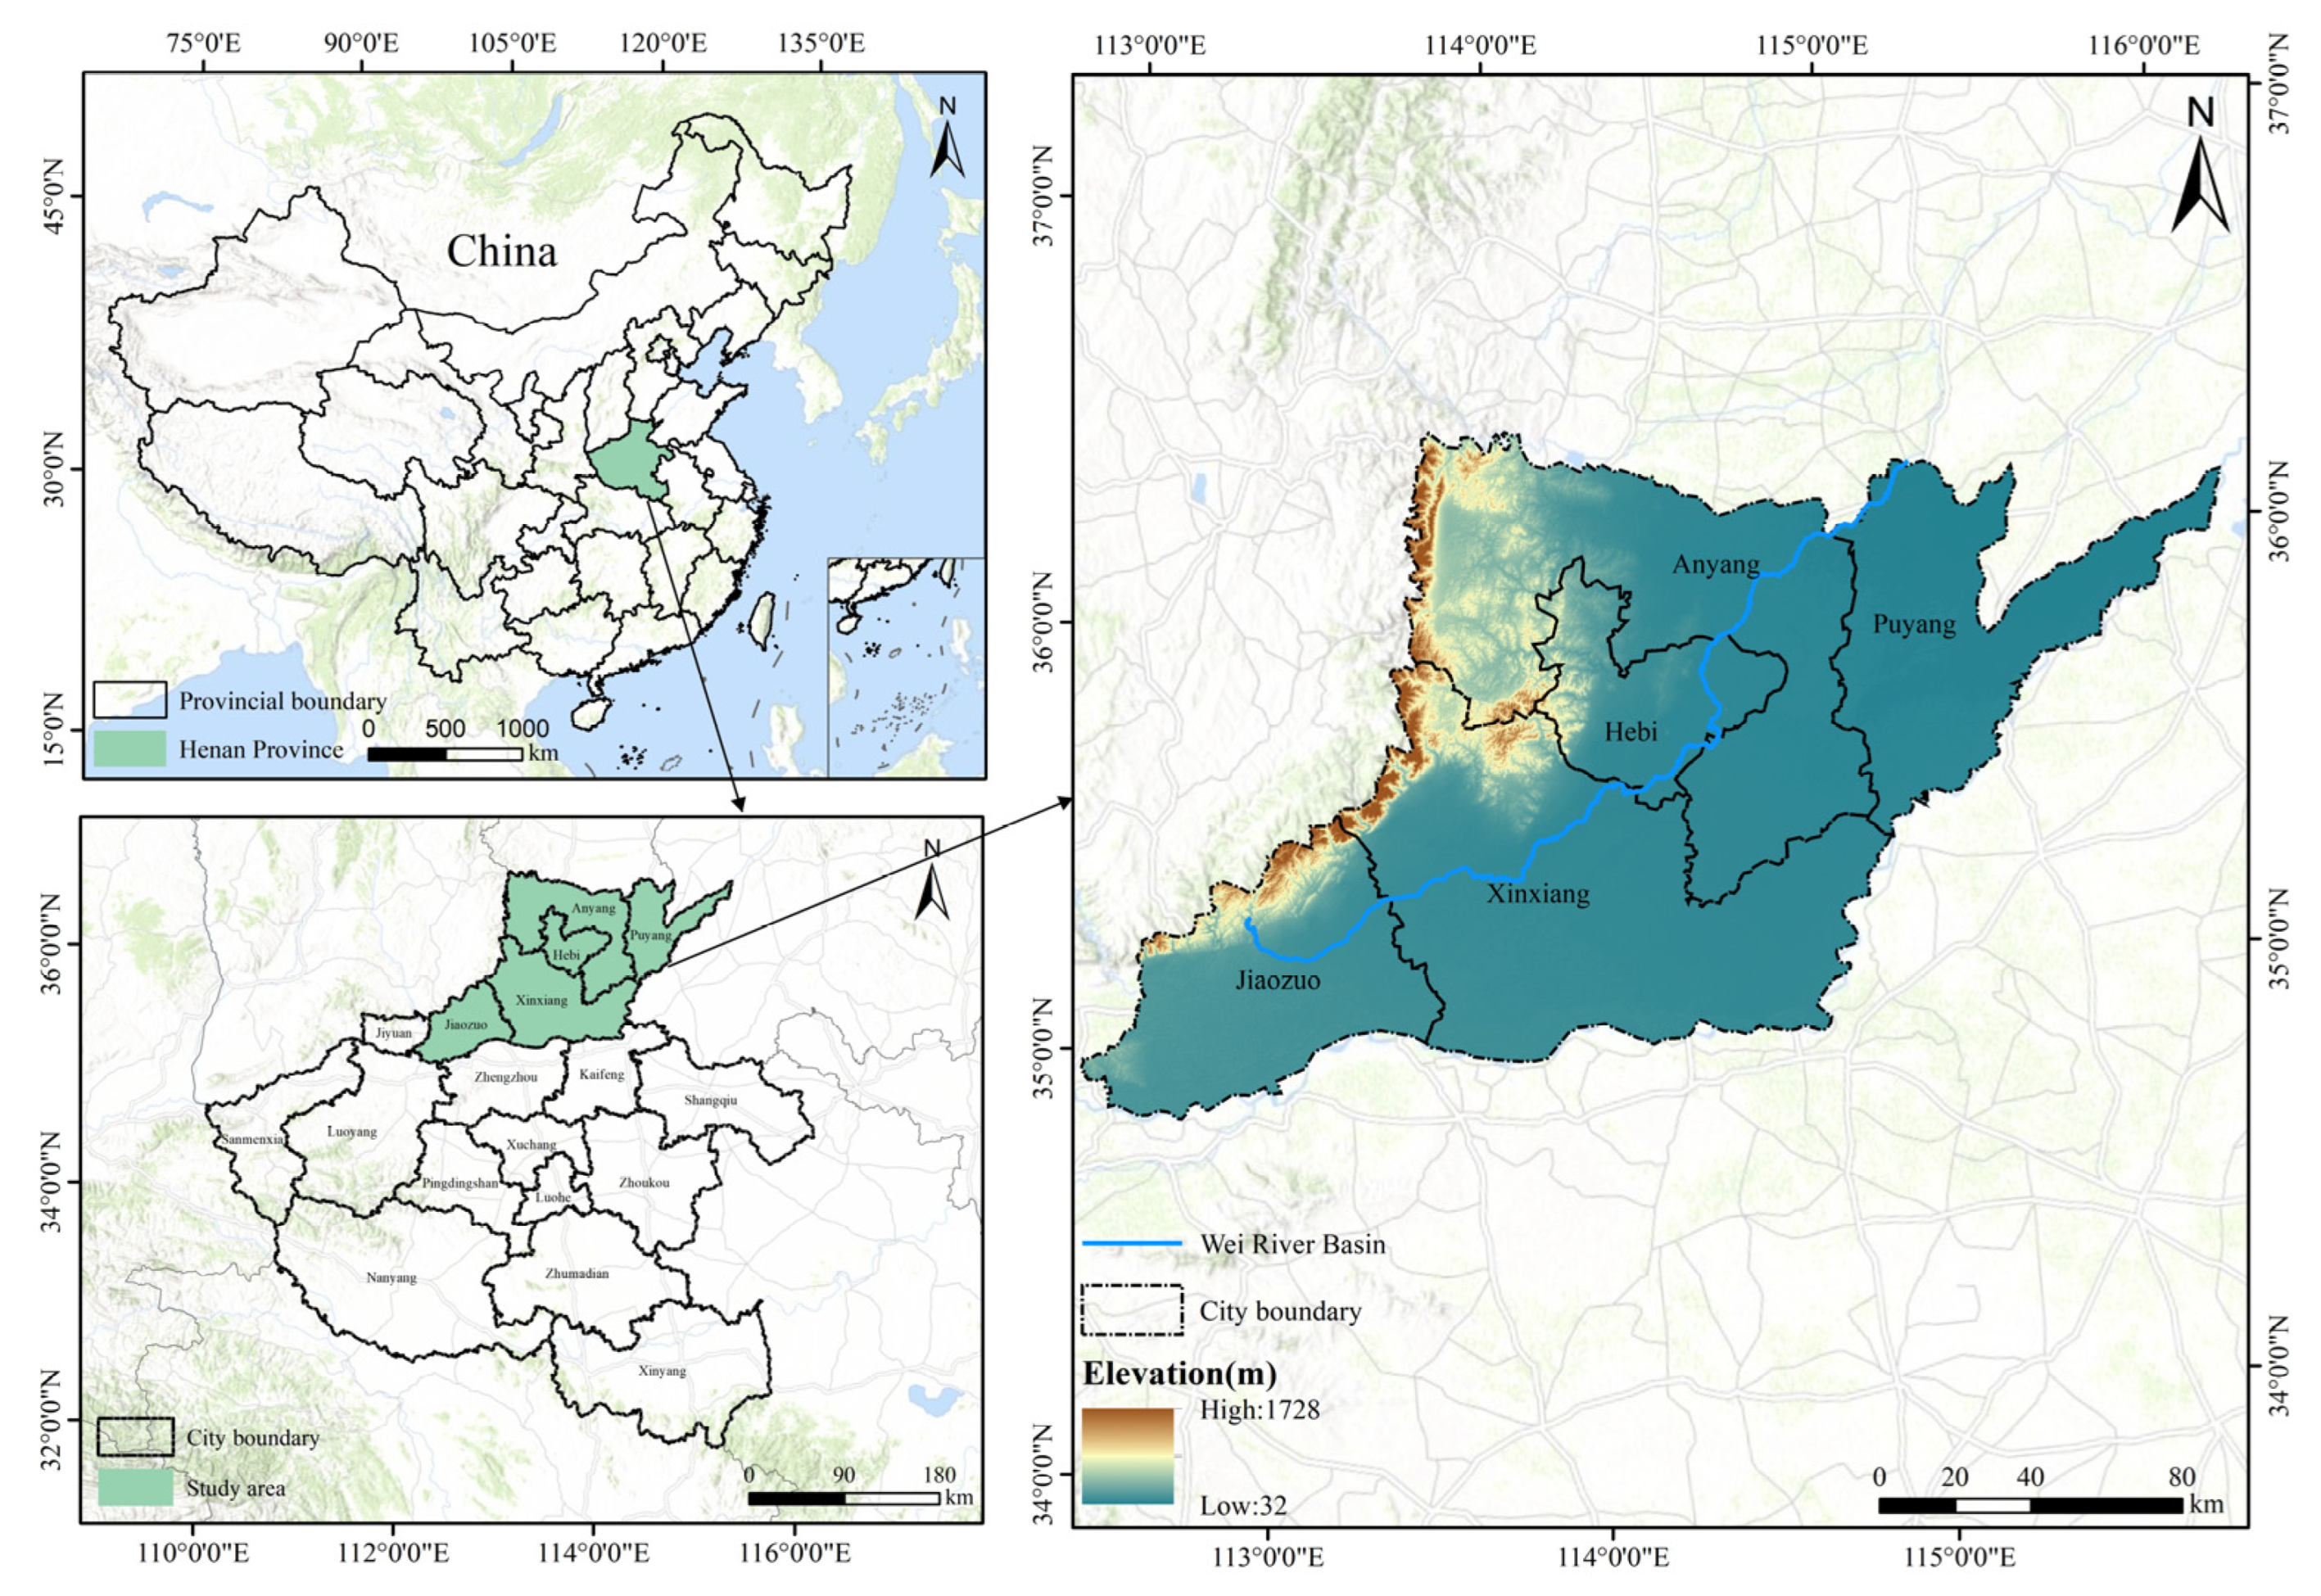
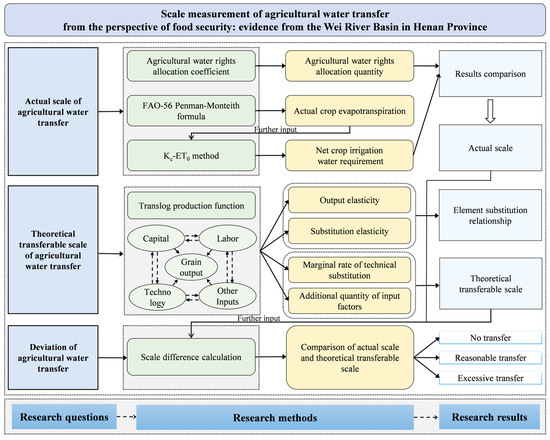
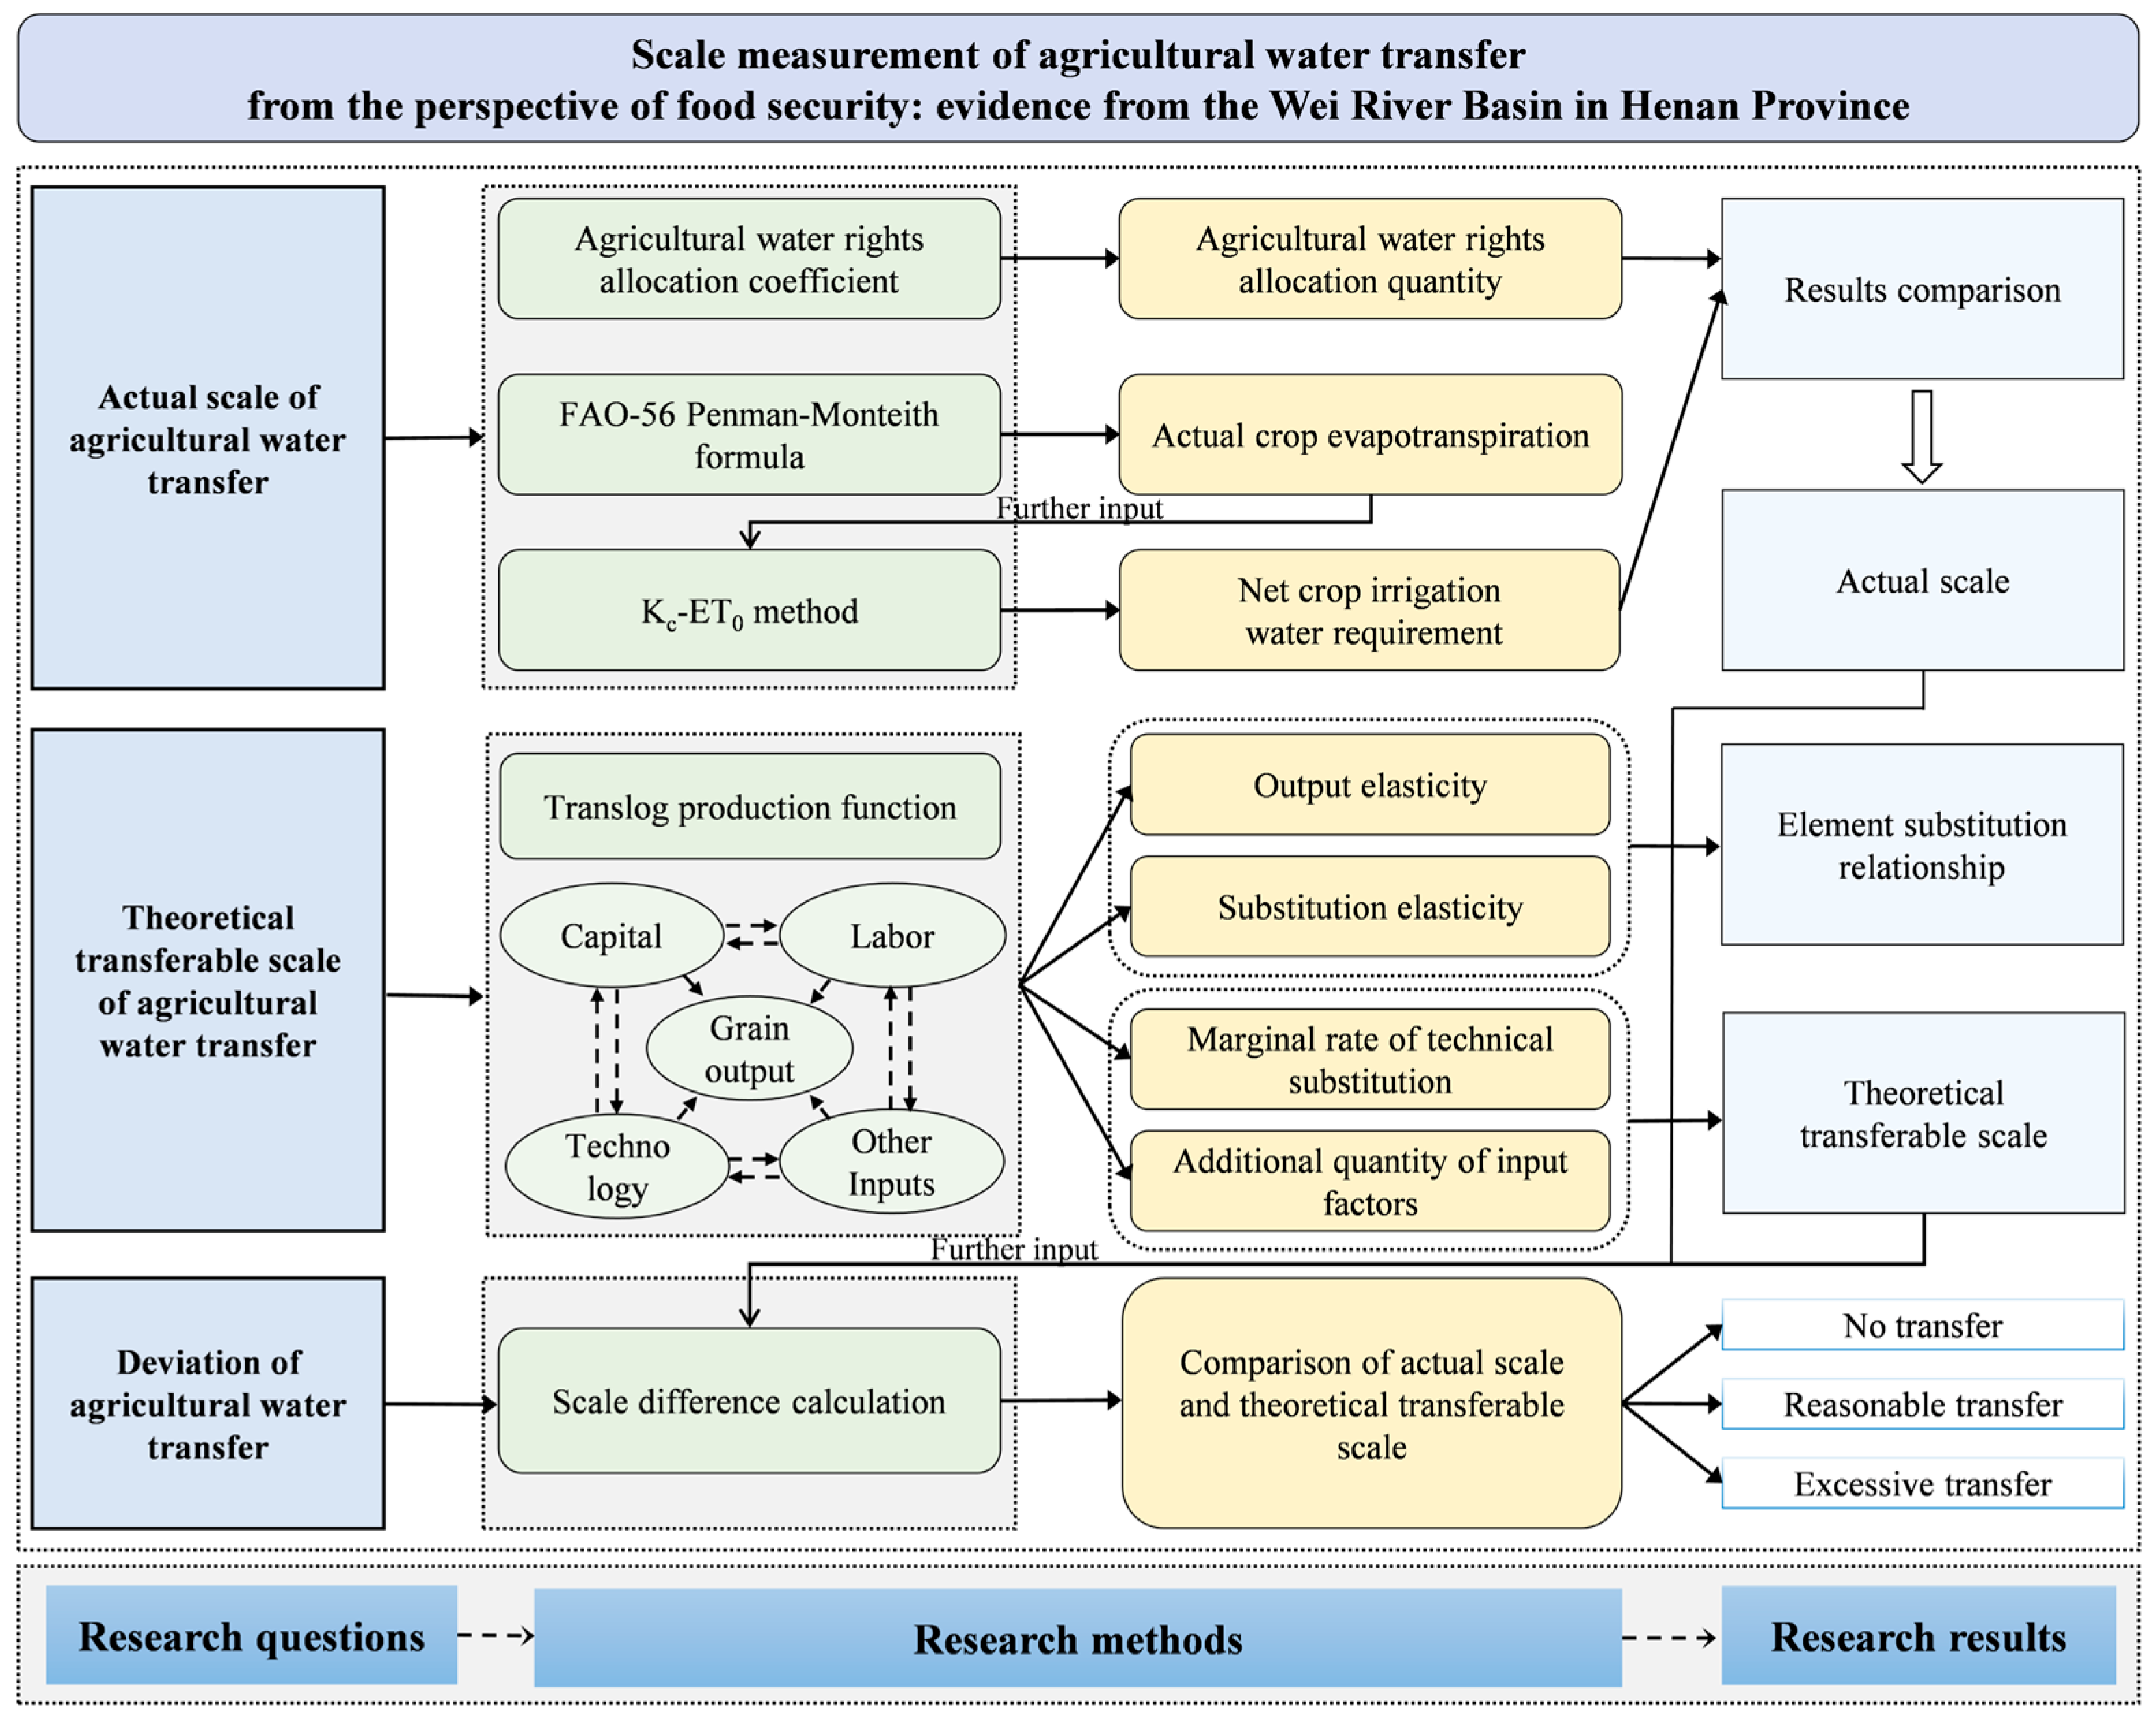
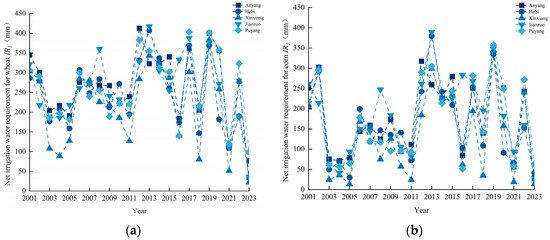
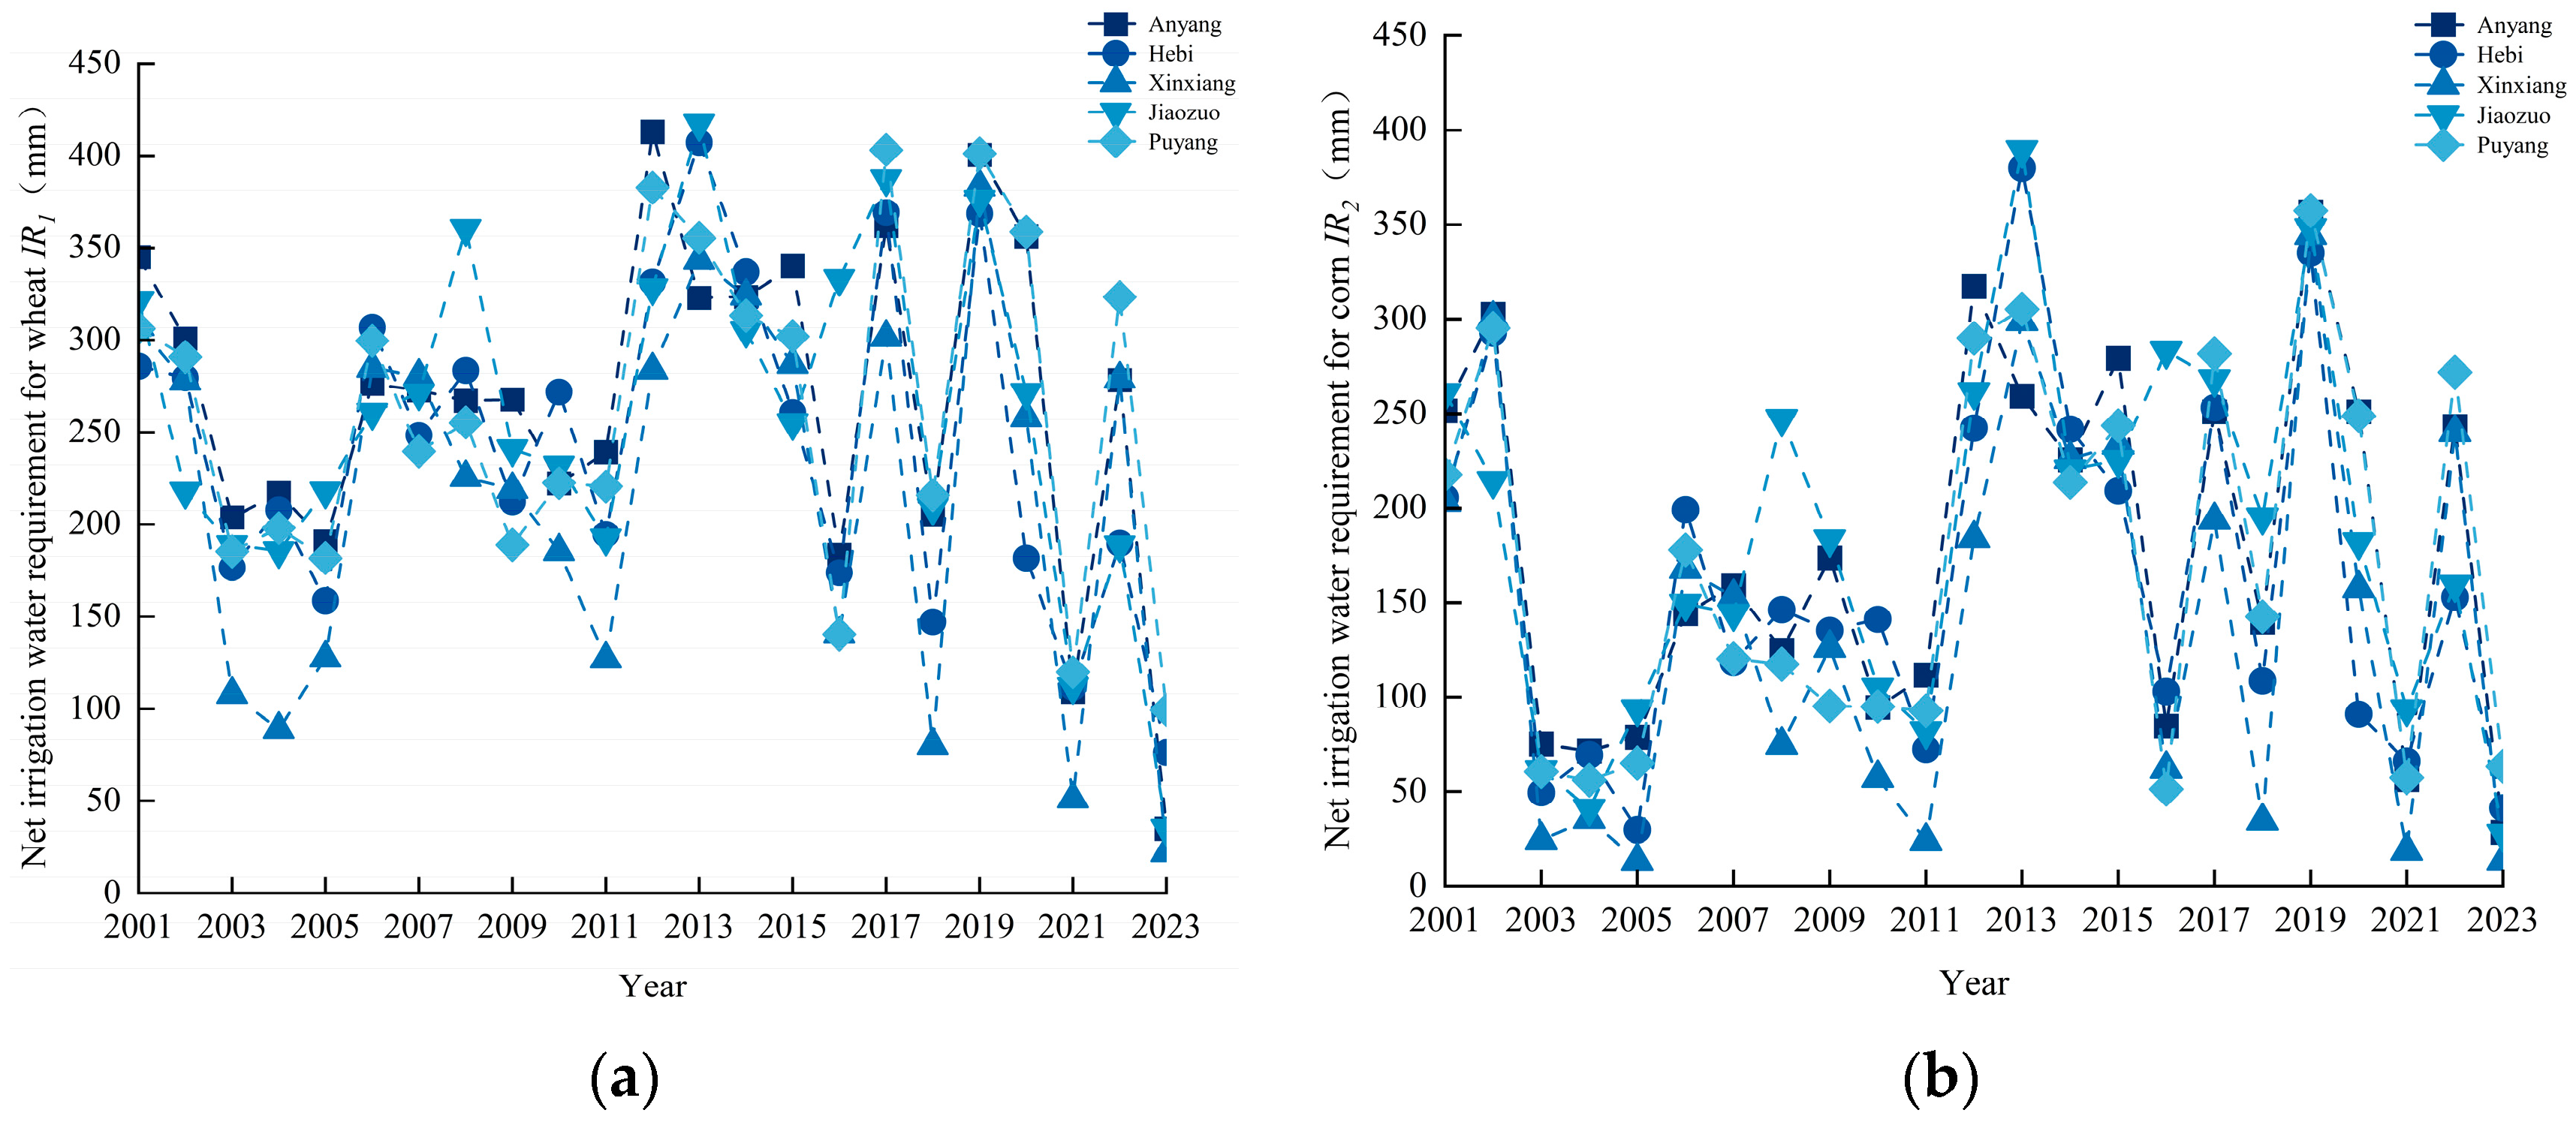
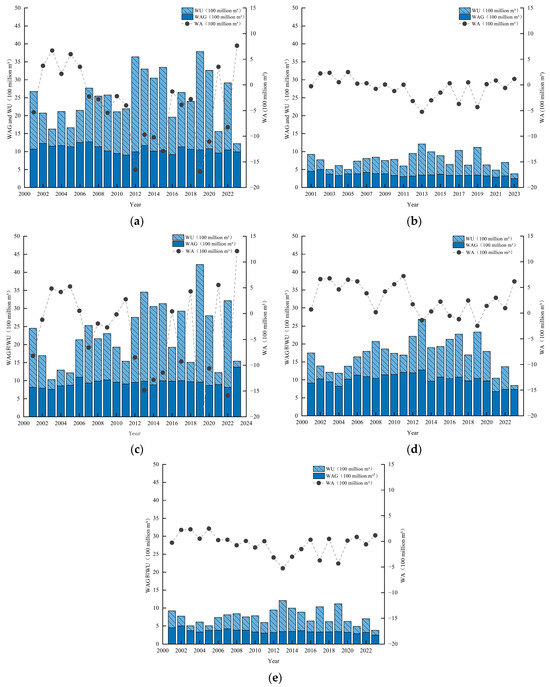
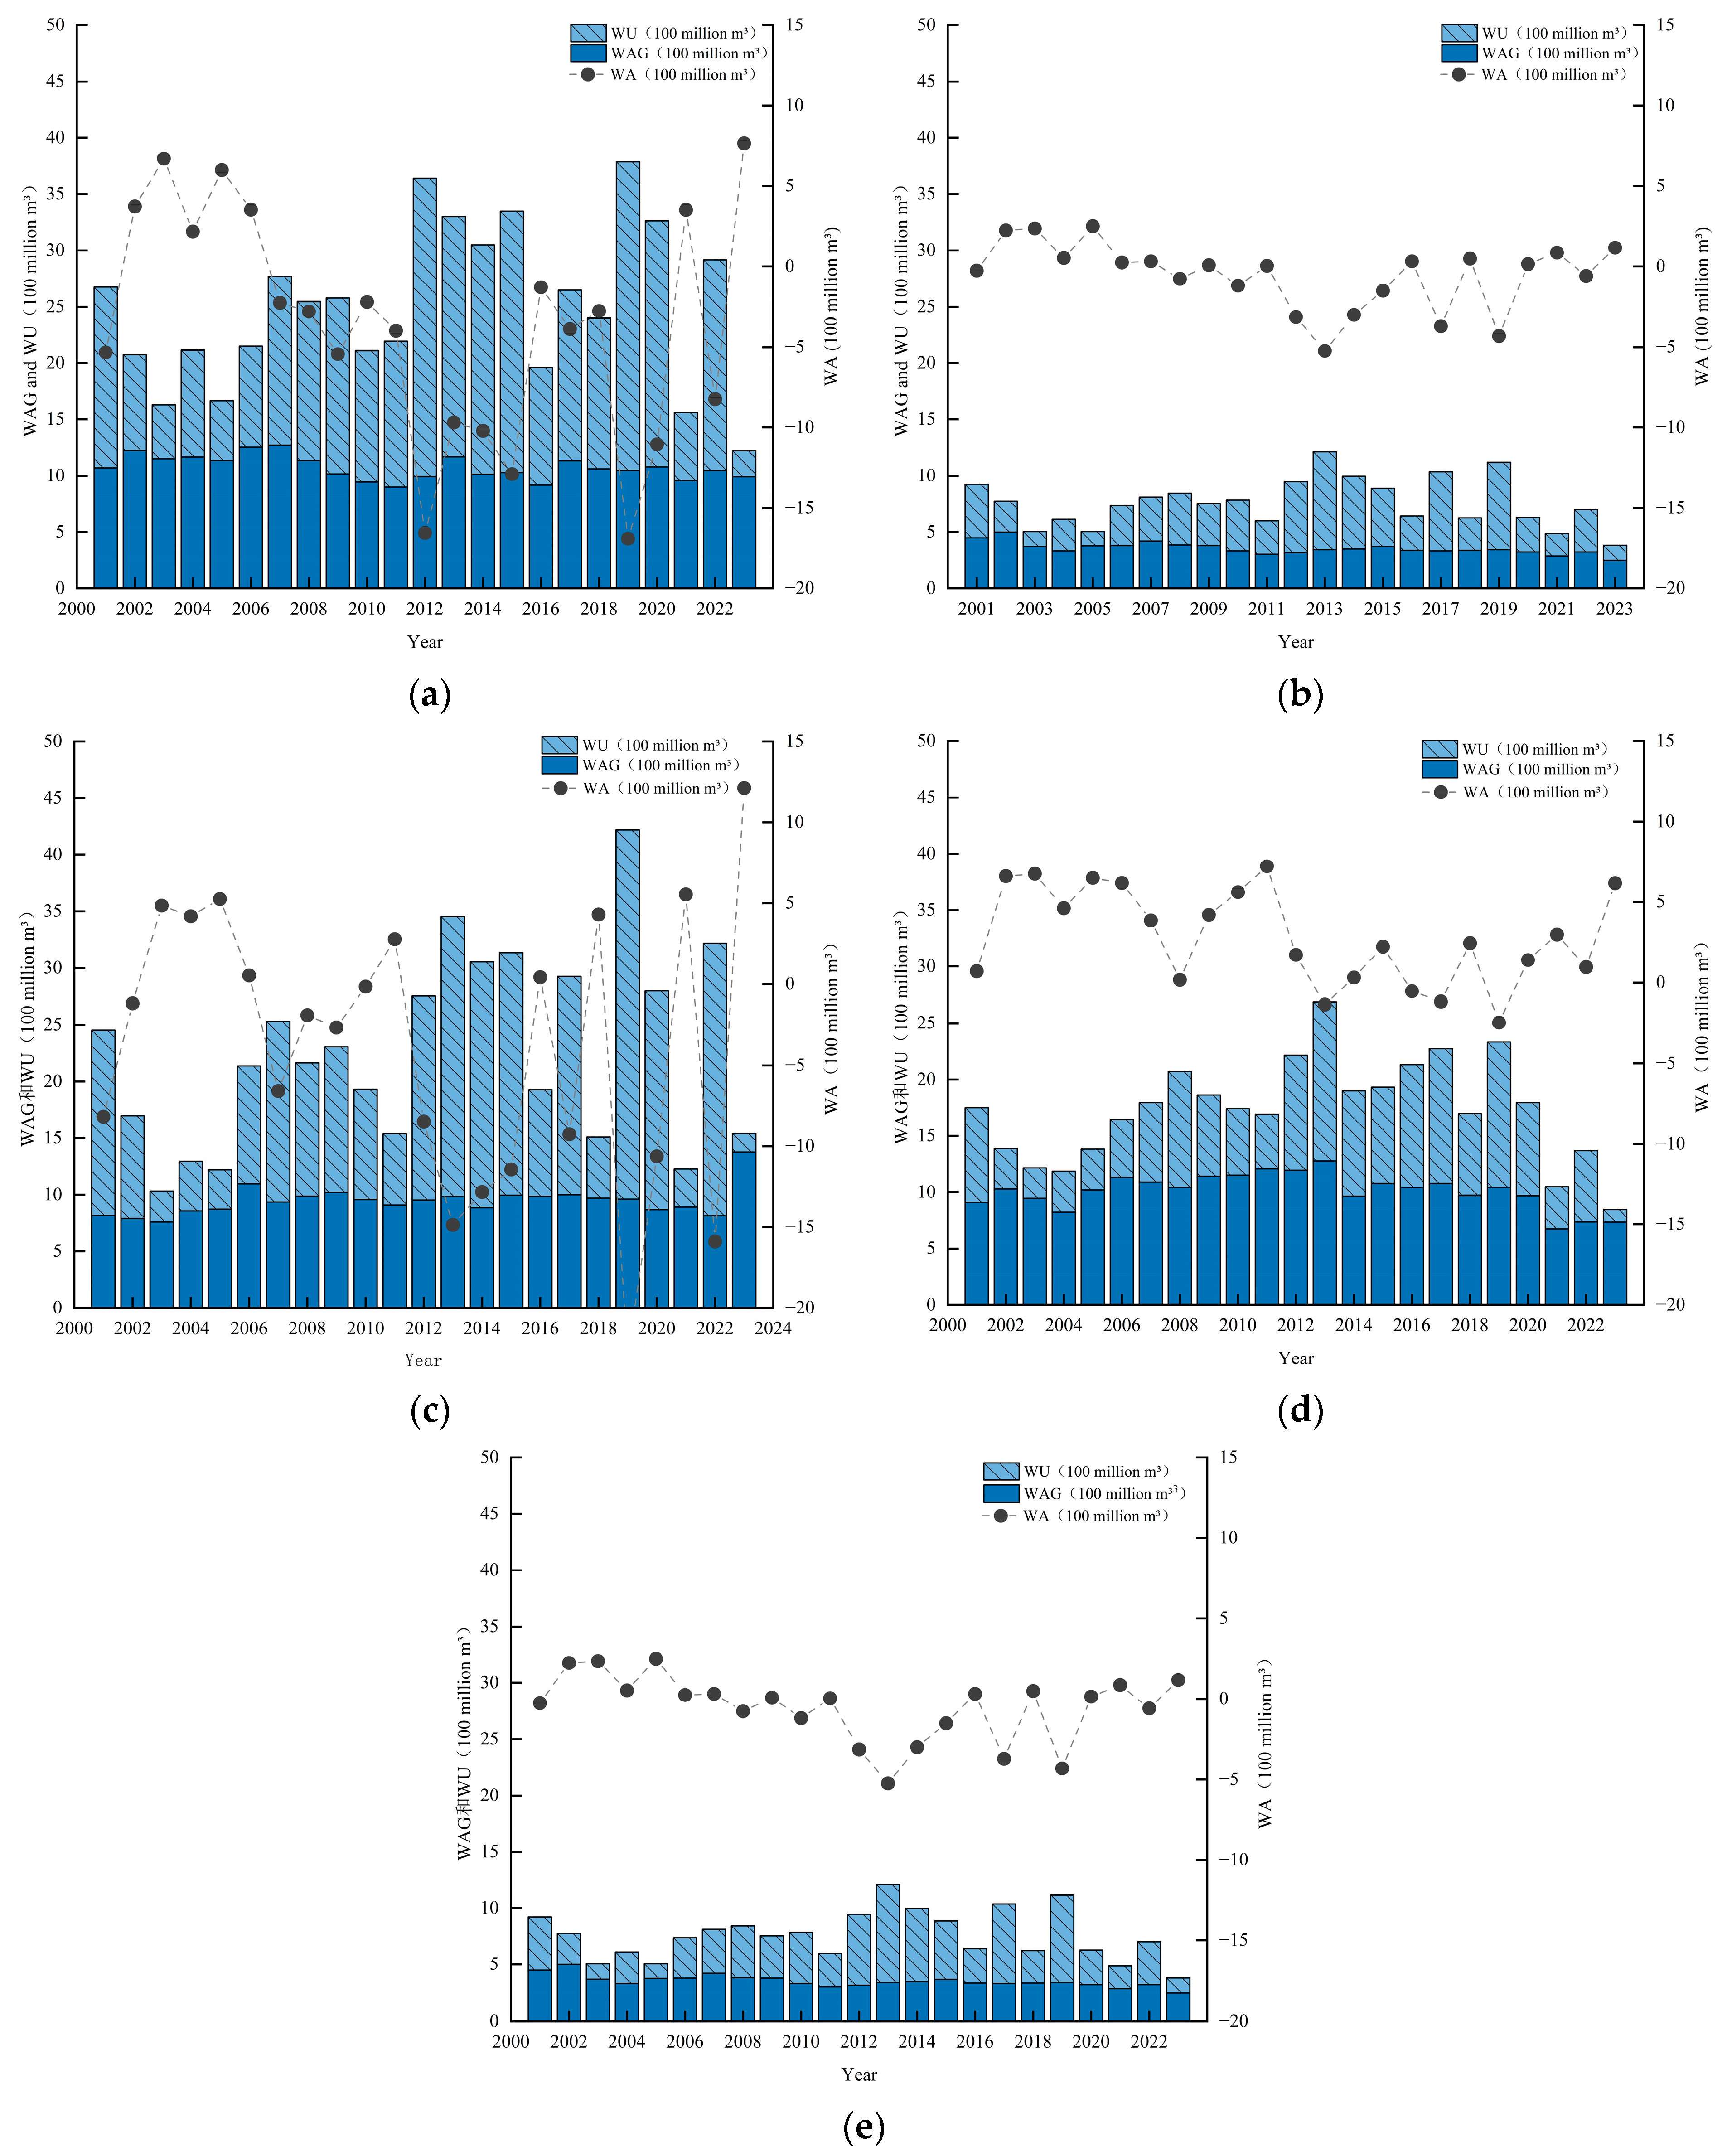

Disclaimer/Publisher’s Note: The statements, opinions and data contained in all publications are solely those of the individual author(s) and contributor(s) and not of MDPI and/or the editor(s). MDPI and/or the editor(s) disclaim responsibility for any injury to people or property resulting from any ideas, methods, instructions or products referred to in the content. |
© 2026 by the authors. Licensee MDPI, Basel, Switzerland. This article is an open access article distributed under the terms and conditions of the Creative Commons Attribution (CC BY) license.