


Abstract
Urban flood modelling in heavily engineered catchments requires model structures that capture not only surface runoff processes but also hydraulic infrastructure and operational controls. This study applies a TELEMAC-2D rain-on-grid framework to two urban sub-catchments of the Emscher River (North Rhine-Westphalia, Germany) to quantify the relative effects of surface calibration, explicit infrastructure representation, and operational rules on the simulated flood response. A stepwise model development workflow was implemented, including land use-based calibration of Manning’s n and SCS Curve Numbers, explicit integration of culverts and bridges, and rule-based representation of retention basins and pumping stations. Model performance was evaluated using hydrograph shape, peak discharge, peak timing, event volume, and inundation behaviour across different antecedent moisture conditions (AMC). The results show that surface calibration alone was insufficient to consistently reproduce observed hydrographs. In the Rossbach sub-catchment area, integrating retention basins, pumping stations, and operational rules improved model performance from NSE = −0.129 under AMC I to NSE = 0.773 under AMC III. RMSE decreased from 3.380 to 1.515 m3 s−1, peak discharge error from −6.198 to −0.492 m3 s−1, and volume bias from −0.664 to +0.038. A targeted, routing-focused calibration further improved timing behaviour but increased volume bias, indicating residual deficiencies in the representation of rapid urban conveyance pathways. The findings show that reliable urban flood simulation in infrastructure-rich catchments depends not only on calibrating surface parameters but also on explicitly representing hydraulic structures, operational controls, and antecedent wetness conditions.
1. Introduction
Extreme rainfall events of short duration and high intensity have increasingly highlighted the vulnerability of urban areas to flooding. Climate change is expected to further intensify these events, increasing risks for densely populated catchments where land-surface variability, impervious areas, and critical infrastructure influence flood dynamics in complex ways [1,2,3]. Recent studies have further shown that urban flood risk is shaped not only by changing rainfall extremes but also by the spatial structure of the built environment and the increasing interaction between climate change and urbanisation [4,5]. In such environments, flood risk assessment and operational planning require models that can represent not only rainfall–runoff generation but also the effects of engineered structures such as culverts, bridges, pumping stations, and retention basins on flow routing and inundation patterns [6,7].
Urban flood modelling can be approached using different model classes, depending on the study objective and available data. Recent assessments have highlighted that urban flood model selection must balance physical process realism, infrastructure representation, data availability, and computational feasibility, especially when models are intended to support hazard assessment and future risk analysis under extreme conditions [8]. Coupled hydrological–hydraulic workflows, for example, combinations of rainfall–runoff and hydraulic routing models such as HEC-HMS and HEC-RAS integrated with GIS, are widely used for flood hazard mapping and catchment-scale event reconstruction [9]. Their strength lies in combining established hydrological loss and routing routines with hydraulic water-level and inundation calculations. However, for applications that require spatially distributed rainfall input, detailed surface routing, explicit representation of hydraulic structures, and operational control within a single computational domain, fully hydrodynamic 2D rain-on-grid approaches offer important advantages.
Among these, TELEMAC-2D is well suited for urban flood studies because it combines a flexible unstructured mesh with direct rainfall forcing, distributed parameterisation of infiltration and roughness, and the possibility to integrate engineered structures and operational rules through standard user subroutines [10,11,12,13]. This is particularly relevant for the Emscher catchment, where culverts, bridges, pumping stations, and retention basins interact strongly with local runoff pathways and where operational rules are expected to influence flood dynamics alongside surface properties.
Despite these advances, most previous studies have focused either on surface parameter calibration or on individual hydraulic structures. Hydraulic structures are often simplified or omitted entirely, although culverts and bridges can substantially alter flow routing and backwater dynamics [14,15,16,17]. Similarly, pumping stations and retention basins are frequently represented by simplified sink–source terms, even though their effectiveness depends strongly on operational rules [18,19,20]. In addition, antecedent moisture conditions (AMC), which control infiltration capacity and initial storage, are known to influence runoff generation and peak discharge even in urbanised catchments [21], yet studies that systematically assess AMC together with explicit infrastructure representation and operational control within a single 2D rain-on-grid framework remain rare.
This study, therefore, aims to quantify the relative impacts of (i) surface parameter calibration, (ii) explicit structural representation of culverts, bridges, pumping stations, and retention basins, and (iii) operational control rules under different AMC scenarios on the performance of TELEMAC-2D flood simulations. The case study focuses on the Emscher catchment in North Rhine-Westphalia, Germany, a heavily urbanised basin with extensive flood-control infrastructure.
2. State of the Art in Urban Flood Modelling
Urban flood modelling has significantly improved over the past decades, driven by the need to better capture increasingly frequent and intense (flash) flood events [8,12,19,22]. Major advances have focused on representing urban surface variability, enhancing rainfall–runoff coupling methods, and incorporating critical infrastructures into hydraulic models.
2.1. Urban Surface Representation and Calibration in 2D Flood Models
Previous studies highlighted that imperviousness, building density, and microtopography greatly influence urban runoff generation [2,3]. Calibration has usually depended on land use-dependent Curve Numbers (CN) and Manning’s roughness coefficients (Manning’s n), adjusted to match observed hydrographs [12,13]. While these methods enhance model performance, they primarily focus on surface features and cannot account for the effects of engineered structures.
2.2. Rain-on-Grid Approaches to Urban Flood Modelling
Hydrodynamic models like TELEMAC-2D are increasingly used for rain-on-grid simulation, enabling direct conversion of radar-based precipitation data into distributed runoff [10,11]. This method has shown to be effective in urban settings, especially for event-based flash flood analysis. Ensuring numerical stability and proper mesh design remains essential, with recent research emphasising how results can be sensitive to spatial resolution, solver configurations, and wetting–drying thresholds [23,24,25].
2.3. Hydraulic Structures and Operational Infrastructure in Urban Models
A growing body of research highlights the importance of hydraulic structures in influencing flood response. Culverts and bridges can restrict or redirect water flows, with clogging effects seen as especially important for floodplain connectivity [17]. Pumping stations and retention basins significantly influence hydrographs, although their operation is often represented only by simplified sink–source terms [20,22]. These simplifications can cause considerable errors in peak flow magnitude and timing [6,7,18].
Comparisons between calibration-focused and infrastructure-integrated models reveal that ignoring structural components often results in underestimating backwater effects and misrepresenting discharge peaks [14,15,16]. These results indicate that calibration alone cannot guarantee robust performance in urban catchments.
2.4. Antecedent Moisture Conditions and Hydrological Initialisation
Although runoff generation is well known to depend on initial wetness, explicit integration of AMC is mainly applied in hydrological modelling, while its use in urban flood models remains limited. Hettiarachchi et al. [21] demonstrated that AMC significantly alters flood response even in developed basins, but systematic analyses combining AMC variability with infrastructure representation are scarce. This highlights an important gap in current research.
2.5. Remaining Research Gaps and Positioning of This Study
In summary, existing research has enhanced urban flood modelling through improved parameter calibration, advanced rain-on-grid techniques, and isolated analyses of hydraulic structures. However, to the best of our knowledge, no study has systematically quantified the relative contributions of surface calibration, structural modelling and operational control under different antecedent moisture conditions within a TELEMAC-2D framework. Addressing this gap is the primary goal of this study. The novelty lies in combining stepwise calibration (CN, Manning’s n), explicit structural integration (culverts and bridges), and operational realism (pumping, retention basin control rules) under varying AMC conditions in a large-scale TELEMAC-2D setup.
3. Materials and Methods
3.1. Study Area and Hydrological Setup
The study area is situated in the Emscher catchment in North Rhine-Westphalia, Germany, a highly engineered lowland river basin characterised by dense urbanisation and extensive hydraulic infrastructure. The catchment has experienced significant hydromorphological changes over the past century, including channelisation, separation of wastewater and stormwater flows, and the construction of numerous pumping stations and flood retention basins. These alterations have greatly changed the natural hydrological response, decreasing infiltration capacity and increasing the amount of surface runoff during heavy rainfall events.
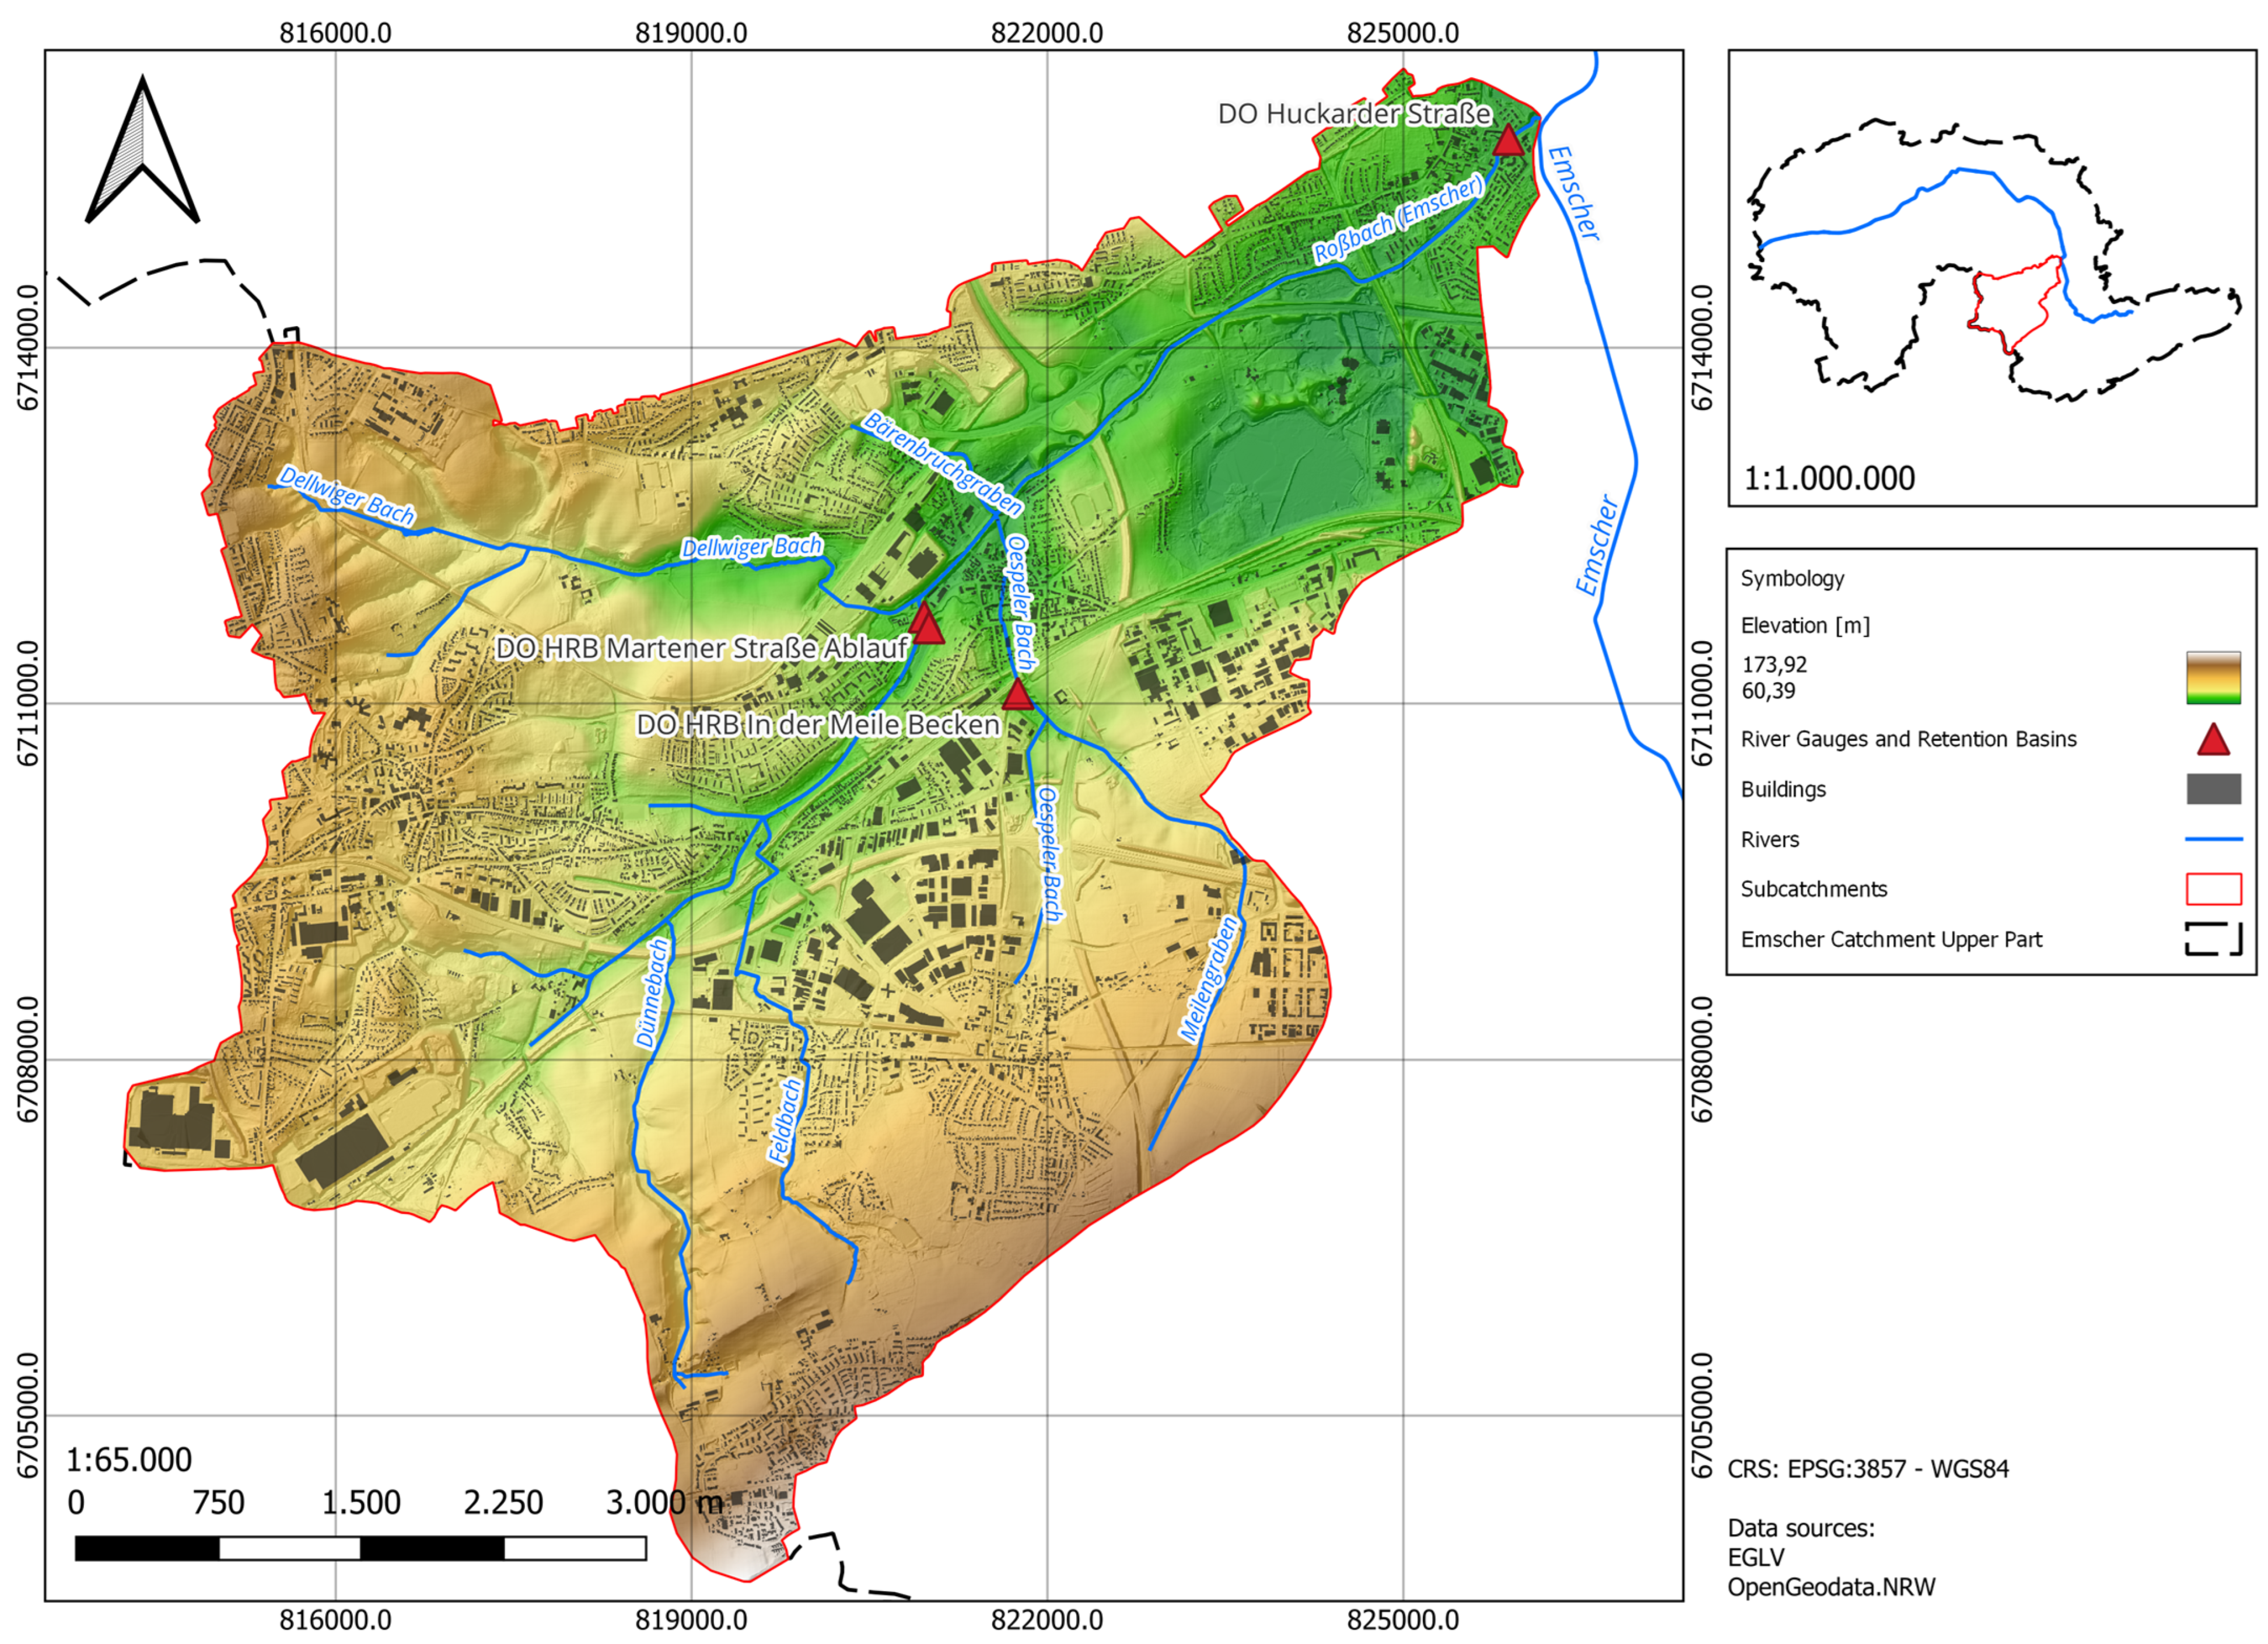
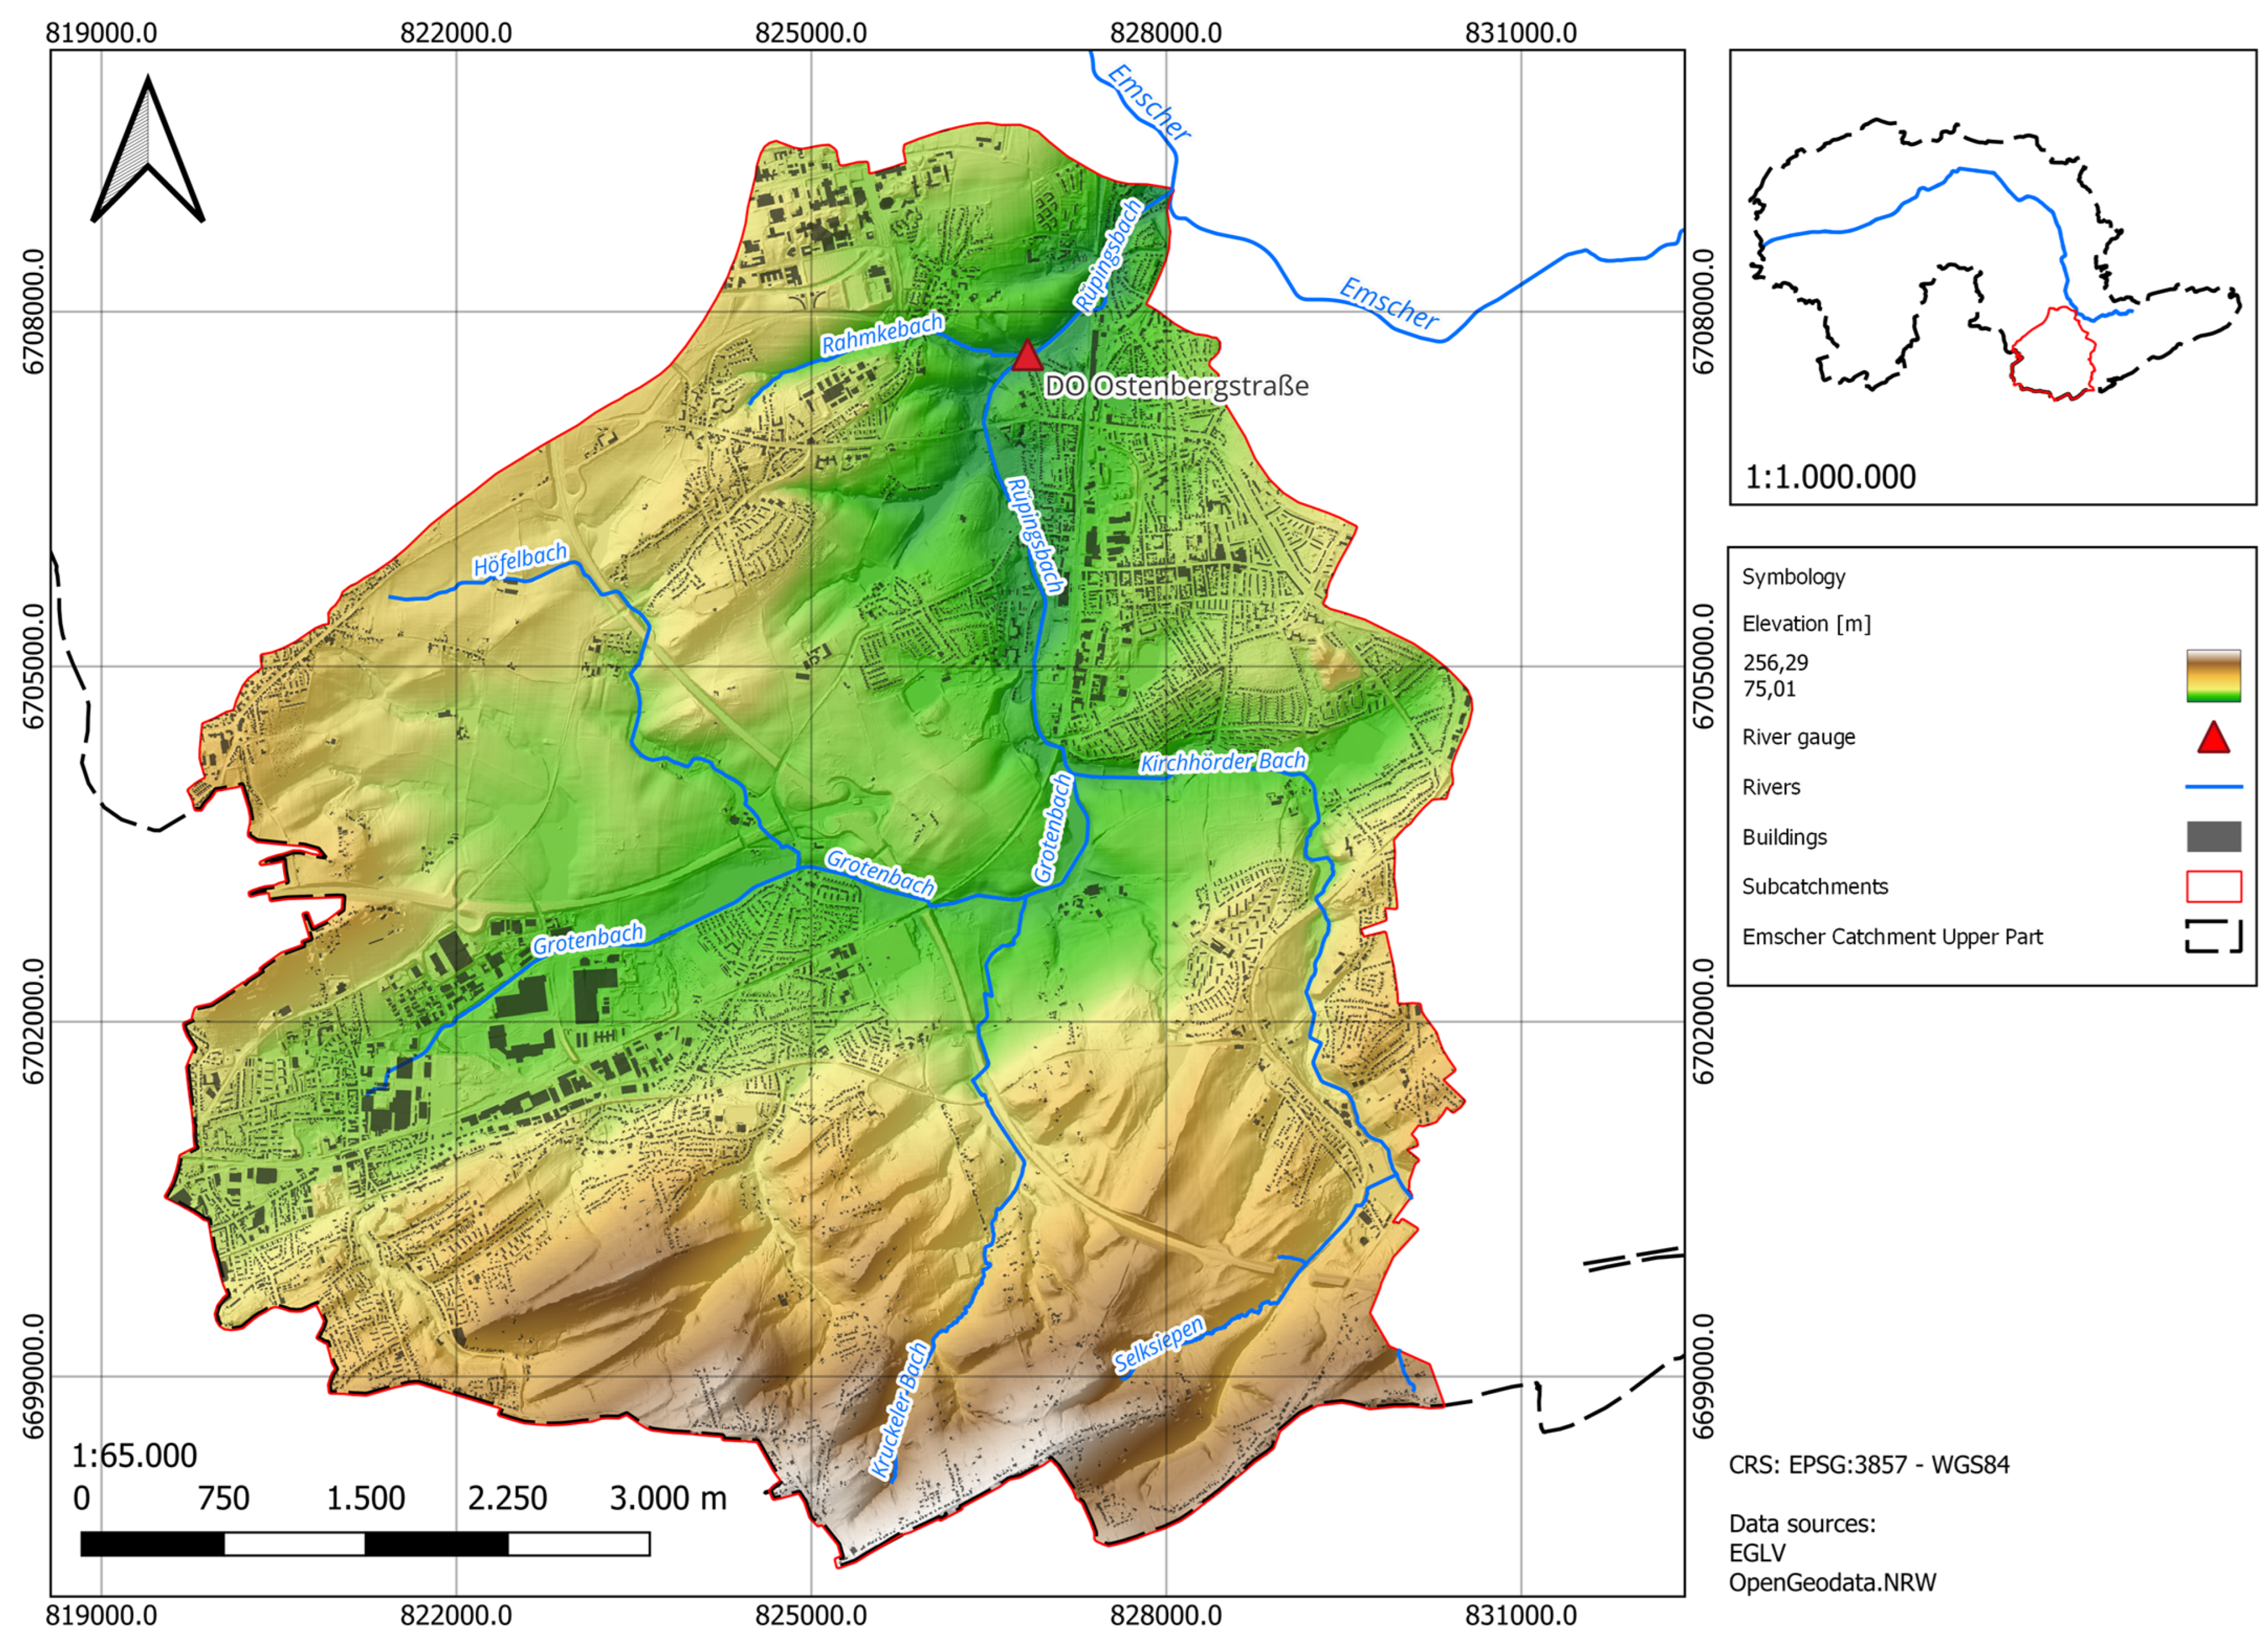
Two representative urban sub-catchments were selected: Rossbach and Ruepingsbach (Figure 1 and Figure 2). They were chosen to represent contrasting hydrological and infrastructural conditions within the Emscher basin. Furthermore, they were selected as two contrasting urban test cases within the broader Emscher basin to capture different combinations of hydrological response and infrastructure influence under otherwise comparable regional conditions. While Rossbach is strongly affected by active control structures, particularly pumping stations and a retention basin, Ruepingsbach is more strongly shaped by bridges, culverts, and channel-related hydraulic constraints. This case-study design enabled a comparative assessment of surface calibration, structural representation, and operational control within a computationally manageable framework.
Figure 1.
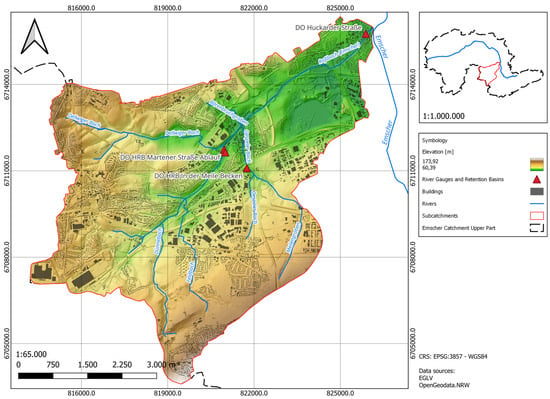
Sub-catchment area of the Rossbach within the Emscher Catchment, including elevation, river network, buildings, river gauges, and retention basins based on data from EGLV (2024) and OpenGeodata.NRW (2024); prepared by D. Roschinsky in 2025.
Figure 2.
Sub-catchment area of the Ruepingsbach within the Emscher Catchment, including elevation, river network, buildings, river gauges, and retention basins based on data from EGLV (2024) and OpenGeodata.NRW (2024); prepared by D. Roschinsky in 2025.
Rossbach:
- Catchment area size: 30.88 km2.
- Average river slope: 2.6‰.
- Average discharge amount: 0.360 m3/s.
- Land use: predominantly low-lying residential and industrial areas (urban areas: 43.7%), characterised by the integration of managed green spaces.
- Infrastructure: two pumping stations, one retention basin, and culvert-controlled crossings. These features make Rossbach particularly sensitive to operational rules governing pumping and storage by retention basins.
Ruepingsbach:
- Catchment area size: 35.37 km2.
- Average river slope: 3.1‰.
- Average discharge amount: 0.431 m3/s.
- Land use: mixed urban fabric with residential, industrial (urban areas: 37.18%), and recreational zones.
- Infrastructure: less dominated by active control structures but influenced by bridges and culverts along the main river of Ruepingsbach.
The sub-catchment areas of the two study areas were modelled separately in TELEMAC-2D to improve computational efficiency. Hydrological connectivity was maintained through a sequential coupling approach: discharge hydrographs extracted at specific cross-sections in the upstream model domain served as input parameters for the respective inflow section in the downstream domain. This modular setup allowed for event-based simulations across multiple sub-catchments. Sub-catchment area boundaries were provided by the managing water board (EGLV—Emschergenossenschaft Lippeverband, Germany).
During post-processing and manuscript preparation, ChatGPT (OpenAI), Version 4–5.3 was used as a supportive tool for drafting and refining scripts for the processing and evaluation of large simulation output datasets, including the automated handling of data and the generation of plots for result analysis and comparison. All code suggestions were critically checked, adapted where necessary, and validated by the authors before application. The AI tool was not used to generate scientific results independently, to make methodological decisions autonomously, or to interpret findings.
3.2. Model Setup
The hydrodynamic simulations were conducted in TELEMAC-2D (version 8.4) using an unstructured triangular mesh and from a high-resolution (1 m) digital elevation model (DEM). Pre-processing steps, including catchment delineation, mesh creation, and spatial parameter assignment (such as building representation), were performed in QGIS (version 3.40.5) and BlueKenue (version 3.3.4). The goal was to produce a physically accurate representation of terrain, land cover, and hydraulic structures suitable for simulating pluvial and fluvial flood dynamics in mostly urban areas.
3.2.1. DEM, Mesh Design, and Numerical Configuration
A 1 m resolution DEM from the Geoportal NRW, Germany served as the topographic basis. Before mesh generation, the DEM was corrected for artefacts such as bridges, vegetation, and overpasses. River channels and depressions were reviewed to ensure hydraulic connectivity, while building footprints were introduced using the building-block method (Section 3.3.1).
The computational mesh was generated using a constrained Delaunay triangulation. Mesh density was varied according to hydraulic relevance:
- Main channels and culvert zones: ~1 m target edge length.
- Densely urbanised areas: ~3 m target edge length.
- Open fields and low-sensitivity areas: ~25 m target edge length.
Transitions between refinement zones are automatically smoothed by BlueKenue to avoid abrupt element size changes. A formal mesh sensitivity analysis was not carried out as a separate part of this study. Instead, mesh resolution was defined according to hydraulic relevance and expected process sensitivity, with local refinement in channels, culvert zones, and densely urbanised areas to ensure an appropriate balance between process representation and computational efficiency.
TELEMAC uses the finite element method (FEM) to solve the shallow water equations. For the model setup, numerical stability was ensured through a variable time-stepping approach with a maximum Courant number of 0.9, fulfilling the Courant–Friedrichs–Lewy (CFL) condition. Advection of depth and velocity was computed using the method of characteristics (MOC) scheme, which, although typically recommended for tidal flat systems, was applied here to the inland Emscher catchment to enhance numerical stability and accurately capture advective transport, while the streamline upwind Petrov–Galerkin (SUPG) stabilisation advection scheme was not applied. The hydrodynamic equations were solved using a conjugate gradient solver, with a convergence tolerance of 1.0 × 10⁻⁴ and a maximum of 2000 iterations, consistent with the TELEMAC-2D defaults. Wetting and drying were handled with tidal flats enabled and a threshold depth of 0.05 m, which balances stability and physical realism during inundation and recession. Additional stability was achieved through negative depth correction, a free-surface gradient compatibility factor of 0.9, and full mass-lumping of the depth equation.
The modular coupling approach (Section 3.1) required explicit handling of lateral and downstream boundaries. Hydrographs extracted from upstream sub-catchments were inserted as discharge inflows at predefined sections of the mesh. At the downstream end of each sub-catchment, a free outflow boundary was applied. Initial water levels were set to zero depth across the floodplain.
3.2.2. Land Use and Soil Data
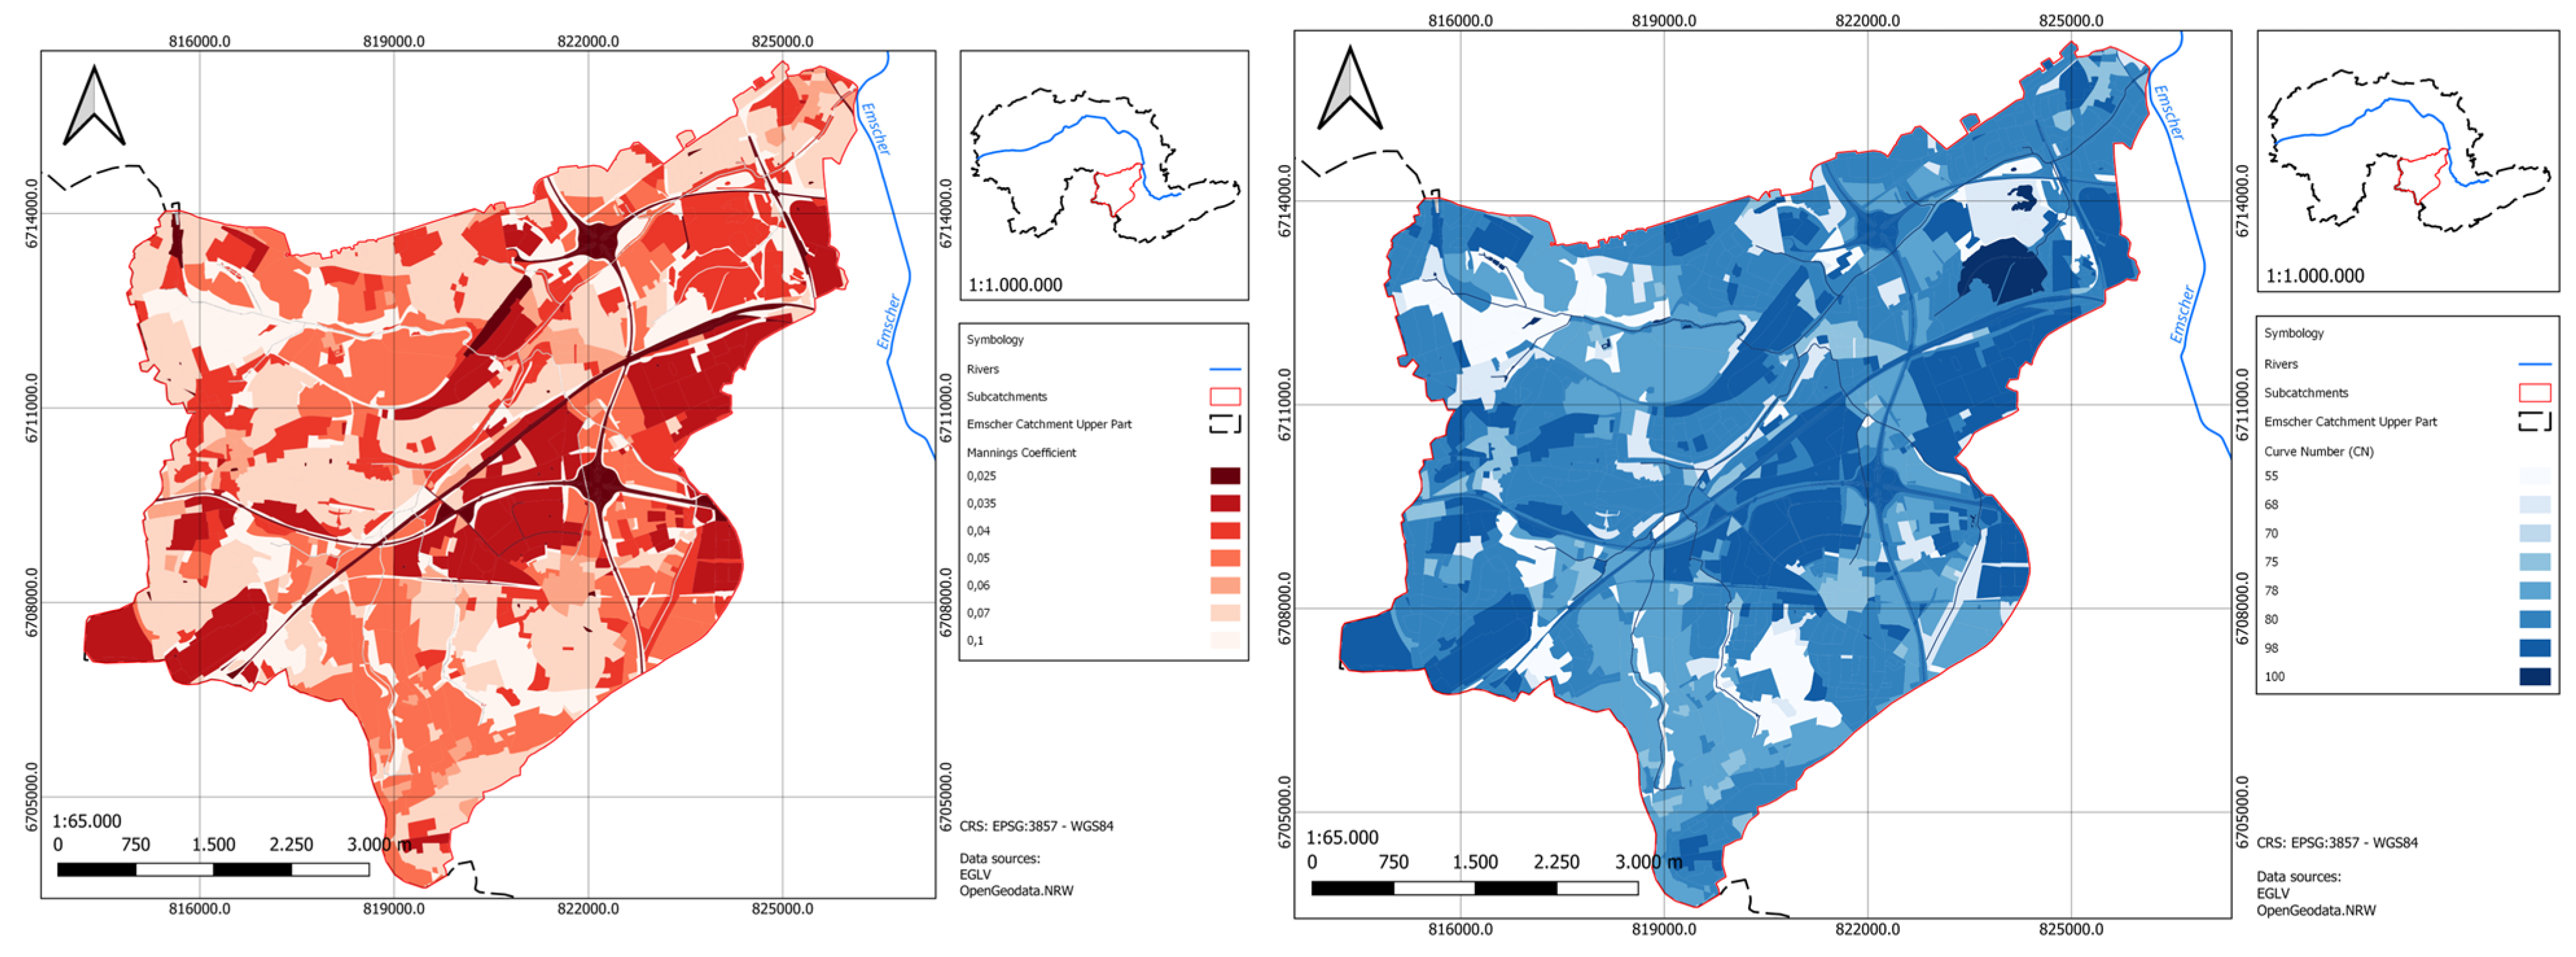
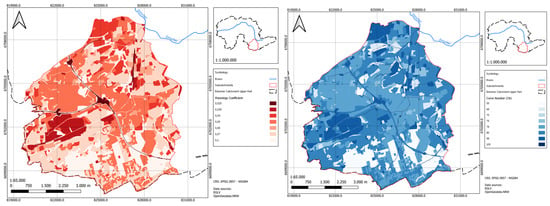
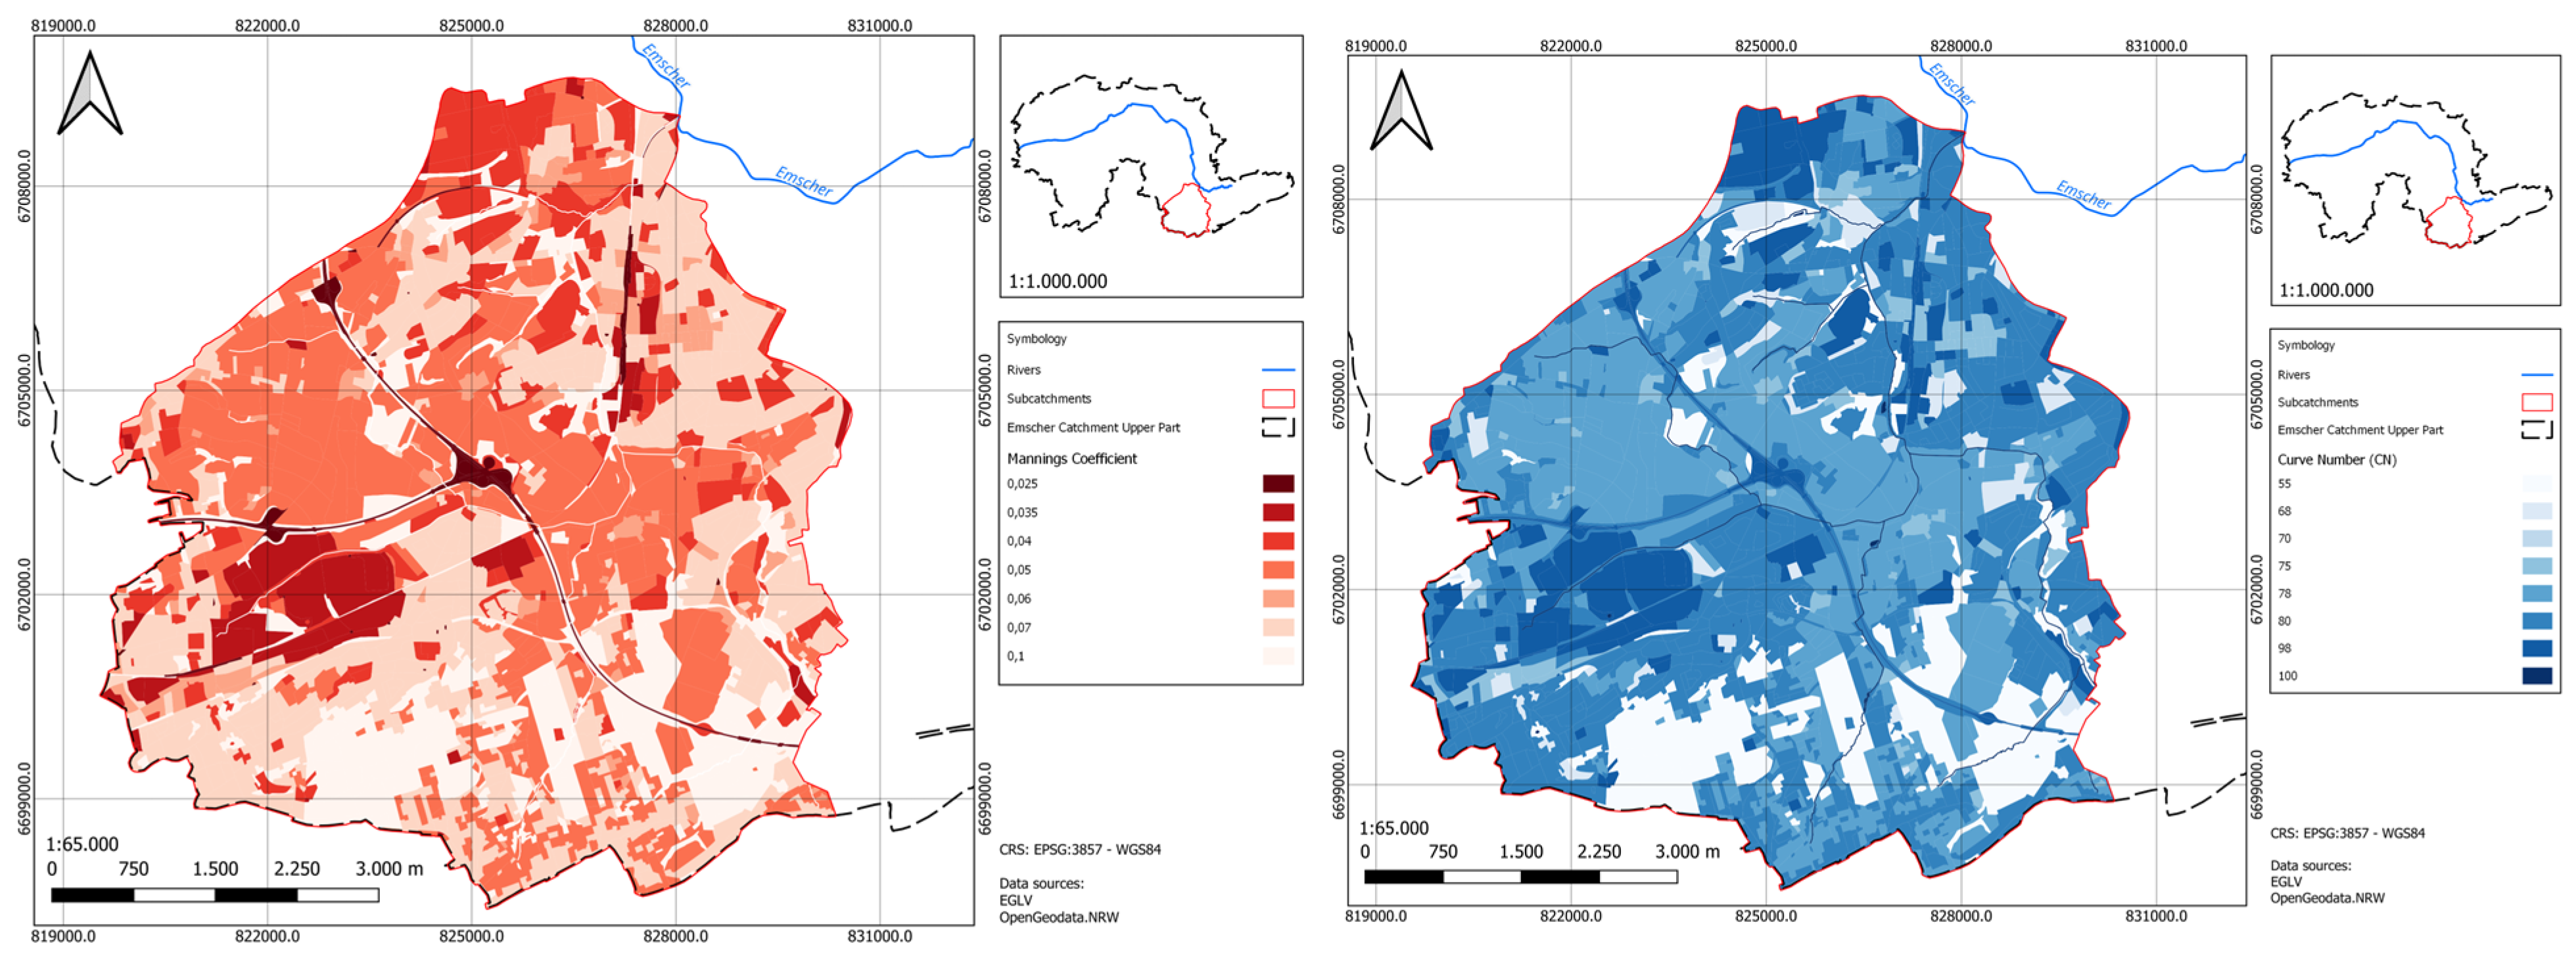
Land use data were obtained from the Geoportal NRW and supplemented by the ATKIS topographic dataset (Official Topographic-Cartographic Information System). These datasets provide spatially explicit information on land cover categories, which are essential for assigning hydrological and hydraulic parameters in the TELEMAC-2D model. Each land use class was linked to a Curve Number (CN) regarding its soil group and a Manning’s roughness coefficient (n) (see Figure 3 and Figure 4) following standard hydrological classifications [3,10].
Figure 3.
Roughness (left) and SCS-CN Curve Number (right) distribution of values in the Rossbach sub-catchment area.
Figure 4.
Roughness (left) and SCS-CN Curve Number (right) distribution of values in the Ruepingsbach sub-catchment area.
To systematically test model sensitivity, three calibration levels (R1–R4) (see Table 1) were defined. This process was carried out manually and not through an automated optimisation procedure:
- R1: Baseline values from literature and standard tables;
- R2: Intermediate adjustment based on catchment-specific observations;
- R3: Refined calibration against observed hydrographs;
- R4: Additional calibration against observed hydrographs after incorporating hydraulic components.
Table 1.
CN and n values for the calibration series R1–R4.
3.2.3. Rainfall and Runoff Modelling
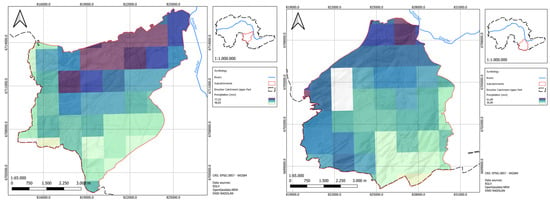
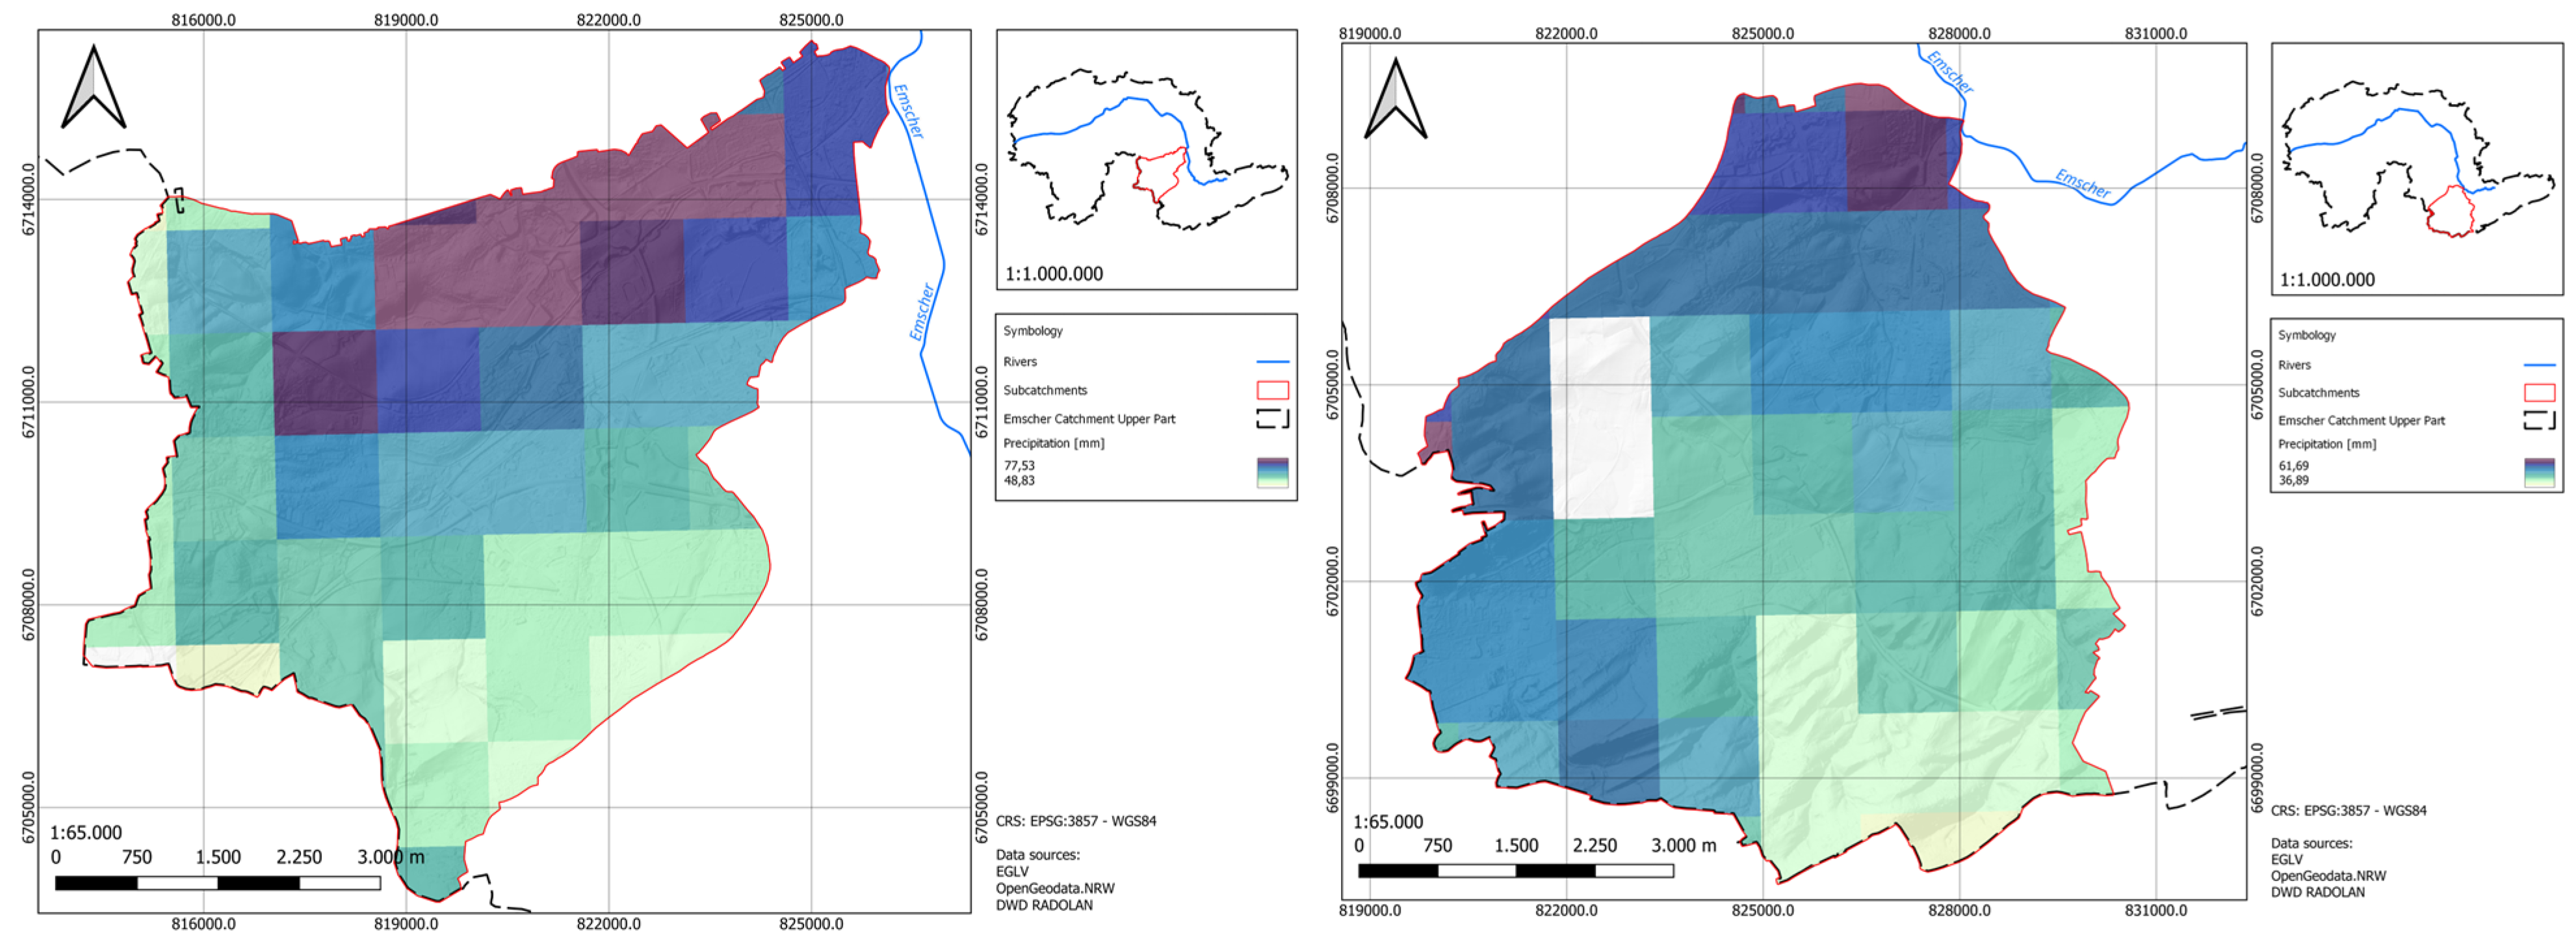
Rainfall data were obtained from the RADOLAN-RW product of the German Weather Service (DWD), which provides gauge-adjusted radar rainfall estimates at 1 km2 spatial and 5 min temporal resolution (see Figure 5). As the dataset is already adjusted using ground-based rain gauge observations within the DWD processing workflow, no additional event-specific rainfall calibration or external bias correction was applied in this study.
Figure 5.
The precipitation sum of the 2023 rainfall event coming from the RADOLAN dataset by the German Weather Service (DWD).
For model validation, a severe storm in June 2023 was selected. The event featured highly localised convective rainfall cells with peak intensities over 35 mm/h in several sub-catchments and a total rainfall of 69.3 mm over 13 h. This event was chosen because it caused observable flooding in multiple urban areas of the Emscher basin and had reliable gauge data available for validation. The study was intentionally designed as an event-based analysis centred on one well-documented extreme rainfall event in order to evaluate the relative effects of calibration, infrastructure representation, and operational control under a common and directly comparable forcing. A single-event design allowed the different model configurations and antecedent moisture scenarios to be assessed under controlled conditions, but it also limited the generalisability of the results to other rainfall patterns and hydrological situations. Multi-event validation would, therefore, be an important next step for future work. Gauge data were provided by EGLV.
The rainfall–runoff transformation was directly integrated into TELEMAC-2D using a rain-on-grid method based on the Soil Conservation Service Curve Number (SCS-CN) approach. This method relates total precipitation to effective runoff through three main parameters: maximum potential retention (S), initial abstraction (Ia), and land use-dependent CN values, which were spatially assigned to each mesh element.
Because the model was configured as an event-based rain-on-grid simulation of a short-duration extreme rainfall event, no separate baseflow component was parameterised. The focus was placed on rainfall-driven runoff generation, routing, and infrastructure-controlled flood response. This simplification should be considered when interpreting residual discrepancies between simulated and observed hydrographs.
Three scenarios of antecedent moisture conditions (AMC) were explicitly incorporated by adjusting CN values according to SCS guidelines. Dry conditions (AMC I) correspond to lower CN values, indicating higher infiltration and storage capacity, while wet conditions (AMC III) lead to increased runoff due to limited retention capacity. In the TELEMAC-2D rain-on-grid workflow, this AMC I–III split is routinely implemented by selecting AMC-specific CN sets as defined by the SCS conversion rules.
A custom Fortran subroutine was created to load rainfall fields from temporally resolved ASCII files, which contain x, y, t coordinates and precipitation depths. The routine updates rainfall intensity at each mesh node for every model time step, allowing full spatiotemporal variability of the rainfall event. This implementation enables TELEMAC-2D to simulate short-duration, high-intensity storm dynamics that are critical for flash flood formation in urban catchments.
3.3. Urban Infrastructure Integration
Urban flood dynamics are heavily shaped by human-made hydraulic structures that control, redirect, or temporarily store water flow. To accurately represent these effects, key urban features, including buildings, sewer-related abstractions, culverts, bridges, retention basins, and pumping stations, were systematically incorporated into the TELEMAC-2D model. The objective was to ensure essential hydraulic realism while keeping computational demands manageable.
3.3.1. Buildings
Building footprints were sourced from the Open Data Portal NRW and implemented using the building-block method. Impermeable polygons were vertically extruded and assigned artificially elevated terrain values in the mesh. This method prevents water from entering buildings and directs runoff along realistic urban routes such as streets and open spaces. It also helps maintain realistic runoff volumes near buildings. During high-intensity rainfall, local property drainage is likely to be capacity-limited, while sewer effects are already represented via the urban initial-loss formulation, so excess rainfall is plausibly redistributed around building footprints rather than removed from the domain. The extrusion height for modelled buildings was set to 3 m above the terrain. This representation is computationally efficient and reflects the primary role of buildings as lateral barriers, particularly important in low-gradient urban areas.
3.3.2. Sewer System Abstractions
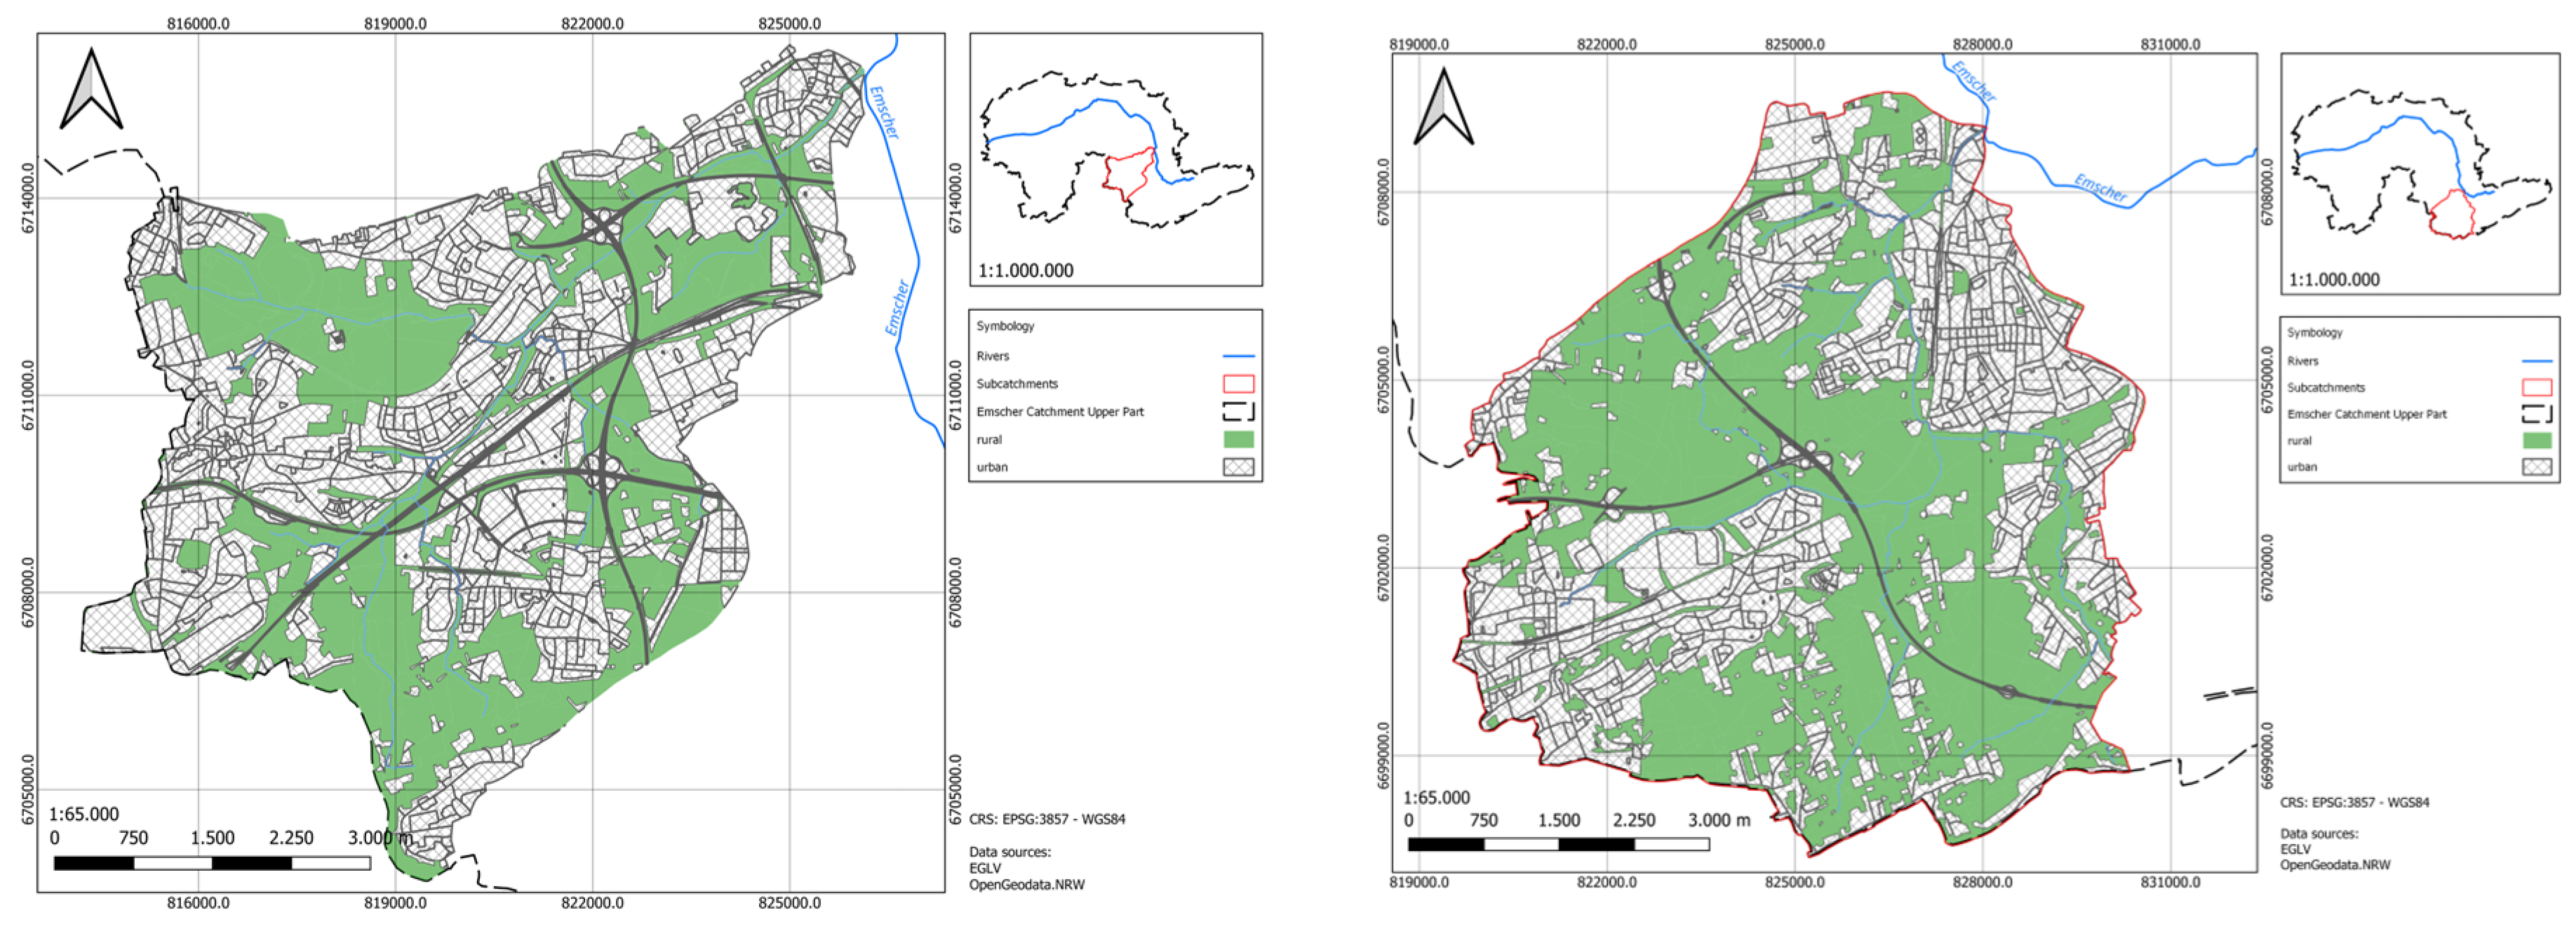
An explicit hydraulic sewer model was not available. Instead, sewer effects were approximated by spatially variable abstraction terms applied to impervious land use classes (ATKIS dataset). A pre-processing routine was introduced to increase infiltration capacity in urban zones to mimic interception by stormwater inlets and underground pipes (see Figure 6). Based on discussions with the waterboard in charge, the abstraction rate was set to 10 mm∙h−1 for the first 2 h. This simplification reduces overestimation of surface runoff in densely built areas, but it does not reproduce dynamic sewer surcharges.
Figure 6.
Distribution of the urban fabric (not green area) derived from the ATKIS dataset as affected by the initial loss proxy method (sewer system).
3.3.3. Culverts and Bridges
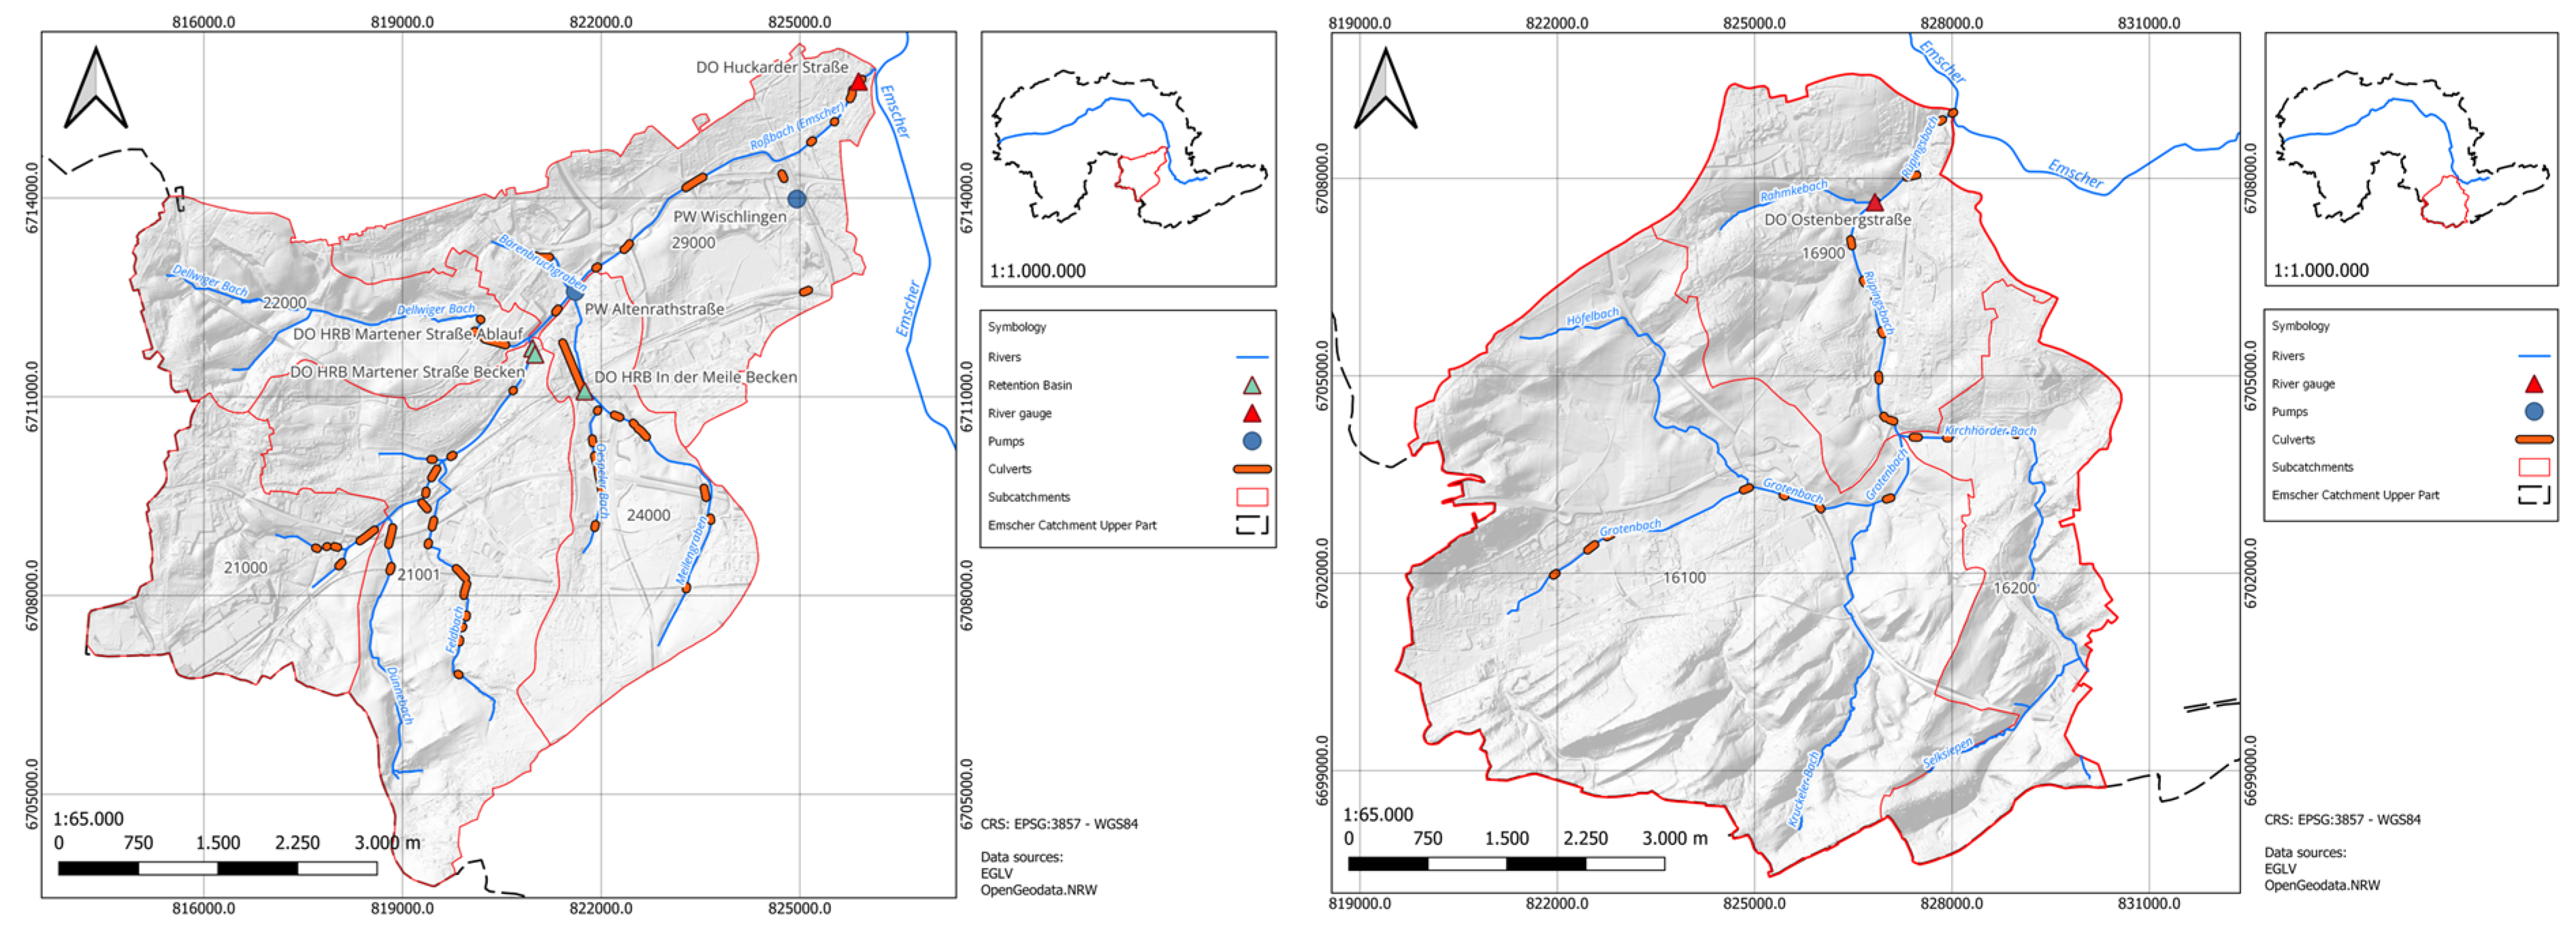
66 culverts and bridges were explicitly modelled using TELEMAC-2D’s internal hydraulic structure modules. Each culvert or bridge was parameterised with inlet and outlet elevations, simplified cross-sectional geometry, length, and empirical head-loss coefficients based on [2]. The locations and dimensions data were provided by the waterboard EGLV (see Figure 7). This structure-based approach allowed for the reproduction of local throttling effects, backwater buildup, and delayed flow transfer, which are crucial for accurately modelling urban flood wave propagation, especially under surcharge or debris-prone conditions. Although no explicit clogging scenarios were included in the current setup, the configuration permits the future addition of blockage routines.
Figure 7.
Locations of culverts and bridges in the sub-catchment areas of Rossbach and Ruepingsbach.
Two modelling approaches were compared:
- Open configuration (OP): structures omitted, DEM cut through to allow unimpeded flow.
- Closed configuration (CL): explicit culvert/bridge modelling as hydraulic structures.
This allowed for the evaluation of the hydraulic significance of culvert representation for flood routing and hydrograph reproduction.
3.3.4. Retention Basins and Pumping Stations
Retention basins were modelled as dynamic sink–source terms with specific storage capacities and outlet rules. Pumping stations were implemented through user-defined Fortran routines, where their activation depended on upstream water levels and official discharge; head curves were provided by the local water authority EGLV.
- Retention basins: two, with volumes of 151,000 m3 and 58,000 m3
- ○
- Operational rule: threshold-based activation
- Pumping stations: two with rated capacities of [~1 m3 h−1].
- ○
- Operational rule: event data-based control (Section 4.4).
This setup provided a realistic depiction of storage and controlled drainage, which are essential in lowland urban areas where gravity-driven outflow is limited.
To implement these process representations without directly modifying the TELEMAC-2D source code, we relied on the standard user subroutine interface provided by the modelling system.
As described in the TELEMAC-2D user manual, this mechanism offers predefined entry points for project-specific extensions, enabling transparent, version-compatible, and reproducible modifications of model behaviour. Accordingly, the operational logic was implemented using a set of adapted subroutines, summarised in Table 2.
Table 2.
List of subroutines that has been adjusted in TELEMAC-2D.
The computer code for the subroutines developed in this study is openly available in a GitHub (version 2025) repository: https://git.rwth-aachen.de/iww-public/telemac-urbandraincontrol (accessed on 17 January 2026).
3.4. Methodological Considerations and Impacts
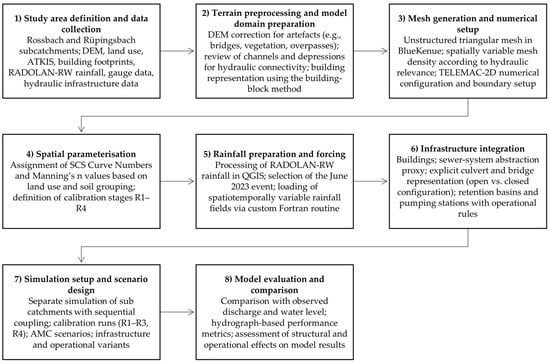
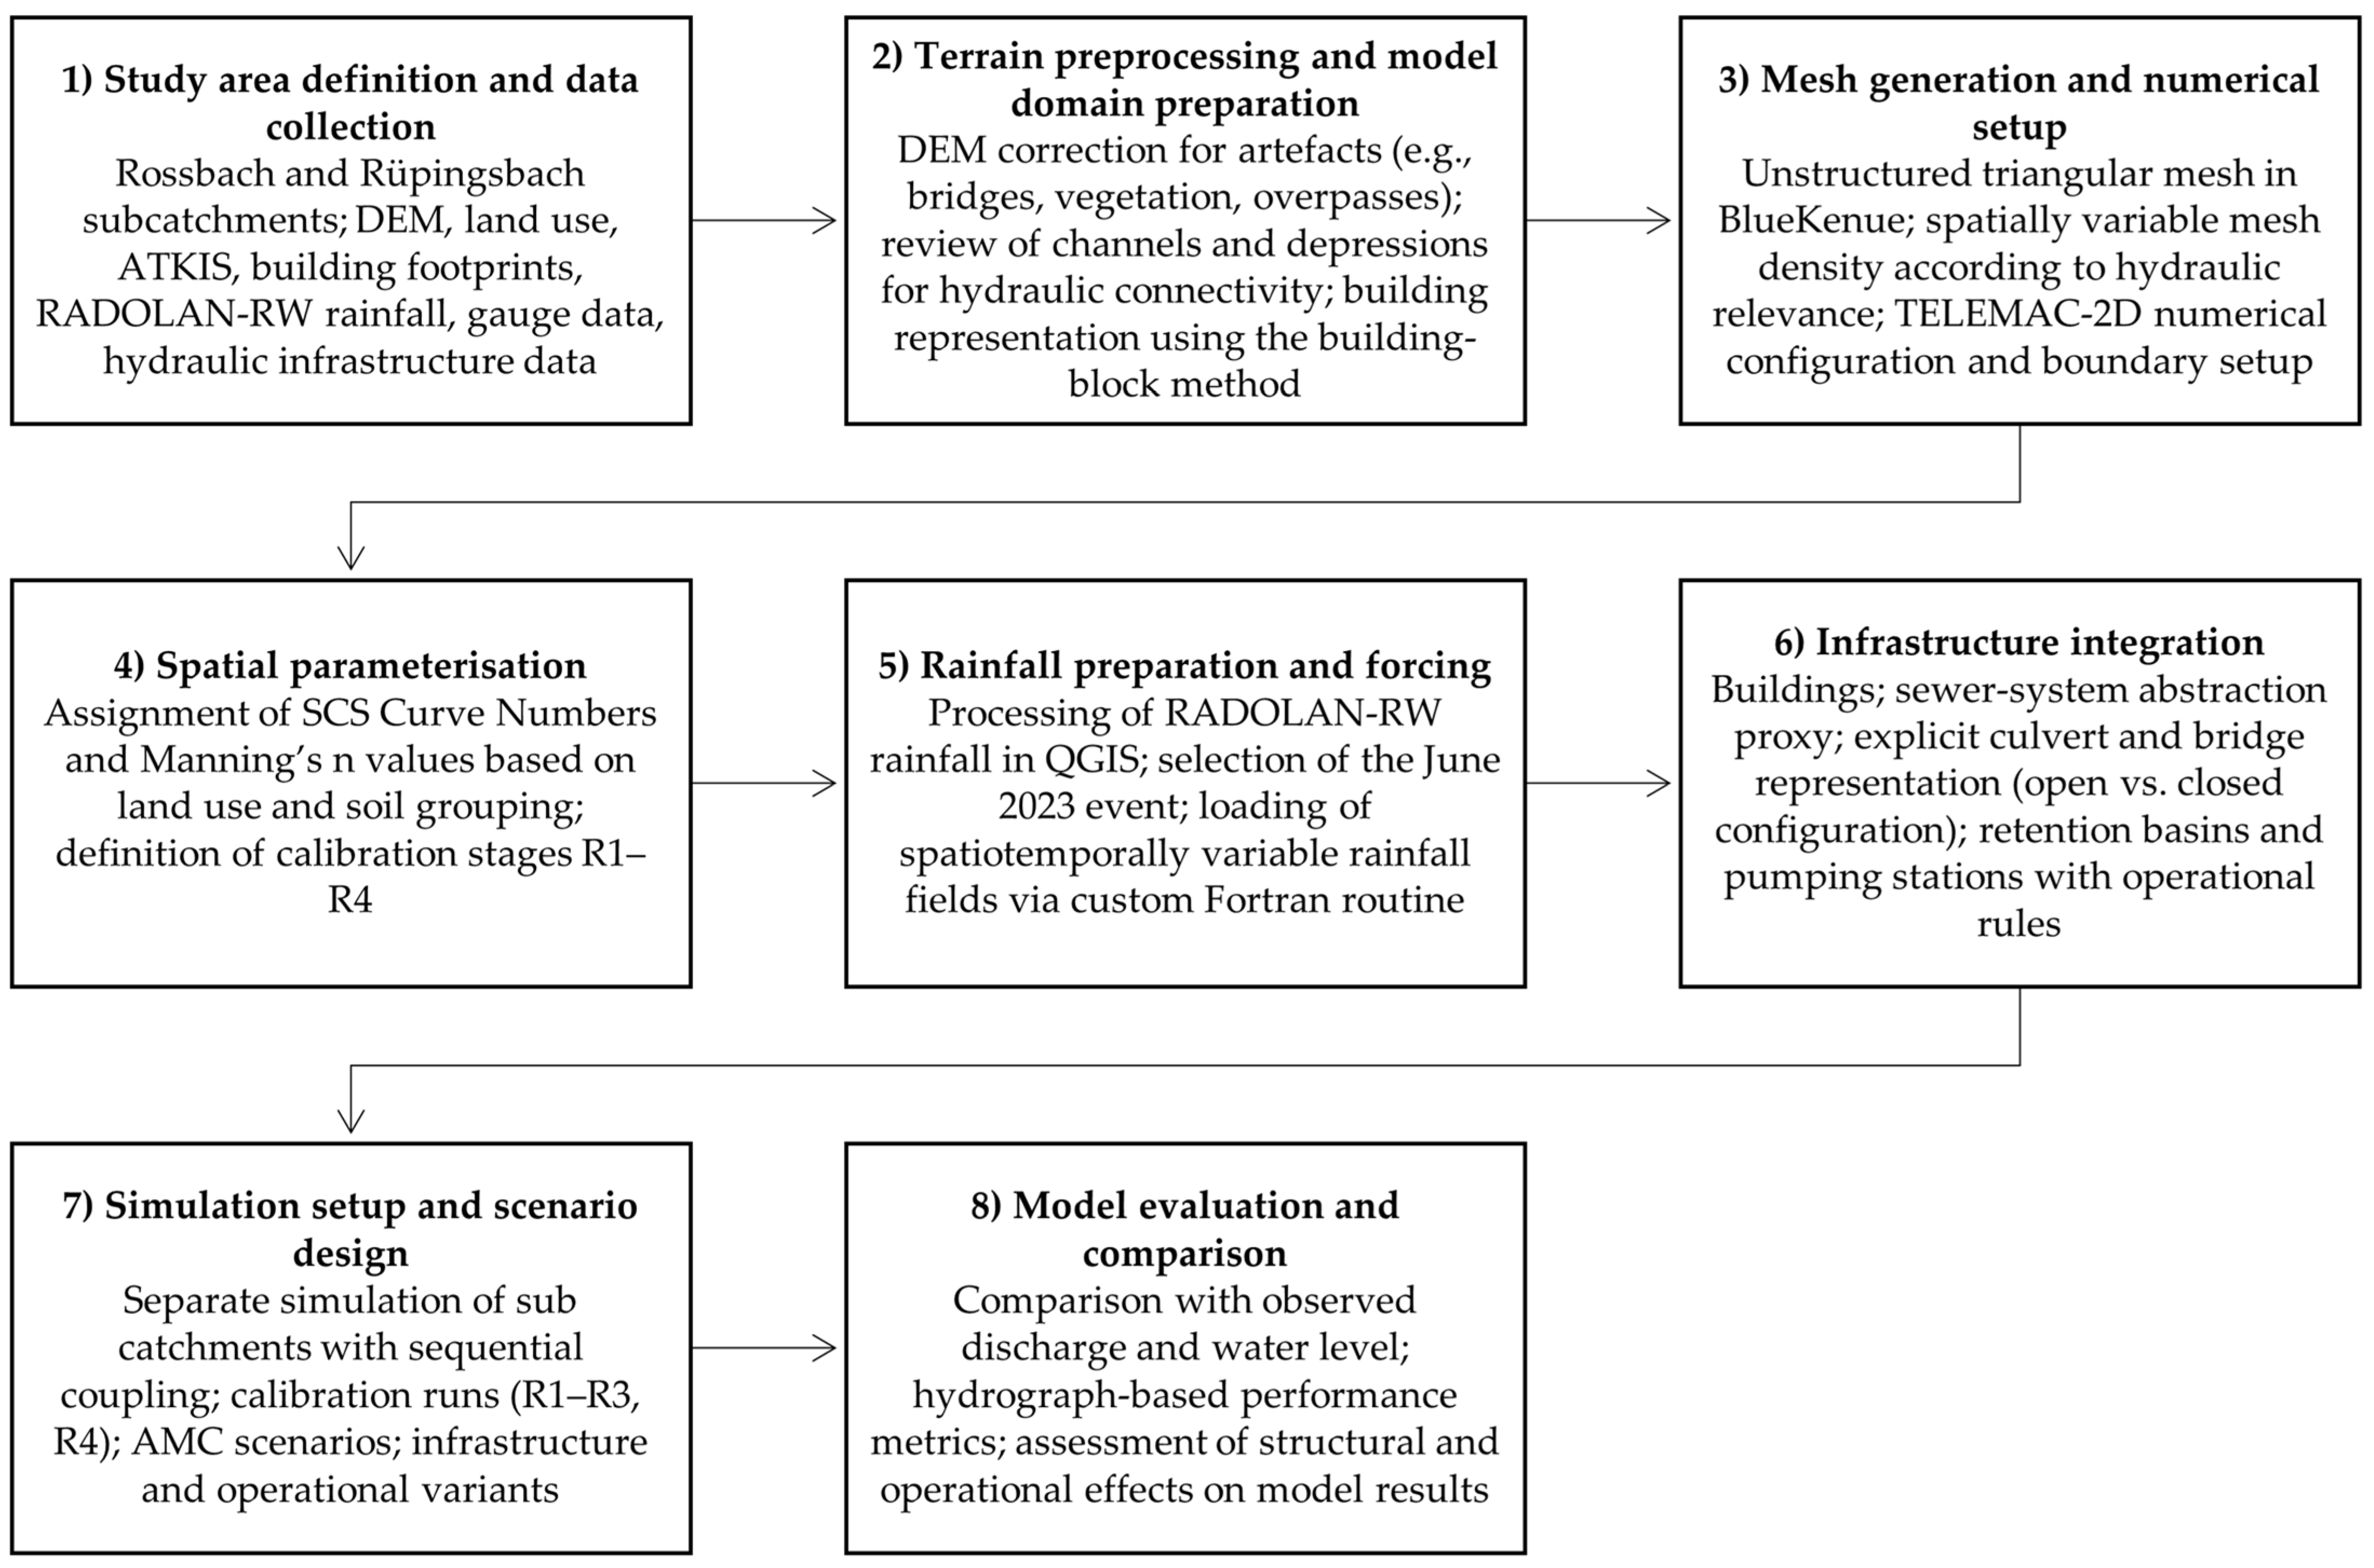
Integrating urban infrastructure into TELEMAC-2D requires balancing hydraulic detail and computational efficiency. In this study, a lot of data and also several simplifications were implemented to keep the model manageable while capturing the key flood processes (see Table 3 and Figure 8).
Table 3.
Overview of datasets used in this study, including source, resolution, and modelling purpose.
Figure 8.
The workflow of the modelling framework within the TELEMAC-2D rain-on-grid approach.
Initially, the sewer network was not explicitly modelled but was represented through spatially variable abstraction losses in impervious zones. This approach minimises early runoff overestimation but cannot simulate sewer surcharge or pipe capacity exceedance. The simplification is justified by the lack of reliable sewer data for the study area and the focus on aboveground flood dynamics.
Second, pumping stations and retention basins were utilised as source–sink systems with operational rules instead of detailed mechanical models. This approach allowed critical storage and pumping behaviours to be incorporated without making the setup overly complex. The downside is that energy use or redundancy could not be addressed in this model.
Third, culvert and bridge modelling relied on simplified geometric and empirical parameterisations. While sufficient to capture flow throttling and backwater effects, blockage by debris and sediment was not considered. This omission is important because clogging has been shown to significantly alter flood propagation during extreme events and should be tested in future scenario-based extensions.
Finally, the rain-on-grid approach using SCS Curve Numbers provided a practical compromise between hydrological detail and computational efficiency. While this method considers infiltration and antecedent moisture conditions, it does not explicitly model subsurface interflow or groundwater recharge, which may contribute to late hydrograph volumes.
Taken together, these methodological choices allowed the model to capture key flood dynamics at the urban scale, but they also introduced uncertainties. The trade-offs made in this study highlight the importance of transparently communicating assumptions, so results can be understood within the appropriate bounds of reliability. In addition, no formal convergence-based mesh sensitivity analysis was conducted. Although the mesh was designed using hydraulically motivated refinement zones, the influence of alternative mesh resolutions on local flow patterns, inundation extent, and structure-related effects should be assessed in future work. The present evaluation is also based on one extreme event. While this supports a controlled comparison of alternative model configurations, further testing across multiple rainfall events would be required to assess the transferability and robustness of the calibrated setup more comprehensively.
4. Results
The calibration experiments evaluated how effectively surface parameter adjustments alone can replicate observed hydrographs. At the Rossbach gauge, simulated discharges could be directly compared against available observed flow data, whereas at the Ruepingsbach gauge, only water level observations were available for model evaluation. Three calibration levels (R1–R3) were tested, with R1 representing baseline values from literature, R2 including intermediate adjustments, and R3 providing refined tuning of Curve Numbers (CN) and Manning’s n. Each calibration level was applied in both the “open” (OP) and “closed” (CL) culvert configurations, resulting in six scenarios per catchment. To address the remaining temporal mismatch in peak discharge after surface-based calibration, an additional targeted calibration step (R4) was performed after integrating hydraulic components, focusing on flow routing efficiency rather than further adjustments to runoff generation parameters.
4.1. Calibration Performance
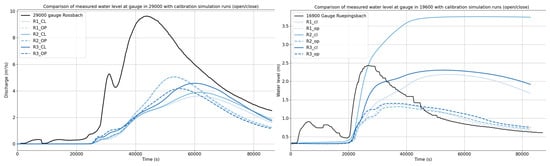
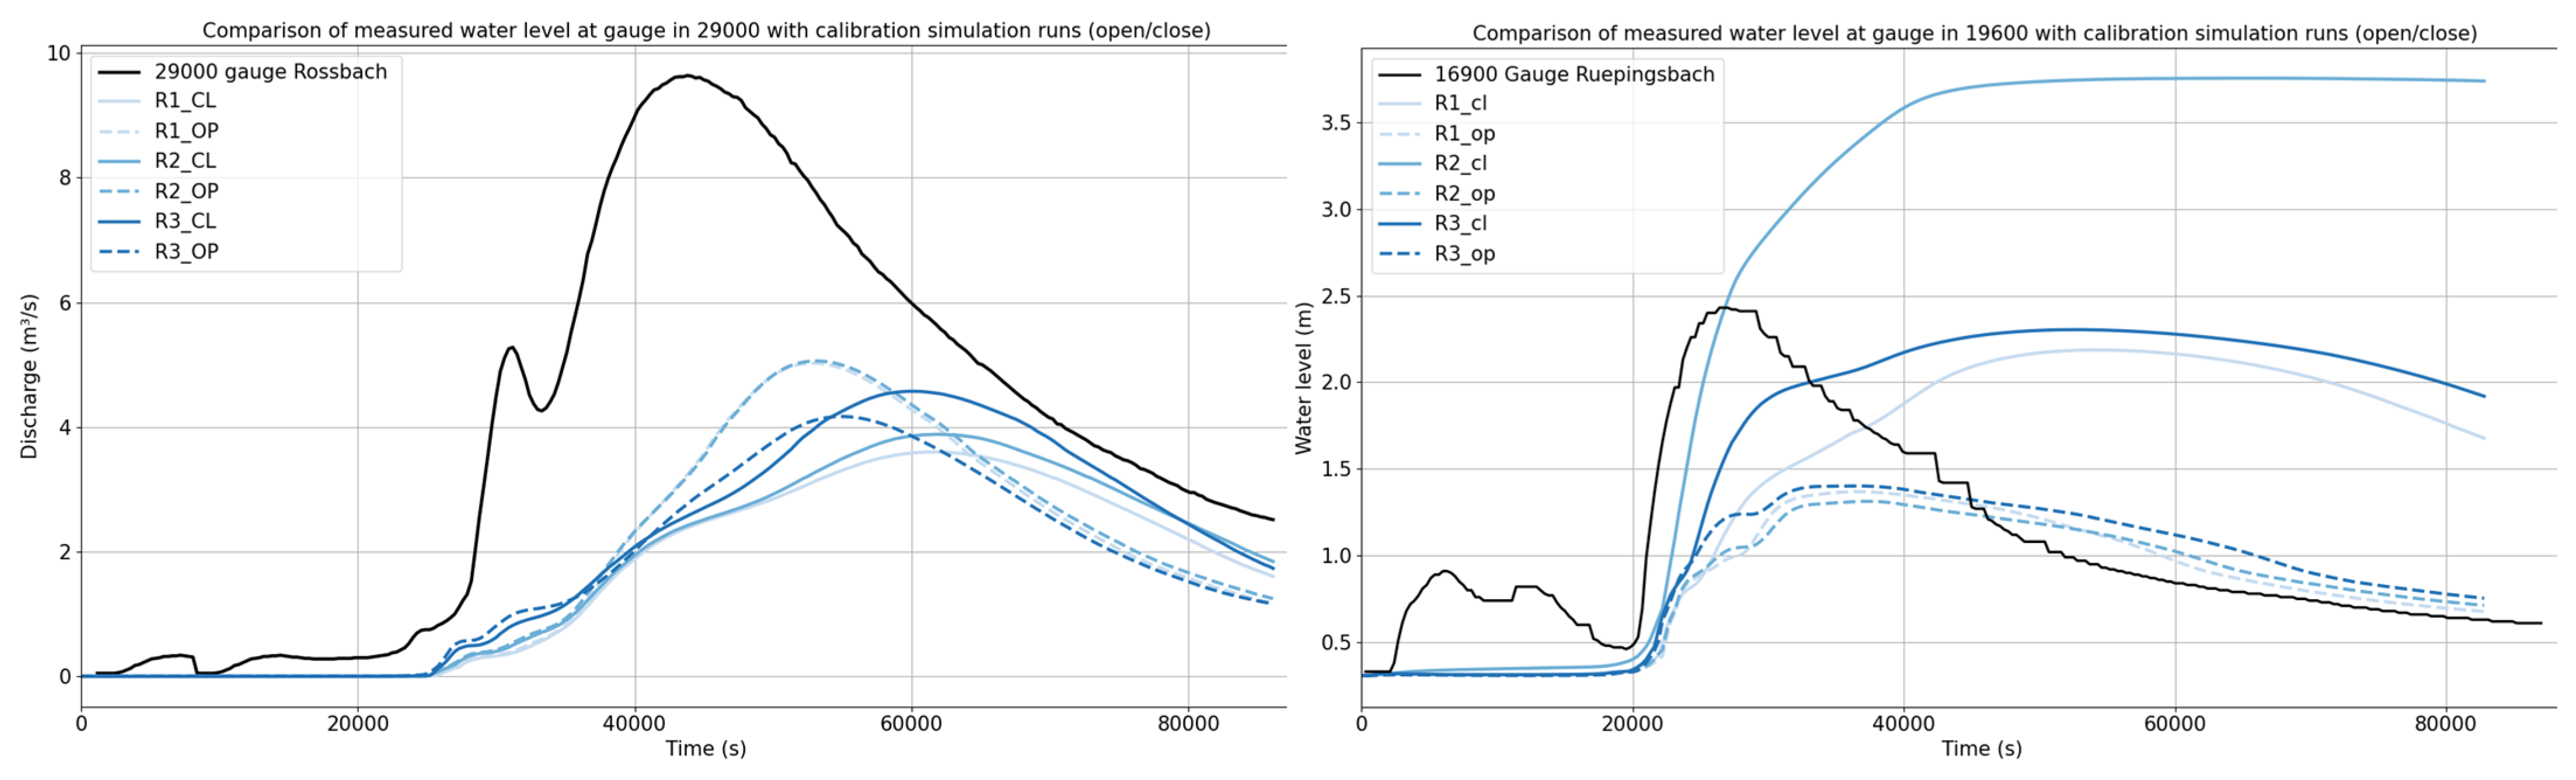
At Rossbach, calibration improved the overall hydrograph shape, but surface parameter adjustment alone was insufficient to reproduce the observed peak discharge (Figure 9 and Table 4). The observed peak approached 10 m3/s, whereas simulated peaks remained between approximately 3.5 and 5.0 m3/s across all R1–R3 scenarios. This systematic underestimation is reflected in the performance metrics: RMSE ranged from 2.91 to 3.38 m3/s, peak discharge errors from −4.58 to −6.04 m3/s, and NSE values remained low, varying from −0.138 to 0.157. The best performance among these calibration-only runs was obtained for R2_OP (NSE = 0.157; RMSE = 2.91 m3/s; peak error = −4.58 m3/s), but even this configuration still failed to reproduce peak magnitude satisfactorily. Overall, the Rossbach results show that calibration of Manning’s n and Curve Numbers alone improved parts of the hydrograph response but could not compensate for missing structural and operational controls, particularly with respect to peak flow reproduction and timing.
Figure 9.
Observed and simulated discharges at Rossbach (Gauge 29000) and Ruepingsbach (Gauge 19600) under calibration levels R1–R3, with open (OP) and closed (CL) culvert configurations.
Table 4.
Overview of results of R1–R3 runs in the sub-catchment areas Rossbach and Ruepingsbach.
At Ruepingsbach, calibration had a clear influence on simulated water levels, but the performance remained inconsistent across the tested configurations (Figure 9 and Table 4). Baseline scenarios underestimated the observed peak substantially, with R1_OP showing a peak error of −1.36 m, whereas R2_CL overestimated the peak by +1.02 m. Among all runs, R3_CL yielded the closest peak representation with a peak error of −0.43 m, but NSE values remained negative in all cases, ranging from −10.000 to −0.623, and RMSE values varied between 0.73 and 1.91 m. The lowest RMSE was obtained for R3_OP (0.73 m), but this configuration still underestimated the peak by −1.33 m. These results indicate that surface calibration affected both peak magnitude and timing, yet did not lead to consistently robust model skill, highlighting persistent structural limitations beyond parameter adjustment alone.
Taken together, the calibration experiments show that surface-based parameter adjustment improved model behaviour, but it did not consistently reproduce peak magnitude, hydrograph shape, and timing across both catchments. In Rossbach, all R1–R3 runs substantially underestimated peak discharge despite moderate improvements in NSE and RMSE. In Ruepingsbach, calibration produced mixed results, with both under- and overestimation depending on the scenario and no positive NSE values. These findings establish a clear baseline for the subsequent analyses and indicate that calibration alone is insufficient in highly engineered urban catchments, where hydraulic structures and operational controls are likely to exert a comparable or stronger influence on model performance.
Model performance also differed between the two sub-catchments. In Rossbach, calibration-only runs systematically underestimated peak discharge, but the later integration of operational infrastructure and AMC-dependent initialisation substantially improved model skill. In contrast, Ruepingsbach showed a more mixed response even during the calibration phase, with persistent negative NSE values despite local improvements in peak representation. This indicates that model behaviour varies spatially across the study area and is influenced not only by surface parameterisation but also by differences in hydraulic controls, response dynamics, and available validation variables.
4.2. Influence of Hydraulic Structures
The effect of hydraulic structures was evaluated by directly comparing hydrographs from the open setup (DEM cut-throughs without structures) and the closed setup (explicit bridges and culverts using EGLV data, see Section 3.3.3). No observational dataset was used in this comparison; all performance metrics measure differences between the two modelling methods.
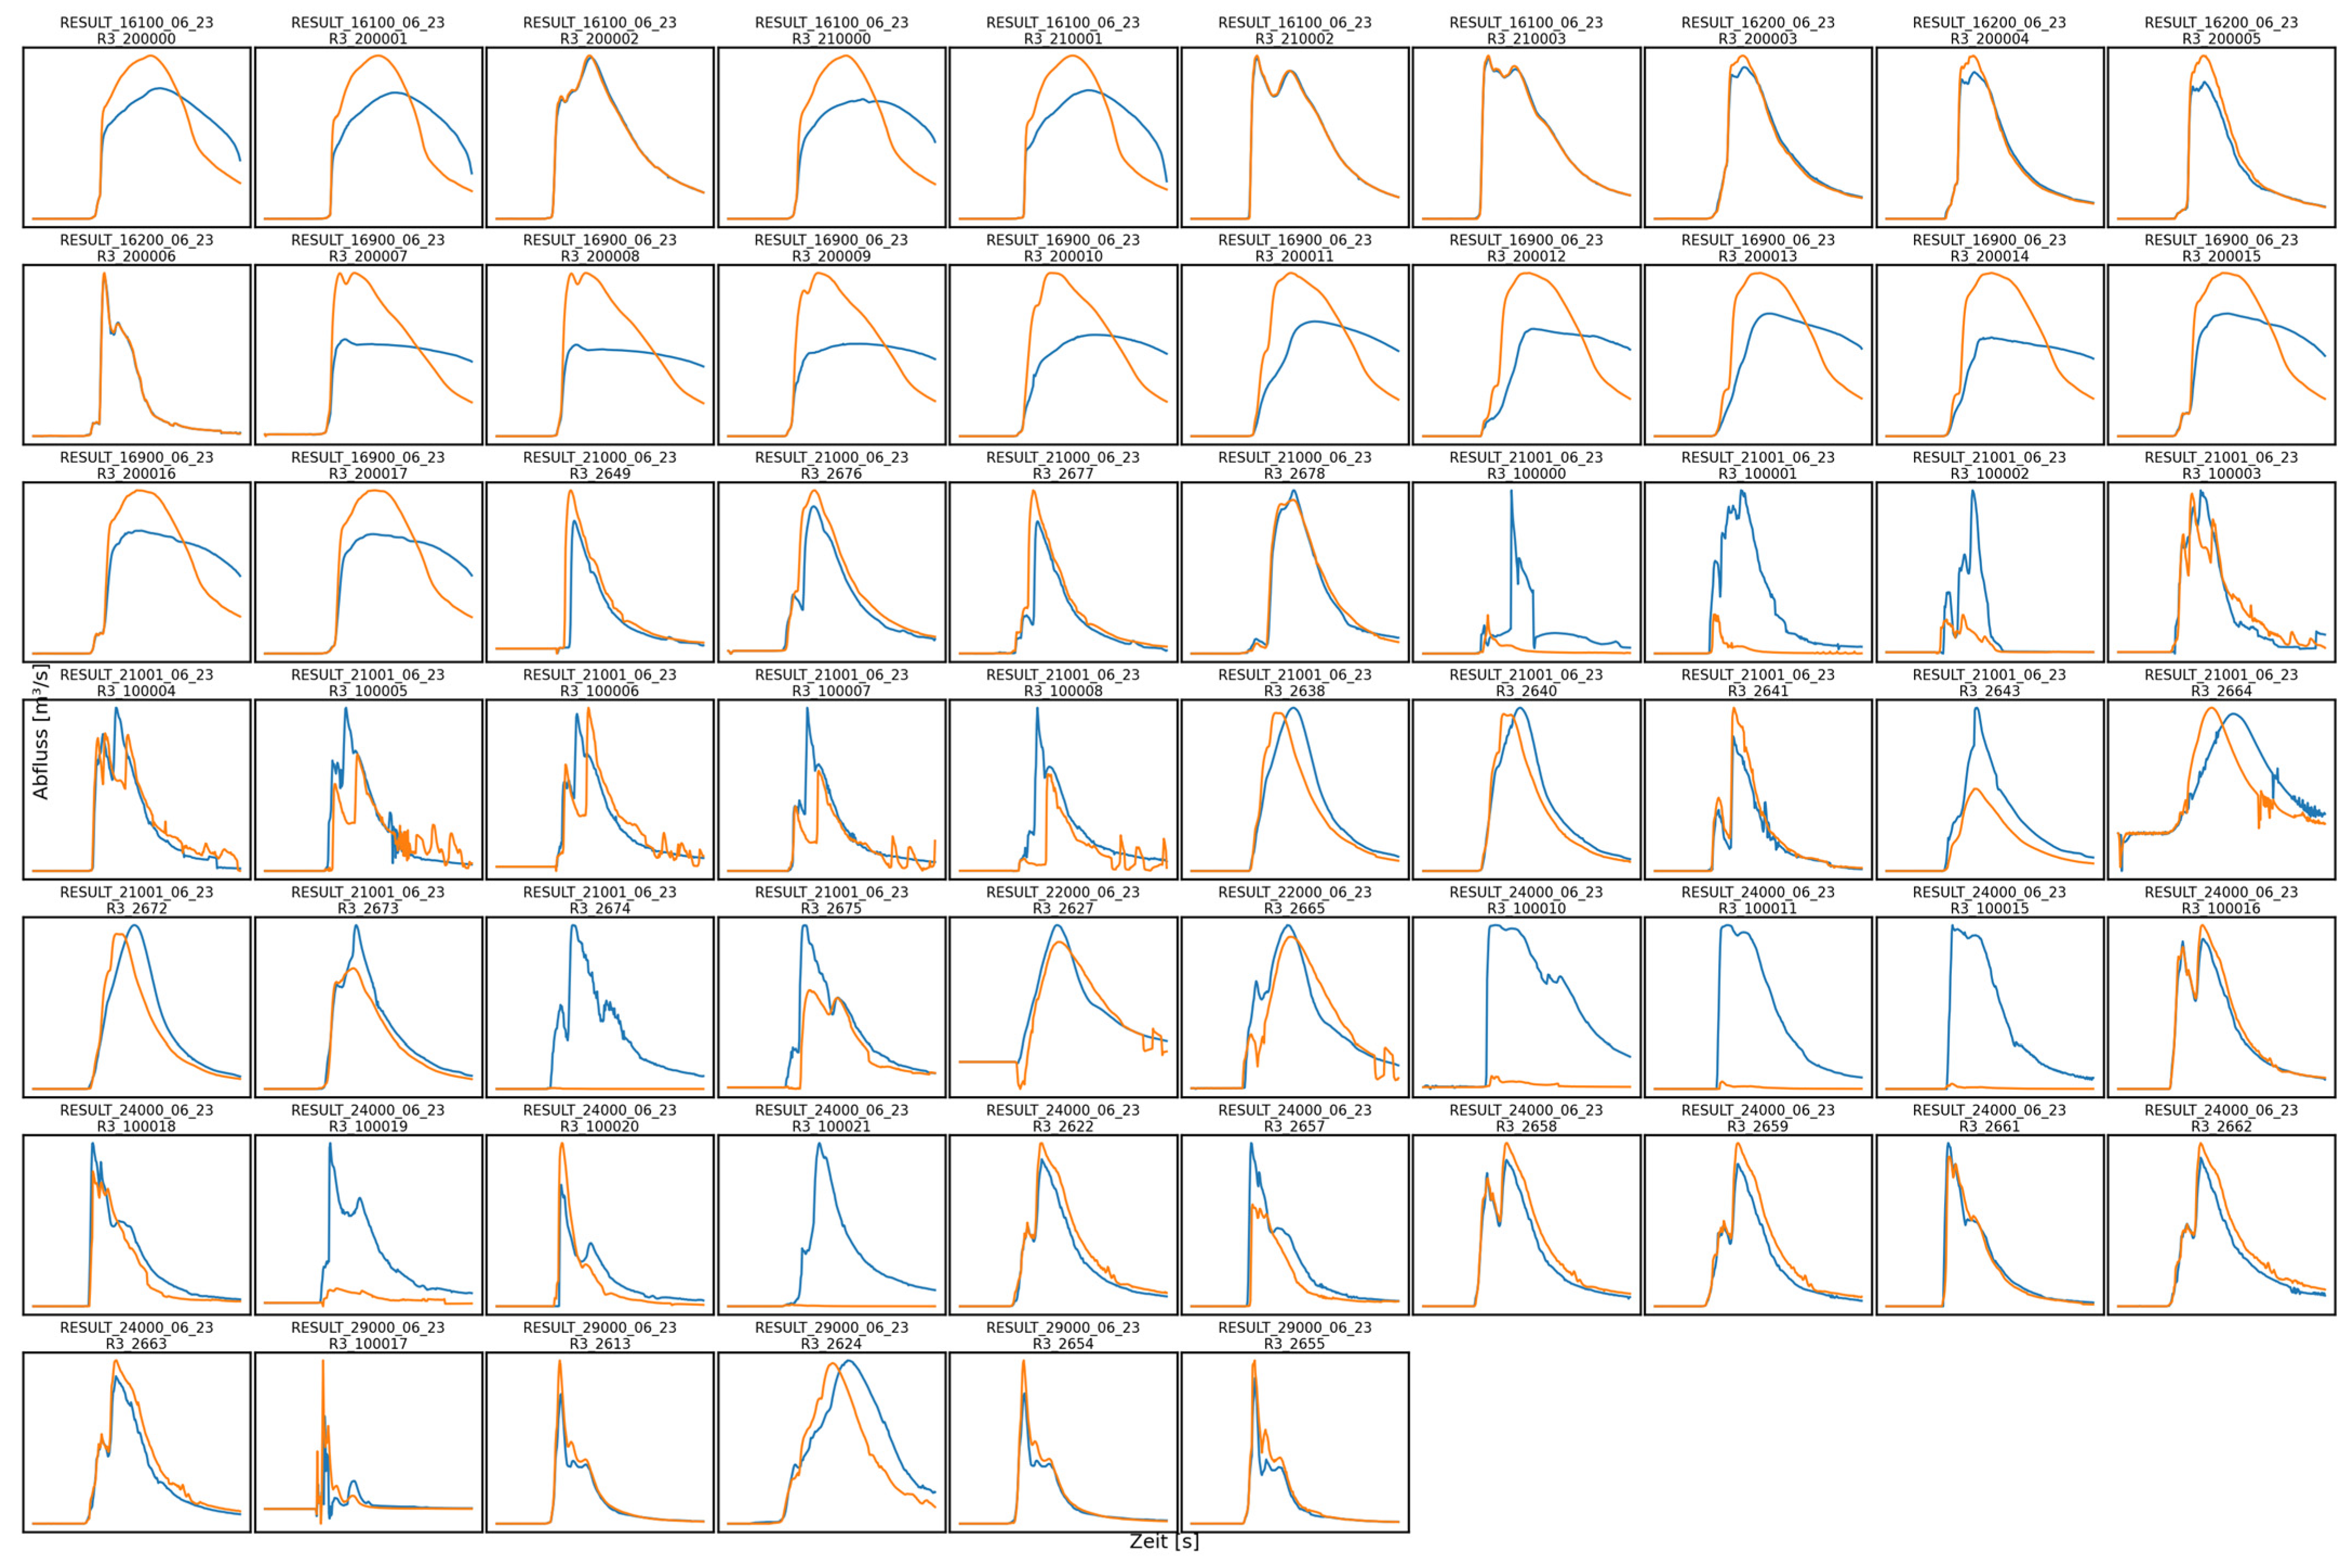
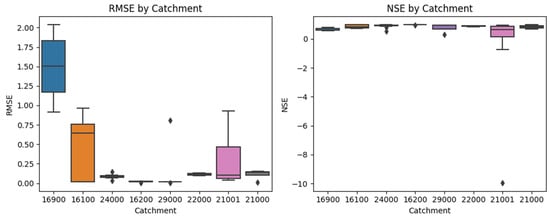
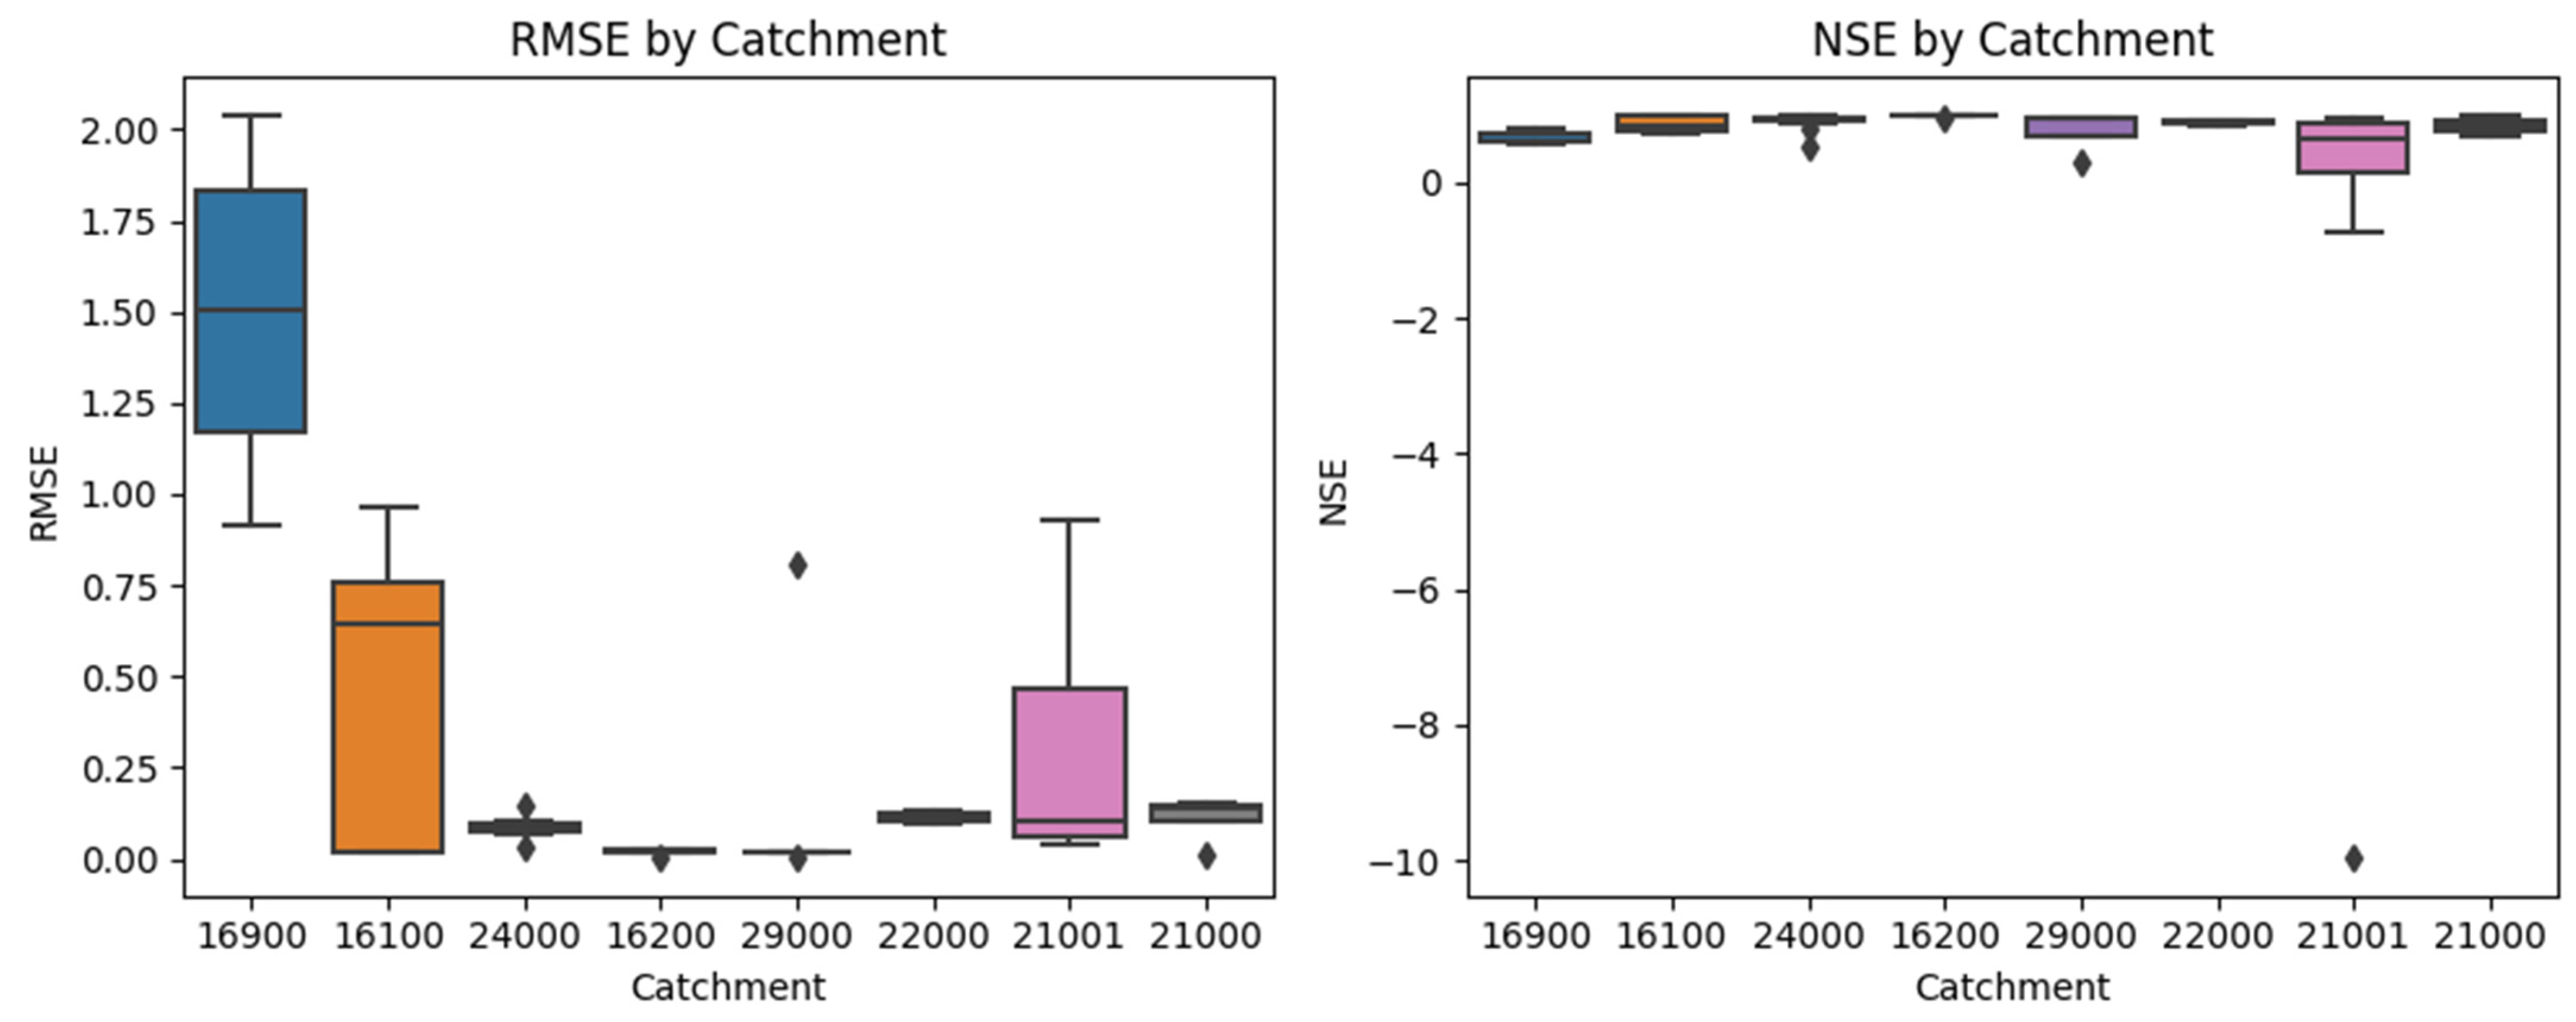
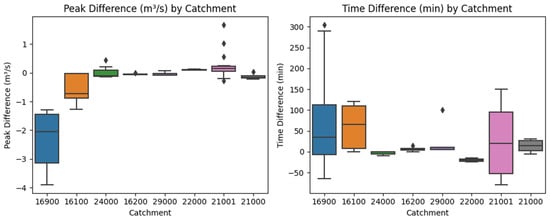
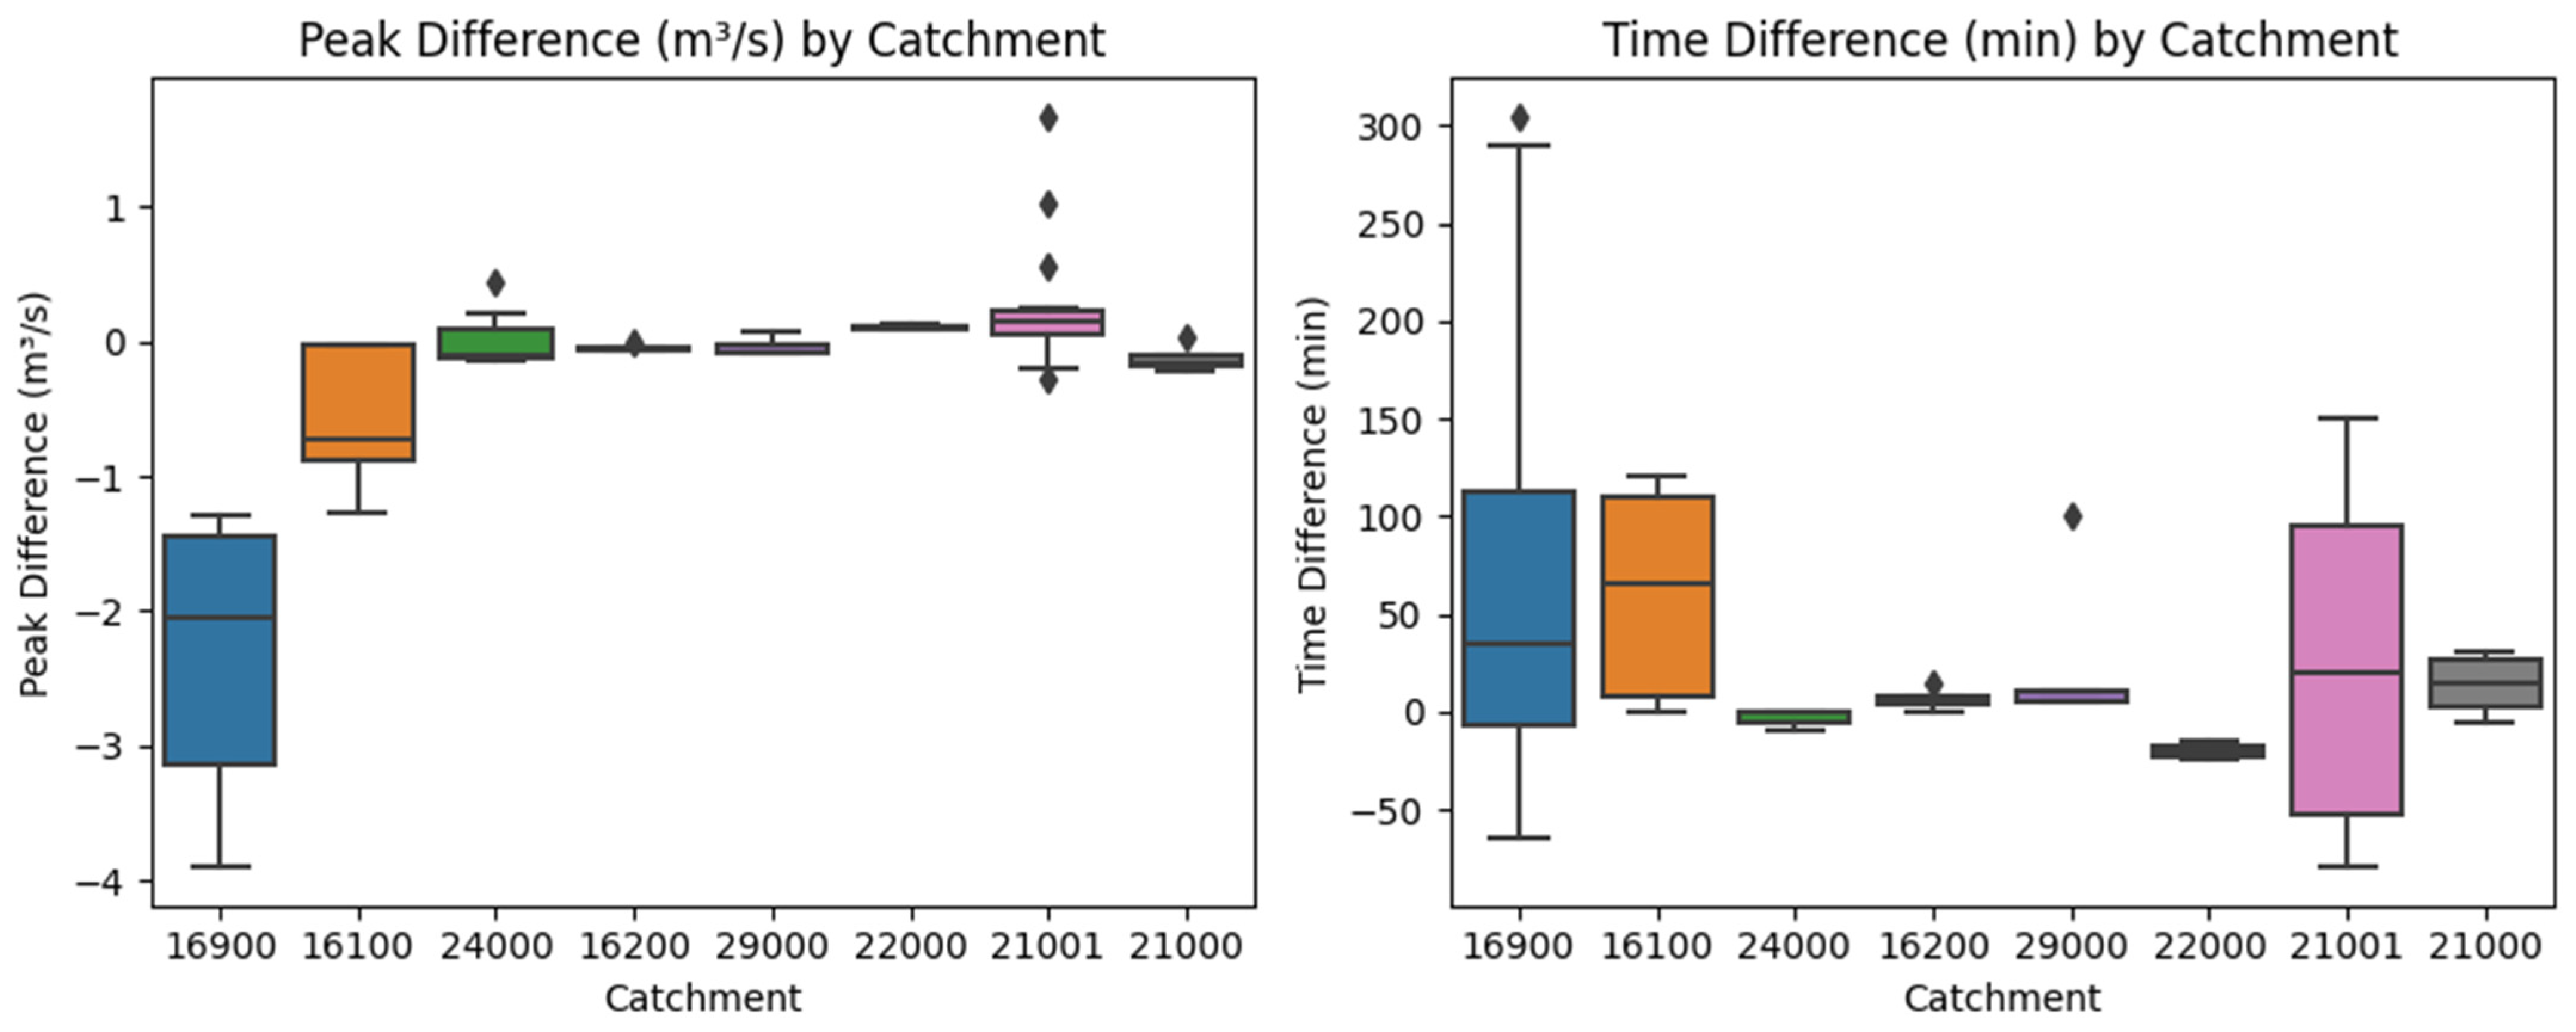
Figure 10 and Figure 11 (and Figure A1 in the Appendix A) show the results using Nash–Sutcliffe efficiency (NSE), root-mean-square error (RMSE), and differences in peak discharge magnitude and timing. These metrics were calculated pairwise for the same gauge locations, comparing simulated hydrographs from the open and closed configurations.
Figure 10.
RMSE and NSE differences between open and closed configurations, grouped by sub-catchment. (21000, 22000, 24000, 21001, and 29000 = Rossbach system; 16000, 16200, and 16900 = Ruepingsbach).
Figure 11.
Absolute differences in peak discharge (m3/s) and peak timing (min) between open and closed hydrographs by sub-catchment. (21000, 22000, 24000, 21001, and 29000 = Rossbach system; 16000, 16200, and 16900 = Ruepingsbach).
The boxplots show the distribution of metric values across all culvert and bridge locations. In most cases, the differences between setups were non-negligible, with RMSE values indicating changes in both peak magnitude and hydrograph shape. Peak timing differences ranged up to >300s, while peak discharge deviations reached ~3.9 m3/s. The interquartile ranges demonstrate that some structures exert only minor influence, while others cause pronounced differences between the two setups. Sub-catchments 21000, 22000, 24000, 21001, and 29000 belong to the Rossbach system, while all remaining sub-catchments 16000, 16200, and 16900 are part of the Ruepingsbach system.
Selected hydrographs illustrate these findings in more detail (Figure 12):
- Culvert/bridge 2673 (Sub-catchment 21001): Both setups reproduced similar rising limbs, but the closed configuration showed a sharper peak and slower decline, reflecting the influence of hydraulic constriction.
- Culvert/bridge 100019 (Sub-catchment 24000): The difference was extreme, with the open run yielding almost no discharge, while the closed configuration generated a distinct peak of ~0.45 m3/s. This highlights the inability of DEM cut-throughs to reproduce conveyance capacity at this site.
- Culvert/bridge 2624 (Sub-catchment 29000): The closed run produced a lower and delayed peak compared to the open run, with a smoother recession limb. The open setup overestimated the peak discharge and underestimated the duration of elevated flows.
- Culvert/bridge 200002 (Sub-catchment 16100): Here, both setups showed similar peak magnitude and timing, with only minor differences in the falling limb, indicating limited structural influence at this location.
- Culvert/bridge 200014 (Sub-catchment 16900): The divergence was most pronounced: the open setup produced a sharp peak of nearly 6 m3/s, while the closed configuration attenuated this to ~3.5 m3/s and extended the recession phase.
Figure 12.
Simulated discharge hydrographs (R3 calibration) comparing open (orange) and closed (blue) setups at five locations: culvert/bridge 2624 (29000), culvert/bridge 2673 (21001), culvert/bridge 100019 (24000), culvert/bridge 200002 (16100), culvert/bridge 200014 (16900).
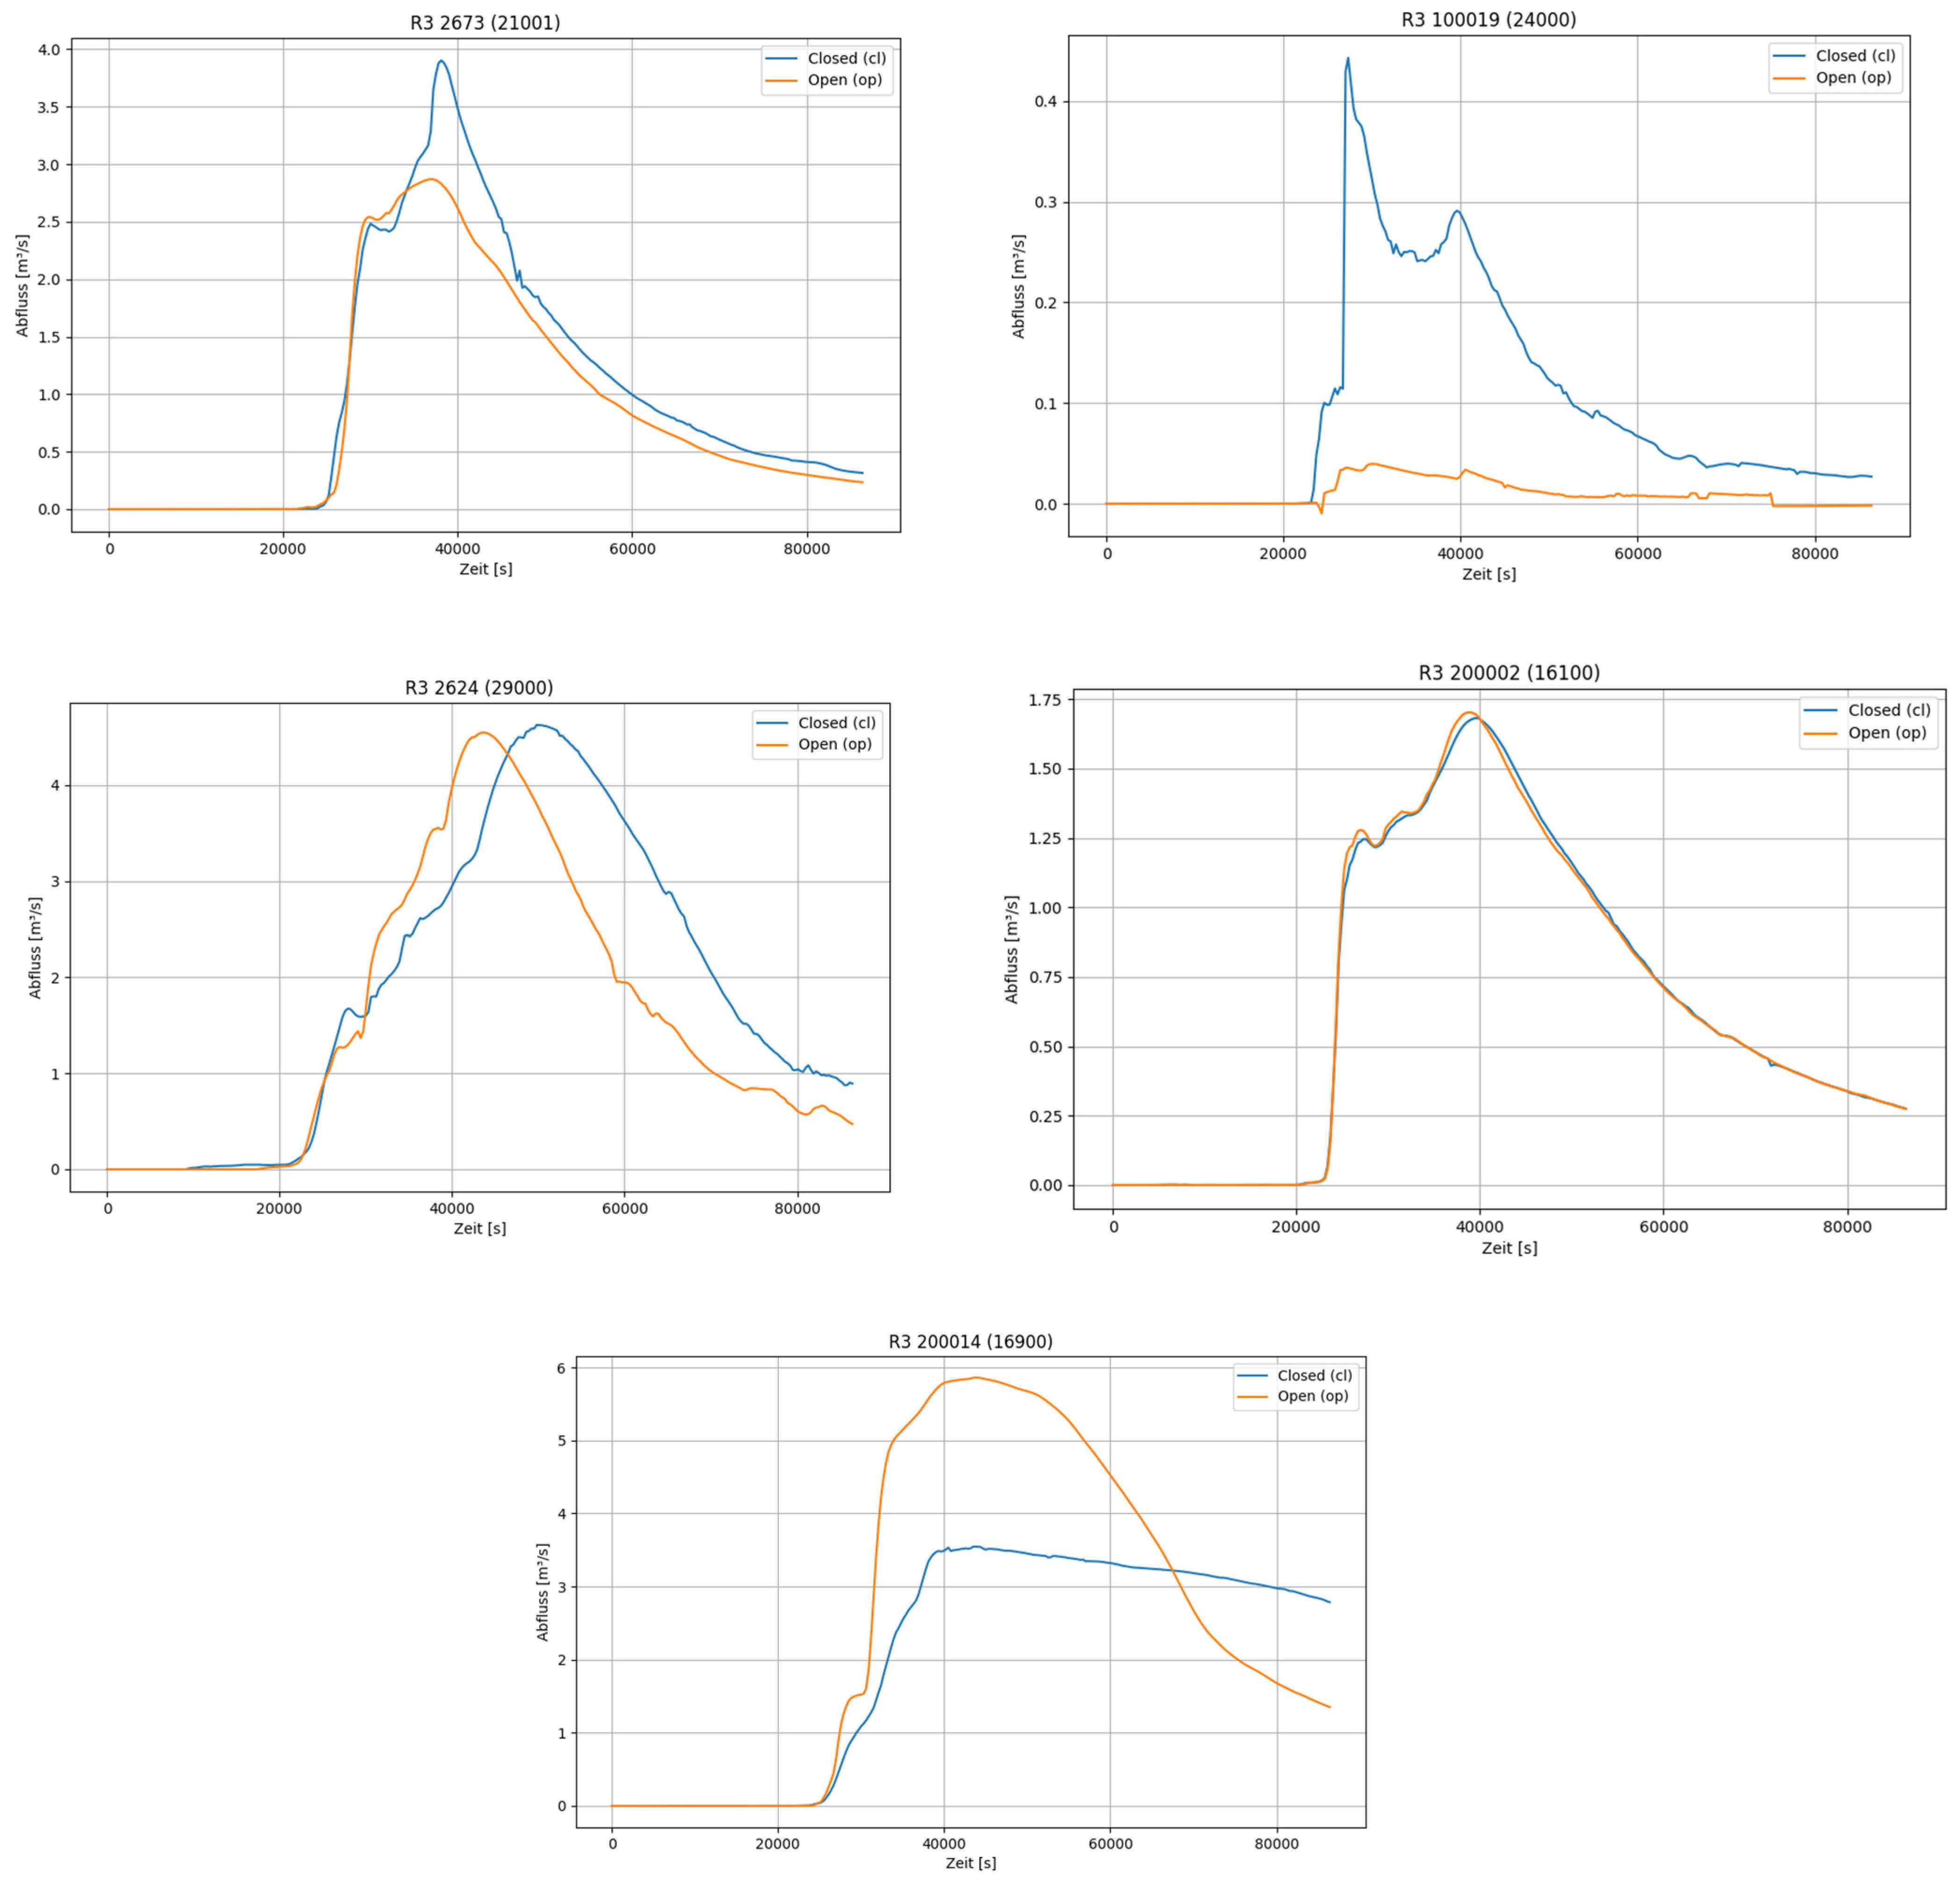
In summary, the boxplot analysis and individual hydrograph comparisons show that how culverts and bridges are represented has a clear and sometimes significant impact on model results. While in some areas the difference is small, in others, choosing between open DEM cut-throughs and explicit culvert modelling fundamentally alters hydrograph shape, peak levels, and timing.
4.3. Effect of Retention Basins, Pumping Stations, and Antecedent Moisture Conditions
The results of Section 4.1 demonstrate that calibration and structural representation alone were not sufficient to reproduce the observed flood response at Rossbach. Even the refined R3 variants still showed clear trade-offs between peak magnitude, timing, and event volume. To address these remaining discrepancies, retention basins and pumping stations were added to the model (R3+QP1), and the resulting system response was evaluated under three antecedent moisture conditions (AMC I–III). This comparison reveals a pronounced sensitivity of model performance to prior wetness despite identical rainfall forcing and unchanged operational control rules.
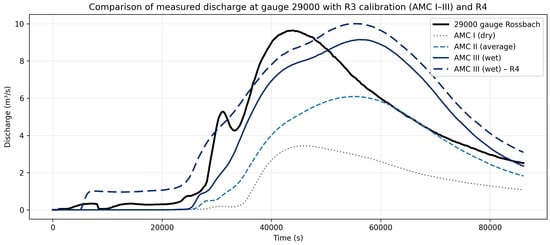
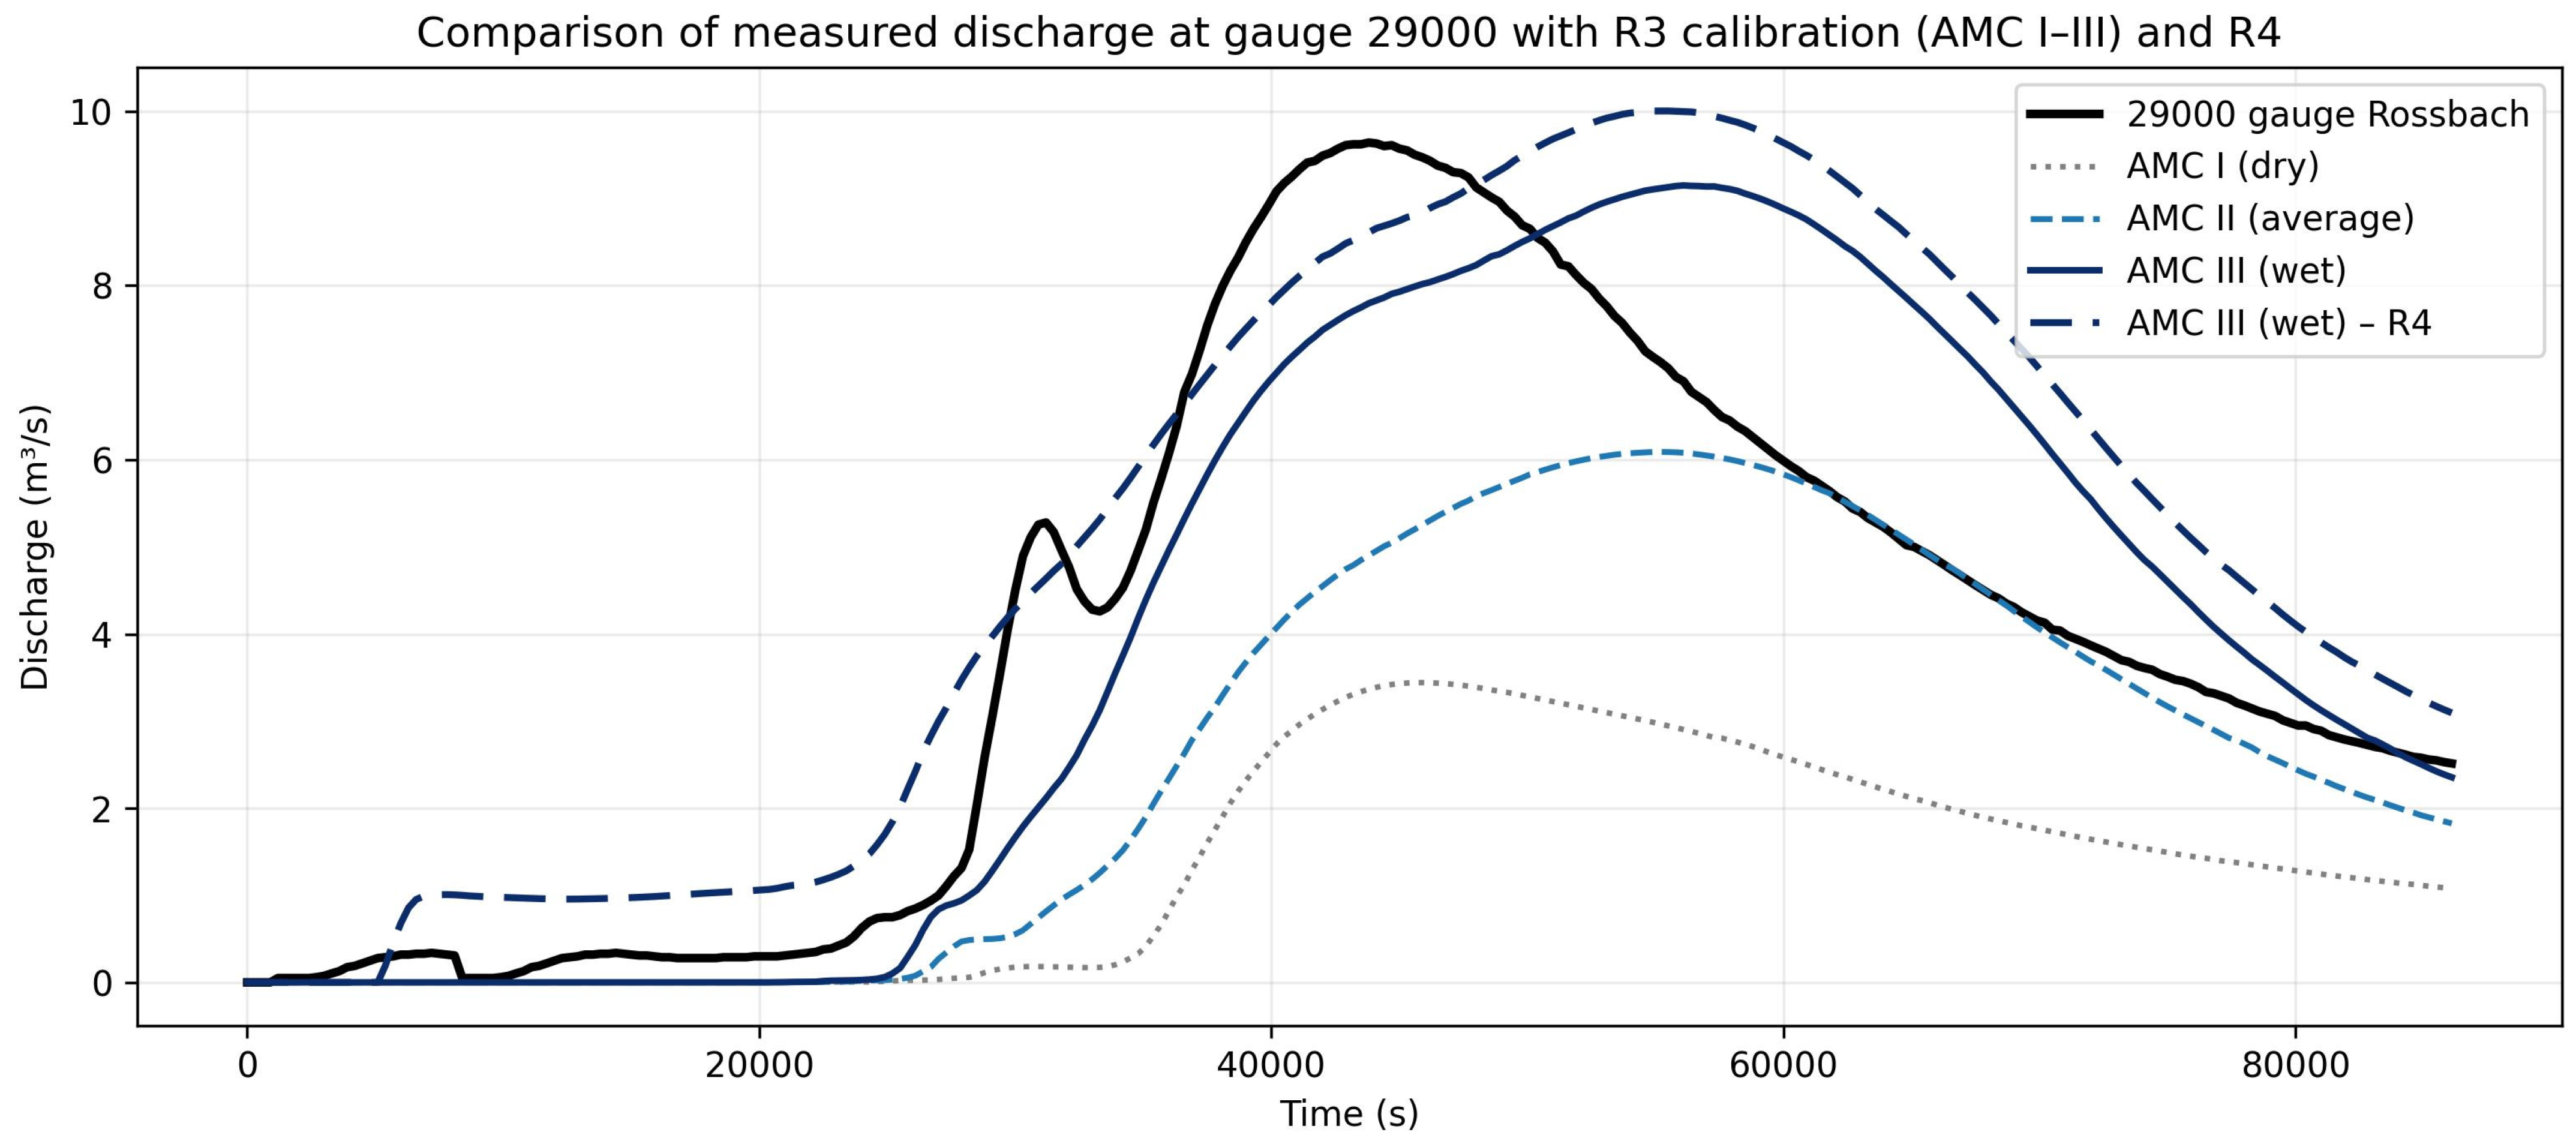
Figure 13 and Table 5 compares the observed discharge hydrograph with simulated responses under dry (AMC I), average (AMC II), and wet (AMC III) soil moisture conditions for the R3+QP1 configuration. The simulations reveal a clear sensitivity to antecedent wetness despite identical rainfall forcing and unchanged operational control rules. Under dry conditions (AMC I), the hydrograph peak is significantly underestimated, and the event volume is notably too low (peak error −6.198 m3 s−1; volume bias −0.664), while the peak occurs slightly earlier than observed (peak timing error 0.583 h). Overall model performance remains modest, as indicated by an NSE of −0.129 and an RMSE of 3.380 m3 s−1. The negative NSE value under AMC I indicates poor model skill, as the simulated hydrograph reproduces the observed event less accurately than a benchmark based on the mean observed discharge and reflects the strong underestimation of both peak magnitude and event volume under dry initial conditions.
Figure 13.
Simulation run R3 with integrated retention basin and pumps for dry (AMC I), average (AMC II), and wet (AMC III) soil moisture conditions. The additional R4 simulation represents an AMC III (wet) configuration with targeted routing calibration and is, therefore, labelled separately from the R3 AMC III run.
Table 5.
Calculated evaluation metrics for gauge 29000 (Rossbach) in the R3+QP1 scenario (+ AMC III R4) under various AMC conditions.
Under average conditions (AMC II), overall agreement improves compared to AMC I (NSE 0.551; RMSE 2.131 m3 s−1), and the peak underestimation decreases (peak error −3.550 m3 s−1). However, the simulated peak remains significantly delayed relative to the observation (peak timing error +3.167 h), and the event volume is still underestimated (volume bias −0.336), indicating that antecedent wetness alone does not consistently resolve timing and storage–release dynamics.
The wet scenario (AMC III) demonstrates the best overall performance across metrics. It achieves the highest NSE (0.773) and the lowest RMSE (1.515 m3 s−1), with only a minor peak underestimation (peak error −0.492 m3 s−1) and an almost balanced event volume (volume bias +0.038). However, the peak timing remains delayed by several hours (peak timing error +3.417 h), indicating that while higher antecedent wetness significantly enhances magnitude and volume representation, residual timing offsets still persist even with the infrastructure-augmented setup.
4.4. Effect of Targeted Routing Calibration (R4)
To further address the remaining temporal mismatch in peak discharge identified in the AMC III scenario, an additional calibration run (R4) was performed using the refined R3 parameter set. In contrast to previous calibration steps, R4 focused exclusively on flow routing efficiency by selectively adjusting Manning’s roughness coefficients in dominant transport corridors while retaining the antecedent moisture condition (AMC III) and the overall surface parameterisation.
Figure 13 includes the observed discharge hydrograph at gauge 29000 with the simulated responses for the R3 calibration under AMC I–III conditions and the additional R4 run. In the R3 AMC III configuration, the R4 simulation shows a clear shift in the hydrograph towards earlier peak timing, while maintaining a comparable overall shape. The rising limb becomes steeper, and the peak occurs closer to the observed timing, indicating an acceleration of wave propagation through the urban drainage network.
Quantitative performance metrics for the R4 run are summarised in Table 4. Compared to the R3 AMC III scenario, the peak timing error is reduced, while the peak magnitude slightly exceeds the observed value (peak error +0.36 m3 s−1). The overall model skill remains high, with an NSE of 0.69 and an RMSE of 1.79 m3 s−1. The event volume is overestimated in the R4 configuration (volume bias of +0.29), reflecting an increase in effective hydraulic connectivity due to the reduced routing resistance.
Overall, the R4 calibration results demonstrate that targeted adjustments of routing-related roughness parameters can substantially influence hydrograph timing and peak development without altering the underlying runoff generation processes. This additional calibration step, therefore, provides a complementary improvement to the AMC III configuration by further reducing temporal discrepancies between simulated and observed flood responses.
5. Discussion
5.1. Implications for Calibration and Validation
The progression from R1 to R3 confirms that calibration of Curve Numbers and Manning’s n influences hydrograph shape, runoff volume, and peak development, but it also demonstrates the limits of calibration-only approaches in highly engineered urban catchments. This is consistent with previous studies showing that urban flood simulations remain sensitive not only to land-surface parameterisation but also to structural representation and boundary realism [6,12,16,22]. In the present study, improvements in calibration metrics did not eliminate persistent discrepancies in peak discharge, timing, and recession behaviour, indicating that remaining errors cannot be attributed to surface parameterisation alone.
The representation of hydraulic structures influences model accuracy. Incorporating structures explicitly, such as culverts and bridges, improves peak flow and rising-limb predictions by simulating real-world delays. Open configurations, where structures are modelled as depressions, allow for faster flow, whereas closed setups, which create backwater effects, align more closely with actual conditions. These results highlight the hydraulic importance of structural details, especially in urban or complex terrains [6,22].
The consistent underestimation of total volume indicates the omission of runoff components. In TEZG 29000, the absence of modelled pumping infrastructure likely led to volume deficits since real pumps remove water and delay peaks. Excluding this component reduces the model’s ability to simulate late-stage hydrograph features accurately.
Subsurface processes, such as interflow, also play a significant role, but are not represented in TELEMAC-2D’s surface-based, CN-derived setup. This omission may explain the observed rapid recession curves, even in the optimal R3_CL case.
Increasing n-values improved water retention, but some land use types, notably urban areas with mixed surfaces or riparian zones with high roughness, remain under-represented. A more detailed parameterisation could better capture hydrodynamic feedback across different surfaces.
The additional R4 calibration further illustrates the limitations of surface-based parameter adjustment when peak timing discrepancies persist under saturated conditions. By selectively reducing Manning’s roughness in dominant transport corridors while keeping antecedent moisture and runoff generation unchanged, the R4 run demonstrates that hydrograph timing is highly sensitive to effective routing resistance. Although peak timing improves compared to the R3 AMC III configuration, this comes at the cost of increased discharge volumes and partial peak overestimation. This highlights that manual roughness calibration can compensate for missing conveyance pathways only to a limited extent and risks conflating routing effects with runoff generation processes if applied beyond physically plausible bounds.
Ultimately, model accuracy depends on hydrological and hydraulic enhancements: explicit infrastructure modelling, inclusion of lateral flows, and refined land use roughness parameters. These improvements would enhance volume estimates, timing, peak predictions, and retention, especially during extreme rainfall events.
The automatisation of calibration processes is increasingly recommended to address the complexity and high dimensionality of urban flood models. Automated approaches, for instance, through optimisation algorithms, multi-objective calibration frameworks, or machine learning–based parameter tuning, enable a more systematic exploration of parameter space and reduce subjectivity in manual calibration. Such methods improve reproducibility, accelerate the calibration workflow, and enhance model robustness across a wide range of hydrological conditions. It is necessary to avoid overfitting during optimisation and maybe set a sensible threshold for parameters. In particular, automated calibration based on a data assimilation algorithm can help capture nonlinear interactions between land-surface parameters, drainage components, and hydraulic infrastructure, which is essential for reliable flood forecasting and scenario-based stress testing [26].
Beyond parameter calibration through Curve Numbers and roughness coefficients, flood model validation in urban areas also benefits from spatial comparison with observed inundation extents. Especially in settings lacking reliable gauge data, orthophotos, hazard maps, social media data, or reports of affected infrastructure can provide valuable references. These spatial benchmarks help detect mismatches between modelled and actual flood extents [16], particularly in morphologically challenging areas where microtopography, building density [15] or unaccounted drainage components strongly influence flow patterns [13].
Beyond calibration against discharge and water-level observations, urban flood model evaluation would benefit from spatial validation using observed inundation extents, post-event water marks, orthophotos, hazard maps, or documented reports of affected infrastructure. Such spatial benchmarks can help identify mismatches in flood extent and flow routing that are not captured by hydrograph-based performance metrics alone. For the present study, no consistent independent flood-extent dataset was available for systematic quantitative comparison for the analysed event, which should be considered a limitation of the current validation approach.
In such cases, spatial validation complements hydrograph-based calibration by addressing not only the volume and timing of discharge but also the geographic accuracy of flood propagation. This is particularly important in anthropogenically altered environments where terrain and land use changes are often under-represented in DEMs. Integrating both point-based and area-based validation strategies can thus enhance model robustness, especially for short-duration, high-intensity urban flood events.
5.2. Representation of Buildings and Urban Flow Constraints
Using buildings as flow-relevant obstacles via the building-block method effectively captures how urban structures influence hydrodynamics in the TELEMAC-2D model. In dense residential and industrial areas, buildings significantly change local flow patterns, especially during pluvial flood scenarios. Assigning buildings as impermeable polygons above ground level allows the simulation to show key effects like lateral flow diversion, formation of preferred pathways (such as streets), and temporary pooling in urban depressions. These effects, crucial for localised flooding analysis, cannot be fully represented by terrain data alone, especially when high-resolution LiDAR simplifies building footprints or overgeneralises vertical features.
The impact of buildings is most evident in areas with complex infrastructure and low gradients, where lateral flow restrictions and frictional variations govern runoff. Ignoring building effects here results in unrealistic flood extent and depth estimates and misplacement of flow accumulation zones. Thus, the building-block method enhances not just flow velocity representation but also the spatial distribution of flood impacts. Nevertheless, some limitations remain. Treating buildings as fully impermeable ignores partial permeability features like basements or open courtyards, and neglects building-specific resistance factors such as staggered facades or ventilation gaps. The lack of explicit drainage pathways, like curb-and-gutter systems or underground sewer pipes, reduces realism in subsurface, surface interactions, which are crucial in urban flood dynamics. Additionally, representing building-induced blockage without modelling vertical connectivity can overestimate restrictions in structures like bridges or passageways, causing artificial ponding and flow diversion.
Future improvements could include hybrid models that combine the building-block approach with semi-permeable wall representations, resistance layers, or coupled sewer flow modules. Incorporating open data and building metadata, such as ground floor elevation, footprint type, and usage, can further improve the hydraulic accuracy of urban flood simulations.
5.3. Implications of Culvert Representation in Urban Flood Modelling
The results in Section 4.2 highlight the importance of explicitly including culverts and bridges in hydrodynamic flood modelling frameworks. Improvements in statistical performance measures, such as peak timing, hydrograph shape, RMSE, and NSE, demonstrate the hydraulic significance of these structures at both local and catchment levels. The findings align with previous studies such as Ah-Woane et al. [17], which emphasise the role of culverts and bridges as key flow control elements during high-intensity events.
The observed differences can be explained by two methodological factors. First, DEM cut-throughs involve arbitrary choices for incision width and depth, which often do not accurately reflect actual conveyance capacity. Second, although TELEMAC-2D’s culvert routines allow for explicit parameterisation, their effectiveness depends on input accuracy and the flow regime; simplified 1D assumptions may still cause deviations. These limitations highlight the importance of cautious interpretation of structure-related improvements.
Sensitivity varied across the study area. In infrastructure-dense, low-gradient sub-catchments such as 21001 and 24000, explicit structures fundamentally changed hydrograph dynamics, shifting peaks, extending recession limbs, and reproducing multi-peak responses that were absent in the open setup. In contrast, steeper or hydraulically simpler regions (e.g., 22000 and 29000) exhibited only moderate sensitivity, as topographic gradients mainly controlled flow routing. Nevertheless, even in these areas, including structural features improved timing accuracy and decreased simulation spread, which is helpful for short-lead-time forecasts.
Overall, the results confirm that DEM-based cut-through approaches are inadequate for capturing the dynamic behaviour of infrastructure-constrained flow paths. In urban and peri-urban catchments, ignoring culvert hydraulics can systematically underestimate upstream water levels and overstate downstream discharges, resulting in distorted hazard maps, biased design discharges, or poorly informed protection plans.
Future modelling should, therefore, incorporate culvert inventories more systematically, supported by detailed structural attributes and blockage susceptibility assessments. Implementing blockage scenarios, whether probabilistically or deterministically, would further improve robustness during extreme events. Additionally, interactions between culvert performance, upstream land use, and temporal rainfall patterns require deeper investigation, especially in small, fast-responding urban catchments.
5.4. Implications for Retention Basins and Pumping Stations
The comparison of hydrograph responses across different modelling configurations shows that the effectiveness of flood mitigation infrastructure depends not only on its structural design but also, crucially, on the implementation of realistic operational logic. While refined surface parameterisation and structural integration enhance specific hydrograph characteristics, they do not fully capture the system behaviour of infrastructure-led urban catchments. This becomes particularly evident under saturated antecedent conditions (AMC III), where discharge magnitude and event volume can be reproduced with high skill, yet a persistent peak lag remains. This indicates that fast conveyance pathways typical of dense urban drainage are still under-represented when the sewer system is simplified.
Although the R3_CL calibration series improves peak timing and hydrograph shape through better land use parameterisation and explicit representation of culverts and bridges, it consistently underestimates total discharge volumes. This systematic shortfall indicates that surface-based calibration alone is insufficient in urban settings where internal drainage mechanisms, such as controlled storage, pumping, and rapid conveyance through the minor drainage network, regulate not only late-stage runoff dynamics and recession behaviour but also the timing of the rising limb and peak.
The explicit inclusion of retention basins and pumping stations (Figure 13) fundamentally changes the simulated hydrograph response. Retention basins reduce peak discharges by temporarily storing runoff, while pumping stations redistribute discharge over time by delaying the return to baseflow. As a result, hydrograph volumes increase, and recession limbs become smoother and more realistic. These effects are especially noticeable under different antecedent moisture conditions, emphasising the importance of system state in determining infrastructure efficiency. However, while retention and pumping strongly shape volumes and recession behaviour, they do not necessarily eliminate peak timing biases if upstream runoff conveyance remains dominated by surface routing due to simplified sewer representation. In low-lying urban areas where gravity-driven drainage is limited, such operational controls play a key role in flood management.
The targeted routing calibration applied in the R4 run further supports this interpretation. Despite the inclusion of retention basins and pumping stations, a residual peak delay under AMC III conditions persisted, prompting a selective reduction in surface roughness in high-connectivity zones. The resulting improvement in peak timing confirms that rapid conveyance through the minor drainage network remains under-represented when sewer processes are simplified. At the same time, the associated increase in event volume demonstrates that routing-focused roughness adjustments alone cannot substitute for explicit representation of sewer–surface exchange and fast transport pathways without introducing structural bias.
Importantly, the results indicate that pumping station performance is highly sensitive to the chosen operational scheme. Simplified activation rules based solely on local surface water presence (e.g., node-based thresholding) can misrepresent discharge dynamics, particularly under saturated conditions (AMC III). In contrast, implementing pumping behaviour using discharge–head relationships derived from real infrastructure specifications significantly enhances model performance. This method more accurately reflects real-world operational practices, where pumping may commence proactively or continue beyond local surface flow conditions to safeguard downstream infrastructure and uphold system functionality. In practical terms, operational realism improves how much water is released and how long drainage persists, whereas peak timing also depends on how fast runoff reaches control points, an aspect that is strongly influenced by surface–sewer connectivity and transport capacity.
From a flood risk management perspective, these findings are highly significant. Ensuring operational realism in model configurations is crucial when simulations support real-time decision-making, early warning systems, or emergency response planning. Poor representation of pumping logic can result in overestimated surface ponding, delayed forecasts, or an underestimation of peak mitigation capabilities, thereby diminishing the reliability of model-based risk assessments.
Furthermore, the strong interaction between antecedent moisture conditions and pumping effectiveness emphasises the need for scenario-based stress testing. Under saturated catchment conditions, even minor differences in pump activation thresholds or control curves can cause significant changes in peak attenuation, hydrograph timing, and flood extent. This underlines the importance of assessing operational infrastructure not just under isolated design conditions but across a variety of plausible system states.
In summary, this research shows that realistic urban flood modelling requires both structural and operational accuracy. Retention basins and pumping stations must be represented not just geometrically but also functionally, using system-specific operational rules that mirror real-world management practices. Such dual-level integration is vital for producing robust, physically consistent simulation results that can inform risk-based flood management and scenario-driven resilience assessments in urban settings.
These findings also affect transferability. Parameter sets that perform well in one sub- catchment may not directly generalise to neighbouring basins if surface parameters implicitly compensate for local drainage connectivity. Improving the functional representation of the minor drainage system, through tighter coupling or reduced-order sewer–surface exchange, should increase parameter identifiability and, thereby, support more robust transfer of calibrated configurations to adjacent urbanised sub-catchments.
6. Conclusions
This study shows that urban flood modelling in highly engineered catchments needs a level of realism that goes beyond traditional surface-based calibration. While adjustments to Curve Numbers and Manning’s roughness coefficients improve the overall shape of simulated hydrographs, they cannot, by themselves, fix key process limitations in infrastructure-rich urban catchments. In particular, remaining peak timing biases under saturated initialisation (AMC III) suggest that parameter refinement cannot replace missing or simplified internal drainage and conveyance processes. These findings demonstrate that parameter calibration alone cannot fully capture the interactions between hydrological states and engineered urban systems, where drainage connectivity, operational controls, and routing constraints jointly influence hydrograph magnitude, recession behaviour, and peak timing.
Explicit representation of hydraulic structures, especially culverts and bridges, proved crucial for accurately simulating flood routing and timing. In several sub-catchments, the difference between simplified DEM cut-through methods and structure-aware modelling was not just minor but fundamental. DEM-based simplifications either suppressed discharge peaks or generated unreal flow patterns, whereas explicit culvert modelling captured attenuation effects, delayed responses, and multi-peak hydrographs that better reflect observed system behaviour. This underscores the importance of structure-aware modelling in representing hydraulic constraints and flow diversions in urban settings.
Equally important was the integration of retention basins and pumping stations. The results indicate that flood dynamics in lowland urban catchments cannot be accurately simulated without considering how such infrastructure functions. Simulations based solely on geometric representation consistently underestimated event volumes and distorted recession behaviour. In contrast, employing rule-based discharge–head relationships that reflect real operational practice significantly enhanced the accuracy of peak flows, drawdown phases, and overall hydrograph consistency. However, the remaining peak lag observed under AMC III suggests that accurate operational release alone is insufficient when rapid conveyance through the minor drainage system is implicitly represented. This confirms that operational realism, rather than geometric detail, is a crucial factor in determining the credibility of models in engineered river systems.
The additional R4 calibration step reinforces this conclusion by demonstrating that further improvements in peak timing can be achieved through targeted routing adjustments, but only at the expense of increased volume bias. This confirms that surface roughness calibration can partially compensate for missing fast conveyance pathways, yet it cannot fully replace explicit representation of the minor drainage system. Consequently, improvements achieved through routing-focused parameter tuning should be interpreted as indicative of structural model deficiencies rather than as transferable calibration solutions.
The strong interaction between infrastructure performance and antecedent moisture conditions highlights the nonlinear character of urban flood response. Saturated catchment states increase runoff production and significantly modify the effectiveness of pumping and retention systems, while drier conditions cause delayed peaks and lower volumes. These results show that hydrological initialisation is a crucial system state variable and must be explicitly considered when evaluating urban flood hazards and resilience under complex event scenarios.
Taken together, the R4 results indicate that remaining peak timing errors under saturated conditions are not primarily a calibration issue but a structural one, underscoring the need for explicit or reduced-order representations of fast urban conveyance pathways.
Several limitations persist. Sewer surcharge processes were approximated using abstraction terms; subsurface contributions were not explicitly represented, and culvert and bridge blockages were not considered. These simplifications introduce uncertainty and may bias estimates of flood extent, peak attenuation, and local inundation patterns. Addressing these gaps will require closer integration with sewer models (or a simplified dual-drainage approach for inlet exchange, conveyance, and surcharge), systematic inclusion of blockage scenarios, and, where applicable, combined surface–subsurface approaches supported by detailed infrastructure inventories and operational data.
In conclusion, this study shows that reliable urban flood modelling depends on the integrated representation of hydrological states, hydraulic structures, and operational controls within a unified modelling framework. Transfer to neighbouring sub-catchments is most effective when surface parameterisation correlates with observable land use characteristics and rainfall forcing is similar; it becomes less dependable when calibration is used to account for local drainage connectivity, highlighting the importance of dual-drainage representation for regionalisation. By moving from parameter calibration to structural and operational accuracy, TELEMAC-2D rain-on-grid modelling provides a more credible basis for hazard mapping, risk-informed design, early warning, and scenario-based stress testing of urban water systems. At the same time, the complex nature of urban catchments underscores the importance of scenario-based simulations as a critical area for research and practical application. Such methods enable exploration of compound and cascading conditions, support uncertainty-aware decision-making, and help bridge the gap between scientific modelling and operational flood risk management, especially when drainage connectivity and control logic are represented with sufficient structural fidelity to facilitate transfer across neighbouring urban catchments.
Author Contributions
Conceptualization, J.R.; methodology, J.R., C.B. and J.H.; software, J.R.; formal analysis, J.R.; investigation, J.R.; data curation, J.R.; writing—original draft preparation, J.R.; writing—review and editing, J.H., A.A. and C.B.; visualization, J.R.; supervision, C.B.; project administration, C.B.; All authors have read and agreed to the published version of the manuscript.
Funding
This research was funded by the Interreg North-West Europe Programme through the FlashFloodBreaker project (project ID NWE0200167), co-funded by the European Regional Development Fund (ERDF).
Data Availability Statement
The original contributions presented in this study are included in the article. Further inquiries can be directed to the corresponding author.
Acknowledgments
We gratefully acknowledge Edwin Baumtrog for developing the source code and for his continuous technical support with TELEMAC-2D. We also thank Bernd Böckmann and Valentin Meincke for their ongoing assistance with IT-related issues throughout the project. We sincerely thank Beke Pierick for her substantial contribution through her master’s thesis, particularly regarding the integration of spatially distributed rainfall. Their collaboration was essential for enabling this work. We also acknowledge the use of ChatGPT (OpenAI), model versions 4–5.3 as a supportive tool during manuscript preparation and post-processing, particularly for drafting and refining scripts used for handling large simulation datasets and generating evaluation plots. All outputs were reviewed, adapted, and validated by the authors, who take full responsibility for the final content.
Conflicts of Interest
The authors declare no conflicts of interest.
Abbreviations
The following abbreviations are used in this manuscript:
| AI | Artificial Intelligence |
| AMC | Antecedent Moisture Conditions |
| ASCII | American Standard Code for Information Interchange |
| ATKIS | Authoritative Topographic-Cartographic Information System (Germany; dataset/product name: ATKIS) |
| CC BY | Creative Commons Attribution License |
| CFL | Courant–Friedrichs–Lewy condition |
| CL | Closed configuration (culverts/bridges represented as explicit hydraulic structures) |
| CN | Curve Number |
| DEM | Digital Elevation Model |
| DOI | Digital Object Identifier |
| DWD | German Weather Service (Deutscher Wetterdienst, DWD) |
| EGLV | Emschergenossenschaft and Lippeverband (EGLV; regional water associations) |
| ERDF | European Regional Development Fund |
| FEM | Finite Element Method |
| IT | Information Technology |
| LiDAR | Light Detection and Ranging |
| MASL | Meter above sea level |
| MOC | Method of Characteristics |
| NSE | Nash–Sutcliffe Efficiency |
| NRW | North Rhine-Westphalia (NRW, Germany) |
| OP | Open configuration (structures omitted/“cut-through” representation in the DEM) |
| QGIS | QGIS (Geographic Information System software) |
| QP1 | Model configuration/scenario label for including retention basins and pumping stations with operational logic (used in “R3+QP1”) |
| R2 | Coefficient of determination |
| R1–R4 | Calibration/model-development stages (R1 baseline → later stages with increasing structural/infrastructure representation and routing focus) |
| RADOLAN-RW | RADOLAN radar precipitation product (RW variant) |
| RMSE | Root Mean Square Error |
| RWTH | RWTH Aachen University |
| SCS | Soil Conservation Service |
| SCS-CN | Soil Conservation Service Curve Number method |
| SUPG | Streamline Upwind Petrov–Galerkin |
Appendix A
Figure A1.
Discharge hydrograph comparison (open vs. closed) at 66 culvert and bridge locations across the sub-catchments of Rossbach and Ruepingsbach in the Emscher catchment area.
References
- Milly, P.C.D.; Wetherald, R.T.; Dunne, K.A.; Delworth, T.L. Increasing risk of great floods in a changing climate. Nature 2002, 415, 514–517. [Google Scholar] [CrossRef] [Scilit]
- Smolders, S.; Leroy, A.; Teles, M.J.; Maximova, T.; Vanlede, J. Culverts modelling in TELEMAC-2D and TELEMAC-3D. In Proceedings of the XXIIIrd TELEMAC-MASCARET User Conference 2016, Paris, France, 11–13 October 2016; Bourban, S., Ed.; HR Wallingford: Oxfordshire, UK, 2016; p. 21. [Google Scholar]
- Broich, K.; Pflugbeil, T.; Disse, M.; Nguyen, H. Using TELEMAC-2D for Hydrodynamic Modeling of Rainfall-Runoff. In Proceedings of the XXVIth TELEMAC-MASCARET User Conference, Toulouse, France, 15–17 October 2019; CNRS/CERFACS: Toulouse, France, 2019. [Google Scholar]
- Dharmarathne, G.; Waduge, A.O.; Bogahawaththa, M.; Rathnayake, U.; Meddage, D. Adapting cities to the surge: A comprehensive review of climate-induced urban flooding. Results Eng. 2024, 22, 102123. [Google Scholar] [CrossRef] [Scilit]
- Balaian, S.K.; Sanders, B.F.; Abdolhosseini Qomi, M.J. How urban form impacts flooding. Nat. Commun. 2024, 15, 6911. [Google Scholar] [CrossRef] [Scilit] [PubMed]
- de Vos, L.F.; Rüther, N.; Mahajan, K.; Dallmeier, A.; Broich, K. Establishing Improved Modeling Practices of Segment-Tailored Boundary Conditions for Pluvial Urban Floods. Water 2024, 16, 2448. [Google Scholar] [CrossRef] [Scilit]
- Salvisberg, R.; Marti, T.; Arrigo-Meier, S.; Petar, M. Flood risk management based on 2D TELEMAC computations: An example with Swiss hazard map. In Proceedings of the XXVIth TELEMAC-MASCARET User Conference, Toulouse, France, 15–17 October 2019; CNRS/CERFACS: Toulouse, France, 2019. [Google Scholar]
- Mahmood, M.Q.; Wang, X.; Aziz, F.; Dogulu, N. Urban flood modelling: Challenges and opportunities—A stakeholder-informed analysis. Environ. Model. Softw. 2025, 191, 106507. [Google Scholar] [CrossRef] [Scilit]
- Peker, İ.B.; Gülbaz, S.; Demir, V.; Orhan, O.; Beden, N. Integration of HEC-RAS and HEC-HMS with GIS in Flood Modeling and Flood Hazard Mapping. Sustainability 2024, 16, 1226. [Google Scholar] [CrossRef] [Scilit]
- Ligier, P.-L. Implementation of a rainfall-runoff model in TELEMAC-2D. In Proceedings of the XXIIIrd TELEMAC-MASCARET User Conference 2016, Paris, France, 11–13 October 2016; Bourban, S., Ed.; HR Wallingford: Oxfordshire, UK, 2016; p. 13. [Google Scholar]
- Adouin, Y.; Moulinec, C.; Barber, R.; Sunderland, A. Preparing TELEMAC-2D for extremely large simulations. In Proceedings of the XVIIIth Telemac & Mascaret User Club 2011, Chatou, France, 19–21 October 2011; Violeau, D., Hervouet, J.-M., Razafindrakoto, E., Denis, C., Eds.; EDF R&D: Chatou, France, 2011; p. 35. [Google Scholar]
- Guo, K.; Guan, M.; Yu, D. Urban surface water flood modelling—A comprehensive review of current models and future challenges. Hydrol. Earth Syst. Sci. 2021, 25, 2843–2860. [Google Scholar] [CrossRef] [Scilit]
- Leandro, J.; Schumann, A.; Pfister, A. A step towards considering the spatial heterogeneity of urban key features in urban hydrology flood modelling. J. Hydrol. 2016, 535, 356–365. [Google Scholar] [CrossRef] [Scilit]
- Xing, Y.; Chen, H.; Liang, Q.; Ma, X. Improving the performance of city-scale hydrodynamic flood modelling through a GIS-based DEM correction method. Nat. Hazards 2022, 112, 2313–2335. [Google Scholar] [CrossRef] [Scilit]
- Zhang, J.; Wu, G.; Liang, B.; Chen, Y. Subgrid modeling of urban flooding incorporating buildings’ effects. Phys. Fluids 2023, 35, 127108. [Google Scholar] [CrossRef] [Scilit]
- Wang, Y.; Chen, A.S.; Fu, G.; Djordjević, S.; Zhang, C.; Savić, D.A. An integrated framework for high-resolution urban flood modelling considering multiple information sources and urban features. Environ. Model. Softw. 2018, 107, 85–95. [Google Scholar] [CrossRef] [Scilit]
- Ah-Woane, E.; Amama, Z.; Cordier, F.; Davarend, T.; Lotfi, J.; Assaba, M.; Sochinskii, A.; Majdalani, S.; Moussa, R.; Abily, M.; et al. Toward Brague river flood modelling 3: The impact of culvert representation. Digit. Water 2025, 3, 1–22. [Google Scholar] [CrossRef] [Scilit]
- Lee, J.-H.; Lee, S.; Kim, B.; Choi, H.; Noh, S.J. Evaluating the Effects of Spatial Resolution on 2D Pluvial Flood Modeling in Urban Built Environments. J. Flood Risk Manag. 2025, 18, e70105. [Google Scholar] [CrossRef] [Scilit]
- Butters, O.; Robson, C.; McClean, F.; Glenis, V.; Virgo, J.; Ford, A.; Iliadis, C.; Dawson, R. An open framework for analysing future flood risk in urban areas. Environ. Model. Softw. 2025, 185, 106302. [Google Scholar] [CrossRef] [Scilit]
- Mignot, E.; Li, X.; Dewals, B. Experimental modelling of urban flooding: A review. J. Hydrol. 2019, 568, 334–342. [Google Scholar] [CrossRef] [Scilit]
- Hettiarachchi, S.; Wasko, C.; Sharma, A. Can antecedent moisture conditions modulate the increase in flood risk due to climate change in urban catchments? J. Hydrol. 2019, 571, 11–20. [Google Scholar] [CrossRef] [Scilit]
- Mignot, E.; Dewals, B. Hydraulic modelling of inland urban flooding: Recent advances. J. Hydrol. 2022, 609, 127763. [Google Scholar] [CrossRef] [Scilit]
- Godara, N.; Bruland, O.; Alfredsen, K. Modelling Flash Floods Driven by Rain-on-Snow Events Using Rain-on-Grid Technique in the Hydrodynamic Model TELEMAC-2D. Water 2023, 15, 3945. [Google Scholar] [CrossRef] [Scilit]
- Godara, N.; Bruland, O.; Alfredsen, K. Simulation of flash flood peaks in a small and steep catchment using rain-on-grid technique. J. Flood Risk Manag. 2023, 16, e12898. [Google Scholar] [CrossRef] [Scilit]
- Bourban, S.E.; Turnbull, M.S. A simplified approach to modelling all types of obstacles in TELEMAC-2D and 3D. In Proceedings of the XXIXth TELEMAC Users Conference, Karlsruhe, Germany, 12–13 October 2023; Kopmann, R., Folke, F., Eds.; Bundesanstalt für Wasserbau: Karlsruhe, Germany, 2023; p. 217. [Google Scholar]
- Hao, W.; Gourbesville, P.; Jianyun, Z. (Eds.) Proceedings of the 15th International Conference on Hydroinformatics, Beijing, China, 27–30 May 2024; The International Association for Hydro-Environment Engineering and Research (IAHR): Spain, Madrid, 2024. [Google Scholar]

Disclaimer/Publisher’s Note: The statements, opinions and data contained in all publications are solely those of the individual author(s) and contributor(s) and not of MDPI and/or the editor(s). MDPI and/or the editor(s) disclaim responsibility for any injury to people or property resulting from any ideas, methods, instructions or products referred to in the content. |
© 2026 by the authors. Licensee MDPI, Basel, Switzerland. This article is an open access article distributed under the terms and conditions of the Creative Commons Attribution (CC BY) license.