


Abstract
Frequent reservoir navigation and the deployment of coastal refueling stations pose a potential risk of sudden petroleum contamination to the raw water in reservoirs, necessitating effective containment strategies. This study uses a river flow model and computational fluid dynamics (CFD) with a three-phase volume of fluid (VOF) approach to investigate vortex generation and synergistic oil removal mechanisms for containment drums and nets under varying submersion depths, flow velocities, and layout configurations. The simulation identifies a critical flow velocity for oil droplet entrainment failure of 0.23 m/s. A drum submersion depth of 1.5 cm generates stable upstream and downstream vortices that maximize oil–drum contact, whereas increasing the depth to 3.0 cm causes downstream vortex detachment, reducing contact time and leading to failure. For containment nets, the vertical double-layer deployment creates a low-velocity storage zone between layers, forcing oil to breach two barriers, while vertical tiling generates a static wall effect that prolongs oil residence time. In the combined drum–net system, the favorable vortex areas generated by both devices can be fully utilized to improve oil spill control. These findings demonstrate that optimizing drum submersion depth and net configuration significantly enhances oil containment efficiency, providing guidance for emergency response in source water reservoirs.
1. Introduction
Water supply safety is a fundamental condition for high-quality urban development [1]. Drinking water source areas are essential for public health and ecosystem stability, yet they face increasing threats from a wide range of human activities driven by urbanization and economic development [2,3]. Waterway transportation, particularly along the Yangtze River in China, is the primary mode for transporting chemical raw materials and products, with dense chemical parks, large-scale hazardous chemical transport, and high vessel traffic posing sustained pressure on the water environment. Accidents leading to leaks of hazardous chemicals, such as petroleum, directly threaten drinking water safety and ecological stability for coastal residents. As a typical source of water pollution, petroleum leakage causes long-term damage to aquatic ecology and socio-economic development and must be highly prioritized and prevented. Many cities, both domestically and internationally, have water sources located in shipping areas, exposing them to various pollution threats, including fixed sources (e.g., industrial pollution sources, gas stations, and ship maintenance along water source rivers) and mobile sources (e.g., oil spills from shipping accidents), all posing risks of sudden petroleum pollution. Domestic shipping vessels predominantly use diesel engines [4,5], and diesel leaks threaten urban water safety [6,7]. According to the International Tanker Owners Pollution Federation, six large spills (exceeding 700 tonnes) and four medium spills (ranging from 7 to 700 tonnes) were recorded from tanker incidents in 2024, primarily involving fuel oil across South America, Asia, and Europe. The current decade averages 7.4 spills (above 7 tonnes) per year, a slight increase from the 2010s but still a dramatic reduction compared to earlier decades.
To address sudden petroleum pollution, common methods include gravity separation, filtration, chemical treatment, and adsorption. Gravity separation utilizes the density difference between oil and water to separate floating and dispersed oils, primarily using various oil separators and multi-phase separators. This method is simple, energy-efficient, and highly effective, but it requires large equipment footprints and long processing times, making it unsuitable for open water bodies [8,9]. Filtration employs membranes with different pore sizes to intercept oil components. It is easy to operate and produces no secondary pollution; however, membrane materials are expensive and prone to fouling, requiring pressurized operation [10,11,12]. Chemical treatment involves adding agents to alter the properties of oil, offering rapid processing. However, dispersants can significantly increase the toxicity of oil to aquatic organisms and may enhance the solubilization of polycyclic aromatic hydrocarbons, posing substantial ecological risks in open waters [13,14,15]. Adsorption utilizes hydrophobic and oleophilic materials to absorb spilled oil. Common adsorbents include polypropylene, high-oil-absorption resins, and natural fibers. Polypropylene is widely used due to its low density, low water absorption, and excellent oil absorption performance. Nevertheless, adsorbent materials face challenges related to poor degradability and the need for improved utilization efficiency [16,17,18,19,20,21]. However, traditional emergency response methods face significant limitations in restoring complex scenarios, achieving mechanistic understanding, optimizing efficiency, and adapting to multiple scenarios, making it difficult to meet the practical demands for efficient and precise prevention and control of sudden oil pollution in water bodies.
With the rapid development of the computer industry, numerous scholars worldwide have begun to utilize numerical simulation methods to investigate the removal of oil pollution using oil booms in response to oil spill issues in oceans and inland river basins [22]. Under reasonable constraints, computational fluid dynamics (CFD) can provide detailed information on relevant flow variables throughout the entire computational domain (full flow field data) [23]. On this basis, the application of oil booms has also been significantly improved, particularly in terms of their composition and structure. Traditional oil booms consist of floats, skirts, tension members, ballasts, and connectors [24,25]. The primary function of the floats is to provide buoyancy, enabling the oil boom to remain on the water surface. The submerged skirt portion forms a barrier that effectively contains oil pollutants that might otherwise escape from underneath. Shi et al. developed a numerical model for movable floating booms under wave–current coupling and demonstrated that fixed-boom assumptions overestimate vorticity, underscoring the importance of capturing realistic boom motion in performance assessments [26]. Amini et al. [27] modeled single-layer and double-layer barriers containing oil on the water surface, investigating flow characteristics of rigid and flexible barriers at different submergence depths. Hou et al. [28] experimentally studied oil containment effects and motion responses of oil booms under wave influence, using numerical methods to analyze the impacts of water flow rate, wave parameters, skirt height, and initial oil spill volume on containment performance. Their results indicated that waves accelerate oil interception failure, and increased initial oil volume leads to increased viscosity of the oil reservoir. Feng et al. [29] developed a two-dimensional multiphase model to reproduce oil containment processes, comprehensively studying water–oil–boom interactions. They found that movement of the boom’s lower hem significantly alters the surrounding flow field, affecting oil removal efficiency, with arc-shaped or multi-linear lower hems demonstrating superior performance. Fonty et al. [30] employed the SPH Lagrange method to simulate leakage scenarios under complex water–oil two-phase motion and fluid–solid coupling interactions, showing that oil spill occurs between wave heights of 0.5–1.0 m with a test wave period of 4 s. Hossein et al. [31] proposed an oil boom arm system incorporating a sieve tube and inclined bottom hem, achieving better removal efficiency for lighter oils at relative velocities of 2–3 knots. While these studies collectively demonstrate the capability of CFD to optimize the design of individual boom components, the current body of research remains largely focused on structural and material improvements, with limited attention given to the influence of different deployment configurations on overall containment performance. This gap highlights the need for systematic investigations into how varying boom layouts and arrangements affect oil-trapping efficiency under realistic flow conditions.
In this study, different arrangements of oil containment booms were selected to simulate varying flow rates, submergence depths, and layout configurations. The CFD method was employed to investigate the hydraulic characteristics of numerical river channels and intuitively represent water flow states. The objective was to further explore the correlation between installation methods and adsorption efficiency, analyze oil trapping mechanisms under different layout schemes, improve the oil removal efficiency of existing configurations, and provide technical support and guidance for reservoirs when responding to sudden petroleum pollution events.
2. Governing Equations and Models
2.1. Experimental and Numerical Object
In this study, oil containment drums and nets are chosen to simulate the function of oil containment booms. For the simulation of oil containment nets, this study uses algae barrier nets, which are made of spun fibers and feature numerous pores and pore structures, classifying them as a polymer porous material. Therefore, the porous medium model in ANSYS Fluent (Version 2022R1) is used.
As for oil containment drums, though the surfaces of the drums and nets possess hydrophobic and oleophilic properties, in the actual flow state, most of the spilled oil will be swept away by the water flow and will not be directly adsorbed on the material surface. Considering that the oil containment drums float directly on the river channel, the contact area with the water flow is very small, and the oil absorption capacity of the outer surface of the oil containment drums is quite limited, their porous medium properties are ignored when modeling the oil containment drums. The established model will be divided into grids, and once the grid quality meets expectations, the model will be set up and iteratively calculated in Fluent software.
2.2. Porous Media Model
This study uses a porous media model to simulate the process of water and oil penetrating through the net fibers during oil interception [32]. The simulation method of porous media considers the hindering effect of porous materials on fluids as the resistance applied to the fluid in that region. This simulation method can be used for fluid flow and heat transfer problems in heat exchangers, filter membranes, or fluidized beds. In porous materials such as oil containment nets, the flow in the fiber pores is slow due to their high hydrophobicity, so it can be regarded as a resistance applied to the fluid.
Determining the properties of porous media in simulation experiments usually involves obtaining the velocity pressure drop curve of the material based on actual experimental conditions in order to obtain the viscosity and inertial resistance coefficients. At the same time, it is also necessary to determine the porosity and relative permeability of the porous media.
Fluent adds a momentum source term to the calculation equation, which includes two parts: viscous drag and inertial drag.
where Si represents the source term and D represents the matrix of viscous drag coefficients; C represents the matrix of inertial drag coefficient; μ represents the viscosity coefficient; ρ represents the density; and Vj represents the velocity of the flow field in a certain direction. For unidirectional and uniform porous media, the porous media model can be further simplified:
where α represents the permeability of porous media materials, and C2 represents the inertial drag coefficient. When a specific porous medium cannot obtain a velocity pressure drop curve, the Ergun formula can be used to approximate the viscous and inertial drag coefficients over a wide range of Re numbers. The expression of the Ergun formula is:
where represents the pressure drop, L represents the material thickness, represents the porosity of fibers, and represents the velocity along a certain direction at a certain point in the flow field; represents the mean particle diameter in the Ergun equation, which is originally derived for packed beds. For a fibrous porous medium like the oil containment net, is analogously taken as the mean fiber diameter to characterize the pore scale.
If the process of water and oil passing through the net fibers is considered as laminar flow, then the second term in Equation (3) is very small. After ignoring it, the Blake Kozeny equation can be obtained:
After comprehensive comparison, the viscous drag coefficient and inertial drag coefficient can be obtained as follows:
According to the ImageJ (Version 1.x) measurement, the fiber diameter is 47.86 μm and the porosity is 0.68. By substituting it into the Blake Kozeny equation, it can be obtained that 1/α = 2.10 × 10¹⁰, C2 = 73,641 [33]. While more advanced gradient calculation methods, such as the solution-dependent weighted least squares (SDWLS) approach, have been developed to achieve higher-order accuracy on unstructured meshes for complex flow simulations [34], the present study adopts the standard porous media formulation, as it sufficiently captures the bulk hydraulic resistance for the comparative analysis of different deployment configurations.
It is important to note that the viscous and inertial resistance coefficients (1/α and C2) for the porous medium model were derived from theoretical correlations (Equations (5) and (6)) based on the measured porosity and fiber diameter, rather than from direct pressure-drop measurements on the specific net material. While this approach provides a reasonable first-order approximation, it may not fully capture the complex, non-Darcy flow behavior through the flexible fibrous structure under varying compression or tension. Future work will include dedicated benchtop experiments to measure the velocity–pressure drop relationship of the oil containment net, enabling a direct calibration of the porous media coefficients and further enhancing the quantitative predictive capability of the model.
2.3. Multiphase Flow Model
In this study, it is necessary to investigate the impact of different deployment methods on the hydraulic conditions inside the flow channel before and after the sudden oil spill accident, as oil spills reach the front end of the containment drums and nets with the flow of water, and then flow backward after being intercepted by the drums and nets. Therefore, gas, water, and oil are all considered continuous media, and the flow situation of spilled oil under resistance and water flow changes is visualized. When simulating gas–liquid interface changes, not only should the evolution of flow shape be considered, but the changes in liquid level should also be noted. Therefore, accurately capturing the interface changes of these phases is crucial. Similar VOF-based approaches have been successfully applied to simulate oil spill processes from submarine pipelines to the free surface, examining the effects of oil density, leaking rate, and current velocity on oil droplet migration [35].
When using the volume of fluid (VOF) method to solve the three-phase flow model, the software treats the three immiscible phases as a single mixture and solves only one set of conservation equations for the entire flow field. A key assumption of the VOF formulation is that all phases share the same velocity field which is obtained by solving a single momentum equation for the mixture. This assumption is valid when the phases are strongly coupled and the relative velocity between phases (e.g., oil droplet slip relative to water) is negligible under the current low-flow-velocity conditions (0.06–0.21 m/s).
While the physical phenomenon is inherently three-dimensional, especially near the lateral edges of the drums and nets, a two-dimensional planar model was deliberately chosen as the primary simulation tool for this study. The justification is threefold. First, the primary hydrodynamic mechanisms governing oil entrapment and failure—such as vortex generation upstream and downstream, velocity shear at the material interface, and the vertical oil–water interface deformation—are predominantly captured in the vertical plane aligned with the flow direction. Second, the laboratory-scale physical model was designed with a width-to-depth ratio sufficiently large to minimize sidewall effects, making the flow field statistically two-dimensional in the central measurement region. Third, this study focuses on evaluating the relative performance of different deployment configurations rather than predicting absolute oil volumes. The two-dimensional approach, validated against critical failure velocities, provides a computationally efficient means to compare these configurations and reveal the underlying vortex-driven mechanisms, which are qualitatively consistent in a three-dimensional setting. Future work will extend the most promising configurations to three-dimensional simulations to quantify edge effects and optimize lateral sealing.
The control equation is represented in Text S1.
2.4. Vortex Identification
In classical fluid mechanics—for example, in two-dimensional laminar flow—the vorticity near the wall may be very large, but in reality, the fluid does not rotate. This may lead to significant errors in vortex identification [36]. In this study, due to the presence of oil–water two-phase flow, the turbulent flow in the river channel is complex under the presence of oil containment drums and nets. From practical experiments, it was found that there are vortex areas in front of and behind the oil containment drums, which increase the residence time of oil spills floating on the water surface and increase the contact time and frequency with oil-absorbing materials. Therefore, these vortices promote oil absorption.
This article uses the second-generation vortex recognition method, which is mainly based on the characteristic values of the velocity gradient tensor. In response to the shortcomings of the above-mentioned vortex methods, Liu et al. [37] proposed the Ω method, which considers the influence of fluid deformation and is applicable to both compressible and incompressible fluid flows. So, Ω can be calculated using the Equation (7).
where A and B represent symmetric tensors and antisymmetric tensors, respectively. A symmetric tensor characterizes the deformation motion of fluid micro clusters, while an antisymmetric tensor characterizes the rotational motion of fluid micro clusters. Therefore, the Ω method essentially obtains the part of the fluid micro clusters with a larger proportion of rotating parts and identifies this part of the fluid as vortices. Generally speaking, when Ω is set to 0.52, it can better display strong and weak vortices [37]. Vortex has a significant impact on flow, and it is crucial to effectively identify the vortex in the river channel.
3. Configuration Setups and Verifications
3.1. Simulated Setups and Model Mesh
To investigate the oil absorption and oil interception performance of oil containment drums and nets under flowing conditions, we constructed an experimental setup simulating oil adsorption and interception in river flow environments to investigate how hydrodynamic conditions resulting from different deployment configurations significantly influence the oil recovery efficiency of these measures. However, directly observing the complex flow behavior of reservoir raw water and ultrapure water remains challenging under laboratory conditions. Therefore, we employed CFD to analyze the hydraulic characteristics of a numerical flume, enabling visualization of flow patterns, aiming to further explore the correlation between installation methods and adsorption efficiency, providing technical guidance for deploying emergency oil containment measures in actual source water reservoirs.
As shown in Figure S1, the fluid dynamics simulation setup consists of six components (water inlet, over-flow weir, drums installation area, nets installation area, and discharge outlet), with a peristaltic pump connected to the inlet serving as the inflow source. Water enters the main channel through the weir structure, with an energy dissipation device installed at the inlet to prevent vortex formation. The flow subsequently passes sequentially through the oil containment drums zone and oil containment net zone, simulating the first two stages of actual oil spill response. Finally, water discharges via the weir into the outlet section and exits through the nozzle, where diesel concentration measurements in water samples are used to evaluate treatment performance [38].
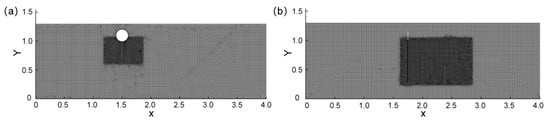
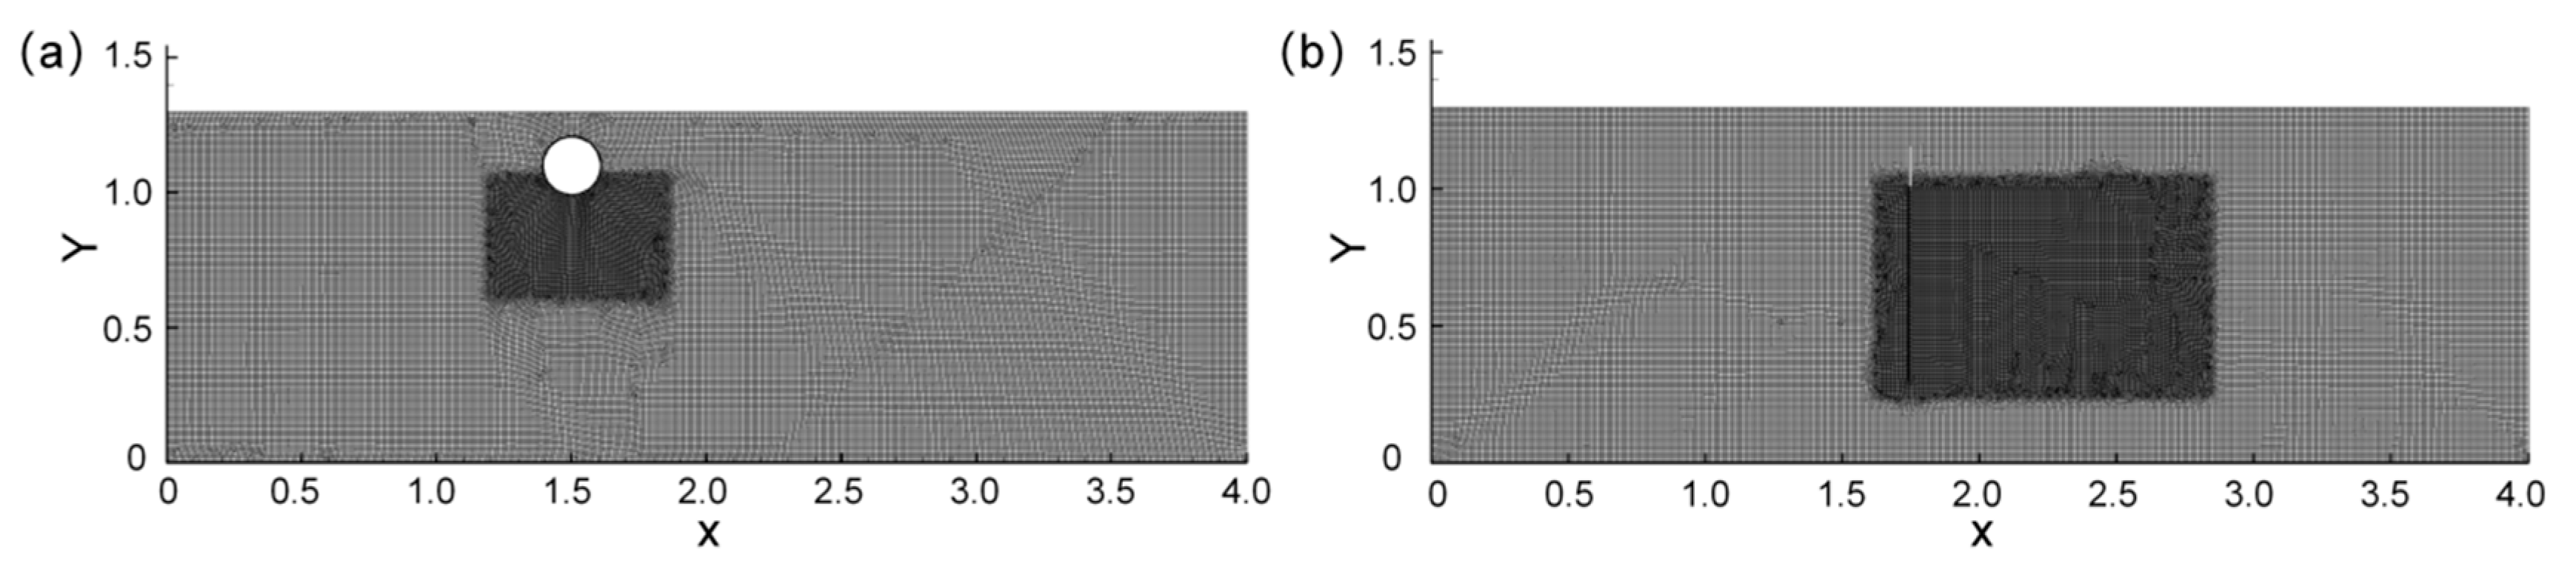
A three-phase flow model was employed to investigate the behavior of the oil–water interface as it passed through oil containment drums and nets in an open channel. A two-dimensional planar model was deemed sufficient for this purpose. The model dimensions were based on an oil containment drum with a standard commercial diameter of 0.21 m. The water depth was set to 1 m to ensure the drum could be tested at various submersion depths (0.5 cm, 1.5 cm, and 3.0 cm) while remaining fully submerged and maintaining a sufficiently large depth-to-diameter ratio to approximate two-dimensional flow conditions. The total channel length was 4 m, which allowed the drum and net to be positioned 1.5 m from the inlet and outlet, respectively, thereby minimizing boundary effects on the test sections while keeping computational cost manageable. The air layer height was 0.3 m to capture the air–water interface dynamics without excessive computational expense. Based on these considerations, the model parameters were defined as follows: length 4 m, water depth 1 m, and air layer height 0.3 m, with a left-side inlet and a right-side pressure outlet. The simulation used the open channel flow simulator within the VOF sub-model. The oil containment drums had a diameter of 0.21 m, and their centers were positioned 1.5 m from the inlet. A line source of oil with a unit length flow rate of q = 0.01 m3/m was placed 1.0 m downstream of the inlet. The model configuration is illustrated in Figure 1a [39].
Figure 1.
Model mesh with (a) oil containment drums and (b) oil containment nets installed in the river model.
The numerical investigation focused on the effect of varying the submersion depth of the drums on the flow characteristics within the numerical channel. Consequently, the simulation employed the same submersion depths as the experimental phase. When a drum is positioned horizontally on the channel bed (theoretically 0 cm submersion), its impact on the flow is negligible. However, under realistic conditions, the drum’s self-weight and the hydrodynamic forces acting on the oleophilic materials within the hydrophobic matrix cause a slight submersion even in a nominally horizontal placement. This minimal actual submersion results in a significantly greater influence on the flow field compared to the ideal 0 cm case. Therefore, in our simulations, the horizontal drum condition was represented as a 0.5 cm submersion depth for analysis. All other conditions mirrored the experimental setup, with flow velocities set at 0.06 m/s, 0.15 m/s, and 0.21 m/s, respectively.
For the simulation of the oil containment net, a porous media model was incorporated to replicate the obstructive effects of this porous material on both oil droplets and water flow, enabling analysis of how different installation configurations influence fluid and oil droplet dynamics. The central vertical section of the net was positioned 1.5 m upstream of the outlet. The mesh was refined around the net’s installation area, with boundary layer treatment applied to enhance simulation accuracy. The overall model dimensions remained consistent with those used in the oil containment drum simulations, and the net model extended to the bottom of the numerical channel, aligning with the deployment method employed in laboratory experiments.
Four deployment configurations were established—horizontally laid, vertically draped as a single layer, vertically draped as a double layer, and vertically tiled (a combined vertical and horizontal deployment)—to simulate actual emergency scenarios (Figure S2). For each arrangement, local mesh refinement and boundary layer incorporation were implemented at the corresponding net positions. Given that the section of the net protruding above the water surface lacked significant hydrodynamic driving force and did not contribute decisively to oil containment, it was omitted from the model to conserve computational resources. The submerged portion of the net was configured using the parameters derived from the porous media model, as illustrated in Figure 1b.
3.2. Simulation of Oil Spill Interception Failure
Prior to formal simulations, a two-dimensional channel model measuring 4.0 m in length and 0.50 m in depth was established to validate the numerical approach. An oil containment drum with a width of 0.01 m was positioned at the center of the model. In this hydrodynamic configuration, the top boundary was defined as a friction-free free surface with zero tangential velocity, while the bottom boundary was set as a fixed, no-slip wall with zero velocity. The left boundary served as the velocity inlet with a specified velocity v1, and the right boundary was configured as a pressure outlet with backflow suppression. The upper boundary was assigned as a pressure outlet with a gravitational acceleration of −9.81 m/s2 in the y-direction (Figure 1).
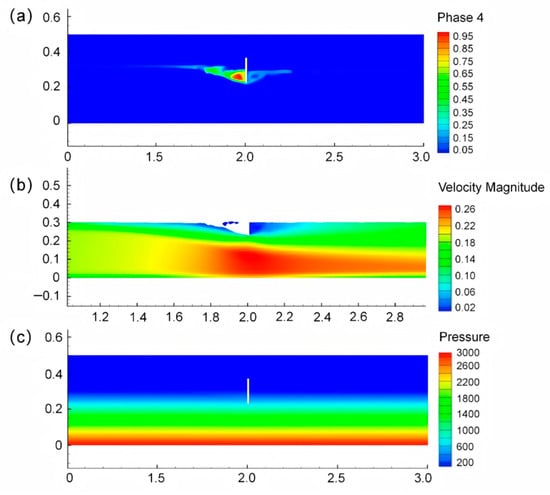
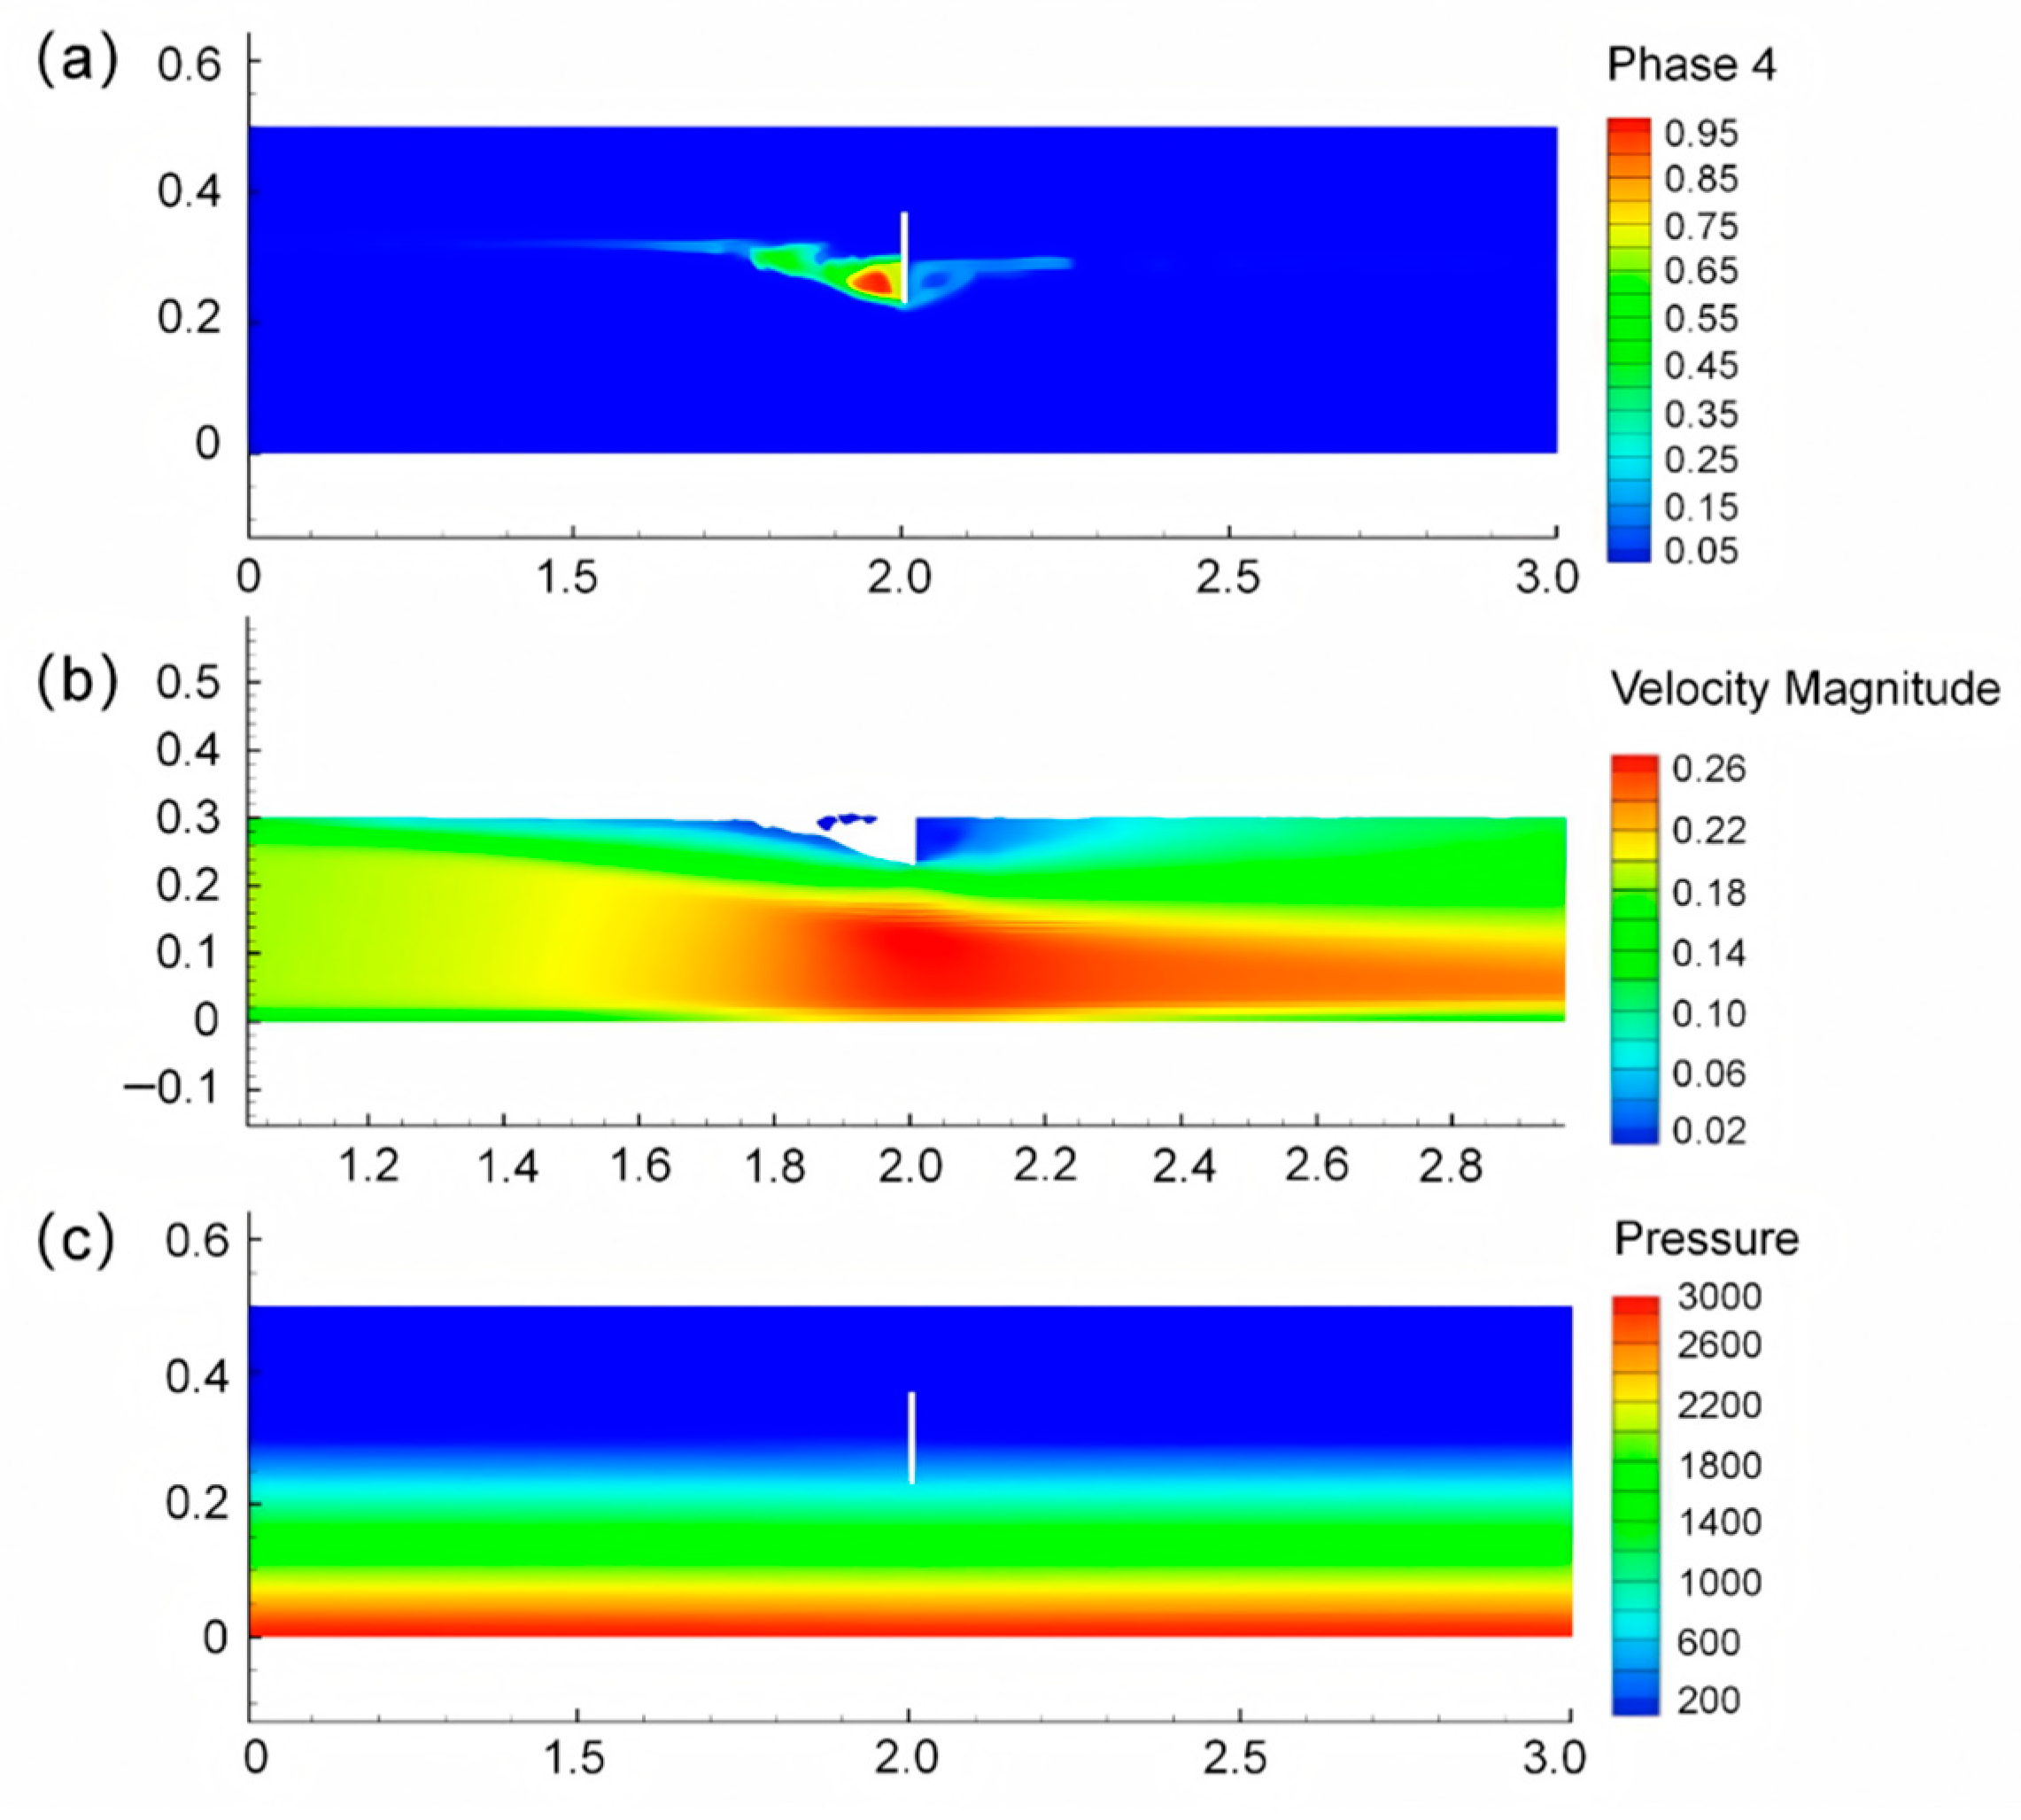
For the three-phase flow simulation, a stable air–water two-phase flow field was first established and served as the initial condition for subsequent multiphase calculations. Numerical experiments on a single oil containment drum were conducted using Fluent, with the initial oil volume per unit length set to q = 0.01 m3/m based on the drum length. As shown in Figure 2, when the flow velocity increased to v = 0.23 m/s, the oil containment efficiency began to decline. The comparison of numerical simulation results with those from references [40,41,42] is presented in Table 1. The simulated oil spill failure flow velocity (0.23 m/s) agrees well with reference values and is comparable to previous research, indicating that the model adequately captures the bulk hydraulic resistance and is effective for gas-water-oil three-phase flow simulation. Therefore, this method can be utilized to investigate changes in river flow patterns under different flow velocities and device configurations.
Figure 2.
Simulation results of oil phase volume fraction map (a), velocity cloud map (b), and pressure contour line (c) when the flow rate reaches 0.23 m/s.
Table 1.
Comparison of simulation results with literature.
While the matching of the critical failure velocity provides a crucial and necessary validation of the global force balance and the onset of oil droplet entrainment, it represents a limited validation point. A more comprehensive validation, including comparisons of vortex structures (size, location, intensity), oil retention time upstream of the barriers, and concentration breakthrough curves for the combined drum–net system, is essential to fully establish the model’s predictive capability. Currently, detailed experimental data for these specific output variables are not available for direct comparison. Therefore, the qualitative agreement of vortex patterns and the relative performance trends among configurations presented in the following sections should be interpreted as model predictions that are physically plausible and consistent with the validated failure criterion. The absolute values, particularly of oil concentration or retention time, remain semi-quantitative.
4. Results and Discussion
4.1. Flow State Analysis of Submerged Depth of Oil Containment Drums
A detailed investigation was conducted on the hydraulic conditions upstream and downstream of the oil containment drums under various flow velocities and submersion depths. As each deployment configuration did not fully obstruct the channel, the system maintained open-channel flow conditions where pressure exerted negligible influence on the flow regime. Consequently, the effect of pressure on flow characteristics was excluded from further analysis. Additionally, given the minimal impact of airflow on oil spill dispersion, the gas phase data was omitted from contour plots to facilitate clearer visualization and analysis of the oil–water phase behavior. By examining the performance of the water phase under different hydrodynamic conditions, we can gain deeper insights into how these flow patterns influence oil removal efficiency.
Vortices play a critical role in enhancing oil interception efficiency. Their presence prolongs the residence time of oil near the drum, increasing opportunities for contact with oleophilic materials. Even if oil is not immediately adsorbed by the drum’s surface, vortices can trap it within the surrounding area, effectively improving containment performance. Therefore, this study focuses specifically on vortex generation and its effects. According to vorticity distributions generated using the Omega (Ω) method, a vortex is identified where Ω exceeds 0.52, indicating that the rotational intensity of fluid clusters surpasses their deformation rate. All regions enclosed by the 0.52 isosurface in the contour plots [43] were thus defined as vortical zones. During post-processing, these regions were marked, and the influence of different drum configurations on vortex generation was analyzed based on velocity distributions, with isosurfaces delineated accordingly in the Omega field.
As observed in the velocity contour plots Figure S3a–c, significant differences in the stabilized flow velocity across the channel plane are evident due to varying initial flow rates. In oil spill incidents, the initial flow velocity exerts a considerable influence on the interception efficiency of containment structures. A comparison of Figure S3d–f indicates that a submersion depth of 1.5 cm does not substantially disrupt the natural river flow, confining the hydrodynamic impact of the drum to a localized area. This configuration ensures efficient oil droplet capture while maintaining overall flow continuity, achieving a balance that promotes effective oil–water separation.
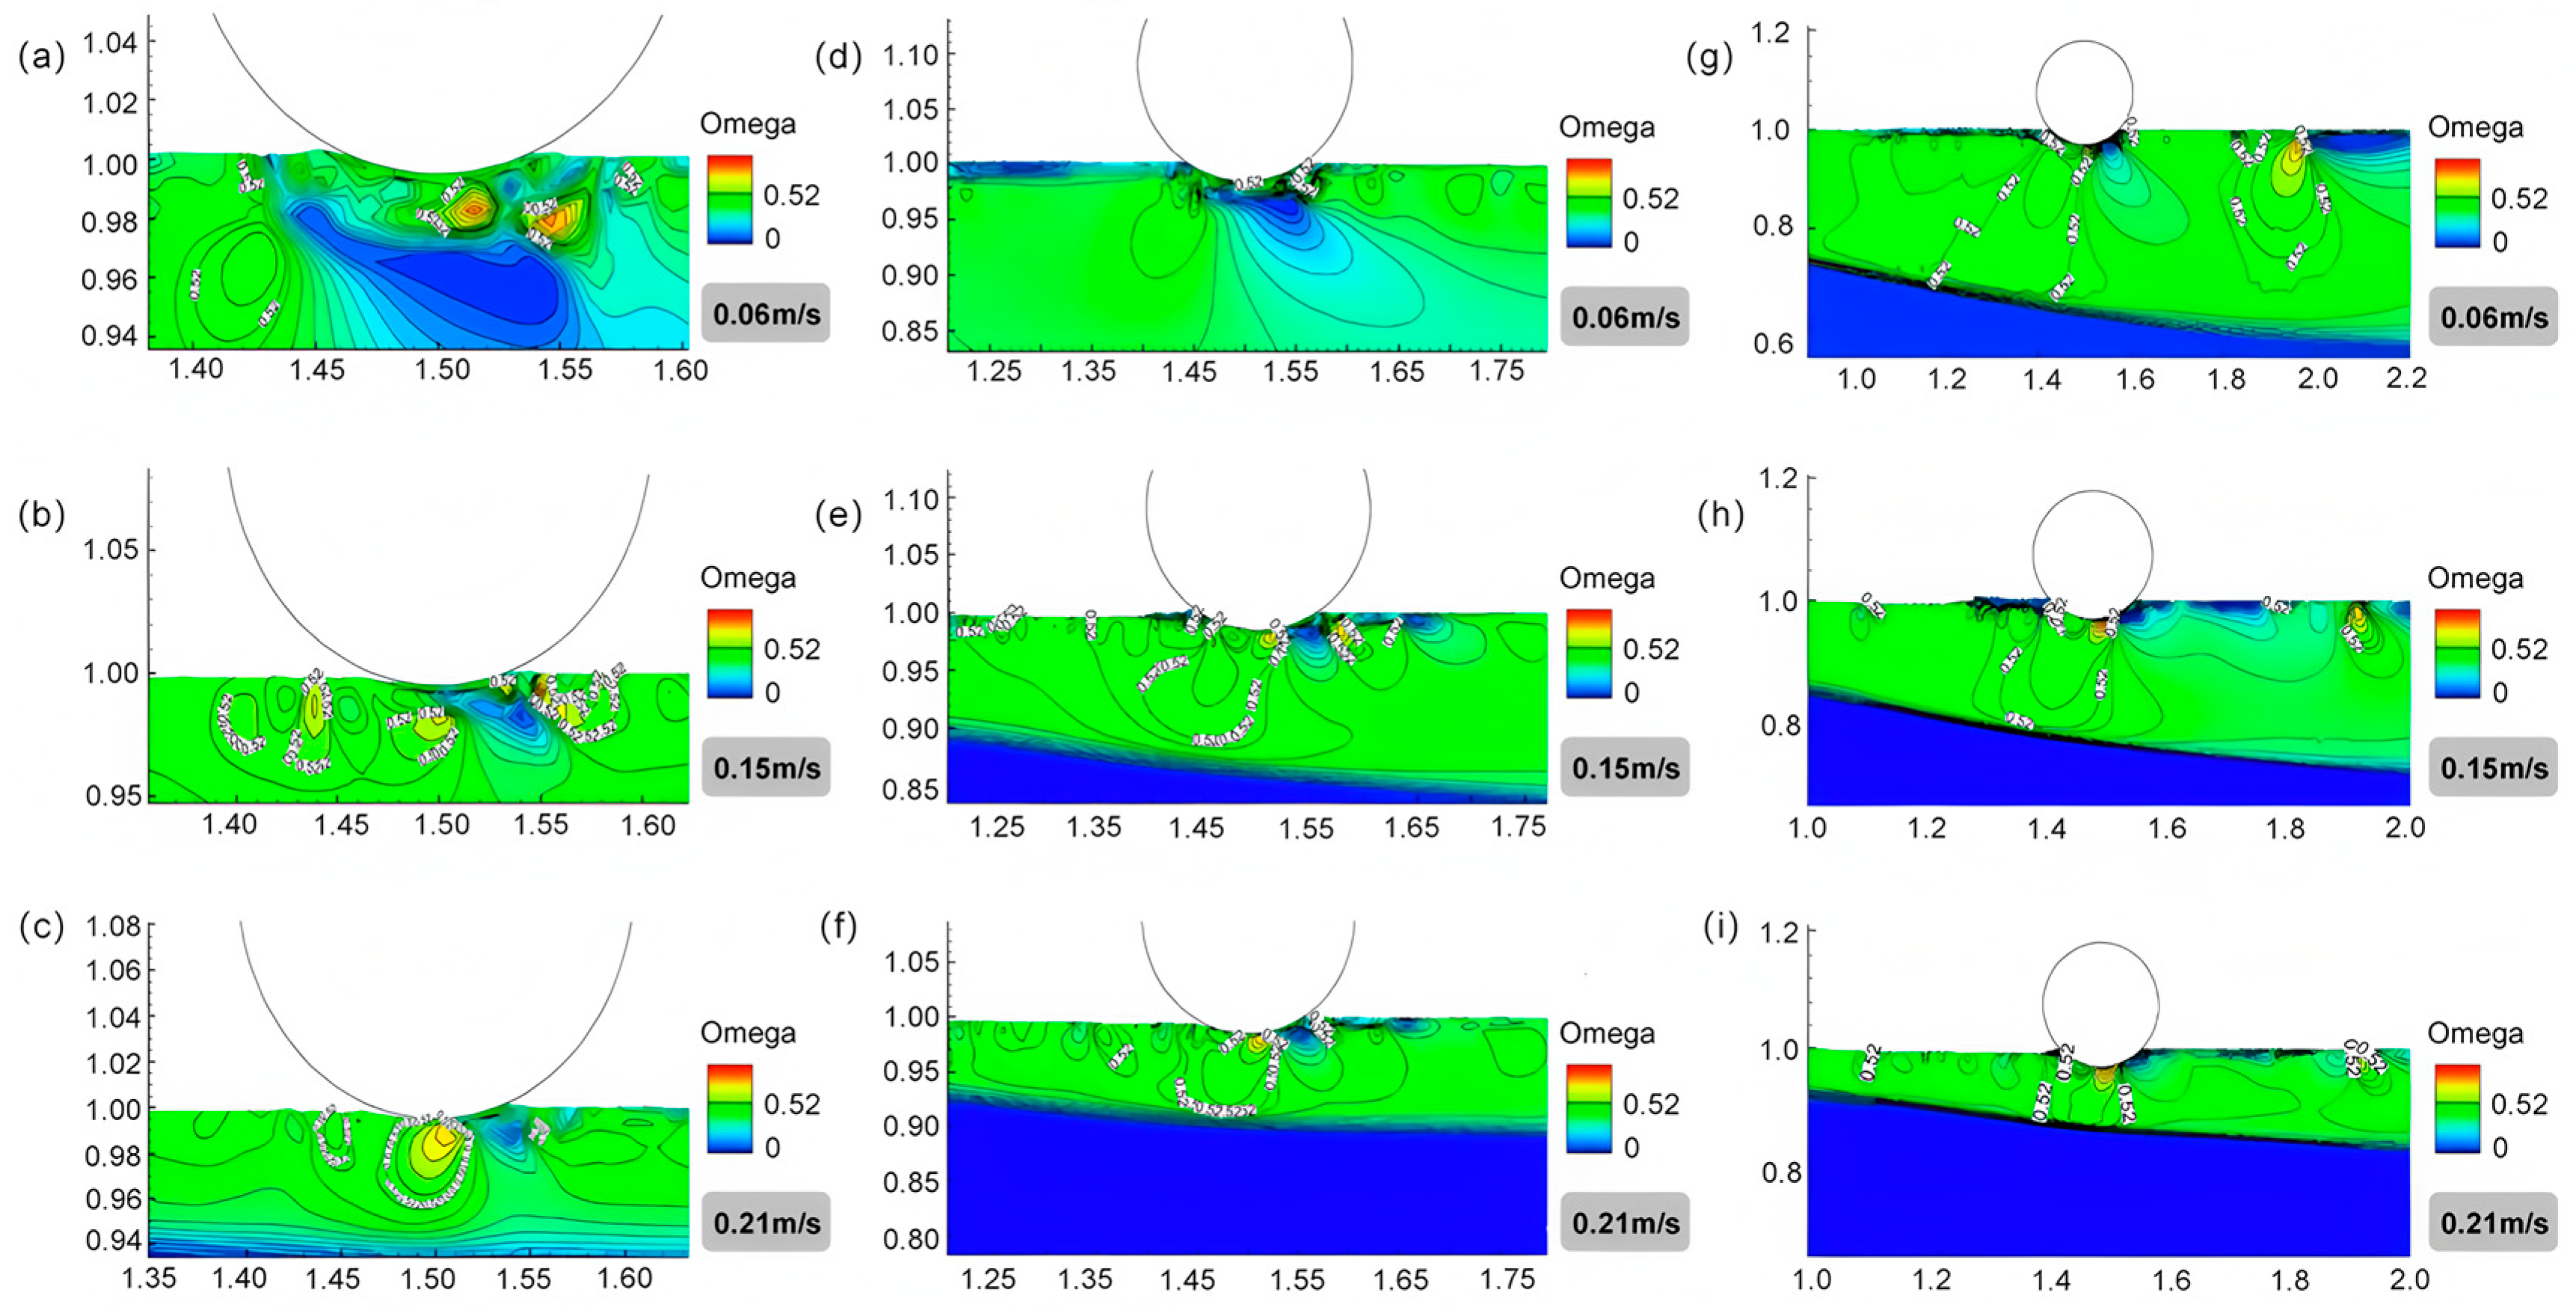
When the drum is positioned horizontally on the water surface, its minimal contact area with the flow severely limits its ability to alter the river’s hydrodynamic state, particularly at higher velocities. Comparing Figure 3a–c reveals that increased flow velocity, associated with greater kinetic energy, markedly reduces the number and size of vortices formed near the drum. The restricted contact area diminishes the drum’s capacity to modulate the horizontal flow. At a very shallow submersion depth, the generated vortices are concentrated directly beneath the drum. These vortices can push accumulated oil upstream under the drum, leading to containment failure. Furthermore, the oleophilic surface material of the drum remains underutilized, resulting in the poorest oil interception performance at this depth.
Figure 3.
Contour maps of Omega = 0.52 at different flow velocities (0.06 m/s, 0.15 m/s, 0.21 m/s), where the submersion depth of the oil containment drum is 0.5 cm for (a–c), 1.5 cm for (d–f), and 3.0 cm for (g–i).
Figure 3d–f demonstrates that at a submersion depth of 1.5 cm, stable vortex structures form both upstream and downstream of the drum, positioned adjacent to its oleophilic surface. When oil droplets are trapped within these vortices, they encounter the drum’s adsorbent material. The combination of vortical trapping and the material’s high oil-adsorption capacity significantly enhances separation efficiency. The low-velocity zones around the drum expand with increasing submersion depth, as shown in Figure 3g–i. This indicates that greater depth effectively reduces surface velocity, aiding in the interception of incoming oil. However, the relationship between submersion depth and oil interception efficiency is not monotonic. Increased submersion depth also substantially alters the flow field beneath the drum. At a depth of 3 cm, the vortex area formed directly underneath exceeds that at 1.5 cm and surpasses the area observed in the horizontal position. Despite the formation of a large sub-drum vortex, which prolongs oil contact, a critical limitation emerges. The downstream vortex detaches from the drum’s rear surface and migrates further downstream. This detachment reduces the vortex’s ability to trap oil against the oleophilic material on the drum’s downstream side. Consequently, while a 3 cm submersion depth creates a larger upstream vortex, the loss of the stabilizing downstream vortex leads to underutilization of the adsorbent material and can ultimately promote oil dispersion rather than containment. Thus, while increased submersion improves surface flow retardation beyond an optimal point identified here as 1.5 cm, the beneficial vortical structures become destabilized, thereby limiting overall effectiveness.
The simulations confirm that vortices generated under flow conditions help manage oil droplets not initially captured by the drum. These vortices create localized rotational flows that facilitate adsorption by the drum’s external material. Particularly when vortices are stable and flow velocity is low, the residence time of oil droplets near the drum is significantly extended, providing more time for the adsorption process. Conversely, if the vortex radius becomes excessively large, droplets at its periphery may bypass the drum entirely, leading to containment failure. Furthermore, vortices formed behind the drum should remain close to its surface to maximize the utilization of the adsorbent material on the rear side.
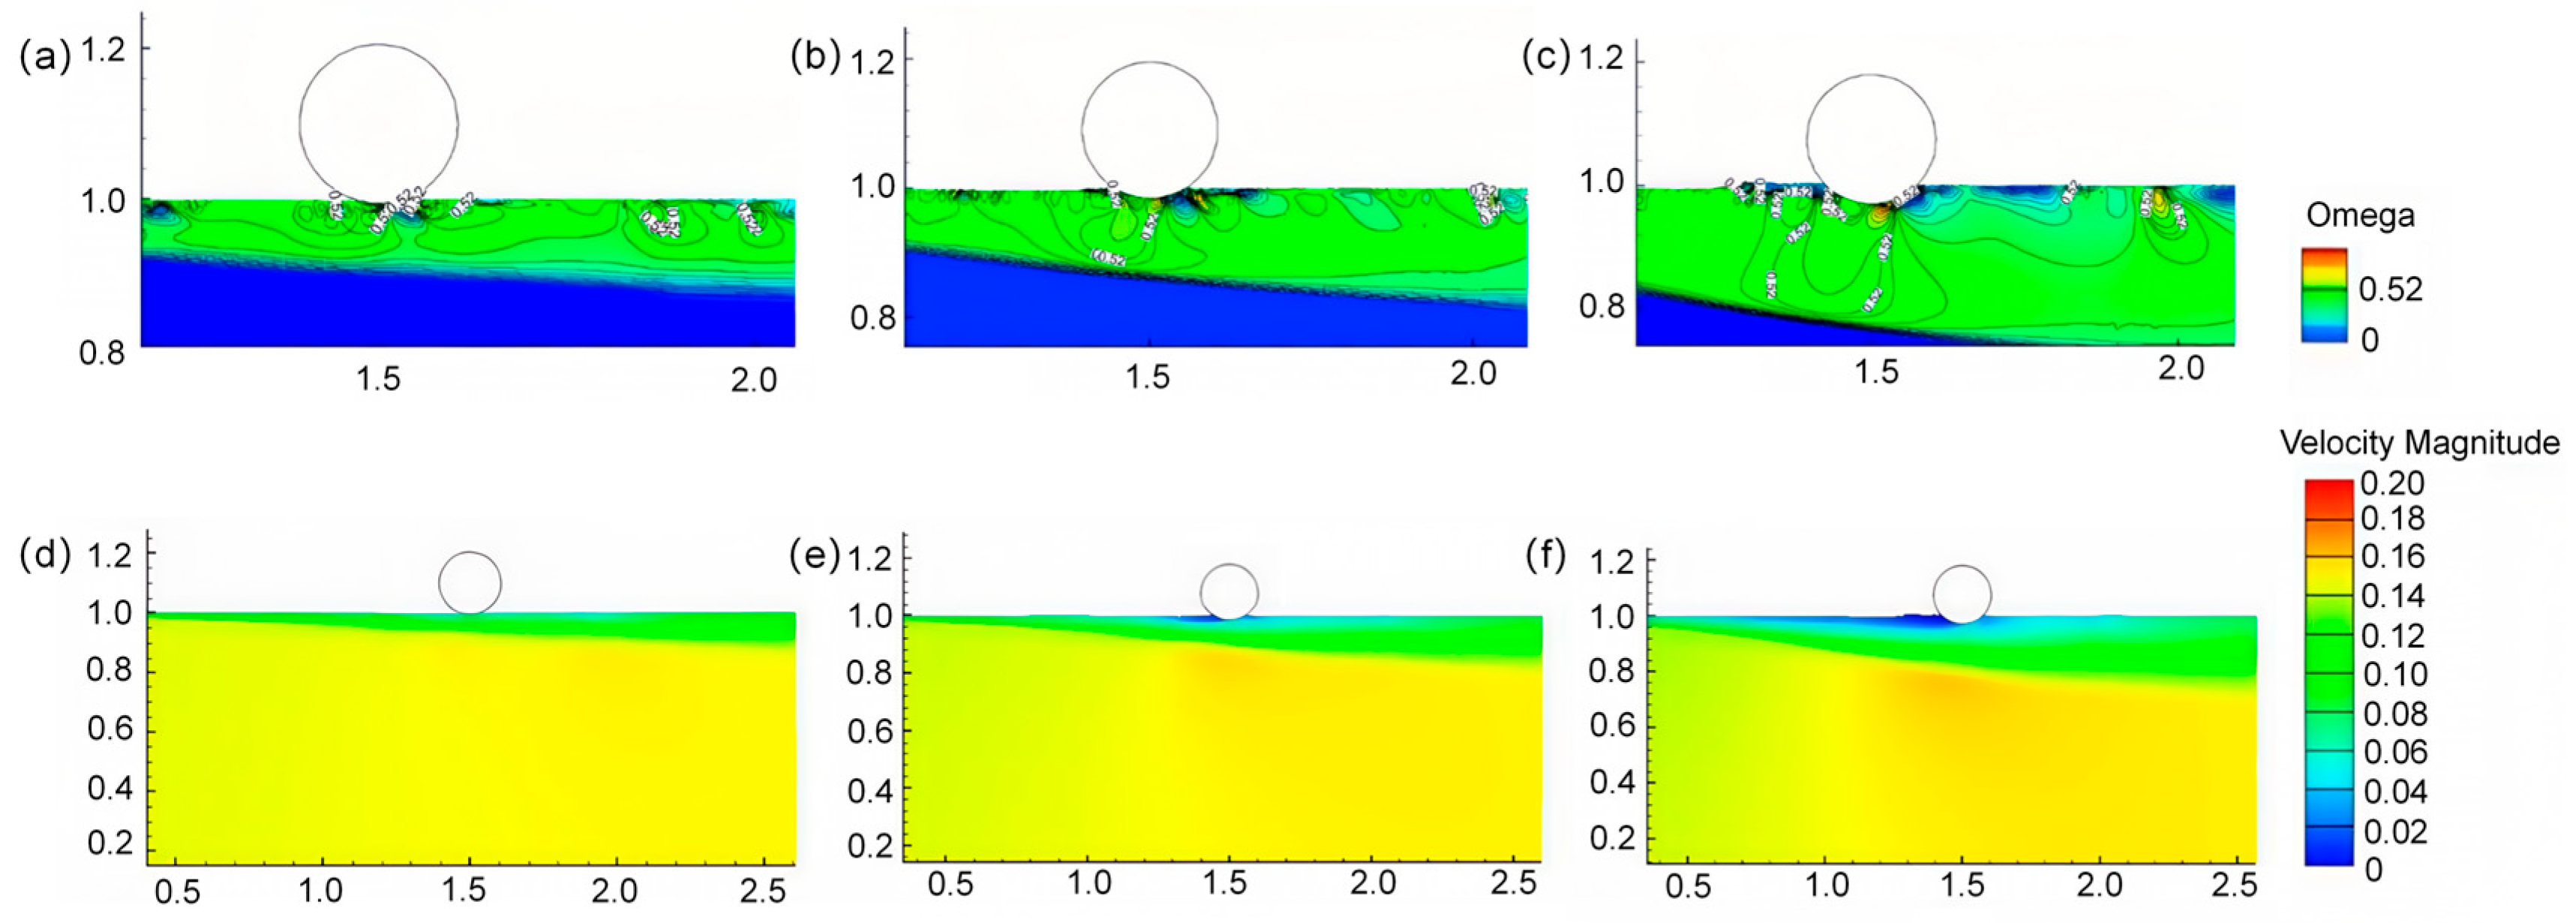
Flow field diagrams corresponding to three submersion depths at a velocity of 0.15 m/s were selected for analysis. The influence of the oil containment drums on the river water level intensified progressively with increasing submersion depth. The flow field was least affected when the drum rested horizontally on the water surface. As shown in Figure 4, the most significant reduction in upstream velocity was observed, indicating a substantial impact on the surface flow layer at the submersion depth of 3.0 cm.
Figure 4.
Contour maps and velocity cloud maps of Omega = 0.52 at different submergence depths at a flow rate of 0.15 m/s, where the immersion depth of the oil containment drum is 0.5 cm for (a,d), 1.5 cm for (b,e), and 3.0 cm for (c,f).
Interaction between the water surface and the drum generates two distinct flow behaviors: one portion of the flow passes beneath the drum, while another reverses direction, forming vortices. Vorticity plots for the three submersion depths at 0.15 m/s reveal that a depth of 0.5 cm produces minimal vortical activity due to the exceedingly small contact area with the flow; the region where Omega > 0.52 is negligible, exerting little influence on the overall flow. As the submersion depth increases, vortices begin to develop beneath and downstream of the drum. Notably, at the 3 cm depth, the vortex formed behind the drum is displaced further downstream, and the surface flow experiences greater impact from the incoming current. A stable vortex can only form at a distance from the drum, resulting in underutilization of the oleophilic material on the drum’s rear surface—unlike the scenario observed at the 1.5 cm depth. Consequently, despite the increased submersion, effective oil interception is not achieved under these conditions (Figure 4).
4.2. Flow State Analysis of Configuration of Oil Containment Nets
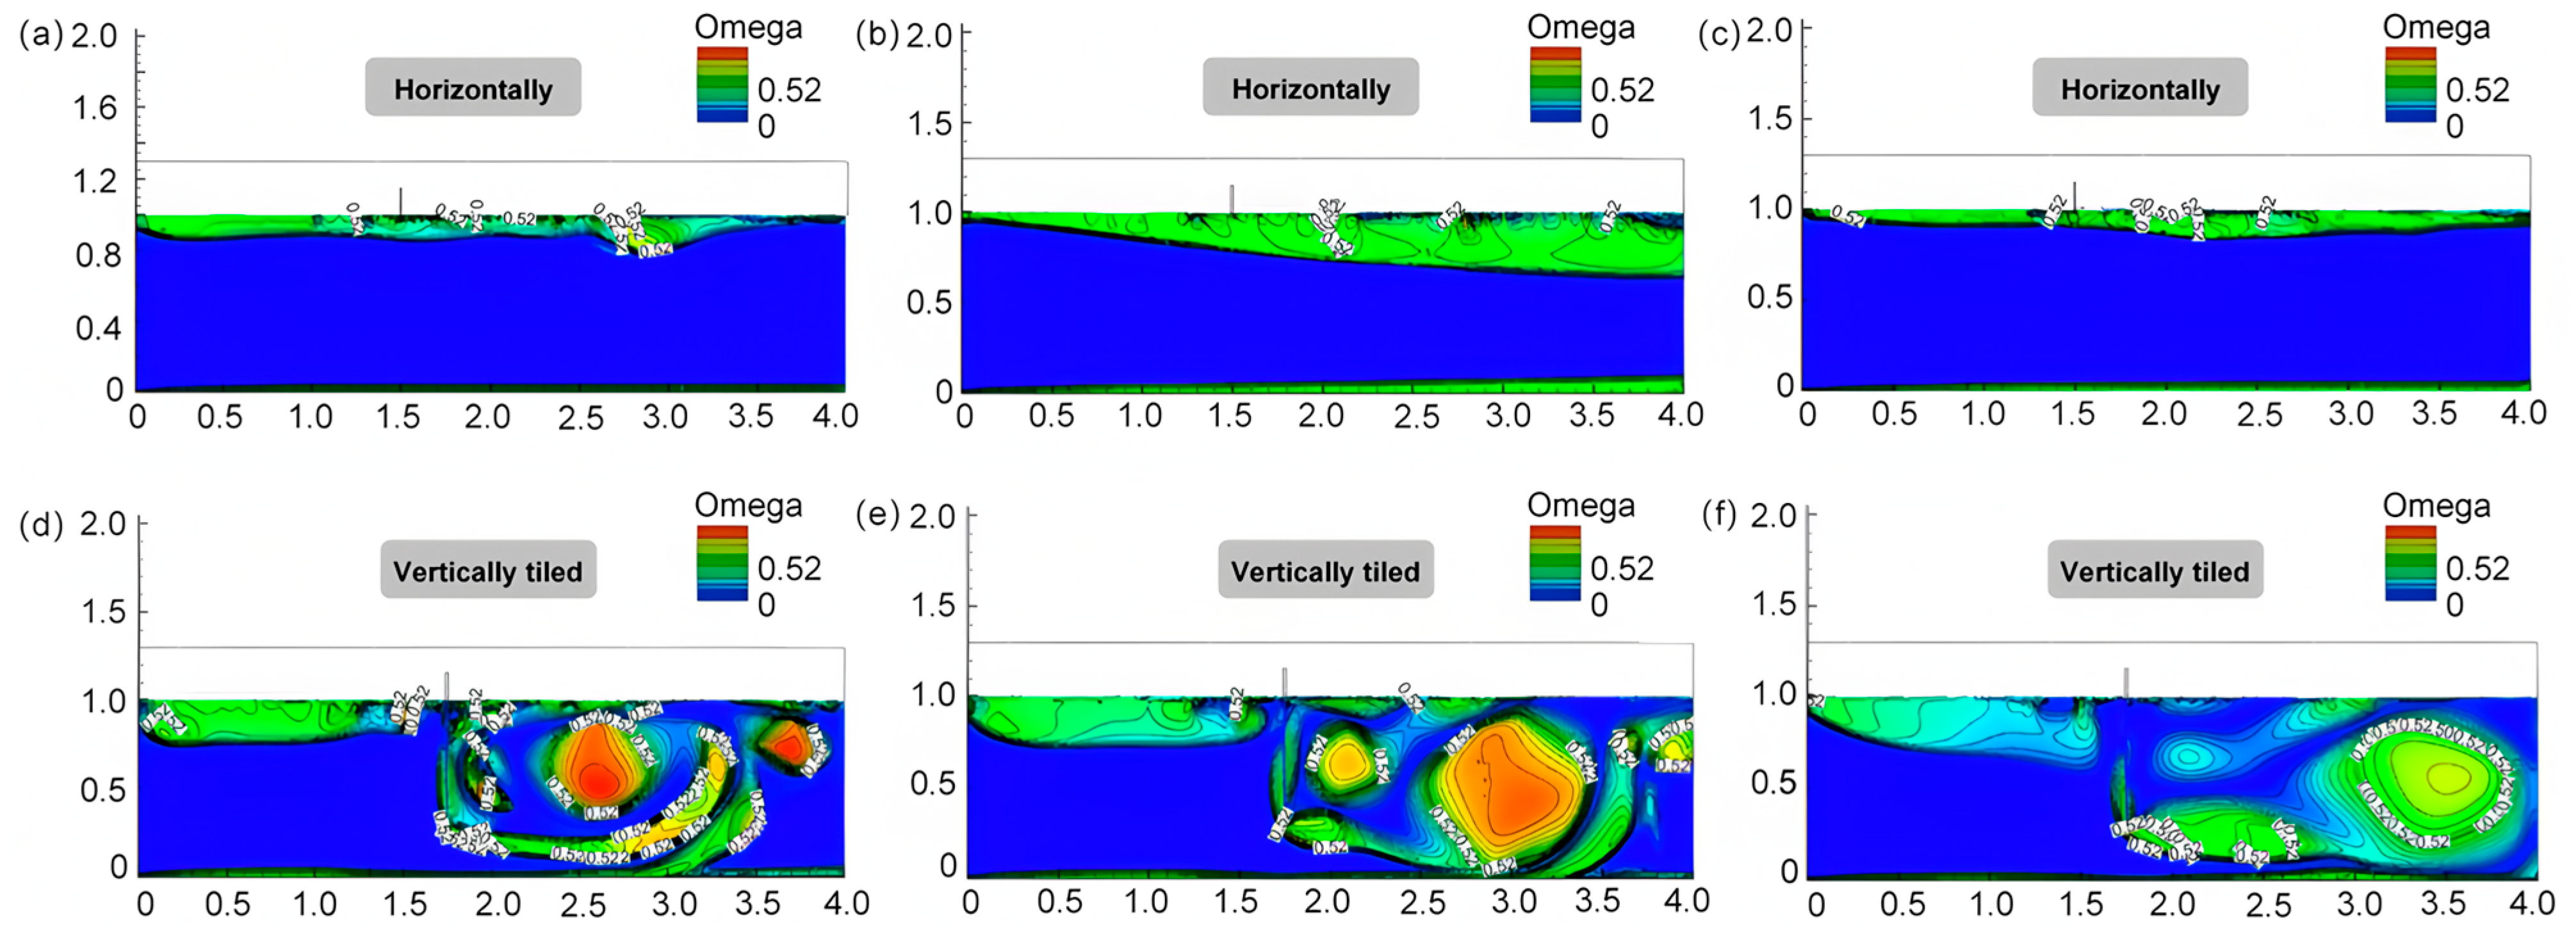
As shown in Figure 5a–c, under the horizontal deployment mode, the disturbance effect on water flow is relatively weak. At a flow velocity of 0.06 m/s, even though the contact area between the oil containment nets and the water flow is small, several vortices can still form in the water body, affecting the velocity field (Figure S4a–c). When the flow velocity increases to 0.15 m/s, the interference effect of the oil containment nets on the velocity field reaches its maximum under this flow condition. This phenomenon is similar, to some extent, to the flow disturbance observed when a wooden board is placed flat on the water surface [44]. When the flow velocity further increases to 0.21 m/s, the kinetic energy of the water flow becomes stronger, and the influence of the horizontally deployed sorbent nets on the velocity field relatively decreases, while the number of generated vortices is also significantly reduced. Therefore, in the event of an accidental oil pollutant spill in practical scenarios, the adsorption capacity of the sorbent nets may be limited when using a horizontal deployment method to address the oil spill, as the nets barely induce significant flow disturbance.
Figure 5.
Contour map of Omega = 0.52 when the oil containment net is laid horizontally and vertically tiled, where v = 0.06 m/s for (a,d), v = 0.15 m/s for (b,e), and v = 0.21 m/s for (c,f).
Figure 5d–f illustrates that when the oil containment net is deployed in a vertically tiled configuration, under the conditions of viscous and inertial resistances induced by the current porosity and fiber diameter, the vertical section of the containment net is almost impermeable to water. Assuming the containment net behaves as a rigid material with its lower end remaining stationary without deflection due to water flow, and disregarding factors such as localized damage or edge gaps, oil droplets can only penetrate the containment net material by passing through the gap beneath the net or by migrating through the upper layer after the sorbent reaches saturation. Owing to the obstructing effect of the containment net, a large vortex forms downstream of the net. As the flow velocity increases, this vortex gradually migrates away from the net. This occurs because the increased flow velocity results in a progressively higher flow rate through the underlying gap, thereby enhancing the transverse velocity, which carries the vortex away from the containment net. Consequently, the oil containment efficiency is substantially compromised.
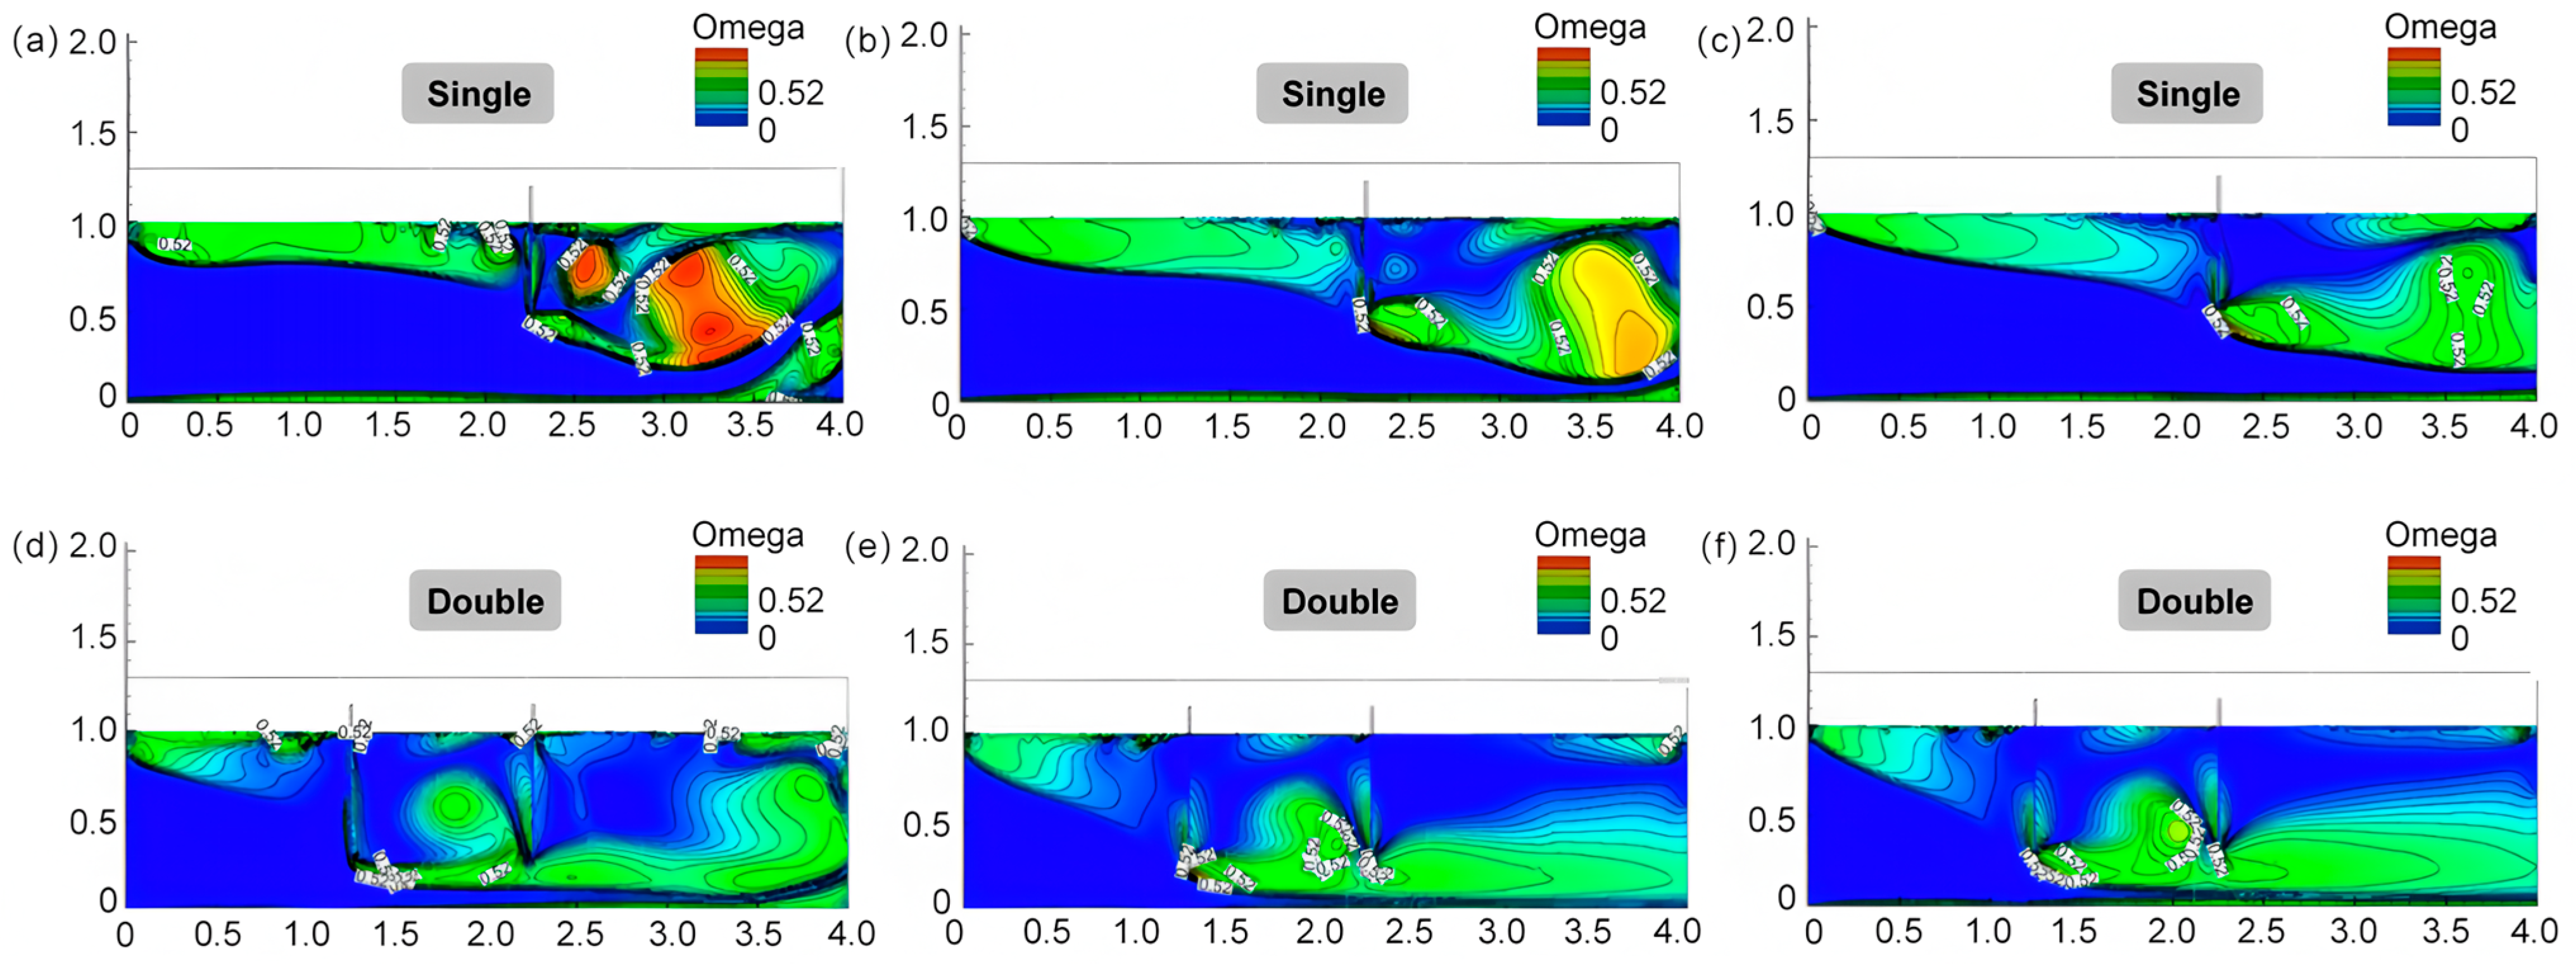
To improve oil containment efficiency, a double-layer vertical deployment method is introduced herein and compared with a single-layer setup through simulation. The velocity contour patterns for the single-layer vertical configuration align with previous findings [16]. Under higher flow velocities, assuming the hydrophobic/oleophilic net acts as a rigid barrier (analogous to a sluice gate in a channel), the flow velocity at the bottom of the net increases abruptly (Figure 6a–c). As the inflow velocity increases, the vortex region downstream of the net contracts significantly. This is likely due to the enhanced kinetic energy, which disrupts the stability and coherence of the vortex structure, preventing its sustained formation. Consequently, the turbulent intensity of the flow recovers rapidly after passing the net. The concomitant reduction in the area of the low-velocity vortex zone behind the net shortens the residence time of any entrapped oil, indicating a higher risk of oil spill breakthrough. Enhancing the size and stability of this vortex could improve oil removal efficiency by effectively capturing oil slicks that bypass the net and enter the downstream vortex region.
Figure 6.
Contour map of Omega = 0.52 when the oil interception net is placed vertically in a single layer and double layers, where v = 0.06 m/s for (a,d), v = 0.15 m/s for (b,e), and v = 0.21 m/s for (c,f).
For the double-layer net deployment, the configuration significantly influences the near-bed velocity profile, not only extending the zone of accelerated flow but also preventing the formation of a stable vortex behind the second layer (Figure 6d–f). This is primarily because the first net dissipates a substantial portion of the flow’s kinetic energy, resulting in a minimal velocity differential across the second net. The advantage of this layout for oil interception lies in the low-velocity zone created between the two nets. This area, characterized by vortical structures and reduced flow velocity, acts as a containment region for oil accumulation. Experimental results confirm the significant effectiveness of this configuration for oil spill remediation.
By comparing the Omega contour plots of the four deployment methods, this section demonstrates that their oil removal mechanisms rely not solely on the material’s oleophilic/hydrophobic properties but also on their distinct influences on the channel hydraulics. The vertically draped configuration promotes vortex formation behind the net across various flow rates. The surface-laid section of the net creates a quasi-”wall” effect, stagnating the surface flow and further increasing the hydraulic residence time of oil droplets downstream, thereby enhancing removal efficiency. Similarly, the double-layer setup creates a velocity “depression” between the nets, where vortex generation prolongs oil droplet retention, significantly improving oil capture performance.
4.3. Performance of Combined Mode
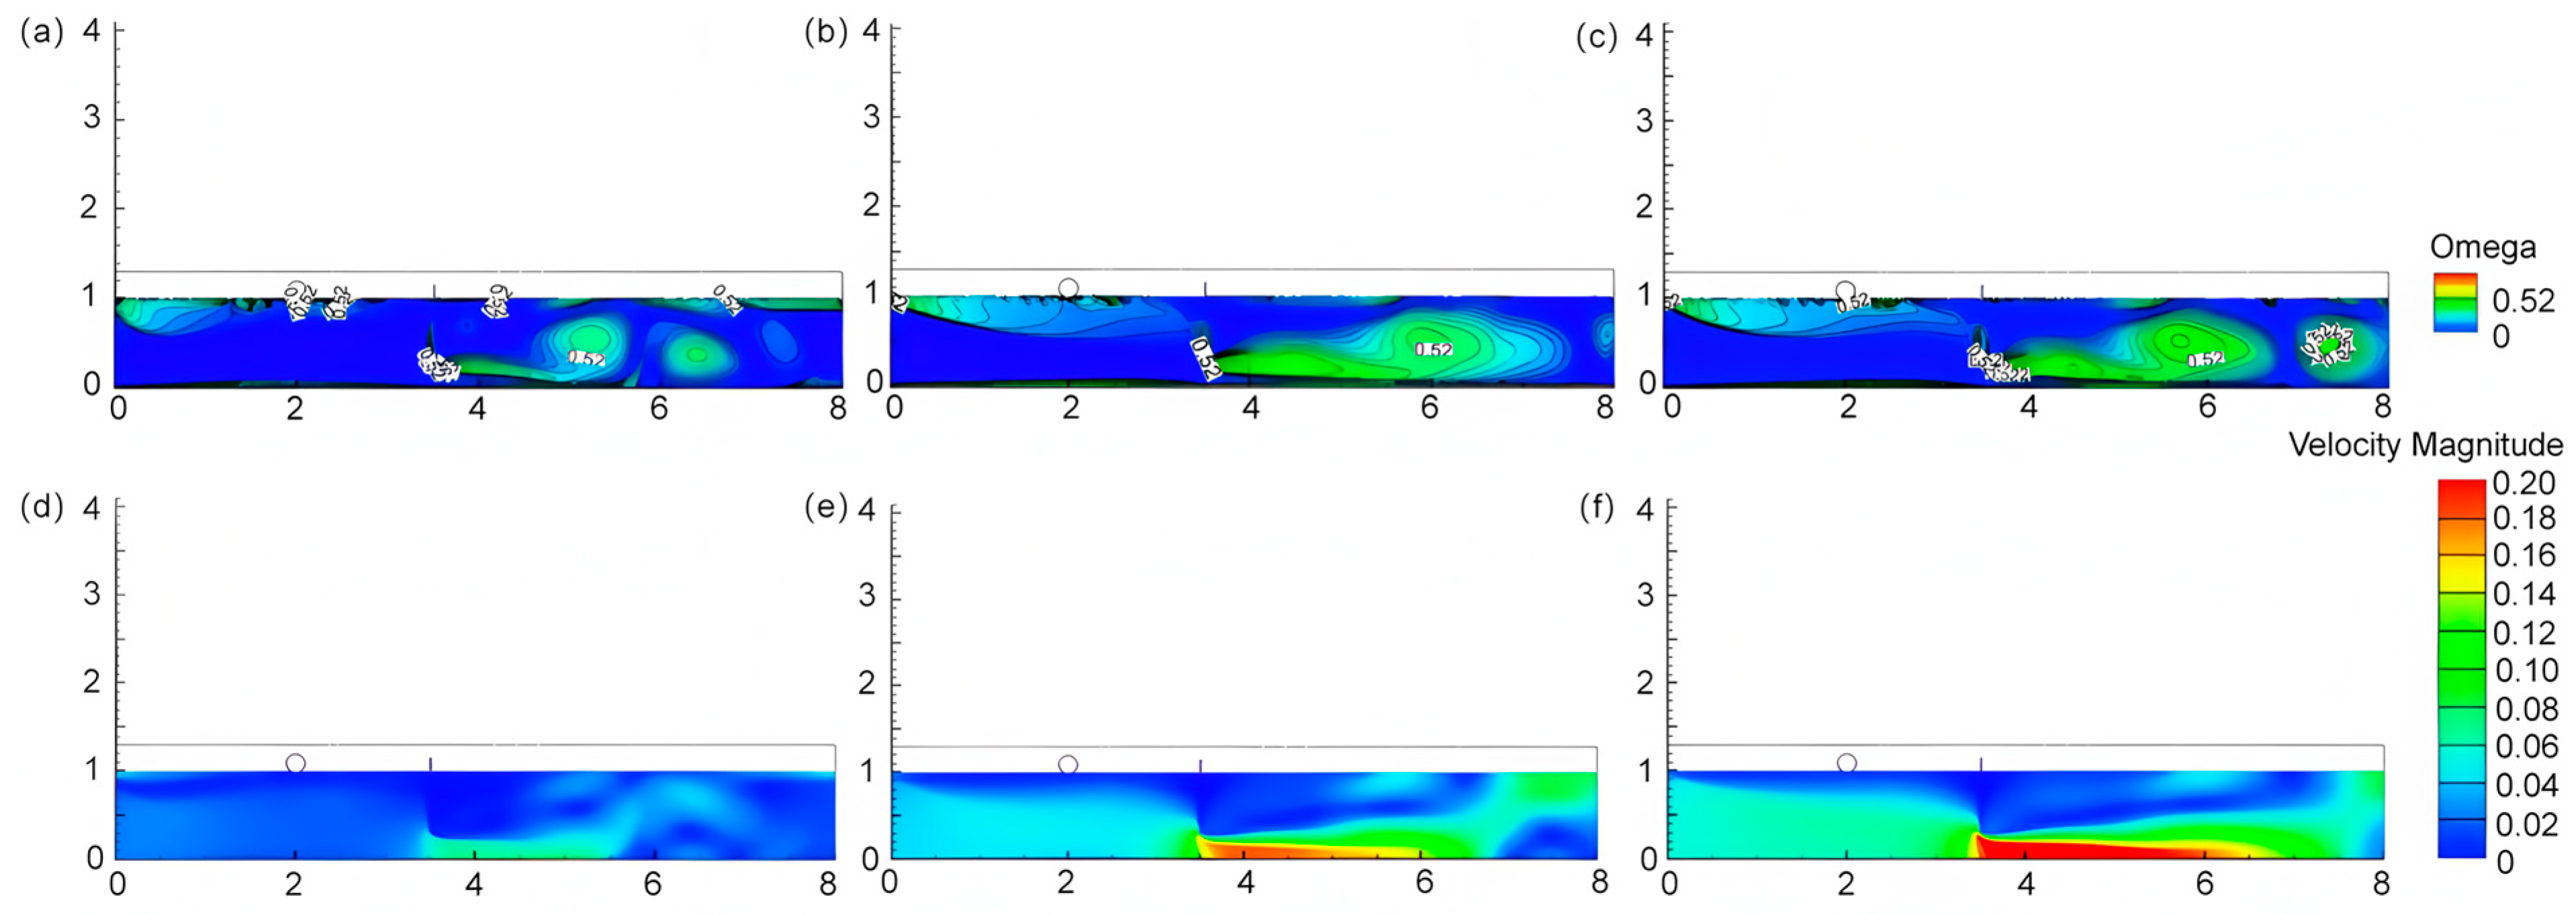
Based on the optimized parameters identified in Section 4.1 and Section 4.2—specifically, a drum submersion depth of 1.5 cm and a vertically draped net configuration—the hydrodynamic performance of the combined system was further evaluated. Figure 7 reveals that a significant vortex separation phenomenon occurs at the rear end of the oil containment drums. Although the vortex area behind the oil containment drums does not differ significantly from when it is set alone, when combining processes are set up, the advantageous vortex area generated by both the drums and nets can be fully utilized to enhance the oil spill response effectiveness compared to using the oil containment drums alone.
Figure 7.
Contour map and velocity cloud maps of Omega = 0.52 under the combined mode (oil barrel submergence depth of 1.5 cm + vertically laid oil containment nets), where (a,d) v = 0.06 m/s, (b,e) v = 0.15 m/s, and (c,f) v = 0.21 m/s.
It was also observed that vortex shedding occurs behind the net, which likely explains the phased variation in oil concentration at the outlet. Since the vortex region is not stationary, the vortical structures downstream of the net intensify over time until they reach a critical state, after which they are advected away by the flow. Consequently, oil droplets temporarily stored within these vortices are carried downstream and eventually escape the containment area.
5. Conclusions
(1) Simulation calculations of traditional oil containment drums show that the critical flow velocity for oil droplet entrainment failure is 0.23 m/s. The calculation results in this paper are in good agreement with experimental data, confirming that the calculation method is reasonable and effective.
(2) Based on the Omega criterion, an increase in submergence depth will generate eddies before and after the oil containment drums, which assist in controlling oil spills. However, when the submergence depth reached 3 cm, the vortex at the back moved away from the drums, reducing contact time and causing oil spills to pass over faster, leading to failure.
(3) Through comparative analysis of the flow states of four installation methods of oil containment nets, three main reasons for the nets to intercept oil spills were identified: Firstly, as a porous medium, the oil containment nets absorb oil below the water surface; secondly, secondly, the double-layer arrangement creates an intermediate space, forming a low-flow-rate oil storage zone, requiring oil spills to break through twice; finally, the vertical tiling method creates a static wall effect on the water surface, forming a stable vortex in the enclosed right-angle area, increasing the residence time of oil spills at the back.
(4) When setting up a combination process, the favorable vortex area generated by oil containment drums and nets can be fully utilized to improve oil spill control. Additionally, vortex shedding was observed at the rear end of the nets. The oil amount measured at the outlet at a certain time may be a vortex or a combination of vortices, which could be the reason for periodic changes in diesel concentration at the outlet.
Supplementary Materials
The following supporting information can be downloaded at: https://www.mdpi.com/article/10.3390/w18101173/s1, Text S1: Control equations of three-phase flow model; Figure S1: Fluid dynamics simulation device; Figure S2: Installation methods of the oil containment nets: (a) vertically arranged in a single layer, (b) horizontally arranged, (c) vertically arranged in double layers, and (d) vertically arranged in a tiled configuration; Figure S3: Velocity contour maps with Omega = 0.52 at different flow velocities (0.06 m/s, 0.15 m/s, and 0.21 m/s). The submergence depths are 0.5 cm for (a–c), 1.5 cm for (d–f), and 3.0 cm for (g–i); Figure S4: Velocity contour plots of Omega = 0.52 for oil containment nets laid horizontally and vertically: 0.06 m/s for (a,d); 0.15 m/s for (b,e); and 0.21 m/s for (c,f).
Author Contributions
L.L.: conceptualization, formal analysis, writing—original draft; Z.P.: data curation, writing—review and editing; Z.Z.: investigation, writing—review and editing; T.Z.: supervision, writing—review and editing, funding acquisition. All authors have read and agreed to the published version of the manuscript.
Funding
This work was supported by the National Natural Science Foundation of China (Nos. 52370017, 52270010, and 52070144) and the Research Program of Tongji Architectural Design (Group) Co., Ltd. (No. 2023J-JB10).
Data Availability Statement
The original contributions presented in this study are included in the article/Supplementary Material. Further inquiries can be directed to the corresponding author.
Conflicts of Interest
The authors declare that this study received funding from the National Natural Science Foundation of China, and Research Program of Tongji Architectural Design (Group) Co., Ltd. The funder was not involved in the study design, collection, analysis, interpretation of data, the writing of this article, or the decision to submit it for publication.
References
- Larsen, T.A.; Hoffmann, S.; Lüthi, C.; Truffer, B.; Maurer, M. Emerging solutions to the water challenges of an urbanizing world. Science 2016, 352, 925–928. [Google Scholar] [CrossRef] [Scilit] [PubMed]
- Shu, X.; Xu, L.; Yang, M.; Qin, Z.; Zhang, Q.; Zhang, L. Spatial distribution characteristics and migration of microplastics in surface water, groundwater and sediment in karst areas: The case of Yulong River in Guilin, Southwest China. Sci. Total Environ. 2023, 868, 161578. [Google Scholar] [CrossRef] [Scilit]
- Agbasi, J.C.; Egbueri, J.C.; Pande, C.B.; Khan, M.Y.A.; Ighalo, J.O.; Uwajingba, H.C.; Abba, S.I. Review of the Potential Effects and Remediation Strategies of Microplastic Pollutants in Drinking Water Sources. Anal. Lett. 2024, 58, 799–839. [Google Scholar] [CrossRef] [Scilit]
- Guan, B.; Zhan, R.; Lin, H.; Huang, Z. Review of state of the art technologies of selective catalytic reduction of NOx from diesel engine exhaust. Appl. Therm. Eng. 2014, 66, 395–414. [Google Scholar] [CrossRef] [Scilit]
- Falih, K.T.; Razali, S.F.M.; Maulud, K.N.A.; Rahman, N.A.; Abba, S.I.; Yaseen, Z.M. Assessment of petroleum contamination in soil, water, and atmosphere: A comprehensive review. Int. J. Environ. Sci. Technol. 2024, 21, 8803–8832. [Google Scholar] [CrossRef] [Scilit]
- Strandberg, J.; Waldetoft, H.; Egelrud, L.; Backlund, A.; Cascone, C.; Thorsén, G.; Potter, A.; Giovanoulis, G. Characterization of fuel-induced water contamination: Chemical composition, odor threshold, and ecotoxicological implications. J. Environ. Expo. Assess. 2024, 3, 20. [Google Scholar] [CrossRef] [Scilit]
- Xie, C.; Huang, L.; Deng, J.; Wang, R.; Hao, G. Hazard assessment and hazard mitigation of fuel leak inside a ship elevator for LNG-fueled vessel. Ocean Eng. 2022, 259, 111943. [Google Scholar] [CrossRef] [Scilit]
- Irorere, V.U.; Tripathi, L.; Marchant, R.; Mcclean, S.; Banat, I.M. Microbial rhamnolipid production: A critical re-evaluation of published data and suggested future publication criteria. Appl. Microbiol. Biotechnol. 2017, 101, 3941–3951. [Google Scholar] [CrossRef] [Scilit]
- Jamaly, S.; Giwa, A.; Hasan, S.W. Recent improvements in oily wastewater treatment: Progress, challenges, and future opportunities. J. Environ. Sci. 2015, 37, 15–30. [Google Scholar] [CrossRef] [Scilit]
- Bi, H.; Mulligan, C.N.; Zhang, B.; Biagi, M.; An, C.; Yang, X.; Lyu, L.; Chen, X. A review on recent development in the use of surface washing agents for shoreline cleanup after oil spills. Ocean Coast. Manag. 2023, 245, 106877. [Google Scholar] [CrossRef] [Scilit]
- Sun, C.; Leiknes, T.; Weitzenböck, J.; Thorstensen, B. Development of a biofilm-MBR for shipboard wastewater treatment: The effect of process configuration. Desalination 2010, 250, 745–750. [Google Scholar] [CrossRef] [Scilit]
- Nandi, B.K.; Moparthi, A.; Uppaluri, R.; Purkait, M.K. Treatment of oily wastewater using low cost ceramic membrane: Comparative assessment of pore blocking and artificial neural network models. Chem. Eng. Res. Des. 2010, 88, 881–892. [Google Scholar] [CrossRef] [Scilit]
- Xiong, D.; Duan, M.; Gao, X.; Yang, B.; Ding, G. Effects of Chemically Dispersed Oil on DNA Damage of Sea Urchin. Aquat. Procedia 2015, 3, 209–215. [Google Scholar] [CrossRef] [Scilit]
- Dussauze, M.; Danion, M.; Le Floch, S.; Lemaire, P.; Theron, M.; Pichavant-Rafini, K. Growth and immune system performance to assess the effect of dispersed oil on juvenile sea bass (Dicentrarchus labrax). Ecotoxicol. Environ. Saf. 2015, 120, 215–222. [Google Scholar] [CrossRef] [Scilit]
- Ngamlerdpokin, K.; Kumjadpai, S.; Chatanon, P.; Tungmanee, U.; Chuenchuanchom, S.; Jaruwat, P.; Lertsathitphongs, P.; Hunsom, M. Remediation of biodiesel wastewater by chemical- and electro-coagulation: A comparative study. J. Environ. Manag. 2011, 92, 2454–2460. [Google Scholar] [CrossRef] [Scilit] [PubMed]
- Churipard, S.R.; Kanakikodi, K.S.; Rambhia, D.A.; Raju, C.S.K.; Halgeri, A.B.; Choudary, N.V.; Ganesh, G.S.; Ravishankar, R.; Maradur, S.P. Porous polydivinylbenzene (PDVB) as an efficient adsorbent for hydrocarbons: Effect of porogens on adsorption capacity. Chem. Eng. J. 2020, 380, 122481. [Google Scholar] [CrossRef] [Scilit]
- Van Truong, D.; Le, S.T.Q.; Bui, H.M. Development of an oil-absorbent web by the dry-laid method from polypropylene and chemically treated kapok. Res. J. Text. Appar. 2022, 28, 100–119. [Google Scholar] [CrossRef] [Scilit]
- Wang, B.; Liang, W.; Guo, Z.; Liu, W. Biomimetic super-lyophobic and super-lyophilic materials applied for oil/water separation: A new strategy beyond nature. Chem. Soc. Rev. 2015, 44, 336–361. [Google Scholar] [CrossRef] [Scilit] [PubMed]
- Chen, P.C.; Xu, Z.K. Mineral-Coated Polymer Membranes with Superhydrophilicity and Underwater Superoleophobicity for Effective Oil/Water Separation. Sci. Rep. 2013, 3, 2776. [Google Scholar] [CrossRef] [Scilit]
- Liu, X.; Ge, L.; Li, W.; Wang, X.; Li, F. Layered Double Hydroxide Functionalized Textile for Effective Oil/Water Separation and Selective Oil Adsorption. ACS Appl. Mater. Interfaces 2014, 7, 791–800. [Google Scholar] [CrossRef] [Scilit]
- Chu, Z.; Feng, Y.; Seeger, S. Oil/Water Separation with Selective Superantiwetting/Superwetting Surface Materials. Angew. Chem. Int. Ed. 2014, 54, 2328–2338. [Google Scholar] [CrossRef] [Scilit]
- Raznahan, M.; An, C.; Li, S.S.; Geng, X.; Boufadel, M. Multiphase CFD simulation of the nearshore spilled oil behaviors. Environ. Pollut. 2021, 288, 117730. [Google Scholar] [CrossRef] [Scilit]
- Blocken, B. Computational Fluid Dynamics for urban physics: Importance, scales, possibilities, limitations and ten tips and tricks towards accurate and reliable simulations. Build. Environ. 2015, 91, 219–245. [Google Scholar] [CrossRef] [Scilit]
- Kumar, R.; Banerjee, S.; Banik, A.; Bandyopadhyay, T.K.; Naiya, T.K. Simulation of single phase non-Newtonian flow characteristics of heavy crude oil through horizontal pipelines. Pet. Sci. Technol. 2017, 35, 615–624. [Google Scholar] [CrossRef] [Scilit]
- Feng, X.; Wu, W.Q.; Zhang, F.L. The Deflection Angle Impact on the Oil Containment by Boom Based on the Numerical Wave Flume. Adv. Mater. Res. 2011, 183–185, 495–499. [Google Scholar] [CrossRef] [Scilit]
- Shi, Y.; Li, S.; Zhang, H.; Peng, S.; Chen, H.; Zhou, R.; Mao, T. Numerical modeling of floating oil boom motions in wave-current coupling conditions. J. Ocean Univ. China 2017, 16, 602–608. [Google Scholar] [CrossRef] [Scilit]
- Amini, A.; Schleiss, A.J. Numerical Modeling of Oil-Water Multiphase Flow Contained by an Oil Spill Barrier. Eng. Appl. Comput. Fluid. Mech. 2009, 3, 207–219. [Google Scholar] [CrossRef] [Scilit]
- Hou, T.; Sun, H.; Jiao, B.; Wang, G.; Lin, H.; Liu, H.; Gao, B. Numerical and experimental study of oil boom motion response and oil-stopping effect under wave-current action. Ocean Eng. 2024, 291, 116439. [Google Scholar] [CrossRef] [Scilit]
- Feng, X.; Shi, Y. Numerical Study of Containment of Spilled Medium-Viscosity Oil in Wave–Current Flow. J. Eng. Mech. 2019, 145, 04019056. [Google Scholar] [CrossRef] [Scilit]
- Fonty, T.; Ferrand, M.; Leroy, A.; Joly, A.; Violeau, D. Mixture model for two-phase flows with high density ratios: A conservative and realizable SPH formulation. Int. J. Multiph. Flow. 2019, 111, 158–174. [Google Scholar] [CrossRef] [Scilit]
- Babaei, H.; Baker, S.; Cornett, A.; Pilechi, A. Two-Dimensional Computational and Physical Modeling of High-Speed Oil Spill Containment Booms. J. Waterw. Port. Coast. Ocean Eng. 2021, 147, 04021032. [Google Scholar] [CrossRef] [Scilit]
- Luz, B.R.D. Attenuated total reflectance spectroscopy of plant leaves: A tool for ecological and botanical studies. New Phytol. 2006, 172, 305–318. [Google Scholar] [CrossRef] [Scilit]
- Qiu, L.; Chen, X.D.; Wang, R.; Wang, D.P. Macro fluid analysis of laminated fabric permeability. Therm. Sci. 2016, 20, 835–838. [Google Scholar] [CrossRef] [Scilit]
- Chandrakant, S.; Panchal, H.; Sadasivuni, K.K. Numerical simulation of flow-through heat exchanger having helical flow passage using high order accurate solution dependent weighted least square based gradient calculations. Energy Sources Part A-Recovery Util. Environ. Eff. 2021, 47, 5818–5842. [Google Scholar] [CrossRef] [Scilit]
- Zhu, H.; Lin, P.; Pan, Q. A CFD (computational fluid dynamic) simulation for oil leakage from damaged submarine pipeline. Energy 2014, 64, 887–899. [Google Scholar] [CrossRef] [Scilit]
- Kim, S.; Kim, C.; Kim, B.; Jang, H.; Kim, I.; Lee, Y.H. A Study Comparing the Subsurface Vortex Characteristics in Pump Sumps. Energies 2022, 15, 5049. [Google Scholar] [CrossRef] [Scilit]
- Liu, C.; Wang, Y.; Yong, Y.; Duan, Z. New omega vortex identification method. Sci. China Phys. Mech. Astron. 2016, 59, 684711. [Google Scholar] [CrossRef] [Scilit]
- Xu, B.; Zhang, Z.; Hou, W.; Yang, S.; Tang, Y.; Ren, X.; Zhang, T. Optimization of reservoir oil booms and algae-blocking nets for the prevention and control of petroleum pollution. J. Tongji Univ. (Nat. Sci.) 2023, 51, 1489–1495. [Google Scholar]
- Demirel, E.; Aral, M.M. A Design for Vortex Suppression Downstream of a Submerged Gate. Water 2020, 12, 750. [Google Scholar] [CrossRef] [Scilit]
- Goodman, R.H.; Brown, H.M.; An, C.F.; Rowe, R.D. Dynamic modelling of oil boom failure using computational fluid dynamics. Spill Sci. Technol. Bull. 1996, 3, 213–216. [Google Scholar] [CrossRef] [Scilit]
- Brown, H.M.; Goodman, R.H.; An, C.F.; Bittner, J. Boom failure mechanisms: Comparison of channel experiments with computer modelling results. Spill Sci. Technol. Bull. 1996, 3, 217–220. [Google Scholar] [CrossRef] [Scilit]
- Delvigne, G.A.L. Laboratory Experiments on Oil Spill Protection of a Water Intake. In Oil in Freshwater: Chemistry, Biology, Countermeasure Technology; Pergamon: Oxford, UK, 1987; pp. 446–458. [Google Scholar] [CrossRef] [Scilit]
- Zhang, Y.N.; Liu, K.H.; Li, J.W.; Xian, H.Z.; Du, X.Z. Analysis of the vortices in the inner flow of reversible pump turbine with the new omega vortex identification method. J. Hydrodyn. B 2018, 30, 463–469. [Google Scholar] [CrossRef] [Scilit]
- Wang, J.; Wang, S.Q.; Jiang, Q.D.; Xu, Y.X.; Shi, W.C. Effect of Different Raft Shapes on Hydrodynamic Characteristics of the Attenuator-Type Wave Energy Converter. China Ocean Eng. 2023, 37, 645–659. [Google Scholar] [CrossRef] [Scilit]

Disclaimer/Publisher’s Note: The statements, opinions and data contained in all publications are solely those of the individual author(s) and contributor(s) and not of MDPI and/or the editor(s). MDPI and/or the editor(s) disclaim responsibility for any injury to people or property resulting from any ideas, methods, instructions or products referred to in the content. |
© 2026 by the authors. Licensee MDPI, Basel, Switzerland. This article is an open access article distributed under the terms and conditions of the Creative Commons Attribution (CC BY) license.