


Abstract
Coral reefs exposed to chronically turbid conditions challenge conventional assumptions about the optical environments required for reef persistence and productivity. This study investigates the utility of light absorption coefficients as indicators of optical water quality in Varadero Reef, an extreme coral ecosystem located in Cartagena Bay, Colombia. Field campaigns were conducted across three seasons (rainy, dry, and transitional) along a transect from fluvial to marine influence. Absorption coefficients at 440 nm were derived for particulate (ap(440)) and chromophoric dissolved organic matter (aCDOM(440)) to assess their contribution to underwater light attenuation. Average values across seasons show that ap(440) reached 0.466 m−1 in the rainy season (September 2021), 0.285 m−1 in the dry season (February 2022), and 0.944 m−1 in the transitional rainy season (June 2022). Meanwhile, mean aCDOM(440) values were 0.368, 0.111, and 0.552 m−1, respectively. These coefficients reflect the dominant influence of particulate absorption under turbid conditions and increasing aCDOM(440) relevance during lower turbidity periods. Mean Secchi Disk Depth (ZSD) ranged from 0.6 m in the rainy season to 3.0 m in the dry season, aligning with variations in Kd PAR, which averaged 2.63 m−1, 1.13 m−1, and 1.08 m−1 for the three campaigns. Chlorophyll-a concentrations at 1 m depth also varied significantly, with average values of 2.3, 2.7, and 6.2 μg L−1, indicating phytoplankton biomass peaks associated with seasonal freshwater inputs. While particulate absorption limits light penetration, CDOM plays a potentially photoprotective role by attenuating UV radiation. The observed variability in these optical constituents reflects complex hydrodynamic and environmental gradients, providing insight into the mechanisms that sustain coral functionality under suboptimal light conditions. The absorption-based approach applied here, using standardized spectrophotometric methods, proved to be a reliable and reproducible tool for characterizing the spatial and temporal variability of IOPs. We propose integrating these indicators into monitoring frameworks as cost-effective, component-resolving tool for evaluating light regimes and ecological resilience in optically dynamic coastal systems.
1. Introduction
Reef-forming corals (Scleractinians) are typically found in environments with low sedimentation, limited nutrient input, clear waters, and stable salinities between 33 and 36 PSS. Nevertheless, some coral reefs persist under extreme environmental conditions that deviate markedly from these norms, challenging traditional ecological assumptions. In the Cartagena Bay for example, according to Davis et al. [1], the most extreme mixed turbid environment in the Caribbean and western Atlantic region, named Varadero reef, is characterized by its high turbidity, largely related to coastal development, industrial and sewage wastewater, and sediment discharge from the Magdalen River [2,3,4].
Previous studies at Varadero Reef indicate that this ecosystem is mainly constituted of large colonies of Orbicella spp., which represent 80% of its cover and are predominantly located towards the shallower portions of the reef [5,6]. Despite an adverse environmental condition described by the authors, interesting ecological aspects have been studied in this extreme coral reef. For example, the reef structure and species composition demonstrate that Varadero Reef is a functional ecosystem [6], with high fish species richness [4], high species richness of Scleractinian coral, and the presence of other groups (hydrocorals, sponges, lobsters and sea urchins), distributed in a very similar way to the typical zonation of a Caribbean fringing reef [6]. The structure and species composition of Varadero closely resemble those of a typical Caribbean fringing reef. This raises a critical question: how can a reef exposed to chronic turbidity maintain high ecological integrity and functional resilience?
A plausible explanation lies in the distinct optical properties of the water column. Reefs in turbid environments such Varadero may exhibit adaptations to low-light conditions, likely mediated by interactions between light and suspended or dissolved constituents—mechanisms that remain insufficiently understood [7]. For instance, suspended sediments can mitigate ultraviolet (UV) radiation stress, as noted by López-Londoño et al. [3]. These interactions shape the underwater light field, influencing critical processes such as photosynthesis, primary production, and visual perception for reef organisms. Understanding how different optical constituents contribute to light attenuation is therefore essential not only for evaluating water quality but also for interpreting the ecological functionality and resilience of coral ecosystems exposed to high turbidity.
However, traditional water quality assessments in marine-coastal systems often rely on general metrics such as Secchi disk depth, turbidity, chlorophyll-a concentration, and multisonde-derived variables like pH, dissolved oxygen, and temperature. In some cases, nutrient concentrations—particularly phosphates originating from domestic wastewater and detergents—are also included. These conventional metrics are typically aimed at detecting nutrient pollution, algal blooms, and general suspended material, without distinguishing the specific contributions of the particulate and dissolved fractions that govern underwater light fields [8,9]. As a result, inherent optical properties (IOPs)—such as light absorption coefficients—remain underutilized in the evaluation of water quality in coastal ecosystems, despite their capacity to provide detailed information on the distribution and interactions of these optical components.
Light absorption coefficients provide a robust framework to understand how different water constituents influence underwater light availability. The particulate fraction—encompassing both organic and inorganic particles—can signal sediment inputs, resuspension processes, and biological activity, thereby modulating light penetration in the water column. In contrast, the dissolved fraction, particularly chromophoric dissolved organic matter (CDOM), reflects contributions from riverine discharge and anthropogenic sources and can alter both light attenuation and photochemical processes [10]. Incorporating inherent optical property (IOP) measurements into coastal water studies is thus essential for improving our understanding of optical and ecological variability in systems such as Varadero Reef, where light availability is both critical and highly dynamic.
A key aspect of this study is the role of dissolved and particulate fractions in modulating the underwater light climate. The dissolved component, particularly chromophoric dissolved organic matter (CDOM), plays a crucial role in attenuating ultraviolet (UV) radiation, potentially serving as a photoprotective mechanism in turbid coral reef environments. CDOM acts as a natural spectral filter, selectively absorbing short wavelengths and thereby reducing photochemical stress on photosynthetic organisms [11,12]. At the same time, elevated concentrations of suspended particulate matter can significantly limit light penetration but may also stabilize the surface light environment by buffering daily or seasonal fluctuations in irradiance [7].
By investigating these properties, this study aims to demonstrate the utility of light absorption coefficients in assessing optical water quality under extreme conditions. We propose a methodological framework that emphasizes IOPs as key indicators, particularly suited for dynamic environments influenced by a mix of fluvial, marine, and human activities. This approach seeks to improve both ecological monitoring and management strategies for vulnerable coastal systems, including turbid coral reefs.
2. Materials and Methods
This section describes the study area and sampling strategy, followed by an overview of conventional water quality metrics. It then introduces the proposed optical methods for quantifying the contributions of light-absorbing constituents—grouped as particulate matter and dissolved matter (CDOM). Lastly, we describe the environmental and sedimentary variables used to contextualize the seasonal variability in optical properties.
2.1. Study Area: Cartagena Bay and Varadero Reef
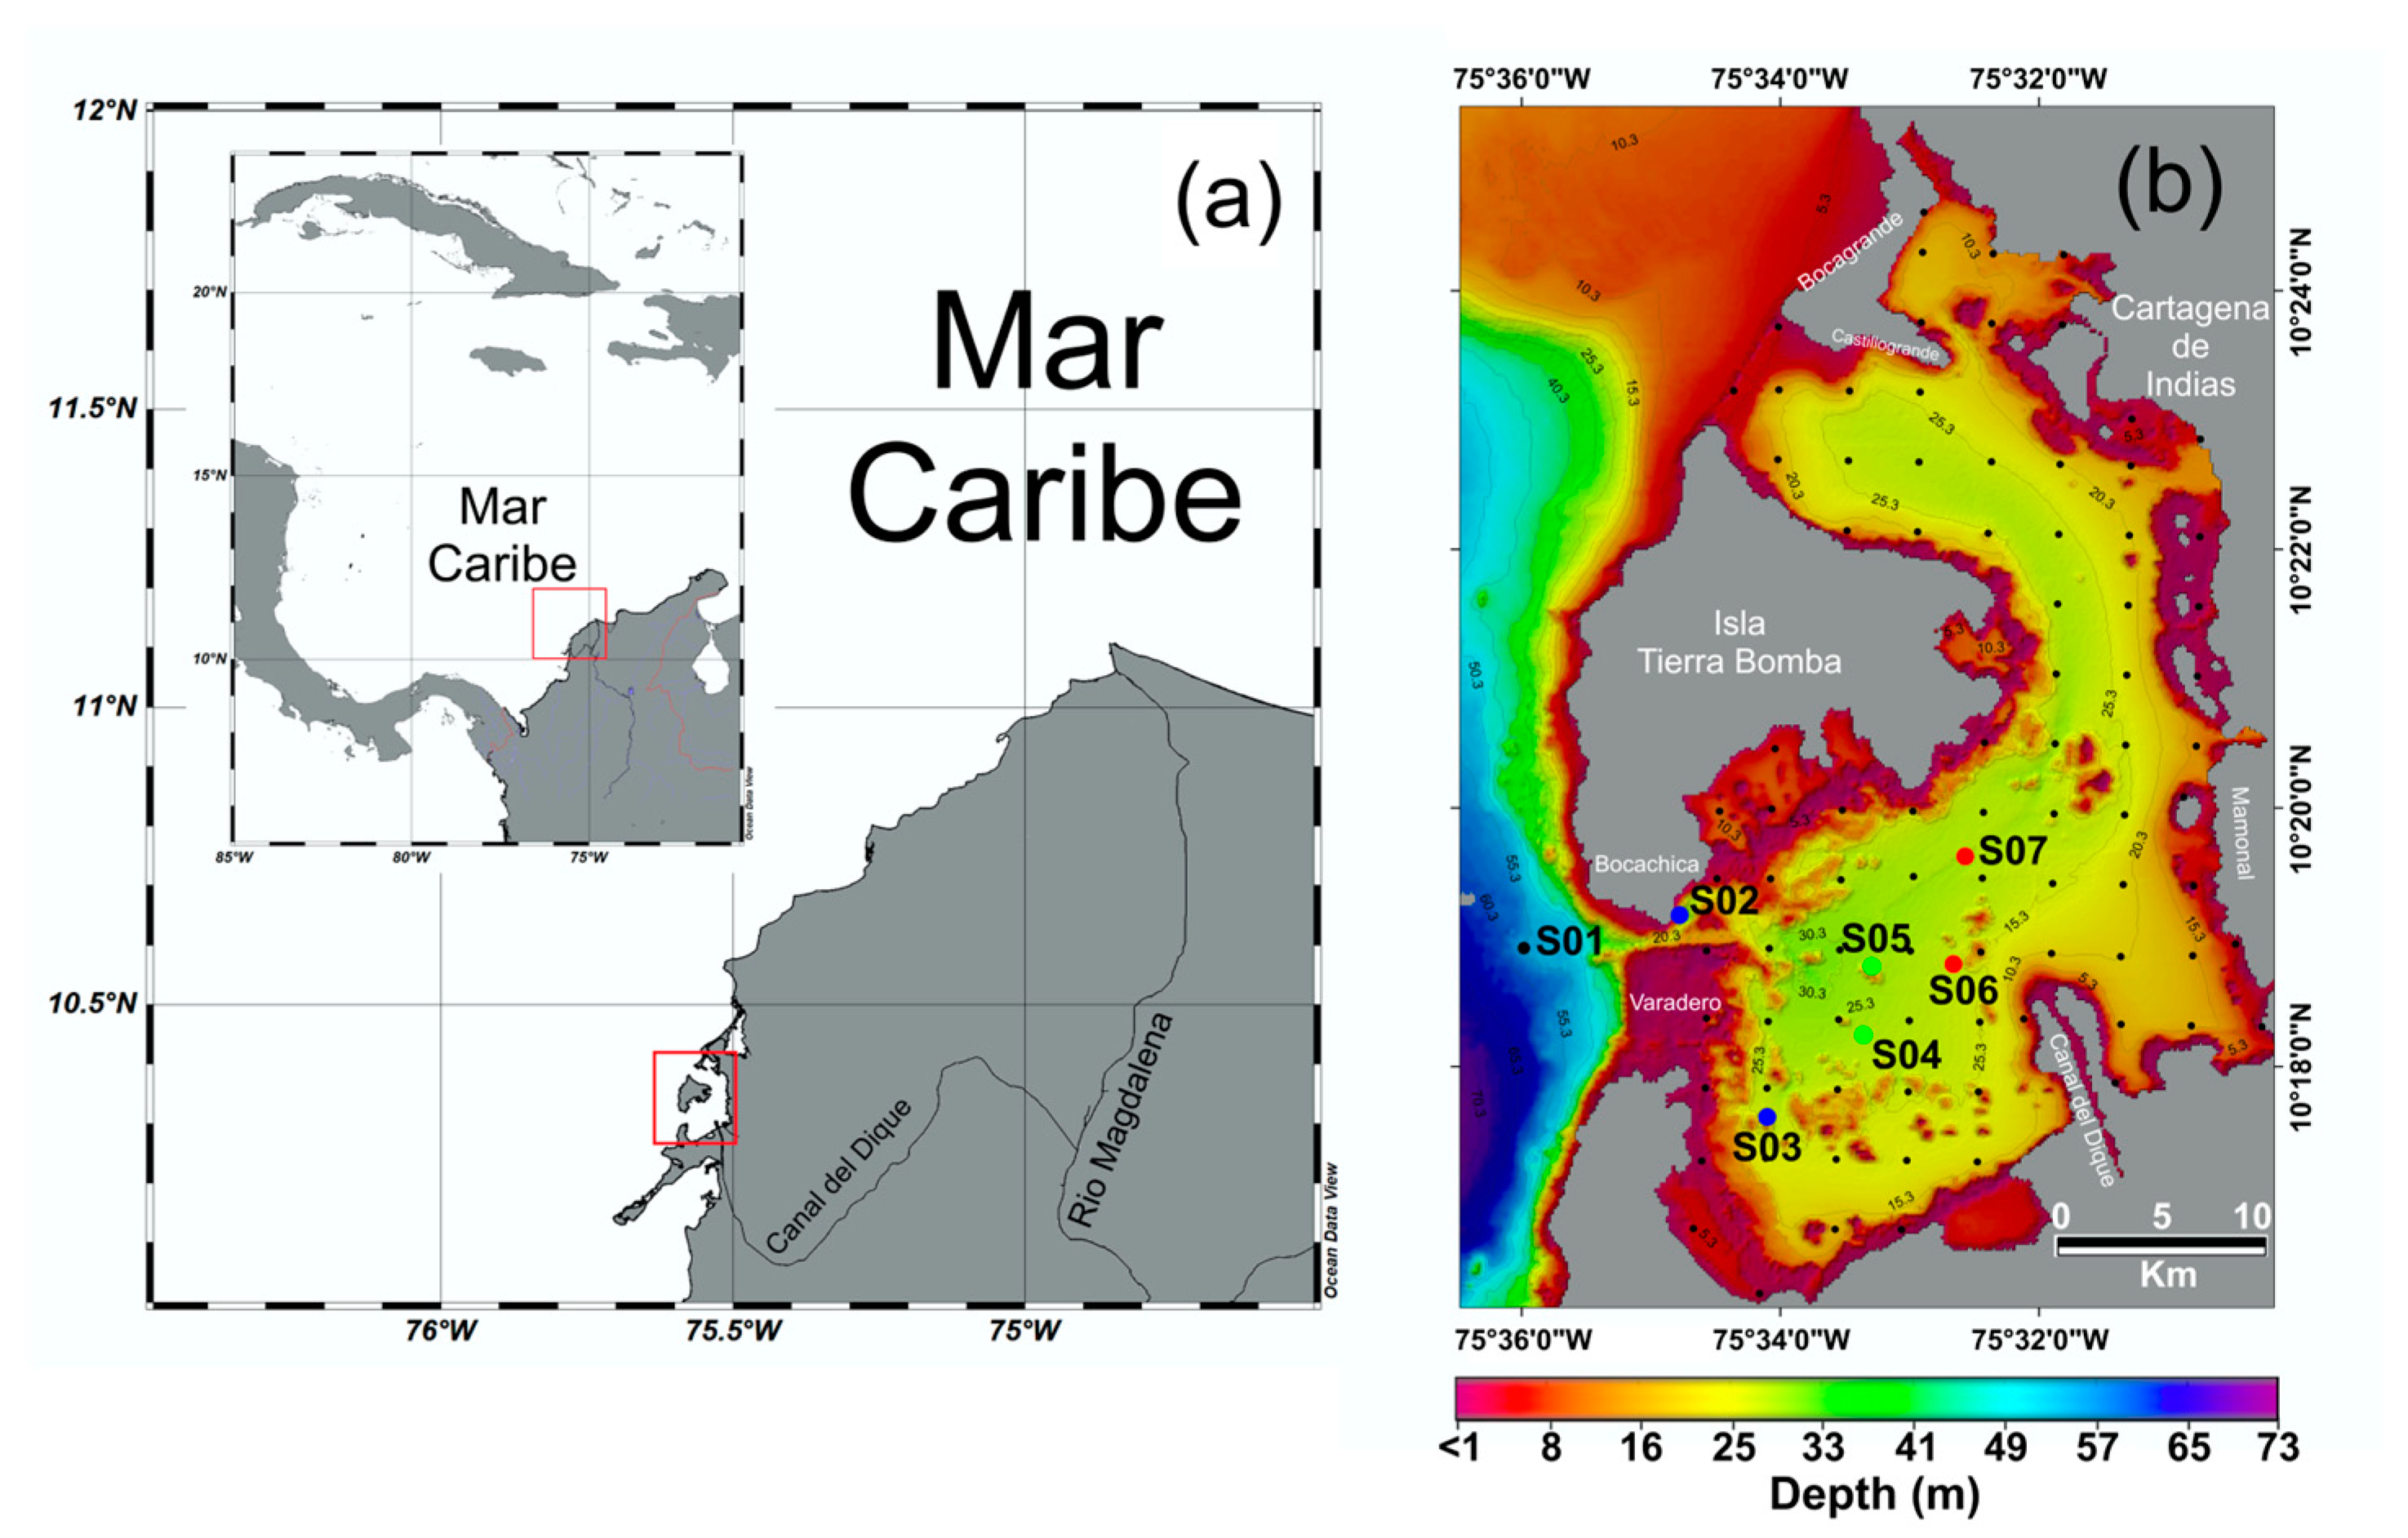
Cartagena Bay (10°16′–10°26′ N, 75°30′–75°37′ W) is a semi-enclosed coastal system in northern Colombia, covering approximately 82 km2 and reaching maximum depths of 30.3 m. It is connected to the Caribbean Sea through two inlets—Bocagrande to the north and Bocachica to the south. The Varadero Reef is located near the southern inlet, adjacent to the main navigation channel (Figure 1).
Figure 1.
Cartagena Bay. (a) Location of the study area in the Caribbean Sea. The inset map highlights, with a red square, Cartagena Bay on the northern coast of Colombia; this area corresponds to the enlarged view shown in panel (b); (b) in situ sampling stations distributed along a fluvial–marine gradient. Red circles indicate stations with strong fluvial influence (S06 and S07); green circles represent stations with intermediate influence (S04 and S05); blue circles correspond to marine-influenced stations (S02 and S03); and the black circle denotes station with oceanic characteristics (S01).
Cartagena Bay receives significant freshwater and sediment inputs from the Canal del Dique (Figure 1a), contributing to pronounced spatial and temporal variability in physical and chemical conditions. Varadero Reef lies near the mouth of the canal, embedded in a sediment-rich deltaic environment with a seafloor characterized by calcareous pinnacles, mud volcanoes, and scattered coral formations (Figure 1b). These unique conditions provide an ideal setting for evaluating the utility of IOPs in coastal water quality assessments.
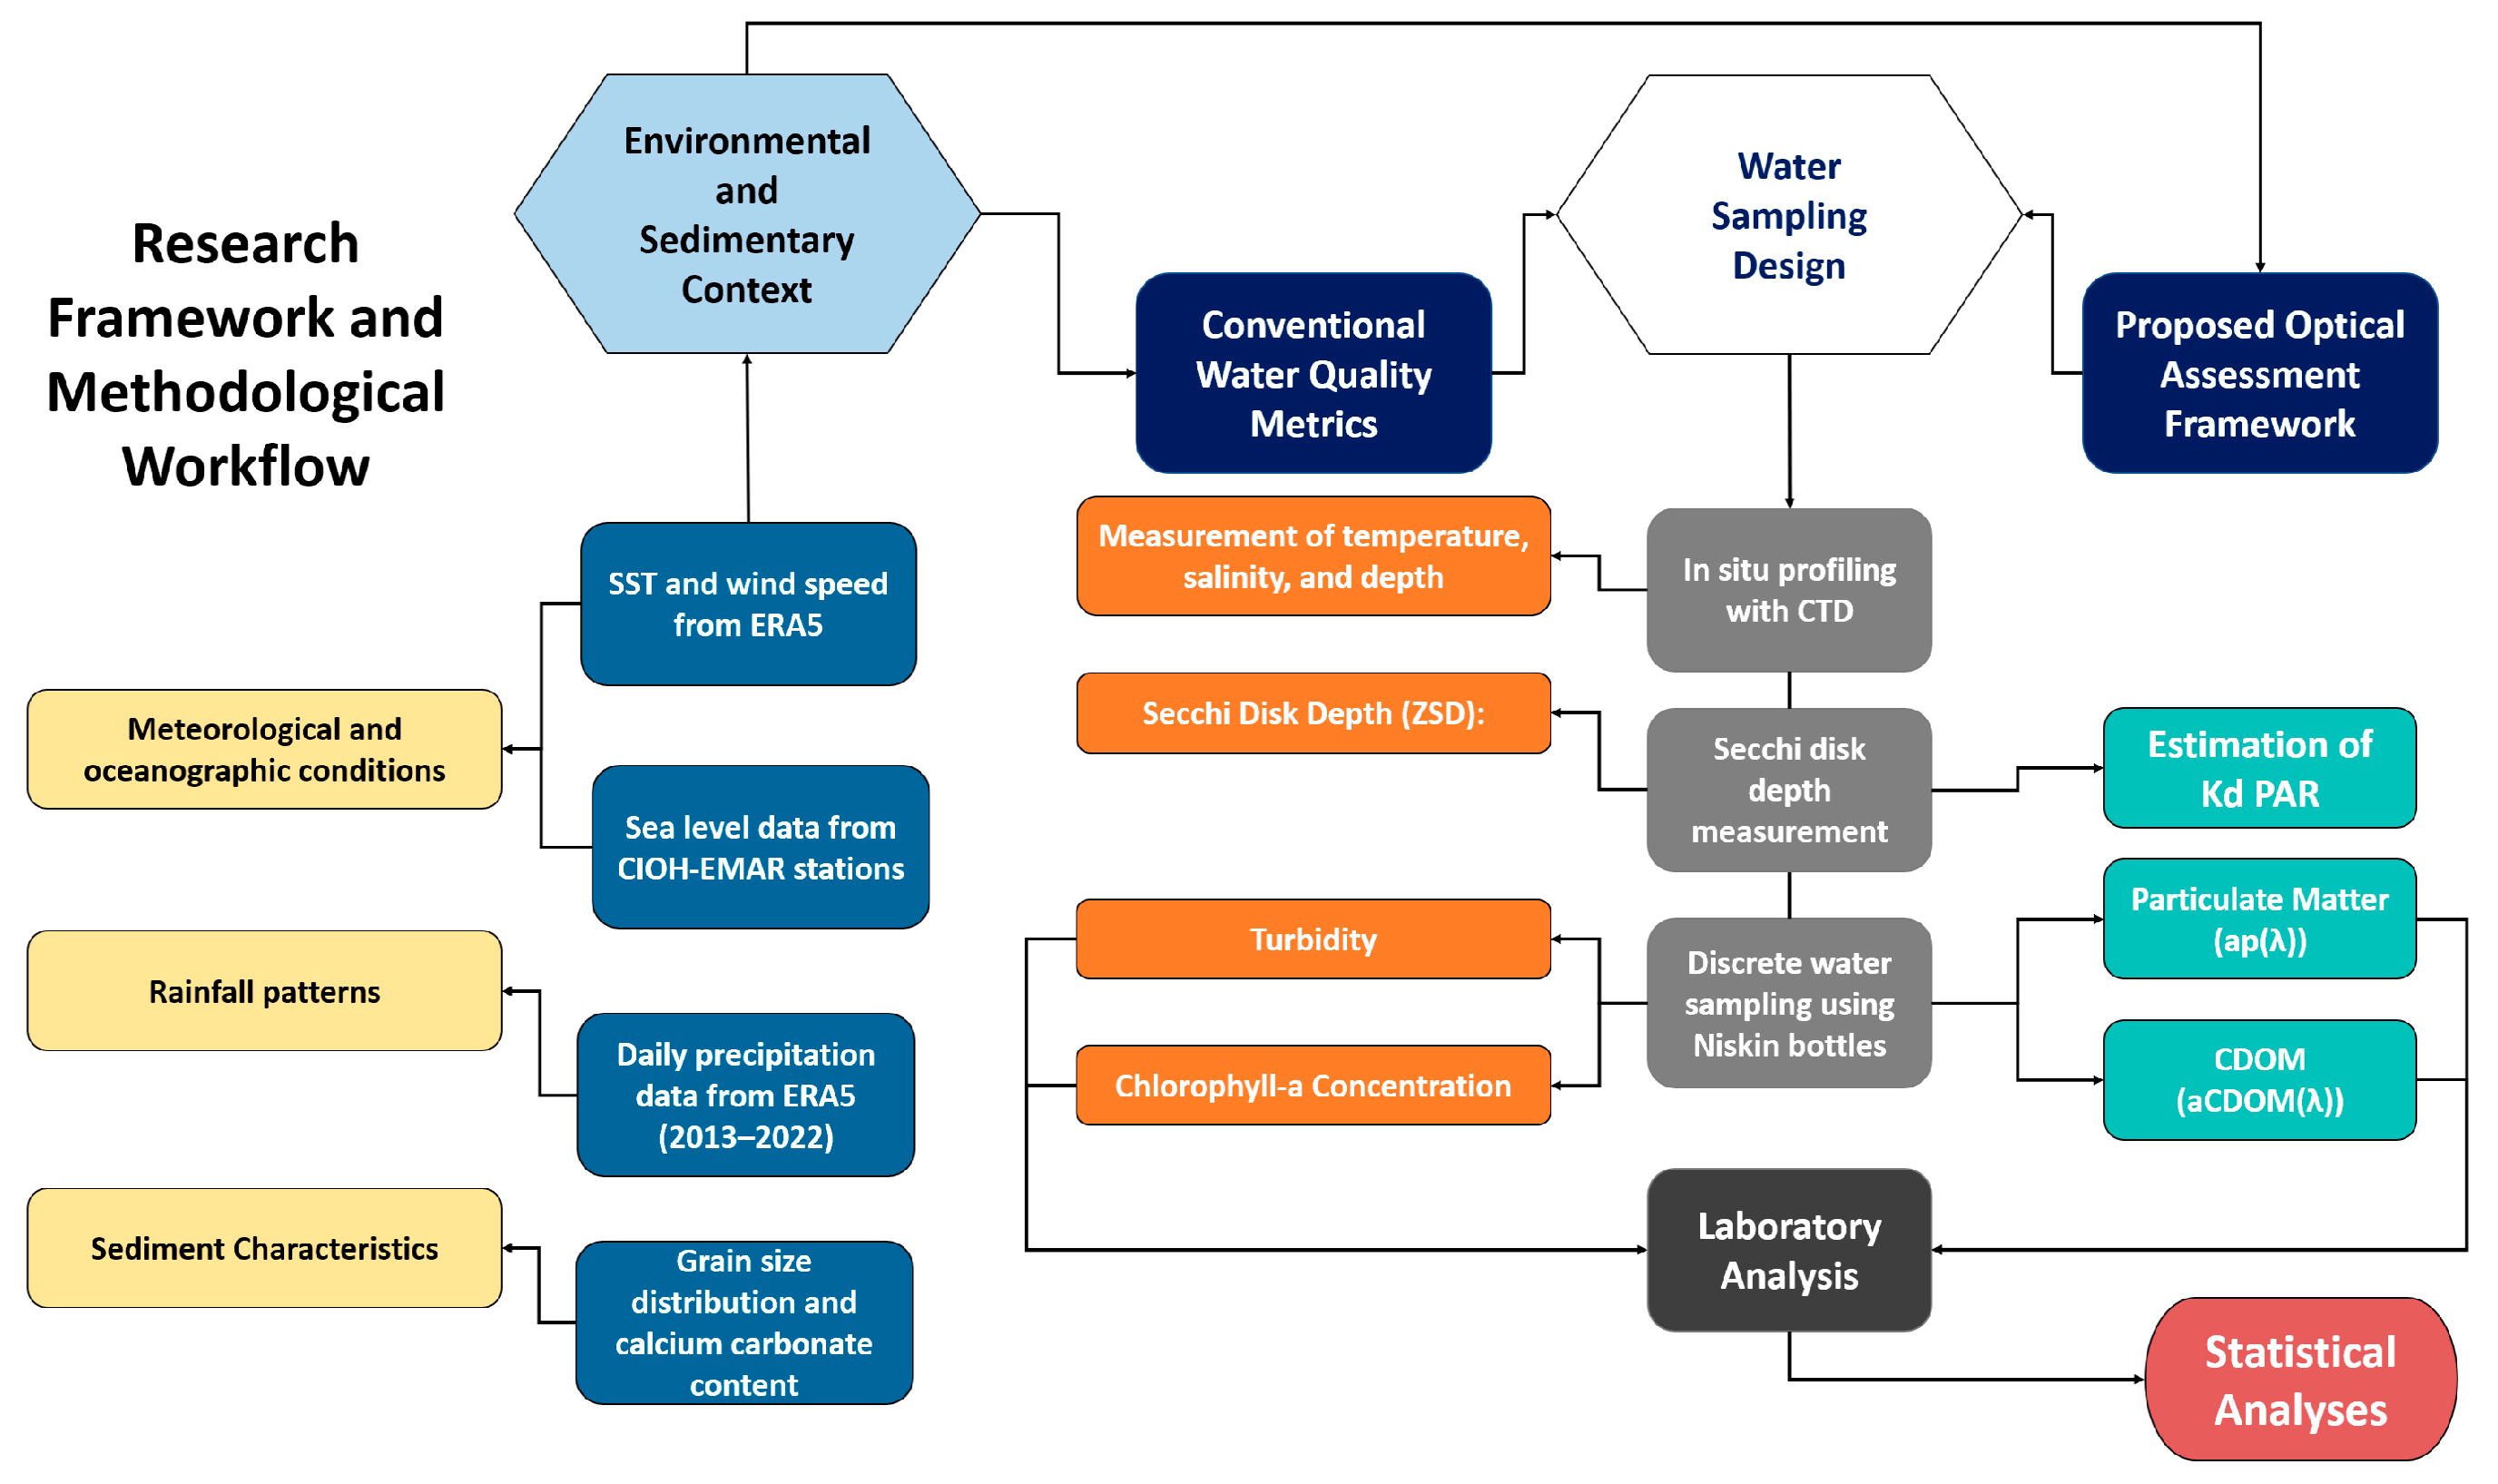
To provide a comprehensive overview of the methodological approach, a schematic diagram is presented in Figure 2. This flowchart outlines the major components of the study, including the water sampling design, the assessment of conventional and optical water quality metrics, the characterization of the environmental and sedimentary context, and the subsequent statistical analyses. The framework highlights the integration of multiple data sources—ranging from satellite-derived products and in situ measurements to sediment samples and laboratory analyses—used to evaluate the optical quality of coastal waters in the Varadero Reef region.
Figure 2.
Methodological framework used in this study, illustrating the integration of environmental and sedimentary context, conventional and optical water quality metrics, water sampling design, and statistical analyses.
2.2. Water Sampling Design
Field sampling was conducted during three seasonal campaigns representing distinct hydrological periods: the rainy season (September 2021), the dry season (February 2022), and the transitional period (June 2022). Seven stations (S01–S07) were sampled across a gradient of fluvial to oceanic influence (Figure 1b). At each station, surface (1 m) and bottom (10–30 m) water samples were collected using 5-L Niskin bottles for the determination of chlorophyll-a (Chl) and absorption coefficients of particulate matter and chromophoric dissolved organic matter (CDOM). A water sample was extracted directly from the Niskin bottle using previously washed amber glass bottles for the determination of the CDOM absorption coefficient according to the protocol of Mitchell et al. [13]. They were stored under refrigeration (4 to 8 °C) until laboratory analysis. From the remaining volume, water samples were taken in 2000 mL plastic bottles for particulate absorption and Chlorophyll-a determination. The detailed methodology for these variables is provided in Betancur-Turizo et al. [14] and Eljaiek-Urzola et al. [15] and the complete database is available through the CECOLDO Metadata Catalog (https://doi.org/10.26640/cecoldo.dataset_00585 accessed on 11 August 2025). However, a quick description of these is given below.
2.3. Conventional Water Quality Metrics
The following conventional indicators were measured to provide baseline water quality information:
- Secchi Disk Depth (ZSD): Water transparency was measured using a Secchi disk oceanographic version (white disk of 30 cm diameter), following the recommendations of Santamaría-del-Angel et al. [16]. The procedure applied for measuring this variable considered that the measurement can be affected by the human eye and therefore one person was assigned as responsible for this measurement. The differences associated with the angle were also considered, so the reading was made during the same time interval (between 9 a.m. and 3 p.m.) mainly on sunny days, when it is assumed that there is more indirect light than diffuse light penetrating the water column [16]. When considering these aspects, it was assumed that errors were consistent throughout the sampling process.
- Chlorophyll-a Concentration: Was estimated according to Method 10200 H.2.b. defined by Baird et al. [17] for which 100 mL to 1000 mL of water through a negative filtration system, using Whatman GF/F filter (nominal pore size 0.7 µm and 47 mm diameter). Each filter was carefully placed in aluminum foil, folded in half for packing, and preserved in liquid nitrogen until analysis in the laboratory.
- Turbidity: Determined in nephelometric turbidity units (NTU) using an EZDO GONDO TUB-430 turbidimeter (https://www.gondo.com.tw/products_detail/23.htm accessed on 11 August 2025) according to Method 2130 B defined by Baird et al. [17].
2.4. Proposed Optical Assessment Framework
To better characterize underwater light conditions in optically complex coastal waters, this study incorporated specific inherent optical properties (IOPs) as part of the assessment framework. The methodology focused on the quantification of absorption by particulate matter and chromophoric dissolved organic matter (CDOM), the two main constituents affecting underwater light attenuation.
2.4.1. Determination of Light Absorption Coefficients
- Particulate Matter (ap(λ)): Was determined from spectrophotometric measurements of optical density on filter pads (Whatman GF/F filter, 25 mm diameter) following the corrections proposed by Roesler et al. [18] for measurements performed without an integrating sphere. For the analysis, between 100 mL and 1000 mL of water were filtered using a low-pressure (<5 PSI) vacuum filtration system with Whatman GF/F filter (nominal pore size 0.7 µm and diameter of 25 mm). Each filter was carefully placed in a tissue processing capsule and stored in liquid nitrogen until analysis. Spectrophotometric readings were conducted according to the protocol of Roesler et al. [18], which involves measuring optical density in the UV-Vis range (350–850 nm) using a spectrophotometer without an integrating sphere. For this analysis, each filter was placed directly into a Varian Cary 100 Spectrophotometer to obtain the particulate absorption coefficient ap(λ), using the following equation from Roesler et al. [18]:where, V is the volume of water filtered (in m3), A is the effective filtration area (in m2), and the subscript p denotes particulate matter. The term represents the sample’s optical density (ODs (λ)) corrected by the amplification factor β, specific to T-mode measurements (Transmittance mode) performed without an integrating sphere.
- CDOM (aCDOM(λ)): CDOM samples were analyzed following the methodology described by Mitchell et al. [13]. This procedure involved filtering the water sample through a 0.2 µm pore-size membrane filter that had been pre-cleaned with 10% HCl and rinsed thoroughly with ultrapure water. The cleaned filter was placed into a filtration apparatus, which was then purged using both ultrapure water and the sample itself to minimize contamination.
The total absorption coefficient (at(λ)) was calculated as the sum of absorption by water, particulate matter, and CDOM, providing an integrated view of light absorption at each station. The water absorption coefficient values (aw(λ)) were obtained from the dataset provided by Morel and Prieur [19], which includes temperature- and salinity-independent values for the absorption spectrum of pure seawater and is publicly available at https://omlc.org/spectra/water/data/morel77.txt (accessed on 11 August 2025).
Although at(440) was calculated as the sum of ap(440), aCDOM(440), and aw(440), the bar plots representing relative contributions focus exclusively on the non-water components (ap(λ) and aCDOM(λ)), as aw(440) remains constant and does not reflect biogeochemical or anthropogenic variability.
It is important to note that while particulate matter is concentrated onto the filter surface for spectrophotometric measurement in T-mode, the resulting absorption coefficients ap(λ) are widely used as proxies for the optical effect of particles dispersed throughout the water column. This approach, supported by empirical correction factors and standardized protocols (e.g., [18]), allows for reliable inter-sample comparisons of particle absorption despite the physical differences in measurement geometry. For clarity and transparency, the theoretical background, assumptions, and associated uncertainties of this method are detailed in Appendix A.
2.4.2. Estimation of Diffuse Attenuation Coefficient for Downward Photosynthetically Active Radiation (Kd PAR)
Diffuse Attenuation Coefficient for Downward Photosynthetically Active Radiation (Kd PAR) was estimated using Secchi Disk Depth (ZSD) and the empirical model proposed by Castillo-Ramírez et al. [20]. This approach allows for standardized estimates of light attenuation according to the optical variability of different water types.
2.5. Environmental and Sedimentary Context
To contextualize the spatial and temporal variability in optical absorption, a set of environmental and sedimentary descriptors was included:
- Meteorological and oceanographic conditions: Physical parameters were measured throughout the water column at all sampling stations. This was conducted using an RBRconcerto3 C.T.D, following the manufacturer’s recommended protocols. Sea surface temperature and wind speed were obtained from the ERA5 reanalysis dataset, while sea level data were retrieved from the CIOH-EMAR tide gauge station located in Cartagena Bay. These variables offer insights into seasonal hydrodynamics and water column stratification.
- Rainfall patterns: Daily rainfall data from ERA5 were extracted for a defined region along the Canal del Dique, covering the period from 2013 to 2022. These records enabled the characterization of freshwater inputs and their influence on sediment plumes and CDOM.
- Sediment characteristics: Grain size distribution and calcium carbonate content were analyzed from 86 surface sediment samples collected across the bay (Figure 1b). These parameters help assess the potential for sediment resuspension and its role in modulating light scattering and absorption.
By integrating these descriptors, we aim to clarify how environmental forcing mechanisms shape the observed variability in particulate and dissolved light-absorbing components throughout the year.
All datasets used in this study are summarized in Supplementary Table S1. These include discrete in situ measurements collected during three oceanographic campaigns of Project ARC No. 75916 (8 September 2021; 18 February 2022; and 23 June 2022), some of which are publicly available through the CECOLDO Metadata Catalog. The table also includes a sediment dataset based on samples collected across Cartagena Bay between February and March 2020, meteorological and sea level data from the CIOH-EMAR tide gauge and weather station, and satellite-based reanalysis products (e.g., ERA5 sea surface temperature, wind speed, and rainfall). Supplementary Table S1 provides a comprehensive overview of the source, spatial and temporal resolution, coverage period, data format, and availability of each dataset used in the study.
2.6. Statistical Analyses
In order to assess the association between all the reported variables, a multiple contrast analysis was performed by organizing pairs of variables and using the Spearman’s correlation coefficients (rs) following the criteria of Santamaria-del-Angel et al. [21]. The statistical significance of the indices was evaluated [22], and the results were interpreted following the criteria of Mu et al. [23]. Critical values tables were taken from [24] for Spearman’s correlation coefficient.
3. Results and Discussions
3.1. Seasonal and Spatial Patterns in Light Absorption Components
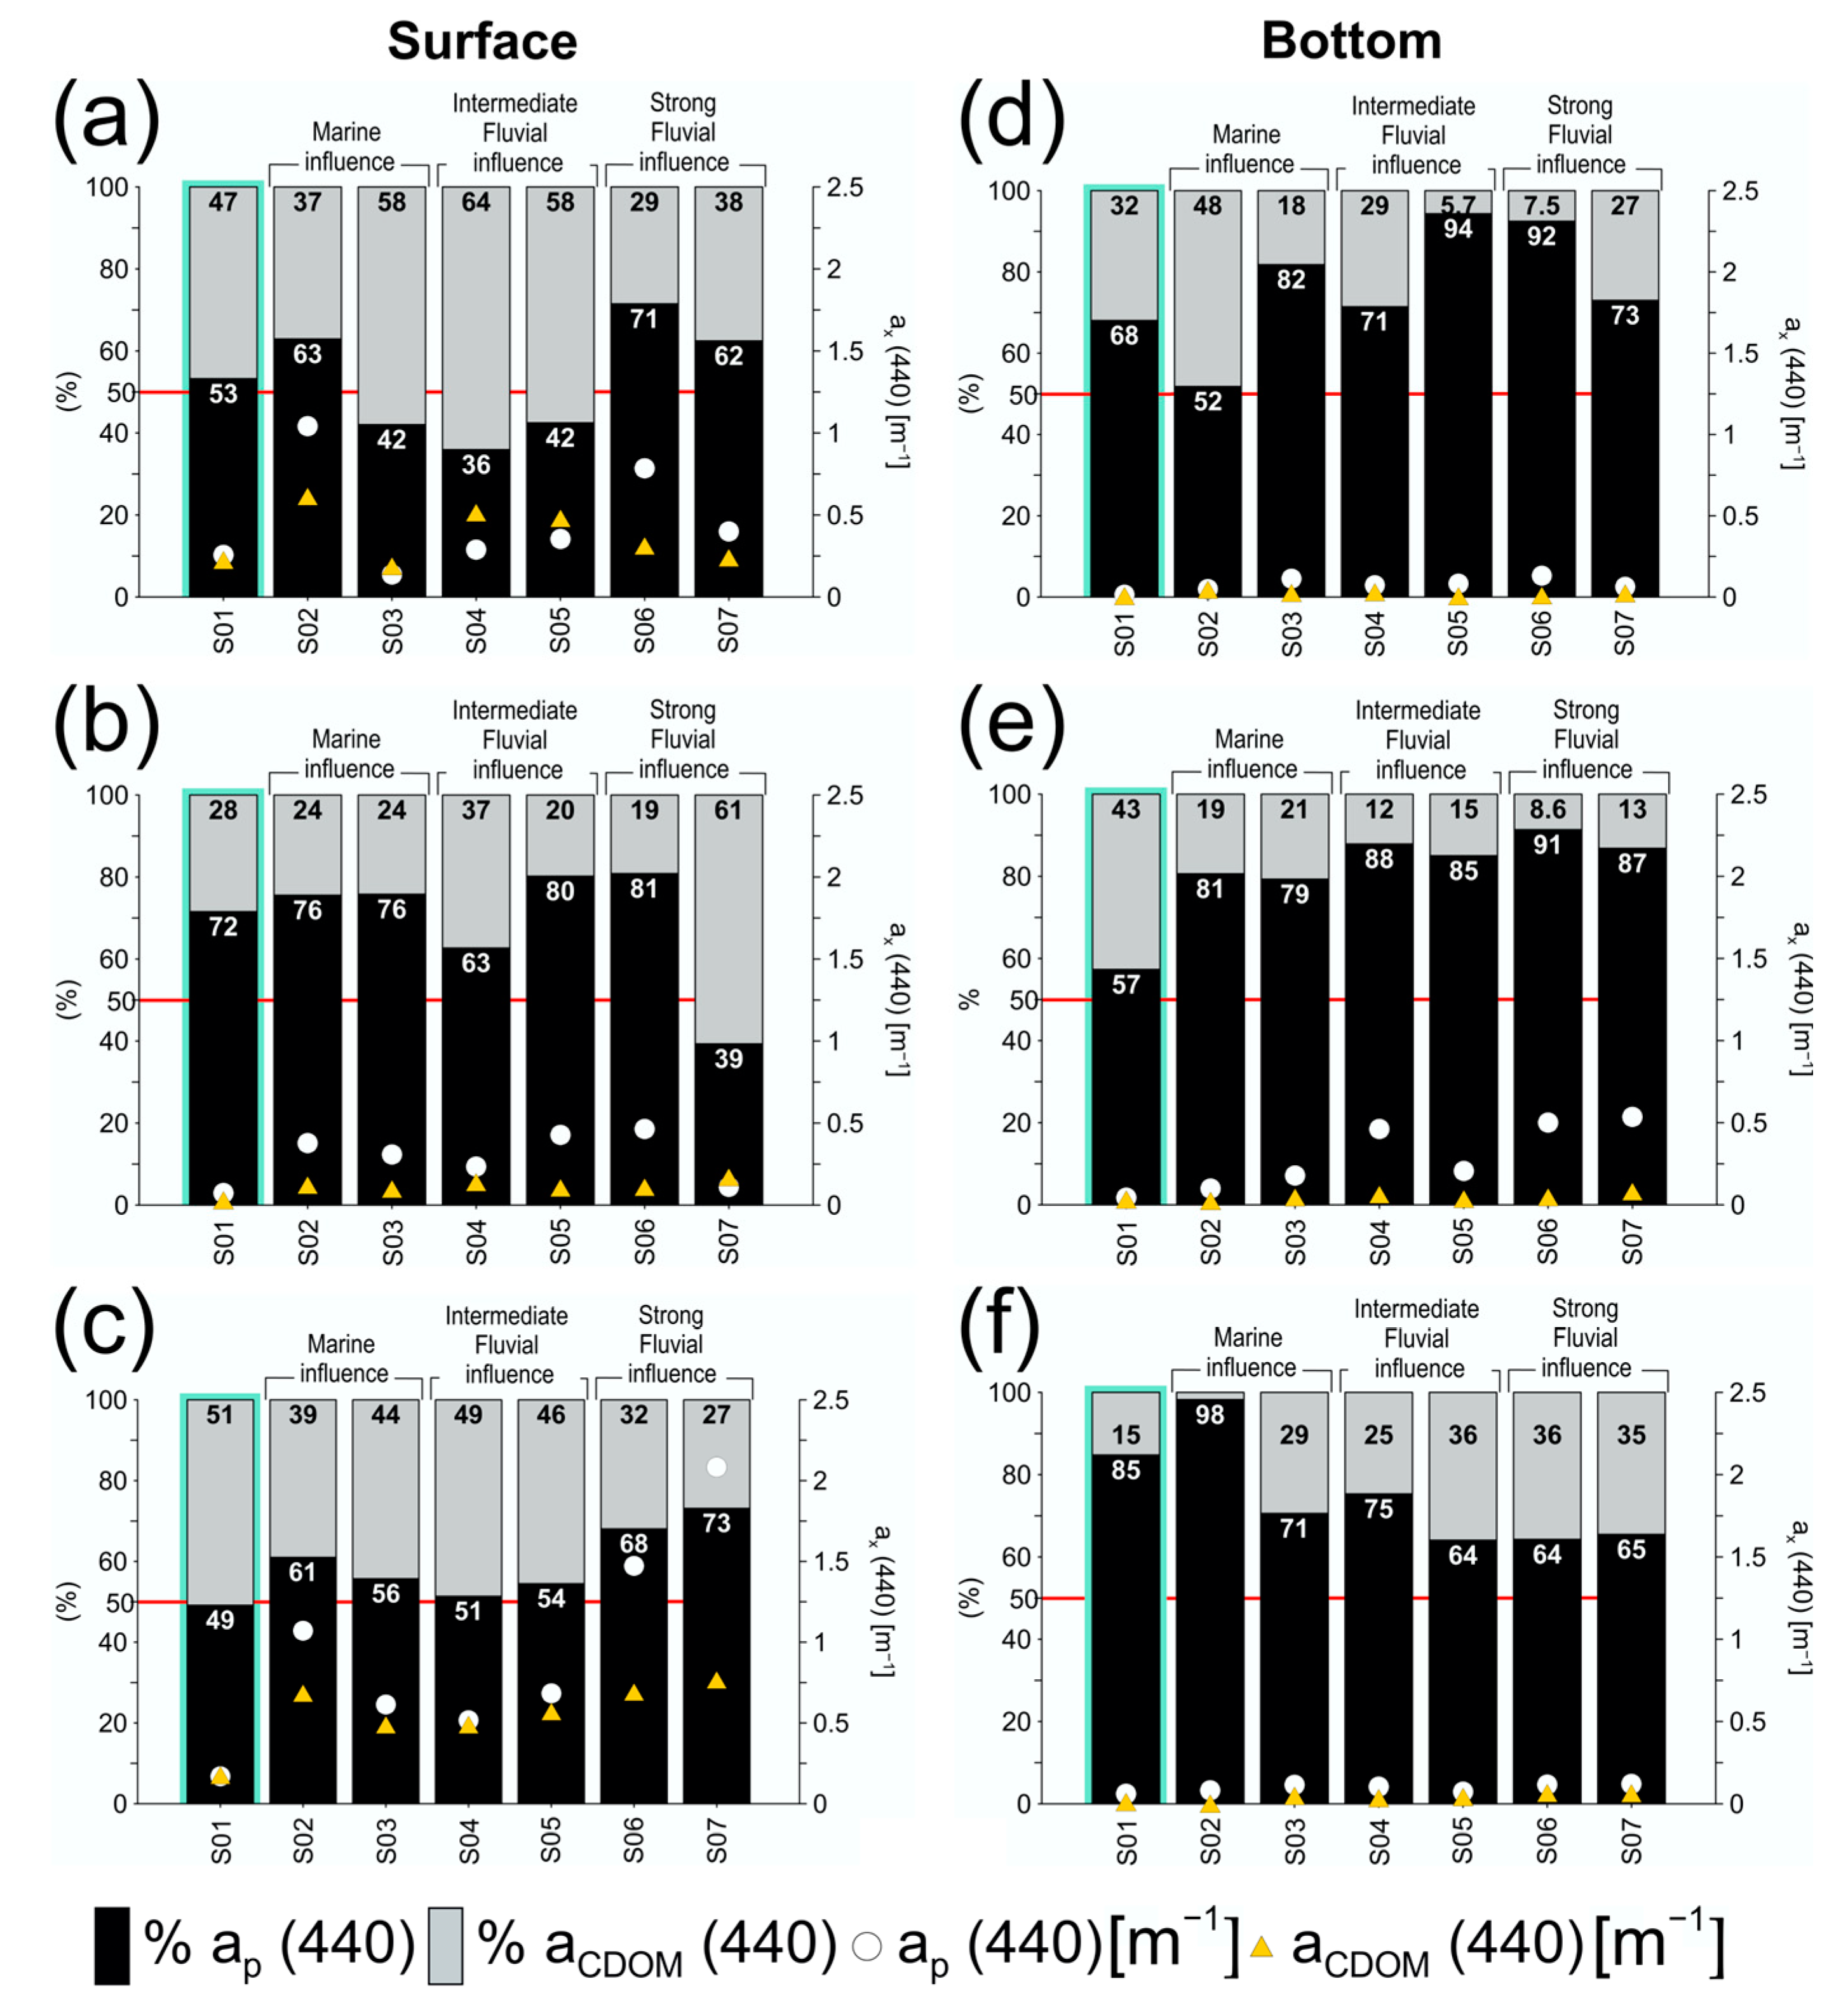
The relative contribution of coefficients of particulate matter (ap(440)) and Chromophoric dissolved organic matter (aCDOM(440)) (Figure 3) indicates a predominance of particulate matter, with ap(440) values exceeding 50% of the total non-water absorption, both at the surface (Figure 3a–c) and at depth (Figure 3d–f). This predominance is particularly pronounced at stations influenced by fluvial inputs (S04–S07) and in bottom samples, where all stations and campaigns show ap(440) contributions greater than 50%, reaching up to 98% in some cases.
Figure 3.
Relative contribution of aCDOM (440) and ap (440) to total non-water absorption in samples collected during September 2021, February 2022, and June 2022. Panels (a–c) show surface layer contributions, while panels (d–f) corresponds to bottom layer samples. The left y-axis represents the relative contribution (%), and the right y-axis shows the absorption coefficients of ap(440) (white circles) and aCDOM(440) (yellow triangles). A red line marks the 50% contribution threshold. Stations are categorized according to their position: oceanic (S01, sea green), marine-influenced (S02–S03), intermediate fluvial influence (S04–S05), and strong fluvial influence (S06–S07).
At the surface, the stations with greater fluvial influence (S06 and S07) consistently show dominance of ap(440) compared to the oceanic station (S01) and those with marine influence (S02–S03). However, this pattern weakens or even reverses during the February 2022 campaign, particularly at station S07 (Figure 3b). Additionally, during the June and September campaigns, some intermediate stations (S03, S04, and S05) show higher relative contributions of aCDOM(440) (Figure 3a,c), even exceeding the 50% threshold (Figure 3a).
Although aCDOM(440) remained below 50% at most stations, specific exceptions were identified. In September 2021, aCDOM(440) reached between 58% and 64% at stations S03, S04, and S05 (Figure 3a); in February 2022, S07 recorded 61% (Figure 3b); and in June 2022, S01 presented a value near the threshold (51%) (Figure 3c). These exceptions suggest specific conditions of increased input or persistence of dissolved matter, possibly related to lower particulate loads or local hydrodynamic variations.
In terms of absolute absorption, ap(440) exhibited the highest values, especially in surface samples influenced by fluvial inputs (Figure 3a,c), reaching peaks close to 2.5 m−1 (Figure 3c). In contrast, aCDOM(440) showed lower and more stable values (Figure 3b), with the highest records occurring during the rainy season campaigns (Figure 3a,c). In bottom samples, ap(440) values were generally below 0.5 m−1, while aCDOM(440) values did not exceed 0.1 m−1 (Figure 3d–f).
To quantitatively contextualize these observations, Table 1 summarizes the average values of key optical and environmental variables for each campaign, distinguishing between the surface layer (1 m) and the bottom layer (10–30 m). Consistent patterns are highlighted, such as higher turbidity, chlorophyll-a, ap(440), and at(440) in surface waters during June (with maximum values of at(440) = 1.511 m−1 and ap(440) = 0.944 m−1), along with a general decrease in ap(440), at(440), and aCDOM(440), as well as turbidity, chlorophyll-a, and temperature with depth. Surface salinity reached its lowest values during the months of highest fluvial discharge, particularly in June (23.3 PSS), consistent with greater terrestrial influence. Minimum surface temperature values (28.7 °C) were associated with the dry season, while the lowest average ZSD corresponded to the rainy season.
Table 1.
Mean values of environmental and optical variables measured at surface (1 m) and bottom layers (10–30 m) during the three sampling campaigns. ZSD = Secchi disk depth; Kd PAR = Diffuse Attenuation Coefficient for Downward Photosynthetically Active Radiation; ap = Particulate absorption; aCDOM = Chromophoric Dissolved Organic Matter absorption; at = Total absorption.
The observed spatial and temporal variations in absorption components are consistent with patterns documented in other river-influenced coastal systems. For instance, studies in Hudson Bay [25], the Laptev Sea [26], and North Borneo estuaries [27] have shown that terrestrial inputs of CDOM and particulate matter can persist across salinity gradients and into deeper layers, depending on hydrodynamics and mixing regimes. In Cartagena Bay, the relative dominance of aCDOM(440) in transitional zones and ap(440) near the Canal del Dique suggests a similar dynamic, where both hydrological seasonality and local resuspension processes shape the optical landscape. These insights reinforce the ecological relevance of evaluating both dissolved and particulate absorption in stratified and optically complex coastal waters.
3.2. Relationship Between Absorption Properties and Optical Quality Indicators
Correlation analyses revealed distinct patterns between optical absorption coefficients and environmental variables, particularly in surface waters. Ecologically relevant associations were explored in both surface and bottom layers using Spearman rank correlations (Table 2 and Table 3). In the surface layer, several variable pairs showed statistically significant correlations (|rs| > 0.433, α = 0.05, highlighted in bold in Table 2). These results emphasize the central role of freshwater inputs and suspended material in modulating water optical properties, especially through the delivery of CDOM and particulate matter.
Table 2.
Spearman correlation coefficients (rs) between surface variables (n = 21). Significant correlations (|rs| > 0.433, α = 0.05) are shown in bold.
Table 3.
Spearman correlation coefficients (rs) between bottom variables (n = 21). No statistically significant correlations were found at α = 0.05 (rs = ±0.433).
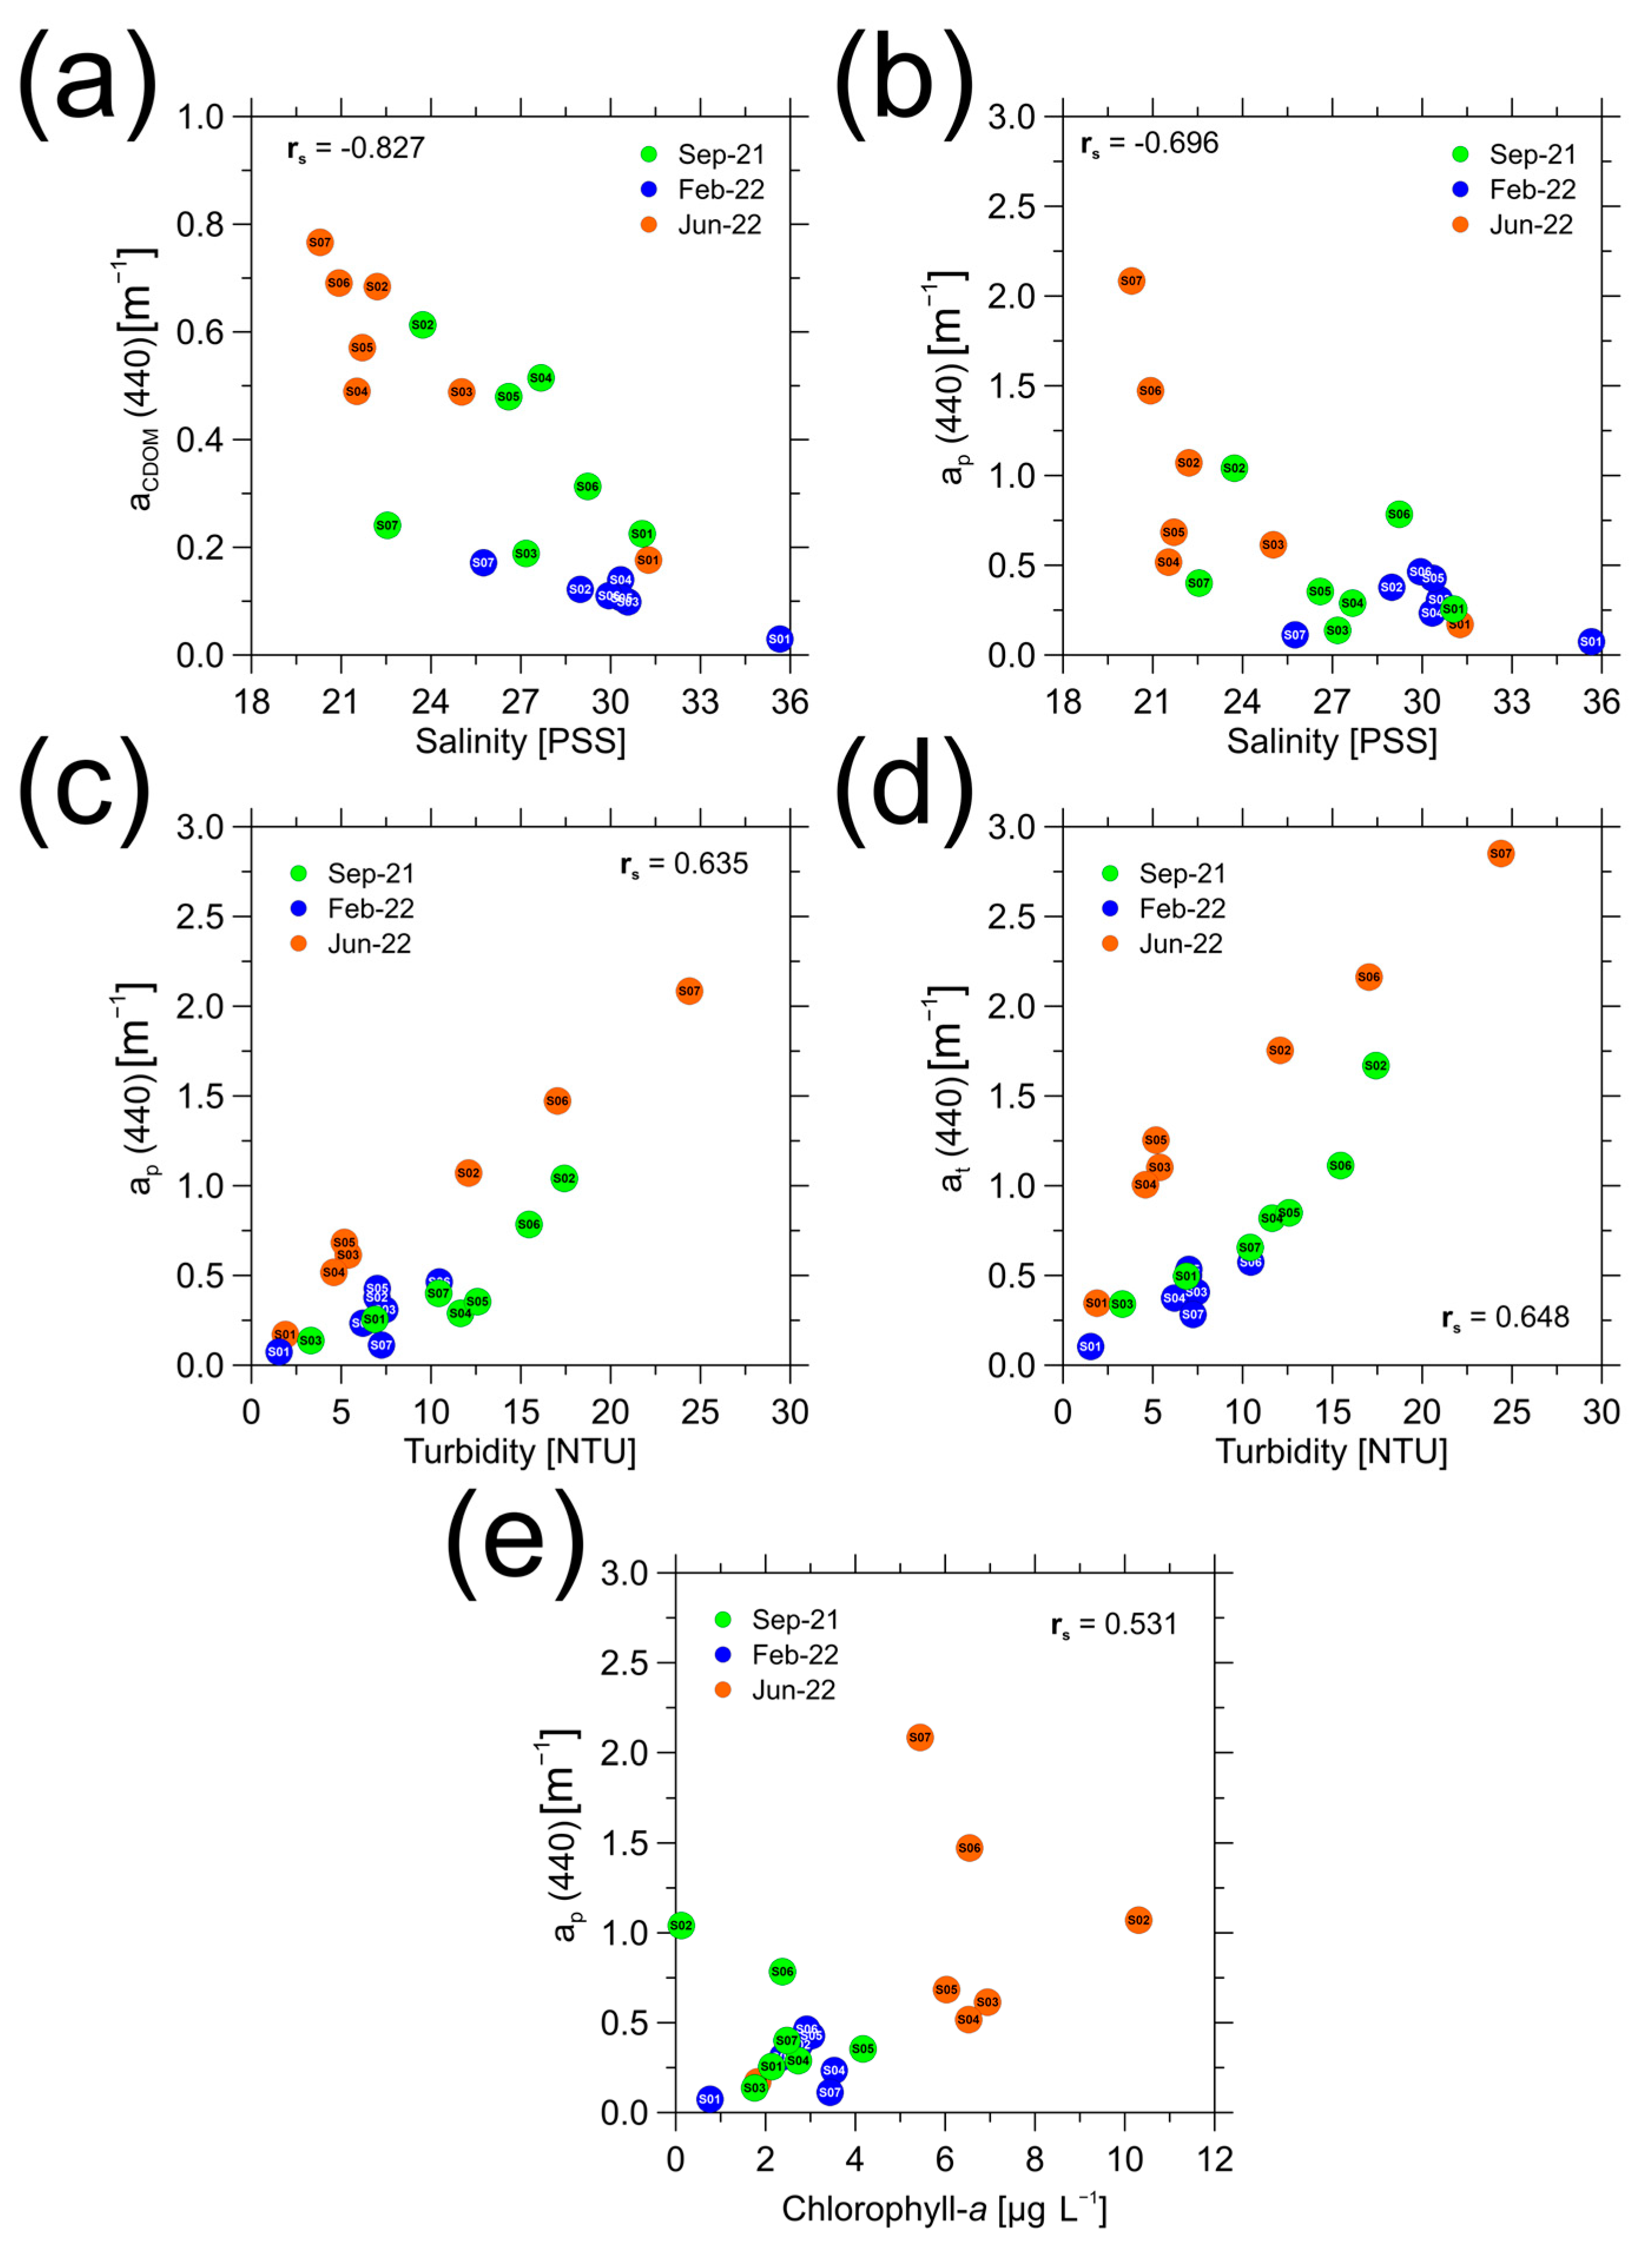
Salinity showed strong negative correlations not only with aCDOM(440) (rs = −0.827), ap(440) (rs = −0.696), and at(440) (rs = −0.768), but also with chlorophyll-a (rs = −0.638), reinforcing the influence of freshwater inflows as vectors of both organic matter and phytoplankton biomass. Similarly, turbidity was significantly correlated with ap(440) (rs = 0.635), aCDOM(440) (rs = 0.503), and at(440) (rs = 0.648), reflecting its value as a proxy for optically active constituents. Interestingly, the negative correlation between turbidity and salinity (rs = −0.429) underscores the contrasting behavior of traditional indicators and IOP-derived metrics, further supporting the inclusion of absorption coefficients in the study of turbid coral environments.
These findings suggest that while traditional variables such as turbidity and salinity provide valuable information, they may not fully capture the complexity of underwater light environments. In contrast, absorption-based indicators offer more direct insights into light attenuation processes, particularly relevant for assessing conditions affecting coral reef habitats.
In contrast, bottom layer analyses (Table 3) revealed no statistically significant correlations between turbidity and optical absorption coefficients. Specifically, the correlations between turbidity and ap(440) (rs = 0.404) and at(440) (rs = 0.417) remained below the significance threshold (|rs| > 0.433, α = 0.05, n = 21). These statistically non-significant trends suggest that, unlike in surface waters, turbidity is not a reliable proxy for particulate absorption at depth. This finding highlights the more complex or localized nature of particulate dynamics in bottom layers, where sediment resuspension, benthic inputs, or weaker stratification may decouple the relationship between suspended solids and inherent optical properties.
Although most studies exploring CDOM-salinity relationships focus on surface layers, there is growing evidence that these associations can persist throughout the water column. For instance, Juhls et al. [26] reported strong negative relationships between aCDOM and salinity even in subsurface Arctic and estuarine layers, suggesting vertical coherence in freshwater-derived CDOM signals. While those studies employed different wavelengths (e.g., 350 or 443 nm), their results align with our findings and support the use of aCDOM(440) as a spectral proxy in CDOM-dominated systems.
Our results extend this understanding by demonstrating that, despite the lack of statistical significance, the inclusion of bottom-layer aCDOM(440) and Secchi depth measurements adds valuable insight into the vertical structure of optical quality in fluvially influenced coastal systems such as Cartagena Bay. This supports the recommendation by Martin et al. [28] to assess optical variability across depth strata, especially in systems characterized by vertical stratification and resuspension events.
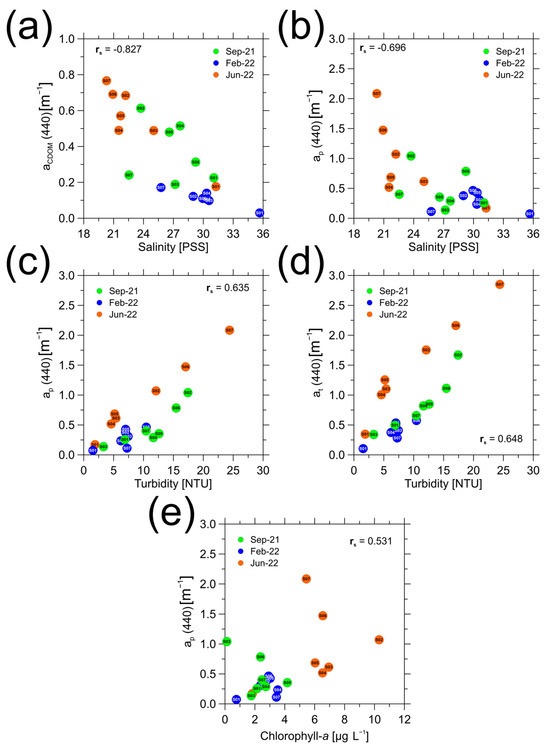
As illustrated in Figure 4, salinity exhibited strong negative correlations with aCDOM(440) (rs = −0.827; Figure 4a) and ap(440) (rs = −0.696; Figure 4b), confirming the influence of terrestrial runoff in delivering both dissolved and particulate matter. This inverse relationship between aCDOM and salinity is well-documented in fluvially influenced coastal and estuarine systems, where freshwater discharges transport high concentrations of colored dissolved organic matter, which gradually dilutes with increasing salinity toward marine waters [27,29,30]. Turbidity was positively correlated with ap(440) (rs = 0.635; Figure 4c) and at(440) (rs = 0.648; Figure 4d), reinforcing its role as a proxy for suspended light-attenuating substances. These findings align with those of Eljaiek-Urzola et al. [15], who observed that both ap(440) increased significantly during high discharge events from the Canal del Dique, concurrently with turbidity peaks. This highlights turbidity as a reliable surrogate for the concentration of suspended particulates that modulate light penetration in optically complex coastal systems. Chlorophyll-a, an indicator of phytoplankton biomass, also correlated significantly with ap(440) (rs = 0.531; Figure 4e), highlighting the phytoplankton contribution to particulate absorption.
Figure 4.
Scatterplots illustrating key relationships between optical absorption components and environmental indicators in surface waters (n = 21). Panels show: (a) aCDOM(440) vs. salinity, (b) ap(440) vs. salinity, (c) ap(440) vs. turbidity, (d), and at(440) vs. turbidity, (e) chlorophyll-a vs. ap(440). Each point represents a sampling station, color-coded by campaign. Station labels are displayed for spatial reference. The Spearman correlation coefficient (rs) is indicated in each panel. Statistically significant associations are those where |rs| > 0.433 (n = 21, α = 0.05) are panels (a–e).
In summary, the patterns of correlation and spatial distribution in this study reinforce the value of using absorption-based indicators to characterize underwater light conditions in complex coastal zones. They also confirm the dual role of CDOM and suspended particles as both stressors and modulators of light availability, with direct implications for primary production and coral reef ecology in turbid systems [3,31]. These insights are critical for refining monitoring approaches and conservation strategies in fluvially influenced tropical coastal ecosystems.
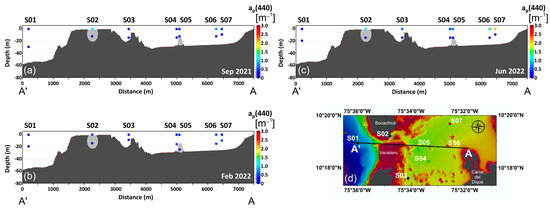
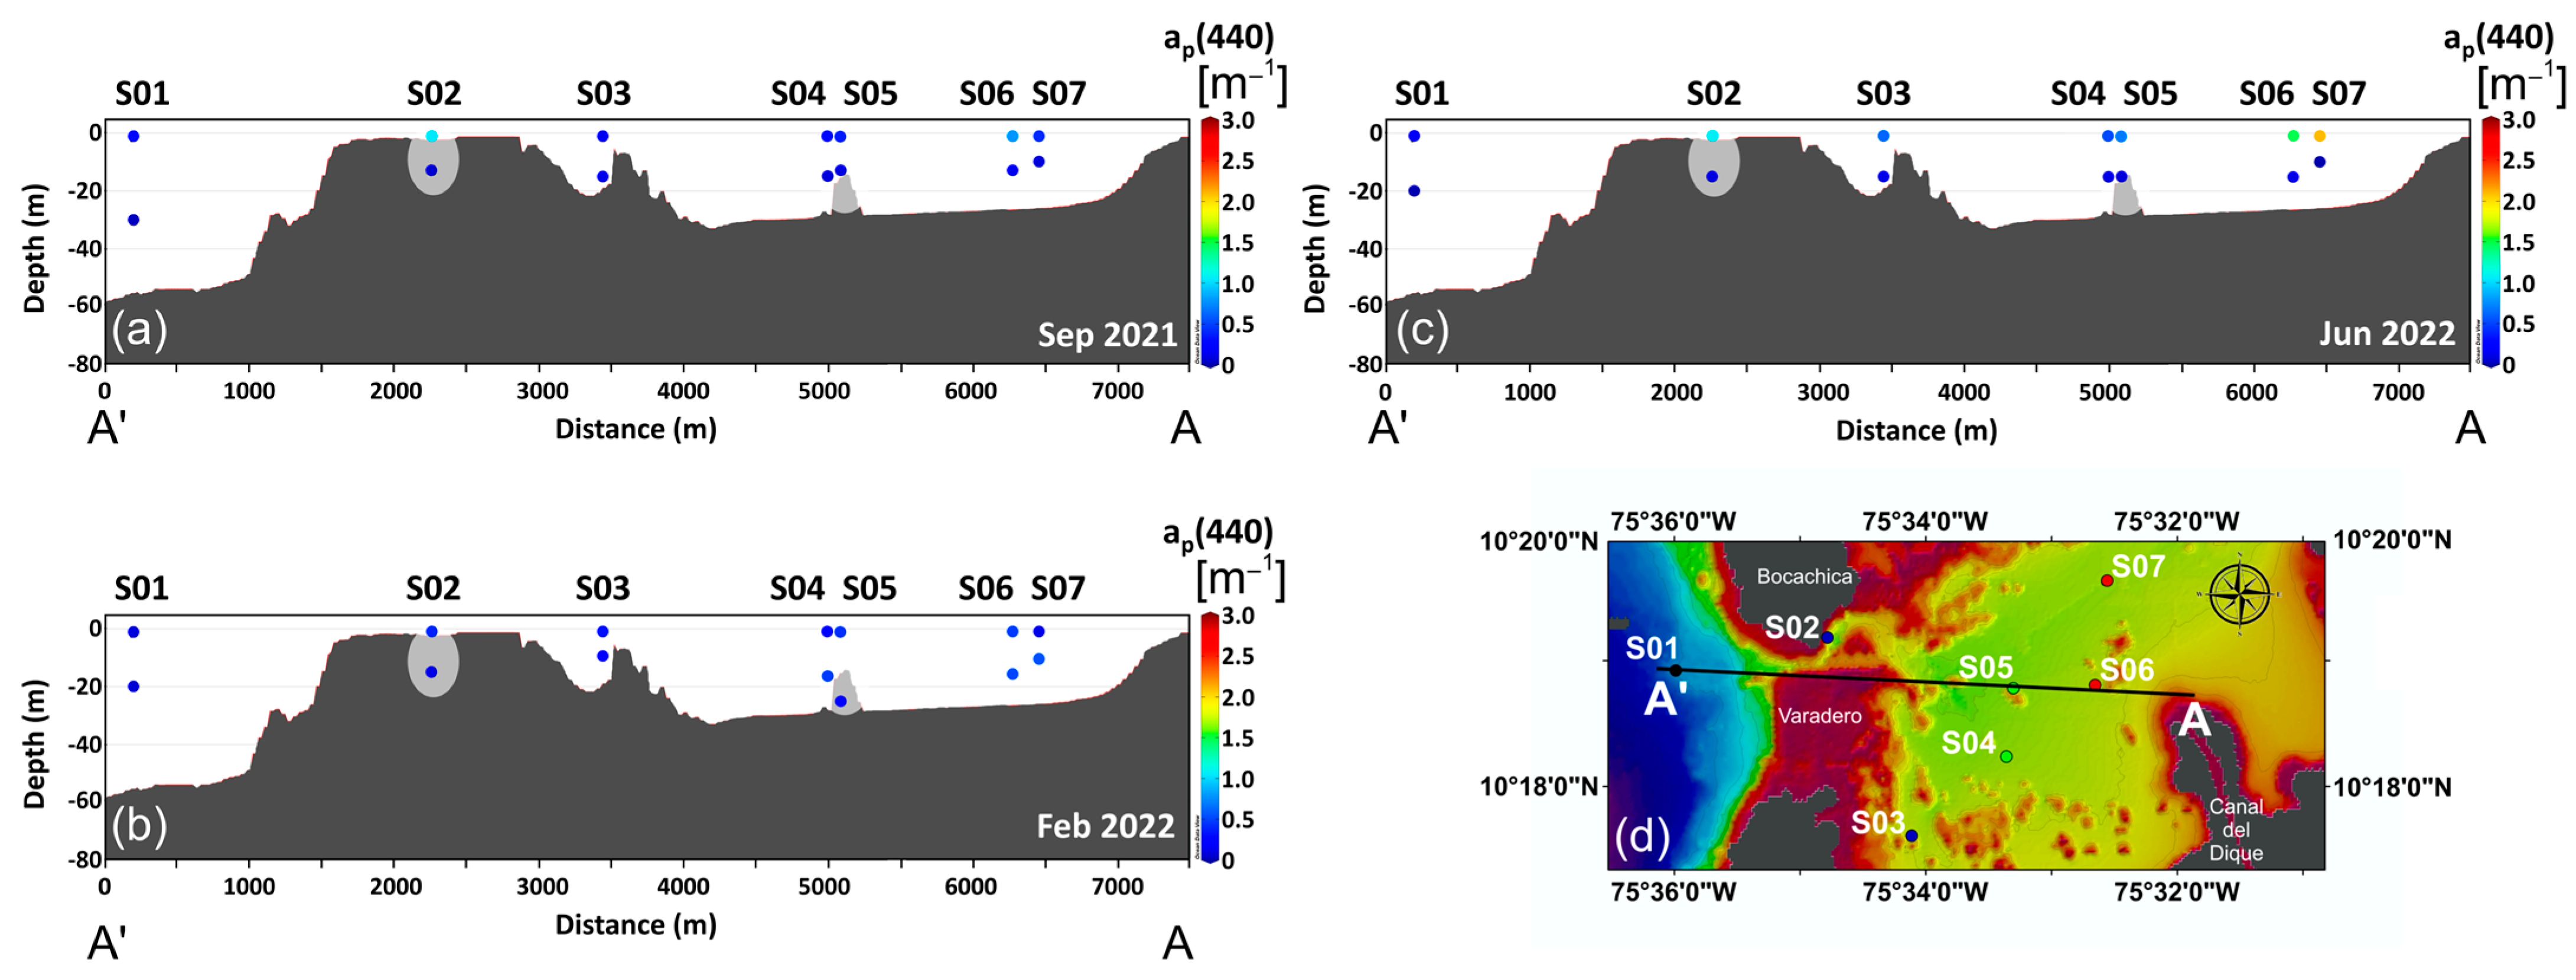
The longitudinal transects depicted in Figure 5 reveal distinct spatial and vertical patterns in ap(440) across the gradient from the Canal del Dique outlet to offshore waters. In all three sampling campaigns, surface waters generally exhibited the highest ap(440) values at the stations most influenced by fluvial discharge (S06 and S07), with a progressive decrease toward offshore stations. However, each campaign also showed unique features worth highlighting.
Figure 5.
Longitudinal transects of ap(440) across sampling campaigns. Panels (a–c) show the spatial distribution of the particulate absorption coefficient at 440 nm (ap(440), m−1) along a longitudinal transect from the Canal del Dique outlet to offshore waters, during the sampling campaigns of September 2021 (a), February 2022 (b), and June 2022 (c). For each campaign, values are shown for both surface and bottom layers across seven sampling stations (S01–S07). Panel (d) displays the bathymetric profile used as spatial reference for the transect, oriented from east (A) to west (A′). The profile is visualized from a south-to-north perspective, meaning that stations located to the south of the transect line are fully visible, while those situated to the north (e.g., S02 and S05) may lie behind the bathymetric profile. A shaded area is used to illustrate the hidden portion of the transect, indicating that these stations are positioned beyond the visible relief in the current viewing angle. Color scales represent absorption intensity.
In September 2021 (Figure 5a), surface ap(440) values peaked at the river-influenced stations (S06 and S07), but unexpectedly, station S02—characterized by a more marine influence—showed the highest value of the campaign (1.108 m−1), indicating a localized input or accumulation of particulate matter.
During February 2022 (Figure 5b), both surface and bottom layers exhibited the lowest ap(440) values recorded across all campaigns, suggesting a period of reduced particulate input and a relatively well-mixed water column. In most stations, the difference between surface and bottom layers was minimal, pointing to weak vertical stratification. An exception was observed at station S04, where bottom ap(440) (0.461 m−1) was nearly twice the surface value (0.234 m−1), suggesting localized resuspension or vertical transport.
In June 2022 (Figure 5c), the water column displayed strong vertical stratification in all stations, with a distribution pattern resembling that of September 2021. Notably, station S02 again exhibited surface ap(440) values (1.070 m−1) similar to those at the most turbid, river-influenced sites—S06 (1.472 m−1) and S07 (2.084 m−1)—highlighting the complex and dynamic nature of particulate distribution in this transitional coastal zone.
These findings are consistent with other optical studies in fluvial-marine transition zones, where sediment dynamics, resuspension, and freshwater pulses generate marked spatial and vertical heterogeneity in absorption coefficients [32,33,34]. The observed variability in ap(440) reinforces the importance of capturing both surface and bottom conditions when assessing light availability in reef systems exposed to high sediment fluxes.
Across all campaigns, the spatial structure of ap(440) reflects a gradient of influence from the Canal del Dique, with maximum absorption values recorded at stations located closest to its outflow (S06 and S07). This spatial signal is consistent with the strong terrestrial input characteristic of semi-enclosed coastal systems influenced by major freshwater discharges [33]. This gradient diminishes toward stations less exposed to fluvial discharge, particularly S01 and S02, although localized peaks—such as those observed at S02—highlight the dynamic nature of particulate distribution within this semi-enclosed bay. Such anomalies may reflect transient inputs, sediment resuspension, or retention zones that accumulate particulate matter, as also reported by Ferrari et al. [32] and Tilstone et al. [35].
The observed temporal and vertical variability underscore the importance of assessing both the particulate and dissolved fractions to better understand optical water quality and ecological functioning in systems with strong and variable terrestrial inputs. This multidimensional approach is especially relevant in areas like Varadero Reef, where corals thrive under suboptimal light conditions, making them highly sensitive to fluctuations in optical properties [5,8].
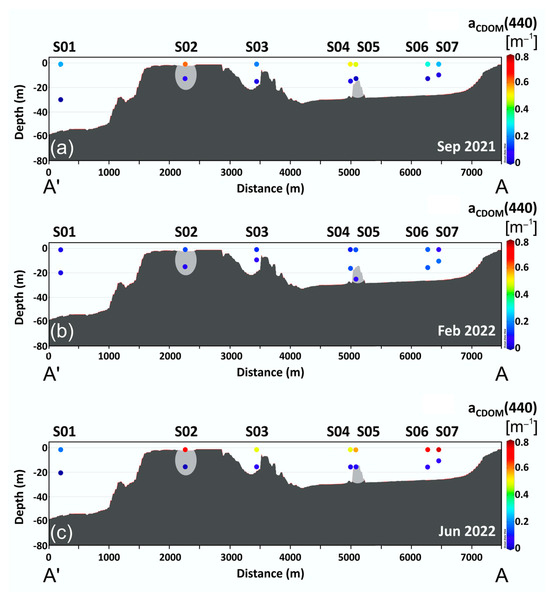
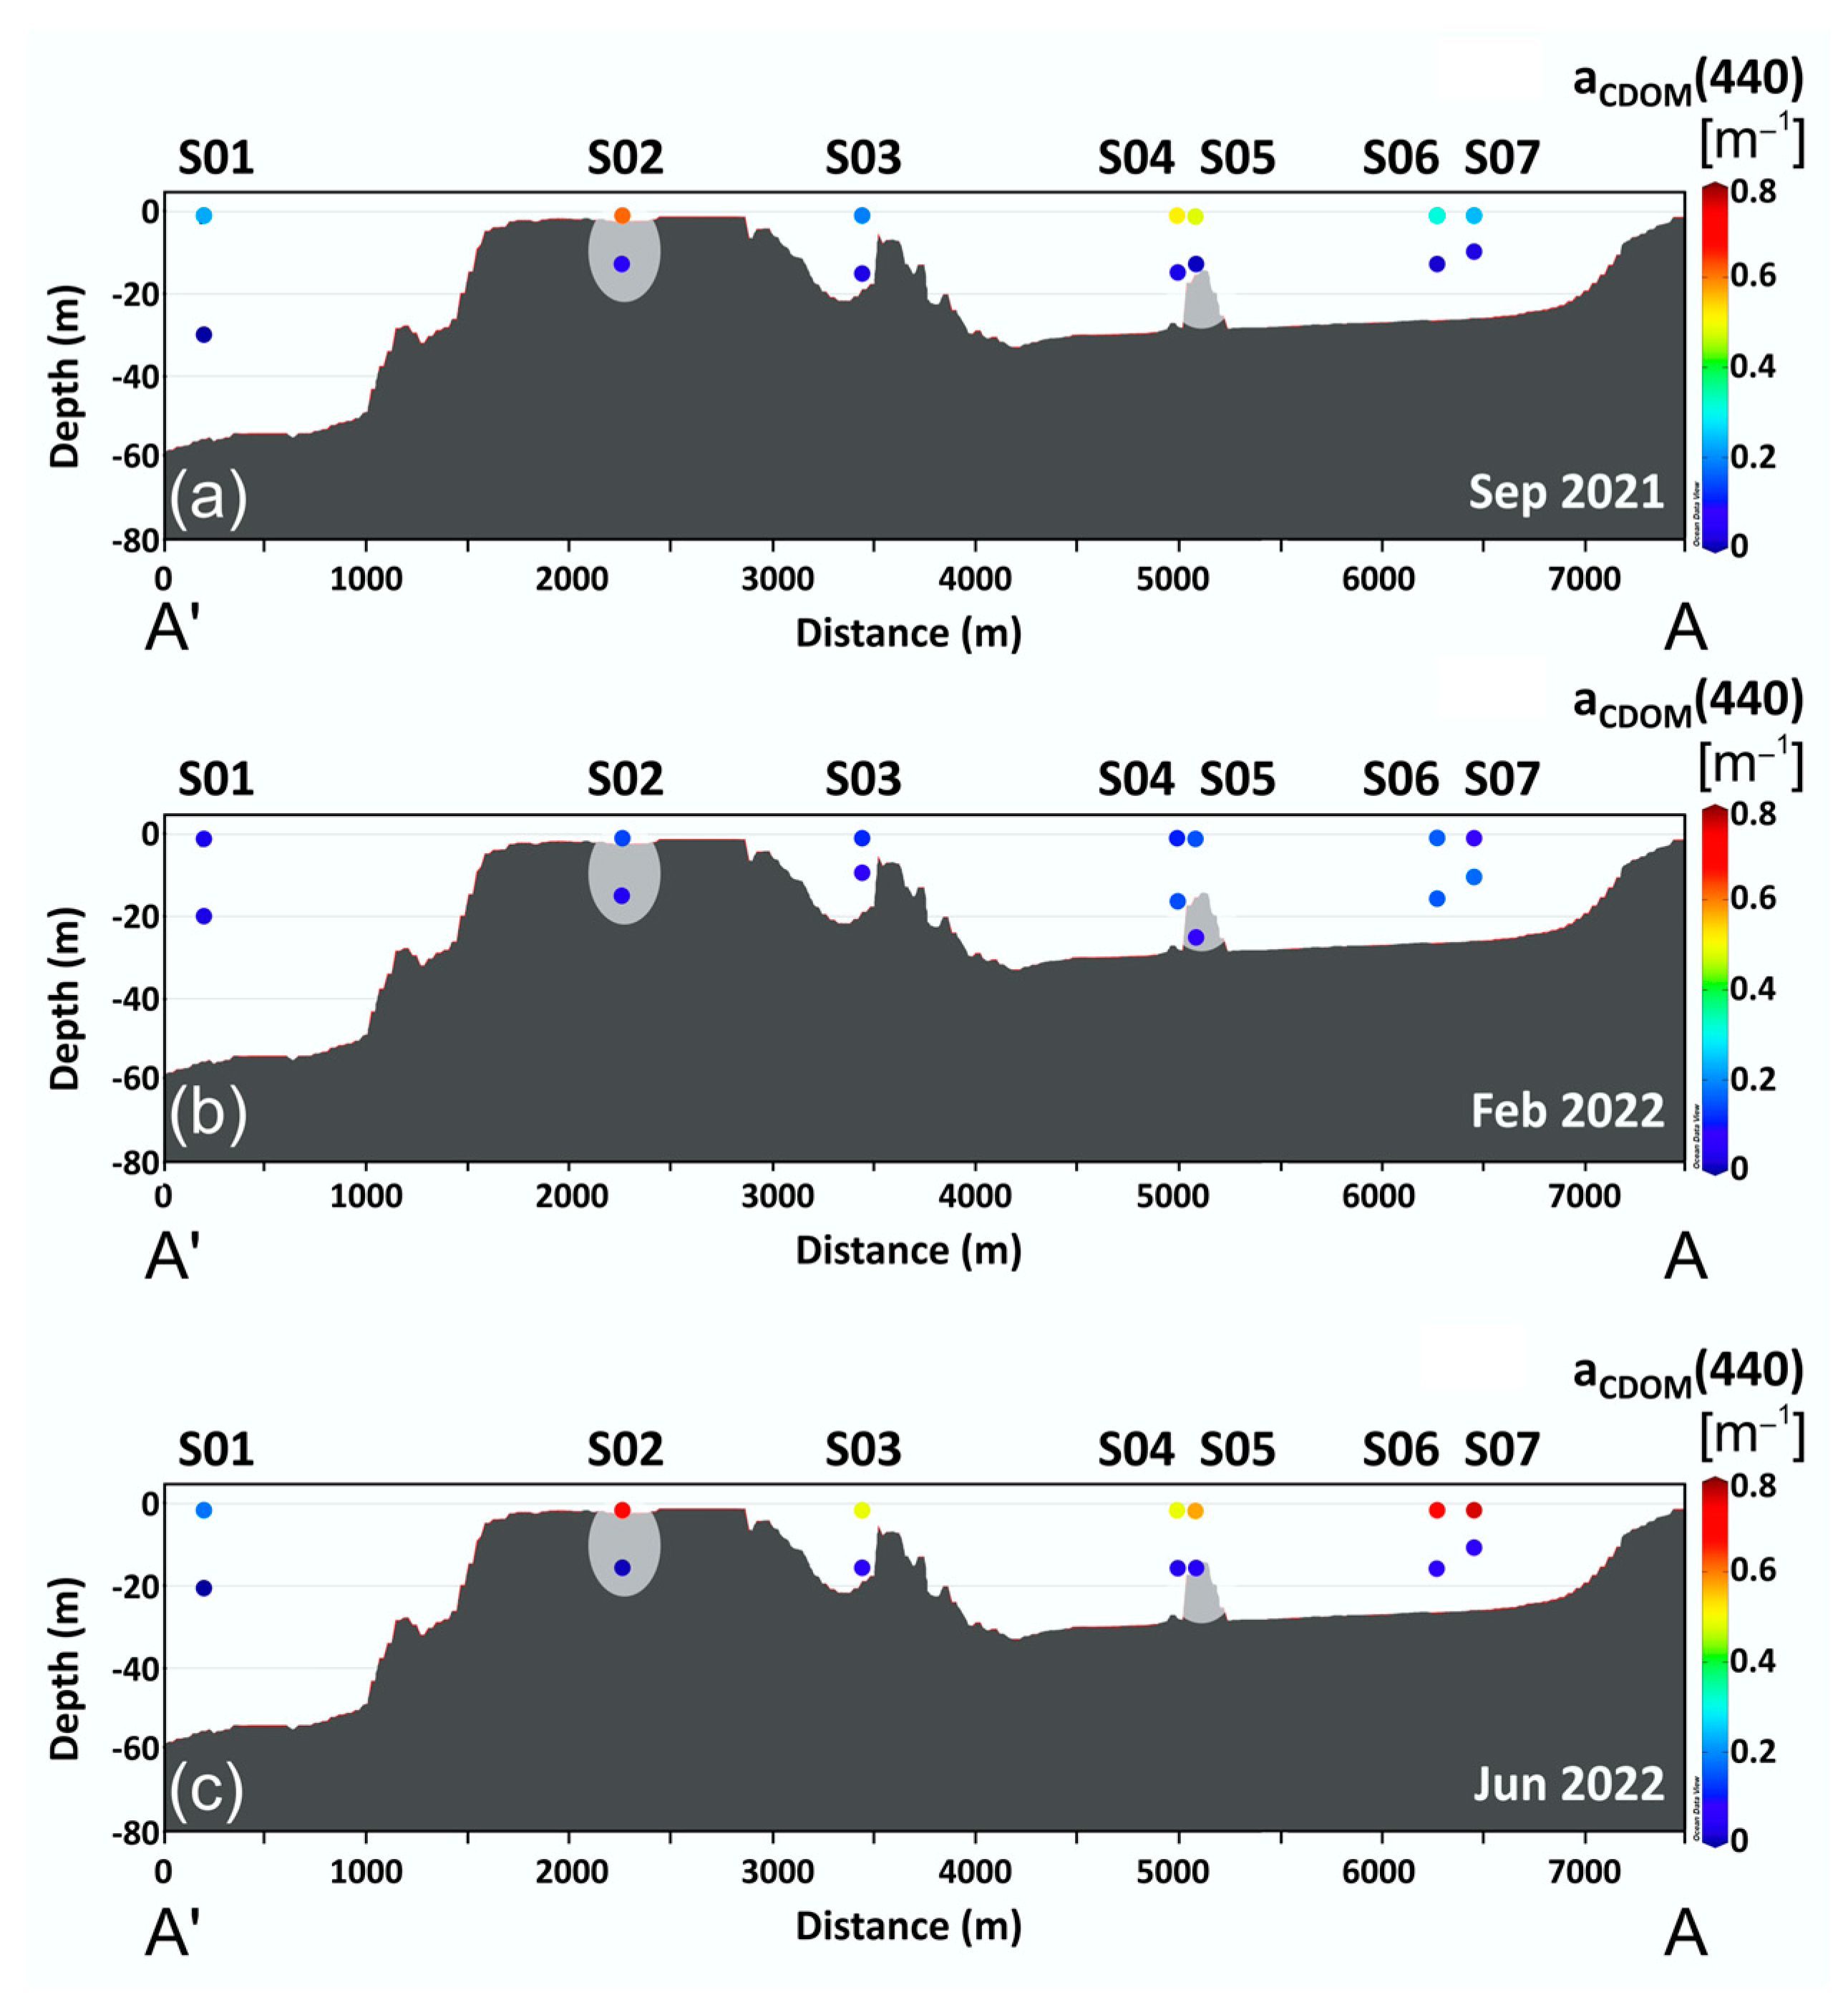
Just like ap(440), aCDOM(440) generally shows higher values at the surface than at depth in most stations (Figure 6a–c), confirming the prevalence of terrestrial-derived dissolved organic matter in surface layers influenced by riverine discharge. Regarding the spatial gradient, distinct patterns were observed for each campaign:
Figure 6.
Chromophoric dissolved organic matter absorption coefficient at 440 nm (aCDOM(440)), for the three sampling campaigns. The transect location and orientation are the same as in Figure 5, with end points A and A′ corresponding to the transect illustrated in Figure 5d. The color scale is adjusted to the observed values of aCDOM(440), ranging from 0 to 0.8 m−1. (a) September 2021; (b) February 2022; (c) June 2022.
- In September 2021 (Figure 6a), the spatial distribution of aCDOM(440) revealed an inverse trend compared to ap(440), with increasing values from station S07 (0.240 m−1) to S02 (0.613 m−1). This pattern suggests areas with lower particle concentration may retain higher CDOM levels due to reduced photodegradation and enhanced retention—mechanisms consistent with findings by Xi et al. [25] and Mohd-Shazali et al. [27]. An exception occurred at S03, which registered the campaign’s lowest surface value (0.188 m−1), possibly reflecting dilution from marine waters or local flushing.
- In February 2022 (Figure 6b), a weaker spatial gradient was observed, with values progressively decreasing from S07 (0.171 m−1) to S01 (0.029 m−1). This campaign coincided with the lowest overall particulate and CDOM levels, consistent with a dry-season reduction in fluvial inputs and a more homogenized water column.
- In June 2022 (Figure 6c), a marked decline in aCDOM(440) was recorded from S07 (0.766 m−1) to S01 (0.176 m−1), with a notable anomaly at station S02 (0.684 m−1), whose values were comparable to those of highly fluvial stations like S06 (0.691 m−1). These elevated values at S02 suggest that this site may be receiving episodic inputs of CDOM-rich water, possibly due to eddy activity, wind-driven transport, or internal waves—mechanisms noted in other optically complex systems [26,36].
These results emphasize that both CDOM and particulate absorption exhibit dynamic and at times decoupled spatial patterns, reinforcing the necessity to monitor both components independently. Moreover, the influence of CDOM on underwater light quality is particularly relevant for coral reef systems in turbid environments, where it modulates photic stress and may shape long-term coral survivorship [3,7,31].
To better understand the physical drivers behind these optical relationships, particularly the influence of freshwater discharge and hydrodynamic conditions, we examined the environmental context across the three campaigns using a combination of satellite and in situ data.
3.3. Environmental Context: Support for Optical Variability
The seasonal and spatial variability of underwater light absorption was assessed in relation to environmental conditions during the three sampling campaigns, using a combination of in situ measurements, satellite-derived data, and reanalysis products, as described in Section 2.6. These included sea surface temperature (SST), wind speed, tidal levels, precipitation, salinity, chlorophyll-a, turbidity, and water column stratification—each offering a complementary perspective on the physical and hydrological forcing mechanisms that influence optical properties in Cartagena Bay.
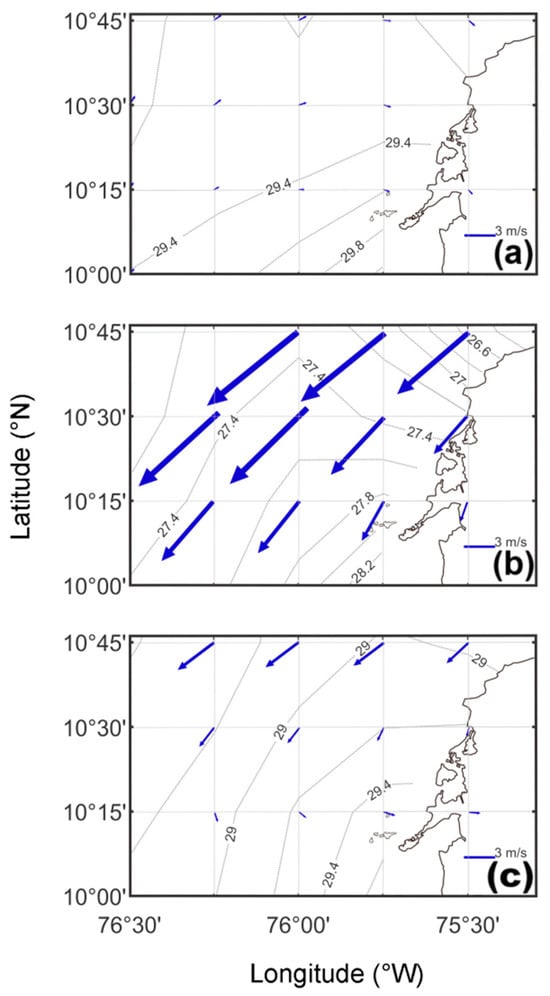
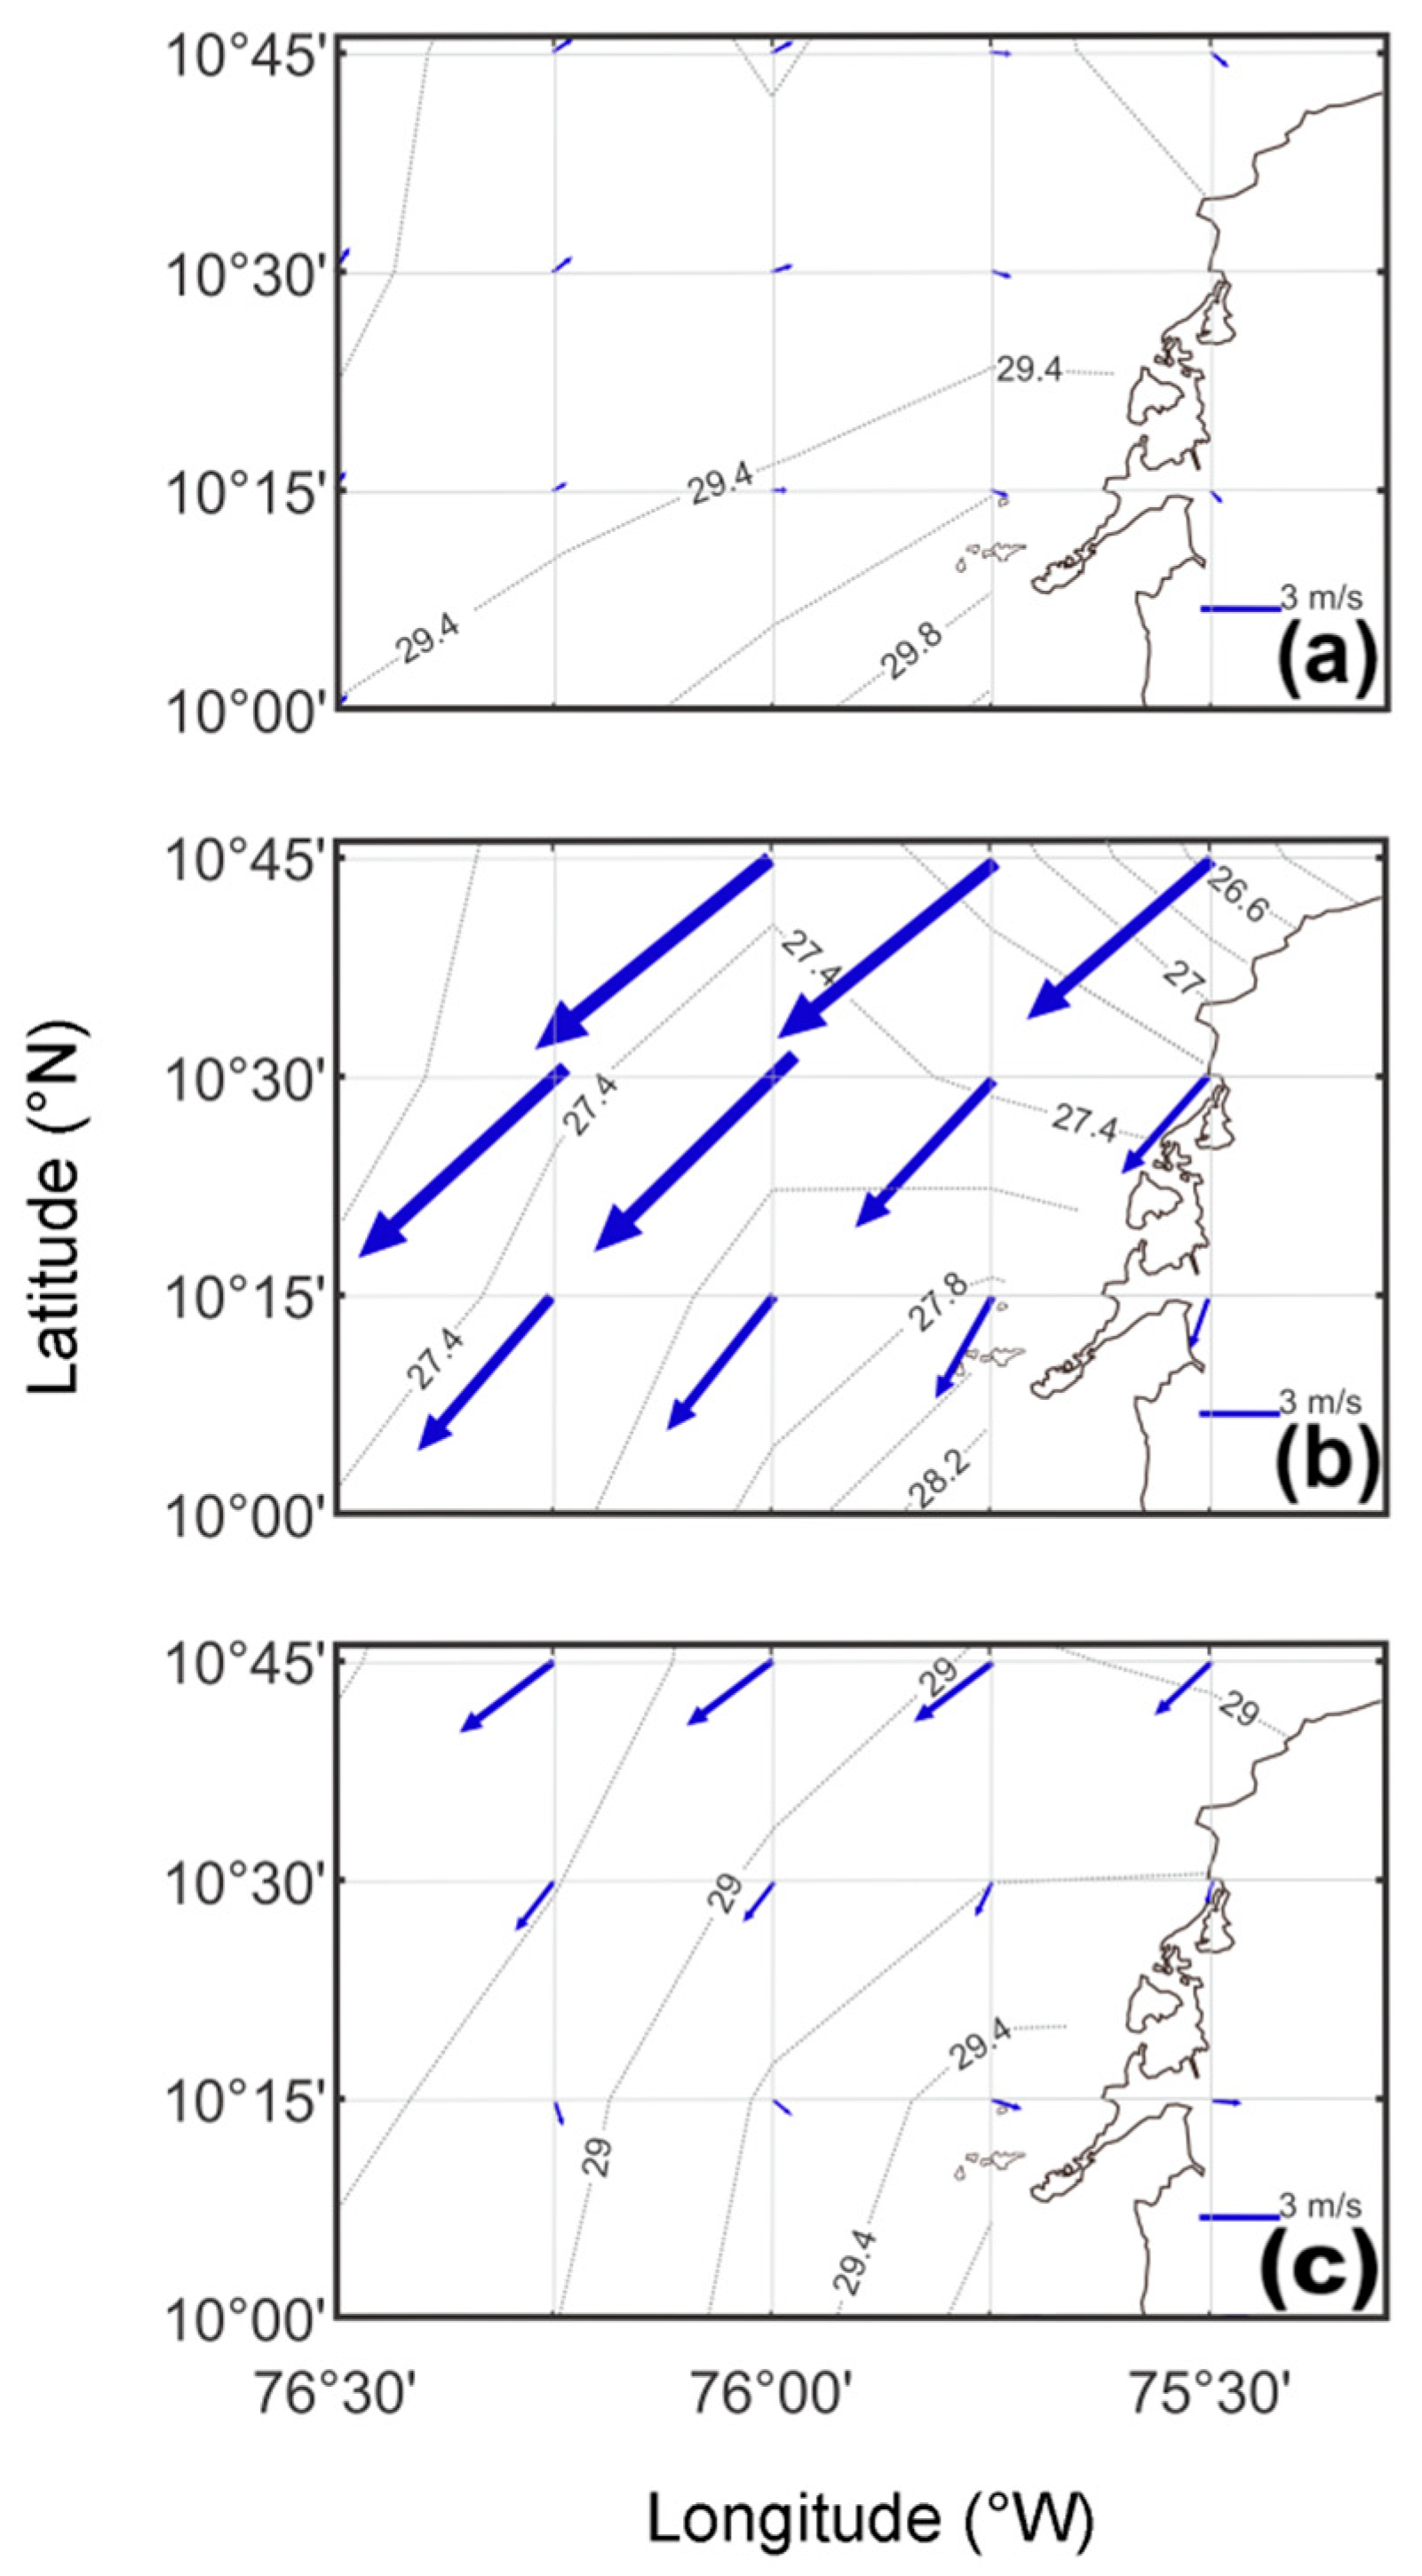
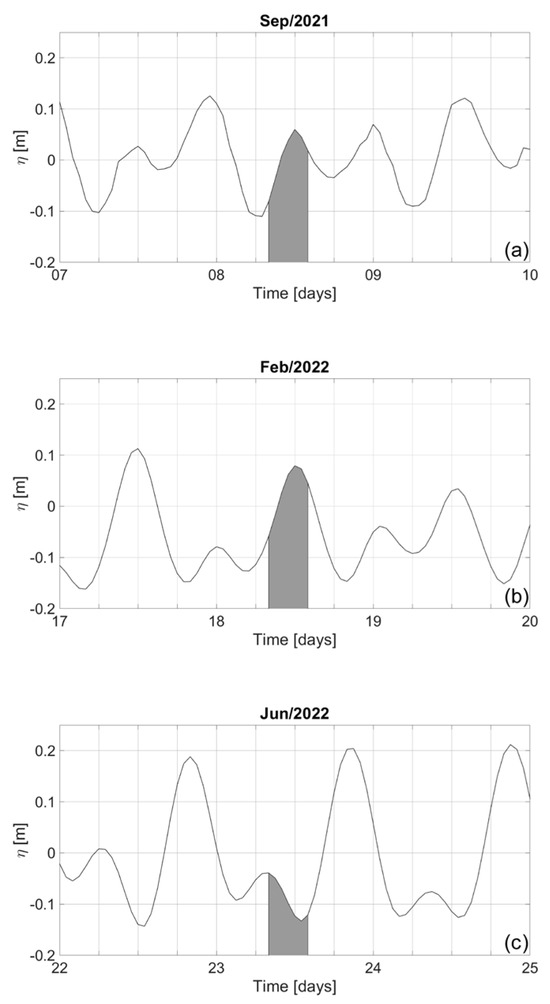
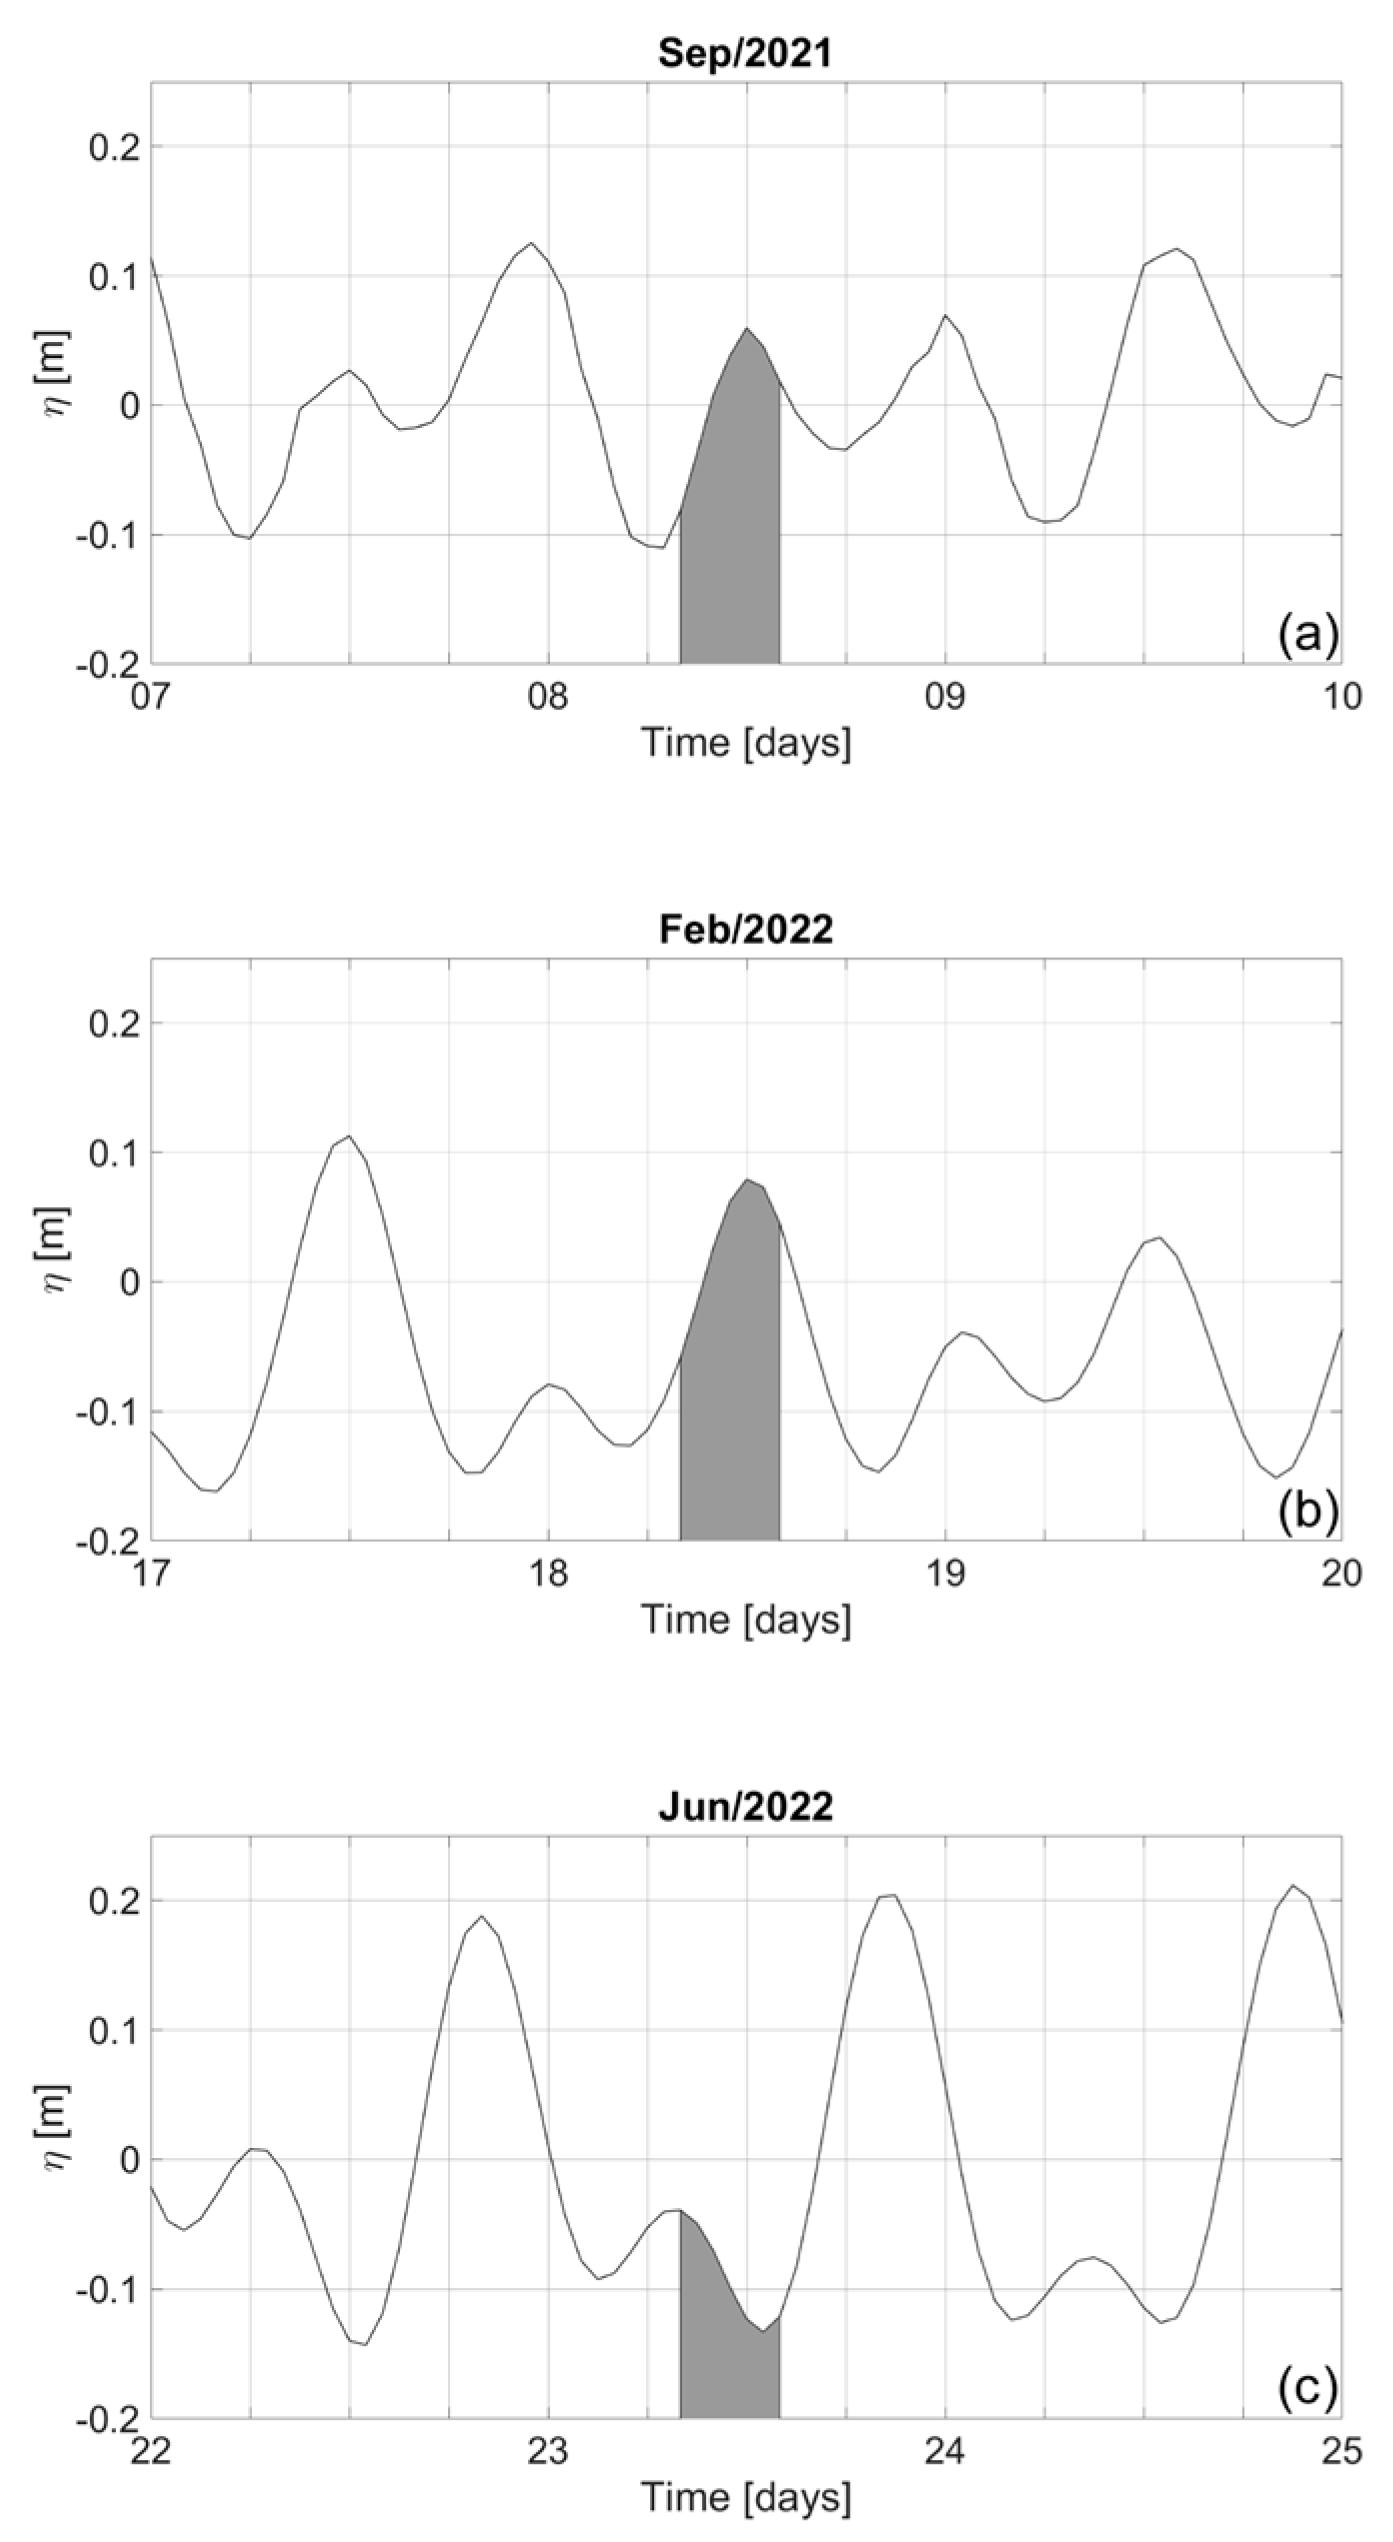
Environmental data indicate that September 2021 (Figure 7a) and June 2022 (Figure 7c) were characterized by warm sea surface temperatures (29–29.8 °C) and weak winds (<3 m·s−1), creating favorable conditions for thermohaline stratification. Conversely, February 2022 (Figure 7b) showed cooler SSTs (26.6–28.2 °C) and stronger winds (>3 m·s−1), which likely promoted vertical mixing and reduced the stability of the water column. These seasonal contrasts in SST and wind regimes are typical of tropical coastal systems influenced by both trade winds and the Intertropical Convergence Zone (ITCZ), which modulate regional hydrodynamics and freshwater inputs [34,37]. Tidal dynamics also played a role in shaping optical variability, with rising tides during the September 2021 (Figure 8a) and February 2022 (Figure 8b) campaigns and a falling tide during June (Figure 8c). This latter condition may have facilitated sediment resuspension and enhanced particulate concentrations in surface waters, a pattern evident in ap(440) values (Figure 5) and turbidity data (Table 1). Tidal asymmetry in semi-enclosed systems like Cartagena Bay can amplify the retention or export of fluvial materials, influencing CDOM accumulation and optical stratification [34,36].
Figure 7.
Daily averaged sea surface temperature (SST, °C) and surface wind speed (m·s−1) from ERA5 during the three monitoring campaigns: (a) 8 September 2021; (b) 18 February 2022; (c) 23 June 2022.
Figure 8.
Sea level time series measured at the CIOH tide gauge station. The gray zones indicate the monitoring dates: (a) 8 September 2021; (b) 18 February 2022; (c) 23 June 2022.
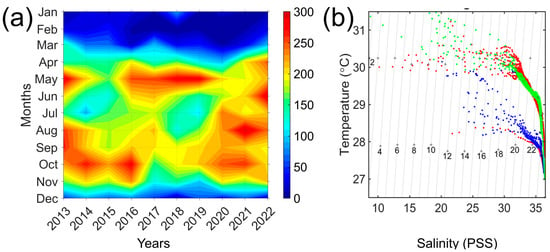
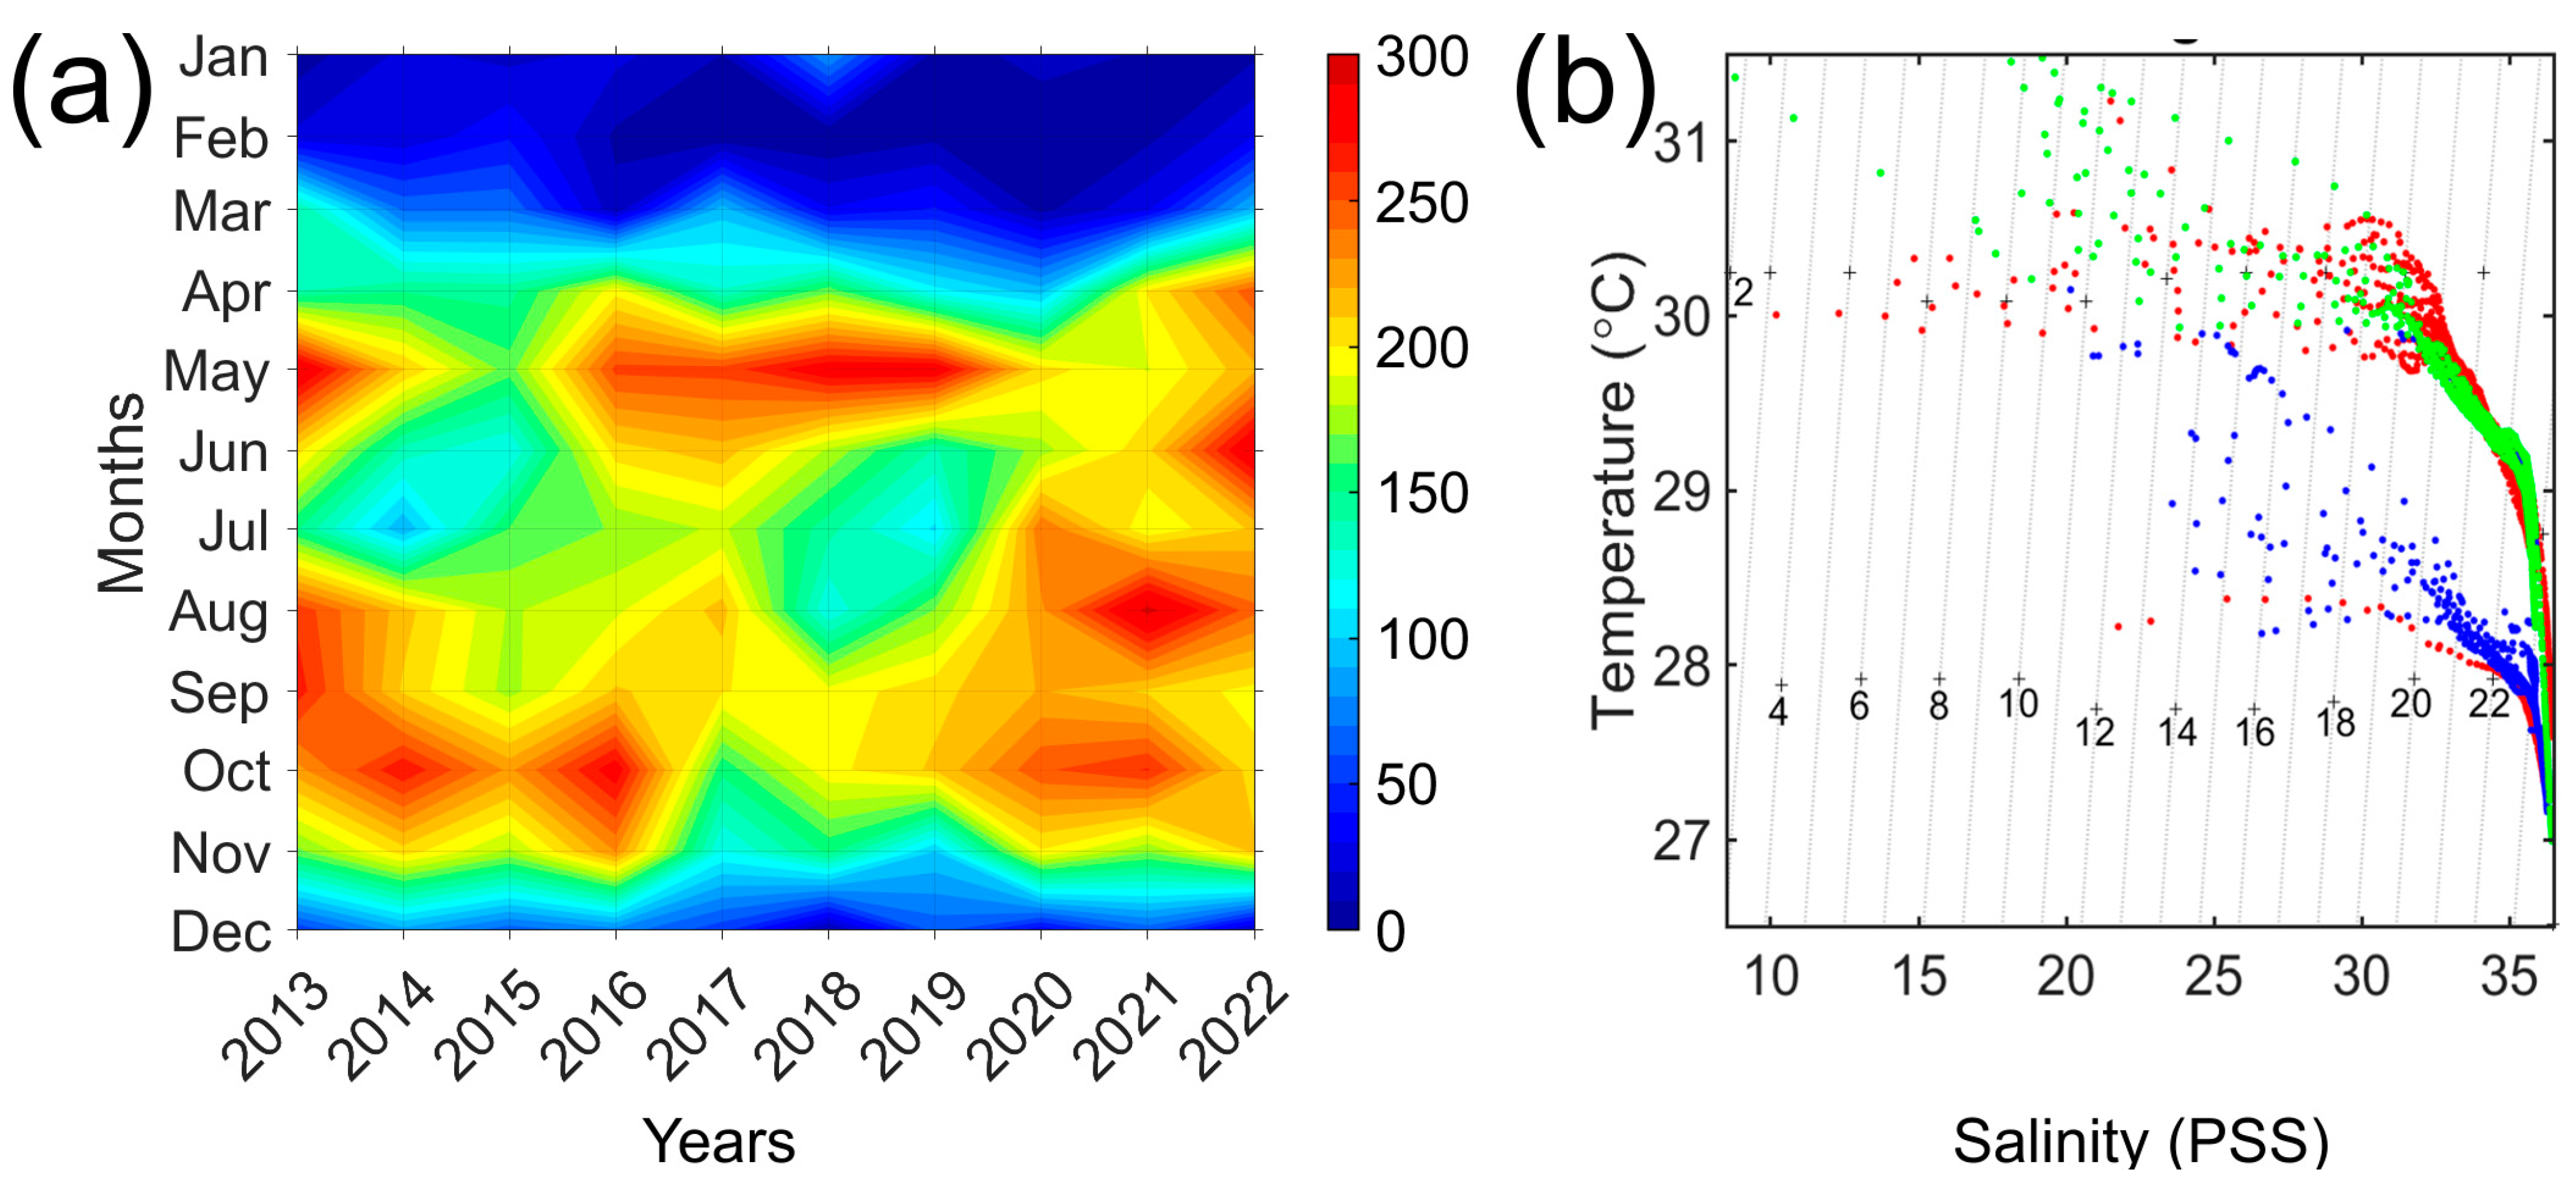
Precipitation patterns further contextualize the optical differences observed across seasons. September and June coincided with high rainfall (>200 mm/month), while February marked the dry season with minimal precipitation (~60 mm) (Figure 9a). These differences are clearly associated with the magnitude of freshwater discharge through the Canal del Dique and are reflected in lower surface salinities, higher turbidity, and increased absorption by both CDOM and particulate matter during rainy months. Similar precipitation-driven effects on coastal optical properties have been reported in diverse systems, including Arctic deltas [26], Asian estuaries [27,38], and tropical South American bays [39,40].
Figure 9.
(a) Hovmöller diagram of monthly rainfall accumulation (mm) from ERA5 along the Canal del Dique region from 2013 to 2022. Black stars mark the dates of the three monitoring campaigns. (b) Temperature–salinity (T–S) diagram for in situ measurements collected during each campaign: 8 September 2021 (green), 18 February 2022 (blue), and 23 June 2022 (red).
Vertical stratification patterns, derived from CTD profiles and temperature–salinity diagrams (Figure 9b), confirm the presence of distinct surface and bottom layers during the September and June campaigns. These were typified by warmer, fresher surface waters overlaying cooler, saltier bottom layers, enhancing vertical differences in optical properties. February, by contrast, displayed a more uniform water column, consistent with increased wind-induced mixing.
Complementing these hydrographic conditions, bio-optical indicators also responded to seasonal forcing. Secchi depth decreased and turbidity rose during the rainy season, while surface chlorophyll-a concentrations peaked in June (6.2 μg·L−1), likely stimulated by elevated nutrient loads from terrestrial runoff. This pattern aligns with the strong correlation found between chlorophyll-a and ap(440), reinforcing the role of phytoplankton as a contributor to total particulate absorption in coastal waters [3,29].
Together, these environmental patterns underscore the tight coupling between regional climatic drivers and underwater light conditions. They also reinforce the need to interpret optical variability not solely as a product of biological or optical processes, but as an emergent property of complex and dynamic hydroclimatic interactions. This holistic perspective is essential for understanding the resilience of turbid coral reef systems such as Varadero, where benthic organisms rely on specific light regimes to maintain productivity under chronically reduced transparency [3,8].
3.4. Implications for Coral Light Environment
The spatial and seasonal variability observed in absorption properties has direct implications for the underwater light regime in Varadero Reef. Stations located farther from the Canal del Dique’s influence (S01–S03), especially during the February 2022 campaign, exhibited the highest water transparency (Secchi disk depth up to 13 m), low ap(440) values, and minimal CDOM absorption. These conditions allow greater irradiance to reach the benthos, which is critical for sustaining the photosynthetic needs of corals and their endosymbiotic algae [3,31].
Conversely, stations more strongly influenced by fluvial discharge (S06–S07) consistently showed elevated ap(440) values across campaigns, with maximum surface values exceeding 2 m−1 in June 2022. These high turbidity levels limit light penetration and reduce the vertical depth of the photic zone. However, they may also serve an adaptive role by filtering high-energy radiation, thereby providing photoprotection against excessive irradiance and UV exposure—a mechanism previously identified in turbid reef environments [8,41].
Notably, at certain stations and times—such as S03–S05 in September 2021 and S01 in June 2022—CDOM accounted for more than 50% of the total non-water absorption. This suggests that CDOM can become the dominant optical constituent, shaping not only the intensity but also the spectral quality of the light field. Because CDOM preferentially absorbs shorter wavelengths (UV and blue light), its presence may reduce photoinhibition risks while still allowing longer wavelengths to penetrate, thus modulating the light environment experienced by benthic communities [3,27].
This dual role of optical constituents—as both stressors and buffers—has major implications for coral physiology. While elevated particulate matter reduces light quantity, high CDOM levels can enhance spectral shielding, potentially fostering ligth acclimation and increasing tolerance to high thermal conditions [7]. The coexistence of reduced transparency and robust coral cover in Varadero therefore supports the notion that turbid reefs can harbor resilient coral assemblages when light quality is moderated by CDOM, a conclusion echoed in other marginal reef settings [29,42].
Understanding these trade-offs is crucial for interpreting the optical niche space available to corals in turbid coastal systems. In the case of Varadero, the balance between light limitation by particles and photoprotection by CDOM likely contributes to the persistence of coral-dominated communities under suboptimal light conditions. This insight adds to a growing body of literature calling for the incorporation of spectral quality metrics, not just light quantity, into assessments of coral reef vulnerability and resilience [5,8,28].
The strong dependence of optical absorption coefficients on the fluvial inputs from the Canal del Dique suggests that any modification to this freshwater-sediment delivery system would likely alter the underwater light environment in Varadero Reef. A complete closure of the canal could reduce both particulate and CDOM contributions, resulting in increased water transparency. While such a shift may seem beneficial in terms of light availability, it could also eliminate the spectral filtering effect provided by CDOM, potentially exposing corals to harmful UV radiation and altering the ecological balance that currently supports coral survival in this turbid environment [3,8]. These findings highlight the need to consider both light quantity and quality in management scenarios involving hydrological interventions.
3.5. Methodological Contributions and Broader Applicability
One of the key contributions of this study lies in the implementation of optical properties as a tool for monitoring marine ecosystems. This approach is grounded in the physical principle that variations in the bio-optical composition of the water column alter its light absorption and scattering characteristics. Optical properties can be classified into two categories: (1) apparent optical properties (AOPs), which are influenced by the aquatic medium and its environmental conditions, and (2) inherent optical properties (IOPs), which are determined by the constituents of the water itself.
AOPs, such as Secchi disk depth (ZSD), allow for rapid and low-cost estimations of parameters like the diffuse attenuation coefficient (Kd), revealing an inverse correlation between water transparency and particulate matter concentration [20]. However, their usefulness is limited to broad spatial scale approximations and is subject to variability depending on system type and the relative proportion of scattering versus absorption. Therefore, their interpretation must consider the specific conditions of the optical gradient (e.g., fluvial vs. marine influence).
In contrast, IOPs—including the specific absorption coefficients of phytoplankton (aphy), non-algal particles (aNAP), and CDOM (aCDOM)—offer a quantitative breakdown of the individual contributors to light attenuation. While their measurement requires standardized sampling and analytical methodologies, they provide higher analytical resolution that allows for the distinction between natural and anthropogenic sources of turbidity. Their inclusion significantly enhances diagnostic capabilities in optical water quality assessments.
The comparative application of both approaches in coastal systems such as Cartagena Bay reveals complementary advantages: while AOPs facilitate synoptic monitoring of turbidity changes, IOPs enable the identification of specific drivers behind those changes (e.g., phytoplankton blooms vs. terrigenous inputs). This distinction is critical for evaluating anthropogenic impacts, such as those associated with the modification of the Canal del Dique, where detailed characterization of IOPs could help predict effects on sensitive benthic communities (e.g., corals) by defining resilience thresholds.
Additionally, the proposed methodological framework has potential for application in other coastal reef systems subject to high turbidity and similar optical gradients, provided that local adaptations are made to the hydrodynamic and bio-optical conditions of each system. This potential for extrapolation—together with the relatively low cost of certain AOP measurements and the high specificity of IOPs—reinforces the value of this approach as a versatile tool for adaptive monitoring in vulnerable ecosystems.
The integration of both methodologies thus enhances early detection of ecosystem alterations, combining spatiotemporal coverage with bio-optical specificity and improving responsiveness to changes in marine environmental quality.
3.6. Limitations of the Absorption-Based Approach
Although this study does not include direct measurements of light scattering or backscattering—which represents a methodological limitation by addressing only one component of underwater light attenuation—the chosen approach was intentionally designed to match the capabilities of routine water quality monitoring laboratories, particularly those lacking access to high-cost instruments such as backscattering sensors or volume scattering function (VSF) systems.
The results demonstrate that integrating inherent optical properties is a technically and economically viable strategy for water quality monitoring, even in institutional contexts with limited resources. By combining fundamental principles of marine optics with protocols adaptable to local conditions, this approach can be progressively implemented into existing monitoring networks without requiring complex investments, thus enhancing diagnostic capacity without overburdening budgets.
Its application is particularly valuable in dynamic and hard-to-access coastal ecosystems, such as coral reefs in turbid waters, where gaps in data often constrain effective environmental management. This methodological framework helps democratize access to optical monitoring technologies, offering a reproducible, evidence-based alternative to support decision-making. To encourage widespread adoption, the development of standardized guidelines and training programs is recommended, especially for agencies with varying technical capacities.
4. Conclusions
This study demonstrates that the absorption coefficients ap(440) and aCDOM(440) offer a robust tool for characterizing optical water quality in complex and highly dynamic coastal systems. Varadero Reef is considered a functional ecosystem, despite being embedded in an extremely turbid environment with marked seasonal and vertical variability, which we were able to observe through the optical components responsible for light absorption.
The results show that ap(440) dominates absorption under high turbidity conditions and proximity to the canal, while aCDOM(440) becomes more relevant at stations with marine or mixed influence. CDOM also emerges as a potential photoprotective agent due to its ability to attenuate UV radiation. This functional duality—where particulate matter regulates light availability and CDOM modulates its spectral quality—helps to explain the reef’s resilience under adverse light conditions.
Integrating these inherent optical properties into monitoring frameworks provides a powerful approach to understanding system dynamics beyond what can be achieved using conventional descriptors such as turbidity, ZSD, or chlorophyll-a alone. These allow for more precise discrimination of optical processes and their ecological implications. The inclusion of these is recommended as key indicators in adaptive management strategies, ecological monitoring, and the conservation of coral reefs under strong continental pressures.
Finally, this study demonstrates that the absorption coefficients ap(440) and aCDOM(440) can be effectively incorporated into environmental monitoring schemes as sensitive, reproducible, and low-cost indicators. Even in the absence of scattering measurements, the proposed approach offers a practical and technically robust tool to strengthen optical assessments in complex coastal ecosystems, particularly in settings with operational limitations. To support its integration, we recommend the development of guidelines and training programs that promote its implementation across various institutional scales.
Supplementary Materials
The following supporting information can be downloaded at: https://www.mdpi.com/article/10.3390/w17192820/s1: Table S1: Summary of datasets used in this study, including their source, description, spatial and temporal resolution, coverage period, data format, and access information.
Author Contributions
Conceptualization, S.P.B.-T. and E.S.-d.-A.; methodology, S.P.B.-T., E.S.-d.-A. and Y.S.-B.; formal analysis, S.P.B.-T. and E.S.-d.-A.; software, A.M.-T.; investigation, S.P.B.-T., G.M.-M., J.P.R.-H. and Y.S.-B.; writing—original draft preparation, S.P.B.-T. and A.M.-T.; writing—review and editing, S.P.B.-T. and E.S.-d.-A. All authors have read and agreed to the published version of the manuscript.
Funding
This research was funded by the Ministry of Science, Technology and Innovation of Colombia, Project ARC No. 75916, Influence of abiotic factors in the nearby coral reef El Varadero, Cartagena de Indias Bay. The APC was funded by the Direccion General Marítima (DIMAR), Colombia.
Data Availability Statement
The data supporting the findings of this study are available from the corresponding author upon reasonable request. Some of the datasets used, including metadata related to optical and environmental parameters, are publicly accessible through the CECOLDO Metadata Catalog at https://doi.org/10.26640/cecoldo.dataset_00585.
Acknowledgments
The authors acknowledge the support of the Oceanographic and Hydrographic Research Center of the Caribbean (CIOH) for field logistics and access to equipment. We also thank the ERA5 and CIOH-EMAR platforms for providing access to environmental and oceanographic data. Special thanks to the laboratory and technical staff who contributed to data processing and sample analysis.
Conflicts of Interest
The authors declare no conflicts of interest.
Abbreviations
The following abbreviations are used in this manuscript:
| APC | Article Processing Charge |
| CDOM | Chromophoric Dissolved Organic Matter |
| CTD | Conductivity, Temperature, Depth |
| GF/F | Glass Fiber Filter |
| IOPs | Inherent Optical Properties |
| Kd PAR | Diffuse Attenuation Coefficient for Downward Photosynthetically Active Radiation |
| NTU | Nephelometric Turbidity Unit |
| SST | Sea Surface Temperature |
| ZSD | Secchi Disk Depth |
| ap(440) | Particulate absorption coefficient at 440 nm |
| aCDOM(440) | Absorption coefficient of chromophoric dissolved organic matter at 440 nm |
| at(440) | Total absorption coefficient at 440 nm |
| Chl-a | Chlorophyll-a concentration |
| rs | Spearman rank correlation coefficient |
Appendix A. Spectrophotometric Estimation of Particulate Absorption and Uncertainty Considerations
Appendix A.1. Measurement of Spectral Particulate Absorption ap(λ) Using Filter Pads in T-Mode
The spectral absorption coefficient of suspended particles, ap(λ), was estimated using the filter-pad method, following the IOCCG guidelines [18]. A dual-beam spectrophotometer without integrating sphere, operating in transmittance mode (T-mode), was used to measure the light transmitted through hydrated glass fiber filters with (sample) and without (blank) particles.
The absorption coefficient was computed from the measured optical density using the equation:
where:
- ODf(λ): blank-corrected optical density at wavelength λ,
- V: volume of filtered water (m3),
- A: effective filter area (m2),
- = 0.679, γ = 1.2804: empirical coefficients for pathlength amplification correction in T-mode [43].
Although T-mode does not account for all scattering effects, the use of empirical beta corrections enables reliable estimation of relative changes in absorption among samples, especially when consistent protocols are applied.
Appendix A.2. Pathlength Amplification and Its Correction
The internal scattering within glass fiber filters artificially increases the photon pathlength, resulting in overestimation of absorption. This effect, known as pathlength amplification, is corrected using the empirical beta correction expressed as:
Substituting ODs(λ) in the equation for ap(λ) adjusts the estimate toward more realistic values. While this correction introduces its own uncertainties, it is considered adequate for comparative and spectral analyses in T-mode configurations, particularly when integrating spheres are unavailable.
Appendix A.3. Conceptual Framework for Uncertainty Propagation
The combined standard uncertainty of ap(λ), denoted uc(ap), can be approximated by propagating the uncertainties of each input variable:
where includes:
- : variability from scan replicates and filter heterogeneity,
- α, γ: uncertainty in the empirical beta correction,
- V: error in volume measurements (estimated at ±5 mL),
- A: geometric uncertainty in the filter area.
Although full analytical propagation is not performed here, we conservatively estimate the overall relative uncertainty in ap(λ) as ±10–15%, based on instrumental precision, procedural replicates, and published intercomparison studies (e.g., [43,44]).
Appendix A.4. Quality Control: Instrumental Baselines and Blank Filters
To ensure measurement quality and minimize noise, the following controls were implemented:
- Air baselines were recorded and used for instrument drift correction.
- Multiple blank filters were scanned before, during, and after measurements.
- Consistency among blank spectra was verified, particularly in the visible range (400–700 nm), ensuring OD levels within 0.3–0.4, and minimal spectral variation.
Appendix A.5. Supporting Figures
To evaluate the spectral consistency and performance of the blank filters used in the absorption measurements, we conducted replicate spectrophotometric scans in transmittance mode (T-mode) with air baseline correction. This quality assurance step follows the protocol established by [18]), who recommend comparing the spectral behavior of blank filters against reference ranges (see their Figure 5.5).
Figure A1 presents a comparative overview. Figure A1a shows the OD spectra from [18], while Figure A1b displays our dataset. The optical density of our blanks remained tightly distributed within ±0.01 OD units across the entire 200–850 nm spectrum, with no detectable offsets or artifacts. The red line denotes the mean OD across the nine replicates, confirming minimal spectral variability and excellent filter cleanliness. These findings highlight the high optical quality of the blank filters used in this study and support the robustness of the measurement approach, even without the use of an integrating sphere. This level of precision further reinforces the reliability of the absorption coefficients reported in this work.
The raw data used to generate these results are provided in Table A1, offering transparency and enabling comparisons with standardized filter performance benchmarks.
Figure A1.
Comparison of spectrophotometric scans of baseline-corrected blank filters. (a) Spectral optical density (OD) scans of five blank filter pads corrected using an average blank filter signature, as reported by Roesler et al. ([18], Figure 5.5), measured in direct transmittance mode (left) and using an integrating sphere (right). (b) OD scans of nine baseline-corrected blank filter pads used in this study, measured in direct transmittance mode. Black lines indicate individual replicates; the red line shows the mean spectrum.
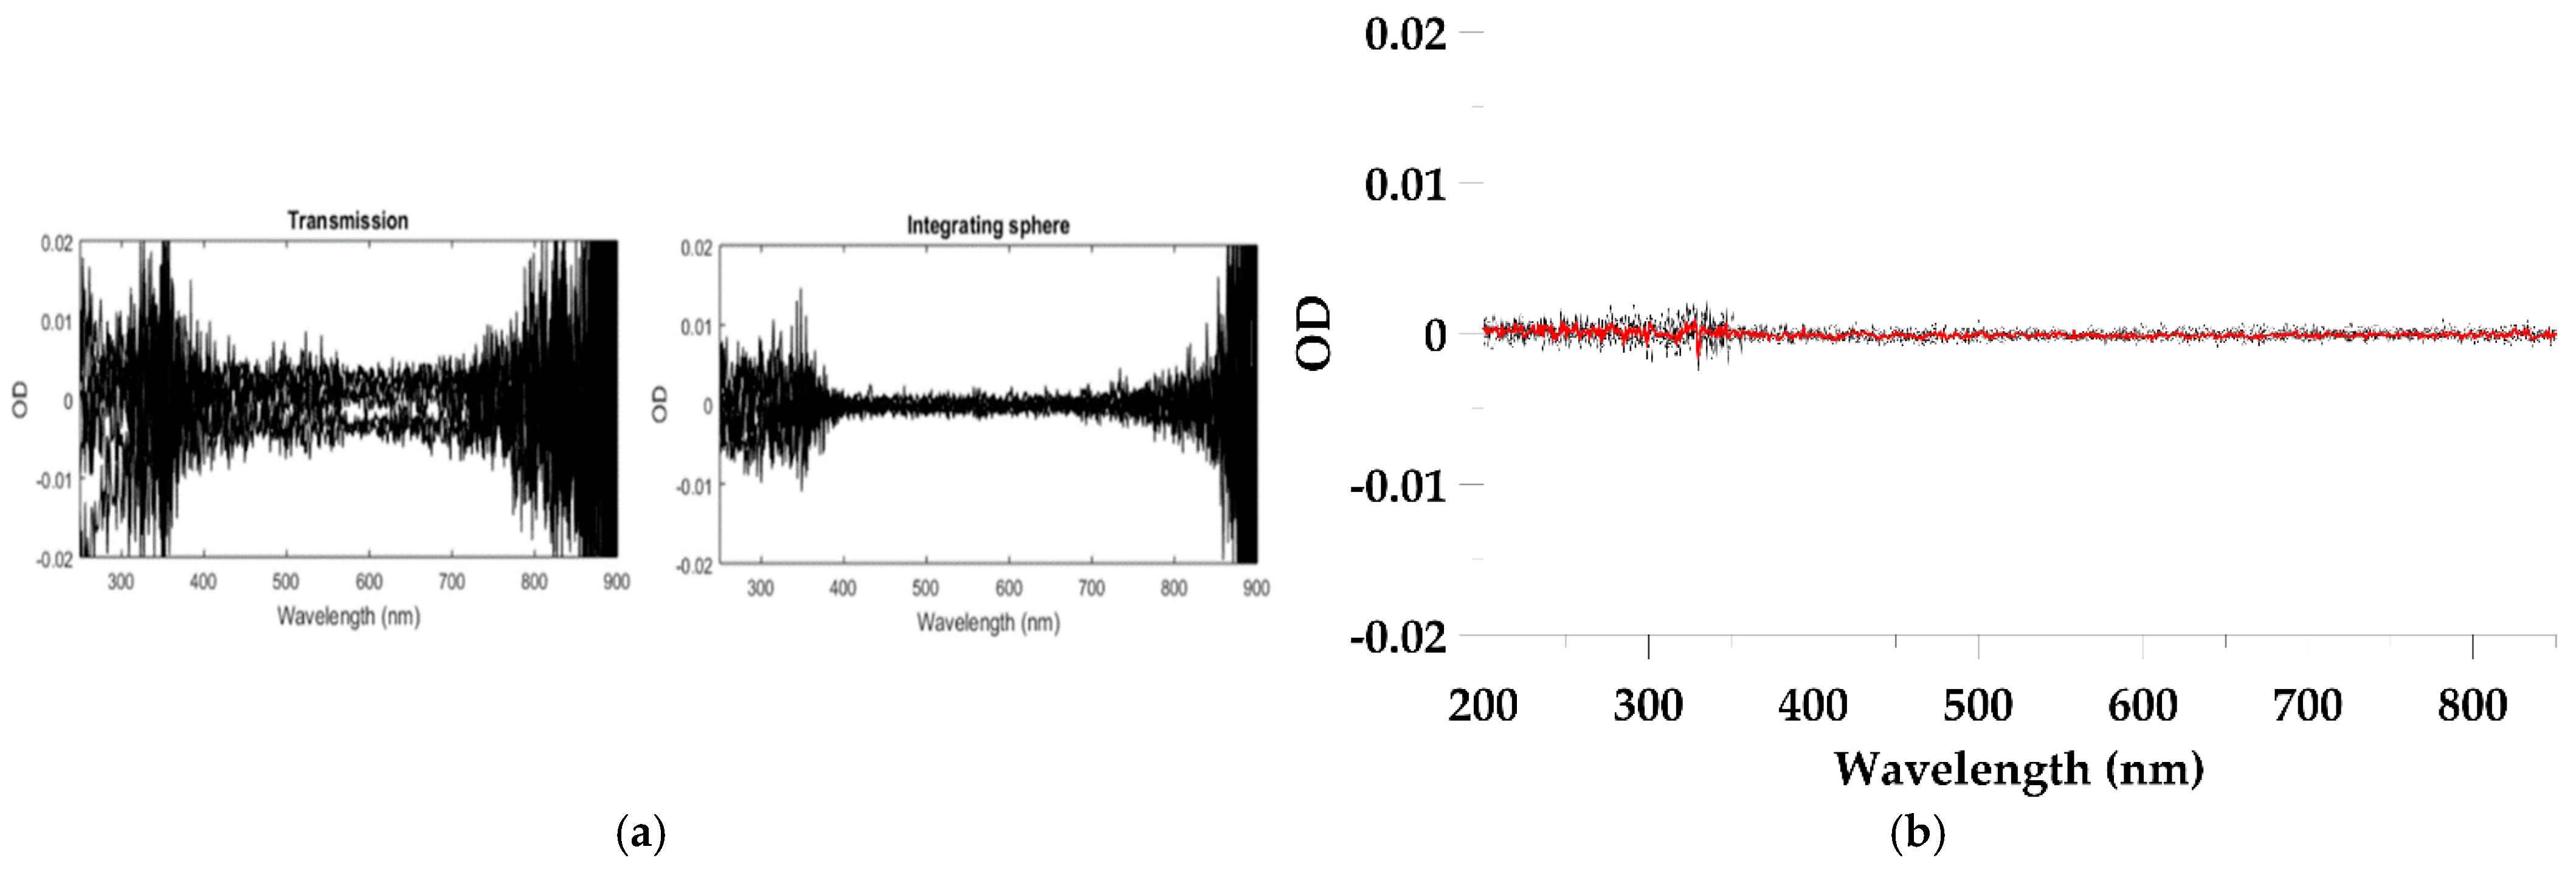
To evaluate the optical quality and spectral consistency of the blank filters used in our absorption measurements, we analyzed their optical density (OD) spectra acquired in direct transmittance mode (T-mode), applying an air baseline correction. This procedure followed the standardized protocol described by [18] and illustrate in Figure A2a. The resulting mean OD spectrum, shown in Figure A2b, was derived from nine individual blank filter pads. The corresponding spectral OD values for each replicate are provided in Table A2 to ensure transparency and facilitate comparison with established benchmarks (cf. Roesler et al., [18], Figure 5.9).
Across the visible range (350–850 nm), the mean OD values remained stable between 2.3 and 2.5, closely matching the reference range of 2.2 (T = 0.6%) to 2.5 (T = 0.3%) reported by Roesler et al. [18]. As expected, OD increased exponentially in the ultraviolet region, reaching a maximum average value of approximately 4.55 at 200 nm. This value is consistent with the reference OD of ~4.1 (T = 0.008%) for high-quality blanks under similar conditions.
These findings confirm the high spectral quality of the blank filters used in this study. No spectral anomalies, signal offsets, or contamination artifacts were detected, supporting the accuracy of the air baseline correction and the reliability of the filter-pad absorption method employed.
Figure A2.
Spectral optical density (OD) of blank filter pads measured in transmittance mode. (a) Reference OD spectra reported by Roesler et al. ([18], Figure 5.9) for blank filters under different neutral density (ND) configurations: air baseline (blue), 0.5 qND (green), and 2.0 qND (red). (b) Mean OD spectrum obtained from this study (black line) for blank filter pads (n = 9), with air baseline correction applied. Dashed horizontal lines indicate reference OD values at 2.2 and 2.5 (visible range), and 4.1 (UV range), as reported in Roesler et al. [18]. The close agreement between the measured and reference values confirms the spectral consistency and quality of the blanks used in this study.
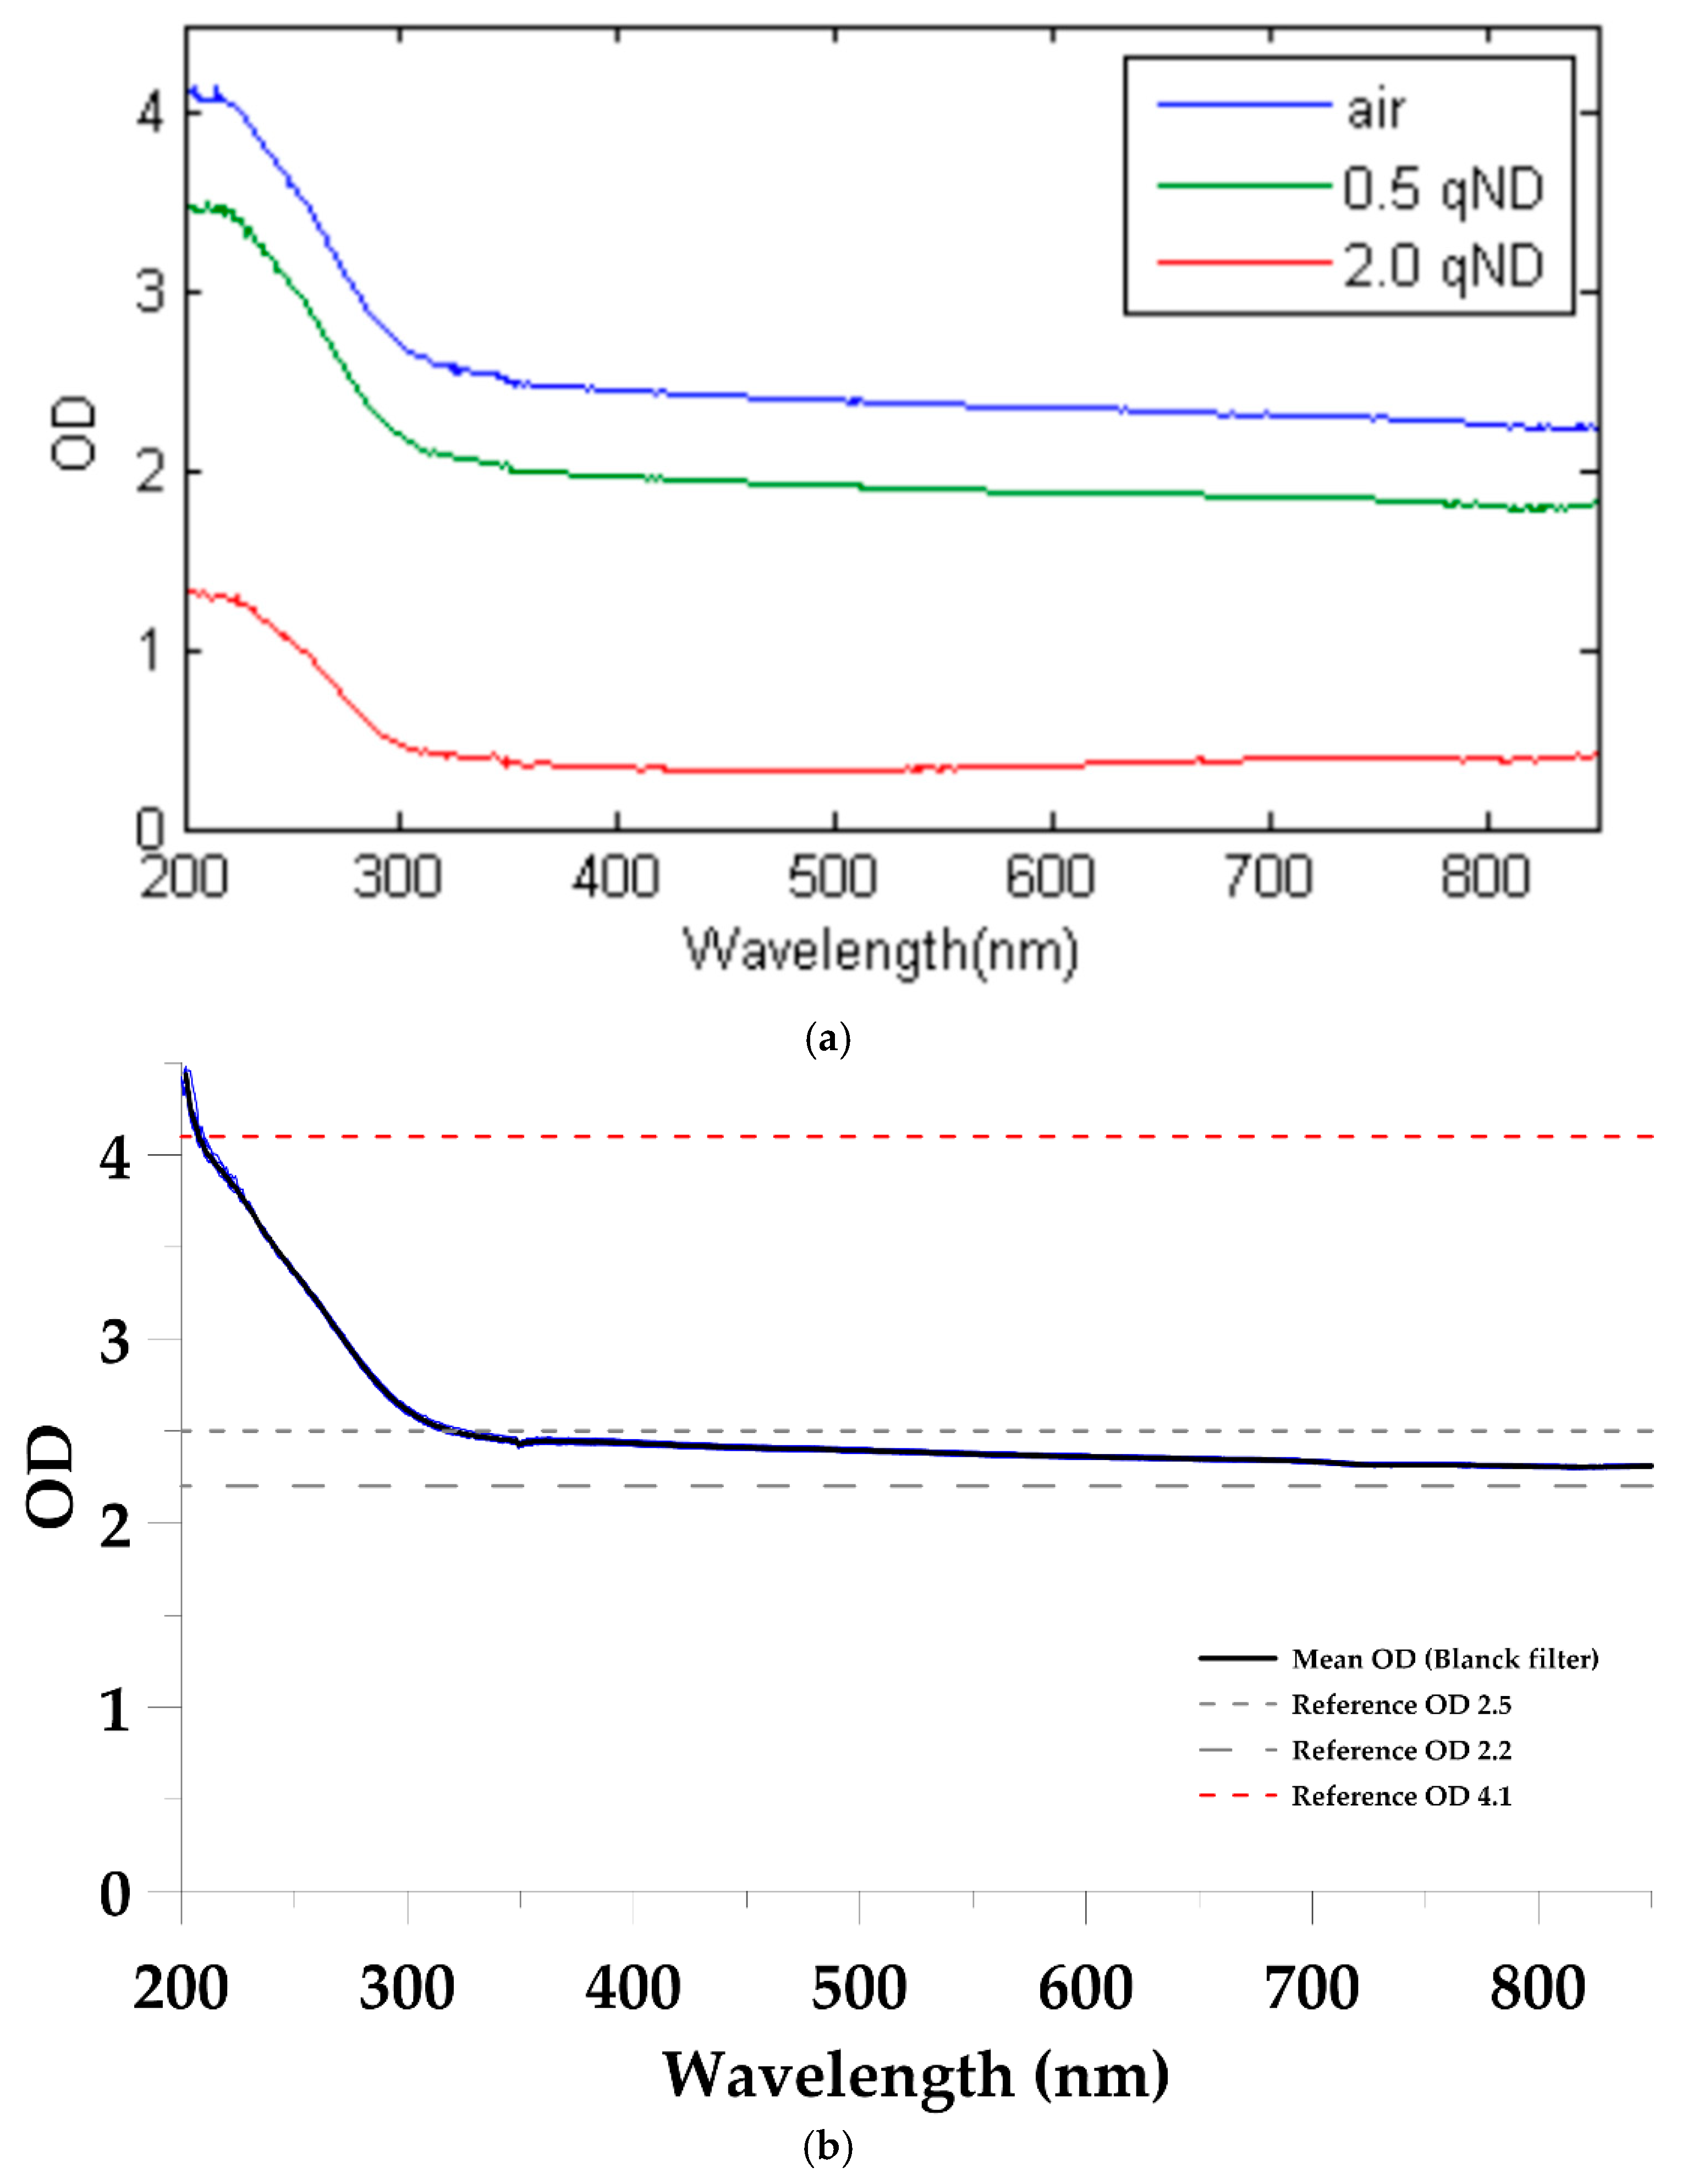
Table A1.
Optical Density (OD) Spectra of Air Baseline and Blank Filters Measured in T-mode. This table includes individual OD spectra of the nine blank filters analyzed to produce Figure A1b. Values are baseline-corrected and span the wavelength range of 200–850 nm. These results were used to evaluate the consistency and optical quality of the blank filters applied in our absorption measurements.
Table A2.
Spectral optical density (OD) values for blank filter pads (n = 9) measured in transmittance mode with air baseline correction.
References
- Davis, K.A.; Pawlak, G.; Monismith, S.G. Turbulence and Coral Reefs. Annu. Rev. Mar. Sci. 2021, 13, 343–373. [Google Scholar] [CrossRef] [Scilit]
- Alegría-Ortega, A.; Sanín-Pérez, M.J.; Quan-Young, L.I.; Londoño-Mesa, M.H. Genetic Structure of Orbicella faveolata Population Reveals High Connectivity among a Marine Protected Area and Varadero Reef in the Colombian Caribbean. Aquat. Conserv. Mar. Freshw. Ecosyst. 2021, 31, 764–776. [Google Scholar] [CrossRef] [Scilit]
- López-Londoño, T.; Galindo-Martínez, C.T.; Gómez-Campo, K.; González-Guerrero, L.A.; Roitman, S.; Pollock, F.J.; Pizarro, V.; López-Victoria, M.; Medina, M.; Iglesias-Prieto, R. Physiological and Ecological Consequences of the Water Optical Properties Degradation on Reef Corals. Coral Reefs 2021, 40, 1243–1256. [Google Scholar] [CrossRef] [Scilit]
- López-Victoria, M.; Herrera, M.A.; Muñoz-López, V.; Rodríguez-Moreno, M.; Puentes-Sayo, A.; Torres-Rodríguez, J.; Torres, O.; Chasqui, L.H.; Tavera, J.; Acero, A. Fish Species Richness of a Coral Reef under Suboptimum Conditions: The Case of Varadero (Cartagena Bay, Colombia). Acta Biol. Colomb. 2023, 28, 108–117. [Google Scholar] [CrossRef] [Scilit]
- López-Victoria, M.; Rodríguez-Moreno, M.; Zapata, F.A. A Paradoxical Reef from Varadero, Cartagena Bay, Colombia. Coral Reefs 2015, 34, 231. [Google Scholar] [CrossRef] [Scilit]
- Pizarro, V.; Rodríguez, S.C.; López-Victoria, M.; Zapata, F.A.; Zea, S.; Galindo-Martínez, C.T.; Iglesias-Prieto, R.; Pollock, J.; Medina, M. Unraveling the Structure and Composition of Varadero Reef, an Improbable and Imperiled Coral Reef in the Colombian Caribbean. PeerJ 2017, 5, e4119. [Google Scholar] [CrossRef] [Scilit]
- Roitman, S.; López-Londoño, T.; Joseph Pollock, F.; Ritchie, K.B.; Galindo-Martínez, C.T.; Gómez-Campo, K.; González-Guerrero, L.A.; Pizarro, V.; López-Victoria, M.; Iglesias-Prieto, R. Surviving Marginalized Reefs: Assessing the Implications of the Microbiome on Coral Physiology and Survivorship. Coral Reefs 2020, 39, 795–807. [Google Scholar] [CrossRef] [Scilit]
- Zweifler, A.; O’leary, M.; Morgan, K.; Browne, N.K. Turbid Coral Reefs: Past, Present and Future—A Review. Diversity 2021, 13, 251. [Google Scholar] [CrossRef] [Scilit]
- Mobley, C.D. The Optical Properties of Water. Handb. Opt. 1995, 1, 43. [Google Scholar]
- Coble, P.G. Marine Optical Biogeochemistry: The Chemistry of Ocean Color. Chem. Rev. 2007, 107, 402–418. [Google Scholar] [CrossRef] [Scilit]
- Zepp, R.G.; Shank, G.C.; Stabenau, E.; Patterson, K.W.; Cyterski, M.; Fisher, W.; Bartels, E.; Anderson, S.L. Spatial and Temporal Variability of Solar Ultraviolet Exposure of Coral Assemblages in the Florida Keys: Importance of Colored Dissolved Organic Matter. Limnol. Oceanogr. 2008, 53, 1909–1922. [Google Scholar] [CrossRef] [Scilit]
- Russell, B.J.; Dierssen, H.M.; Hochberg, E.J. Water Column Optical Properties of Pacific Coral Reefs Across Geomorphic Zones and in Comparison to Offshore Waters. Remote Sens. 2019, 11, 1757. [Google Scholar] [CrossRef] [Scilit]
- Mitchell, B.G.; Kahru, M.; Wieland, J.; Stramska, M. Determination of Spectral Absorption Coefficients of Particles, Dissolved Material and Phytoplankton for Discrete Water Samples. In Ocean Optics Protocols for Satellite Ocean Color Sensor Validation, Revision 3; NASA Goddard Space Flight Center: Greenbelt, MD, USA, 2002; Volume 210004, p. 231. [Google Scholar]
- Betancur-Turizo, S.P.; Mejia-Trejo, A.; Santos-Barrera, Y.; Marin-Amado, T.; Zapata-Valezuela, E.P.; Rivero-Hernández, J.P.; del Pilar Adames-Prada, R. Dataset on the Variability of the Light Field in Coastal Waters. Data Brief 2024, 57, 110923. [Google Scholar] [CrossRef] [Scilit]
- Eljaiek-Urzola, M.; Betancur-Turizo, S.P.; De Carvalho, L.A.S.; Quiñones-Bolaños, E. Seasonal and Spatial Variability of Absorption Properties in Cartagena Bay’s Complex Waters. Estuaries Coasts 2025, 48, 10. [Google Scholar] [CrossRef] [Scilit]
- Santamaría-del-Angel, E.; Soto, I.; Millán-Nuñez, R.; González-Silvera, A.; Wolny, J.; Cerdeira-Estrada, S.; Cajal-Medrano, R.; Muller-Karger, F.; Cannizzaro, J.; Padilla-Rosas, Y.; et al. Phytoplankton Blooms: New Initiative Using Marine Optics as a Basis for Monitoring Programs. In Coastal Ecosystems: Experiences and Recommendations for Environmental Monitoring Programs; Nova Science Publishers: Hauppauge, NY, USA, 2015; pp. 57–88. [Google Scholar]
- Baird, R.B.; Eaton, A.D.; Rice, E.W. Standard Methods for the Examination of Water and Wastewater, 23rd ed.; American Public Health Association: Washington, DC, USA, 2017. [Google Scholar]
- Roesler, C.; Stramski, D.; D’Sa, E.; Röttgers, R.; Reynolds, R.A. Spectrophotometric Measurements of Particulate Absorption Using Filter Pads; IOCCG: Washington, DC, USA, 2018. [Google Scholar]
- Morel, A.; Prieur, L. Analysis of Variations in Ocean Color1. Limnol. Oceanogr. 1977, 22, 709–722. [Google Scholar] [CrossRef] [Scilit]
- Castillo-Ramírez, A.; Santamaría-del-Ángel, E.; González-Silvera, A.; Frouin, R.; Sebastiá-Frasquet, M.-T.; Tan, J.; Lopez-Calderon, J.; Sánchez-Velasco, L.; Enríquez-Paredes, L. A New Algorithm to Estimate Diffuse Attenuation Coefficient from Secchi Disk Depth. J. Mar. Sci. Eng. 2020, 8, 558. [Google Scholar] [CrossRef] [Scilit]
- Santamaría-del-Angel, E.; Millán-Núñez, R.; González-Silvera, A.; Cajal-Medrano, R. A Comparison of Chl a Concentrations Estimated in Situ and Chl a Concentrations Determined via Remote Sensing: A Statistical Examination of the Match-up Approach. In Handbook of Satellite Remote Sensing Image Interpretation: Applications for Marine Living Resources Conservation and Management; EU PRESPO and IOCCG: Dartmouth, NH, Canada, 2011; pp. 241–259. [Google Scholar]
- Perdices, M. Null Hypothesis Significance Testing, p-Values, Effects Sizes and Confidence Intervals. Brain Impair. 2018, 19, 70–80. [Google Scholar] [CrossRef] [Scilit]
- Mu, Y.; Liu, X.; Wang, L. A Pearson’s Correlation Coefficient Based Decision Tree and Its Parallel Implementation. Inf. Sci. 2018, 435, 40–58. [Google Scholar] [CrossRef] [Scilit]
- Kokoska, S.; Nevison, C. Critical Values For Spearman’s Rank Correlation Coefficient. In Statistical Tables and Formulae; Springer Texts in Statistics; Springer: New York, NY, USA, 1989; p. 86. ISBN 978-0-387-96873-5. [Google Scholar]
- Xi, H.; Larouche, P.; Tang, S.; Michel, C. Seasonal Variability of Light Absorption Properties and Water Optical Constituents in Hudson Bay, Canada. JGR Ocean. 2013, 118, 3087–3102. [Google Scholar] [CrossRef] [Scilit]
- Juhls, B.; Overduin, P.P.; Hölemann, J.; Hieronymi, M.; Matsuoka, A.; Heim, B.; Fischer, J. Dissolved Organic Matter at the Fluvial–Marine Transition in the Laptev Sea Using in Situ Data and Ocean Colour Remote Sensing. Biogeosciences 2019, 16, 2693–2713. [Google Scholar] [CrossRef] [Scilit]
- Mohd-Shazali, S.M.; Madihah, J.-S.; Ali, N.; Cheng-Ann, C.; Brewin, R.J.W.; Idris, M.S.; Noir, P.P. Dynamics of Absorption Properties of CDOM and Its Composition in Likas Estuary, North Borneo, Malaysia. Oceanologia 2022, 64, 583–594. [Google Scholar] [CrossRef] [Scilit]
- Martin, P.; Sanwlani, N.; Lee, T.W.Q.; Wong, J.M.C.; Chang, K.Y.W.; Wong, E.W.-S.; Liew, S.C. Dissolved Organic Matter from Tropical Peatlands Reduces Shelf Sea Light Availability in the Singapore Strait, Southeast Asia. Mar. Ecol. Prog. Ser. 2021, 672, 89–109. [Google Scholar] [CrossRef] [Scilit]
- Keith, D.J.; Lunetta, R.S.; Schaeffer, B.A. Optical Models for Remote Sensing of Colored Dissolved Organic Matter Absorption and Salinity in New England, Middle Atlantic and Gulf Coast Estuaries USA. Remote Sens. 2016, 8, 283. [Google Scholar] [CrossRef] [Scilit]
- Nima, C.; Frette, Ø.; Hamre, B.; Stamnes, J.J.; Chen, Y.-C.; Sørensen, K.; Norli, M.; Lu, D.; Xing, Q.; Muyimbwa, D. CDOM Absorption Properties of Natural Water Bodies along Extreme Environmental Gradients. Water 2019, 11, 1988. [Google Scholar] [CrossRef] [Scilit]
- Tamir, R.; Eyal, G.; Kramer, N.; Laverick, J.H.; Loya, Y. Light Environment Drives the Shallow-to-mesophotic Coral Community Transition. Ecosphere 2019, 10, e02839. [Google Scholar] [CrossRef] [Scilit]
- Ferrari, G.M.; Bo, F.G.; Babin, M. Geo-Chemical and Optical Characterizations of Suspended Matter in European Coastal Waters. Estuar. Coast. Shelf Sci. 2003, 57, 17–24. [Google Scholar] [CrossRef] [Scilit]
- Wang, C.; Li, W.; Chen, S.; Li, D.; Wang, D.; Liu, J. The Spatial and Temporal Variation of Total Suspended Solid Concentration in Pearl River Estuary during 1987–2015 Based on Remote Sensing. Sci. Total Environ. 2018, 618, 1125–1138. [Google Scholar] [CrossRef] [Scilit] [PubMed]
- Molares, R.; Mestres, M. Efectos de La Descarga Estacional Del Canal Del Dique En El Mecanismo de Intercambio de Aguas de Una Bahía Semicerrada y Micromareal: Bahía de Cartagena, Colombia. Bol. Cient. CIOH 2012, 30, 53–74. [Google Scholar] [CrossRef]
- Tilstone, G.H.; Peters, S.W.; van der Woerd, H.J.; Eleveld, M.A.; Ruddick, K.; Schönfeld, W.; Krasemann, H.; Martinez-Vicente, V.; Blondeau-Patissier, D.; Röttgers, R. Variability in Specific-Absorption Properties and Their Use in a Semi-Analytical Ocean Colour Algorithm for MERIS in North Sea and Western English Channel Coastal Waters. Remote Sens. Environ. 2012, 118, 320–338. [Google Scholar] [CrossRef] [Scilit]
- Chang, G.C.; Barnard, A.H.; McLean, S.; Egli, P.J.; Moore, C.; Zaneveld, J.R.V.; Dickey, T.D.; Hanson, A. In Situ Optical Variability and Relationships in the Santa Barbara Channel: Implications for Remote Sensing. Appl. Opt. 2006, 45, 3593–3604. [Google Scholar] [CrossRef] [Scilit]
- Tosic, M.; Restrepo, J.D.; Lonin, S.; Izquierdo, A.; Martins, F. Water and Sediment Quality in Cartagena Bay, Colombia: Seasonal Variability and Potential Impacts of Pollution. Estuar. Coast. Shelf Sci. 2019, 216, 187–203. [Google Scholar] [CrossRef] [Scilit]
- Chu, Q.; Zhang, Y.; Ma, R.; Hu, M.; Jing, Y. MODIS-Based Remote Estimation of Absorption Coefficients of an Inland Turbid Lake in China. Remote Sens. 2020, 12, 1940. [Google Scholar] [CrossRef] [Scilit]
- Arena, M.; Delgado, A.L.; Celleri, C.; Pratolongo, P.D. Preliminary Assessment of Spatial and Short-Term Variability of Bio-Optical Properties in a Tidal Dominated Estuary (Bahía Blanca, Argentina). Reg. Stud. Mar. Sci. 2019, 29, 100639. [Google Scholar] [CrossRef] [Scilit]
- Noernberg, M.A.; Mizerkowski, B.D.; Mafra, L.L., Jr.; Freitas, F.H. Seasonal Evolution of Particulate and Dissolved Absorption Coefficients in a Subtropical Estuary. Estuar. Coast. Shelf Sci. 2020, 244, 106907. [Google Scholar] [CrossRef] [Scilit]
- Teixeira, C.D.; Leitão, R.L.L.; Ribeiro, F.V.; Moraes, F.C.; Neves, L.M.; Bastos, A.C.; Pereira-Filho, G.H.; Kampel, M.; Salomon, P.S.; Sá, J.A.; et al. Sustained Mass Coral Bleaching (2016–2017) in Brazilian Turbid-Zone Reefs: Taxonomic, Cross-Shelf and Habitat-Related Trends. Coral Reefs 2019, 38, 801–813. [Google Scholar] [CrossRef] [Scilit]
- Perry, C.T.; Larcombe, P. Marginal and Non-Reef-Building Coral Environments. Coral Reefs 2003, 22, 427–432. [Google Scholar] [CrossRef] [Scilit]
- Stramski, D.; Reynolds, R.A.; Kaczmarek, S.; Uitz, J.; Zheng, G. Correction of pathlength amplification in the filter-pad technique for measurements of particulate absorption coefficient in the visible spectral region. Appl. Opt. 2015, 54, 6763–6782. [Google Scholar] [CrossRef] [Scilit] [PubMed]
- Lefering, I.; Röttgers, R.; Weeks, R.; Connor, D.; Utschig, C.; Heymann, K.; McKee, D. Improved determination of particulate absorption from combined filter pad and PSICAM measurements. Opt. Express 2016, 24, 24805–24823. [Google Scholar] [CrossRef] [Scilit]

Disclaimer/Publisher’s Note: The statements, opinions and data contained in all publications are solely those of the individual author(s) and contributor(s) and not of MDPI and/or the editor(s). MDPI and/or the editor(s) disclaim responsibility for any injury to people or property resulting from any ideas, methods, instructions or products referred to in the content. |
© 2025 by the authors. Licensee MDPI, Basel, Switzerland. This article is an open access article distributed under the terms and conditions of the Creative Commons Attribution (CC BY) license (https://creativecommons.org/licenses/by/4.0/).