


Abstract
With increasing wastewater treatment demands and decarbonization goals, synergistic reduction in pollutants and green house gas (GHG) emissions is crucial. High process emissions like N2O pose significant challenges, yet optimized carbon reduction strategies for conventional plants are lacking. This study developed three mathematical models to quantify the impact of dissolved oxygen (DO), influent salinity, and C/N ratio on direct emissions (CH4, N2O) and indirect emissions. Response Surface Methodology (RSM) optimized these factors to minimize GHG emissions under three accounting scenarios: (1) plants with CH4 reuse systems: salinity = 0.5 g L−1, DO = 3.67 mg L−1, C/N = 12.75; (2) plants focusing solely on direct emissions: salinity = 0.5 g L−1, DO = 3.35 mg L−1, C/N = 3; and (3) plants assessing total emissions: salinity = 0.5 g L−1, DO = 2.5 mg L−1, C/N = 7.18. Key findings indicated that increasing salinity exacerbated greenhouse gas emissions. Elevated DO levels in the aerobic stage reduced N2O emissions but increased indirect emissions in the A2/O process. Higher C/N ratios promoted anaerobic CH4 production, but sufficient carbon reduced N2O by enabling complete heterotrophic denitrification. A 60−day continuous GHG emissions monitoring campaign was conducted at a WWTP to validate the actual emission reductions achievable under the identified optimal control conditions. An analysis and comparison of operational and economic costs were also performed. The findings provide practical insights into sustainable GHG emission management and offer potential solutions to advance the synergistic reduction in GHG emissions and pollutants.
1. Introduction
With the advancement of global industrial modernization, the impact of GHG emissions on the human living environment has become increasingly significant, attracting widespread attention [1]. According to statistics, GHG emissions from the drainage and wastewater treatment industry account for approximately 2–3% of the total societal GHG emissions [2]. In 2021, global greenhouse gas emissions totaled approximately 54 Gt CO2eq, with annual emissions from wastewater treatment contributing between 1.5 and 2.0 Gt CO2eq. Furthermore, the GHG emissions from China’s sewage treatment industry were approximately 197 Mt CO2eq in 2016, accounting for 1.71% of the national total emissions. Subsequently, projections suggested that by 2030, the total emissions from China’s sewage treatment industry are projected to reach 365 Mt CO2eq, accounting for 2.95% of the national total emissions, significantly exceeding the 0.5% share of the industry’s output in China’s gross domestic product [3]. This indicates that the sewage treatment industry has become a typical energy−intensive industry [4,5].
GHG emissions generated during the sewage treatment process primarily consist of direct greenhouse gas emissions (CO2, CH4, and N2O) and indirect emissions (electricity consumption and chemical consumption) [6]. Direct emissions are primarily produced during the biochemical treatment phase of wastewater treatment plants (WWTPs), resulting from the action of various environmental microorganisms. Specifically, CO2 is primarily generated from the aerobic degradation of COD, endogenous respiration of microorganisms, and denitrification processes. However, according to the IPCC Guidelines for National Greenhouse Gas Inventories (2006), direct emissions of biogenic CO2—derived from recently fixed atmospheric carbon through biological processes—are considered carbon−neutral over short time scales [7]. Therefore, in line with international methods, this study excludes biogenic CO2 from direct emission calculations, as it does not contribute to net atmospheric greenhouse gas forcing. CH4 is primarily produced through the process of anaerobic microorganisms converting organic pollutants via hydrolysis, acidification, hydrogen and acetate production, and methanogenesis [8]. Moreover, CH4 can be used as a clean energy source for carbon recovery, potentially contributing to carbon neutrality [9]. N2O is a special greenhouse gas that can be produced biologically via three pathways: hydroxylamine oxidation, nitrifier denitrification, and heterotrophic denitrification [10,11]. N2O can also be formed via abiotic pathways, but this contribution to overall N2O emissions is considered negligible [12]. N2O is a potent greenhouse gas with a global warming potential (GWP) 265 times that of CO2, while the GWP of CH4 is only 28 times that of CO2 [7]. Notably, the emissions of N2O are relatively low in other industries but constitute a significant proportion in the sewage treatment industry [13]. Recently, our team calculated using the chemical conservation accounting method that direct emissions account for approximately 48% (proportion of CH4 and N2O is approximately 1:1) of the total emissions in WWTPs, and the indirect emissions are the largest portion of total emissions (52%) [14]. However, WWTPs often overuse chemical reagents and excessive aeration in aerobic tanks to maintain effluent quality standards, which leads to energy waste and increases indirect emissions. Therefore, optimizing technology to achieve efficient carbon reduction in the sewage treatment process has a more direct and significant carbon reduction benefit for society.
Despite the variety of processes employed by WWTPs, such as the conventional activated sludge (CAS), anaerobic/anoxic/oxic (A2/O), oxidation ditch, sequencing batch reactor (SBR), and membrane bioreactor (MBR) processes, the GHG emissions produced during the biochemical treatment phase are influenced by various factors including wastewater quality, organic load, treatment processes, and environmental conditions [15]. Additionally, the interactive effects of multiple factors also have synergistic impacts on GHG emissions. For example, the dissolved oxygen (DO) in anoxic tanks affects the carbon source demand of heterotrophic denitrification processes. However, the majority of studies focused on the impact of single factors on individual greenhouse gas emissions, such as the impact of pH on anaerobic CH4 production, the impact of DO on N2O production in aerobic stages, and the influence of influent concentration on N2O production in anoxic stages [8,16,17]. It is also obvious that reducing DO will significantly decrease the amount of aeration electricity [18]. However, the regulation of a single factor lacks practical guidance for the actual operation of WWTPs. Therefore, systematically exploring the influence of interactive effects of multiple factors on GHG emissions in the sewage treatment process and understanding the correlation and impact mechanism among various factors is helpful to overcome the current limitations on the GHG emission patterns in the sewage treatment industry. This work advances prior single−factor studies by integrating multi−parameter optimization and real−world validation, offering a framework for scenario−based carbon management in WWTPs.
Through a survey and compilation of data from 813 WWTPs in Jiangsu, China, the most prevalent typical processes, operational modes, and influent condition ranges were identified to investigate the GHG emission characteristics of the wastewater treatment process. By developing a multi−factor response surface methodology (RSM) for GHG emission of A2/O process, the interactive effect of salinity, DO, and influent C/N ratio on GHG emissions was comprehensively investigated. Moreover, the GHG emission reduction regulation strategy was proposed, providing theoretical and technical support for the actual operation parameter control of the A2/O process in WWTPs.
2. Materials and Methods
2.1. Raw Materials and Chemicals
The activated sludge was obtained from a WWTP in Zhenjiang, Jiangsu, China. The sludge was collected from the secondary settling tank and stored at 4 °C before use. It was used for the inoculated sludge dosing of the A2/O reactor. All chemicals (sodium acetate, CaCl2, KH2PO4, MgSO4, and NH4Cl) were chemically pure (99.5%) and purchased from Aladdin Reagents Co., Ltd., Shanghai, China. Simulated wastewater used in the experimental process was prepared using tap water.
2.2. Experimental Design
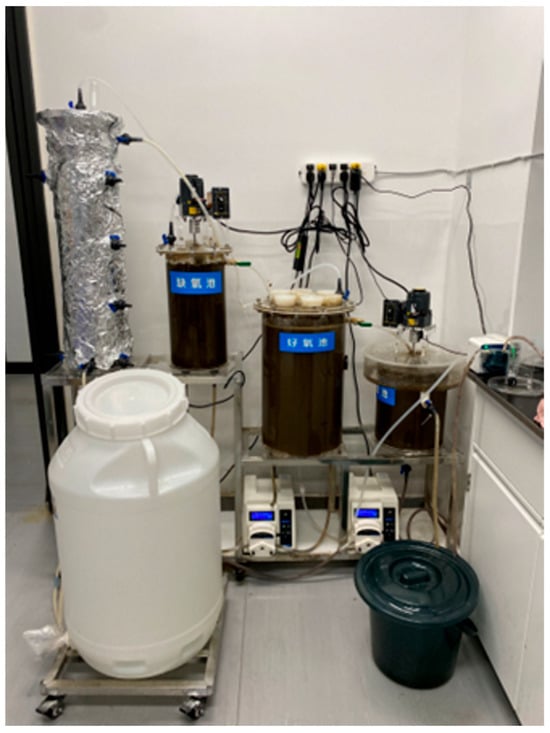
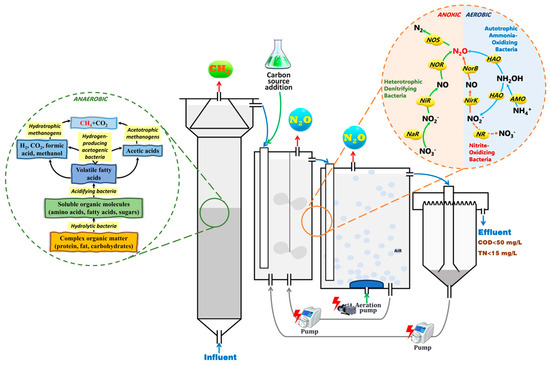
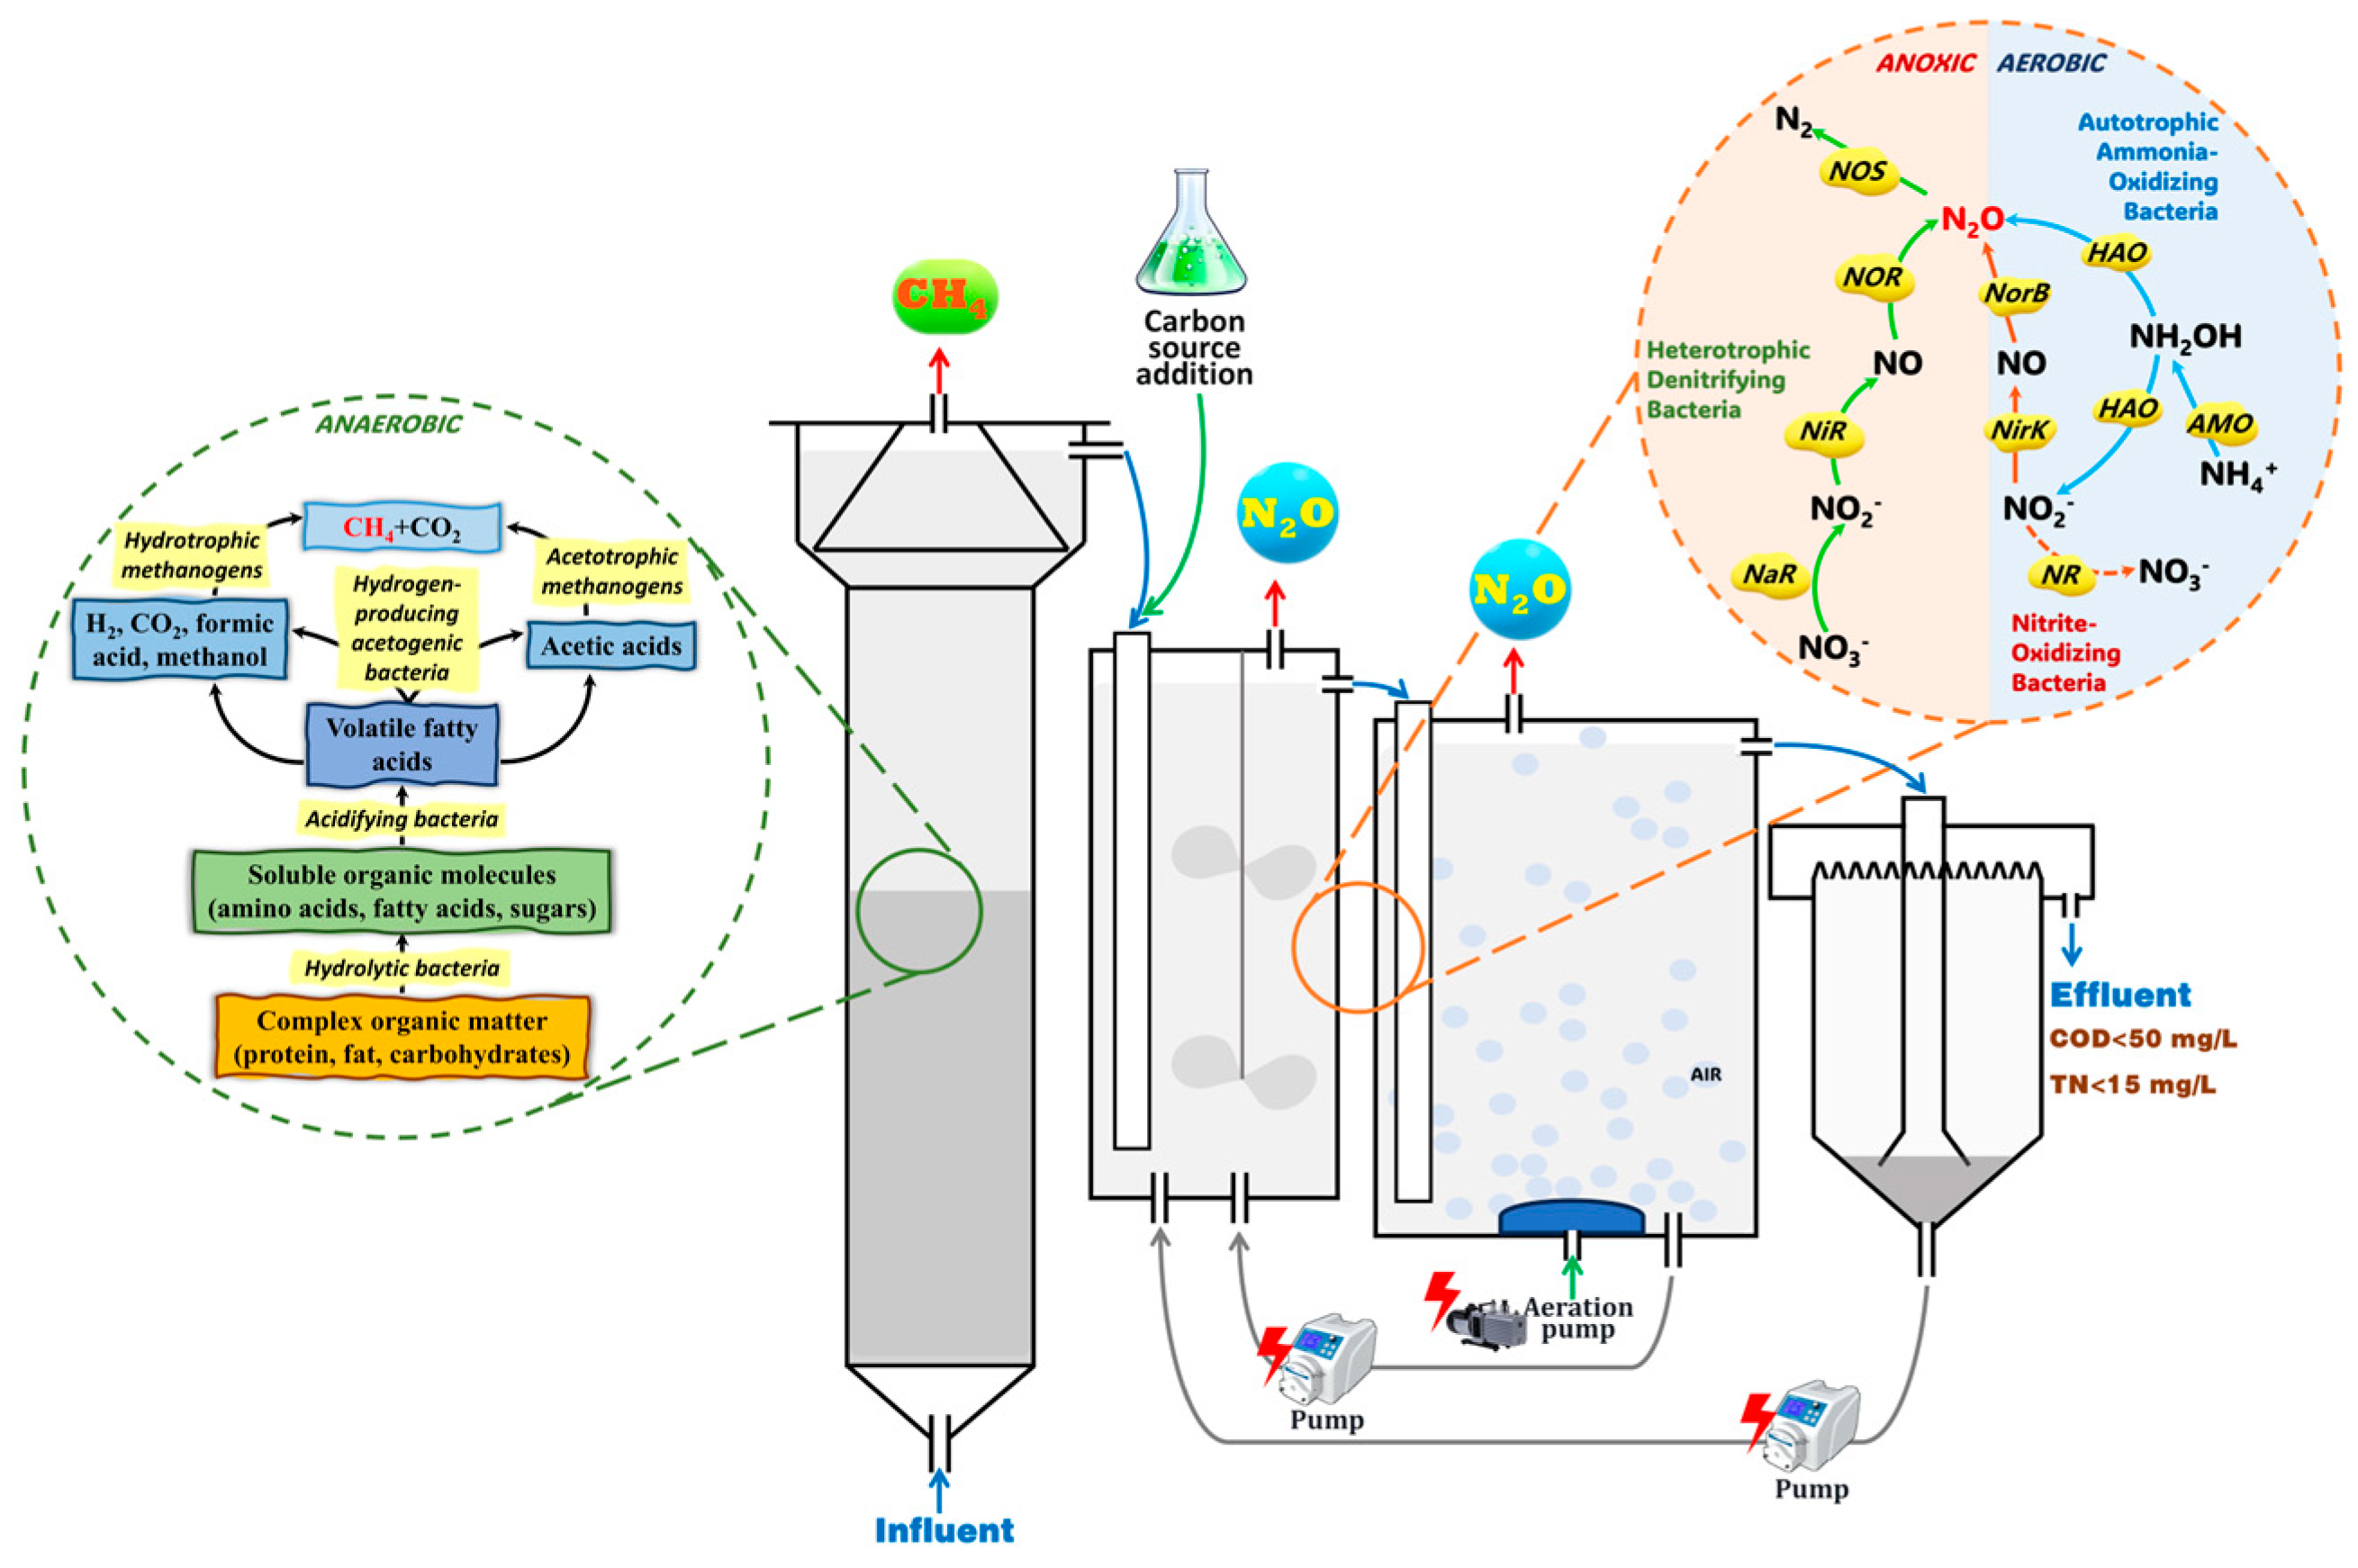
An airtight A2/O reactor was newly designed for sewage treatment and gas collection, as shown in Figure 1. The detailed parameters were as follows: anaerobic volume 10 L, anoxic volume 10 L, aerobic volume 30 L, and influent flow rate 1.25 L h−1. The hydraulic retention times of the anaerobic stage, anoxic stage, and aerobic stage were 8 h, 8 h, and 24 h, respectively. The internal circulation was 2.8 times greater than the influent flow velocity. The initial sludge of anoxic, anaerobic, and aerobic tanks was added at a mixed liquid volatile suspended solid (MLVSS) concentration of 3.5 g L−1. The MLVSS/mixed liquid suspended solid (MLSS) of sludge was approximately equal to 0.54.
Figure 1.
Experimental device diagram of A2/O process (Anaerobic tank, Anoxic tank, Aerobic tank and Sedimentation tank).
Considering the artificially controlled factors were limited in existing WWTP operations, the criteria for parameter selection were as follows: (i) variables are adjustable in >80% of conventional WWTPs, (ii) variables exhibit established mechanistic links to greenhouse gas emissions, and (iii) variables enable decoupled control of aerobic/anoxic conditions. Therefore, DO levels in the aerobic stage, influent C/N ratio, and salinity of the A2/O process were chosen as key variables (X1, X2, X3) for multi−factor coordination. This selection was made because influent COD and NH4+−N levels varied significantly and could be artificially managed through multi−stage treatment or added carbon sources [19]. DO levels could be adjusted by controlling the flow rate of the aeration pump [20]. Industrial saline wastewater in mixed urban sewage plants could impact microbial activity, altering treatment effectiveness and direct emissions [21]. Moreover, while internal recirculation flow rate influences nitrogen removal and indirect emissions, its effects are largely mediated through DO redistribution and carbon availability—variables central to our optimization [22]. Thus, internal recirculation flow rate was not included as a primary control parameter in this study.
Considering the current situation of domestic WWTPs, parameter optimization can be conducted in three different scenarios: (1) when WWTPs have CH4 collection and recovery systems, direct emissions need only consider N2O production; (2) when external carbon sources and electricity consumption are minimized, such as adjusting external carbon sources through high−quality carbon source wastewater from food processing and using precise aeration control equipment for blowers, direct emissions from CH4 and N2O should be considered; and (3) when WWTPs require additional carbon sources and excessive aeration, both direct and indirect emissions must be considered for the total emissions.
2.3. Response Surface Optimization Experiment
RSM was utilized to explore the linear and interactive effects of operational parameters on GHG emissions using a Box–Behnken design via Design−Expert 12 software. Three independent variables were examined: DO (X1 = 1–5 mg·L−1), salinity (X2 = 0.5–1.5 g·L−1 NaCl), and C/N ratio (X3 = 5–10 adjusted with glucose), with NH4+−N fixed at 30 mg·L−1 (Table A1). The emissions of the A2/O reactor were quantified as: Y1 = N2O emissions (g CO2eq·d−1), Y2 = direct emissions (g CO2eq·d−1), Y3 = total emissions (sum of the direct emissions and indirect emissions, g CO2eq·d−1).
The operation was carried out according to the combined experimental scheme of the Box–Benhnken Center. The effluent quality complied with the Level A criteria of the “Urban Sewage Plant Pollutant Discharge Standard” [23]. After the system stabilized, water samples were taken from the effluent points of anaerobic, anoxic, and aerobic sections, and the concentrations of COD, NH4+−N, NO2−−N, and NO3−−N were detected to determine the removal and conversion effects of carbon and nitrogen in sewage. After each process adjustment, gas samples are not collected immediately. Instead, after the water quality discharge meets the standards and stabilizes, the empty gas collection bag is placed over the main exhaust pipe to collect greenhouse gases for a fixed period. Simultaneously, the volume of gas produced and the concentrations of CH4 and N2O were measured, the production rates were analyzed, and the direct emissions (g CO2eq d−1) were calculated across various experimental conditions. If an inadequate carbon source results in suboptimal water quality, sodium acetate could be added to anoxic stage for regulation. Sodium acetate was employed as the bench−scale supplemental carbon source to simulate external organic carbon addition, reflecting real−world practices using acetate/starch/glucose while ensuring experimental reproducibility.
The second−order model fitted to the experimental data is listed by Equation (1).
where Yi is the dependent variable; Xi is the independent variable; β0, βi, βii, and βij indicate the parameters of the regression model; and ɛ is the random error associated with this measure.
2.4. Long−Term Experiment
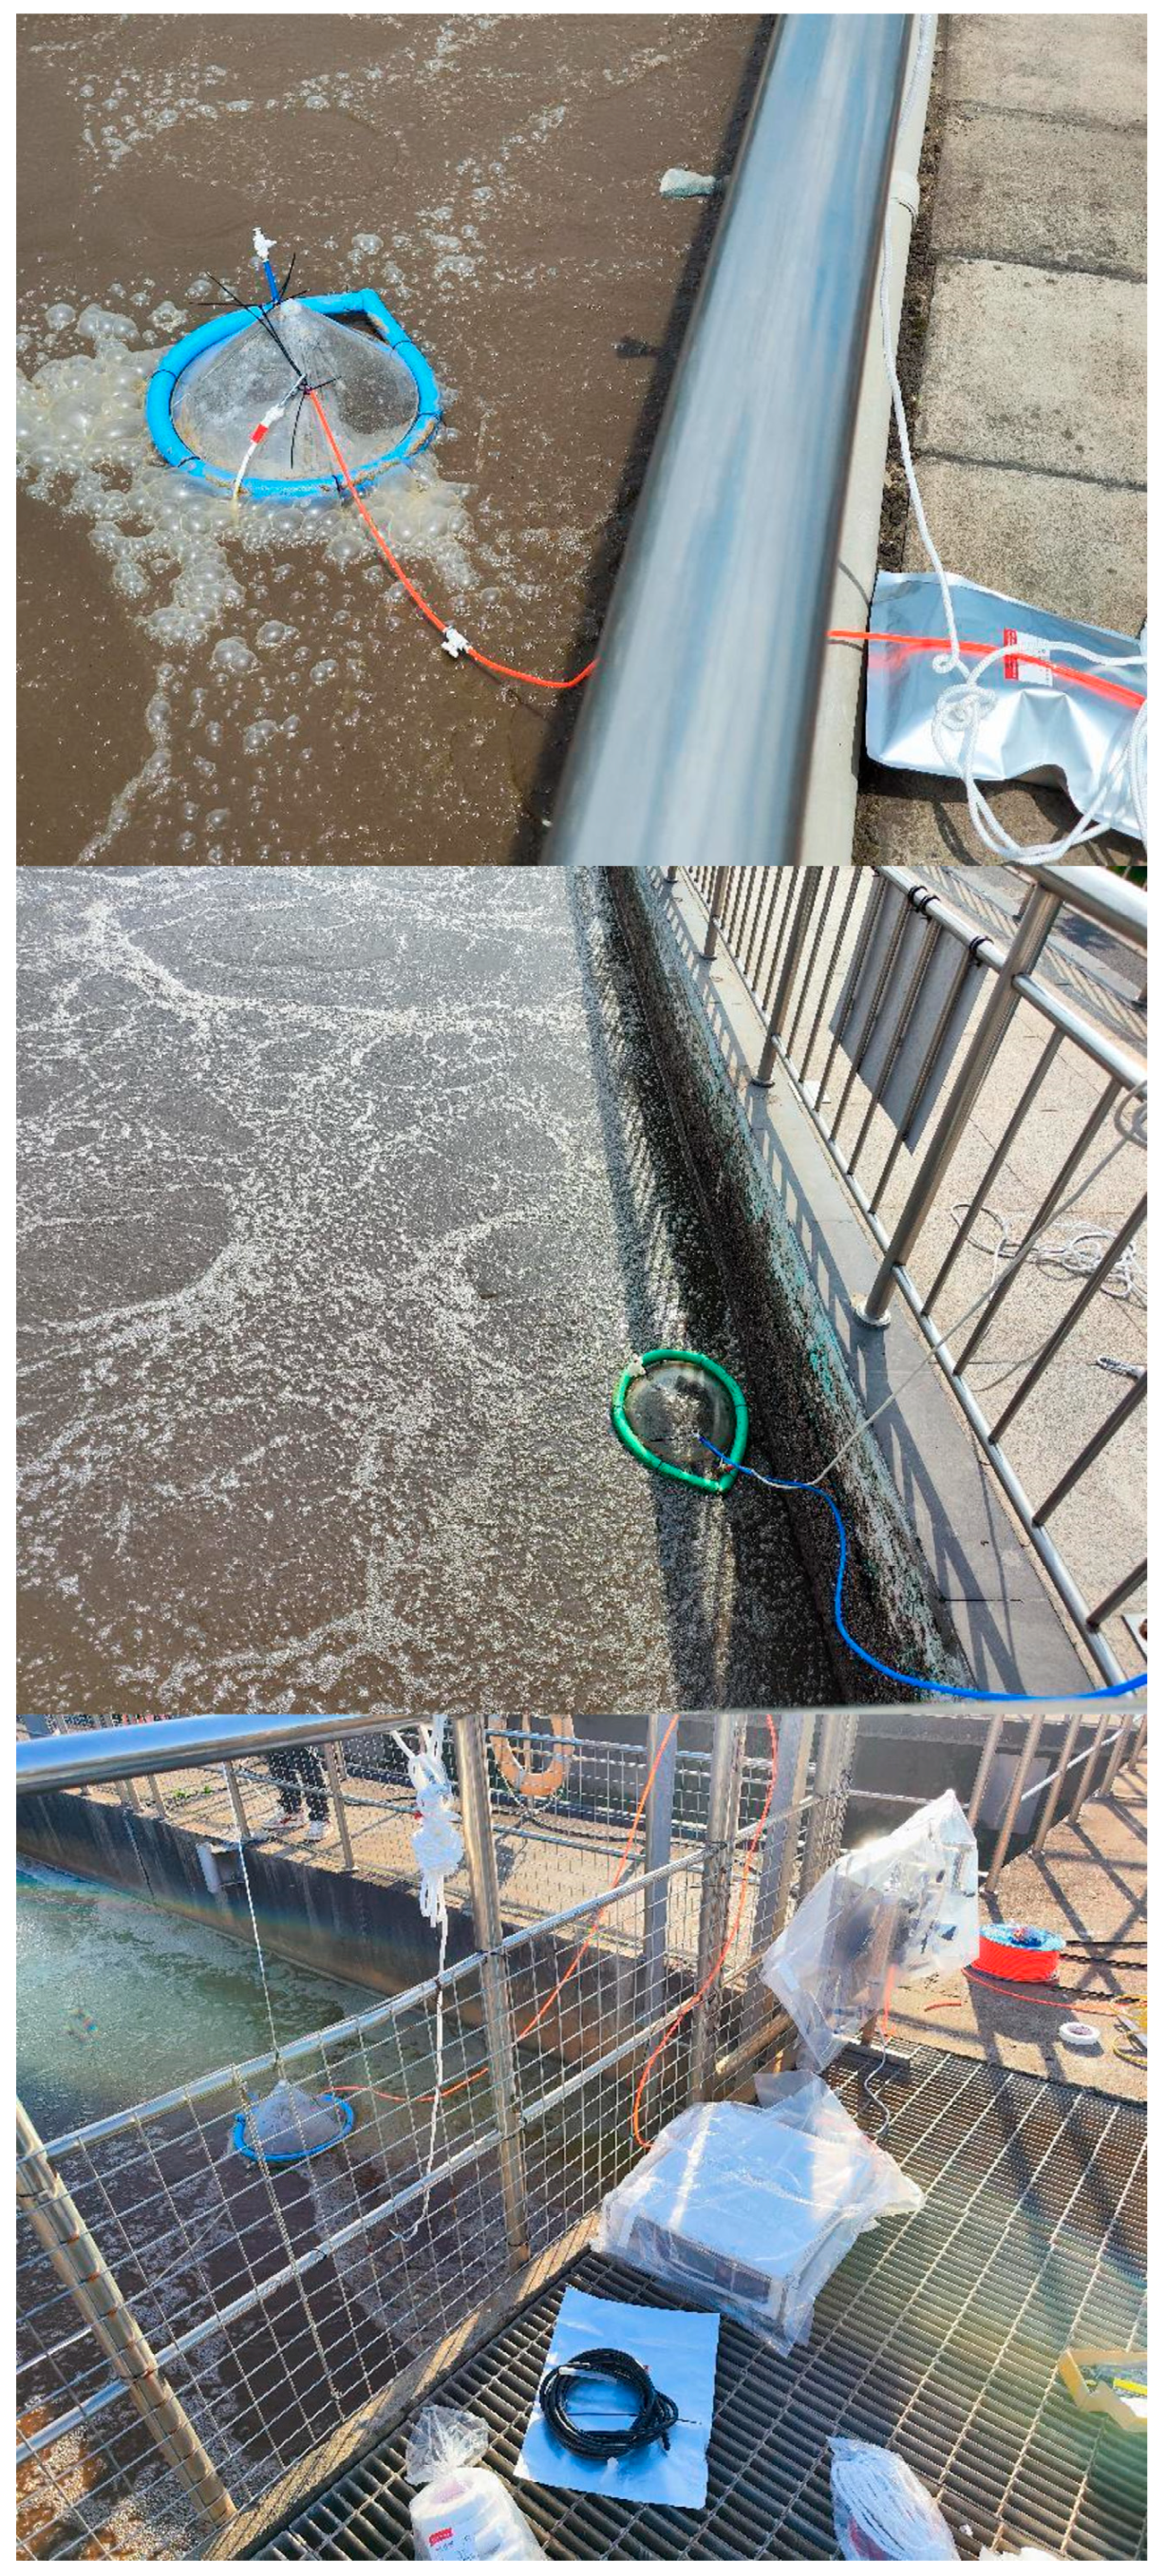
Long−term experiments were carried out in a well−operated WWTP in Jiangsu, China. Multiple indicators were studied for 60 consecutive days, including the COD, TN concentration and salinity of the influent of A2/O process, the DO level in aerobic tank, and the COD and TN concentrations of the effluent. Moreover, the direct emissions in the A2/O treatment process were detected by static chambers above the anaerobic, anoxic, and aerobic tanks (Figure A1) [24]. The consumption of chemicals and electricity was also recorded to calculate indirect emissions. Of note, starting from the 30th day, the A2/O process was artificially regulated in accordance with the optimized conditions in Section 3.2.3 (DO = 2.5 mg L−1, salinity = 0.5 g L−1, and C/N = 7.175). For 60 consecutive days, the effluent water quality remained stable and met the discharge standards.
2.5. Analysis and Detection Methods
The DO level was analyzed by a dissolved oxygen meter (JPB−607A, Leici, Shanghai, China) with a DO−957−Q−type electrode. The MLSS and MLVSS of initial sludge were measured according to the standard method to assess the biomass concentration in the system [25]. The water quality indexes of samples were detected by a UV−Vis spectrophotometer (DR3900, HACH, Loveland, CO, USA) and all detections were performed after filtration with a 22 µm water filter. In particular, test kits (2038225−CN, 2606945−CN, 2605345−CN, 2608345−CN and 2672245−CN, HACH, Loveland, CO, USA) were used to measure COD, NH4+−N, NO3−−N, NO2−−N, and total nitrogen (TN). The production rate of CH4 and N2O was calculated from the volume of gas collected by aluminum foil gas bags in units of time. Gas concentrations were detected by gas chromatography (GC7890A, Agilent, Santa Clara, CA, USA) and a continuous−flow gas concentration analyzer (MH3203, Minghua, Wenling, China). The direct emissions of the airtight A2/O reactor were calculated by adding the carbon dioxide equivalent of CH4 and N2O (g CO2eq d−1). The indirect emissions of the airtight A2/O reactor were converted by electricity consumption (electricity emission factor, 0.67 kg CO2eq kw h−1) and chemical consumption (sodium acetate emission factor, 2.9 kg CO2eq kg−1).
3. Results
3.1. Investigation of WWTPs
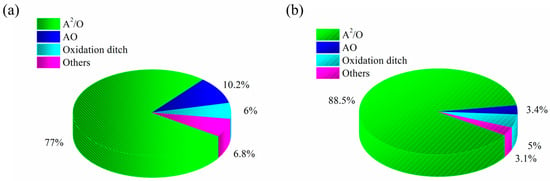
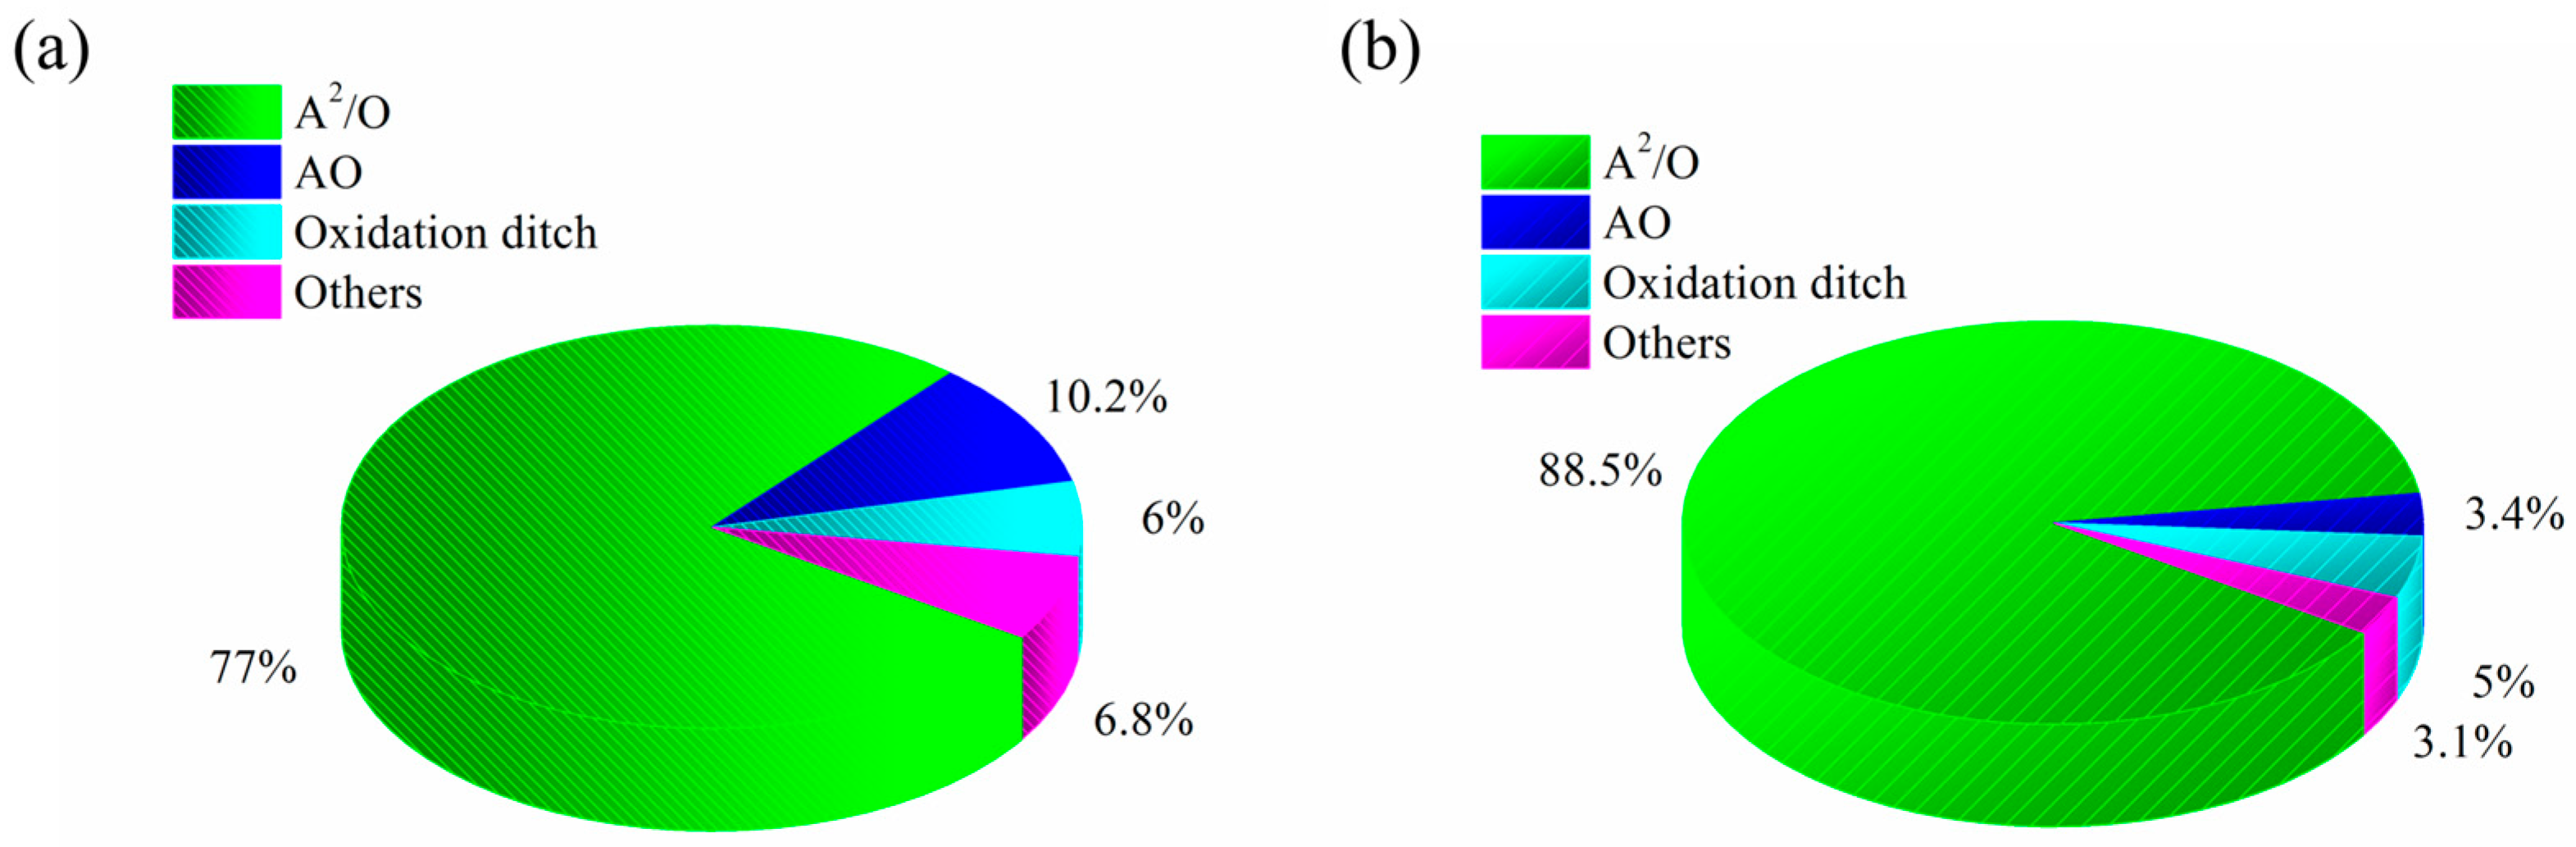
An investigation of the treatment processes and influent water quality conditions was conducted across 813 WWTPs in Jiangsu, China. As illustrated in Figure 2, the A2/O process constitutes the dominant technology, implemented in approximately 77% of facilities, followed by the AO process. Oxidation ditch technology accounted for only 6% of installations due to limitations in nutrient removal (nitrogen and phosphorus), shock load resistance, and economic viability. Notably, among WWTPs with treatment capacities exceeding 15,000 m3 d−1, the A2/O adoption rate reached 87%. Consequently, investigating GHG emissions during A2/O operation holds significant practical relevance. Furthermore, influent conditions at 626 A2/O facilities were analyzed (Table 1) to establish parameter ranges for optimization strategies. The presented key parameter ranges encompass over 80% of surveyed A2/O WWTPs. Functionally, WWTPs are categorized as municipal or centralized industrial park facilities, resulting in distinct influent characteristics and operational parameters. Significant variation in influent COD levels was observed between these categories. To derive broadly applicable operational patterns, the C/N ratio provides superior predictive utility compared to COD alone. Comprehensively evaluating these factors, experimental parameters (NH4+−N: 30 mg L−1; C/N ratio: 5–10; DO: 1–5 mg L−1; salinity: 0.5–1.5 g L−1) were selected for RSM optimization.
Figure 2.
(a) The proportion of processes adopted by WWTPs and (b) the proportion of processes adopted by WWTPs with processing capacities greater than 15,000 m3 d−1.
Table 1.
The main range of influent water quality and operating parameters across A2/O in WWTPs with processing capacities greater than 15,000 m3 d−1.
3.2. Response Surface Optimization of Different Emissions
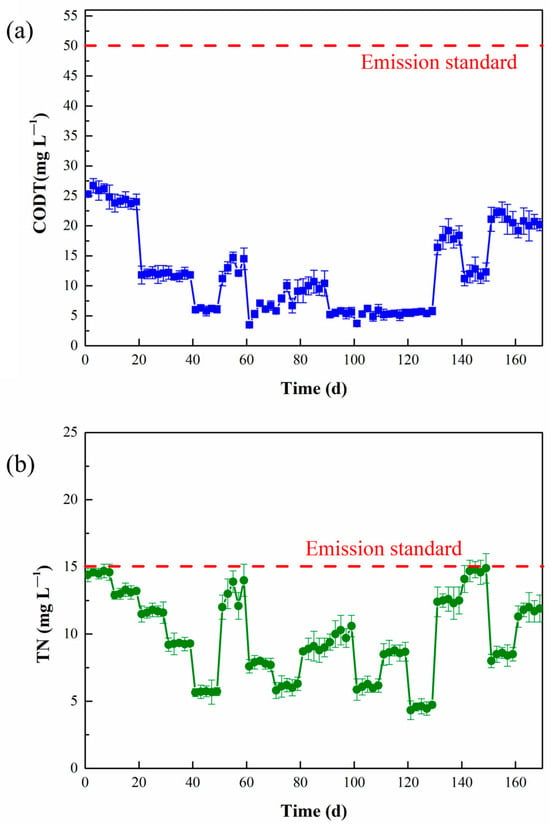
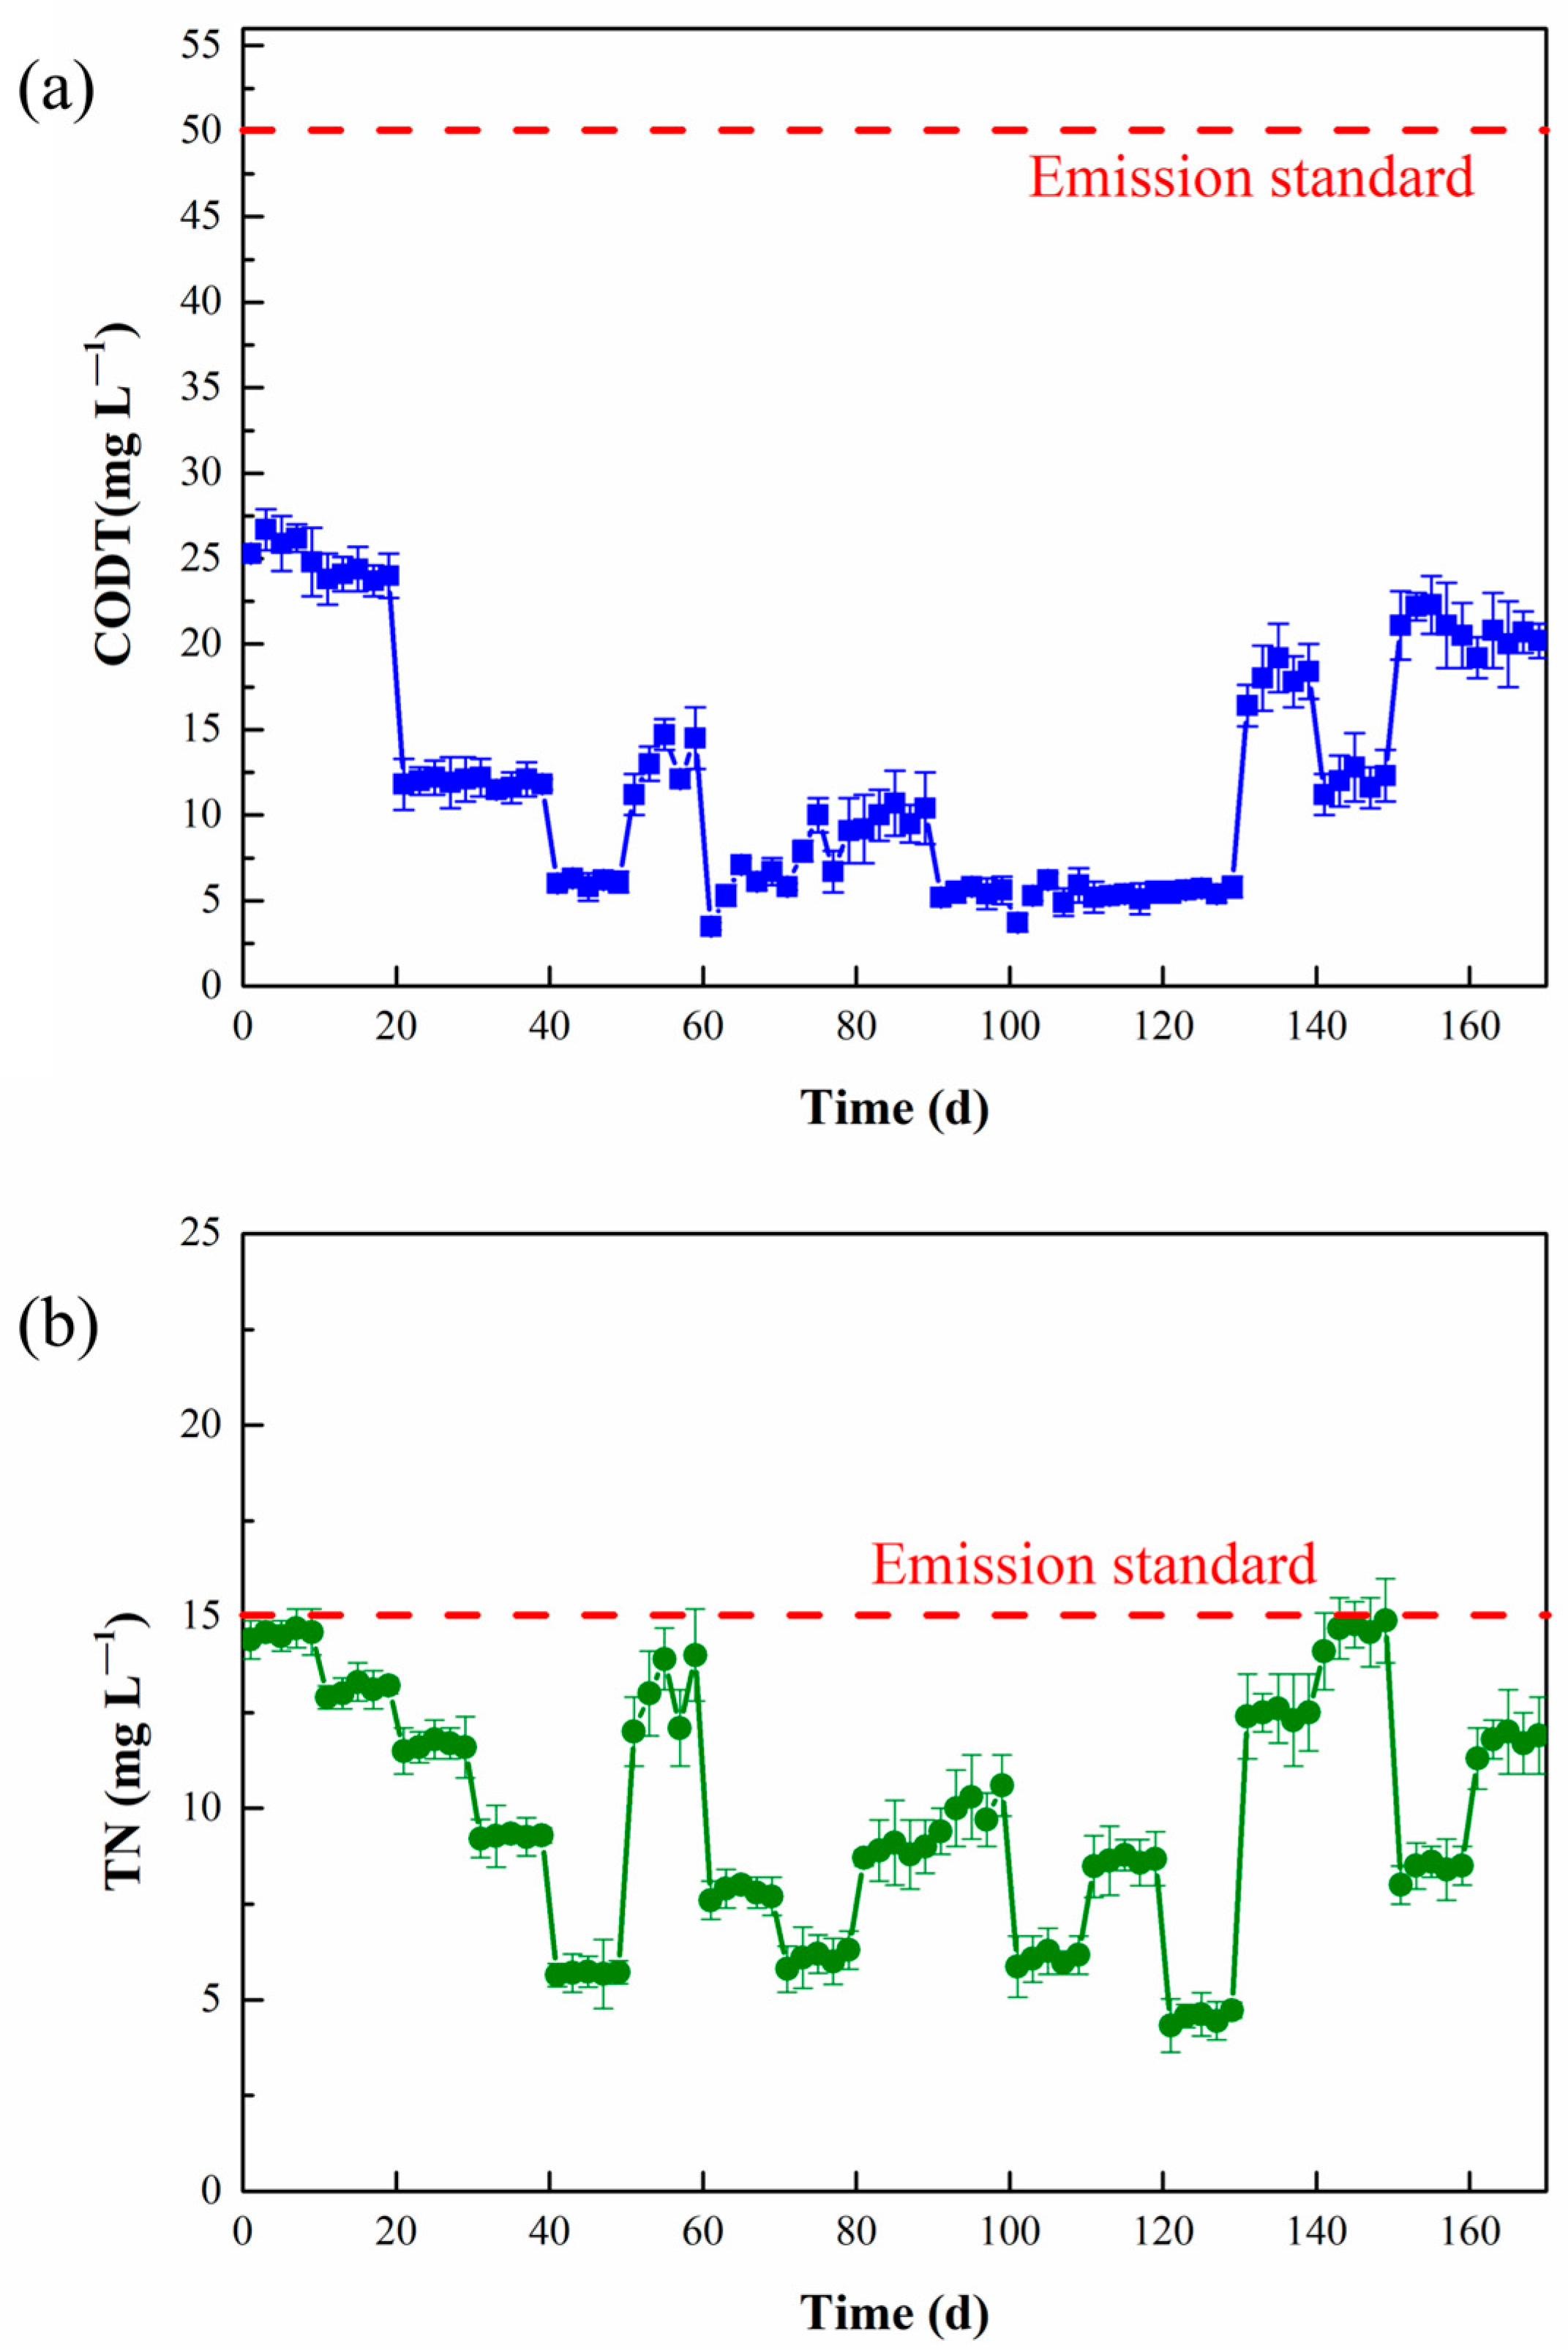
The effluent COD and TN concentrations in 170 days are presented in Figure 3. The effluent COD ranged from 5.2 to 26.7 mg L−1 and TN ranged from 6.1 to 14.7 mg L−1, both meeting the discharge standards. A multivariate analysis was conducted to evaluate the linear and synergistic effects of multiple factors on GHG emissions.
Figure 3.
(a) COD concentration and (b) TN concentration of effluent after reactor stabilization under different conditions in 170 days.
3.2.1. N2O Emission
CH4 is recognized as a clean energy source wiith a high calorific value (8.4 × 10⁴ kJ kg−1), which is used in WWTPs for energy recovery via anaerobic digestion and cogeneration to pursue carbon neutrality. Therefore, in the WWTPs equipped with CH4 reuse systems, greenhouse gas emissions are primarily attributed to N2O. The following model fitting was used to investigate the influencing factors and conditions conducive to N2O reduction.
- N2O emission fitting model
According to the Box–Benhnken central composite experimental method, the linear and interactive effects of DO (A, mg L−1), salinity (B, g L−1), and C/N (C) on N2O emission (Y1, g CO2eq d−1) were analyzed. The experimental results (Table A2) were fitted into a ternary quadratic model (Equation (2)):
Y1 = 54.86 − 2.61A + 10.22B + 2.32C − 0.58AB − 0.23AC − 0.80BC + 0.54A2 − 1.02B2 − 0.28C2
As shown in Table 2, ANOVA results are performed on the predicted experimental results and the actual experimental results. The F−value in ANOVA is indicative of the significance of the model fit. A higher F−value suggests a more significant model and a better fit [26]. It could be seen that a high F−value of 89.28 indicated a high model fit. Additionally, the correlation coefficient (R2) is used to evaluate the accuracy of the model equation. The closer R2 is to 1, the more accurate the model equation is. In this study, the R2 value was 0.9914, suggesting the model accurately explained the experimental results.
Table 2.
ANOVA for the N2O emission under different conditions.
Meanwhile, the Adjusted R2 value (0.9803) and the Predicted R2 value (0.9197) are consistent (difference < 0.2), which indicates that the model results were reasonable [27]. The C.V.% (1.91) indicated low dispersion, which implied that the predictions of the model were more closely aligned with the observed data, reflecting a more reliable and stable estimation [28]. Moreover, the Adeq Precision value (32.85 > 4) confirms that the model results had high credibility and little interference [29]. In addition, the degree of significance of the model and the items can be considered by the p-value. The p-value of the model is less than 0.0001, which denotes that the N2O emission model was highly significant [30]. For other variables, the linear effect of DO and C/N was significant, the interaction of DO and C/N was significant, and the square effect of DO and C/N was highly significant.
- 2.
- N2O emission response surface analysis
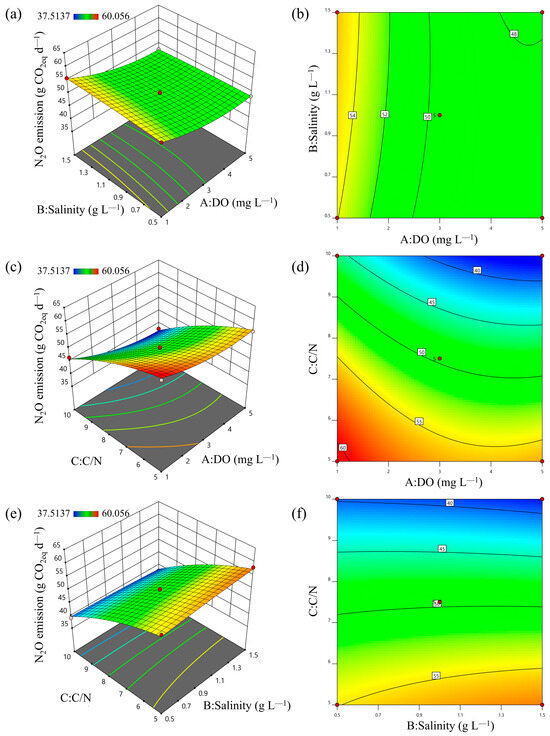
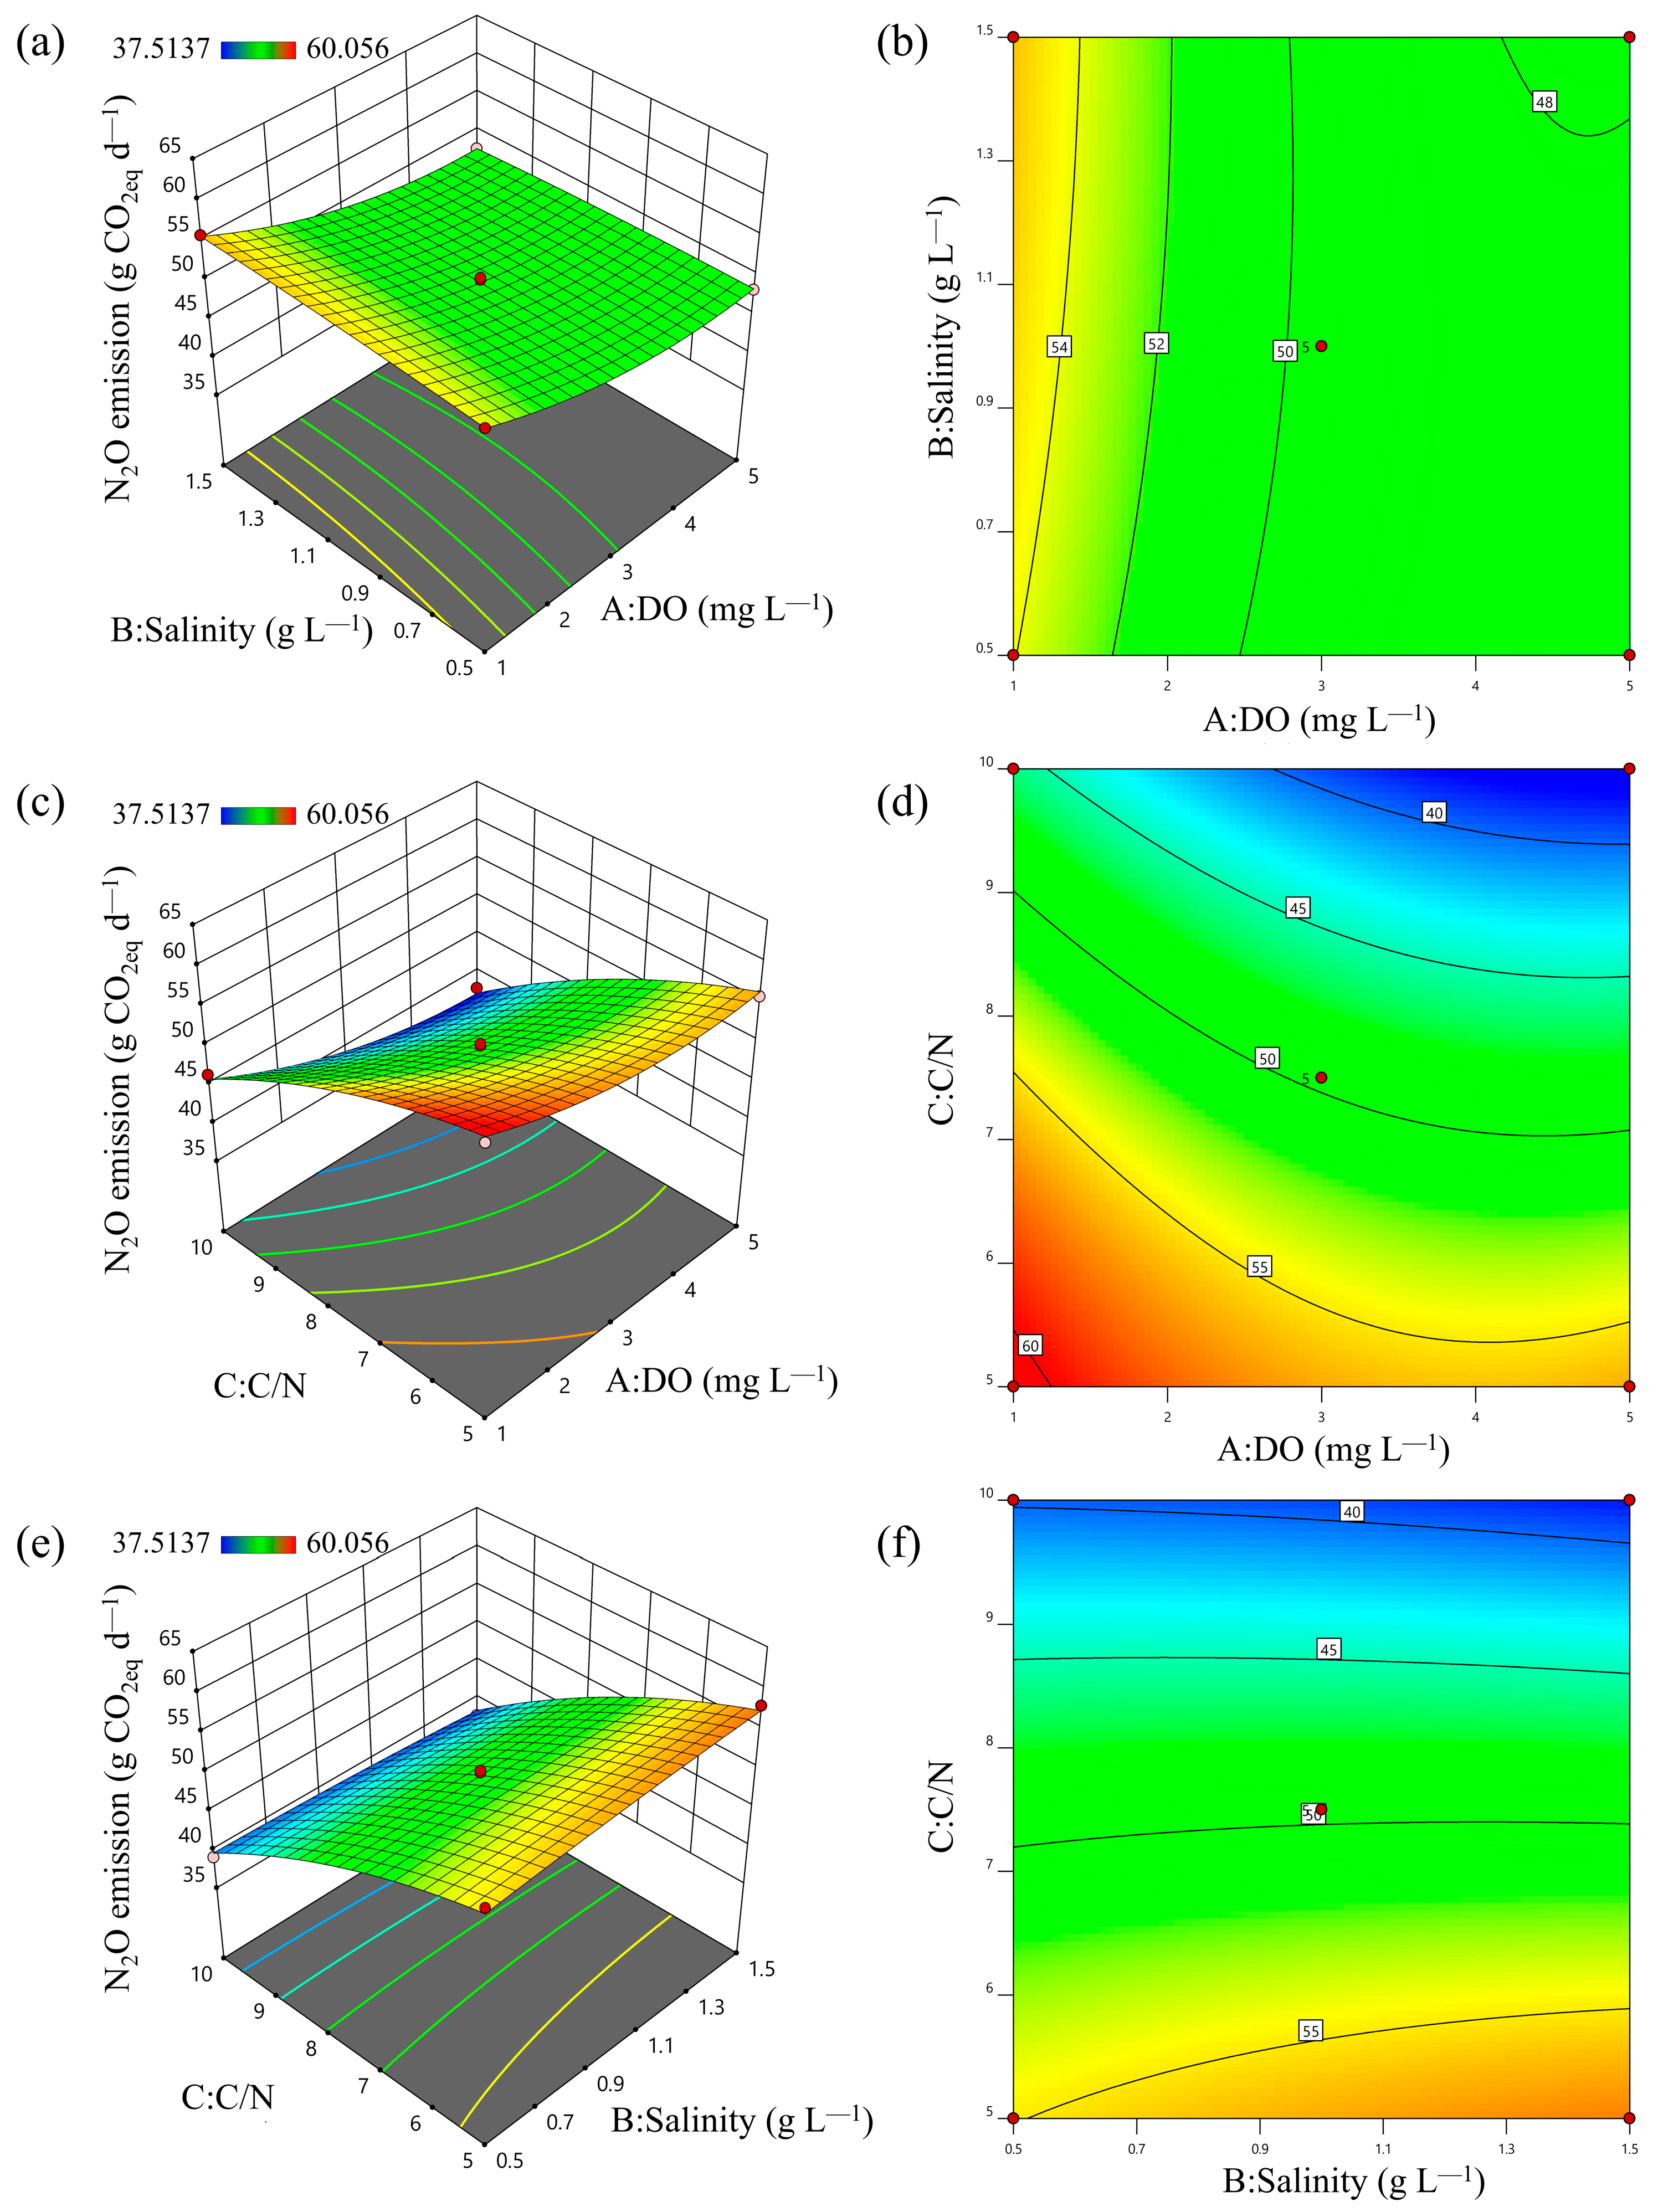
As shown in Figure 4, the response surfaces and contour plots illustrate the linear and interactive effects of variables on N2O production. Contour line ellipticity indicates the interaction strength between variables.
Figure 4.
Response surface plots and contour map for the N2O emission: (a,b) DO and Salinity; (c,d) DO and C/N; (e,f) Salinity and C/N.
Figure 4a–d shows the effect of DO on N2O production. It can be seen that when the DO level decreased from 5 to 2.75 mg L−1, the N2O emission increased only marginally, whereas a further reduction to 1 mg L−1 induced a pronounced rise. This pattern is consistent with the findings reported by Li et al. They found that when DO was decreased from 3 to 0.5 mg L−1, more NO2− was accumulated, resulting in N2O production by nitrifier denitrification [31]. For autotrophic ammonia−oxidizing bacteria (AOB) in the aerobic stage, decreasing DO promotes N2O formation through nitrifier denitrification, whereas the hydroxylamine oxidation pathway is favored as DO increases [32]. Peng et al. demonstrated via isotope measurement that as DO rose from 0.2 to 3 mg L−1, the contribution of nitrifier denitrification declined from 92% to 73%, while that of the hydroxylamine oxidation pathway increased correspondingly. They also found the nitrifier denitrification pathway dominates (66–95%) over the hydroxylamine oxidation pathway (5–34%) [17]. Accordingly, N2O emissions during nitrification are governed predominantly by nitrifier denitrification, which results in markedly elevated N2O emissions under low DO levels.
However, increasing DO to reduce N2O yield is impractical. If a WWTP is overaerated, the DO can be as high as 6–7 mg L−1. In that case, DO will return to anoxic phase via internal reflux, causing DO elevation and increasing N2O production in the heterotrophic denitrification pathway. Enzymes like nitrate reductase (NAR), nitrite reductase (NIR), and nitric oxide reductase (NOR) can tolerate O2, but nitrous oxide reductase (NOS) was highly O2 sensitive, inactivating even at low DO levels. It will block N2O conversion to N2, increasing N2O production [33]. Therefore, maintaining appropriate DO concentration during the aerobic phase can not only reduce N2O production, but also conserve energy, thereby reducing the power consumption associated with high−power aeration equipment. Precisely, DO management can balance the need for effective nitrogen removal with the goal of minimizing energy consumption, promoting sustainable operations in WWTPs.
Figure 4a,b,e,f present the effect of salinity on N2O production. It can be found that N2O production increased slightly as salinity rose from 0.5 g L−1 to 1.5 g L−1. Because salinity suppresses nitrite−oxidizing bacteria (NOB) activity more severely than AOB, causing NO2− accumulation and N2O emission increase [34]. Moreover, elevated salinity attenuates the electron−transfer efficiency of hydroxylamine oxidoreductase (HAO), causing intracellular hydroxylamine accumulation and its subsequent non−enzymatic decomposition to N2O [35]. Moreover, under salt shock, the extracellular polymeric substance (EPS) polysaccharide content of the biofilm rises sharply, adsorbing Na+ to form a “salt−shielding layer” that markedly lowers biofilm porosity. The resulting micro−aerobic zones inhibit NOS synthesis, leading to pronounced N2O accumulation [36,37]. Microbial acclimation to specific salinity levels can mitigate elevated N2O emissions over time [38]. Consequently, maintaining a stable salt concentration below 3.0 wt% is crucial for curbing N2O emission.
Figure 4c–f display the effect of C/N on N2O production. It was observed that N2O production decreased as the C/N ratio increased from 5 to 10, which was due to the direct influence of COD on N2O production during heterotrophic denitrification. COD serves as the electron donor in anoxic systems, and the nitrogen metabolism−related enzymes in the heterotrophic denitrification pathway compete for electrons under COD−limited conditions [39]. However, NOS exhibits the weakest electron competitiveness, reducing the conversion of N2O to N2 and leading to N2O accumulation [40].
- 3.
- Optimum operating conditions for N2O emission
RSM was used to optimize operational parameters for minimal N2O production. Unless it is an industrial sewage plant with high salinity wastewater entering, the salinity of the sewage plant inlet is recommended to be controlled at about 0.5 g L−1. To ensure effluent COD meets the standard and to minimize aeration power consumption, the optimal conditions were DO = 3.67 mg L−1 and C/N = 12.75, yielding simulated N2O of 23.8 g CO2eq d−1. Under these conditions, the experimental N2O yield (25.2 g CO2eq d−1) aligned with simulations, thereby validating the effectiveness of the model and confirming the optimal parameters. This confirms the reliability of the model in predicting N2O emissions and provides a strong basis for optimizing wastewater treatment to reduce greenhouse gas emissions.
3.2.2. Direct Emission
WWTPs vary in construction years and operational efficacy, with some having advanced equipment and optimized regional pipe networks. These plants effectively manage chemical and electricity use, so that only direct emissions are considered. For instance, they use food processing wastewater as a carbon source, precisely controlled aeration, and rely on photovoltaic or other renewable energy sources for power [41,42,43]. In such advanced WWTPs, direct emissions from CH4 and N2O are the primary concern, and the subsequent model can be applied.
- 1.
- Direct emission fitting model
The direct emissions data, reflecting CH4 and N2O emissions from each experimental group, are detailed in Table A3. After data fitting, the equation for direct emissions (Y2, g CO2eq d−1) is derived as Equation (3).
Y2 = 94.86 − 3.20A + 12.27B + 1.18C − 0.68AB − 0.18AC − 0.97BC + 0.61A2 − 1.33B2 + 0.15C2
ANOVA results (Table 3) show an F−value of 36.63, indicating a well−fitted equation. The R2 of 0.9792 demonstrated high accuracy, with Adjusted R2 (0.9525) and Predicted R2 (0.8156) within 0.2 of each other, confirming the robustness of the model. A low C.V.% value (0.9066) and Adeq Precision value (24.0799 > 4) further validated the accuracy and reliability of the model. Moreover, p−value analysis revealed that DO and the C/N ratio significantly impacted the direct emission model. Additionally, the interaction between salinity and the C/N ratio, as well as the quadratic effect of DO, are also significant factors influencing direct emissions. These statistical indicators collectively validate the effectiveness of the model in predicting direct emissions, promoting its suitability for further analysis and application in optimizing the sewage treatment process.
Table 3.
ANOVA for the direct emission under different conditions.
- 2.
- Direct emission response surface analysis
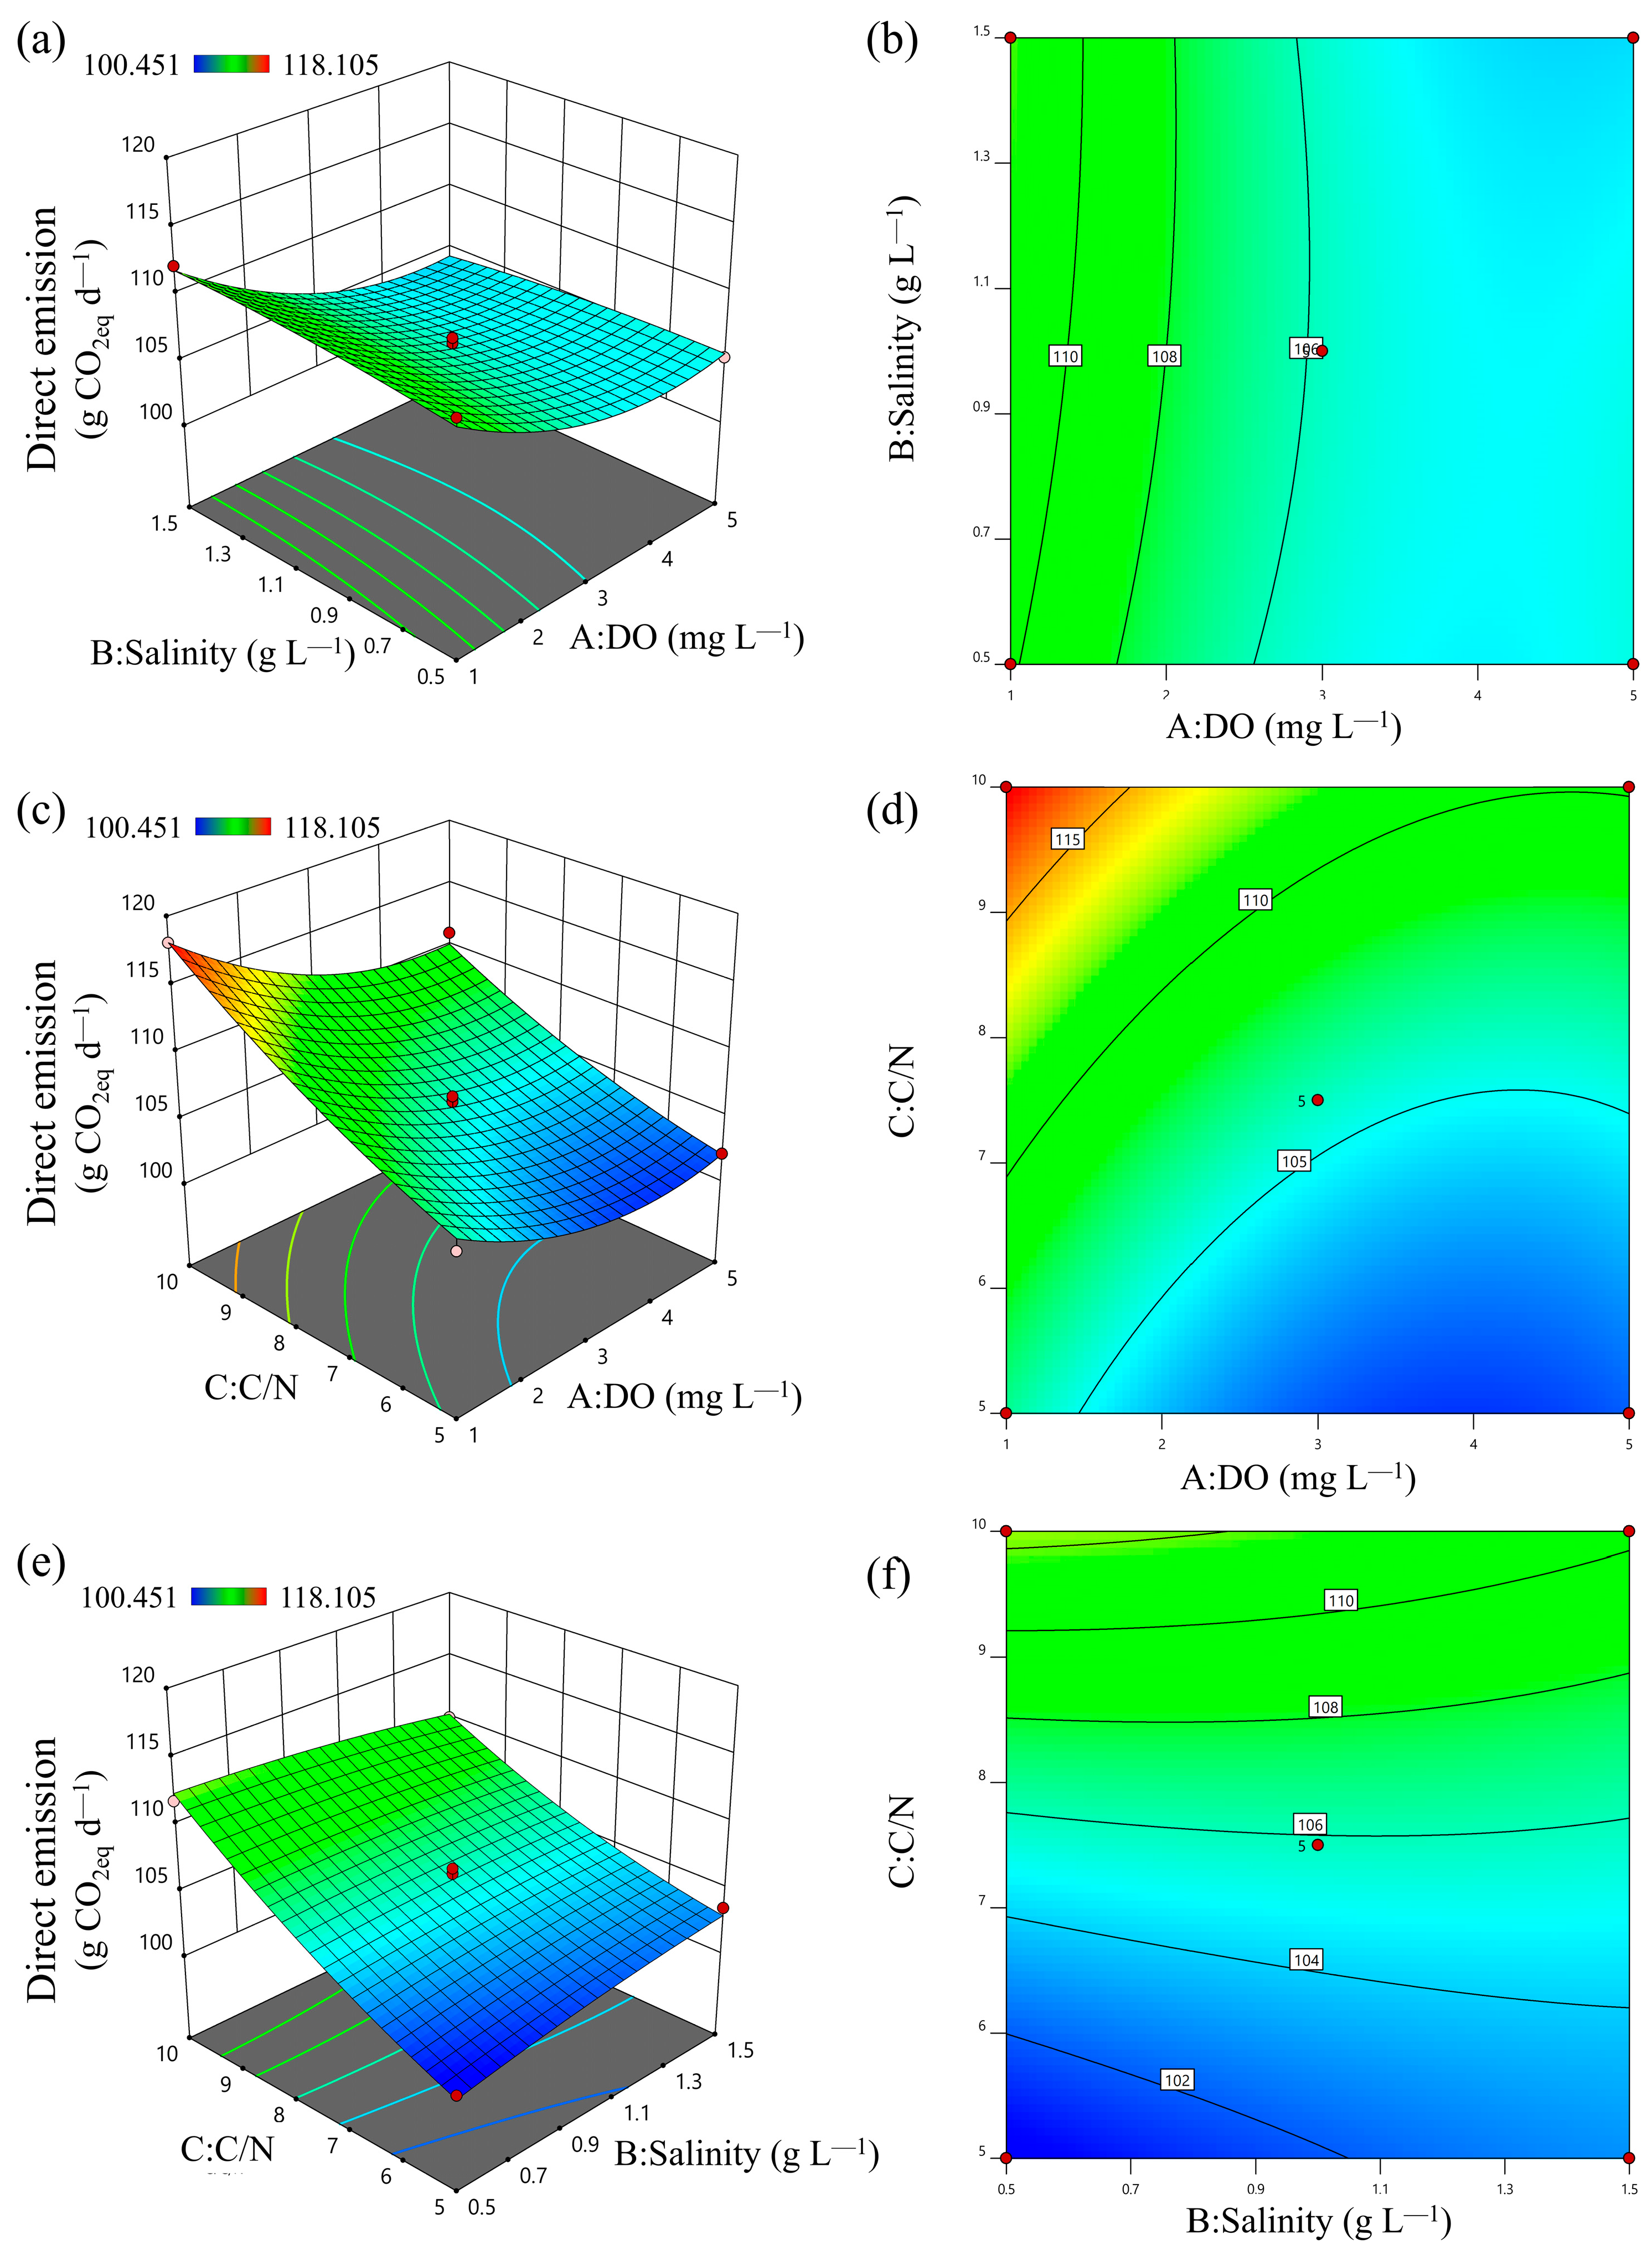
Figure 5a–d illustrates that direct emissions decrease with increasing DO. This trend is mainly due to the significant impact of DO on N2O emissions, consistent with prior findings. Specifically, higher DO levels reduce N2O emissions but have less effect on anaerobic CH4 production [44]. Through concentration determination, the relative contribution ratios of nitrous oxide and methane were 54% and 46%, respectively.
Figure 5.
Response surface plots and contour map for the direct emission: (a,b) DO and salinity; (c,d) DO and C/N; (e,f) salinity and C/N.
Figure 5a,b,e,f show that salinity had a relatively weak impact on direct emissions, with minor increases observed as salinity rose. This is primarily attributed to the influence of salinity on microbial activity and enzyme function [45]. However, the effect of DO on N2O emissions and the effect of C/N on CH4 emissions were more significant, leading to a relatively low degree of influence of salinity on the biochemical system.
It can be seen in Figure 5c–f that direct emissions increased with a rising C/N ratio. It is due to the increased availability of carbon sources, which promoted CH4 production in the anaerobic phase [46]. While a higher C/N ratio tends to decrease N2O production, the surge in CH4 production becomes the predominant factor driving the increase in direct emissions, given the low levels of N2O production.
- 3.
- Optimum operating conditions for direct emission
The optimal conditions for minimal direct emissions were determined by RSM. Results show that lower direct emissions correlated with a lower C/N ratio. Typically, WWTPs have a minimum influent C/N ratio of 3 and standard salinity of 0.5 g L−1. Under these conditions, the optimal DO was maintained at about 3.35 mg L−1 to minimize direct emission. The actual N2O yield was 95.28 g CO2eq d−1, closely matching the theoretical value of 97.316 g CO2eq d−1, validating the model’s effectiveness. WWTPs can utilize the model to input specific C/N ratios and salinity values to determine optimal DO levels for effective direct emission management.
3.2.3. Total Emission
In conventional WWTPs, indirect emissions predominantly occur in two critical stages. First, supplementary carbon sources (e.g., glucose, starch, sodium acetate) are added during the anoxic phase to ensure sufficient COD for heterotrophic denitrification. Second, electricity consumed by aeration devices in the aerobic phase, used for providing adequate DO for nitrification, also contributed significantly to indirect emissions. In this study, the indirect emissions from additional sodium acetate and electricity consumption were calculated using emission factors of 2.9 kg CO2eq kw h−1 and 0.67 kg CO2eq kw h−1, respectively. The subsequent model helped assess total emissions in WWTPs and determined optimal operating conditions, offering a comprehensive approach to managing and reducing the carbon footprint of wastewater treatment.
- 1.
- Total emission fitting model
The total emissions data, which are the sum of direct and indirect emissions from each experimental group, are presented in Table A4. The final fitting equation for total emissions (Y3, g CO2eq d−1) in terms of DO (A, mg L−1), salinity (B, g L−1), and C/N (C) was as follow:
Y3 = 313.99−3.12A + 16.54B−12.96C−0.68AB−0.21AC−1.30BC + 0.65A2−2.02B2 + 0.99C2
The ANOVA analysis results (Table 4) show an F−value of 30.78, indicating a strong correlation between the equation and experimental data. The R2 of 0.9754 confirmed the accuracy of the equation. The discrepancy between the Adjusted R2 (0.9437) and the Predicted R2 (0.7661) was within 0.2, which supported the validity of the model. A C.V.% value of 0.3762 indicated low dispersion and high model fitting accuracy. An Adeq Precision value >4 (17.6461) further confirmed the model was highly reliable and could serve as a representative model for the total emissions. Furthermore, the p−values revealed that the linear effect of DO and the quadratic effects of DO and C/N had a highly significant impact on the total emission model, while the interaction between salinity and C/N was also a significant factor. These statistical indicators collectively validate the effectiveness of the model in predicting total emissions under various operational conditions.
Table 4.
ANOVA for the total emission under different conditions.
- 2.
- Total emission response surface analysis
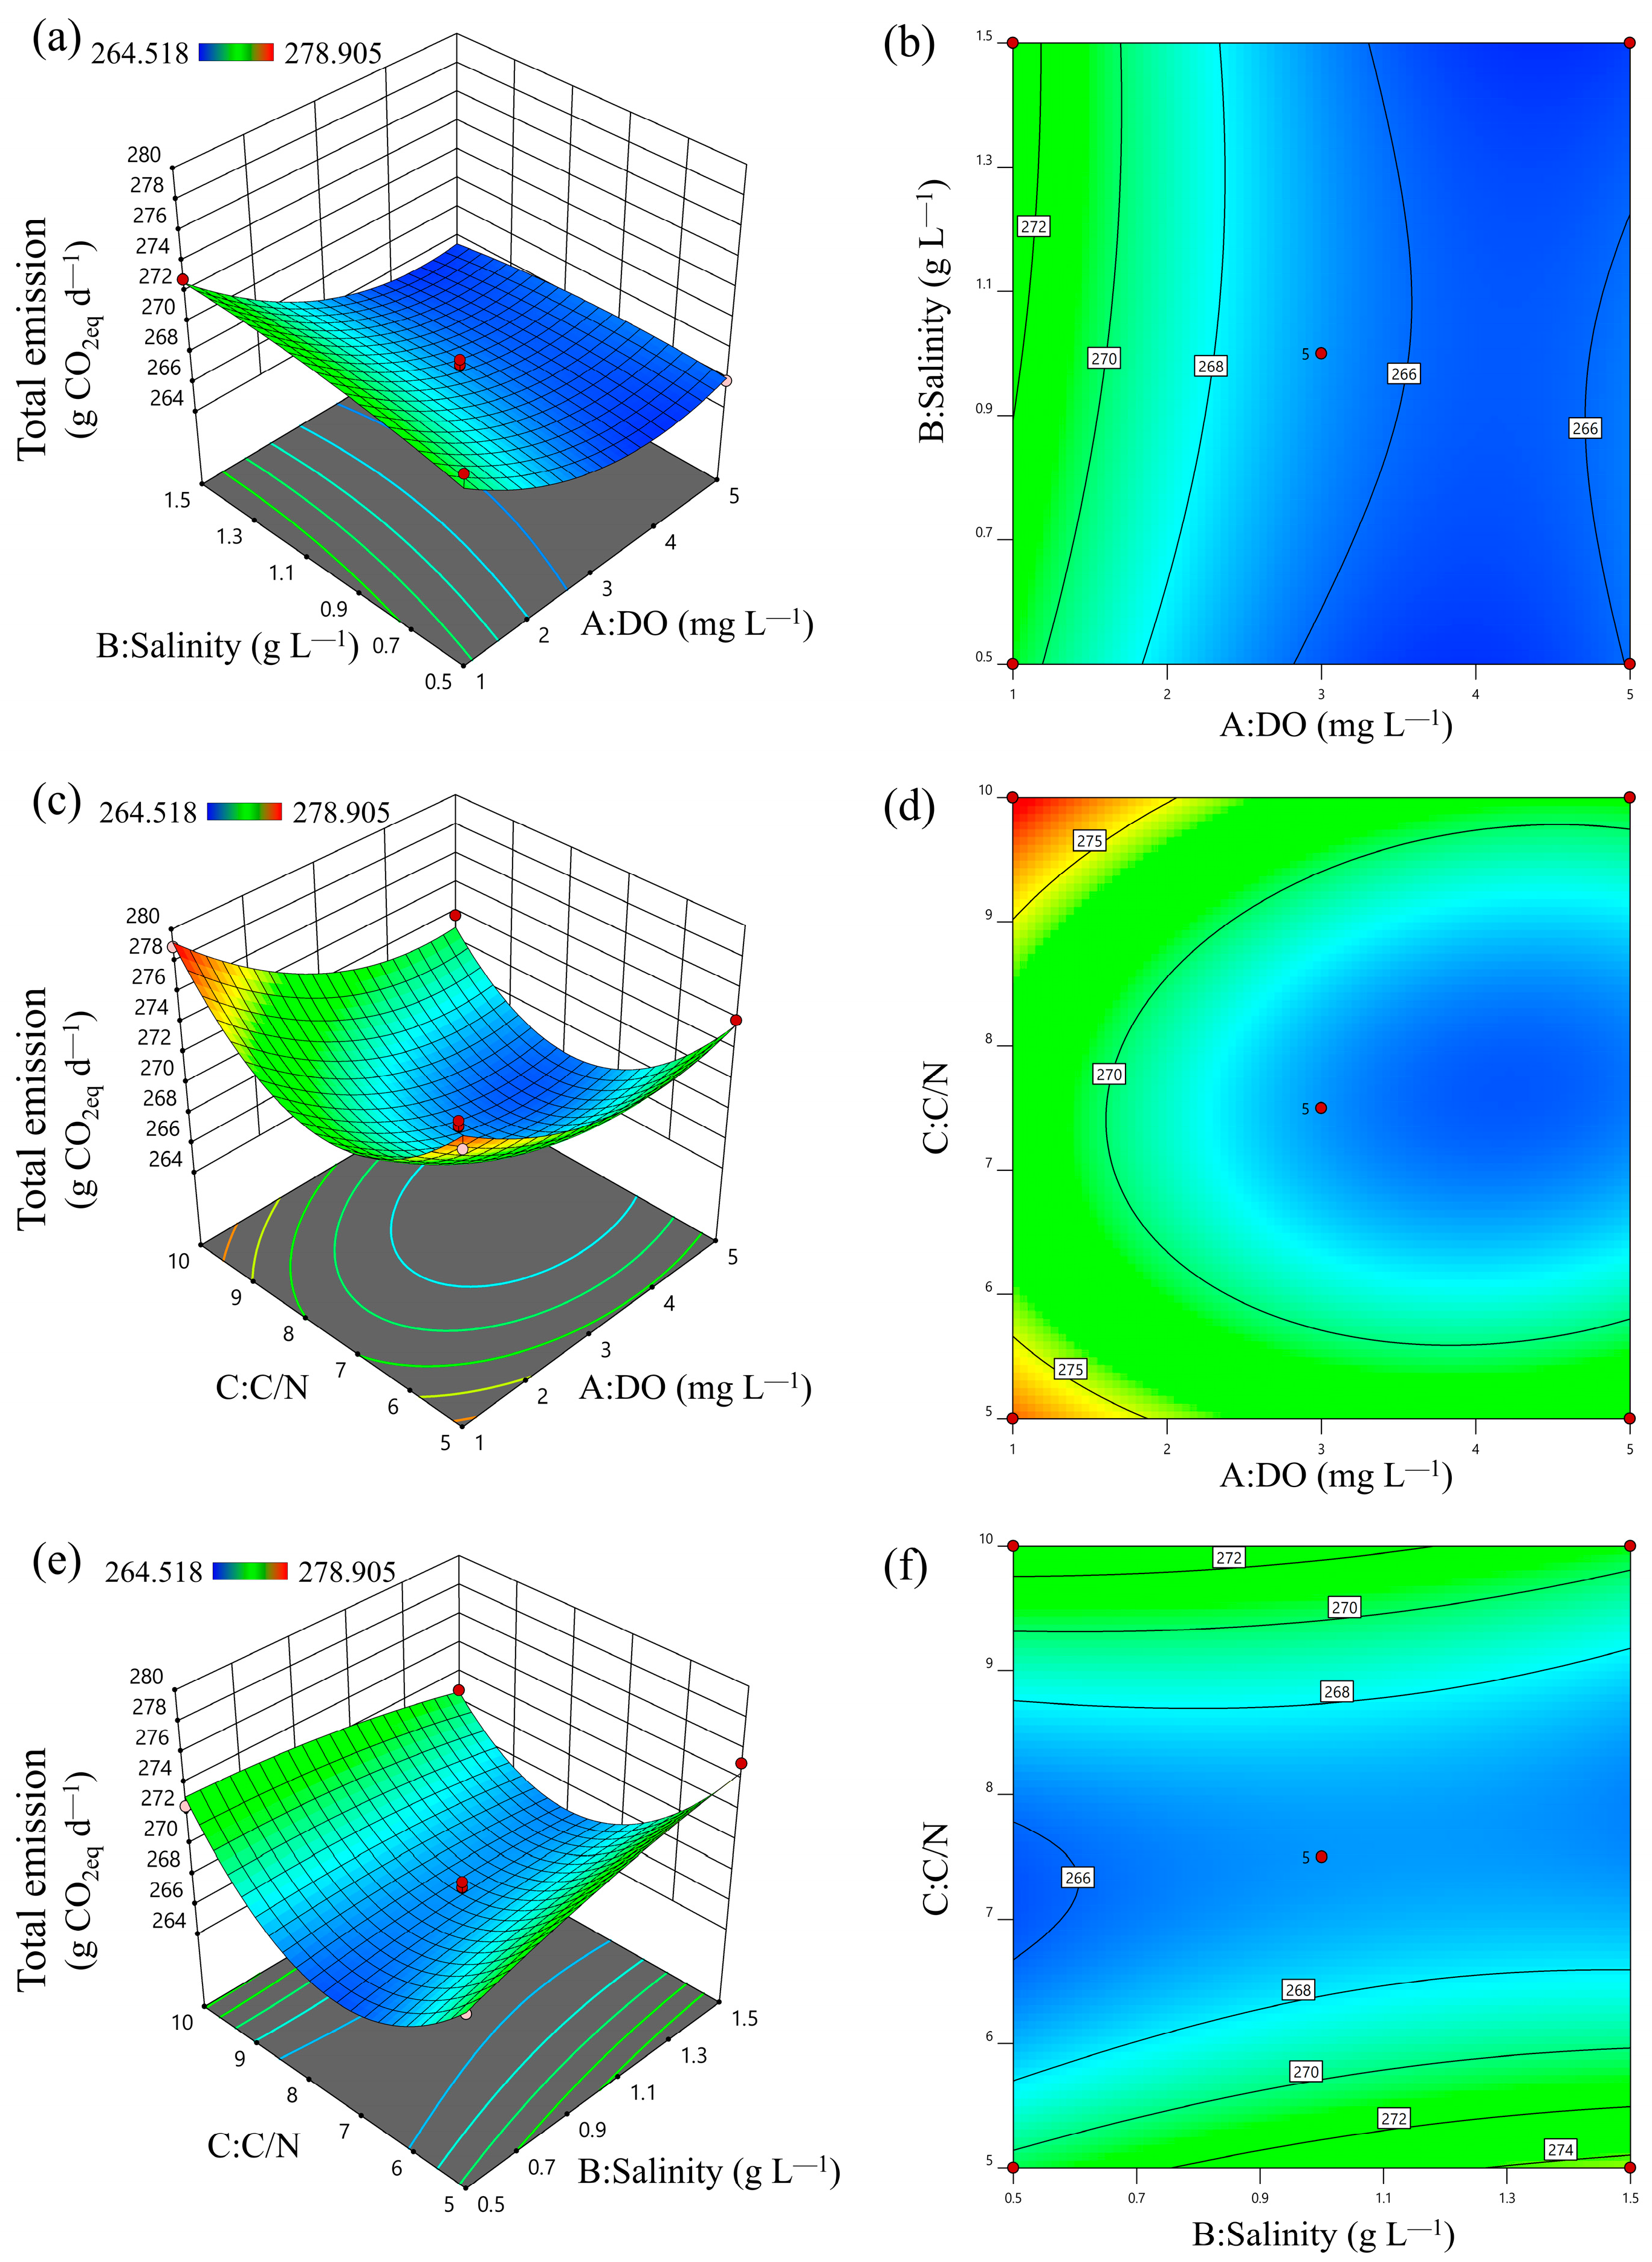
As shown in Figure 6a–d, the total emissions decreased with increasing DO, stabilizing when DO levels exceeded 3 mg L−1. It demonstrates that excessive DO did not contribute to further reductions in total emissions. Therefore, maintaining an appropriate DO level not only keeps total emissions low but also prevents unnecessary energy consumption due to aeration machinery. By optimizing the DO level, WWTPs can balance the need for effective nitrogen removal with energy efficiency.
Figure 6.
Response surface plots and contour map for the total emission: (a,b) DO and salinity; (c,d) DO and C/N; (e,f) salinity and C/N.
Figure 6a,b,e,f display that salinity has a minimal impact on total emissions, with slight increases observed as salinity rises from 0.5 g L−1 to 1.5 g L−1. It is important to note that the influence of salinity on microbial activity was significantly less pronounced compared to the effects of DO on N2O emissions and the C/N ratio on CH4 emissions. The weak effect of salinity on total emissions can be attributed to its relatively minor role in the biochemical processes within wastewater treatment. However, salinity above 3 g L−1 can significantly disrupt microbial activity, increasing greenhouse gas emissions, indicating a critical threshold.
As demonstrated in Figure 6c–f, total emissions exhibit a distinct unimodal trend, characterized by an initial decline followed by a marked increase, with influent C/N rising from 5 to 10. This non−linear response stems from the combined impact of multiple factors on total emissions.
At lower C/N ratios, limited organic carbon availability in the anaerobic stage constrains methanogenesis, reducing CH4 emissions. However, this carbon deficiency propagates to the anoxic stage, where insufficient electron donors impair heterotrophic denitrification. Consequently, it must add supplemental carbon sources to maintain nitrogen removal efficiency, elevating indirect emissions. Simultaneously, N2O emission in the anoxic stage may increase due to the untimely or insufficient addition of supplemental carbon. These factors collectively increase total emissions despite suppressed CH4 generation.
Conversely, at higher C/N ratios, abundant organic carbon in the anaerobic stage stimulates vigorous methanogenesis, driving substantial CH4 emissions that dominate the greenhouse gas profile. While the intrinsic carbon sufficiency eliminates supplemental carbon requirements (reducing indirect emissions) and optimizes denitrification (minimizing N2O), the exponential rise in CH4 outweighs these benefits.
Notably, the emission minimum occurs at C/N ≈ 7.5. This optimum balances (i) moderate anaerobic carbon availability that limits CH4 overproduction without starving methanogens, and (ii) adequate carbon carryover to the anoxic zone that sustains efficient heterotrophic denitrification without external supplementation. This equilibrium minimizes synergistic emissions from all pathways, including direct biological fluxes and indirect supplementation carbon contributions.
- 3.
- Optimum operating conditions for total emission
The DO, C/N values, and salinity are limited to the ranges of 1–7 mg L−1, 3–13, and 0.5–1.5 g L−1, respectively. The optimal operating conditions for minimizing total emissions were identified as DO = 2.5 mg L−1, salinity = 0.5 g L−1, and C/N = 7.175. Excess salinity can be reduced through pretreatment to a lower concentration, beneficial for reducing total emissions. Verification tests under these optimized conditions show minor deviation between actual (282.56 g CO2eq d−1) and predicted emissions (266.41 g CO2eq d−1), validating the accuracy of the model and confirming its suitability for optimization purposes. This approach ensures that the operational parameters are finely tuned to minimize total emissions while maximizing energy efficiency in WWTPs.
3.3. GHG Emission Mechanisms in A2/O Process
Integrated with the aforementioned response surface optimization analysis, Figure 7 illustrates the GHG emission mechanisms within the A2/O process. The figure reveals that N2O is primarily generated through three pathways: the hydroxylamine (NH2OH) oxidation pathway and nitrifier denitrification pathway, both predominantly mediated by aerobic AOB, and the conventional heterotrophic denitrification pathway. The former two pathways typically occur under aerobic conditions, with research confirming AOB (e.g., Nitrosomonas) as the primary contributor, accounting for 50–70% of total N2O production [47]. Under conditions of sufficient dissolved oxygen, the NH2OH oxidation pathway is the dominant route for N2O production.
Figure 7.
Schematic of GHG emission mechanisms in the A2/O process.
The specific reaction sequence of the NH2OH oxidation pathway involved the following: under aerobic conditions, AOB firstly oxidizes NH4+−N to NH2OH via ammonia monooxygenase (AMO). NH2OH is subsequently oxidized to NO2− by hydroxylamine oxidoreductase (HAO), with N2O generated as a byproduct. When DO concentrations decreased in aerobic phases, the NH2OH oxidation pathway persisted, while nitrifier denitrification intensified—AOB reduced NO2− to N2O, thereby elevating N2O emissions. Conversely, elevated DO levels in aerobic phases promote oxygen backflow into anoxic phases. Fluctuating DO concentrations rapidly inhibit nitrous oxide reductase (NOS) activity in the heterotrophic denitrification pathway, impeding the reduction of N2O to N2 and causing N2O accumulation. Simultaneously, salinity exerts a stronger inhibitory effect on nitrite−oxidizing bacteria (NOB; e.g., Nitrospira) than on AOB, leading to NO2− accumulation and consequently increased N2O production. In anoxic systems, electron competition occurs among nitrogen−metabolizing enzymes in heterotrophic denitrification when organic carbon (COD) is limited. NOS, exhibiting the weakest electron affinity, experiences suppressed activity, delaying N2O reduction to N2 and promoting N2O accumulation. Additionally, carbon source accumulation in anaerobic phases increased CH4 production, while elevated DO raised energy consumption and indirect emissions. Thus, holistic optimization balancing these trade−offs is essential. Collectively, these mechanisms demonstrated that influent salinity, C/N ratio, and aerobic−phase DO concentration must be maintained within an optimal range to achieve system−wide carbon reduction in A2/O processes.
3.4. Optimal Operation and Economic Cost Calculation of Actual WWTPs
A well−operated WWTP was selected for actual verification and calculation. This WWTP belonged to the most traditional type, with a capacity of 33,000 tons per day, and the biochemical treatment unit was a typical A2/O process. The plant uses external carbon sources to adjust the C/N ratio of the influent. The aerobic tank is overaerated all year round to ensure the denitrification process, and there is no CH4 resource utilization device. In this context, the GHG emissions of the biochemical section include the direct emissions of CH4 and N2O released, as well as the indirect emissions of chemical and electricity consumption. The total emissions can be optimized with Equation (4).
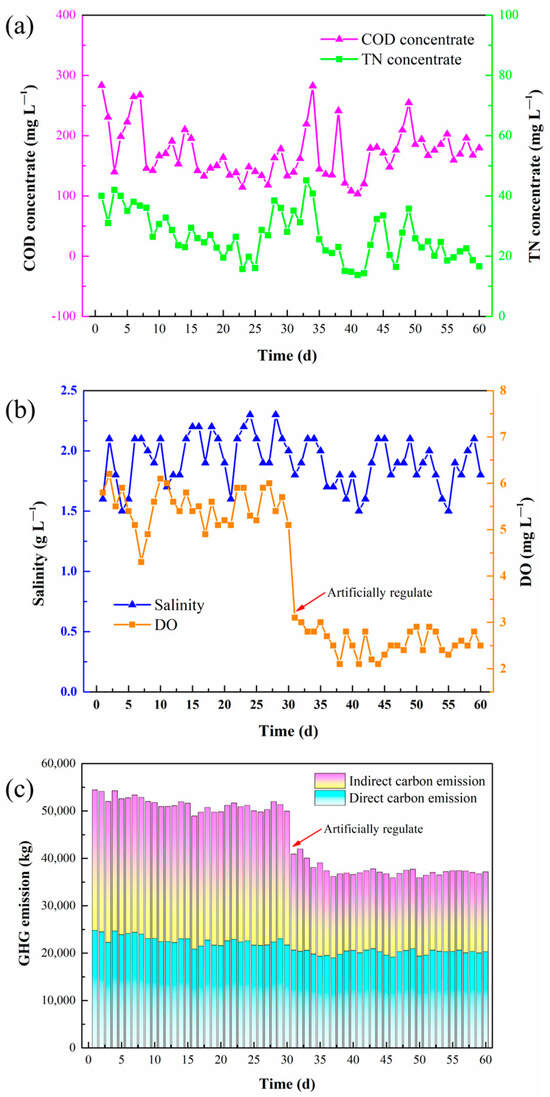
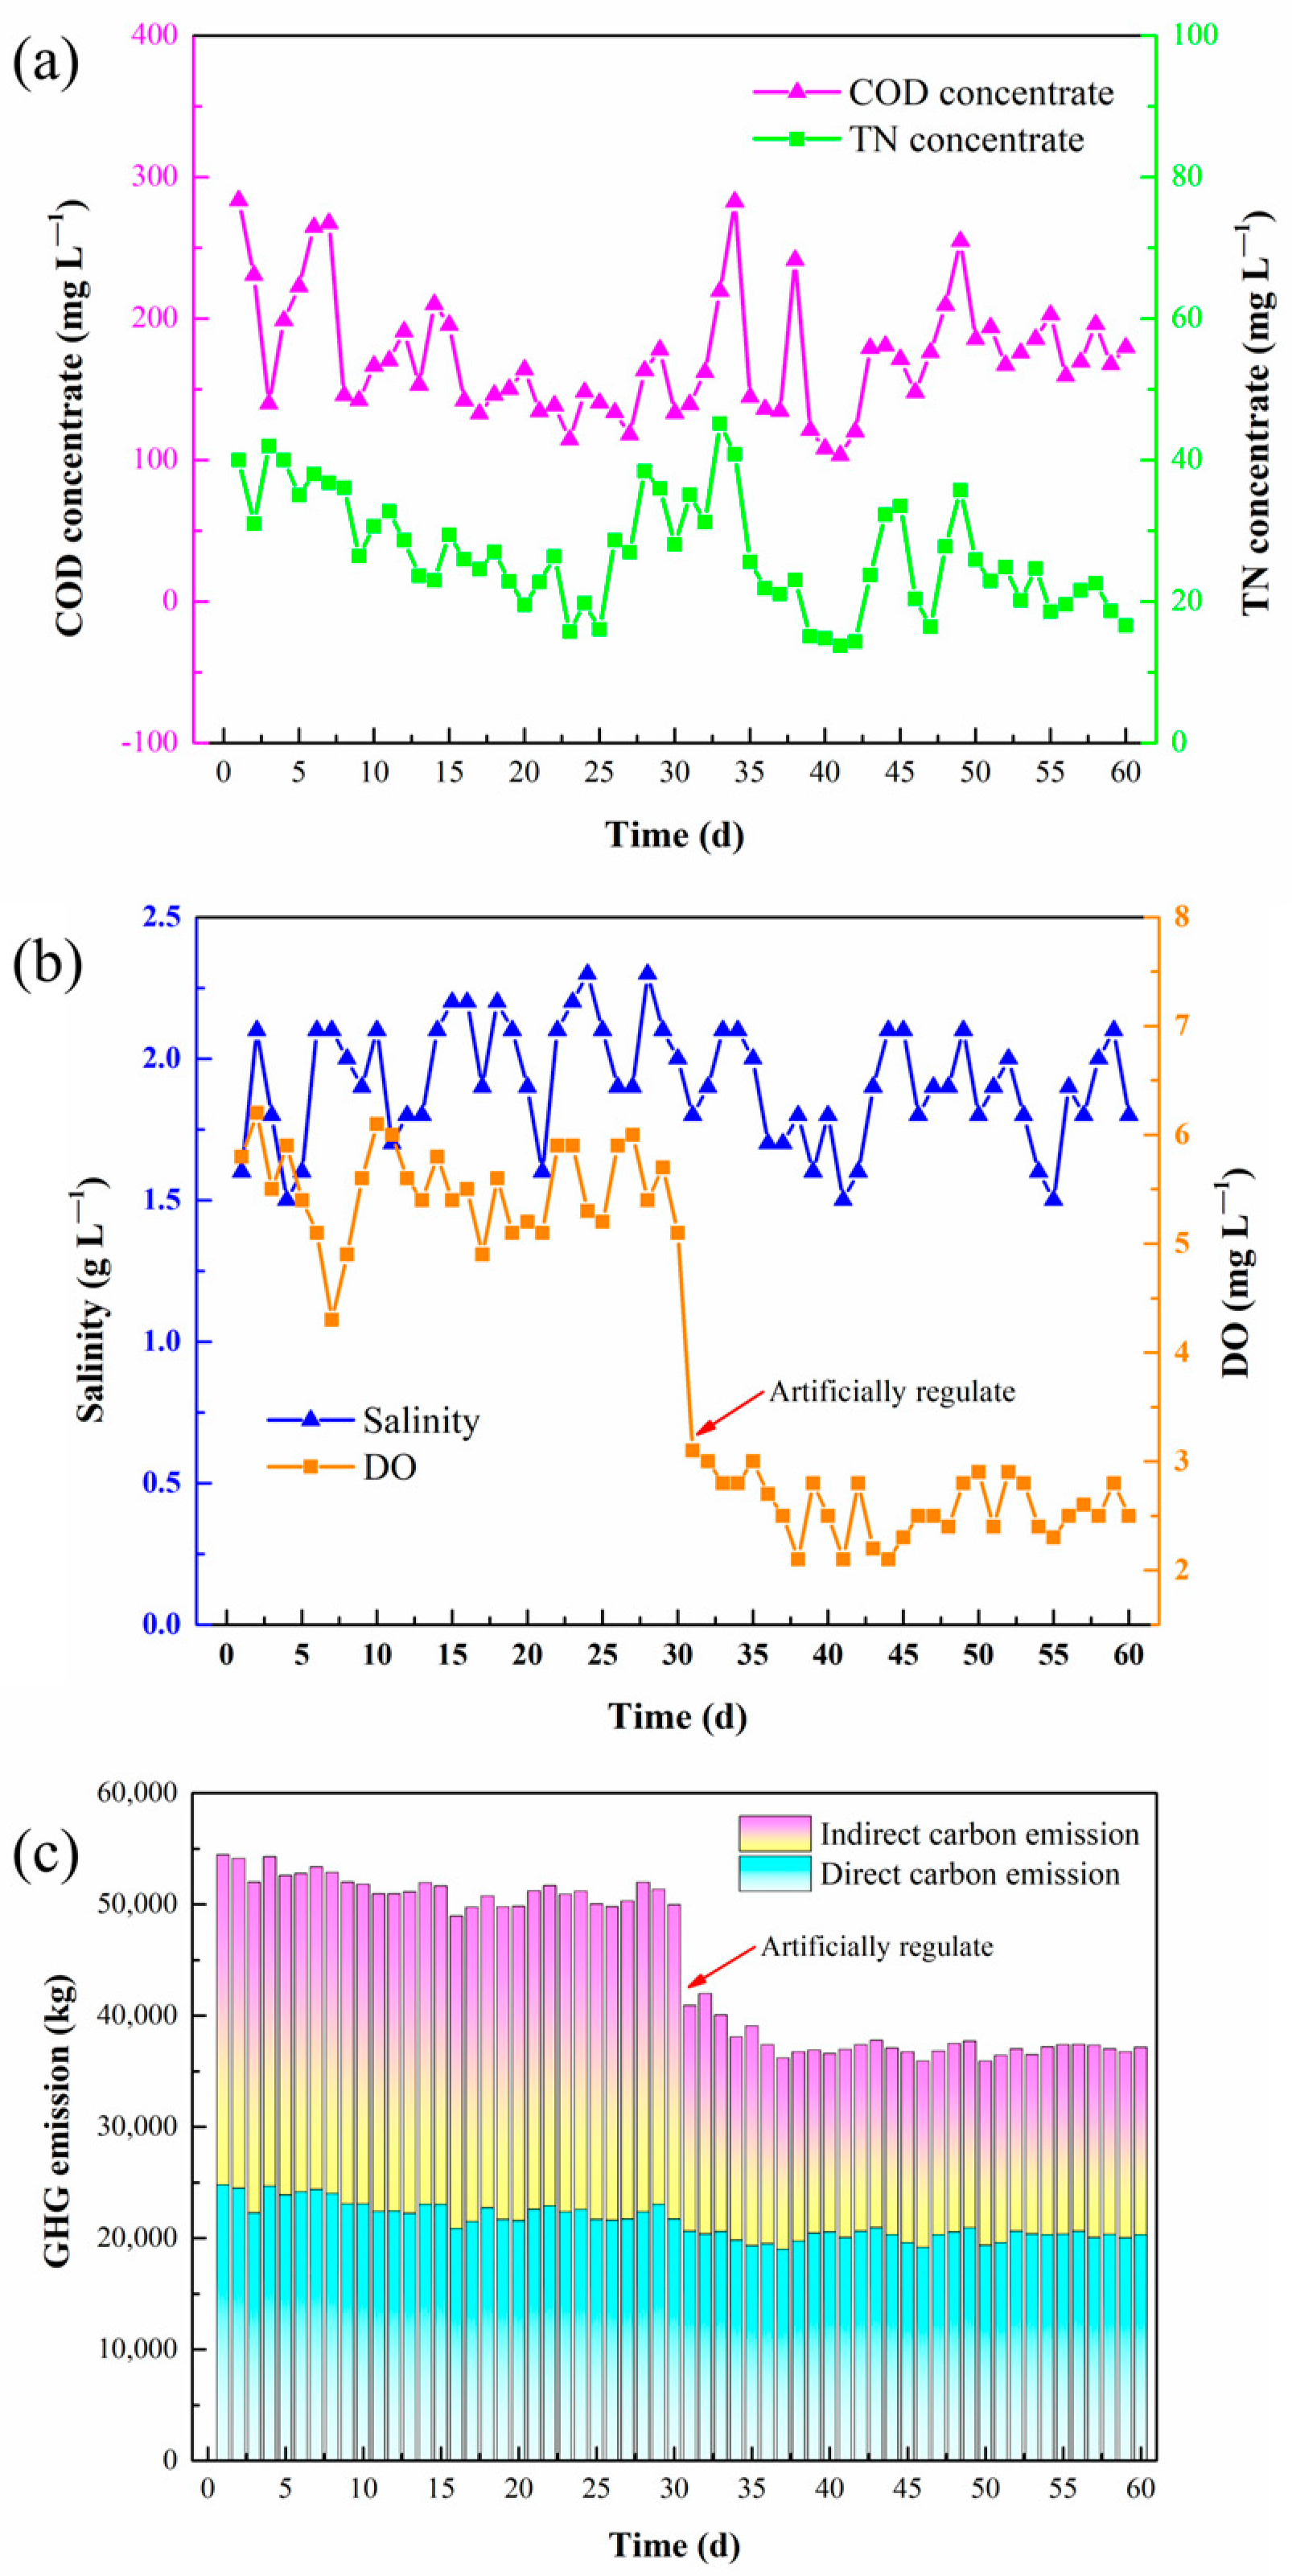
As shown in Figure 8a,b, the water quality parameters, including salinity, COD, and TN concentrations, as well as the DO levels in the aeration tank, were monitored continuously for 60 d. The influent salinity of A2/O was approximately 1.97 g L−1, the COD concentration was within the range of 114–283 mg L−1, the TN concentration was within the range of 15–42 mg L−1, and the DO level was in range of 4.3–6.2 mg L−1 due to over−aeration in the aerobic tank. Based on the monitoring data (Figure 8c), before the parameters were artificially regulated, the total daily emissions of the WWTP were approximately 51,000 kg CO2eq, and the emission intensity was 1.55 kg CO2eq t−1. After artificial regulation, emissions were significantly reduced. The total daily emissions were approximately 37,000 kg CO2eq, and the emission intensity was 1.12 kg CO2eq t−1. After calculation, this WWTP with a daily processing capacity of 33,000 t can reduce total emissions by 5110 t CO2eq per year. Furthermore, as presented in Table 5, operational optimization of the A2/O process significantly reduced operation costs. The reduction in DO concentration in aerobic phases effectively mitigated excessive aeration, resulting in a 39.2% decrease in daily electricity costs for blower operation. Concurrently, optimization of the influent C/N ratio reduced daily chemical consumption costs by 27.6%. These results demonstrated that the optimized operational strategy achieved significant GHG emission reductions and operational savings without compromising treatment efficiency, thereby propelling A2/O−based WWTPs toward sustainable green economic transformation.
Figure 8.
(a,b) The water quality conditions and (c) the GHG emission of A2/O process in WWTP in 60 days.
Table 5.
Comparison of economic costs before and after operational condition optimization.
4. Conclusions
This study probes the biochemical stage of the sewage treatment process, focusing on the synergistic effects of three factors (DO in the aerobic stage, influent salinity, and C/N ratio) on GHG emissions. Considering the varying focuses of GHG emission accounting in the wastewater treatment industry, three models were created to accurately reflect GHG emissions, and the optimized operation parameters were proposed. (1) For the WWTPs equipped with CH4 reuse systems, the optimized parameters were salinity = 0.5 g L−1, DO = 3.67 mg L−1, and C/N = 12.75. (2) For the WWTPs only, considering direct emissions, the optimized parameters were salinity = 0.5 g L−1, DO = 3.35 mg L−1 and C/N = 3. (3) For the WWTPs, with the need to assess total emissions, the optimized parameters were salinity = 0.5 g L−1, DO = 2.5 mg L−1, and C/N = 7.18. Specific findings indicated that the increase in salinity was related to the exacerbation of direct emissions. An elevation in aerobic DO would reduce N2O production but raise the indirect emissions. Conversely, the raised DO in the anoxic section due to nitrification reflux likely hiked N2O production. Furthermore, the C/N ratio mainly influenced CH4 production in the anaerobic section. An adequate carbon source enabled the complete conversion of nitrogen, leading to a reduction in N2O emissions. Collectively, this study not only provided three models for GHG emission assessment of different scenarios but also optimized operational parameters to reduce emissions. Verification tests in a WWTP showed that it could reduce about 5110 t CO2eq per year by artificially controlling the operating conditions. It should be noted that all the above results were obtained based on RSM methods. For the actual carbon reduction situation of WWTPs, more actual data samples were needed to prove it. These findings will offer new insights for carbon reduction strategies and aid in achieving goals of carbon peaking and neutrality in WWTPs.
Author Contributions
Conceptualization, S.T. and Y.W.; data curation, X.M. and S.C.; formal analysis, X.M. and Z.X.; funding acquisition, S.T., C.H. and W.L.; investigation, S.T., X.M. and C.H.; methodology, G.L. and Z.X.; project administration, J.S.; supervision, W.L., J.S. and Y.W.; validation, S.T.; visualization, S.T.; writing—original draft, S.T.; writing—review and editing, Y.W. All authors have read and agreed to the published version of the manuscript.
Funding
This research was funded by the Jiangsu Carbon Peaking and Neutrality Science and Technology Innovation Fund, grant number BE2022861; the Open Research Fund of Jiangsu Province Key Laboratory of Environmental Engineering, grant number ZX2023001; the Jiangsu Funding Program for Excellent Postdoctoral Talent, grant number 2024ZB405; the Independent Research Fund from Jiangsu Provincial Public Welfare Research Institutions, grant number GYYS202403; and the Nanjing Postdoctoral Research Funding Project, grant number C23067.
Data Availability Statement
The raw data supporting the conclusions of this article will be made available by the authors upon request.
Conflicts of Interest
The authors declare no conflicts of interest.
Appendix A
Table A1.
Independent variable range and levels for GHG emissions.
Table A2.
BBD and the N2O emissions under different conditions.
Table A3.
BBD and the direct emissions under different conditions.
Table A4.
BBD and the total emissions under different conditions.
Figure A1.
The greenhouse gas detection site of A2/O process in WWTP.
References
- Woon, K.S.; Phuang, Z.X.; Taler, J.; Varbanov, P.S.; Chong, C.T.; Klemes, J.J.; Lee, C.T. Recent advances in urban green energy development towards carbon emissions neutrality. Energy 2023, 267, 126502. [Google Scholar] [CrossRef] [Scilit]
- Liu, Z.; Xu, Z.; Zhu, X.; Yin, L.; Yin, Z.; Li, X.; Zheng, W. Calculation of carbon emissions in wastewater treatment and its neutralization measures: A review. Sci. Total Environ. 2024, 912, 169356. [Google Scholar] [CrossRef] [Scilit]
- Guo, S.; Huang, H.; Dong, X.; Zeng, S. Calculation of greenhouse gas emissions of municipal wastewater treatment and its temporal and spatial trend in China. Water Wastewater Eng. 2019, 45, 56–62. [Google Scholar]
- Huang, Y.; Meng, F.; Liu, S.; Sun, S.; Smith, K. China’s enhanced urban wastewater treatment increases greenhouse gas emissions and regional inequality. Water Res. 2023, 230, 119536. [Google Scholar] [CrossRef] [Scilit] [PubMed]
- He, Y.; Li, Y.; Li, X.; Liu, Y.; Wang, Y.; Guo, H.; Hou, J.; Zhu, T.; Liu, Y. Net−zero greenhouse gas emission from wastewater treatment: Mechanisms, opportunities and perspectives. Renew. Sustain. Energy Rev. 2023, 184, 113547. [Google Scholar] [CrossRef] [Scilit]
- He, X.; Li, Z.; Xing, C.; Li, Y.; Liu, M.; Gao, X.; Ding, Y.; Lu, L.; Liu, C.; Li, C.; et al. Carbon footprint of a conventional wastewater treatment plant: An analysis of water−energy nexus from life cycle perspective for emission reduction. J. Clean. Prod. 2023, 429, 139562. [Google Scholar] [CrossRef] [Scilit]
- Bartram, D.; Short, M.D.; Ebie, Y.; Farkaš, J.; Gueguen, C.; Peters, G.M.; Zanzottera, N.M.; Karthik, M. Chapter 6: Wastewater Treatment and Discharge. In 2019 Refinement to the 2006 IPCC Guidelines for National Greenhouse Gas Inventories; IPCC: Geneva, Switzerland, 2019; Volume 5: Waste. [Google Scholar]
- Song, C.; Zhu, J.J.; Willis, J.L.; Moore, D.P.; Zondlo, M.A.; Ren, Z.J. Methane emissions from municipal wastewater collection and treatment systems. Environ. Sci. Technol. 2023, 57, 2248–2261. [Google Scholar] [CrossRef] [Scilit]
- Li, L.; Wang, X.; Miao, J.; Abulimiti, A.; Jing, X.; Ren, N. Carbon neutrality of wastewater treatment−A systematic concept beyond the plant boundary. Environ. Sci. Ecotechnol. 2022, 11, 100180. [Google Scholar] [CrossRef] [Scilit] [PubMed]
- Yang, R.; Yuan, L. Generation, emission reduction/utilization, and challenges of greenhouse gas nitrous oxide in wastewater treatment plants—A review. J. Water Process Eng. 2023, 53, 103871. [Google Scholar] [CrossRef] [Scilit]
- Ni, B.J.; Ye, L.; Law, Y.; Byers, C.; Yuan, Z. Mathematical modeling of nitrous oxide (N2O) emissions from full−scale wastewater treatment plants. Environ. Sci. Technol. 2013, 47, 7795–7803. [Google Scholar] [CrossRef] [Scilit]
- Su, Q.; Felez, C.D.; Jensen, M.M.; Smets, B.F. Abiotic nitrous oxide (N2O) production is strongly pH dependent, but contributes little to overall N2O emissions in biological nitrogen removal systems. Environ. Sci. Technol. 2019, 53, 3508–3516. [Google Scholar] [CrossRef] [Scilit]
- Abulimiti, A.; Wang, X.; Kang, J.; Li, L.; Wu, D.; Li, Z.; Piao, Y.; Ren, N. The trade−off between N2O emission and energy saving through aeration control based on dynamic simulation of full−scale WWTP. Water Res. 2022, 223, 118961. [Google Scholar] [CrossRef] [Scilit]
- Shahabadi, M.B.; Yerushalmi, L.; Haghighat, F. Estimation of greenhouse gas generation in wastewater treatment plants—Model development and application. Chemosphere 2010, 78, 1085–1092. [Google Scholar] [CrossRef] [Scilit]
- Wang, H.; Wu, Q.; Luo, H.; Zhao, Q.; Liu, B.; Si, Q.; Zheng, S.; Guo, W.; Ren, N. Automatic control and optimal operation for greenhouse gas mitigation in sustainable wastewater treatment plants: A review. Sci. Total Environ. 2023, 855, 158849. [Google Scholar]
- Komilis, D.; Barrena, R.; Grando, R.L.; Vogiatzi, V.; Sanchez, A.; Font, X. A state of the art literature review on anaerobic digestion of food waste: Influential operating parameters on methane yield. Rev. Environ. Sci. Bio−Technol. 2017, 16, 347–360. [Google Scholar] [CrossRef] [Scilit]
- Peng, L.; Ni, B.J.; Erler, D.; Ye, L.; Yuan, Z. The effect of dissolved oxygen on N2O production by ammonia−oxidizing bacteria in an enriched nitrifying sludge. Water Res. 2014, 66, 12–21. [Google Scholar] [CrossRef] [Scilit]
- Bunzel, K.; Kattwinkel, M.; Liess, M. Effects of organic pollutants from wastewater treatment plants on aquatic invertebrate communities. Water Res. 2013, 47, 597–606. [Google Scholar] [CrossRef] [Scilit]
- Ding, H.; Tang, M.; Huang, Q.; Yang, P.; Liu, Z.; Bi, X.; Nair, A.; Wang, X. Soft sensor enabled real−time chemical dosing control systems for wastewater treatment: From hybrid model to full−scale application. J. Water Process Eng. 2024, 63, 105431. [Google Scholar] [CrossRef] [Scilit]
- Sweetapple, C.; Fu, G.; Butler, D. Multi−objective optimisation of wastewater treatment plant control to reduce greenhouse gas emissions. Water Res. 2014, 55, 52–62. [Google Scholar] [CrossRef] [Scilit]
- Jiang, Y.; Ma, D.; Wang, J.; Xu, Q.; Fang, J.; Yue, Z. Regulatory of salinity on assembly of activated sludge microbial communities and nitrogen transformation potential in industrial plants of the lower Yangtze River basin. Environ. Res. 2024, 251, 118769. [Google Scholar] [CrossRef] [Scilit]
- Santín, I.; Meneses, M.; Pedret, C.; Barbu, M.; Vilanova, R. Nitrous oxide reduction in wastewater treatment plants by the regulation of the internal recirculation flow rate with a fuzzy controller. J. Water Process Eng. 2023, 53, 103802. [Google Scholar] [CrossRef] [Scilit]
- GB 18918-2002; Discharge Standard of Pollutants for Municipal Wastewater Treatment Plant. Ministry of Ecology and Environment of the People’s Republic of China: Beijing, China, 2002.
- Czepilel, P.; Crill, P.; Harriss, R. Nitrous oxide emissions from municipal wastewater treatment. Environ Sci Technol. 1995, 29, 2352–2356. [Google Scholar] [CrossRef] [Scilit]
- CJ 221-2005; Technical Specification for Municipal Solid Waste Composting Plants. China Architecture & Building Press: Beijing, China, 2005.
- Wang, Z.; Ji, T.; Zhu, Z.; Mei, P.; Guo, W.; Li, Y. Optimization of the anaerobic−anoxic−oxic process by integrating ASM2d with pareto analysis of variance and response surface methodology. Water 2022, 14, 940. [Google Scholar] [CrossRef] [Scilit]
- Obidike, L.; Madigoe, E. Development and optimization of sewage wastewater treatment program. Appl. Water Sci. 2021, 11, 187. [Google Scholar] [CrossRef] [Scilit]
- Tong, S.; Chen, D.; Jiang, X.; Xu, Z.; Liu, X.; Shen, J. Persulfate activation by Fe3O4−doped biochar synthesized from Fenton sludge and sewage sludge for enhanced 1−H−1,2,4−triazole degradation. Chem. Eng. J. 2023, 461, 142075. [Google Scholar] [CrossRef] [Scilit]
- Abyar, H.; Younesi, H.; Bahramifar, N.; Zinatizadeh, A.A. Biological CNP removal from meat−processing wastewater in an innovative high rate up−flow A2/O bioreactor. Chemosphere 2018, 213, 197–204. [Google Scholar] [CrossRef] [Scilit]
- Karimifard, S.; Moghaddam, M.R.A. Application of response surface methodology in physicochemical removal of dyes from wastewater: A critical review. Sci. Total Environ. 2018, 640, 772–797. [Google Scholar] [CrossRef] [Scilit]
- Li, P.; Wang, S.; Peng, Y.; Liu, Y.; He, J. The synergistic effects of dissolved oxygen and pH on N2O production in biological domestic wastewater treatment under nitrifying conditions. Environ. Technol. 2015, 36, 1623–1631. [Google Scholar] [CrossRef] [Scilit]
- Kemmou, L.; Amanatidou, E. Factors affecting nitrous oxide emissions from activated sludge wastewater treatment plants—A review. Resources 2023, 12, 114. [Google Scholar] [CrossRef] [Scilit]
- Li, L.; Ling, Y.; Wang, H.; Chu, Z.; Yan, G.; Li, Z.; Wu, T. N2O emission in partial nitritation−anammox process. Chin. Chem. Lett. 2020, 31, 28–38. [Google Scholar] [CrossRef] [Scilit]
- Li, P.; Wang, Y.; Liu, Y.; Wang, S.; Peng, Y. The effect of salinity on N2O emissions during domestic wastewater partial nitrification treatment in a sequencing batch reactor. Water 2023, 15, 3502. [Google Scholar] [CrossRef] [Scilit]
- Gong, Y.; Yue, Y.; Peng, Y. The effects of salinity on microbial activity and N2O release in anoxic−aerobic sequencing batch biofilm reactor. Chin. J. Process Eng. 2020, 20, 970–978. [Google Scholar]
- Xia, Y.; Jiang, X.; Guo, S.; Wang, Y.; Mu, Y.; Shen, J. Glycine betaine modulates extracellular polymeric substances to enhance microbial salinity tolerance. Environ. Sci. Ecotechnol. 2024, 20, 100406. [Google Scholar] [CrossRef] [Scilit]
- Zhang, Z.; Guo, Y.; Guo, L.; Hu, F.; Zhao, Y.; Jin, C.; She, Z.; Gao, M.; Wang, G. Elucidating salinity adaptation and shock loading on denitrification performance: Focusing on microbial community shift and carbon source evaluation. Bioresour. Technol. 2020, 305, 123030. [Google Scholar] [CrossRef] [Scilit]
- Zheng, N.; Yu, Y.; Li, Y.; Ge, C.; Chapman, S.J.; Yao, H. Can aged biochar offset soil greenhouse gas emissions from crop residue amendments in saline and non−saline soils under laboratory conditions? Sci. Total Environ. 2022, 806, 151256. [Google Scholar] [CrossRef] [Scilit]
- Li, M.; Wu, H.; Zhang, J.; Ngo, H.H.; Guo, W.; Kong, Q. Nitrogen removal and nitrous oxide emission in surface flow constructed wetlands for treating sewage treatment plant effluent: Effect of C/N ratios. Bioresour. Technol. 2017, 240, 157–164. [Google Scholar] [CrossRef] [Scilit]
- Mannina, G.; Ekama, G.A.; Capodici, M.; Cosenza, A.; Di Trapani, D.; Odegaard, H.; van Loosdrecht, M.M.C. Influence of carbon to nitrogen ratio on nitrous oxide emission in an Integrated Fixed Film Activated Sludge Membrane BioReactor plant. J. Clean. Prod. 2018, 176, 1078–1090. [Google Scholar] [CrossRef] [Scilit]
- Hu, H.; Ma, S.; Zhang, X.; Ren, H. Characteristics of dissolved organic nitrogen in effluent from a biological nitrogen removal process using sludge alkaline fermentation liquid as an external carbon source. Water Res. 2020, 176, 115741. [Google Scholar] [CrossRef] [Scilit] [PubMed]
- Gu, Y.; Li, Y.; Yuan, F.; Yang, Q. Optimization and control strategies of aeration in WWTPs: A review. J. Clean. Prod. 2023, 418, 138008. [Google Scholar] [CrossRef] [Scilit]
- Bey, M.; Hamidat, A.; Nacer, T. Eco−energetic feasibility study of using grid−connected photovoltaic system in wastewater treatment plant. Energy 2021, 216, 119217. [Google Scholar] [CrossRef] [Scilit]
- Nguyen, T.K.L.; Ngo, H.H.; Guo, W.; Chang, S.W.; Nguyen, D.D.; Nghiem, L.D.; Liu, Y.; Ni, B.; Hai, F.I. Insight into greenhouse gases emissions from the two popular treatment technologies in municipal wastewater treatment processes. Sci. Total Environ. 2019, 671, 1302–1313. [Google Scholar] [CrossRef] [Scilit]
- Liu, H.; Xiao, S.; Liu, W.; Wang, H.; Liu, Z.; Li, X.; Zhang, P.; Liu, J. Salinity decreases methane concentrations in Chinese lakes. Sci. Total Environ. 2024, 937, 173412. [Google Scholar] [CrossRef] [Scilit]
- Junior, A.E.S.; Duda, R.M.; de Oliveira, R.A. Improving the energy balance of ethanol industry with methane production from vinasse and molasses in two−stage anaerobic reactors. J. Clean. Prod. 2019, 238, 117577. [Google Scholar] [CrossRef] [Scilit]
- Yang, R.; Yuan, L.J.; Wang, R.; He, Z.X.; Chen, X. New insight on the regulation of N2O production in aerobic condition: An N2O metabolic perspective based on enzymatic analysis of nitrous oxide reductase. J. Water Process Eng. 2021, 41, 102090. [Google Scholar] [CrossRef] [Scilit]

Disclaimer/Publisher’s Note: The statements, opinions and data contained in all publications are solely those of the individual author(s) and contributor(s) and not of MDPI and/or the editor(s). MDPI and/or the editor(s) disclaim responsibility for any injury to people or property resulting from any ideas, methods, instructions or products referred to in the content. |
© 2025 by the authors. Licensee MDPI, Basel, Switzerland. This article is an open access article distributed under the terms and conditions of the Creative Commons Attribution (CC BY) license (https://creativecommons.org/licenses/by/4.0/).