


Abstract
Swimming pool owners worldwide face the challenging task of keeping their pool water balanced and free from contaminants. However, swimming pool water (SPW) quality management is complex with the countless processes and interactions of interlinked system variables. For example, contamination with sunscreen residues is inevitable as users apply sunscreen to protect their skin from damaging ultraviolet (UV) radiation. Nanoparticulate titanium dioxide (nano-TiO2) is one such residues that have received criticism due to potential human health and environmental risks. Despite ongoing research studies, management strategies of nano-TiO2 in swimming pools are still limited. Therefore, this paper focuses on developing a multi-method approach for identifying and understanding interdependencies between TiO2 particles and an aquatic environment such as a swimming pool. Given the complexity of the system to be assessed, the authors utilise a systems approach by integrating cross-matrix multiplication (MICMAC) and Systems Thinking techniques. The developed conceptual model visually depicts the complex system, which provides users with a basic understanding of swimming pool chemistry, displaying the numerous cause-and-effect relationships and enabling users to identify leverage points that can effectively change the dynamics of the system. Such systems-level understanding, and actions will help to manage nano-TiO2 levels in an efficient manner. The novelty of this paper is the proposed methodology, which uses a systems approach to conceptualise the complex interactions of contaminants in swimming pools and important pathways to elevated contaminant levels.
1. Introduction
Public and private swimming pools are widely used across the world as swimming is a popular activity due to its health benefits; pools are also essential for practicing other water sports like surfing, snorkelling, or canoeing [1,2,3]. For years, the number of swimming pools installed globally has been on the rise [4], especially since the beginning of the coronavirus pandemic in 2019 [5]. This upward trend has particularly been observed in the private residential swimming pool market in countries such as Australia [6], the USA [5,7], and in the European Union [5,8].
Swimming pool water (SPW) management is complex and requires trained personnel to ensure their compliance with health and safety standards [9,10]. While public swimming pools are well regulated and professionally monitored, this is not the case for private residential swimming pools, which are often poorly maintained due to maintenance costs, a lack of understanding and knowledge, and the owners’ laxity. As a result, the risk of SPW contamination is increased and so is the health risk to pool users [11]. Contaminants can be bather-derived (body fluids, hair, skin, personal care products), maintenance-derived (disinfectants, disinfection by-products, algicides, chemicals to adjust the SPW chemistry) or originate from environmental sources (bird or other animal excretions, dust, soil, leaves, grass) [12,13].
Potential health risks arising from SPW contamination have widely been investigated in the literature [14,15]. However, most studies have focussed on monitoring the levels of common contaminants such as body fluids [16,17], disinfectants and disinfection by-products [18,19,20,21,22], whereas information regarding the SPW contamination by personal care products is rather scarce. Only a few researchers have examined the occurrence and fate of selected personal care products including preservatives [20,23], insect repellents [24], as well as organic [20,25] and inorganic UV filters [26,27,28]. Yet even these studies focus on explicit fragments of the whole picture, for example, by measuring the total concentration of the contaminant, and fail to identify or account for the complex interplay of factors that may influence the contaminant’s fate.
Nanoparticulate titanium dioxide (nano-TiO2) is commonly used as an inorganic UV filter in sunscreens [29,30], but can also be found in a range of diverse, new and established applications such as photovoltaics, batteries, phytoremediation and photocatalysts, drug delivery systems, self-cleaning and self-sterilising coatings, or as colorant in paint and plastics [31,32]. Recently, debate about the safe usage of nano-TiO2 has resurfaced with the European Food Safety Authority (EFSA) re-classifying TiO2 as no longer safe as a food additive (E171) [33]. Nonetheless, nano-TiO2 is still allowed up to a maximum concentration of 25% in sunscreens [34], even though the risks to humans and the environment following nano-TiO2 exposure hare not yet been conclusively assessed [35,36].
Previous research has shown that nano-TiO2 can be found in both natural (e.g., estuarial waterways, freshwater bodies) [37,38,39,40] and man-made (e.g., swimming pools) [27,28] aquatic environments. However, the challenge of differentiating engineered nano-TiO2 from naturally occurring particles in nature remains [41]. One way to approach this limitation is by investigating the fate and behaviour of nano-TiO2 in a relatively small and enclosed environment such as a swimming pool. In particular, private residential swimming pools provide a suitable setting for investigating the variety of interactions occurring between the pool users’ behaviour (pool and sunscreen usage), nano-TiO2 and the chosen ecological system.
Similar to natural systems, this socio-ecological system also comprises many interacting and interdependent factors that change over time. Accordingly, in order to capture these interactions and conceptualise such systems meaningfully, we need to employ tools and techniques that enable closed, interdependent parametrisation of specific environments that are also adaptable and expandable. In this context, a systems approach offers a suitable platform to combine multiple tools and techniques for capturing this complexity [42,43]. Compared to other modelling techniques, a systems approach has clear advantages for providing a holistic understanding of the nano-TiO2 fate in the environment.
In light of the above discussion, the overarching goal of this research is to develop an integrated conceptual framework to capture the complex dynamics of the interactions between sunscreen derived nano-TiO2 and SPW using multi-method systems approaches, namely Systems Thinking (ST) [44,45] and Matrice d’Impacts Croisés Multiplication Appliquée à un Classement (MICMAC; Cross-Impact Matrix Multiplication Applied to Classification) [46,47].
2. Method
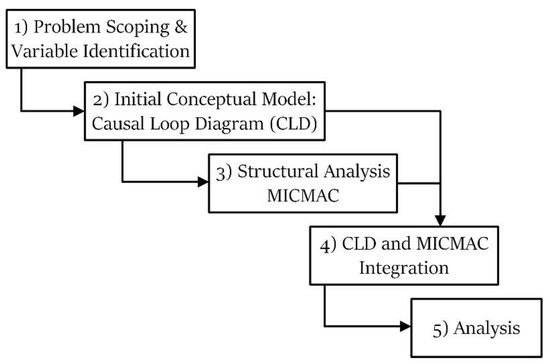
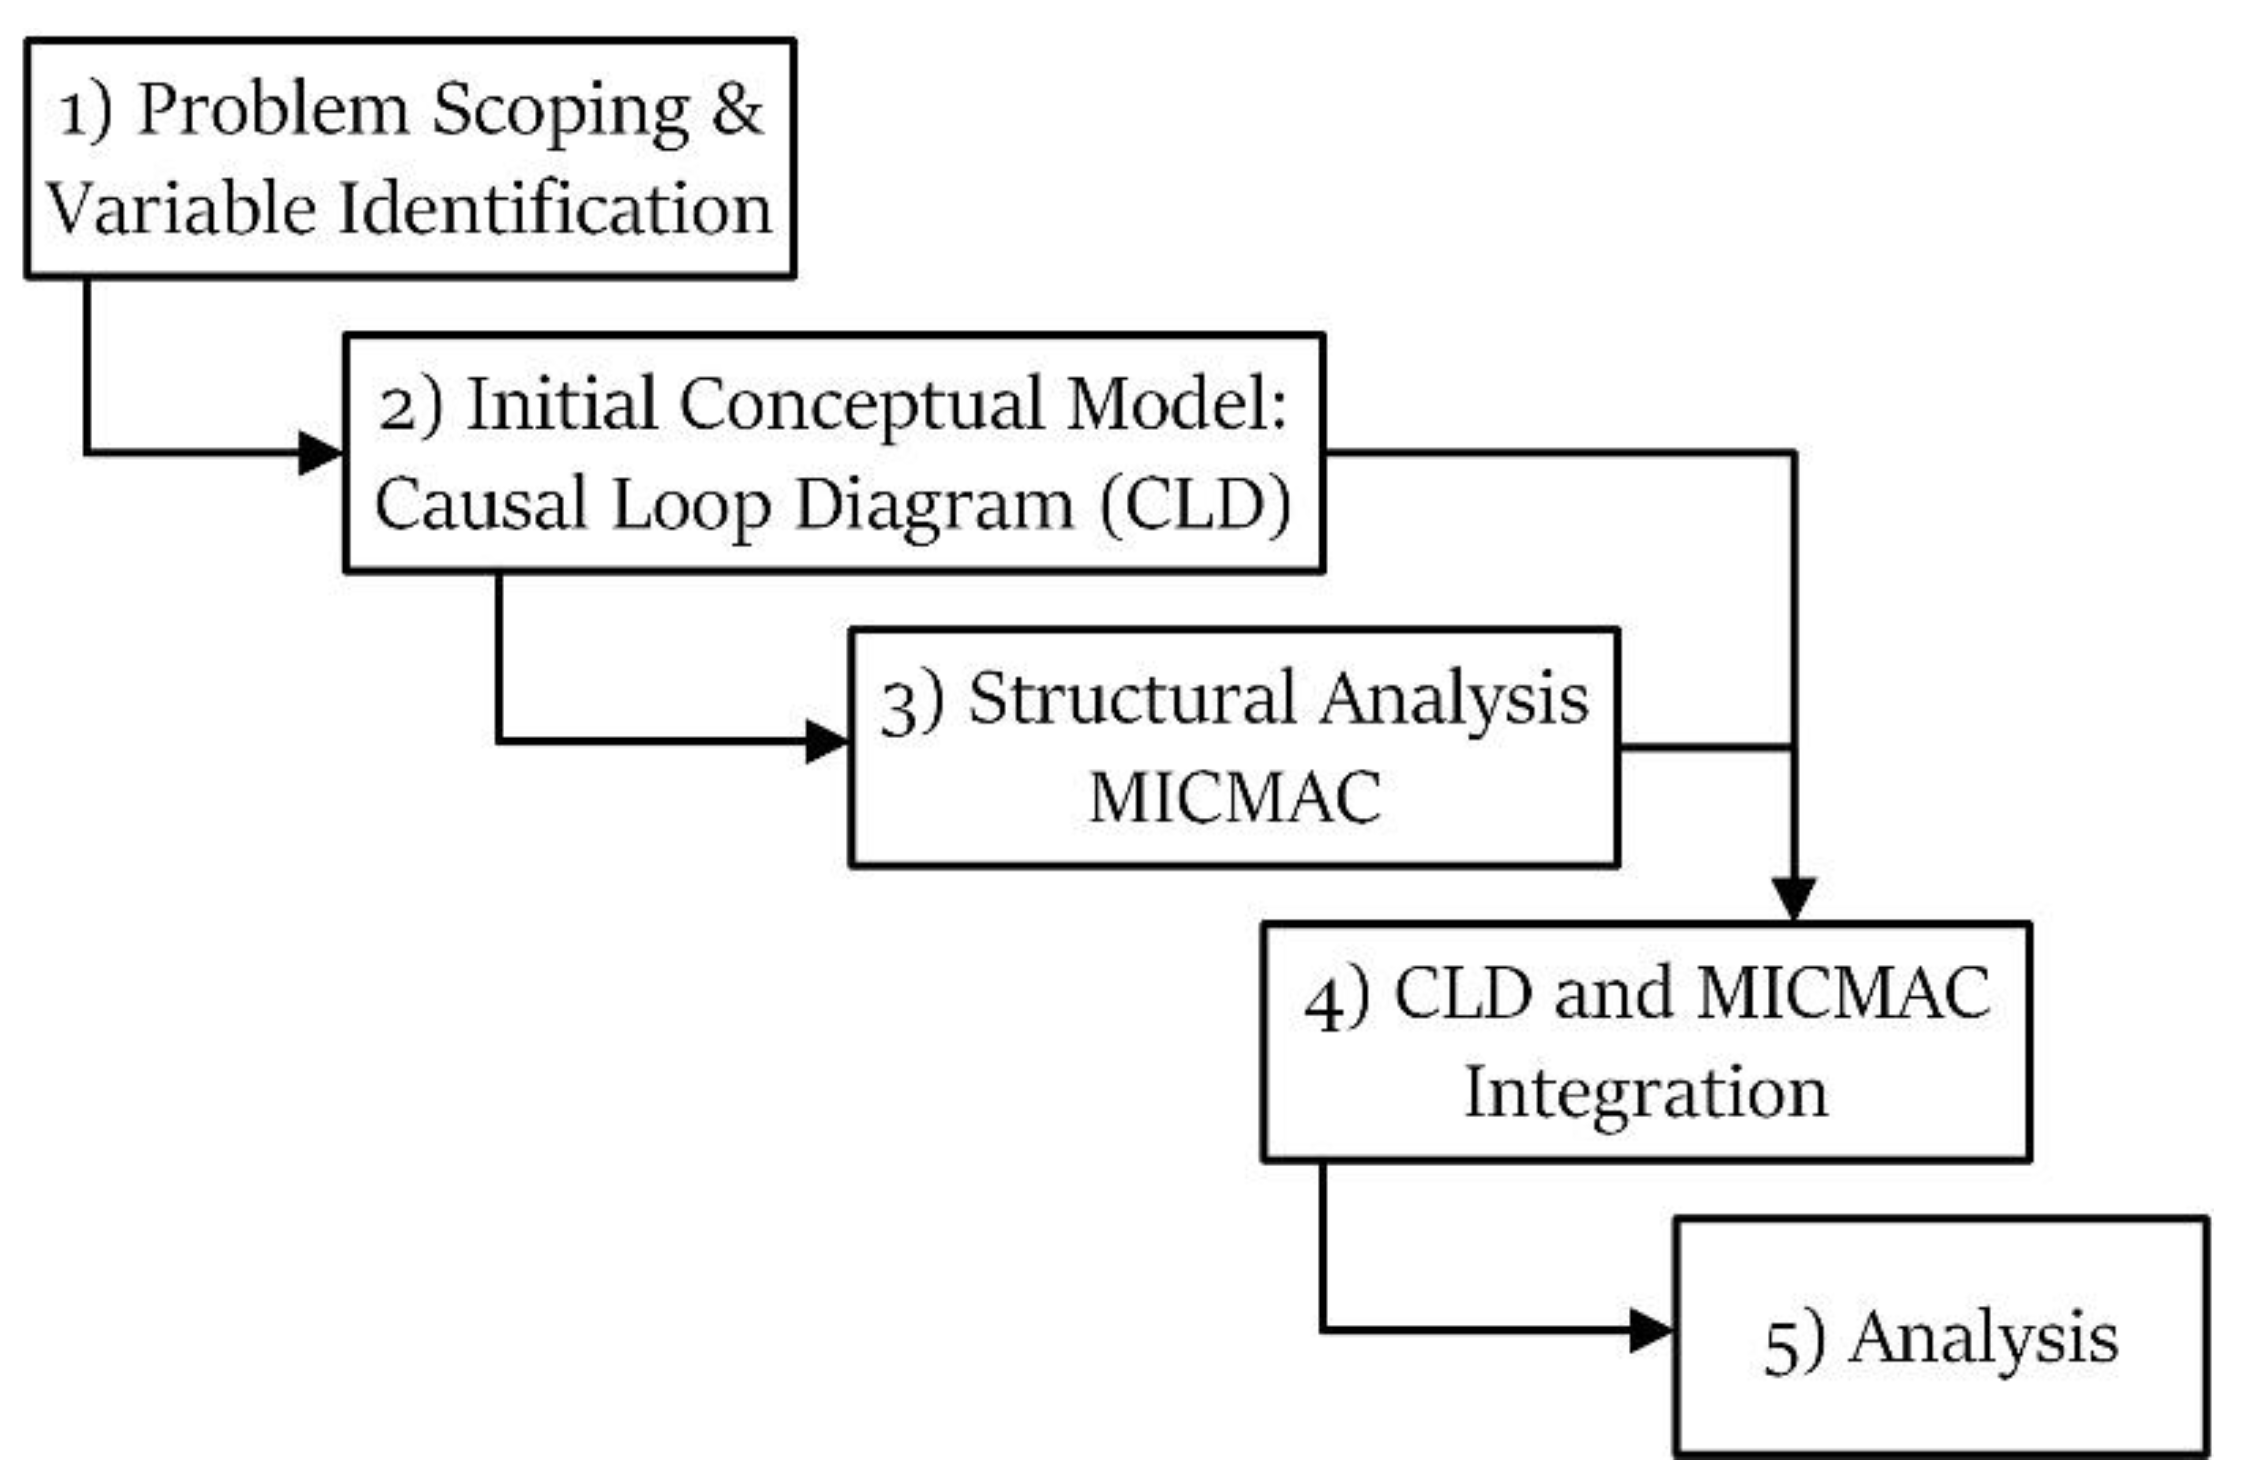
As discussed above, socio-ecological systems are complex systems characterised by dynamic and nonlinear interdependencies between their social and ecological components. That is, a change in any system component triggers a chain of effects between related variables. To capture the complexity of such systems, in this research, a multi-methods systems approach was selected to tackle the problem in hand. Figure 1 shows the framework development steps using two systems approach techniques, ST and MICMAC. These steps are discussed in the following sections in greater detail.
Figure 1.
A multi-method systems approach development framework.
While there is no prescribed recipe for successful modelling, this research paper adopts an approach based on some commonly used modelling steps described by Sterman [48] and Voinov [49]. As the statistician George Box famously noted, the important question is not whether models are right or wrong but whether they are illuminating and useful. Therefore, it should be expected that this conceptual framework and any model subsequently built based on this framework can be modified over time as knowledge of the system improves.
2.1. Problem Scoping and Variable Identification
The first step in developing a conceptual framework is to define the overall research objective, thus, characterising the purpose of the model. The second step involves identifying important variables through an extensive literature review and expert workshops. Primary variables are key factors that describe the problem and are critical to telling the story. Further, it is necessary to identify the causal chains of secondary, interacting variables for each primary influencing variable. In this study, the primary variables were identified by individual or limited interdependencies reported in the literature.
2.2. Initial Conceptual Model: Causal Loop Diagram (CLD)
CLDs, or feedback loop diagrams, are a part of the ST toolbox and help to visualise the complex structure of a system. Mapping the formerly identified system variables and their causal links helps to recognise the underlying structure of the system and identify leverage points that enable efficient and effective interventions [50]. The aim when creating a CLD is not necessarily to include all relevant variables that tell the story but rather to reconsider including variables that may not change or change very slowly relative to the defined time horizon of the viewed system, or those that are irrelevant to the overall objective of the system [51], thereby simplifying the causal relationships to key variables.” Conversely, excessive omission of variables may result in the misrepresentation of relationships and lack of clarity to the observer [48]. Therefore, when constructing a CLD, the level of detail, physical and temporal offsets or boundaries have to be carefully considered and selectively defined [52].
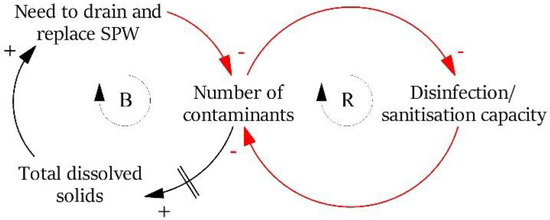
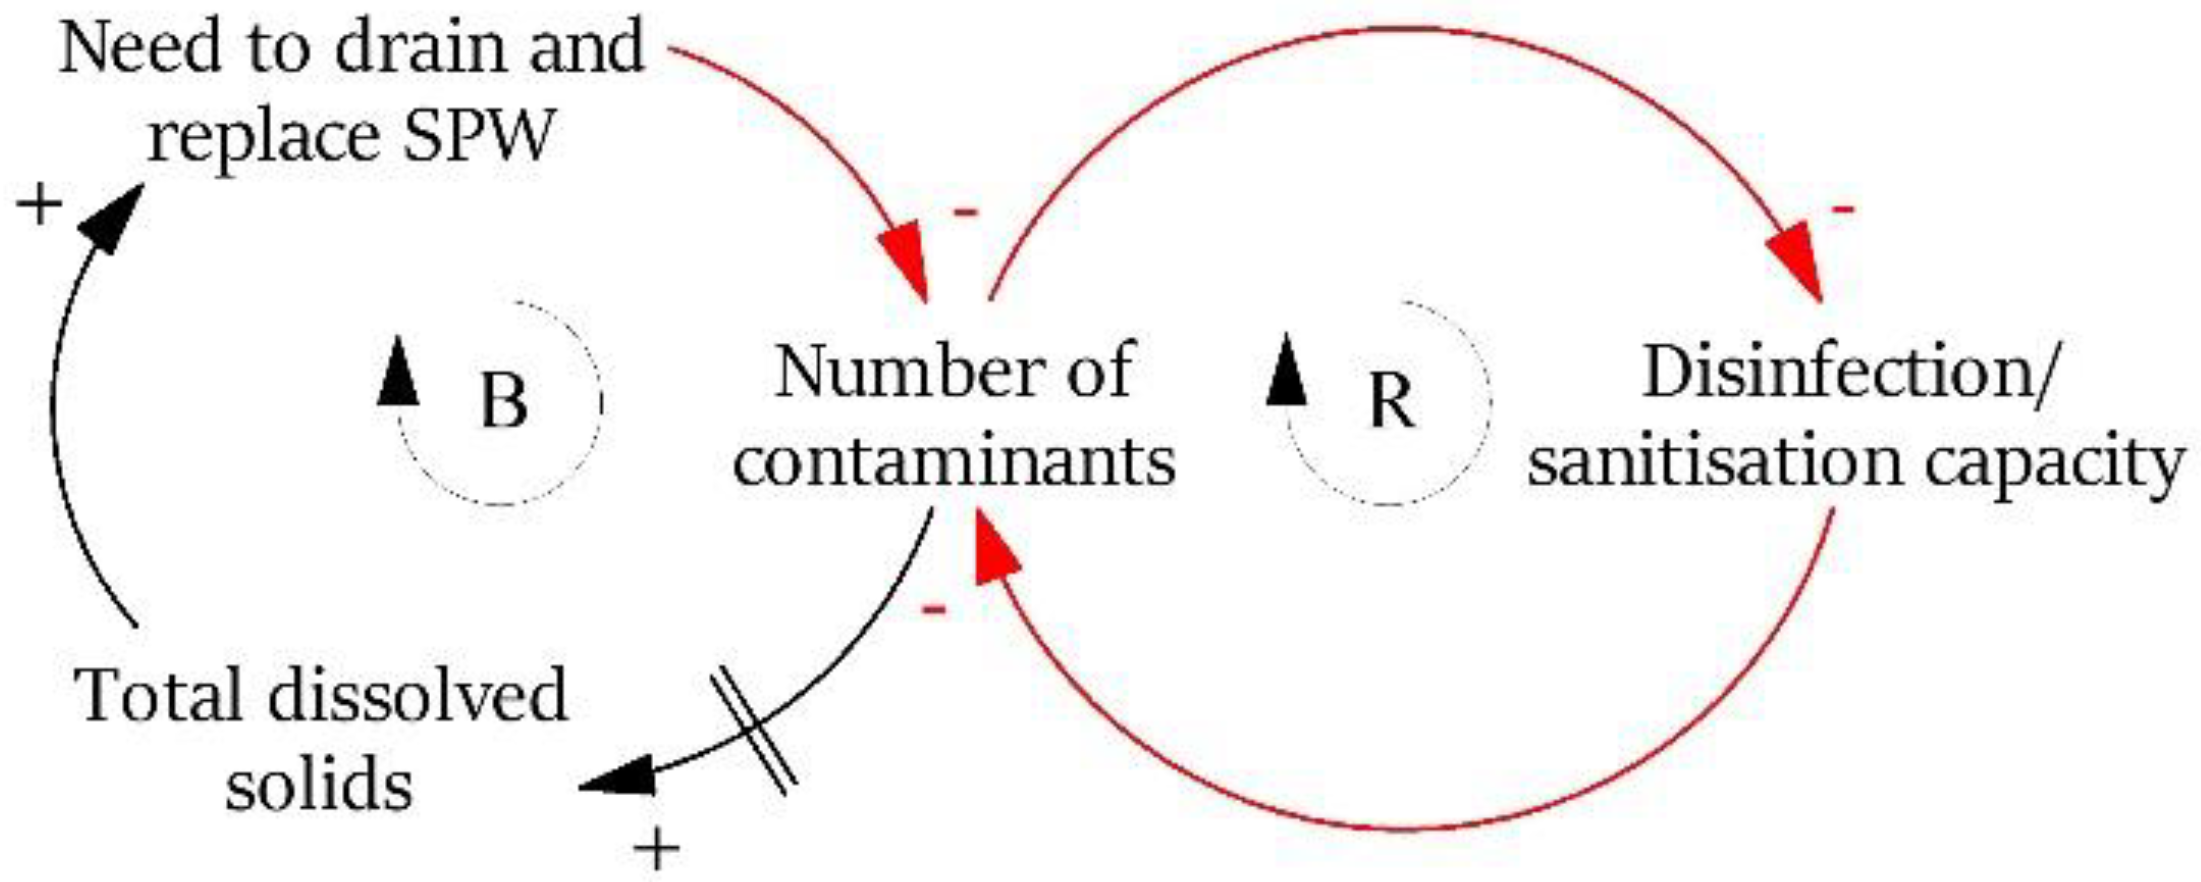
As shown in Figure 2, causal relations are illustrated in a CLD as arrows between variables, which can either be positive (+) or negative (−). A positive link between cause-and-effect stands for a change in the same direction, which means, if the cause increases (or decreases), the effect increases (or decreases) further to what it would have been [48]. For example, as illustrated in Figure 2, “the higher (or lower) the number of contaminants, the higher (or lower) the concentration of total dissolved solids in the SPW” or “the higher (or lower) the concentration of total dissolved solids in the SPW, the more (or less) the necessity to drain and replace the SPW”. In contrast, a negative link represents a change in the opposite direction. Referring to Figure 2, “the more (or less) the pool owner drains and replaces the SPW, the lower (or higher) the number of contaminants”, or “the higher (or lower) the capacity to disinfect or sanitise the SPW, the lower (or higher) the number of contaminants”. In some cases, there might be a time delay between cause-and-effect, graphically shown as “//”. For example, some contaminants like by-products from intentionally added pool chemicals, bather-introduced substances, or debris, degrade slowly; thus, they gradually add to the level of total dissolved solids. Delays are important to consider as they create a complex dynamic behaviour that is often counter-intuitive and difficult to solve [44,53]. For example, adjusting the chemicals in a pool is challenging as some substances take time to dissolve or react with other constituents, or simply require time to be evenly distributed in the pool.
Figure 2.
Example CLD with a negative (balancing, B) and a positive (reinforcing, R) feedback loop, and a delay.
If a causal relation retrospectively affects the variable of origin, it reflects a closed sequence of cause-and-effect, called a feedback loop [54]. Feedback loops can either be positive (reinforcing, R)or negative (balancing, B) where a positive feedback amplifies the direction of change and a negative feedback constrains or self-corrects change in the system [55]. Each feedback loop influences the overall behaviour of the system, which underlines the importance of identifying feedback to understand the system as a whole [56].
2.3. Structural Analysis (MICMAC)
Often, it is convenient to adopt a somewhat informal and haphazard approach to formulating a conceptual framework of systems. The problem with this approach is that it tends to focus on variables and connections with which we are already most familiar. To take a more rigorous approach to the model conceptualisation process, tools like MICMAC are used allowing a more systematic formulation and analysis of a system. Such structural analysis ranks the identified variables or variable groups based on their overall importance (direct and indirect influence and dependence) in the system and determines the strength of their interdependencies [57].
The MICMAC analysis includes the three steps: (1) listing identified primary and secondary variables; (2) describing the relationships between variables by populating a dual entry structural analysis matrix; and (3) identifying key variables that are essential to formulating a conceptual system’s framework [58,59].
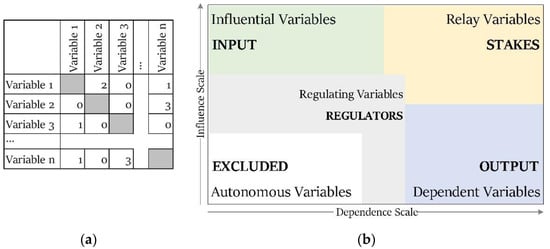
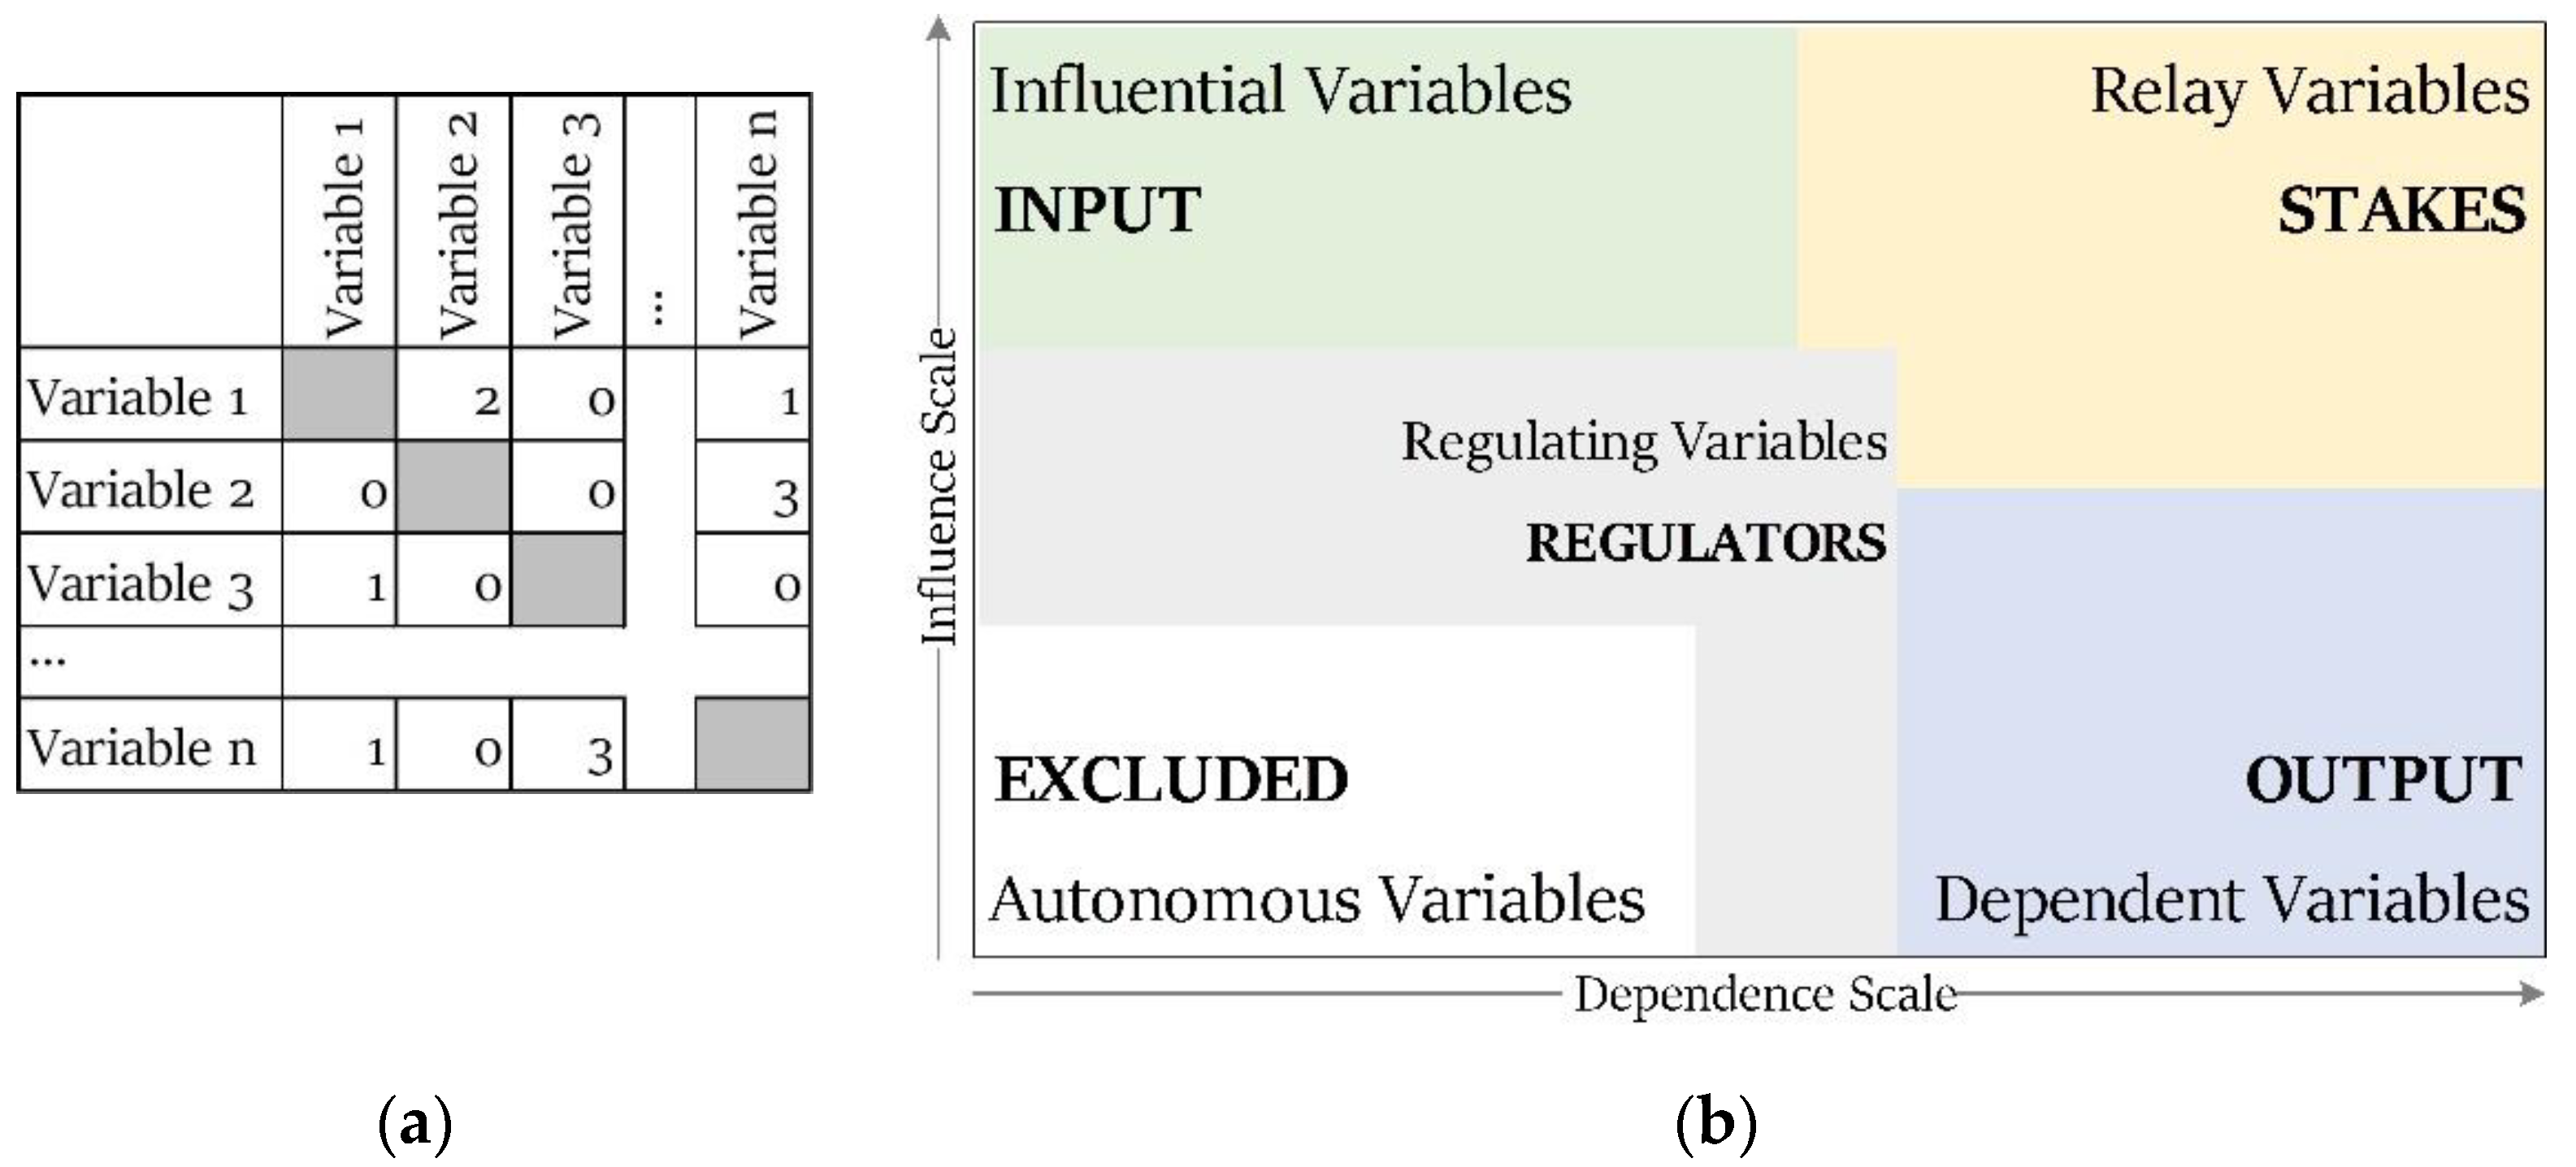
The aim of the first step is to convert the identified variables from the initial conceptual model (CLD) into a matrix with horizontal and vertical data entries, as exemplarily shown in Figure 3a. In the second step, expert consultations are conducted to quantify the direct relationships between variables by populating a matrix of direct influence (MDI). To assess the direct relationship between a pair of variables, the question to be asked is whether, for example, variable 2 (column) is directly influenced by variable 1 (row). The relationship assessment includes four intensity levels: no influence (0); weak influence (1); moderate influence (2); and strong influence (3), see Figure 3a. The purpose of this process is to rank each variable or variable group based on their influences and dependencies, which aids in identifying the most important variables of the system.
Figure 3.
(a) Schematic illustration of a matrix of direct influence; (b) MICMAC influence-dependence map.
In the third and final step, the MICMAC analysis not only identifies the key variables, but also creates (direct and indirect) influence-dependence maps [60] that place the variables into a quadrant depending on their overall influence-dependence rating. The variables are sorted into four categories, as shown in Figure 3b: (1) Influential (input) variables are variables that show a minor dependence but a strong influence on other variables and the system as a whole when changing. Therefore, variables in this group are important to consider when discussing systems’ leverage points and should be included when developing the system’s framework. (2) Relay variables or stakes are variables that are both highly influential on the system and also highly dependent on other variables. These variables are considered unstable or dynamic variables as any change may cause feedback through other variables [57]. Hence, they are also referred to as linkage variables. (3) Dependent variables represent the system’s output, which means they are variables that are highly influenced by other variables and the system. (4) Autonomous variables are neither influential nor dependent and are not controlled by the dynamics of the system. These variables are usually excluded from further analysis as they have comparatively weak and limited systems links. Variables that are sitting at the cross-sections of the four quadrants are regarded as regulating variables or regulators. These variables cover the averagely influential and/or dependent variables and can control the system to a certain degree but have an overall lower priority in the system [58].
If unsure whether to include or exclude a variable, comparing the variables’ placement in the direct and indirect influence-dependence maps may provide a remedy. Overall, a MICMAC analysis helps to investigate the relationships between the variables within a system in a structured manner, and additionally, reduces inherent biases that can occur when reflecting on the system as a whole [59].
2.4. CLD and MICMAC Integration
Both techniques, CLD and MICMAC, have their weaknesses and strengths. While a CLD is a useful tool to tell the system’s story and sufficiently displays the causal relationships and interdependencies between system variables, CLDs fail to clearly represent the strength between causal links and do not show the extent to which a variable is important in the system. On the other hand, MICMAC has strong capabilities to determine key variables and quantify the strength of their interactions. However, a significant drawback of this technique is the inability to explicitly show causal links and polarity. Therefore, combining these two techniques provides a more powerful method to draw a clearer picture of the system. The benefit of this integration is that the ‘final CLD’ includes the strength and polarity between links and reveals the categorisation of the variables based on the influence-dependence map.
2.5. Analysis
The final step of this multi-method systems approach is to identify the leverage points and relevant feedback loops of the system. As D. Meadows stated, ‘Before you disturb the system in any way, watch how it behaves.’ ([44], p. 170). Accordingly, leverage points that influence the system effectively can only be found when the system’s behaviour and its underlying structure are understood. As a result, strategies to implement the interventions can be discussed and recommendations made.
3. Results
3.1. Problem Scoping and Variable Identification
The overarching goal of this research was to map the feedback structure of a system that illustrates the causal relations of released nano-TiO2 from sunscreens in residential private outdoor swimming pools. Primary and secondary variables were identified through a comprehensive literature review [61] and later verified in a workshop with experts. The selected variables cover all aspects that are essential for telling the story of how nano-TiO2 enters, behaves, and potentially leaves private residential outdoor swimming pools. This includes factors such as nano-TiO2 and sunscreen properties, human behaviour, pool operating and monitoring parameters, external environmental factors, or the swimming pool chemistry. A detailed variable description can be found in Appendix A, Table A1.
3.2. Initial Conceptual Model: Causal Loop Diagram (CLD)
The initial conceptual model consists of three interlinked CLDs, namely (1) essential swimming pool chemistry, (2) supplementary swimming pool chemistry, and (3) TiO2 concentration in SPW. The purpose of developing three CLDs, rather than one, combined CLD, was to simplify the modelling process without losing the required level of detail necessary to understand the logic of the causal relations.
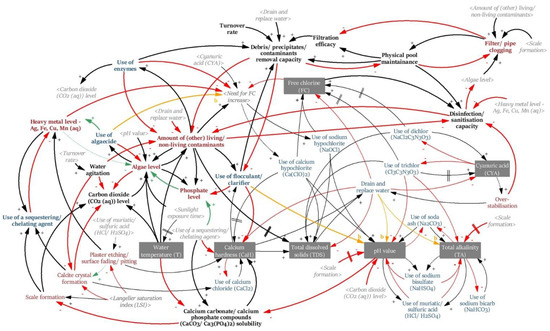
The first CLD depicts the components that typically make up private residential outdoor swimming pools (Figure 4), as the behaviour and fate of nano-TiO2 are significantly governed by the properties of the aqueous environment to which they are exposed. The commonly used Langelier Saturation Index (LSI) that assesses the water balance in swimming pools served as a core component of the CLD. The LSI comprises of five factors (see grey boxes in Figure 4): (1) pH value; (2) water temperature (T); (3) calcium hardness (CaH); (4) total alkalinity (TA); (5) total dissolved solids (TDS); and a correction factor that accounts for the presence of cyanuric acid (CYA) in outdoor pools [62]. The LSI is also expressed as a formula that links the five factors:
LSI = pH + T + CaH + [TA − (CYA correction factor @ pH)] − TDS
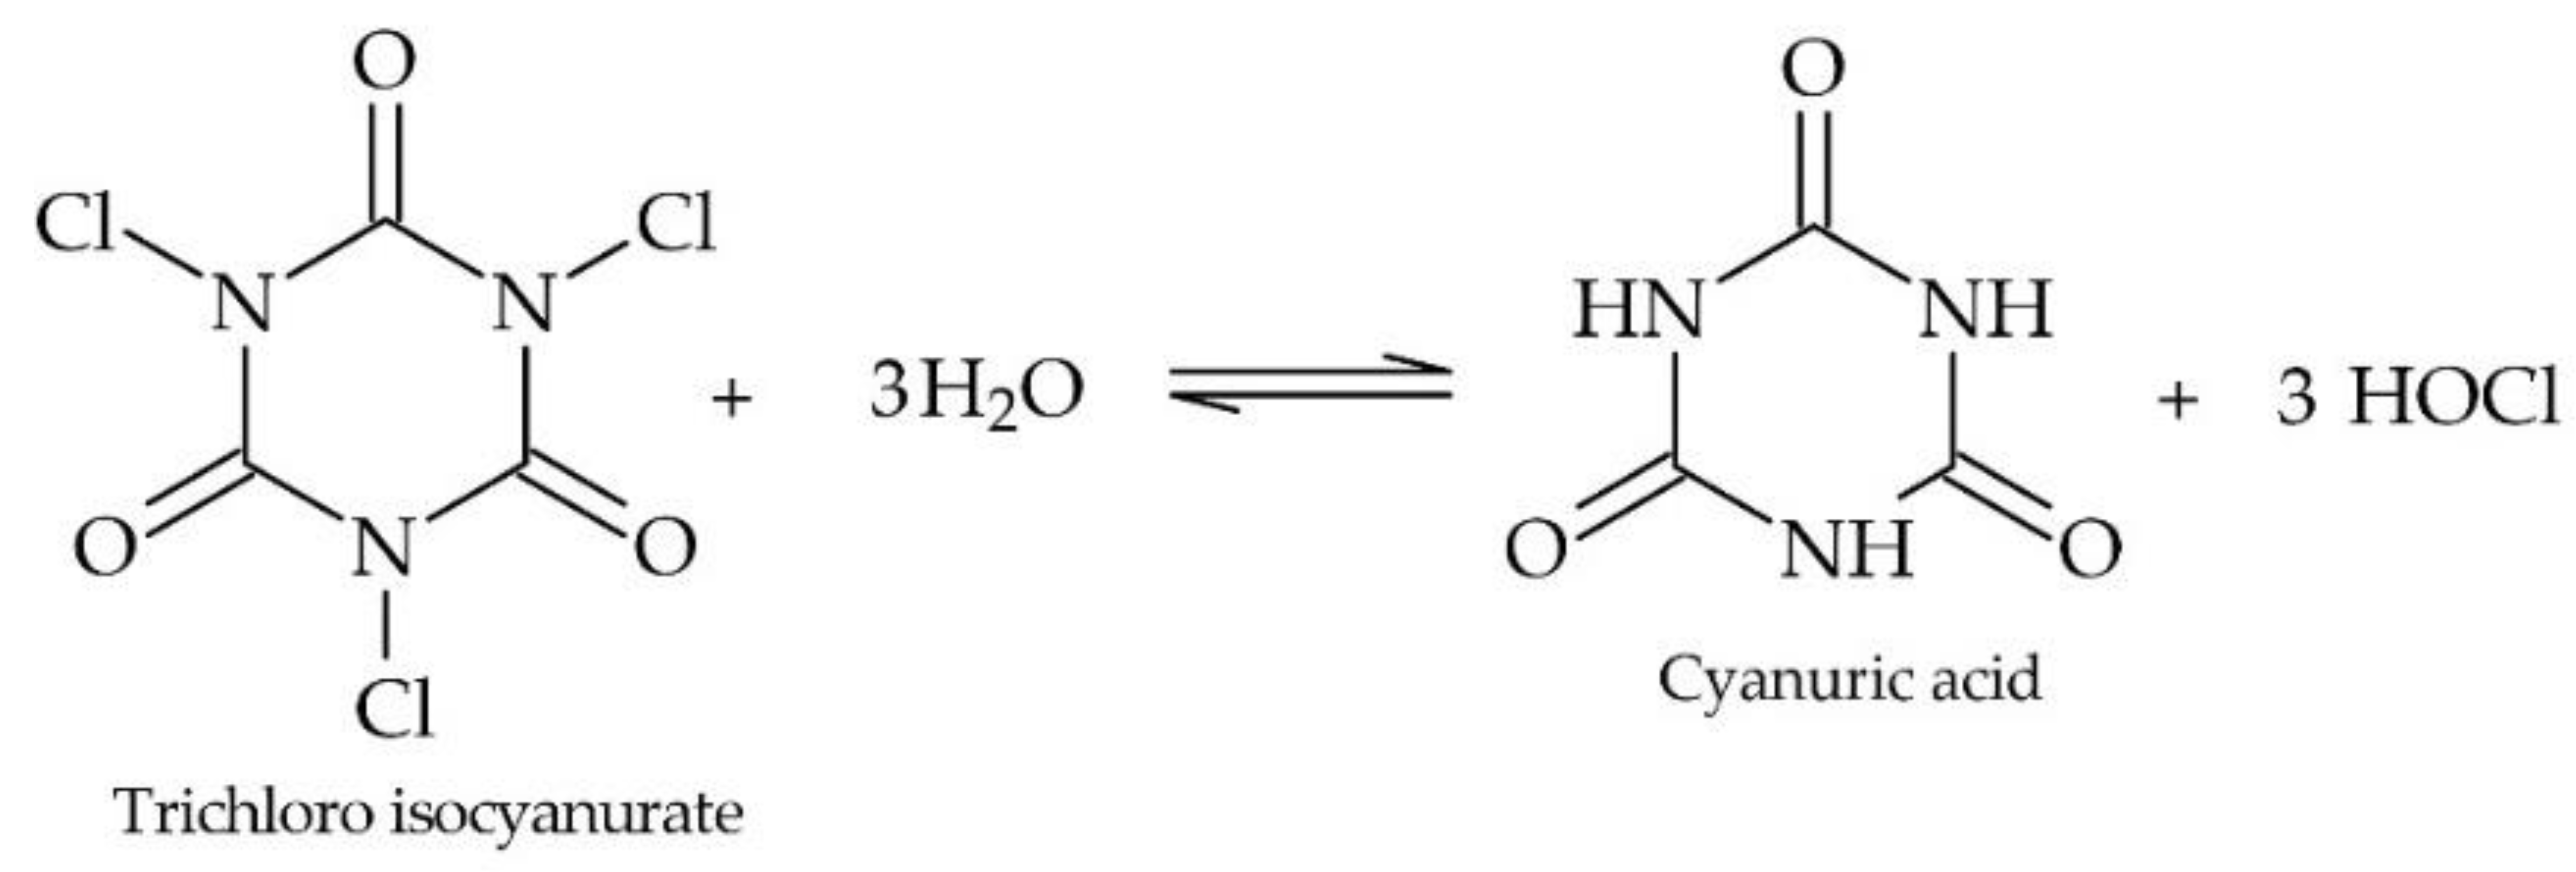
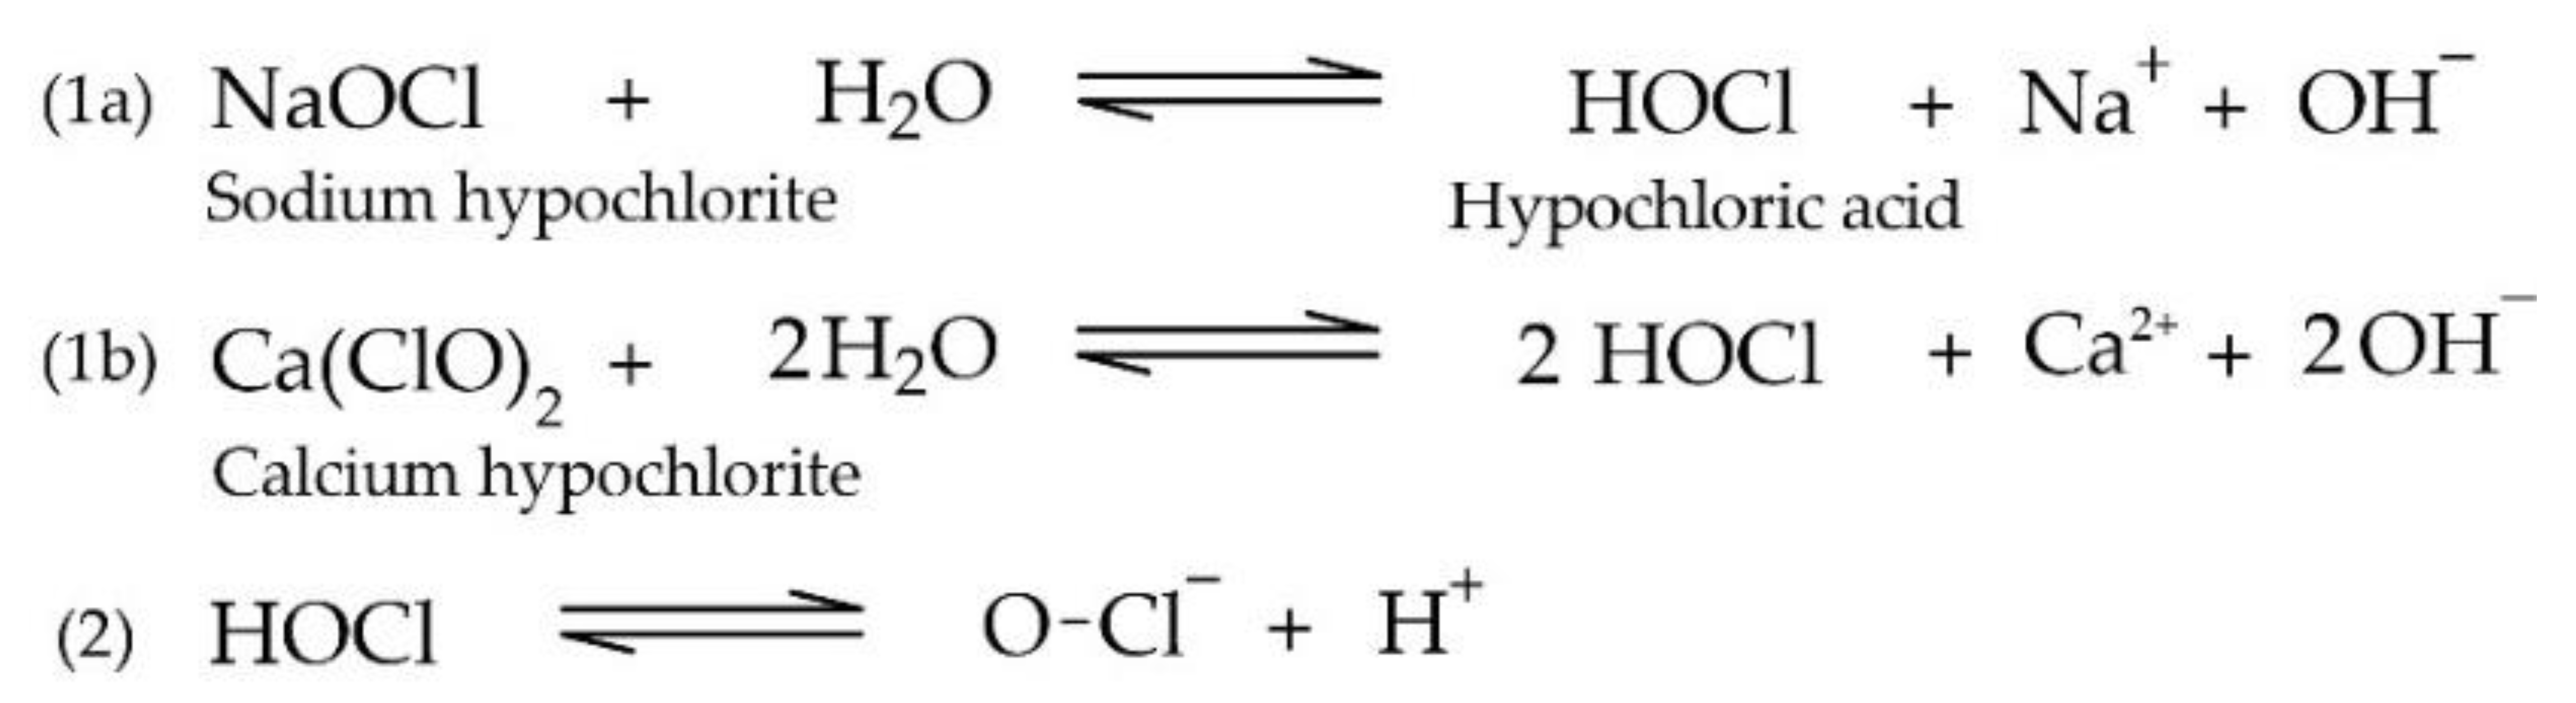
Even though there are numerical values assigned to the factors, the LSI formula was sufficient to provide the polarity of the causal links between the factors and the LSI. The pool water is considered chemically balanced if the LSI is (close to) zero [9]. As shown in Figure 4, below or above the target LSI, the disequilibrium can result in calcite crystal formation, plaster etching, surface fading or calcium carbonate (CaCO3) scale formation [62,63]. Therefore, the primary goal for pool operators is to keep the LSI close to its target of zero and thus prevent irreparable pool damage or significant (time and money) costs in pool maintenance. Additional chemical equations are included in Appendix A, Table A1.
Figure 4.
CLD 1: Essential swimming pool chemistry. Colour code (variables): red—SP(W) issues, green—desired state of variable, blue—SP(W) solutions, action to achieve a desired state, grey/italic—‘shadow variable’, i.e., a variable that is described elsewhere in the CLD; and (arrows): yellow (b)—both directional (+ or −). Dotted—link may accidentally be established, but occurrence is unlikely.
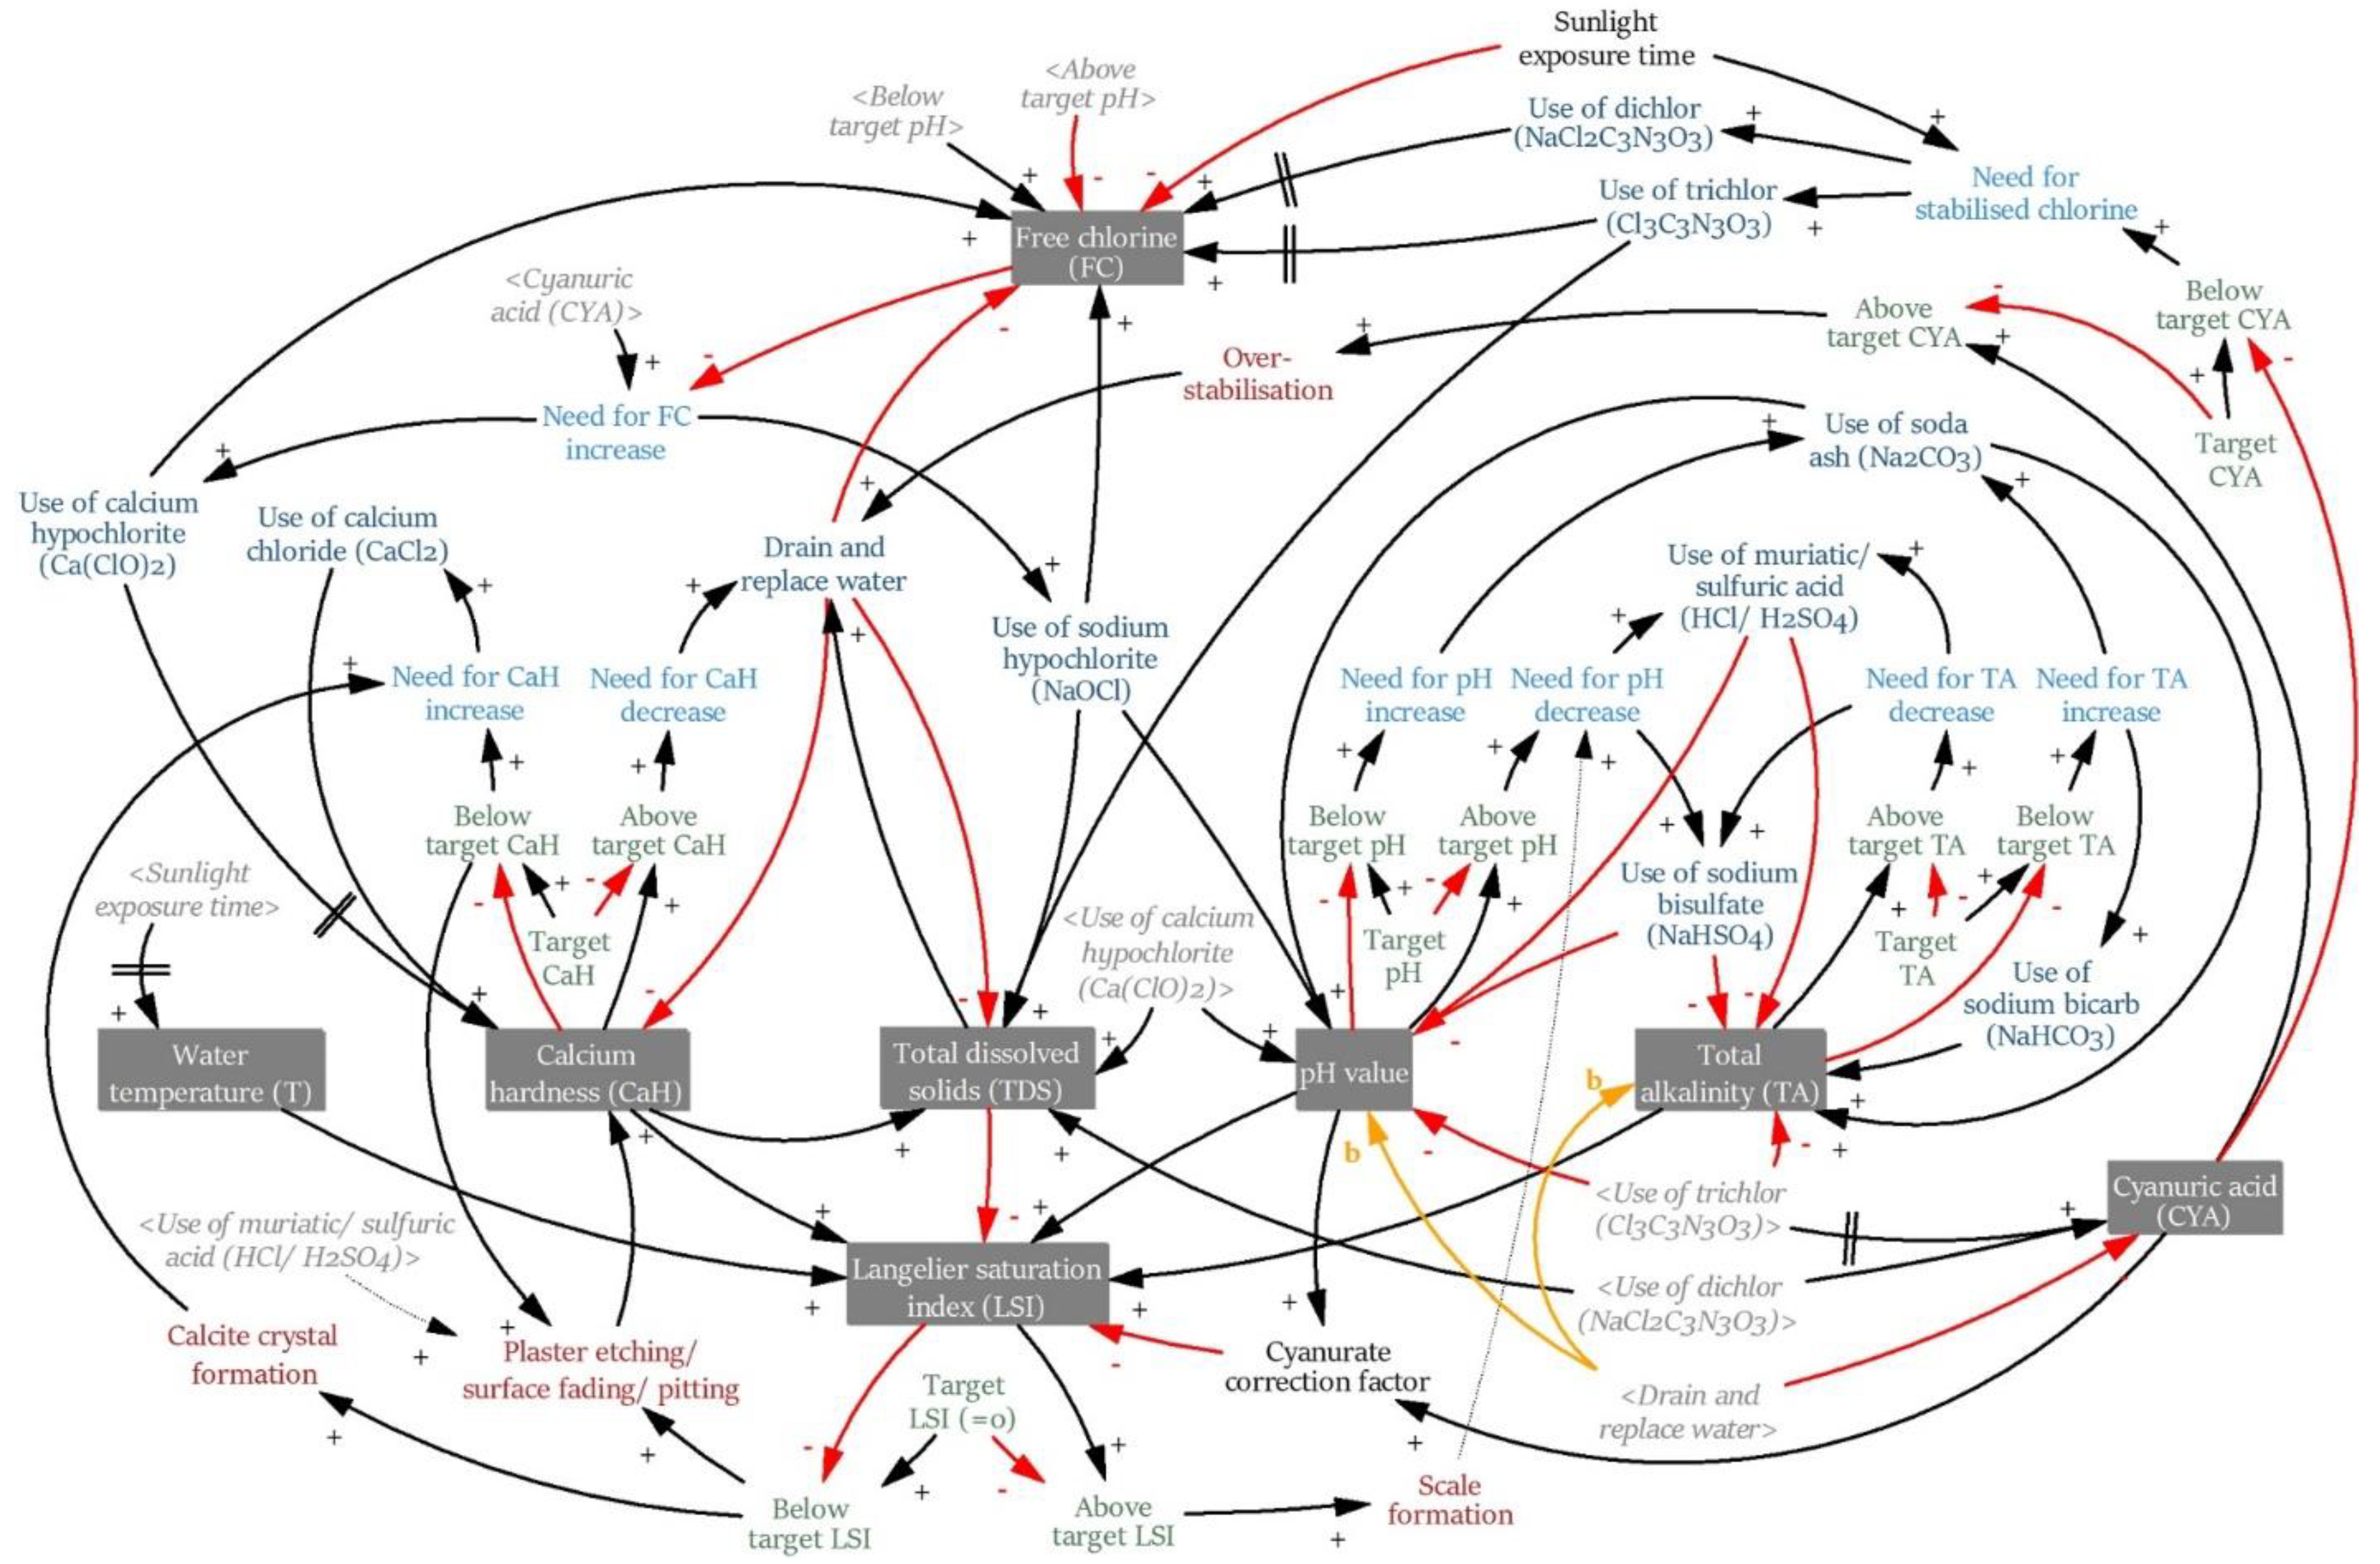
The approach to maintaining a balanced LSI may differ, but a good starting point is to keep the controllable factors such as CaH, pH value, or TA, close to their desired ranges (see Figure 4, targets, below and above targets). The following example illustrates their importance. Outdoor swimming pools require CYA (cyanuric acid (CYA)) as a chlorine stabiliser to prevent the photolysis of hypochlorite (OCl−) and hypochlorous acid (HOCl) [64]. This is achieved by the formation of chlorinated isocyanurates, which are impervious to photolysis [63]. With sunlight (sunlight exposure time) breaking down the free chlorine, the chlorinated isocyanurates (use of trichlor, dichlor) release chlorine over time to compensate for the loss of free chlorine [65]. A CYA concentration range of 15−50 ppm (target CYA) is considered ideal for stabilising free chlorine [66,67]. However, at the same time, using CYA as a chlorine stabiliser substantially reduces the oxidising and sanitising capacity of chlorine [68]. The free chlorine concentration has to be increased to counterbalance the low effectiveness of chlorine when used in conjunction with CYA [69]. Even so, once the CYA level has reached 70 ppm (above target CYA), adding more free chlorine has a negligible effect on the disinfection and sanitisation capability [70]. In other words, once the drawbacks of the reduced disinfection capability of chlorine outweigh the benefits of stabilising chlorine, the swimming pool is considered over-stabilised (over-stabilisation) [71]. The most economical way to fix over-stabilisation is by draining and replacing the SPW (drain and replace water), hence lowering the high CYA level [72].
Mapping the entire “web” of effects resulting from variable adjustments in a CLD assists all levels of users (from researchers to pool service technicians) to understand the complexity with ease compared to traditional explanations based on chemical equations. In this regard, using a CLD does not replace the traditional approach; on the contrary, it plays a complementary and supporting role when tackling the challenge of regulating the complex pool chemistry.
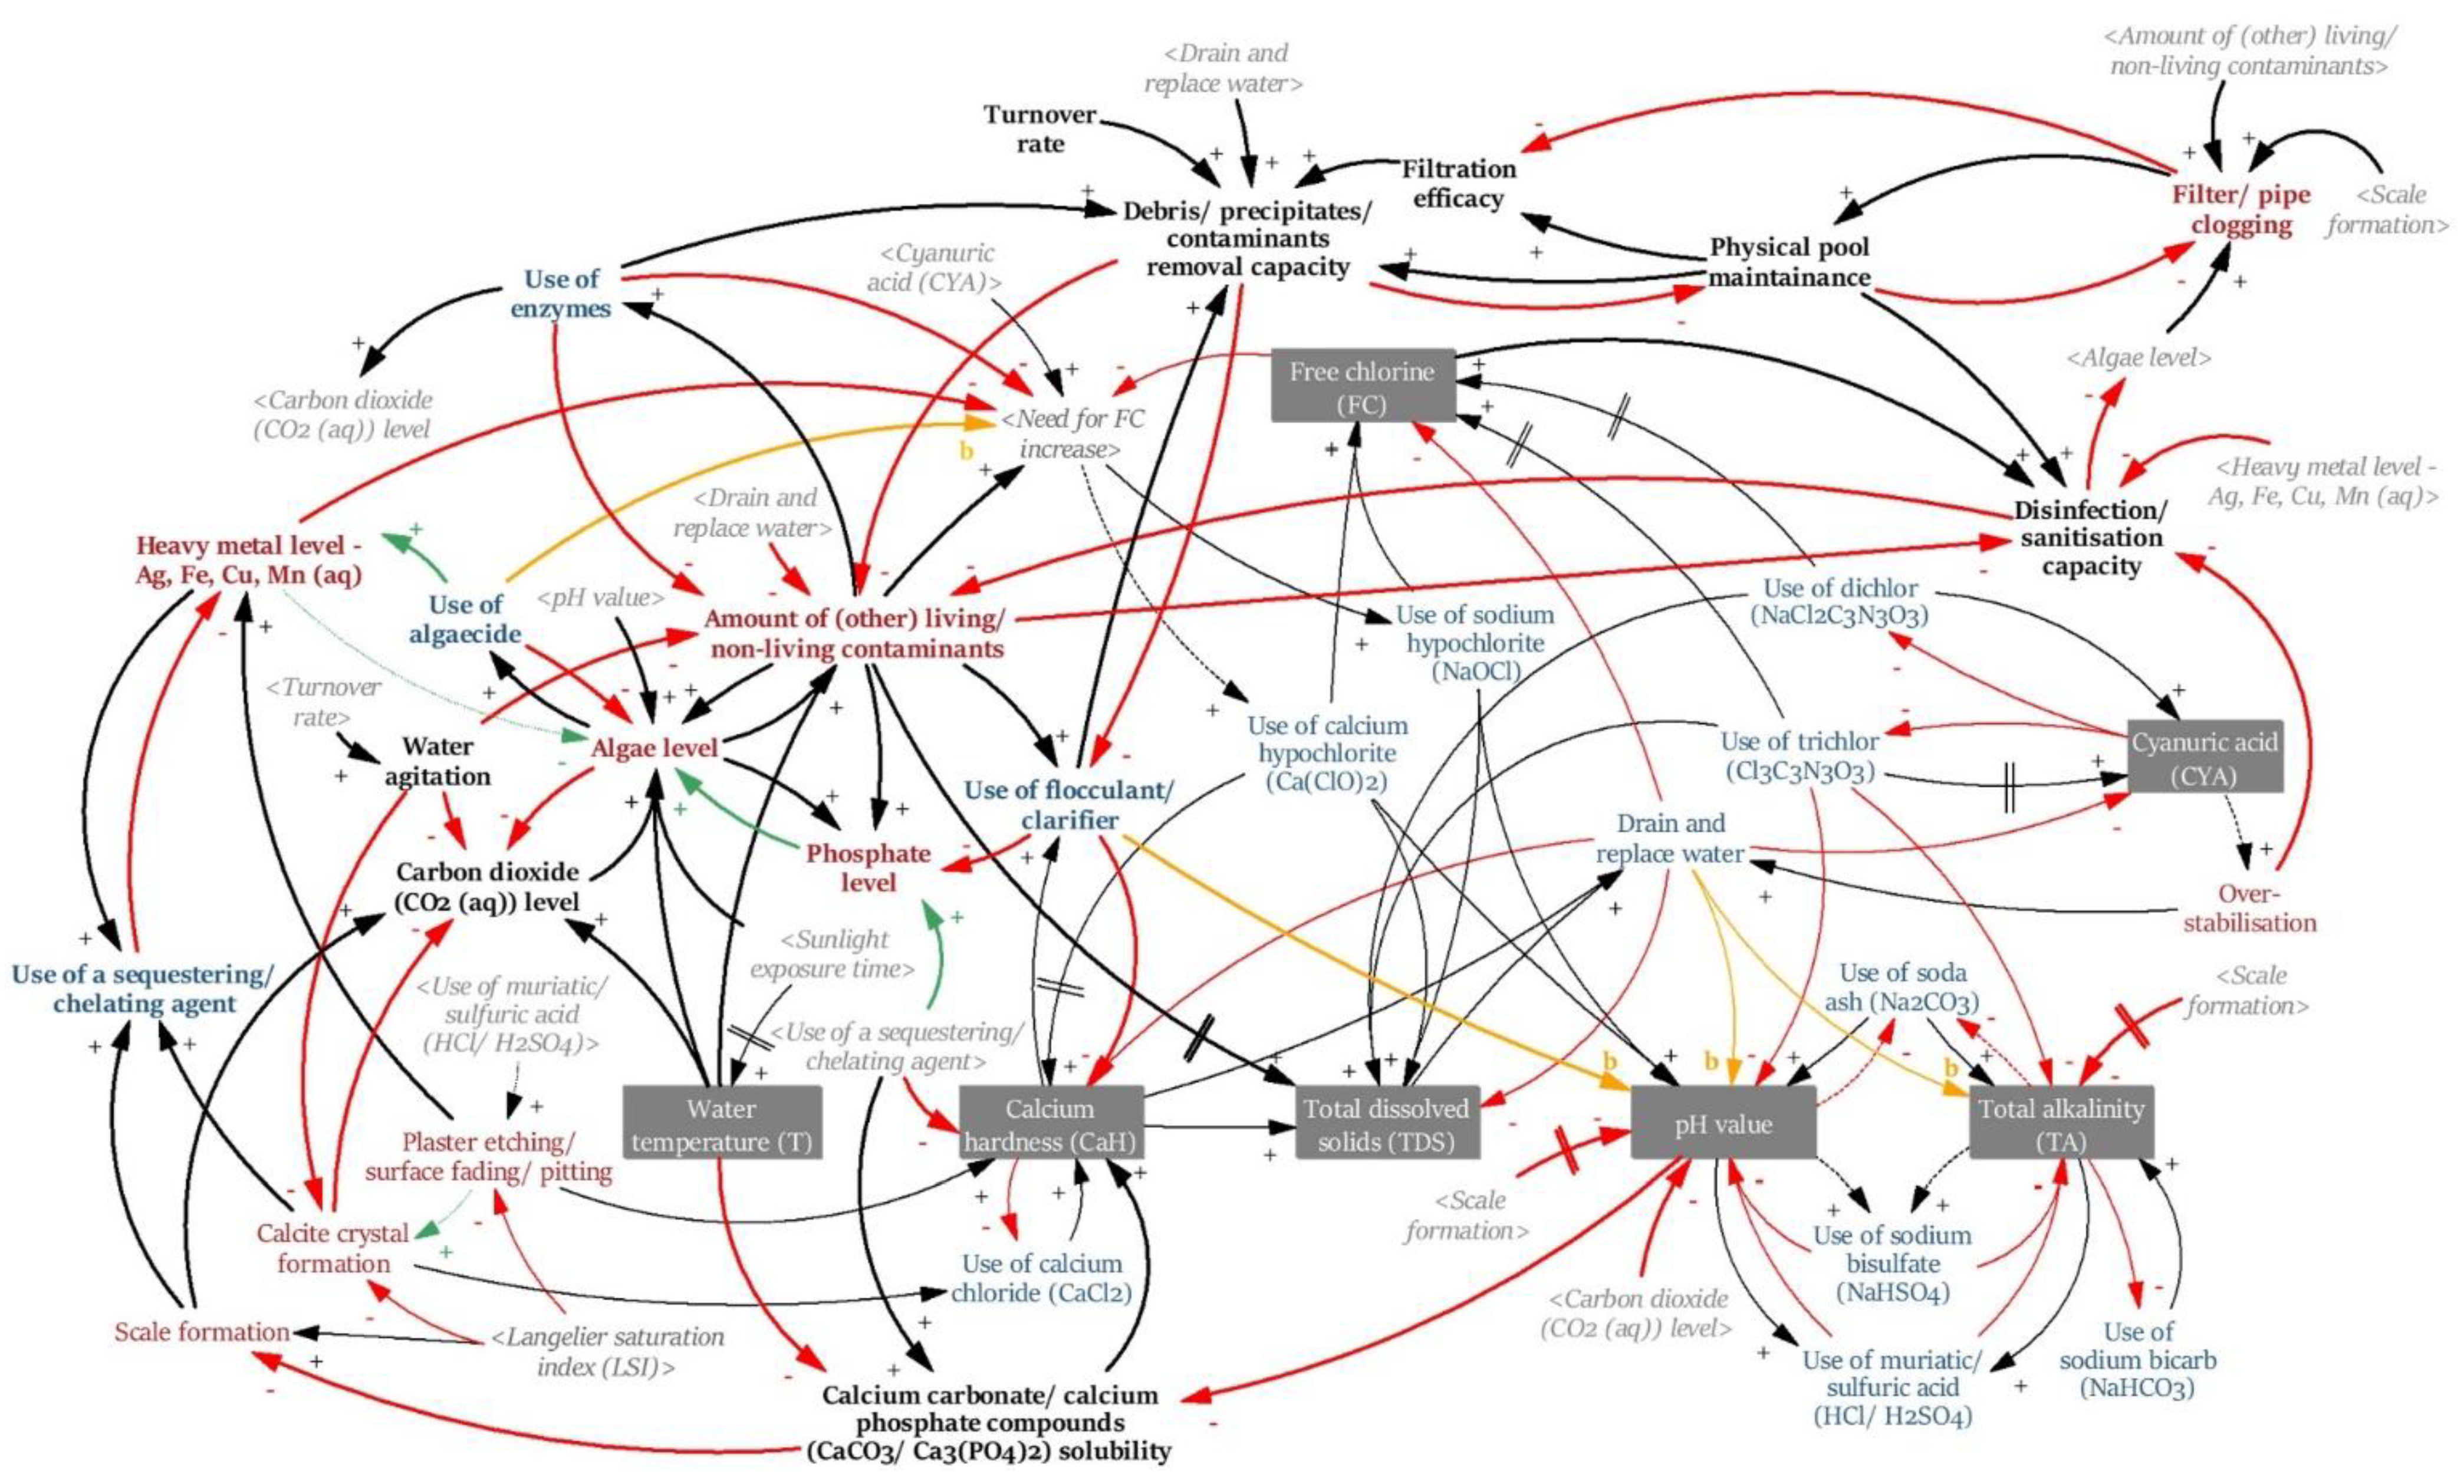
The second CLD, shown in Figure 5, extends the first CLD by including variables in pool operation (e.g., turnover rate, filtration efficacy) and other chemical additives beyond LSI (e.g., clarifiers, sequestering agents) that are used to solve specific undesirable swimming pool or SPW conditions (e.g., scale formation, contamination). These new variables were displayed in bold to be easily distinguished from variables of the first CLD. Furthermore, a few of the variables used in the first CLD were omitted in the second CLD or included as shadow variables shown in grey and italics to obtain a better overview.
Figure 5.
CLD 2: Supplementary swimming pool chemistry. Colour code is the same as in Figure 4 caption, additionally: green arrows represent a situation where either there is a relationship (+ or −) between two variables or no relationship at all, depending on the chemical composition of the affecting variable.
The main foci of the second CLD are (1) to comprehend the occurrence and build-up of various SPW contaminants/pool conditions, (Figure 5, variables displayed in red font), and (2) to explore removal options (displayed in blue). It helps to identify the cause of the problem and explicit intervention points together with their potential benefits and (unintentional) side effects. For instance, algae growth (algae level) is a function of water temperature (T), sunlight exposure time, pH value, carbon dioxide (CO2 (aq)) level, phosphate level, amount of other living/non-living contaminants, disinfection/sanitisation capacity, and use of algaecide [73,74]. Of these, the two obvious options to remove algae and inhibit regrowth are using algaecides (use of algaecide) and striving for higher disinfectant concentration levels (disinfection and sanitisation capacity). However, algae may still regrow rapidly as these two interventions may not necessarily address the source of the problem and may be outweighed by other positive variables for algal growth. Thus, additional measures to reduce algae growth are required. For example, even though the primary purpose of chlorine (free chlorine (FC)) as a disinfectant is to kill pathogens or their hosts (such as algae), 90% of chlorine is used to oxidise organic contaminants (amount of other living/non-living contaminants) such as body fluids or personal care products [75]. This directly reduces the capacity to control algal growth. If the killing rate of the disinfectant becomes too limited, the growth rate of algae can predominate. Thus, instead of increasing the disinfectant concentration to excessive levels, hence unnecessarily escalating costs, removing other organic contaminants through, for example, the use of enzymes helps the disinfectant to eliminate algae. Furthermore, after effectively removing algae, depriving the SPW of nutrients such as dissolved carbon dioxide (CO2; carbon dioxide (CO2 (aq)) level), nitrates (NO3−), or orthophosphates (PO43−; phosphate level) is essential to prevent an almost immediate new algae outbreak [76]. This can be achieved by (1) sufficiently agitating the SPW (water agitation), which lowers the carbon dioxide (CO2 (aq)) level, consequently preventing a rise of the pH value; (2) keeping the pH value in the recommended range of 7.2−7.8 [11]; and (3) using a phosphate remover (use of flocculant/clarifier) [77]. Even though these measures do not help with an existing algae outbreak, they do address the root problem and are, therefore, great for prevention. Using algaecides other than free chlorine (FC) to kill algae in the pool should be the last resort as they can cause significant health and environmental impacts [12]. In addition, copper-based algaecides can cause metal stains or turn the SPW into a clear green solution when copper is oxidised by chlorine [10]. The use of algaecides also impacts the need for FC increase, as, on the one hand, the oxidisation of algaecide by-products requires more free chlorine, while, on the other hand, algaecides reduce the ‘workload’ of free chlorine, hence increasing its effectiveness to kill algae [9].
This example shows how easy it is to mismanage just one particular problem in a swimming pool, as the first course of action is usually to treat the obvious problem regardless of potential side effects, rather than understanding and solving the problem’s origin. Therefore, when tackling a problem, the supplementary pool chemistry CLD (see Figure 5) should also be considered to identify its root cause and to assess the potential risks and unforeseen consequences resulting from an intervention.
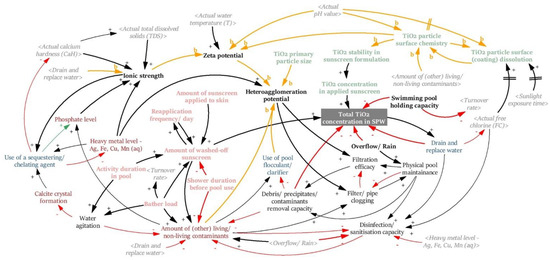
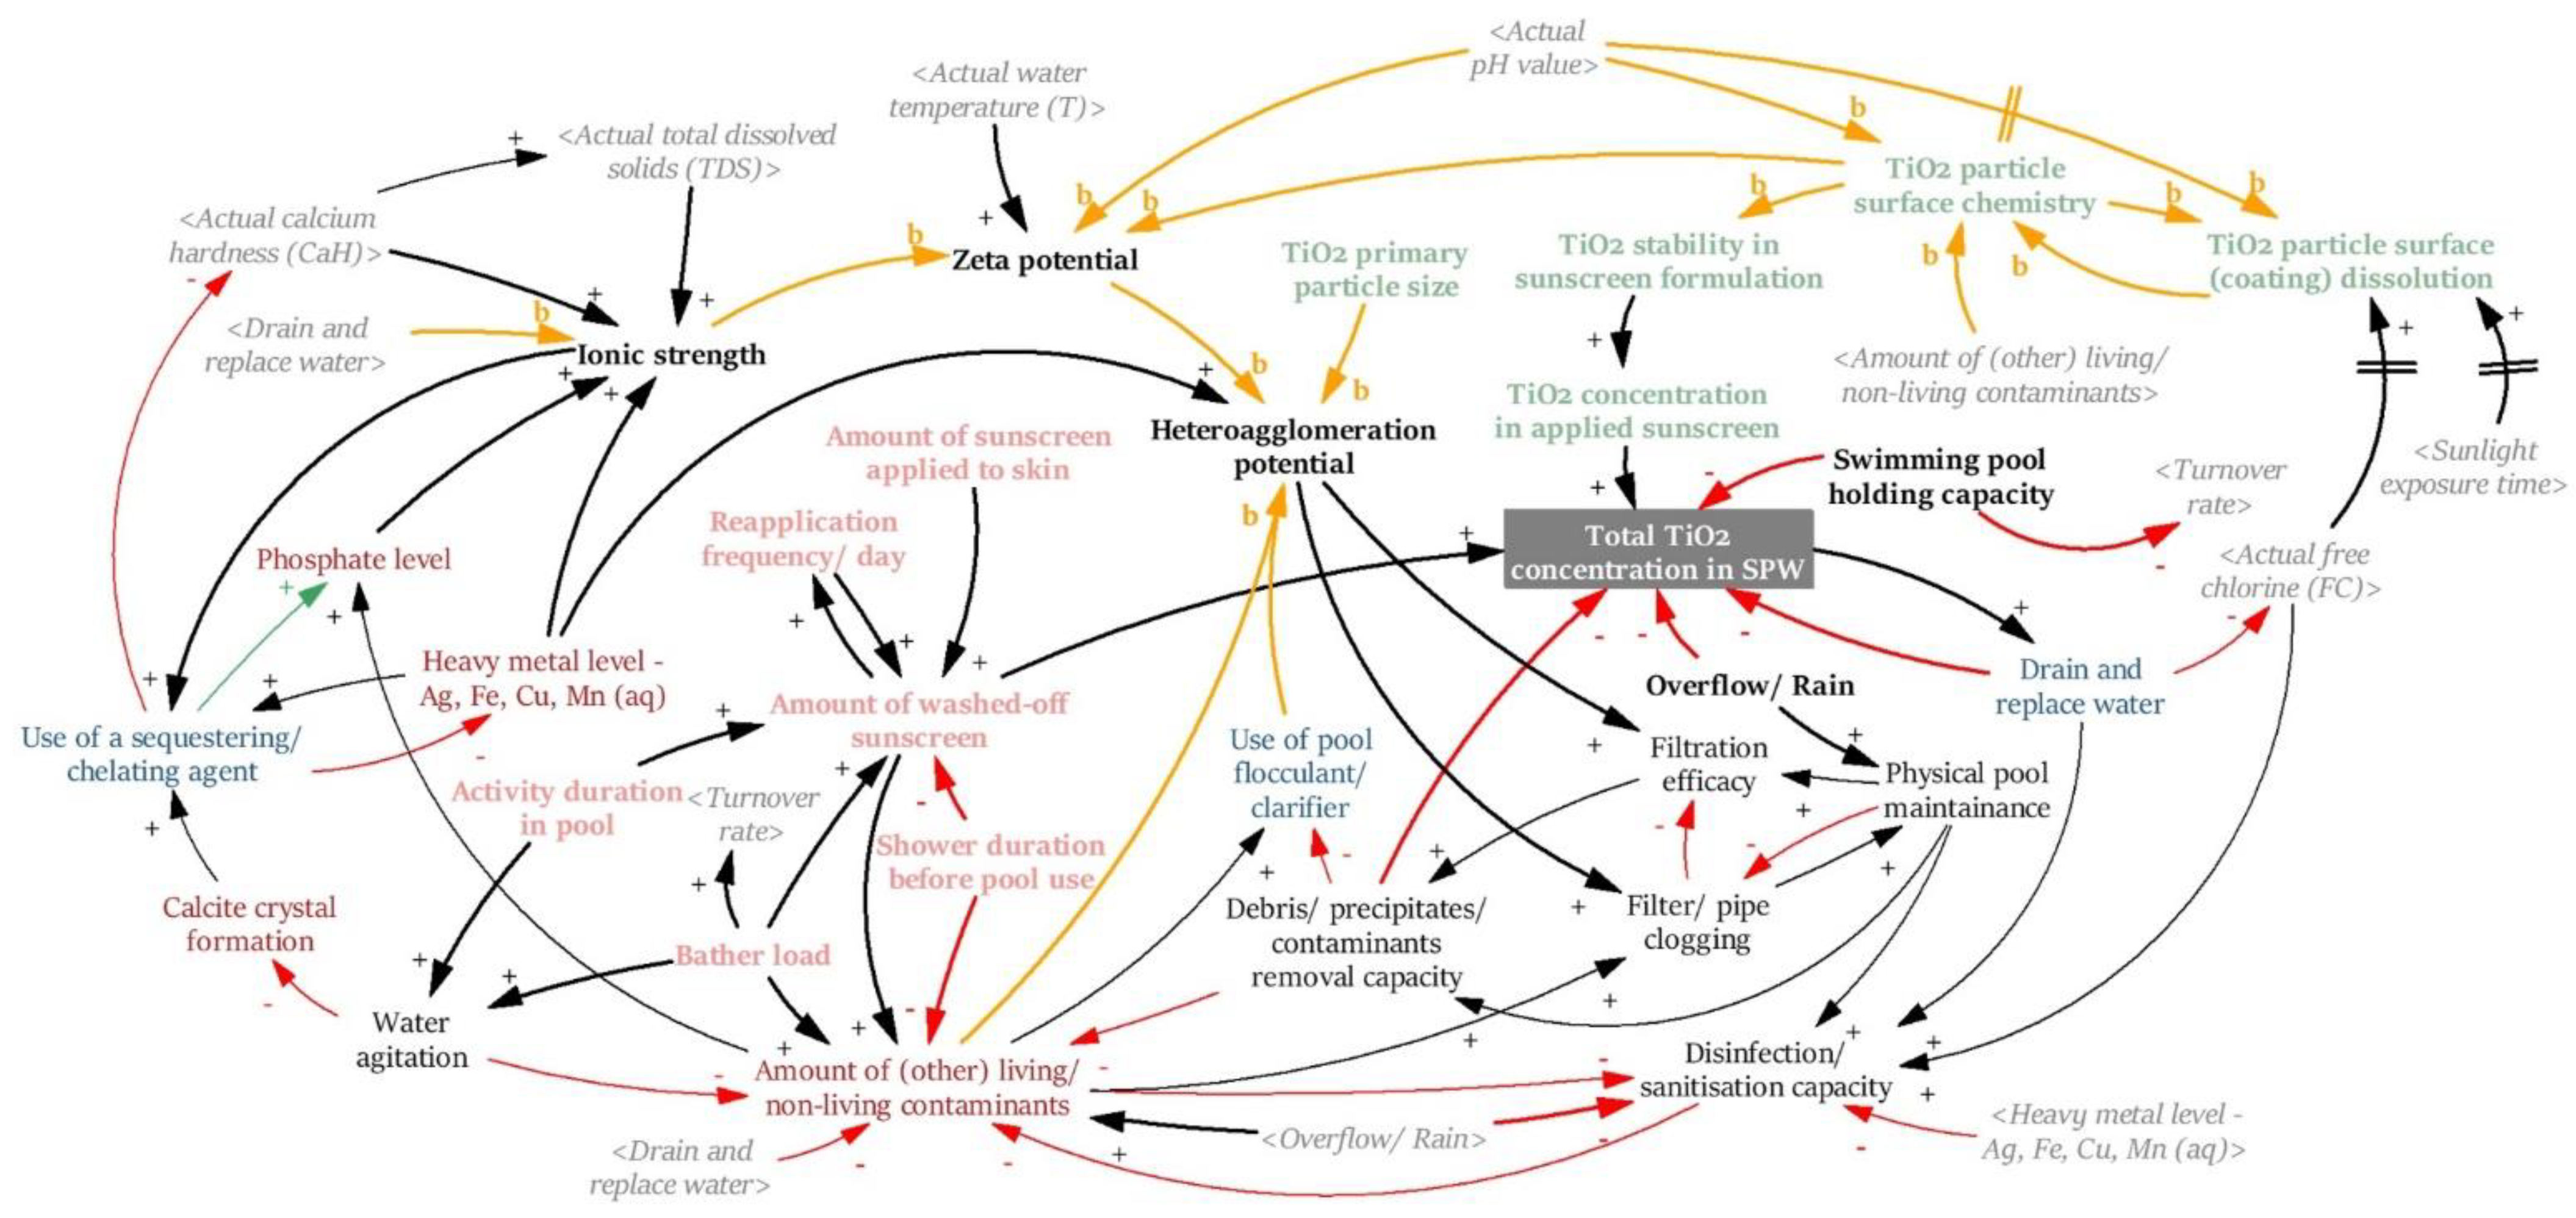
Finally, the third CLD, shown in Figure 6, integrates variables related to the sunscreen formulation and TiO2 particle properties as well as the bathers’ behaviour. Although the main purpose of this CLD is to determine the total TiO2 concentration in the SPW, the CLD also reveals which variables are critical for understanding the input, behaviour, fate, and removal of TiO2.
Figure 6.
CLD 3: TiO2 concentration in SPW. Colour code is the same as in the previous two figures. Additionally: pink variables represent the bathers’ behaviour, whereas green variables refer to sunscreen formulation and TiO2 particle properties.
When developing the CLD, sunscreen usage was assumed to be the only source of TiO2 found in the SPW. Therefore, the TiO2 input can be traced back to the variables TiO2 concentration in the applied sunscreen and the amount of washed-off sunscreen (see Figure 6). Both variables can be manipulated to a certain degree by either the sunscreen manufacturer (e.g., by adequately stabilising the TiO2 particles in the formulation (TiO2 stability in sunscreen formulation)) or the bather (e.g., by applying more or less sunscreen to the skin (amount of sunscreen applied to skin)). Therefore, the impact of these variables on the total TiO2 concentration in the SPW can be defined and predicted well. However, the situation changes considerably once the TiO2 particles enter the SPW environment as their behaviour and fate greatly depend on the individual SPW chemistry (e.g., ionic strength) [78,79,80] and TiO2 particle properties (e.g., TiO2 particle surface chemistry) [81,82] that can additionally change over time (TiO2 particle surface (coating) dissolution) [83,84]. As the behaviour and fate depend on multiple factors, a high number of both directional arrows (+ or −; see Figure 6, yellow arrows (b)) were displayed in the third CLD. Both of these directional arrows indicate that a causal relationship can be established, but the direction of their relationship has to be assessed on a case-by-case basis. Even so, the third CLD reveals which variables impact the total TiO2 concentration in the SPW. The visual presentation of these relationships will be helpful for researchers to design further experimental or modelling investigations.
Furthermore, the third CLD clearly shows that some TiO2 removal strategies (e.g., physical pool maintenance) can reduce the total TiO2 concentration in the SPW irrespective of how strongly variables related to the SPW chemistry and TiO2 particle properties influence the TiO2 particle fate and behaviour.
3.3. Structural Analysis (MICMAC)
In the third step of the framework, the MICMAC analysis, the relative importance of identified variables in the system and the strength of their relationships were quantified.
Firstly, the variables to be used in the MICMAC analysis (Table 1) were determined in the initial step of building the conceptual model. To manage the large and extensive set of variables, they were also grouped into eight categories: (1) essential SPW chemistry (monitoring parameters); (2) supplemental SPW chemistry (chemicals); (3) SP/SPW conditions; (4) essential SPW properties; (5) operating parameters; (6) external monitoring parameters; (7) variables related to the bathers’ behaviour; and (8) sunscreen formulation/TiO2 particle property.
Table 1.
List of variables used in the MICMAC analysis.
Secondly, a dual entry structural analysis matrix was used (Appendix B, Table A2) to assess the direct relationship between a pair of variables. Based on this entry, the MICMAC software calculates a value for each variable indicating its strength of influence (or dependence) and then uses the values to rank each variable. The outcome of the variable ranking is shown in Appendix B, Table A3. The variables were grouped into eight categories and sorted based on their global ranking (number in brackets). To rank the groups, the values of all group members were summed up and divided by the number of variables within a group to calculate the strength of each group’s influence (or dependence). The resulting ranking is shown in Table 2.
Table 2.
Direct and indirect influence and dependency rating of variable groups according to the MICMAC method.
As shown in Table 2, the two most direct and indirect influential categories are the supplementary and essential SPW chemistry. Variables belonging to either of these categories are important to consider as both categories are very influential and moderately dependent. Hence, all variables of both groups were incorporated in the final CLD. SP/SPW conditions is another critical category as variables in this category are quite influential but, on top of that, also highly dependent. Variables in this group were marked as likely to be included in the final CLD. The variables sunlight exposure time and amount of rain/overflow make up the group monitoring parameter (external), which was ranked in the intermediate range in terms of influence. However, since these parameters are extrinsic in source, the direct and indirect dependence rank of this category was the lowest. The categories bather’s behaviour as well as sunscreen formulation/TiO2 particle property were placed at the bottom of the list with a very low influence and dependency score. Variables that are part of either group were marked as likely to be excluded in the final CLD.
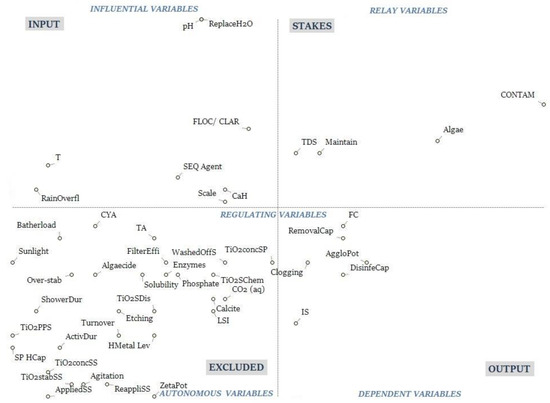
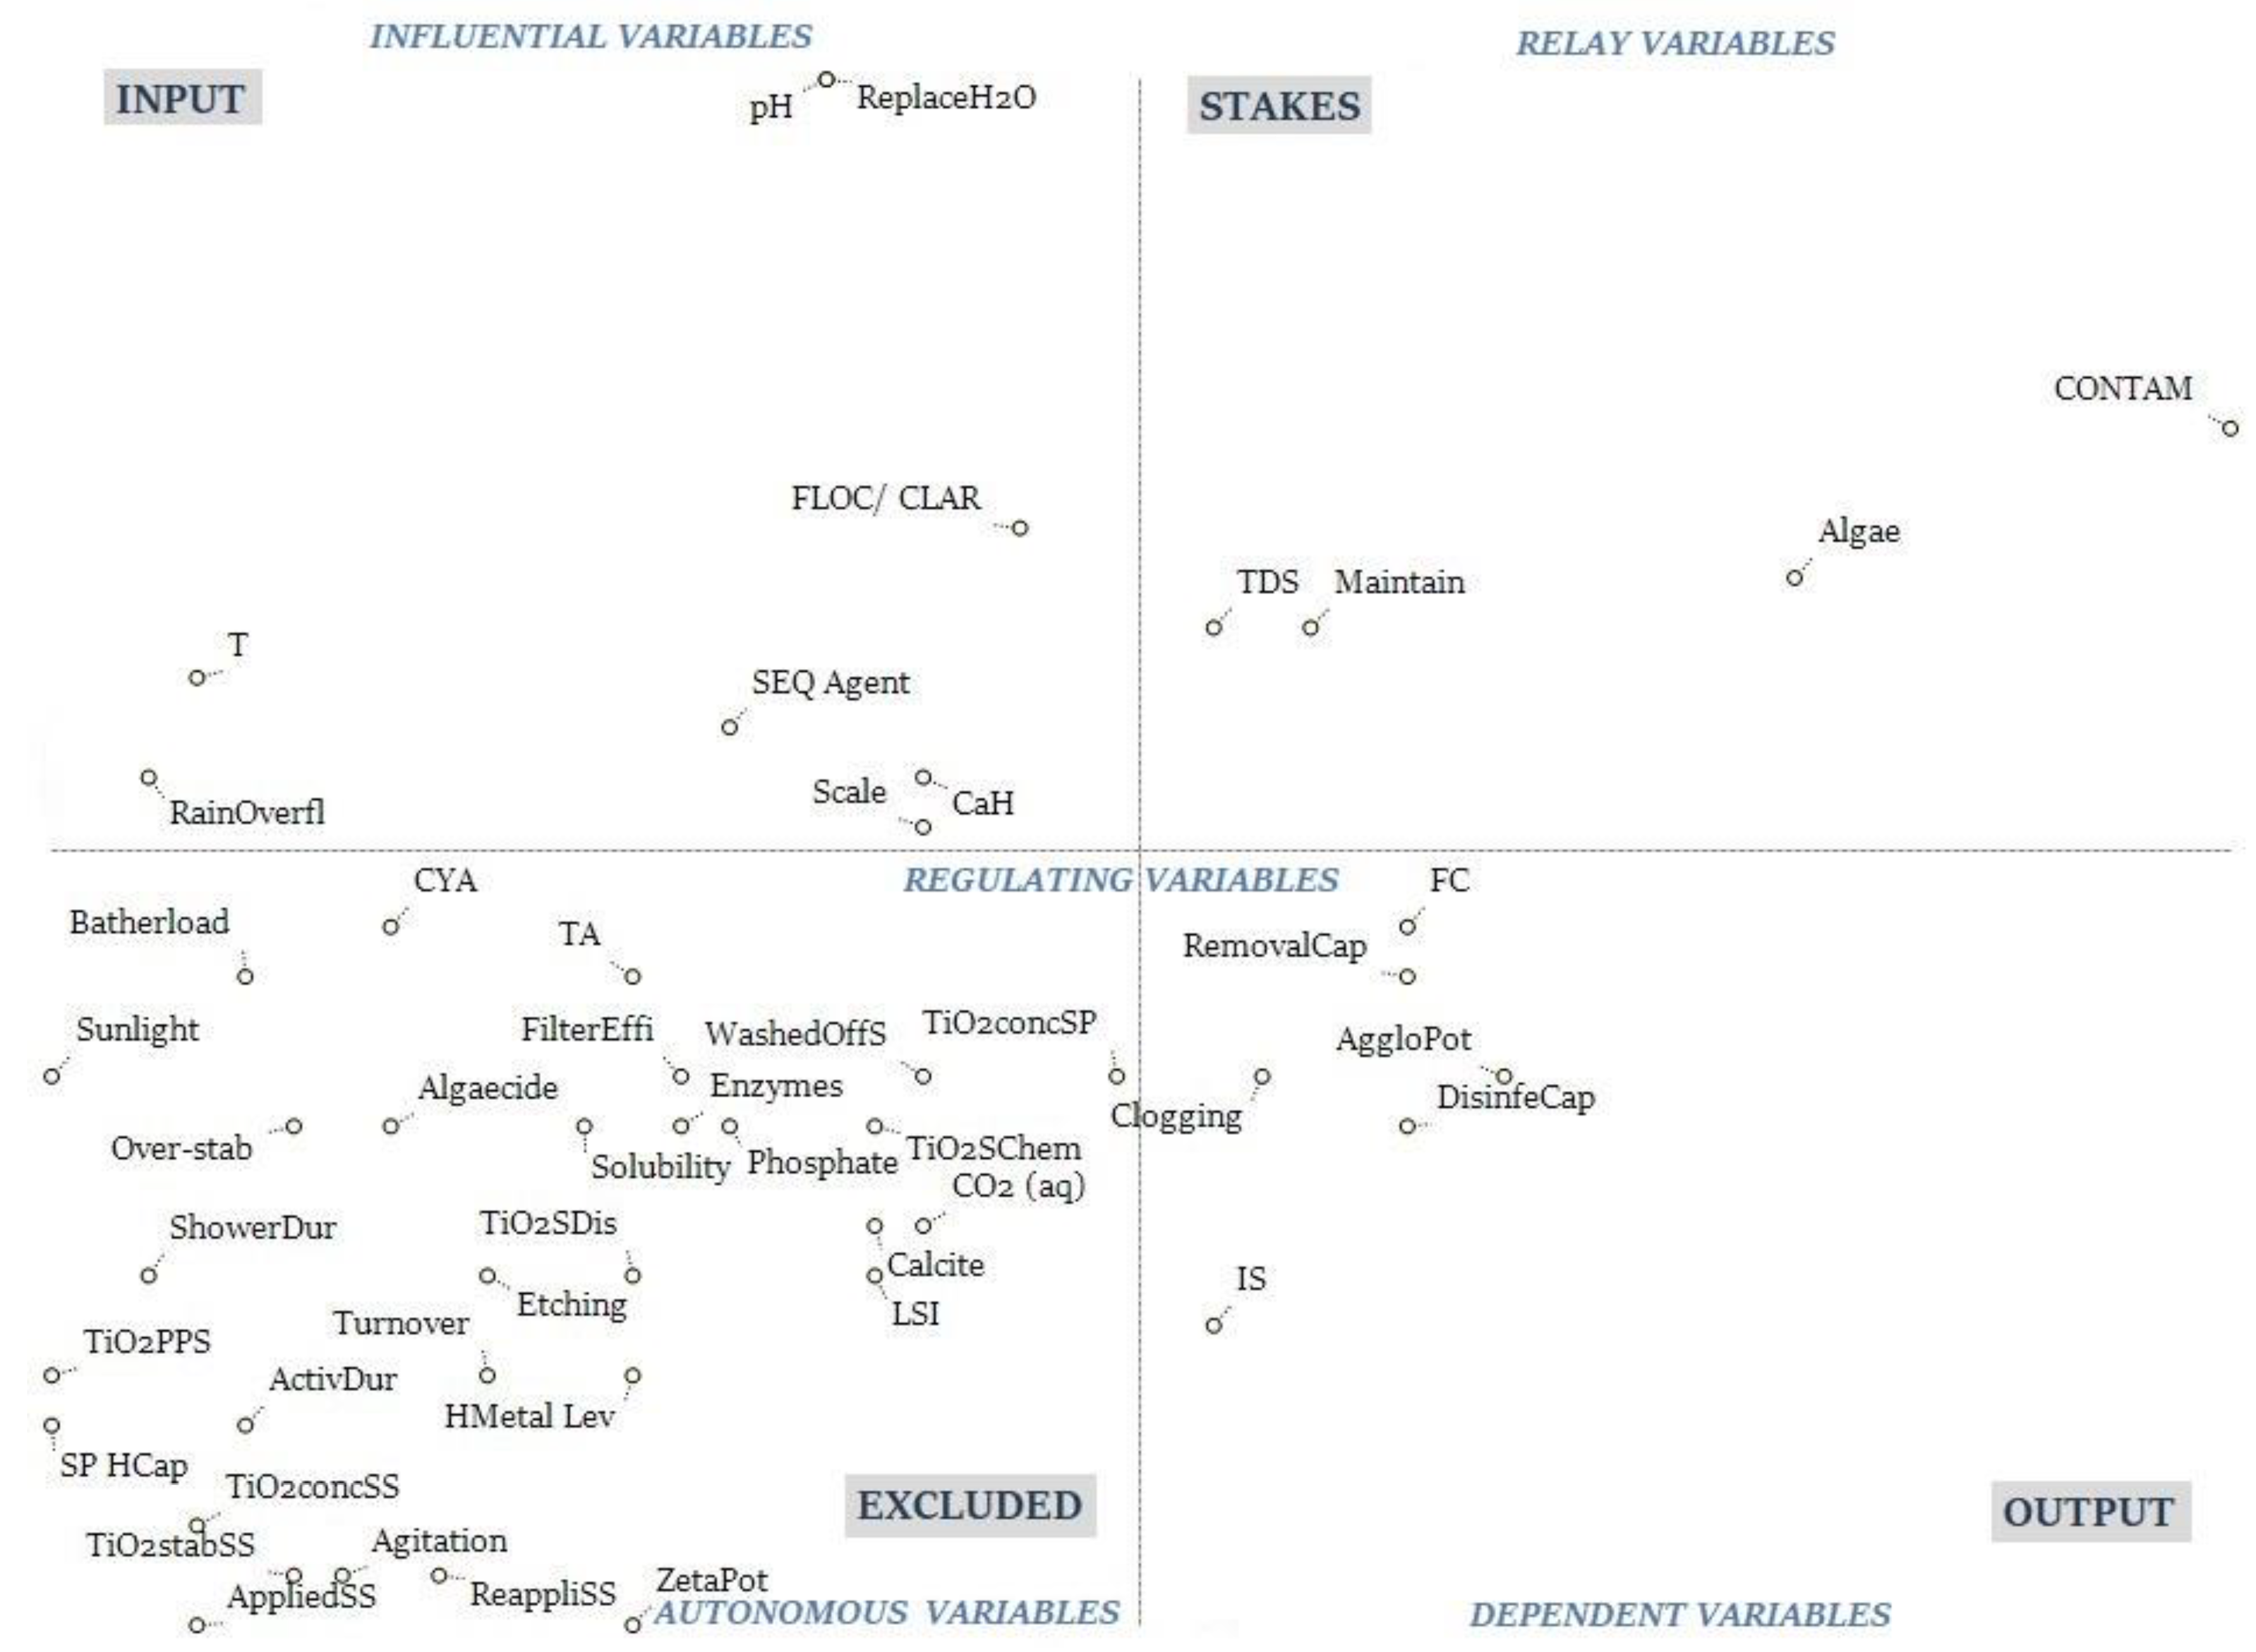
Finally, the variables were placed in direct (Figure 7) and indirect (Appendix B, Figure A1) influence-dependence maps to visualise their overall influence-dependence rating. Variables that were positioned in any of the three quadrants (1) influential (input) variables, (2) relay variables or stakes, or (3) dependent (output) variables were included in the final CLD.
Figure 7.
Direct impact map of the model variables, their quadrant allocation and categorisation.
Most variables, however, were positioned in the quadrant autonomous variables, which means that they have a limited overall influence-dependence rating. In particular, the variables close to the graphs’ origin (lower left corner) are stand-alone variables with weak and a limited number of links to other system variables. Therefore, variables placed in this quadrant were for the most part excluded in the next step of the systems approach development framework.
Using both direct and indirect impact maps, as well as individual variable and variable group scorings, the following variables were excluded from the final CLD: (1) plaster etching/surface fading/pitting, (2) heavy metal level, (3) zeta potential, (4) turnover rate, (5) water agitation, (6) swimming pool holding capacity, (7) shower duration before pool use, (8) activity duration in swimming pool, (9) reapplication frequency/day, (10) amount of sunscreen applied to skin, (11) TiO2 stability (chemical and physical) in sunscreen formulation, (12) TiO2 concentration in applied sunscreen, and (13) TiO2 primary particle size. The remaining variables were used to develop the final CLD, as detailed in the following section.
3.4. CLD and MICMAC Integration
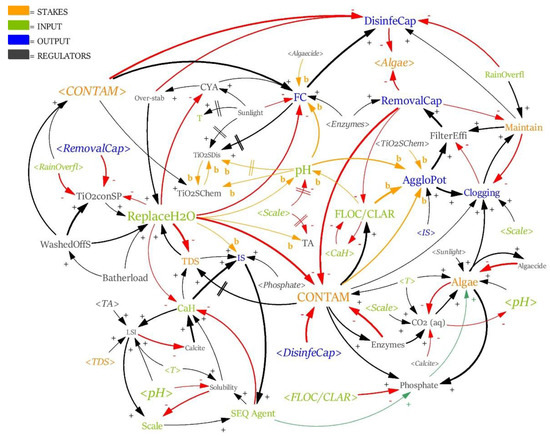
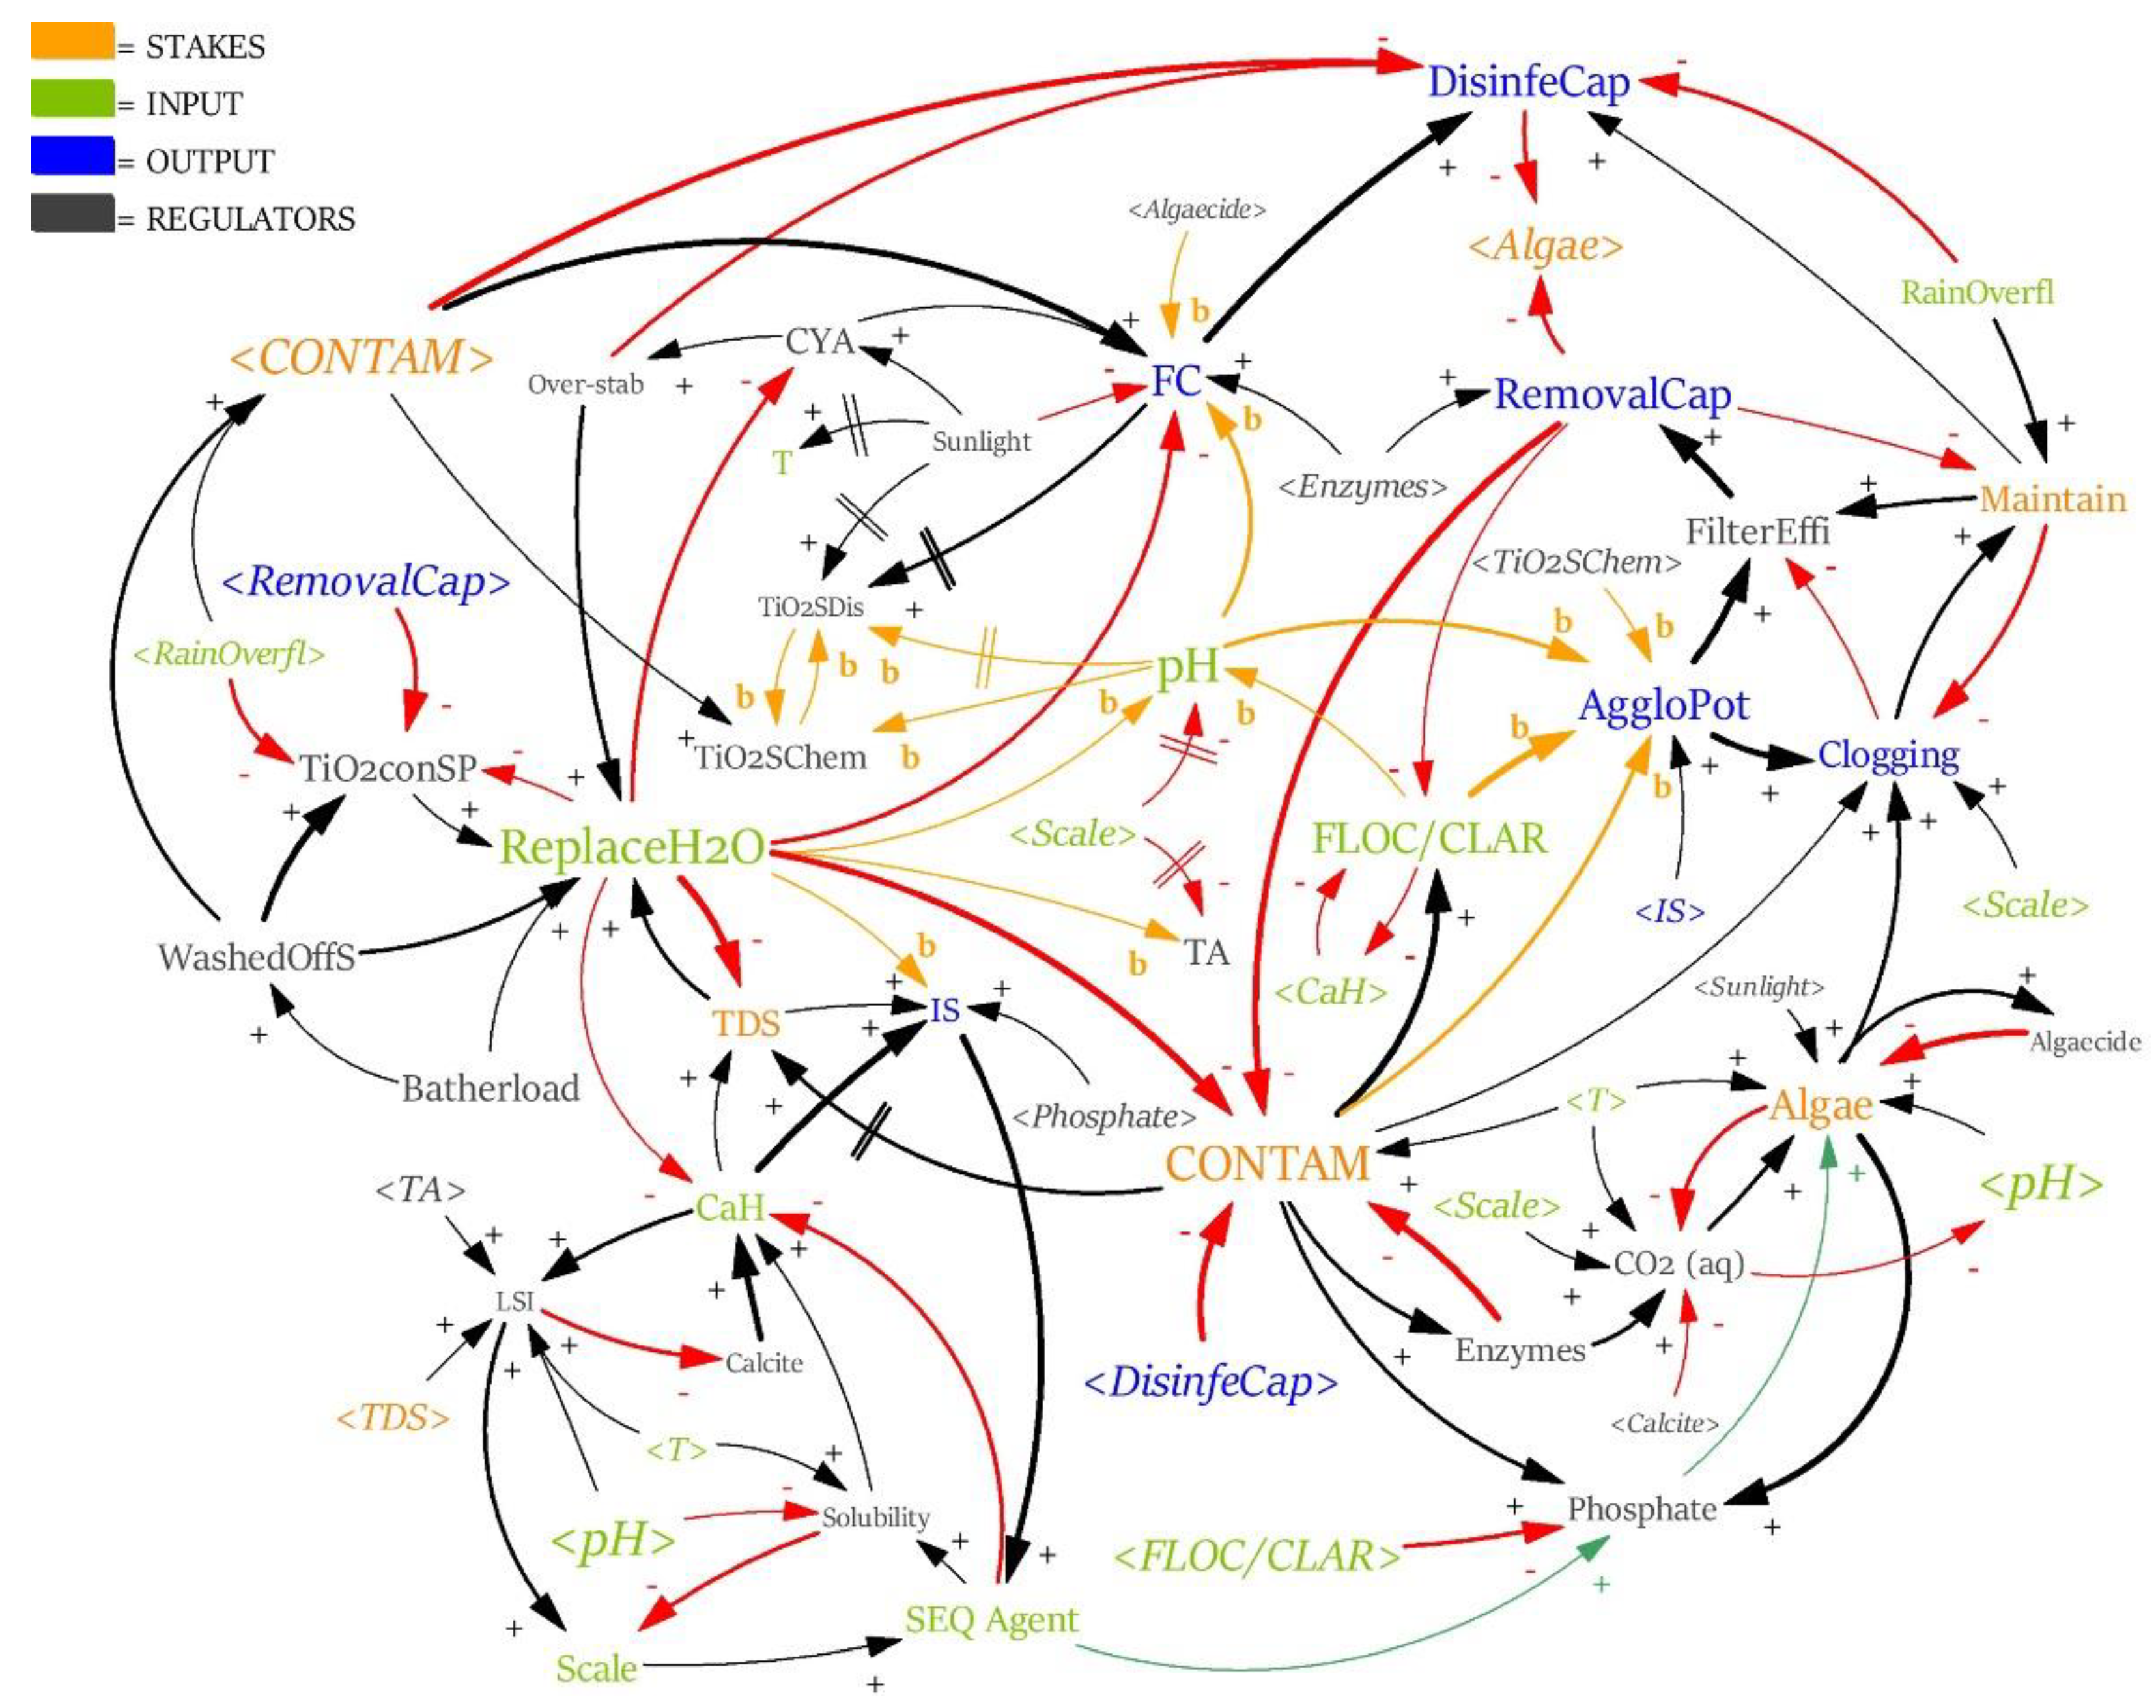
In the fourth step of the multi-method systems approach, a final CLD (Figure 8) was developed by integrating the findings from the MICMAC analysis into the initial CLDs. Specifically, reducing the number of variables through a MICMAC analysis allowed the integration of the three initial CLDs into a more focused, final CLD. Furthermore, the variables were regrouped into four categories based on their position in the quadrants of the direct impact map (Figure 7) instead of clustering the variables into eight contextual categories. By doing so, the degree of influence (or dependence) of the variables became obvious at first glance. The overall influence-dependence ranking score was also emphasized by using different font sizes. For instance, the bigger the font size of a variable, the stronger its effect. Similarly, using the structural analysis matrix entry (Appendix B, Table A2) and the overall influence-dependence rating, the weight (i.e., thickness) of the arrows between variables were adjusted to indicate the strength of their relationship. For example, the thicker the arrow, the stronger the cause-effect relationship. These modifications in the final CLD simplified the identification of intervention points to change the dynamics of the system.
Figure 8.
Final CLD: TiO2 concentration in SPW. Variable colour code is based on the variable placement in the direct impact map (see Figure 7); arrow colour code is the same as in the previous CLDs.
For example, as shown in Figure 8, compared to previous CLDs, it is much easier to spot which variables are most effective in removing non-living/living contaminants (CONTAM) from the SPW merely by identifying connecting input variables (green) with bigger font sizes. In this case, the two most viable options are to either drain and replace the SPW (ReplaceH2O) or to use a flocculant/clarifier (FLOC/CLAR).
3.5. Analysis
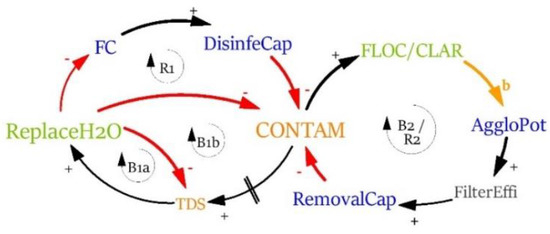
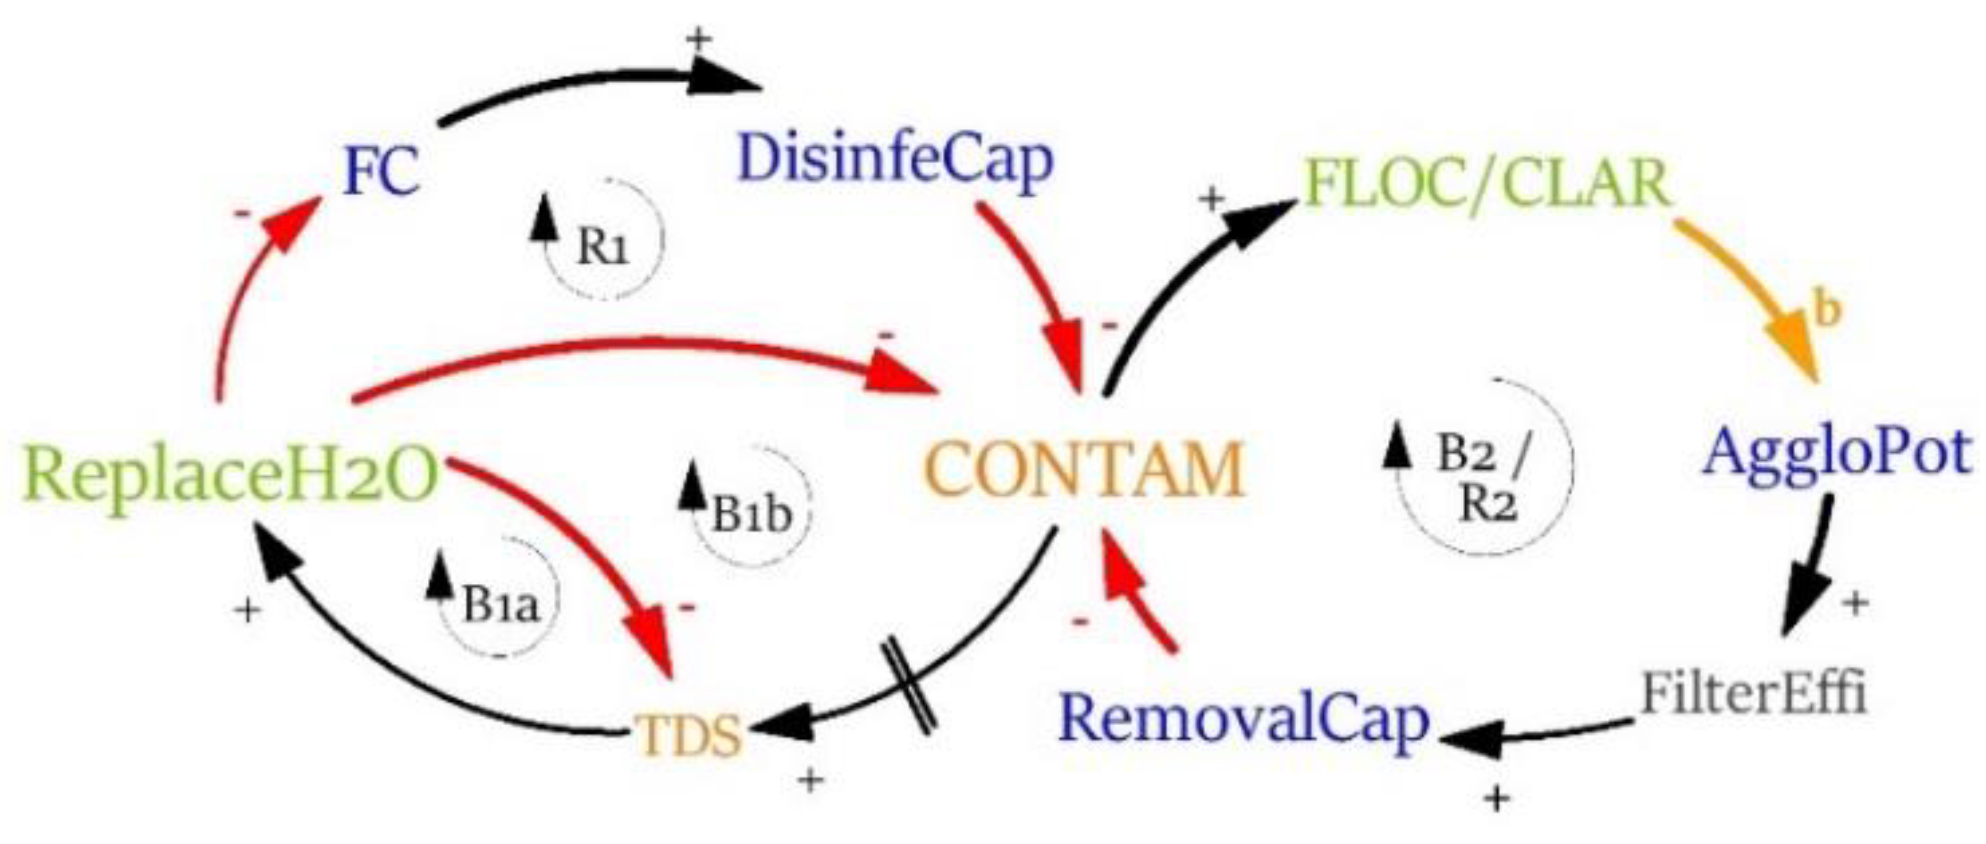
In the final step of the framework, key feedback structures and strategies containing high leverage points were identified and discussed. Figure 9 shows five feedback loops that were extracted from the final CLD (see Figure 8) to explicitly demonstrate the two strategies to manage non-living/living contaminants (CONTAM) in the SPW.
Figure 9.
Five feedback loops extracted from Figure 8 illustrating two strategies to remove contaminants in SPW.
The first strategy to remove both living and non-living contaminants is by draining and replacing SPW (ReplaceH2O), which is represented in the two balancing loops (B1a, B1b) and one reinforcing loop (R1). The balancing loop B1b consists of three variables (CONTAM, TDS, ReplaceH2O) and regulates, as intended, the number of contaminants. With contaminants degrading over time, the TDS level in SPW rises as well (shown by the delay sign on the arrow between CONTAM and TDS). Since the only way to effectively remove TDS from SPW is by draining and replacing the SPW (ReplaceH2O; see B1a), it is advisable to keep contamination levels low in the first place.
Furthermore, as illustrated in the reinforcing loop R1 (CONTAM, TDS, ReplaceH2O, FC, DisinfeCap), this strategy does not necessarily lower the number of contaminants. Without adjusting the SPW chemistry, draining and replacing the SPW (ReplaceH2O) also decreases the free chlorine (FC) level, which again reduces the system’s disinfection capacity (DisinfeCap). Even though the number of contaminants will still be affected, the extent to which the contamination level stagnates, increases or decreases can only be subsequently analysed in a quantitative model. Due to high replacement costs (vast water volume, additional chemicals) and wasting water, the first strategy may not be economically and environmentally the most viable option.
The second strategy to manage living/non-living contaminants (CONTAM) is to use a flocculant or clarifier (FLOC/CLAR). Depending on the amount and type of flocculant or clarifier used, this is represented by either a balancing (B2) or reinforcing (R2) loop. For example, negatively charged (anionic) contaminants are attracted by positively charged (cationic) clarifiers (e.g., quaternary ammonium chlorides (QACs)), which, if dosed correctly, neutralise the surface charge and thereby coagulate the contaminant (AggloPot) [85]. Consequently, the filter efficacy (FilterEffi) increases, and so does the debris/precipitates/contaminants removal capacity (RemovalCap). Therefore, if used precisely, using a flocculant or clarifier reduces the number of contaminants (CONTAM), which is represented in the balancing feedback loop B2.
However, if overdosed, the surface charge of the contaminants can reverse, which results in the contaminants repelling each other. Consequently, due to the lower heteroagglomeration potential (AggloPot), it is more difficult to filter or vacuum contaminants out of the SPW (FilterEffi, RemovalCap). Therefore, using more flocculant or clarifier than necessary can even lead to an increase in contamination (R2).
4. Conclusions
The overarching goal of this research was to develop an integrated conceptual framework to capture the complex dynamics of the interactions between sunscreen derived nano-TiO2 and SPW. This was achieved by employing a multi-method systems approach, which combined ST and MICMAC techniques. The framework assembled three CLDs and the MICMAC structural analysis tool to build a final CLD, which was then applied to (1) identify the most influential (or dependent) system variables, (2) visually depict the interactions between identified variables and feedback structures for a broad audience, and (3) quantify the relevance of their relationships. Although it is impossible to predict, let alone control, the TiO2 fate and behaviour in this complex system, the developed framework will help identify variables that can be used to develop intervention strategies to achieve contaminant mitigation with minimal effort (leverage points).
The proposed framework has implications for both researchers and pool service technicians. For researchers, this novel multi-method approach has not yet been used in this field and provides a novel perspective on nano-TiO2 fate that can also be adapted for various other water contaminant management issues. Because the research crosses traditional disciplinary lines, it sets a precedent for other domains in chemistry to map complex relationships. This systems approach is viewed as complementary to traditional methods rather than replacing them. Another important characteristic of this framework is that it can address other swimming pool water quality issues, not just pertaining to contaminants. Furthermore, the holistic visualisation of the complex relationships in the form of a CLD could help to identify the focal points for laboratory work and consequently improve the effectiveness of subsequent experiments. For pool service technicians, this developed framework can be used to design more focussed workflow charts and visual maintenance plans that could enhance maintenance strategies, design more efficient filtration systems, and assist with water quality improvement recommendations and related chemical adjustments.
Although the integration of ST and MICMAC is relatively new, it has been used by researchers in various domains as an alternative to the qualitative approach to identifying “beyond the system” and “within the system” variables and as a way of presenting the interaction between the variables to explain dynamics of a system. For example, Dhirasasna et al. [86] examined the mental wellbeing of PhD students and Omran et al. [87] applied the method in food security and water security domains. The framework is a powerful analytical tool that can be easily used in any other system. However, clearly, like many other methods, the proposed method has also its limitations as this is not a plug-and-play framework. The main limitation of the proposed method is that it does not create predictive patterns as dynamic simulation approaches. However, it generates a great deal of information about the leverage points of the systems.
There are some limitations in this study that could be addressed in future research. First, the study only focused on sunscreens as the source of TiO2. Future work should also investigate other potential sources to provide a full picture. Additionally, future studies could shift the focus to the fate and behaviour of other contaminants such as by-products of disinfection processes instead of TiO2. Second, this framework only reveals the system as a static picture but does not capture the temporal dynamics of the system. However, by using this causal framework as a base, dynamic or probabilistic simulation models such as System Dynamics can be developed and implemented for scenario analysis and decision-making.
Author Contributions
Conceptualisation, S.H.; methodology, S.H.; investigation, S.H.; data curation, S.H.; visualisation, S.H.; writing—original draft preparation, S.H.; writing—review and editing, R.S., O.S. and R.A.S.; supervision, R.S., O.S. and R.A.S. All authors have read and agreed to the published version of the manuscript.
Funding
This research received no external funding.
Conflicts of Interest
The authors declare no conflict of interest.
Appendix A. Variable Descriptions
Table A1.
Variable descriptions.
Appendix B. MICMAC
Table A2.
Cross-impact matrix of direct influences (MDI)—dark blue indicates a strong, light blue a weak, and white no influence between a variable pair.
Figure A1.
Indirect influence matrix of the model variables, their quadrant allocation and categorisation.
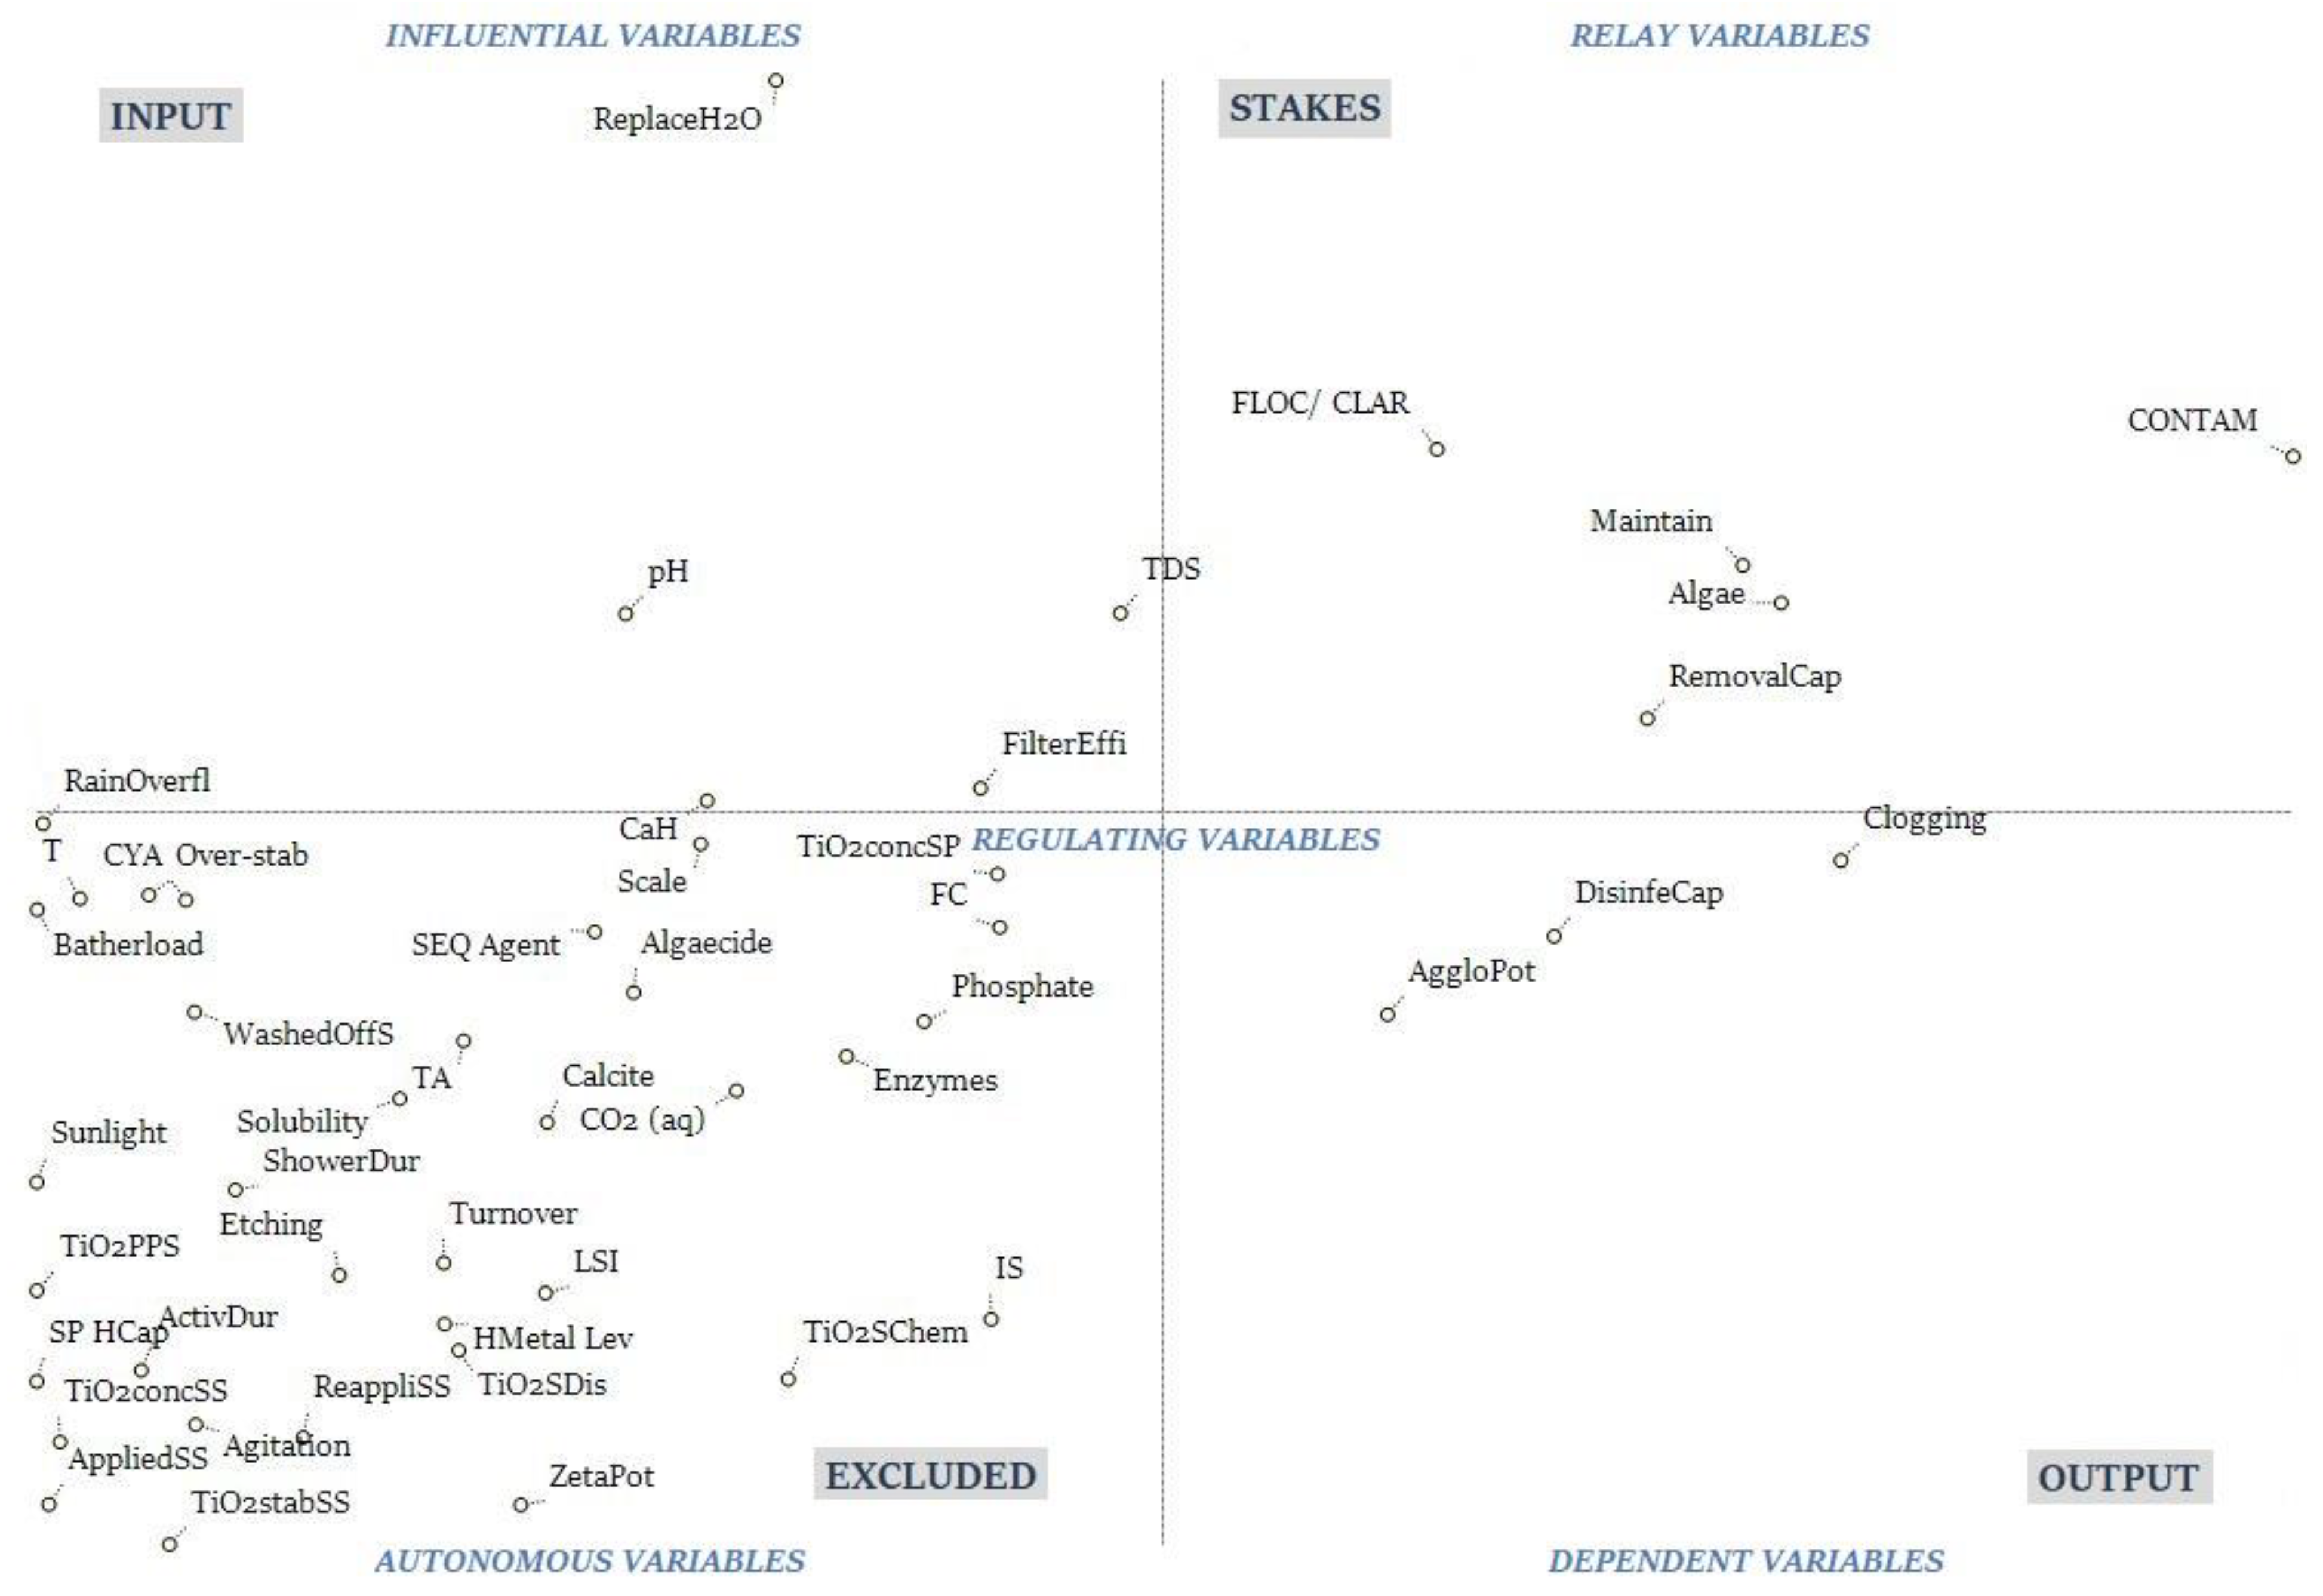
Table A3.
Direct and indirect influence and dependency rating of all variables according to the MICMAC method—variables are ranked within each category as well as overall, that is compared to all 48 variables (shown in parentheses).
References
- Rakicevic, M. 25 Shocking Swimming Pool Statistics You Need to Know. 2022. Available online: https://comfyliving.net/swimming-pool-statistics/ (accessed on 11 April 2022).
- Morgan, R. Swimming Pool Ownership Increases in Australia. 2018. Available online: http://www.roymorgan.com/findings/7811-australian-swimming-pool-ownership-september-2018-201811230555 (accessed on 27 May 2020).
- Goodwin, D. Where is Swimming Popular? 2019. Available online: https://aquamobileswim.com/blog/where-is-swimming-popular/ (accessed on 11 April 2022).
- Wood, L. Global Swimming Pool Market (2020 to 2025)-Growth, Trends and Forecasts. 2020. Available online: https://www.businesswire.com/news/home/20200416005518/en/Global-Swimming-Pool-Market-2020-to-2025---Growth-Trends-and-Forecasts---ResearchAndMarkets.com (accessed on 11 April 2022).
- Faus, J.A. Timothy. Pool Sales Skyrocket as Consumers Splash Out on Coronavirus Cocoons. 2020. Available online: https://www.reuters.com/article/us-health-coronavirus-pools-idUSKCN2520HW (accessed on 11 April 2022).
- Chomicki, C. Demand for Backyard Pools and Spas Sees Some Waiting until Next Christmas. 2021. Available online: https://www.abc.net.au/news/2021-10-30/demand-for-pools-and-spas-never-higher/100581322 (accessed on 13 April 2022).
- Analytics, C. CAPE Data Finds Pandemic-Driven, 533% Surge in New Backyard Swimming Pools. 2020. Available online: https://capeanalytics.com/blog/cape-new-swimming-pool-installations/ (accessed on 11 April 2022).
- Europe, P.G. 2020, a Big Year for Private Pools Worldwide. 2021. Available online: https://www.piscine-global-europe.com/en/blog/2021/06/2020-big-year-private-pools-worldwide (accessed on 11 April 2022).
- South Australia. Department for Health and Ageing. Guideline for the Inspection and Maintenance of Swimming Pools and Spa Pools; Department for Health and Ageing: Adelaide, Australia, 2013.
- Puetz, J.D. Swimming Pool Water Chemistry. The Care and Treatment of Swimming Pool Water; Arch Chemicals, Inc., Now a Part of Lonza: Norwalk, CT, USA, 2013. [Google Scholar]
- Victoria State Government. Water Quality Guidelines for Public Aquatic Facilities. Managing Public Health Risks; Department of Health and Human Services: Melbourne, VIC, Australia, 2019.
- Environmental Health Unit Rural and Regional Health and Aged Care Services Division. Pool Operators’ Handbook; Department of Human Services: Melbourne, VIC, Australia, 2008.
- World Health Organization; Water, S.H. Team. Guidelines for Safe Recreational Water Environments. Volume 2, Swimming Pools and Similar Environments; World Health Organization: Geneva, Switherland, 2006. [Google Scholar]
- Bonadonna, L.; Giuseppina, L.R. A Review and Update on Waterborne Viral Diseases Associated with Swimming Pools. Int. J. Environ. Res. Public Health 2019, 16, 166. [Google Scholar] [CrossRef] [Scilit] [PubMed]
- Akinnola, O.O.; Ajayi, A.S.; Ogunleye, B.O.; Enueme, I.N. Chapter 10—Disinfection By-Products in Swimming Pools and Health-Related Issues. In Disinfection By-Products in Drinking Water; Prasad, M.N.V., Ed.; Butterworth-Heinemann: Oxford, UK, 2020; pp. 235–252. [Google Scholar]
- De Laat, J.; Feng, W.; Freyfer, D.A.; Dossier-Berne, F. Concentration Levels of Urea in Swimming Pool Water and Reactivity of Chlorine with Urea. Water Res. 2011, 45, 1139–1146. [Google Scholar] [CrossRef] [Scilit] [PubMed]
- Yang, L.; Chen, X.; She, Q.; Cao, G.; Liu, Y.; Chang, V.W.C.; Tang, C.Y. Regulation, Formation, Exposure, and Treatment of Disinfection By-Products (DBPs) in Swimming Pool Waters: A Critical Review. Environ. Int. 2018, 121, 1039–1057. [Google Scholar] [CrossRef] [Scilit]
- Carter, R.A.A.; Joll, C.A. Occurrence and Formation of Disinfection By-Products in the Swimming Pool Environment: A Critical Review. J. Environ. Sci. 2017, 58, 19–50. [Google Scholar] [CrossRef] [Scilit] [PubMed]
- Zwiener, C.; Richardson, S.D.; DeMarini, D.M.; Grummt, T.; Glauner, T.; Frimmel, F.H. Drowning in Disinfection Byproducts? Assessing Swimming Pool Water. Environ. Sci. Technol. 2007, 41, 363–372. [Google Scholar] [CrossRef] [Scilit] [PubMed]
- Teo, T.L.; Coleman, H.M.; Khan, S.J. Chemical Contaminants in Swimming Pools: Occurrence, Implications and Control. Environ Int. 2015, 76, 16–31. [Google Scholar] [CrossRef] [Scilit]
- Chowdhury, S.; Alhooshani, K.; Karanfil, T. Disinfection Byproducts in Swimming Pool: Occurrences, Implications and Future Needs. Water Res. 2014, 53, 68–109. [Google Scholar] [CrossRef] [Scilit]
- Richardson Susan, D.; DeMarini David, M.; Kogevinas, M.; Fernandez, P.; Marco, E.; Lourencetti, C.; Villanueva Cristina, M. What’s in the Pool? A Comprehensive Identification of Disinfection By-products and Assessment of Mutagenicity of Chlorinated and Brominated Swimming Pool Water. Environ. Health Perspect. 2010, 118, 1523–1530. [Google Scholar] [CrossRef] [Scilit]
- Lu, J.; Mao, H.; Li, H.; Wang, Q.; Yang, Z. Occurrence of and Human Exposure to Parabens, Benzophenones, Benzotriazoles, Triclosan and Triclocarban in Outdoor Swimming Pool Water in Changsha, China. Sci. Total Environ. 2017, 605–606, 1064–1069. [Google Scholar] [CrossRef] [Scilit]
- Weng, S.; Sun, P.; Ben, W.; Huang, C.-H.; Lee, L.T.; Blatchley, E.R., III. The Presence of Pharmaceuticals and Personal Care Products in Swimming Pools. Environ. Sci. Technol. Lett. 2014, 1, 495–498. [Google Scholar] [CrossRef] [Scilit]
- Vila, M.; Celeiro, M.; Lamas, J.P.; Garcia-Jares, C.; Dagnac, T.; Llompart, M. Simultaneous In-Vial Acetylation Solid-Phase Microextraction Followed by Gas Chromatography Tandem Mass Spectrometry for the Analysis of Multiclass Organic UV Filters in Water. J. Hazard. Mater. 2017, 323, 45–55. [Google Scholar] [CrossRef] [Scilit] [PubMed]
- Holbrook, D.R.; Motabar, D.; Quinones, O.; Stanford, B.; Vanderford, B.; Moss, D. Titanium Distribution in Swimming Pool Water is Dominated by Dissolved Species. Environ. Pollut. 2013, 181, 68–74. [Google Scholar] [CrossRef] [Scilit] [PubMed]
- Venkatesan, A.K.; Reed, R.B.; Lee, S.; Bi, X.; Hanigan, D.; Yang, Y.; Westerhoff, P. Detection and Sizing of Ti-Containing Particles in Recreational Waters Using Single Particle ICP-MS. Bull. Environ. Contam. Toxicol. 2018, 100, 120–126. [Google Scholar] [CrossRef] [Scilit]
- Hadioui, M.; Knapp, G.; Azimzada, A.; Jreije, I.; Frechette-Viens, L.; Wilkinson, K.J. Lowering the Size Detection Limits of Ag and TiO2 Nanoparticles by Single Particle ICP-MS. Anal. Chem. 2019, 91, 13275–13284. [Google Scholar] [CrossRef] [Scilit]
- Trivedi, M.; Murase, J. Titanium Dioxide in Sunscreen; IntechOpen: Rijeka, Croatia, 2017; Volume 26, pp. 61–71. [Google Scholar]
- Chaiyabutr, C.; Sukakul, T.; Kumpangsin, T.; Bunyavaree, M.; Charoenpipatsin, N.; Wongdama, S.; Boonchai, W. Ultraviolet Filters in Sunscreens and Cosmetic Products—A Market Survey. Contact Dermat. 2021, 85, 58–68. [Google Scholar] [CrossRef] [Scilit] [PubMed]
- Ziental, D.; Czarczynska-Goslinska, B.; Mlynarczyk, D.T.; Glowacka-Sobotta, A.; Stanisz, B.; Goslinski, T.; Sobotta, L. Titanium Dioxide Nanoparticles: Prospects and Applications in Medicine. Nanomaterials 2020, 10, 387. [Google Scholar] [CrossRef] [Scilit]
- Chen, X.; Selloni, A. Introduction: Titanium Dioxide (TiO2) Nanomaterials; ACS Publications: Washington, DC, USA, 2014; pp. 9281–9282. [Google Scholar]
- EFSA. Titanium Dioxide: E171 No Longer Considered Safe When Used as a Food Additive. 2021. Available online: https://www.efsa.europa.eu/en/news/titanium-dioxide-e171-no-longer-considered-safe-when-used-food-additive (accessed on 12 April 2022).
- Bernauer, U.; Bodin, L.; Chaudhry, Q.; Coenraads, P.; Dusinska, M.; Ezendam, J.; Panteri, E. SCCS OPINION on Titanium Dioxide (TiO2) Used in Cosmetic Products That Lead to Exposure by Inhalation-SCCS/1617/20, Final Opinion; European Commission: Luxembourg, 2020.
- Rashid, M.M.; Forte Tavčer, P.; Tomšič, B. Influence of Titanium Dioxide Nanoparticles on Human Health and the Environment. Nanomaterials 2021, 11, 2354. [Google Scholar] [CrossRef] [Scilit]
- Baranowska-Wójcik, E.; Szwajgier, D.; Oleszczuk, P.; Winiarska-Mieczan, A. Effects of Titanium Dioxide Nanoparticles Exposure on Human Health—A Review. Biol. Trace Elem. Res. 2020, 193, 118–129. [Google Scholar] [CrossRef] [Scilit]
- Reed, R.B.; Martin, D.P.; Bednar, A.J.; Montano, M.D.; Westerhoff, P.; Ranville, J.F. Multi-Day Diurnal Measurements of Ti-containing Nanoparticle and Organic Sunscreen Chemical Release During Recreational Use of a Natural Surface Water. Environ. Sci.-Nano 2017, 4, 69–77. [Google Scholar] [CrossRef] [Scilit]
- Gondikas, A.; von der Kammer, F.; Kaegi, R.; Borovinskaya, O.; Neubauer, E.; Navratilova, J.; Hofmann, T. Where Is the Nano? Analytical Approaches for the Detection and Quantification of TiO2 Engineered Nanoparticles in Surface Waters. Environ. Sci.-Nano 2018, 5, 313–326. [Google Scholar] [CrossRef] [Scilit]
- Peters, R.J.B.; van Bemmel, G.; Milani, N.B.L.; den Hertog, G.C.T.; Undas, A.K.; van der Lee, M.; Bouwmeester, H. Detection of Nanoparticles in Dutch Surface Waters. Sci. Total Environ. 2018, 621, 210–218. [Google Scholar] [CrossRef] [Scilit] [PubMed]
- Rand, L.N.; Bi, Y.; Poustie, A.; Bednar, A.J.; Hanigan, D.J.; Westerhoff, P.; Ranville, J.F. Quantifying Temporal and Geographic Variation in Sunscreen and Mineralogic Titanium-Containing Nanoparticles in Three Recreational Rivers. Sci. Total Environ. 2020, 743, 140845. [Google Scholar] [CrossRef] [Scilit]
- Bland, G.D.; Battifarano, M.; Pradas del Real, A.E.; Sarret, G.; Lowry, G.V. Distinguishing Engineered TiO2 Nanomaterials from Natural Ti Nanomaterials in Soil Using spICP-TOFMS and Machine Learning. Environ. Sci. Technol. 2022, 56, 2990–3001. [Google Scholar] [CrossRef] [Scilit] [PubMed]
- Sahin, O.; Bertone, E.; Beal, C.D. A Systems Approach for Assessing Water Conservation Potential Through Demand-Based Water Tariffs. J. Clean. Prod. 2017, 148, 773–784. [Google Scholar] [CrossRef] [Scilit]
- Sahin, O.; Stewart, R.A.; Giurco, D.; Porter, M.G. Renewable Hydropower Generation as a Co-Benefit of Balanced Urban Water Portfolio Management and Flood Risk Mitigation. Renew. Sustain. Energy Rev. 2017, 68, 1076–1087. [Google Scholar] [CrossRef] [Scilit]
- Meadows, D.H. Thinking in Systems: A Primer; Earthscan: London, UK; Sterling, VA, USA, 2009. [Google Scholar]
- Senge, P.M. The Fifth Discipline; Measuring Business Excellence; Emerald Publishing Limited (Previously MCB UP Ltd.): Bradford, UK, 1997. [Google Scholar]
- Arcade, J.; Godet, M.; Meunier, F.; Roubelat, F. Structural Analysis with the MICMAC Method & Actor’s Strategy with MACTOR Method. In The Millennium Project 1999: Futures Research Methodology; American Council for the United Nations University: Washington, DC, USA, 2010. [Google Scholar]
- Godet, M. Creating Futures: Scenario Planning as a Strategic Management Tool; Economica Brookings diffusion; Economica: Washington, DC, USA, 2006; 280p. [Google Scholar]
- Sterman, J. Business Dynamics; McGraw-Hill, Inc.: New York, NY, USA, 2000. [Google Scholar]
- Voinov, A. Systems Science and Modeling for Ecological Economics, 1st ed.; Elsevier Academic Press: London, UK, 2008. [Google Scholar]
- Videira, N.; Schneider, F.; Sekulova, F.; Kallis, G. Improving Understanding on Degrowth Pathways: An Exploratory Study Using Collaborative Causal Models. Futures 2014, 55, 58–77. [Google Scholar] [CrossRef] [Scilit]
- Goodman, M. Systems Thinking: What, Why, When, Where, and How. Syst. Think. 1997, 8, 6–7. [Google Scholar]
- Kim, D.H. Systems Thinking Tools: A User’s Reference Guide; Pegasus Communications, Inc.: Waltham, MA, USA, 1995. [Google Scholar]
- Monat, J.P.; Gannon, T.F. What is Systems Thinking? A Review of Selected Literature Plus Recommendations. Am. J. Syst. Sci. 2015, 4, 11–26. [Google Scholar]
- Kirkwood, C.W. System Dynamics Methods; College of Business Arizona State University USA: Tempe, AZ, USA, 1998. [Google Scholar]
- Kim, D.H. Introduction to Systems Thinking; Pegasus Communications: Waltham, MA, USA, 1999; Volume 16. [Google Scholar]
- Currie, D. Taking the ‘Poo’out of ‘Pool’: Participatory Systems Modelling as a Decision-Support Tool for Even the Messiest Public Environmental Health Problems; The Univeristy of Queensland: Brisbane, Australia, 2019. [Google Scholar]
- Suprun, E.; Sahin, O.; Stewart, R.A.; Panuwatwanich, K. Model of the Russian Federation Construction Innovation System: An Integrated Participatory Systems Approach. Systems 2016, 4, 29. [Google Scholar] [CrossRef] [Scilit]
- Hu, H.-Y.; Chiu, S.-I.; Yen, T.-M. Modified IPA for Order-Winner Criteria Improvement: A MICMAC Approach. J. Appl. Sci. 2009, 9, 3792–3803. [Google Scholar] [CrossRef] [Scilit]
- La Prospective. Micmac. Structural Analysis. 2010. Available online: http://en.laprospective.fr/methods-of-prospective/softwares/59-micmac.html (accessed on 18 April 2022).
- Godet, M. Micmac. Software V 6.1.2; Lipsor: Paris, France, 2004. [Google Scholar]
- Heilgeist, S.; Sekine, R.; Sahin, O.; Stewart, R.A. Finding Nano: Challenges Involved in Monitoring the Presence and Fate of Engineered Titanium Dioxide Nanoparticles in Aquatic Environments. Water 2021, 13, 734. [Google Scholar] [CrossRef] [Scilit]
- Orenda. Understanding LSI: The Langelier Saturation Index. Orenda. 2022. Available online: https://blog.orendatech.com/langelier-saturation-index (accessed on 18 April 2022).
- Salter, C.; Langhus, D.L. The Chemistry of Swimming Pool Maintenance. J. Chem. Educ. 2007, 84, 1124. [Google Scholar] [CrossRef] [Scilit]
- De La Matter, D. Swimming Pool Chemistry. Available online: http://www.dougdelamatter.com/website1/science/chemistry/pool/pool1.pdf (accessed on 28 April 2022).
- Queensland Studies Authority. Extended Experimental Investigation: The Effect of Sunlight on the Chlorine Levels in Pools. Queensland Studies Authority. 2013. Available online: https://www.qcaa.qld.edu.au/downloads/senior/snr_chemistry_07_ass_chlorine.pdf (accessed on 28 April 2022).
- U.S. Department of Health and Human Services-Centers for Disease Control and Prevention. Fecal Incident Response Recommendations for Aquatic Staff. Healthy Swimming. 2018. Available online: https://www.cdc.gov/healthywater/swimming/pdf/fecal-incident-response-guidelines.pdf (accessed on 28 April 2022).
- Orenda. The Cyanuric Acid Limit for Public Swimming Pools. Orenda. 2020. Available online: https://blog.orendatech.com/cyanuric-acid (accessed on 28 April 2022).
- Falk, R.A. Chlorine/Cyanuric Acid Relationship and Implications for Nitrogen Trichloride. Available online: https://standards.nsf.org/apps/group_public/download.php/5891/Chlorine-CYA.pdf (accessed on 28 April 2022).
- Falk, R.A.; Blatchley, E.R.; Kuechler, T.C.; Meyer, E.M.; Pickens, S.R.; Suppes, L.M. Assessing the Impact of Cyanuric Acid on Bather’s Risk of Gastrointestinal Illness at Swimming Pools. Water 2019, 11, 1314. [Google Scholar] [CrossRef] [Scilit]
- Williams, K. Cyanurics-Benefactor or Bomb? 1997. Available online: http://citeseerx.ist.psu.edu/viewdoc/download?doi=10.1.1.175.9147&rep=rep1&type=pdf (accessed on 22 April 2022).
- Meyer, E. Over-Stabilization Explained. 2020. Available online: https://blog.orendatech.com/experts-blog/avoid-over-stabilization (accessed on 28 April 2022).
- Orenda. How to Reduce Cyanuric Acid (CYA) in a Swimming Pool. Orenda. 2020. Available online: https://blog.orendatech.com/how-to-reduce-cyanuric-acid-cya-in-a-swimming-pool (accessed on 28 April 2022).
- Missouri Department of Health and Senior Services Section for Environmental Public Health. Swimming Pool and Spa Water Chemistry. Available online: https://www.nitt.edu/home/students/facilitiesnservices/sportscenter/swimmingpool/Swim-pool-chemistry.pdf (accessed on 5 May 2022).
- Orenda. Understanding Algae. Orenda. 2022. Available online: https://blog.orendatech.com/understanding-algae (accessed on 5 May 2022).
- Askins, A. Cyanuric Acid in Commercial Swimming Pools and Its Effects on Chlorine’s “Staying Power” and Oxidation Reduction Potentails; North Carolina State University: Raleigh, NC, USA, 2013. [Google Scholar]
- Orenda. Phosphates, Algae, and Chlorine Demand. Orenda. 2022. Available online: https://blog.orendatech.com/phosphates-algae-chlorine-demand (accessed on 5 May 2022).
- Orenda. Phosphate Removal|Pillar 3. Orenda. 2022. Available online: https://blog.orendatech.com/phosphate-removal-pillar-3 (accessed on 5 May 2022).
- Lehutso, R.F.; Thwala, M. Assessment of Nanopollution in Water Environments from Commercial Products. Nanomaterials 2021, 11, 2537. [Google Scholar] [CrossRef] [Scilit] [PubMed]
- Lead, J.R.; Batley, G.E.; Alvarez, P.J.J.; Croteau, M.-N.; Handy, R.D.; McLaughlin, M.J.; Schirmer, K. Nanomaterials in the Environment: BEHAVIOR, Fate, Bioavailability, and Effects—An Updated Review. Environ. Toxicol. Chem. 2018, 37, 2029–2063. [Google Scholar] [CrossRef] [Scilit]
- Bundschuh, M.; Filser, J.; Lüderwald, S.; McKee, M.S.; Metreveli, G.; Schaumann, G.E.; Wagner, S. Nanoparticles in the Environment: Where Do We Come From, Where Do We Go to? Environ. Sci. Eur. 2018, 30, 1–17. [Google Scholar]
- Yuan, S.; Huang, J.; Jiang, X.; Huang, Y.; Zhu, X.; Cai, Z. Environmental Fate and Toxicity of Sunscreen-Derived Inorganic Ultraviolet Filters in Aquatic Environments: A Review. Nanomaterials 2022, 12, 699. [Google Scholar] [CrossRef] [Scilit]
- Abbas, Q.; Yousaf Amina, B.; Ali, M.U.; Munir, M.A.M.; El-Naggar, A.; Naushad, M. Transformation Pathways and Fate of Engineered Nanoparticles (ENPs) in Distinct Interactive Environmental Compartments: A Review. Environ. Int. 2020, 138, 105646. [Google Scholar] [CrossRef] [Scilit]
- Al-Abed, S.R.; Virkutyte, J.; Ortenzio, J.N.R.; McCarrick, R.M.; Degn, L.L.; Zucker, R.; Boyes, W.K. Environmental Aging Alters Al(OH)(3) Coating of TiO2 Nanoparticles Enhancing their Photocatalytic and Phototoxic Activities. Environ. Sci.-Nano 2016, 3, 593–601. [Google Scholar] [CrossRef] [Scilit]
- Virkutyte, J.; Al-Abed, S.R.; Dionysiou, D.D. Depletion of the Protective Aluminum Hydroxide Coating in TiO2-Based Sunscreens by Swimming Pool Water Ingredients. Chem. Eng. J. 2012, 191, 95–103. [Google Scholar] [CrossRef] [Scilit]
- In The Swim. Swimming Pool Clarifiers. In The Swim. 2022. Available online: https://intheswim.com/eguides/swimming-pool-clairifiers.html (accessed on 13 May 2022).
- Dhirasasna, N.; Suprun, E.; MacAskill, S.; Hafezi, M.; Sahin, O. A Systems Approach to Examining PhD Students’ Well-Being: An Australian Case. Systems 2021, 9, 17. [Google Scholar] [CrossRef] [Scilit]
- Omran, A.; Khorish, M.; Saleh, M. Structural Analysis with Knowledge-Based MICMAC Approach. Int. J. Comput. Appl. 2014, 86, 39–43. [Google Scholar] [CrossRef] [Scilit]
- Wojtowicz, J.A. Calcium Carbonate Precipitation Potential. J. Swim. Pool Spa Ind. 2001, 2, 51–57. [Google Scholar]
- Orenda. Calcium Crystals vs. Scale. Orenda. 2022. Available online: https://blog.orendatech.com/calcium-crystals (accessed on 21 May 2022).
- Wojtowicz, J.A. The Carbonate System in Swimming Pool Water. J. Swim. Pool Spa Ind. 2001, 4, 54–59. [Google Scholar]
- Wojtowicz, J.A. Effect of Cyanuric Acid on Swimming Pool Maintenance. J. Swim. Pool Spa Ind. 2004, 5, 15. [Google Scholar]
- Wojtowicz, J.A. The Effect of Cyanuric Acid and Other Interferences on Carbonate Alkalinity Measurement. J. Swim. Pool Spa Ind. 2001, 1, 7–13. [Google Scholar]
- Lewis, M.J.; Bamforth, C.W. pH. In Essays in Brewing Science; Lewis, M.J., Bamforth, C.W., Eds.; Springer: Boston, MA, USA, 2007; pp. 13–19. [Google Scholar]
- Covington, A.K.; Bates, R.; Durst, R. Definition of pH Scales, Standard Reference Values, Measurement of pH and Related Terminology (Recommendations 1984). Pure Appl. Chem. 1985, 57, 531–542. [Google Scholar] [CrossRef] [Scilit]
- Van Isle Water. What is Over Stabilization in a Swimming Pool or Spa. 2015. Available online: https://www.vanislewater.com/what-is-over-stabilization-in-a-swimming-pool-or-spa (accessed on 22 May 2022).
- Orenda. Different Types of Phosphates. Orenda. 2022. Available online: https://blog.orendatech.com/different-phosphates (accessed on 22 May 2022).
- In The Swim. Phosphate Contamination in Pools. In The Swim. 2014. Available online: https://blog.intheswim.com/phosphate-contamination-in-pools/ (accessed on 22 May 2022).
- Gonzalez, P. Understanding Phosphorus. Water Talk. 2021. Available online: https://www.cheminc.com/post/understanding-phosphorus (accessed on 11 April 2022).
- APSP Recreational Water Quality Committee. Total Dissolved Solids: Explained. Aqua Magazine, February 2019; Volume 44, pp. 34–37.
- Malvern Instruments. Zeta Potential: An Introduction in 30 Minutes. Zetasizer Nano Serles Tech. 2015, 1, 1–6. [Google Scholar]

Publisher’s Note: MDPI stays neutral with regard to jurisdictional claims in published maps and institutional affiliations. |
© 2022 by the authors. Licensee MDPI, Basel, Switzerland. This article is an open access article distributed under the terms and conditions of the Creative Commons Attribution (CC BY) license (https://creativecommons.org/licenses/by/4.0/).