


Abstract
The choice of a probability distribution function and confidence interval of estimated design values have long been of interest in flood frequency analysis. Although the four-parameter exponential gamma (FPEG) distribution has been developed for application in hydrology, its maximum likelihood estimation (MLE)-based parameter estimation method and asymptotic variance of its quantiles have not been well documented. In this study, the MLE method was used to estimate the parameters and confidence intervals of quantiles of the FPEG distribution. This method entails parameter estimation and asymptotic variances of quantile estimators. The parameter estimation consisted of a set of four equations which, after algebraic simplification, were solved using a three dimensional Levenberg-Marquardt algorithm. Based on sample information matrix and Fisher’s expected information matrix, derivatives of the design quantile with respect to the parameters were derived. The method of estimation was applied to annual precipitation data from the Weihe watershed, China and confidence intervals for quantiles were determined. Results showed that the FPEG was a good candidate to model annual precipitation data and can provide guidance for estimating design values.
1. Introduction
Hydrological frequency analysis is important for planning, designing and managing water resources projects. The design values (e.g., design flood, design rainfall) computed by frequency analysis involve uncertainties due to the sampling method, sample length, empirical frequency formula, cumulative distribution function (CDF) or probability density function (PDF), parameter estimation method, goodness-of-fit test, and extent of data extrapolation [1,2]. Among these uncertainty sources, there has been a considerable interest in the choice of CDF for a given sample, because the true CDF of a hydrological variable is unknown. Rao and Hamed summarized commonly used distributions: normal and related, gamma family, extreme value, Wakeby, and logistic as well as their application [3].
Further, quantifying the uncertainty of the estimated design values is important in the planning, design, and management of water resources projects [1,4]. In practice, standard error and confidence interval (confidence limits) are employed to measure the uncertainty of a statistical quantity [4]. Rao and Hamed provided confidence intervals of some common distributions, with parameters estimated by the method of moments (MOM), the probability weighted moments (PWM), and maximum likelihood estimation (MLE) [3]. Shin [5] and Shin et al. [6] summarized methods for computing confidence intervals. Methods of estimating the confidence intervals of design quantities include Monte Carlo simulation [7], approximate method [8], analytical method [5,9,10,11], asymptotic variance of the expected moments algorithm [12], bootstrap method [13,14,15,16], and standard error of regional population index flood (RPIF) [17]. Studies show that confidence intervals mainly depend on the method of estimation of the parameters of the probability distribution function.
The four-parameter exponential gamma (FPEG) distribution has been applied in hydrology in China and be specialized into 10 kinds of probability distribution functions: gamma, Pearson type III (P-III), K–M, Weibull, Chi-square, exponential, normal, Pearson type V (P-V), log-normal, and Gumbel. The properties of FPEG distribution and relations between this distribution and others, and its potential for application, have been investigated [18,19]. However, the MLE-based parameter estimation method and algorithms for computing confidence intervals of the design values for the FPEG distribution have received little attention.
The objective of this paper, therefore, is to present the MLE method for estimating the FPEG distribution parameters, and derive confidence intervals of quantiles using asymptotic variances. The method of parameter estimation involved a set of four equations which are solved by a three dimensional Levenberg–Marquardt algorithm. Following Kendall and Stuart [20], the expected values of the second-order partial derivatives of the log-likelihood function with respect to the parameters, and the explicit formulae for the variances and covariances are analytically derived. The proposed estimation procedure is illustrated by using observed annual precipitation data.
The paper is organized as follows. Describing the FPEG distribution and estimation of its quantiles. A set of four equations of the MLE method for parameters and confidence intervals of quantiles are derived in Section 2, followed by an application to annual precipitation from the Weihe watershed in China in Section 3. Conclusions, along with a summary of the main features of the proposed method, are given in Section 4.
2. Theory and Methodology
2.1. Probability Density Function and Cumulative Distribution Function
The FPEG distribution has the probability density function (PDF), f(x), expressed as [18,19]:
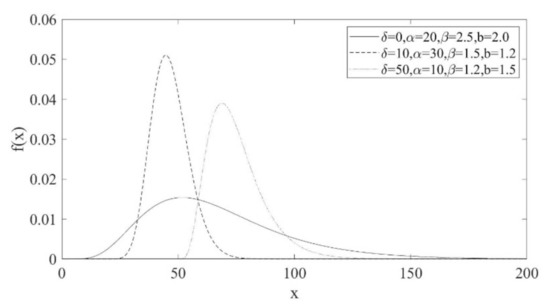
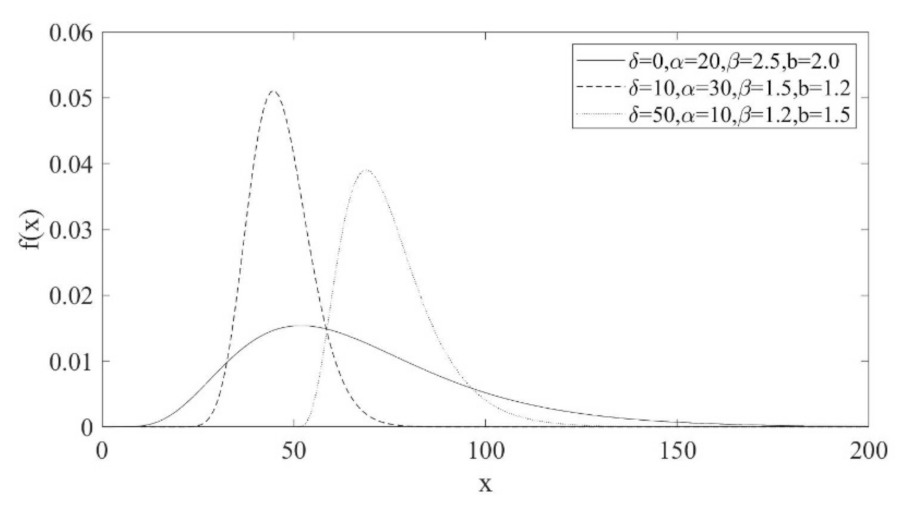
where is the shape parameter; is the scale parameter; is the location parameter; is the transformation parameter; is the complete gamma function; x is the value of the random variable X. Figure 1 shows some typical shapes of the PDF. The CDF can be expressed as
Figure 1.
Examples of the probability density function of the four-parameter exponential gamma distribution.
When the design frequency is given, its correspondance to design value (quantile) can be expressed as
Equation (2) can be transformed to a one-parameter gamma using the following transformation. Let , then , and , when , ; , substitution of these quantities into Equation (2) results in [18,19]:
where , which can be determined by the incomplete gamma function.
2.2. Estimation of Quantiles
The quantile corresponding to the probability of exceedance , , is obtained as
Also, the estimator may be generally written in terms of the mathematical expectation , the coefficient of variation , and the frequency factor as
Given the probability of exceedance , the frequency factor can be written in the following form [18,19]:
Note that from Equations (3) and (6), the frequency factor is a function of the probability of exceedance and parameters and . Some numerical values for such a function are shown in Table 1. For large (e.g., ) it is seen that the differences among the values for a given are subtle.
Table 1.
Frequency factors for the four-parameter exponential gamma distribution.
2.3. Maximum Likelihood Estimation of the Parameters
For the maximum likelihood estimation (MLE), the log-likelihood function for a sample drawn from the FPEG distribution can be written as
where is the sample size, ; ; .
The MLE parameters can be obtained by taking the derivatives of the log likelihood with respect to parameters, setting them equal to zero, and solving for the parameters. Differentiating Equation (7) partially with respect to each parameter and equating each partial derivative to zero yield
where is the digamma function.
Equations (8)–(11) can be solved numerically to obtain parameters , , , and .
2.4. Confidence Intervals of Quantiles
For a given , the design value estimate is a random variable. The 1 − q confidence intervals for the population quantiles may be determined by [2,3]
where is the quantile of the standard normal distribution, is the quantile estimator corresponding to the probability of exceedance which can be determined from Equation (4) or Equation (5), and is the standard deviation or standard error of . Such standard error determined by the MLE is given in what follows.
For the FPEG distribution, when parameters , , , and are estimated by the MLE, is a function of , , , and :
The variance in this case is given by [21]
The variance and covariance matrix of parameters in Equation (13) is the inverse of Fisher’s expected information matrix [3].
where E represents the expected value;
is the sample information matrix;
is Fisher’s expected information matrix, the elements of which can be determined by taking the expected value of the sample information matrix. Its elements are derived in Equations (A1)–(A16) and Equations (A17)–(A32) in Appendix A, respectively.
The derivatives of with respect to the parameters of the FPEG distribution are obtained from Equation (4) as
For in Equation (33), is a constant and is a function of and in Equation (3). Thus, we can get , which reduces to
where is the psi function with a different meaning in Equation (9); is the incomplete gamma function; can be numerically calculated by the central difference of . Some values obtained numerically are listed in Table 2.
Table 2.
values under different probabilities of exceedance .
Finally, the expression of in Equation (33) can be obtained by substituting Equations (37) and (38) into Equation (36). Table 3 shows some values obtained numerically.
Table 3.
Values under different probabilities of exceedance .
3. Data and Case Study
Annual precipitation data from eight sites in the Weihe watershed, China, (1959–2007) were applied to compute the parameters, quantiles, and confidence intervals for the FPEG distribution. All data were obtained from the National Climate of China Meteorological Administration (http://data.cma.cn (accessed on 29 July 2021)) and are complete. The sites and some statistical characteristics of data are summarized in Table 4. It was seen that for annual precipitation from these eight sites, the values of skewness were lower than 1 and the values of kurtosis were higher than 3. All the annual precipitation records also had very low first-order serial correlation coefficients. Using Anderson’s test of independence, results showed that these gauge data are independent at the 90% confidence level. Hence, they are considered suitable for precipitation frequency analysis. One of the advantages of the FPEG distribution is that it accommodates a wide range of skewness and kurtosis values, which is one reason it was applied to these sites.
Table 4.
Characteristics of data used for parameter estimation of case study sites.
3.1. Parameters Estimation
Since there is no explicit solution for the parameters in Equations (8)–(11), the three dimensional Levenberg-Marquardt algorithm was used to obtain a numerical solution for the MLE estimates of , , , and . The procedure is summarized as follows [22].
- (1)
- From Equation (10), one gets . Substituting this quantity into Equations (8), (9), and (11), respectively, the result is the system of nonlinear Equations as
- (2)
- Employ the three dimensional Levenberg-Marquardt algorithm to solve for parameters , and :where is the scaling factor; and are the parameter matrix estimates and at iteration and , respectively; is the three dimensional identity matrix; ; is the Jacobian matrix at iteration , the elements of the Jacobian matrix can be numerically calculated by central difference or their first derivatives derived in Equations (A73)–(A85); is the transpose matrix of . Throughout this paper the iterative procedure was repeated until the relative change in all parameters was less than 0.01%, that is, .
- (3)
- After obtaining parameters , and , and substituting these quantities in , one obtains parameter .
The values of the distribution parameters are given in Table 5. For eight sites, the values of fell in the range (72, 92), the values of were higher than 4, and the values of were lower than 0.1, with one of them being even as high as 1.75. The sixth, seventh and eighth columns show the computed quantities of the left side functions in Equations (8), (9), and (11). It is seen that these computed quantities were close to zero, indicating a satisfactory performance of the three dimensional Levenberg-Marquardt algorithm.
Table 5.
Parameter values estimated for case study sites.
3.2. Goodness-of-Fit Tests and Confidence Interval Calculation
Goodness-of-fit tests are designed to measure the agreement between a theoretical probability distribution and an empirical distribution for a random sample. Here, we used the Kolmogorov–Smirnov (K–S) test for the goodness-of-fit test of the FPEG distribution. The K–S test is also called empirical distribution function test statistic, because it measures the distance between a continuous distribution function and the empirical distribution function.
Let be order statistics for a sample size whose population is defined by a continuous cumulative distribution function and be a specified distribution that contains a set of parameters ( is the value estimated from a sample size ). For an annual precipitation series, the null hypothesis that the true distribution was with parameters was tested. The K–S test can be expressed as [2]:
The sample values of the K–S test statistic are shown in Table 6. The critical value of the FPEG distribution (at the significance level a = 0.05, for sample size ) was 0.1940. It is seen that the statistics of observed annual precipitation were all less than their corresponding critical value, respectively, so that annual precipitation series were all accepted by the K–S test.
Table 6.
Sample values of K–S test statistic for case study sites.
For the FPEG distribution and the values of standard errors of the quantile estimates using the above methods, the 95 percent confidence intervals may be set at standard errors around the values. Table 7 shows the quantiles and confidence interval widths estimated by the above methods for different probabilities of exceedance. For example, annual precipitation at Binxian site was 465.56 mm. Using Equation (12), a 95% confidence interval for the annual precipitation was 430.66 mm to 500.47 mm, its width was 69.80 mm. From Table 7, It is seen that for p = 30–90% the confidence interval widths estimated were much less than those for and .
Table 7.
Quantiles and confidence intervals for case study sites.
4. Conclusions
The use of the FPEG distribution has received only limited attention from the hydrologic community, but some investigations in China suggest that this distribution performs well in modeling hydrological data. The MLE is proposed for determining the parameters and confidence intervals of the FPEG distribution. It involves parameter estimation and asymptotic variances of quantile estimators. The parameter estimation formulas constitute a system of nonlinear equations that have tedious forms. However, this should not be an insurmountable difficultly with the Levenberg–Marquardt algorithm, given the available numerical tools and computer power. An analytical expression of sample information matrix and Fisher’s expected information matrix, and derivatives of design value with respect to the parameters were then derived. The asymptotic variances of the MLE quantile estimators for the FPEG distribution were expressed as a function of the probability (return period), parameters and sample size. Such variances can be employed for estimating the confidence intervals of the FPEG distribution quantiles. The FPEG distribution is applied to precipitation data of the Weihe watershed in China. The observed annual precipitation data were all accepted by the Kolmogorov–Smirnov test. These results showed that the FPEG distribution is a good candidate for modelling annual precipitation data. We expect that our results will provide guidance for estimating design values of random variables in other parts of world. In addition, Bayesian inference is a very good method for inferring the estimation of parameters from quantile parameters of the FPEG distribution, and will be studied further.
Author Contributions
Conceptualization, methodology, writing—original draft, S.S.; Data curation, writing—original draft, Y.K. and X.S.; Writing-review & editing, V.P.S. All authors have read and agreed to the published version of the manuscript.
Funding
This research was funded by National Natural Science Foundation of China, grant number 52079110.
Institutional Review Board Statement
Not applicable.
Informed Consent Statement
Not applicable.
Data Availability Statement
The data that support the findings of this study are available from the National Meteorological Information Center of China Meteorological Administration (CMA) and can be accessed via fpt upon requesting the corresponding author.
Acknowledgments
The observed hydrologic data are from the National Meteorological Information Center of China Meteorological Administration (CMA). The authors acknowledge the financial support of National Natural Science Foundation of China (Grant Nos. 52079110). The authors also wish to express their cordial gratitude to the editors, and anonymous reviewers for their illuminating comments which have greatly helped to improve the quality of this manuscript.
Conflicts of Interest
The authors declare no conflict of interest.
Appendix A
Appendix A.1. Sample Information Matrix
The partial derivatives of the log likelihood model in Equation (15) with respect to parameters , , , and can be expressed as
Appendix A.2. Fisher’s Expected Information Matrix
Multiplying Equations (A1)–(A16) and taking mathematical expectation, the elements of Fisher’s expected information matrix can be obtained as:
Because the above equations have some unknown mathematical expectations, these expectations need to be derived first.
Let , then . Therefore, Equation (A33) becomes
In particular,
,
Let , then , Equation (A37) yields
In particular,
,
Let , then , Equation (A41) produces
Following , Equation (A42) can be written as
In particular,
,
Let , then , Equation (A45) becomes
In particular,
Let , then , Equation (A49) becomes
Let , then , Equation (A51) yields
In particular,
Let , then , Equation (A54) yields
In particular,
Substitution of equations of Equations (A33)–(A56) into Equations (A17)–(A32), we can get the elements of the expected information matrix.
Appendix A.3. Jacobian Matrix
Let and , Equation (A79) becomes to
where
Let and , Equation (A83) becomes to
where
References
- Chowdhury, J.U.; Stedinger, J.R. Confidence interval for design floods with estimated skew coefficient. J. Hydrol. Eng. 1991, 117, 811–831. [Google Scholar] [CrossRef] [Scilit]
- Meylan, P.; Favre, A.C.; Musy, A. Predictive Hydrology: A Frequency Analysis Approach; Science Publishers: Jersey, UK, 2012. [Google Scholar]
- Rao, A.R.; Hamed, K.H. Flood Frequency Analysis; CRC Press LLC: Washington, DC, USA, 2000. [Google Scholar]
- Tung, Y.K.; Yen, B.C.; Melching, C. Hydrosystems Engineering Reliability Assessment and Risk Analysis; McGraw-Hill: New York, NY, USA, 2006. [Google Scholar]
- Shin, H. Uncertainty Assessment of Quantile Estimators Based on the Generalized Logistic Distribution; Yonsei University: Seoul, Korea, 2009. [Google Scholar]
- Shin, H.; Nam, W.; Heo, J.H. Confidence Intervals of Quantiles for the Generalized Logistic Distribution; AHR CONGRESS. 2005. Available online: http://hydro-eng.yonsei.ac.kr/data_files/Confidenceintervalsofquantilesforthegeneralizedlogisticdistribution.pdf (accessed on 16 September 2005).
- Whitley, R.J.; Hromadka, T.V. Chowdhury and Stedinger’s approximate confidence intervals for design floods for a single site. Stoch. Hydrol. Hydraul. 1997, 11, 51–63. [Google Scholar] [CrossRef] [Scilit]
- Ashkar, F.; Quarda, T.B.M.J. Approximate confidence intervals for quantiles of gamma and generalized gamma distribution. J. Hydrol. Eng. 1998, 3, 43–51. [Google Scholar] [CrossRef] [Scilit]
- Heo, J.H.; Salas, J.D.; Kim, K.D. Estimation of confidence intervals of quantiles for the Weibull distribution. Stochastic Environ. Res. Risk Assess. 2001, 15, 284–309. [Google Scholar] [CrossRef] [Scilit]
- Khalidou, M.B.; Carlos, D.D.; Alin, C. Confidence intervals of quantiles in hydrology computed by an analytical method. Nat. Hazard. 2001, 24, 1–12. [Google Scholar] [CrossRef] [Scilit]
- Serinaldi, F. Analytical confidence intervals for index flow flow duration curves. Water Resour. Res. 2011, 47, W02542. [Google Scholar] [CrossRef] [Scilit]
- Cohn, T.A.; Lane, W.L.; Stedinger, J.R. Confidence intervals for expected moments algorithm flood quantile estimates. Water Resour. Res. 2001, 37, 1695–1706. [Google Scholar] [CrossRef] [Scilit]
- Burn, D.H. The use of resampling for estimating confidence intervals for single site and pooled frequency analysis. Hydrol. Sci. J. 2003, 48, 5–38. [Google Scholar] [CrossRef] [Scilit]
- Dunn, P.K. Bootstrap confidence intervals for predicted rainfall quantiles. Int. J. Climatol. 2001, 21, 89–94. [Google Scholar] [CrossRef] [Scilit]
- Rust, H.W.; Kallache, M.; Schellnhuber, H.J.; Kropp, J.P. Confidence intervals for flood return level estimates assuming long-range dependence. In Extremis: Disruptive Events and Trends in Climate and Hydrology; Springer: Berlin/Heidelberg, Germany, 2011. [Google Scholar]
- Schendela, T.; Thongwichian, R. Flood frequency analysis: Confidence interval estimation by test inversion bootstrapping. Adv. Water Resour. 2015, 83, 1–9. [Google Scholar] [CrossRef] [Scilit]
- Sveinsson, O.G.B.; Salas, J.D.; Boes, D.C. Uncertainty of quantile estimators using the population index flood method. Water Resour. Res. 2003, 39, 1206. [Google Scholar] [CrossRef] [Scilit]
- Sun, J.; Qin, D.; Sun, H. Generalized Probability Distribution in Hydrometeorology; China Water and Power Press: Beijing, China, 2001. [Google Scholar]
- Wang, H.; Qin, D.; Sun, J.; Wang, J. Study on the general model of hydrological frequency analysis. Sci. China Ser. E Eng. Mater. Sci. 2001, 44, 52–61. [Google Scholar] [CrossRef] [Scilit]
- Kendall, M.G.; Stuart, A. The Advanced Theory of Statistics. Vol. 2 Inference and Relationship; Charles Griffin: London, UK, 1979. [Google Scholar]
- Kite, G.W. Frequency and Risk Analysis in Hydrology; Water Resources Publications: Littleton, CO, USA, 1977. [Google Scholar]
- Gavin, H.P. The Levenberg-Marquardt method for nonlinear least squares curve-fitting problems. Comput. Sci. 2013, 1–17. Available online: http://people.duke.edu/~hpgavin/ce281/lm.pdf (accessed on 29 July 2021).

Publisher’s Note: MDPI stays neutral with regard to jurisdictional claims in published maps and institutional affiliations. |
© 2021 by the authors. Licensee MDPI, Basel, Switzerland. This article is an open access article distributed under the terms and conditions of the Creative Commons Attribution (CC BY) license (https://creativecommons.org/licenses/by/4.0/).