


Abstract
Despite numerous studies on Arctic wave climate changes associated with sea ice retreat, the spatiotemporal relationship between wind variability and significant wave heights in the Eurasian Arctic remains insufficiently understood. This study analyzes wave and wind variability in the Eurasian Arctic seas for 1979–2025 using the spectral wave model WAVEWATCH III. The quality of the modeling was verified against satellite altimetry and buoy data; the average correlation coefficient exceeded 0.9, and the RMSE was 0.368 m. An analysis of 3-h significant wave height (Hs) and wind speed data revealed positive trends in mean annual Hs across the Arctic, with the strongest statistically significant increases in the Barents and Kara Seas. Extreme wave conditions (95th percentile) showed the largest growth in the Kara, East Siberian, and Chukchi Seas. During ice-free periods, significant trends were weaker and more localized, although positive trends persisted near the Northern Sea Route. Mean wind speed trends were generally positive but mostly statistically insignificant. The results provide a spatially consistent characterization of long-term changes in wind and wave climate under evolving sea-ice conditions and may be used to inform assessments of navigation conditions and associated risks along the Northern Sea Route.
1. Introduction
The cargo throughput along the Northern Sea Route (NSR) reached 36.3 million tons in 2023 [1]. Over the last decade, shipping activity along the NSR has increased substantially, with cargo volumes growing more than an order of magnitude [2]. These changes are driven not only by technological development but also by ongoing climatic changes in the region.
Climate change in the Arctic has both negative and positive consequences. One such positive effect is the improvement of ice conditions for the development of the NSR.
Recent studies have also demonstrated the potential of advanced computational approaches, including deep learning methods, for improving seasonal navigability forecasts and environmental simulations [3,4].
According to a forecast utilizing an ensemble of CMIP6 models, by the end of the century, the duration of the navigation season along the Northern Sea Route could range from 2.5 to 3.5 months under the SSP2-4.5 scenario (moderate impact) and from 4 to 5.5 months under the SSP5-8.5 scenario (aggressive impact) [5].
Reduced ice coverage is also expected to enhance oceanic and atmospheric interactions and improve accessibility for different ship classes during future decades [6,7].
All future scenarios and decades indicate an increase in coastal wave heights, demonstrating how the extended open-water season in the Chukchi and Beaufort Seas could expose the Arctic coastline of Alaska to storm-driven wave impacts for an additional month during the winter by 2050 and for up to three additional months by 2070, depending on the climate scenario [8]. However, as the seasonal ice cover diminishes, a significant trend toward increased wave heights along the Northwest Passage maritime route is observed in July and November, with the timing of peak wave heights shifting from September to a later period in the season [9]. Recent risk assessment studies have identified sea ice conditions, visibility, temperature, waves, and winds as key factors controlling Arctic navigation risks [10].
Estimates of Arctic sea ice variability have been obtained using both numerical modeling approaches [11,12,13,14,15] and satellite observations [16,17,18,19]. These studies provide complementary perspectives on long-term changes in sea ice conditions and form the basis for assessing the future navigability of the NSR.
Based on data from coastal stations and satellite measurements, a study was conducted in the East Siberian Sea to investigate changes in the ice-free period [20]. The analysis revealed trends toward later freeze-up dates and earlier break-up dates; however, only the trends for later ice formation proved to be statistically significant.
The reduction in sea ice extent leads to an increase in open water areas, which leads to changes in the wind–wave regime. It is rather difficult to separate the contributions of changes in wind speed and ice extent to variations in wind wave parameters due to the existing feedback mechanisms between these factors. An increase in open water area undoubtedly affects wave development as the fetch increases. However, over open water, surface roughness changes, and more intensive turbulent heat exchange begins, which leads to changes in the wind field over the area; these changes, in turn, affect wind wave development.
In [21], based on long-term hindcast wave modeling, positive trends in extreme wave heights are demonstrated, particularly for the Beaufort Sea and the East Siberian Sea. According to other estimates [22,23], the annual probability of destructive extreme waves occurring along the Beaufort Sea coast will rise from the 1 in 20 level observed in the late 20th century to a range of 1 in 5 to 1 in 2 by 2100. In the Beaufort Sea, during periods of maximum open-water extent, the percentage of extreme events caused by cyclones has increased from approximately 50% to nearly 80% over the past four decades [24].
A similar analytical approach has been applied to the Barents and Kara Seas in [25,26]. Furthermore, Ref. [21] reported an increase of nearly 60% in 100-year return period wave heights, which corresponds to the reduction in sea ice. This article also presents estimates of wind speed increase (approximately 5%); however, its influence on extreme wave heights was described as minor. The relationship between increasing ice-free water area and increasing mean wave height in the Chukchi and Beaufort Seas is also reported in [27]. On the other hand, a strong correlation between increasing extreme wind speeds and increasing extreme wave heights in Arctic seas was identified in [28].
The influence of sea ice representation on Arctic wave modeling has also been investigated, demonstrating the importance of accurate ice forcing for reproducing storm-wave conditions [29].
Seasonal analyses based on reanalysis datasets indicate increasing autumn wave heights associated with both stronger winds and delayed ice formation [30,31]. In [31], based on a 38-year reanalysis dataset, it is concluded that the maximum significant wave height in the region from the Laptev Sea to the Beaufort Sea increases during October from 2.3 m to 3.1 m. Further studies confirm that changes in wave energy flux are linked not only to wind variability but also to decreasing ice cover, which may accelerate ice breakup processes [32,33]. Future projections using climate model ensembles suggest continued increases in significant wave height under high-emission scenarios [34,35].
Under the SSP5-8.5 emissions scenario, changes in Hs are expected to be stronger than under the SSP1-2.6 scenario. Predicting wave heights using machine learning is emerging as a promising direction in modern oceanography [36].
Recent advances in numerical modeling and machine-learning approaches demonstrate the growing potential of computational methods for representing complex wind–wave interactions under changing environmental conditions [37,38,39].
Wind waves in the seas of the Eurasian Arctic are less extensively covered in the literature, especially in domestic studies, as shown in the review [40]. Review studies [25,26] described the regime and extreme characteristics of waves in the Kara and Barents Seas. In particular, they provided information on wave heights corresponding to return periods of 1, 5, 10, 25, 50, and 100 years. According to estimates for the Barents Sea, 3% exceedance probability wave heights with a 100-year return period reach 19 m, while for the Kara Sea they reach 11.1 m. Nevertheless, regarding the Barents Sea, some papers [41] indicate periods during which the frequency of storms (with wave height >5 m) decreased frequency (1991–2002 and 2010–2015).
In [42], an approach for rapid estimation of wave heights in the Arctic region based on wind fields derived from satellite scatterometer measurements is presented.
Studies focusing on the eastern sector of the Eurasian Arctic are considerably fewer than those devoted to the Barents and Kara Seas. One of the more recent studies described wind wave conditions in the East Siberian and Chukchi Seas for the period 2000–2015 [43]. In this study, it was found that the maximum significant wave height does not exceed 3 m in the East Siberian Sea and 7 m in the Chukchi Sea. The authors also concluded that wave activity has increased and that it contributes to deeper wave-induced mixing.
Previously, our research group has carried out several studies devoted to the modeling of wind waves in the Arctic [35,44,45] as well as to the analysis of storm activity [46,47].
Despite extensive research on Arctic sea ice changes and wave climate variability, the spatial coherence of long-term wind–wave trends and the relative contributions of wind and ice conditions remain insufficiently quantified for the Eurasian Arctic marginal seas. The number of studies focusing specifically on the eastern sector of the Eurasian Arctic is particularly limited.
The objective of this study is to investigate the spatiotemporal trends of wind–wave characteristics and wind regimes in the Eurasian Arctic marginal seas over the period 1979–2025 and to quantify their interrelationships under changing ice conditions. The novelty of this work lies in the combined analysis of a long-term, high-resolution, regionally consistent modelling dataset, covering nearly five decades of continuous simulation, together with a joint assessment of wind, wave, and sea-ice-related variability at the scale of individual grid cells.
Trend estimates are evaluated using both parametric (linear regression) and non-parametric approaches. The results provide a spatially consistent characterization of long-term changes in wind and wave climate under evolving sea-ice conditions and may be used to inform assessments of navigation conditions and associated risks along the Northern Sea Route.
2. Data and Methods
2.1. Study Area
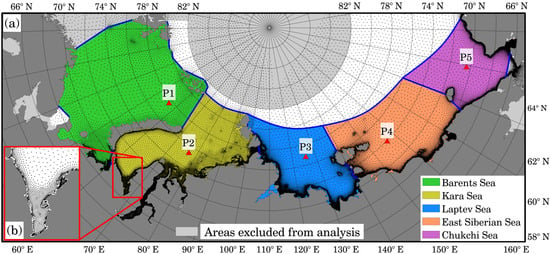
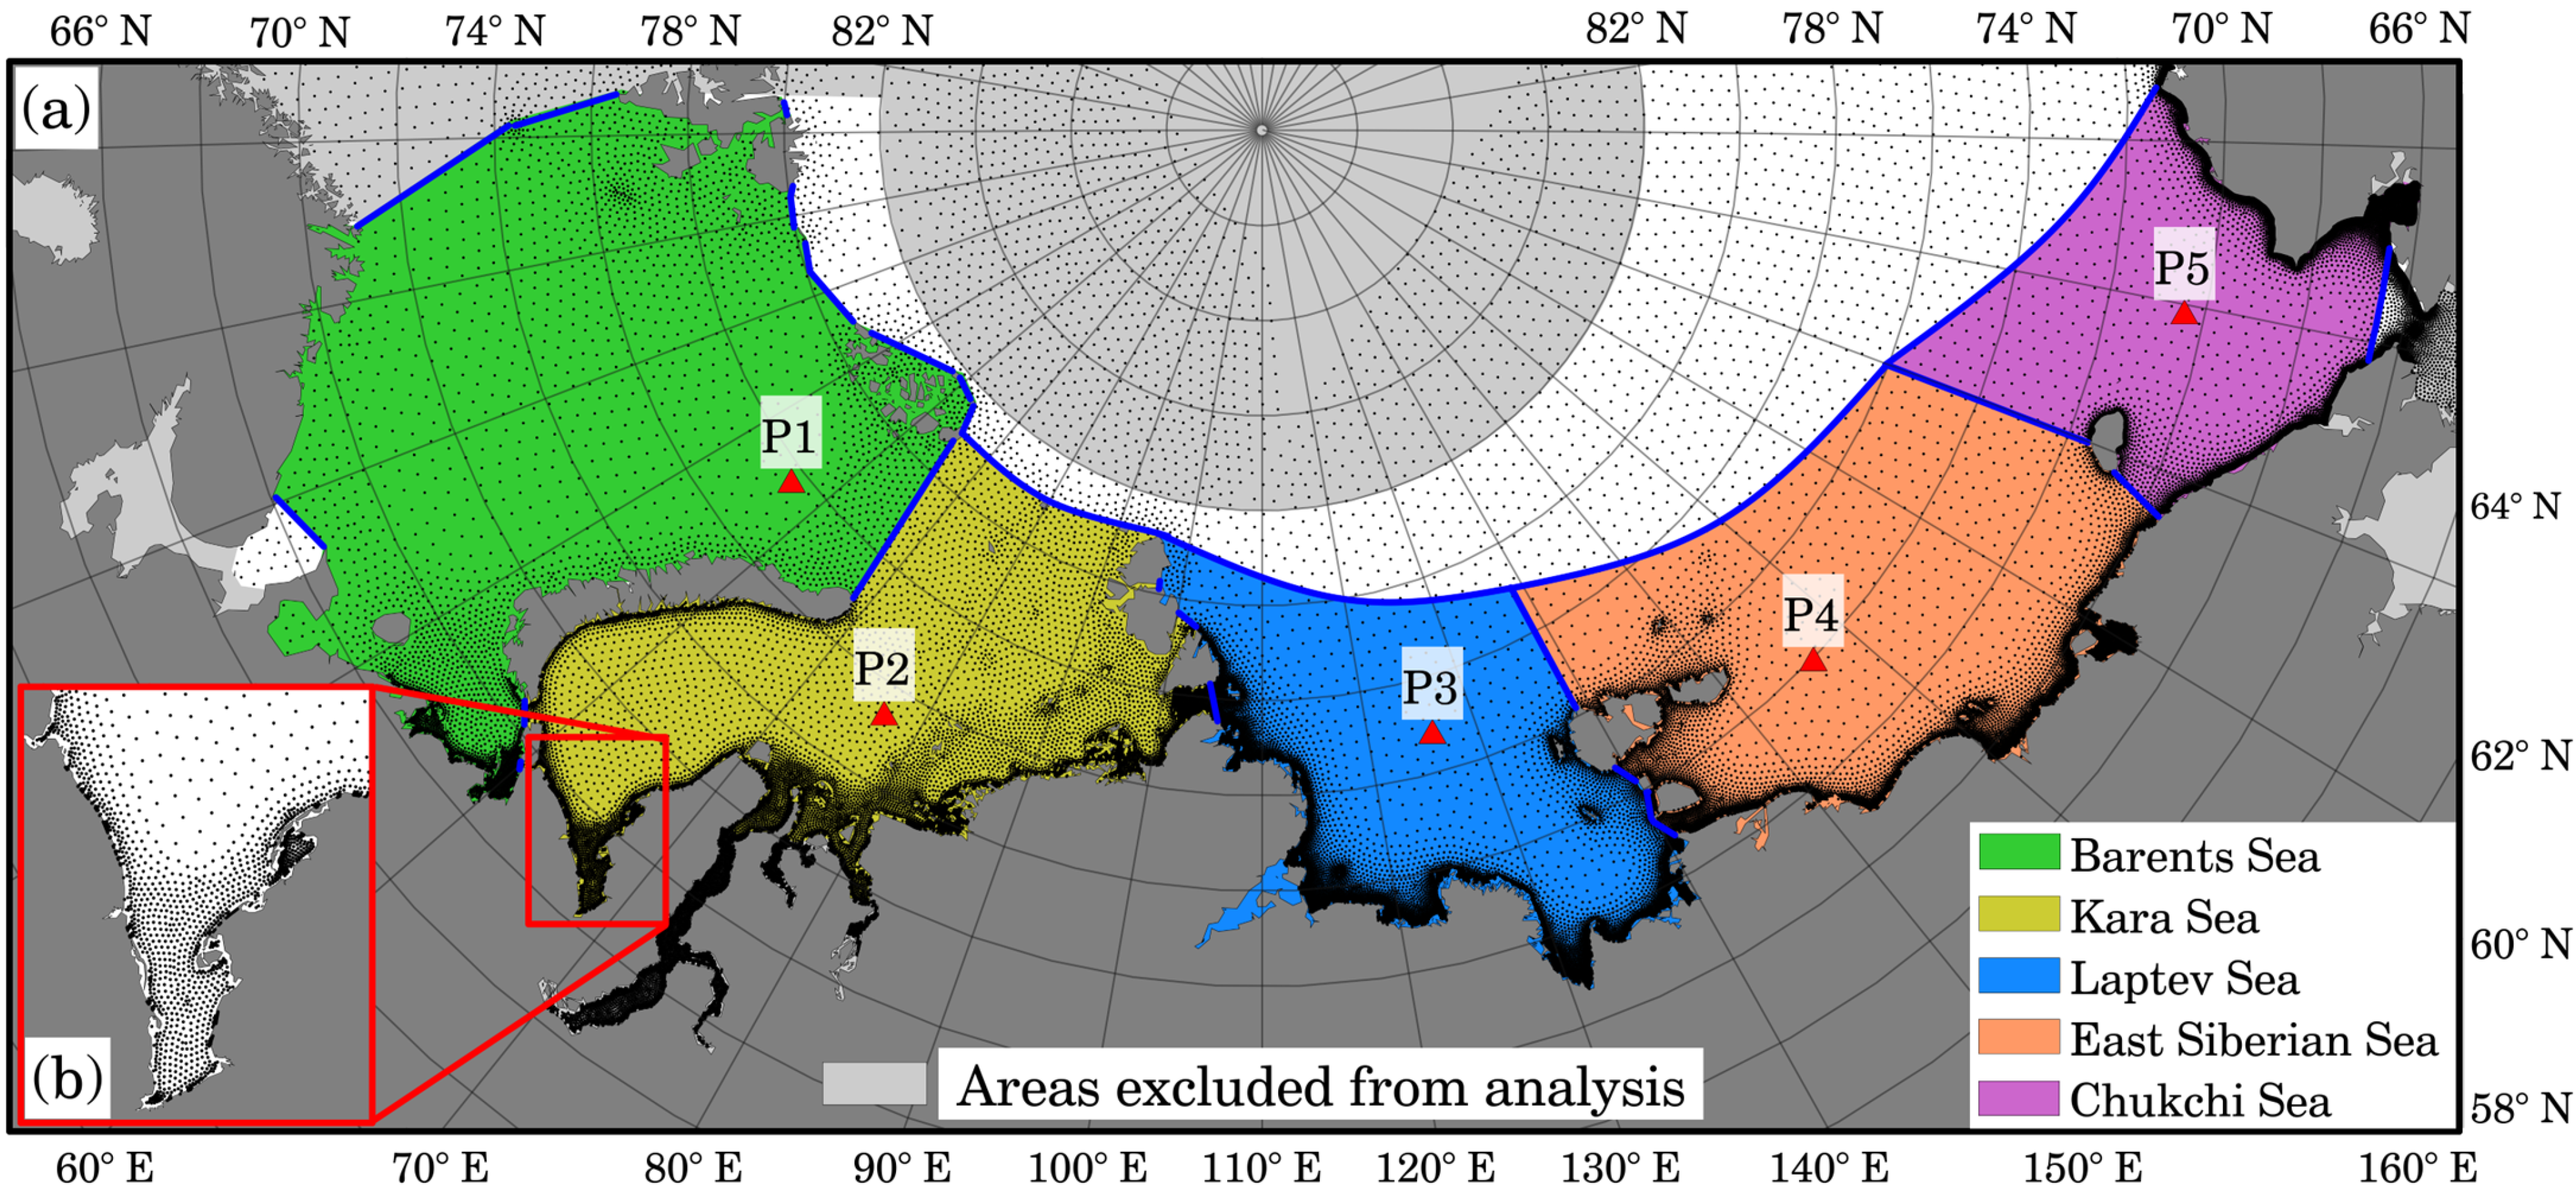
Wave modeling was performed using two unstructured grids for all the studied seas (Figure 1). The unstructured grid for the Barents and Kara seas also covers part of the North Atlantic; the computational grid for the Laptev, East Siberian, and Chukchi seas also covers part of the Arctic Ocean. However, only the studied regions are shown in the figure. In the figure, black dots indicate the nodes of the computational grid. Red lines indicate the boundaries of the Baydaratskaya Bay region, zoomed in to a minimap to demonstrate the spatial resolution along the coast. Blue lines indicate the boundaries of the seas. The spatial resolution was ~20 km in the central and open parts of the seas and 700 m in coastal zones, with a total of 73,905 nodes. Light gray color indicates areas where trend analysis was not conducted, namely, in the Norwegian, White, and Bering Seas, as well as north of 82 N. Continents and islands are shown in dark grey.
Figure 1.
Panel (a) shows portions of the computational grids used for the studied seas. Black dots represent computational grid nodes. The node density increases toward the coast, as illustrated by the Baydaratskaya Bay example in panel (b). Blue lines indicate the boundaries of the studied seas.
The coordinates of the selected points are presented in Table A1.
2.2. Wave Modelling and Model Quality Assessment
Wind-wave conditions in the Eurasian Arctic seas (Barents, Kara, Laptev, East Siberian, and Chukchi Seas) were simulated using the WAVEWATCH III wave model [48]. Wind forcing was derived from the high-resolution NCEP/CFSR/CFSv2 reanalysis for the period 1979–2025. The reanalysis data are characterized by a spatial resolution of approximately 0.2–0.3° and a temporal resolution of 1 h. Sea ice fields were also obtained from the NCEP/CFSv2 reanalysis product. Calculations were performed on an unstructured triangular mesh.
Wave generation processes were represented using the ST6 source term parameterization [48]. A detailed description of the model configuration and its adaptation to Arctic conditions has been provided in previous studies [44,45,49].
Model performance has been evaluated using buoy and satellite-derived significant wave height (SWH) observations. High-quality model validation across different Arctic marginal seas has been demonstrated in previous studies, including the Kara Sea [44] and the Laptev, East Siberian, and Chukchi Seas [50]. It was found in earlier work that the use of the COSMO-CLM atmospheric forcing instead of the NCEP/CFSv2 reanalysis did not lead to a significant improvement in wave simulation skill; therefore, the latter dataset was selected for the present study.
To assess model quality, we used buoy and satellite SWH data. In previous studies, various authors of the present study have already shown the high-quality validation [44,45,47] (Table 1).
Table 1.
Basic statistical parameters of model quality assessments.
For the Barents Sea, model performance was evaluated using CryoSat satellite data for the period 2010–2017 (IMOS database; [51]). The correlation coefficient (R) was 0.88, the BIAS was −0.04 m, the RMSE was 0.53 m, and the scatter index was 0.28 [44]. Assessments of the model quality for the White Sea, based on simulations conducted by our research group, are presented in [52]. According to a comparison with satellite altimetry, RMSE = 0.32 m and R = 0.92. The obtained correlation coefficient for values with a time step of 3 h is better than that presented in [53], where with a step of 6 h (±0.5 h) the coefficient was equal to 0.75. These results are consistent with those reported in previous studies [30,54].
In the Kara Sea, instrumental wave measurements were used for model validation. Wind and wave parameters were measured using an upward-looking IPS-5 sonar for ice profiling and were published in [54]. The correlation coefficient (R) was 0.94, the BIAS was 0.08 m, the RMSE was 0.31 m, and the scatter index was 0.28. A systematic overestimation of Hs (0.2–0.4 m) was observed for several storm events [44].
For the eastern Arctic seas, model results were compared with wave observations from NDBC Station 48213 (71.502° N, 164.133° W; [55]) for 2012. The correlation coefficient (R) was 0.95, the BIAS was −0.05 m, the RMSE was 0.27 m, and the scatter index was 0.16. The comparison indicates a slight underestimation of wave heights [45].
Overall, the validation results obtained by the authors correspond to those reported in other studies [21,24,28,30] and, in some cases, demonstrate improved performance [53,56,57]. This confirms that the model output is suitable for further analysis of climate-induced changes in wind-generated waves in the Arctic.
2.3. Materials and Methods
The modeling results include wind–wave characteristics with a temporal resolution of 3 h for the period 1979–2025 (47 years). For each grid node of the computational domain (73,905 nodes), annual statistics were computed, including mean, maximum, and 95th percentile significant wave height; mean and 95th percentile wind speed (both for wind speed magnitude and its U and V components); and ice-cover duration defined using a prescribed ice concentration threshold.
A critical sea ice concentration of 0.15 was adopted following [58], which is commonly used to distinguish open-water conditions from ice regimes.
These annual time series (47 values per variable and grid node) were subsequently analyzed for the presence of long-term trends. Each grid cell was treated as an independent time series. Grid points were excluded from the trend analysis if the variance of the time series was below 10−6 or if the number of valid ice-free years was fewer than 10.
Given the known persistence and temporal autocorrelation in climate-related time series, both parametric and non-parametric approaches were applied and compared in order to ensure the robustness of the results.
The parametric approach is based on ordinary least squares linear regression:
where the slope coefficient represents the linear trend. For each grid node, regression parameters were estimated, and their statistical significance was assessed using Student’s t-test for regression coefficients and the Fisher F-test for overall model adequacy. A trend was considered statistically significant only when both regression coefficients were significant at the 5% level, and the model passed the F-test. This approach is consistent with previous studies [46,49].
The non-parametric approach is based on the modified Mann–Kendall test [59] combined with Sen’s slope estimator. This method accounts for serial autocorrelation through variance correction based on significant autocorrelation structure. Calculations were performed using the Python package pyMannKendall (version 1.4.3) [60] with default settings. Sen’s slope estimator was used as a robust measure of trend magnitude [61].
The consistency between parametric and non-parametric trend estimates was evaluated as a robustness check of the results.
Trend analysis was performed for both the full simulation period and for the ice-free period separately. The ice-free period at each grid node was defined as time steps when sea ice concentration was below 0.5. The calculation of trends for the entire period assumes that if the ice concentration value at a given grid node exceeded 0.5 (expressed as a fraction), the wave height was treated as zero and included in the calculation of annual values. The “ice-free period” is defined as follows: if the ice concentration at a computational grid node exceeds 0.5, the wave height value is replaced with NaN and excluded from the calculations.
Wind speed trends were computed exclusively for the ice-free period to avoid artificial suppression of wind–wave generation in ice conditions.
Ice-related trends were derived using the same ice concentration threshold (0.15). For each grid node, the number of days per year with ice concentration exceeding this threshold was calculated, and trends were then estimated from the resulting annual time series.
All computations were performed in Python (version 3.12.3). Spatial maps were produced using Surfer software (version 18.1.186). To improve the visual smoothness of isolines, a 3 × 3 Gaussian low-pass filter was applied during map generation.
3. Results
3.1. Spatial Patterns of Significant Wave Height Trends
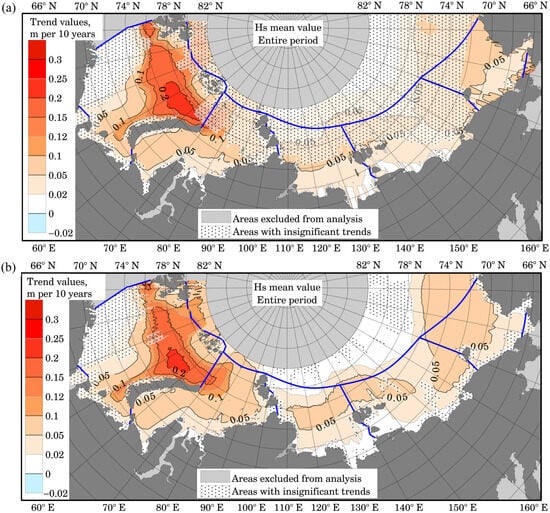
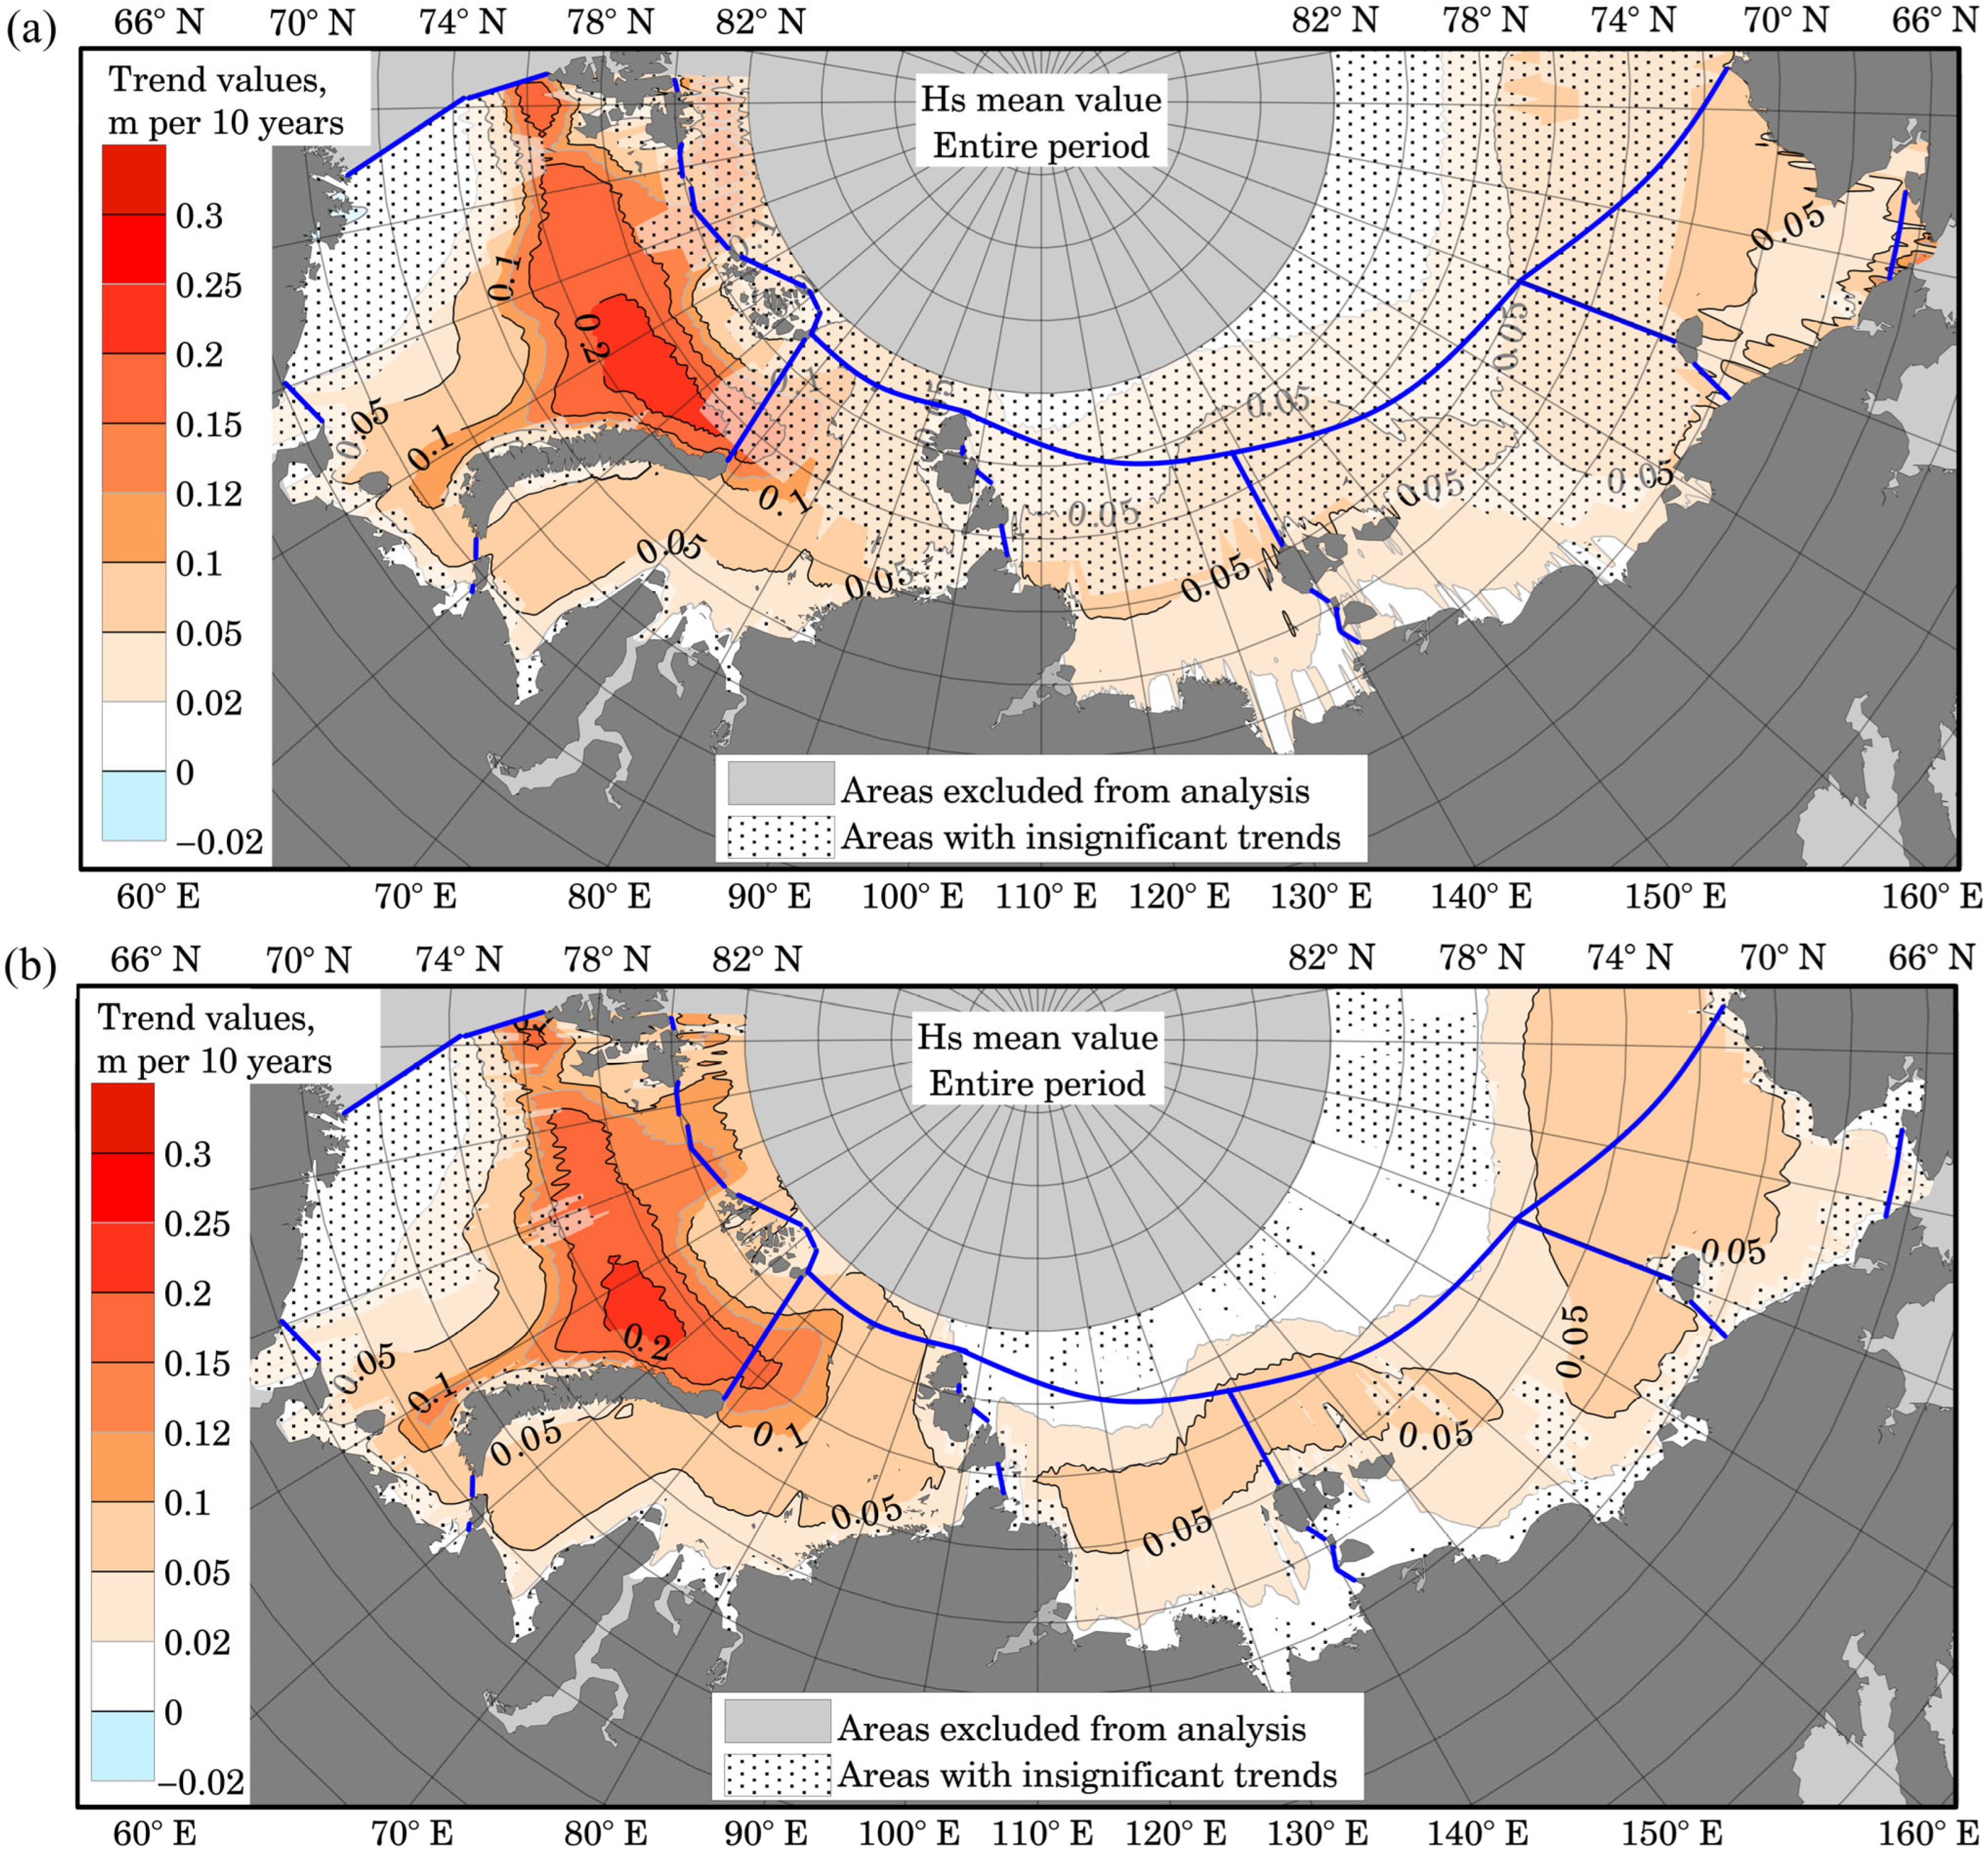
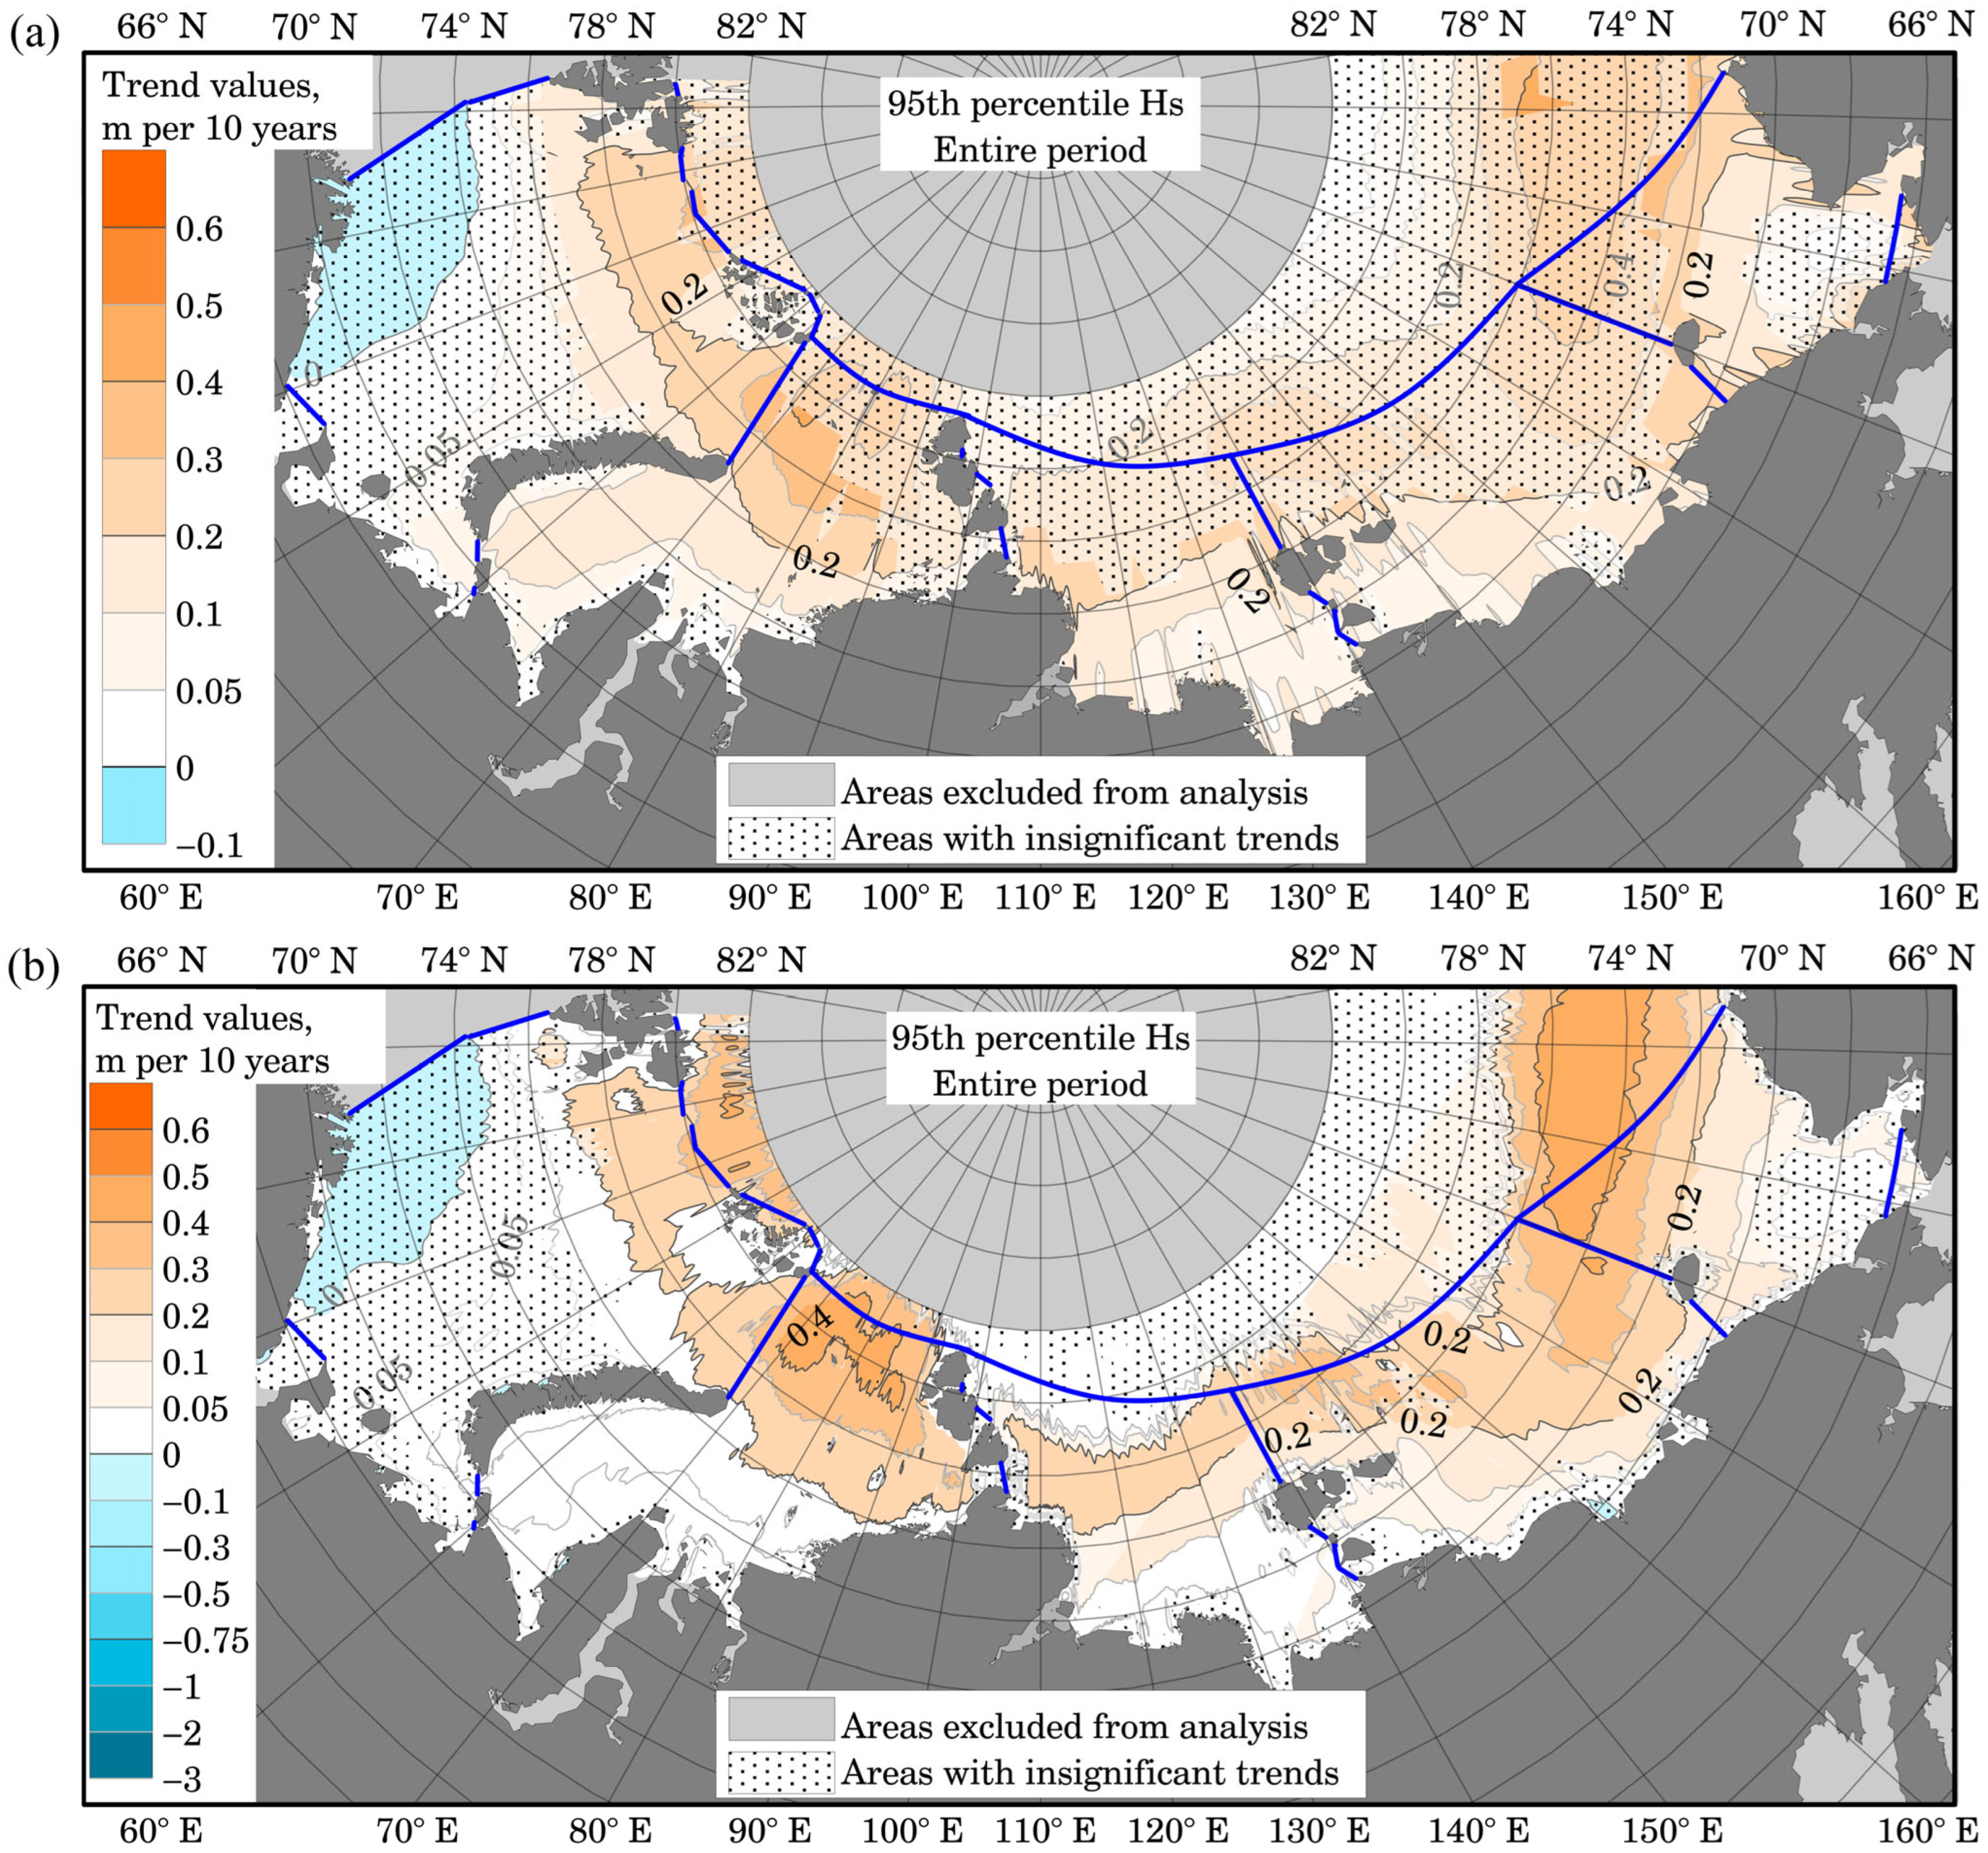
Figure 2, Figure 3 and Figure A1 present maps illustrating the spatial distribution of trends in mean annual 95th-percentile and annual maximum Hs for the entire study period. Figure 2 and Figure 3 present the results of two methods: parametric (a) and nonparametric (b).
Figure 2.
Spatial distribution of the trends for average annual Hs (m/10 years). Distribution map for the entire study period calculated using parametric (a) and non-parametric (b) methods. Blue lines indicate the boundaries of the studied seas.
Figure 3.
Spatial distribution of the trends for 95th percentile annual Hs (m/10 years). Distribution map for the entire study period calculated using parametric (a) and non-parametric (b) methods. Blue lines indicate the boundaries of the studied seas.
In Figure 2 and subsequent figures, statistically insignificant trends are indicated by a dotted pattern with a semi-transparent white background. Areas exhibiting statistically significant trends are left unfilled.
As illustrated in Figure 2a, nearly all of the Eurasian Arctic seas exhibit positive trends in mean annual Hs. The maximum trend magnitude is observed in the Barents Sea, reaching 0.25 m per decade. The trends in this region are statistically significant. For the Kara, Laptev, East Siberian, and Chukchi Seas, areas with significant trends are observed closer to the continental coastline. However, the maximum trend value for these seas is located further north—on average, at latitudes above 74–76° N. In the Kara and Chukchi Seas, the value of significant trends does not exceed 0.2 m per decade (averaging between 0.05 and 0.1 m per decade), while in the East Siberian and Laptev Seas, values range around ~0.025 m per decade.
Figure 2b shows the magnitude and significance of trends in mean annual wave height, calculated using the Sen slope and the modified Mann–Kendall test. The results show good agreement with the linear regression method, indicating the latter’s robustness for this dataset. Minor discrepancies are observed—specifically, estimates from the parametric method are higher for some areas—though there are far more regions where trends are statistically insignificant. With the non-parametric method, maximum trend values of 0.2 m per decade are observed in the Barents Sea. Significant positive trends of up to 0.1 m per decade are observed in the Laptev, East Siberian, and Chukchi Seas.
Figure A1 presents a map illustrating the distribution of trend values for maximum Hs. The map reveals that the areas where trends are statistically significant are smaller than those with insignificant trends. Across all seas, the values of significant trends cluster around a value of 0.6 m per 10 years.
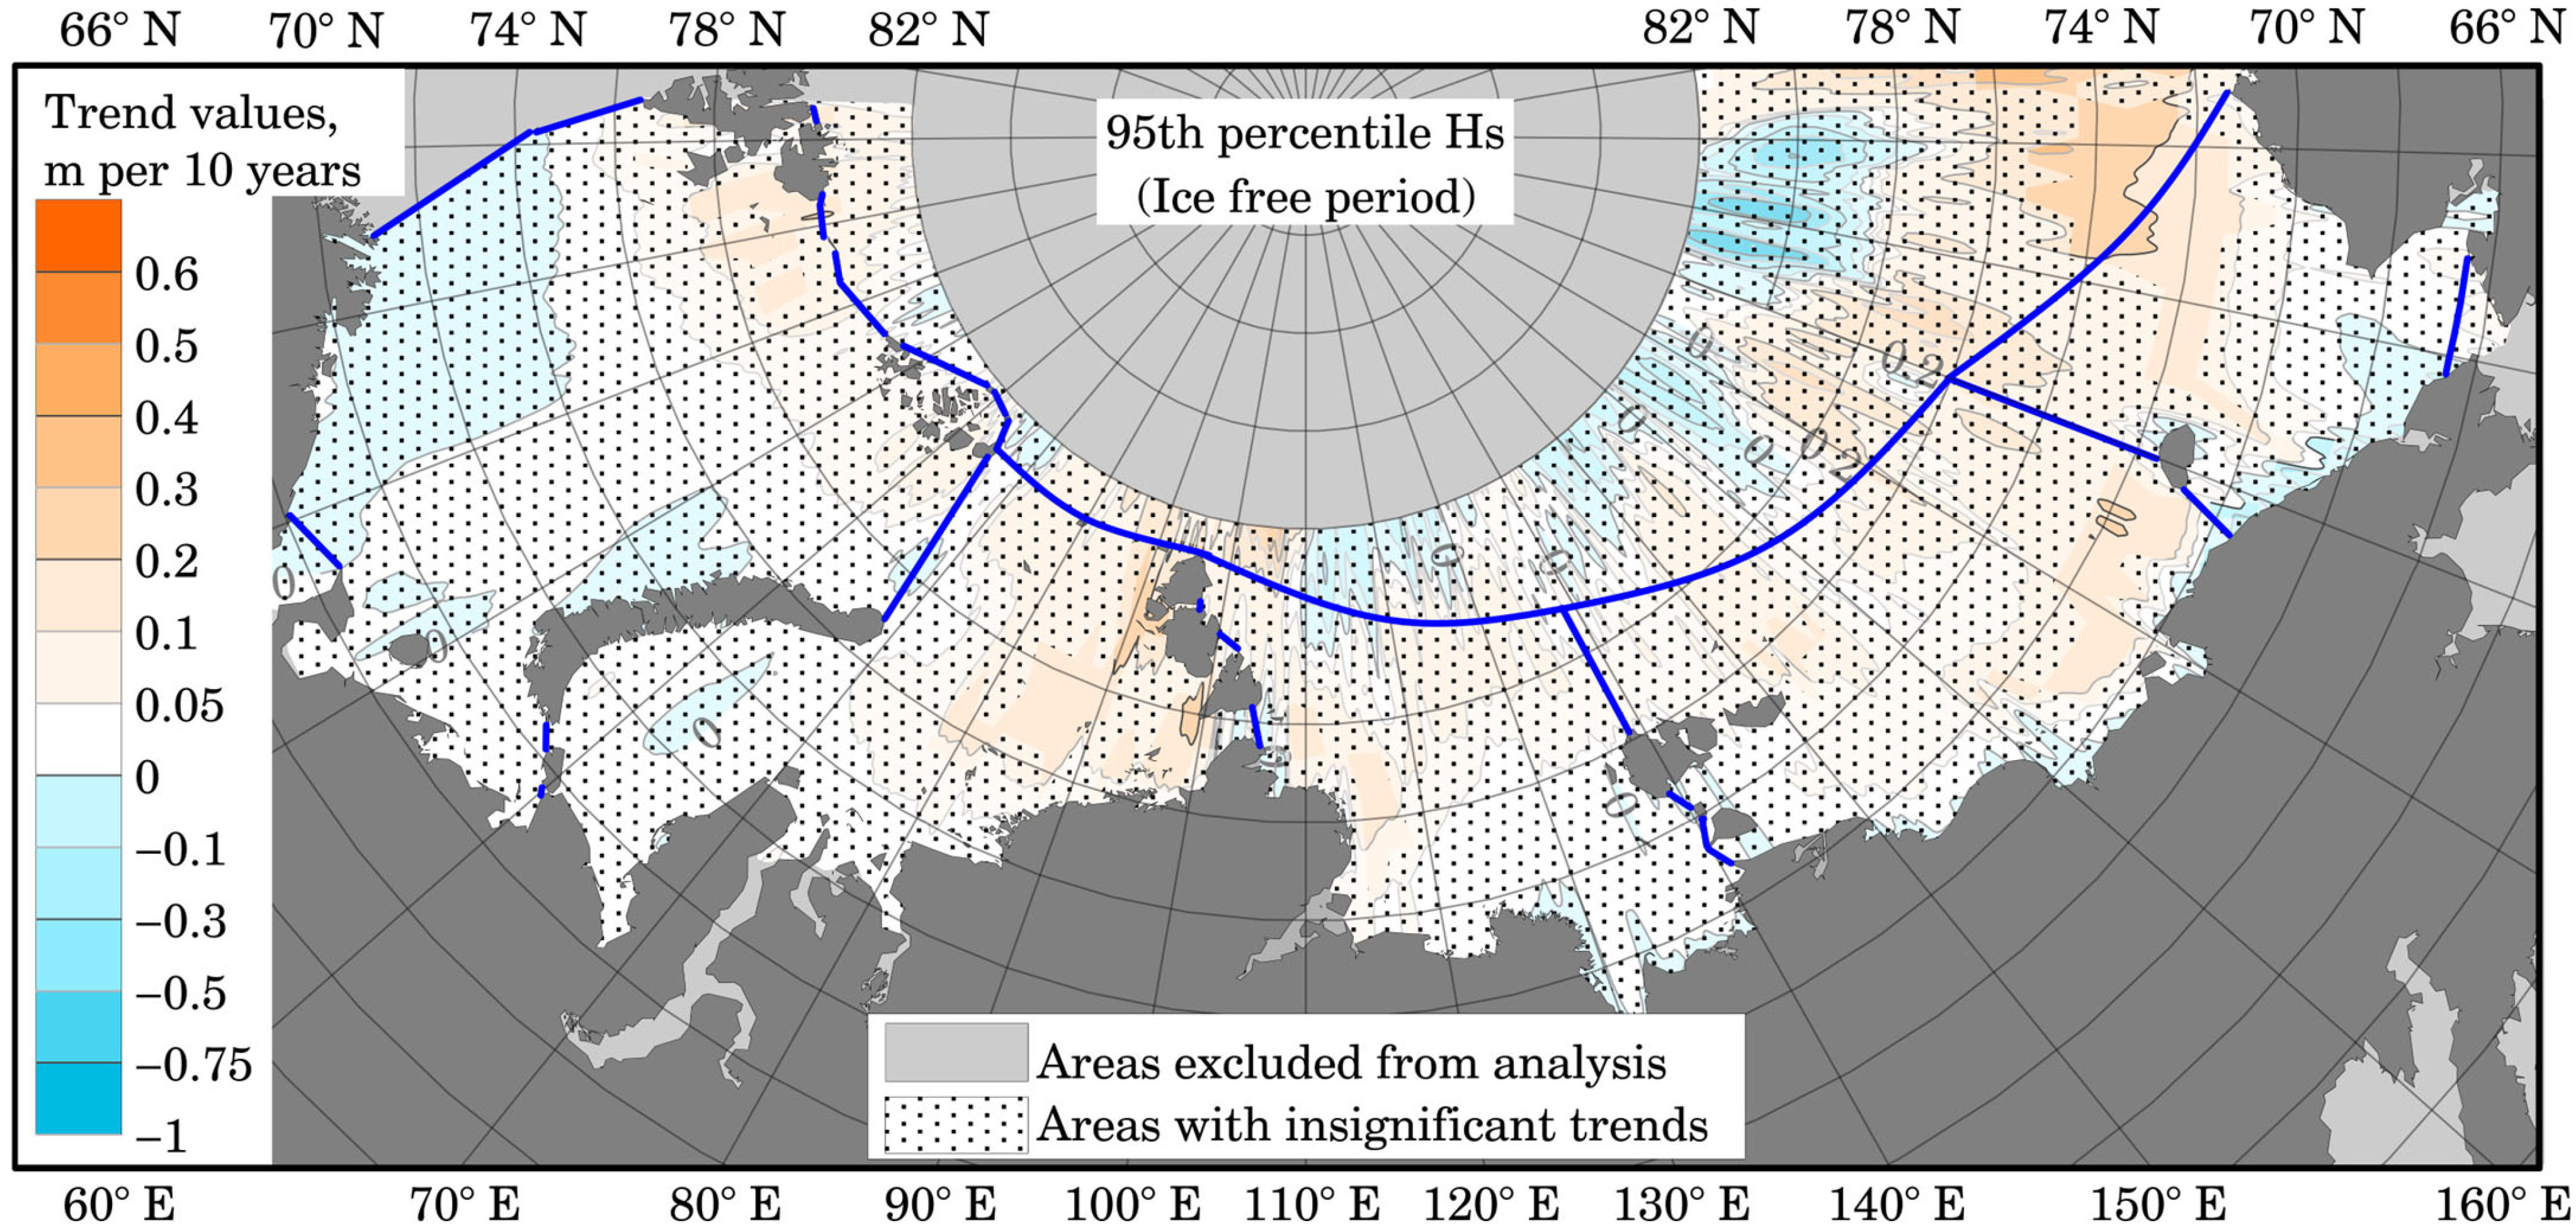
Figure 3a demonstrates a map of trend values for the 95th percentile of Hs. Notably, the northern region of insignificant trends also aligns well with the position of the ice edge [48]. However, in the Barents Sea, the region exhibiting small—and even negative—insignificant trends cannot be explained solely by changes in sea ice extent. The largest significant trends for the 95th percentile of Hs are characteristic of the Kara Sea (exceeding 0.3 m per 10 years). Across most of the Eastern Arctic, these values do not exceed 0.3 m per 10 years.
A comparison of the results obtained using the non-parametric method (shown in Figure 3b) reveals that the trend magnitudes for the northern part of the Kara Sea are higher than those derived from the linear regression method. As with the annual mean values of significant wave heights, a greater number of statistically significant areas is observed for the 95th percentile. Maximum trend values exceeding 0.4 m per decade are observed in the Kara, East Siberian, and Chukchi Seas.
The comparison between parametric and non-parametric estimates shows strong consistency (Figure 2 and Figure 3). Therefore, only regression-based maps are shown in the following figures for clarity.
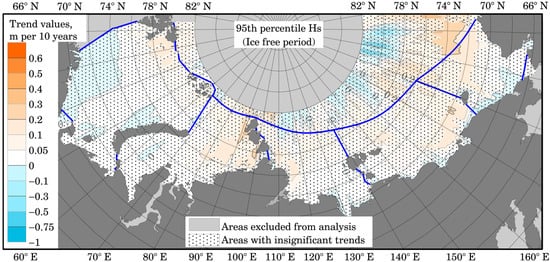
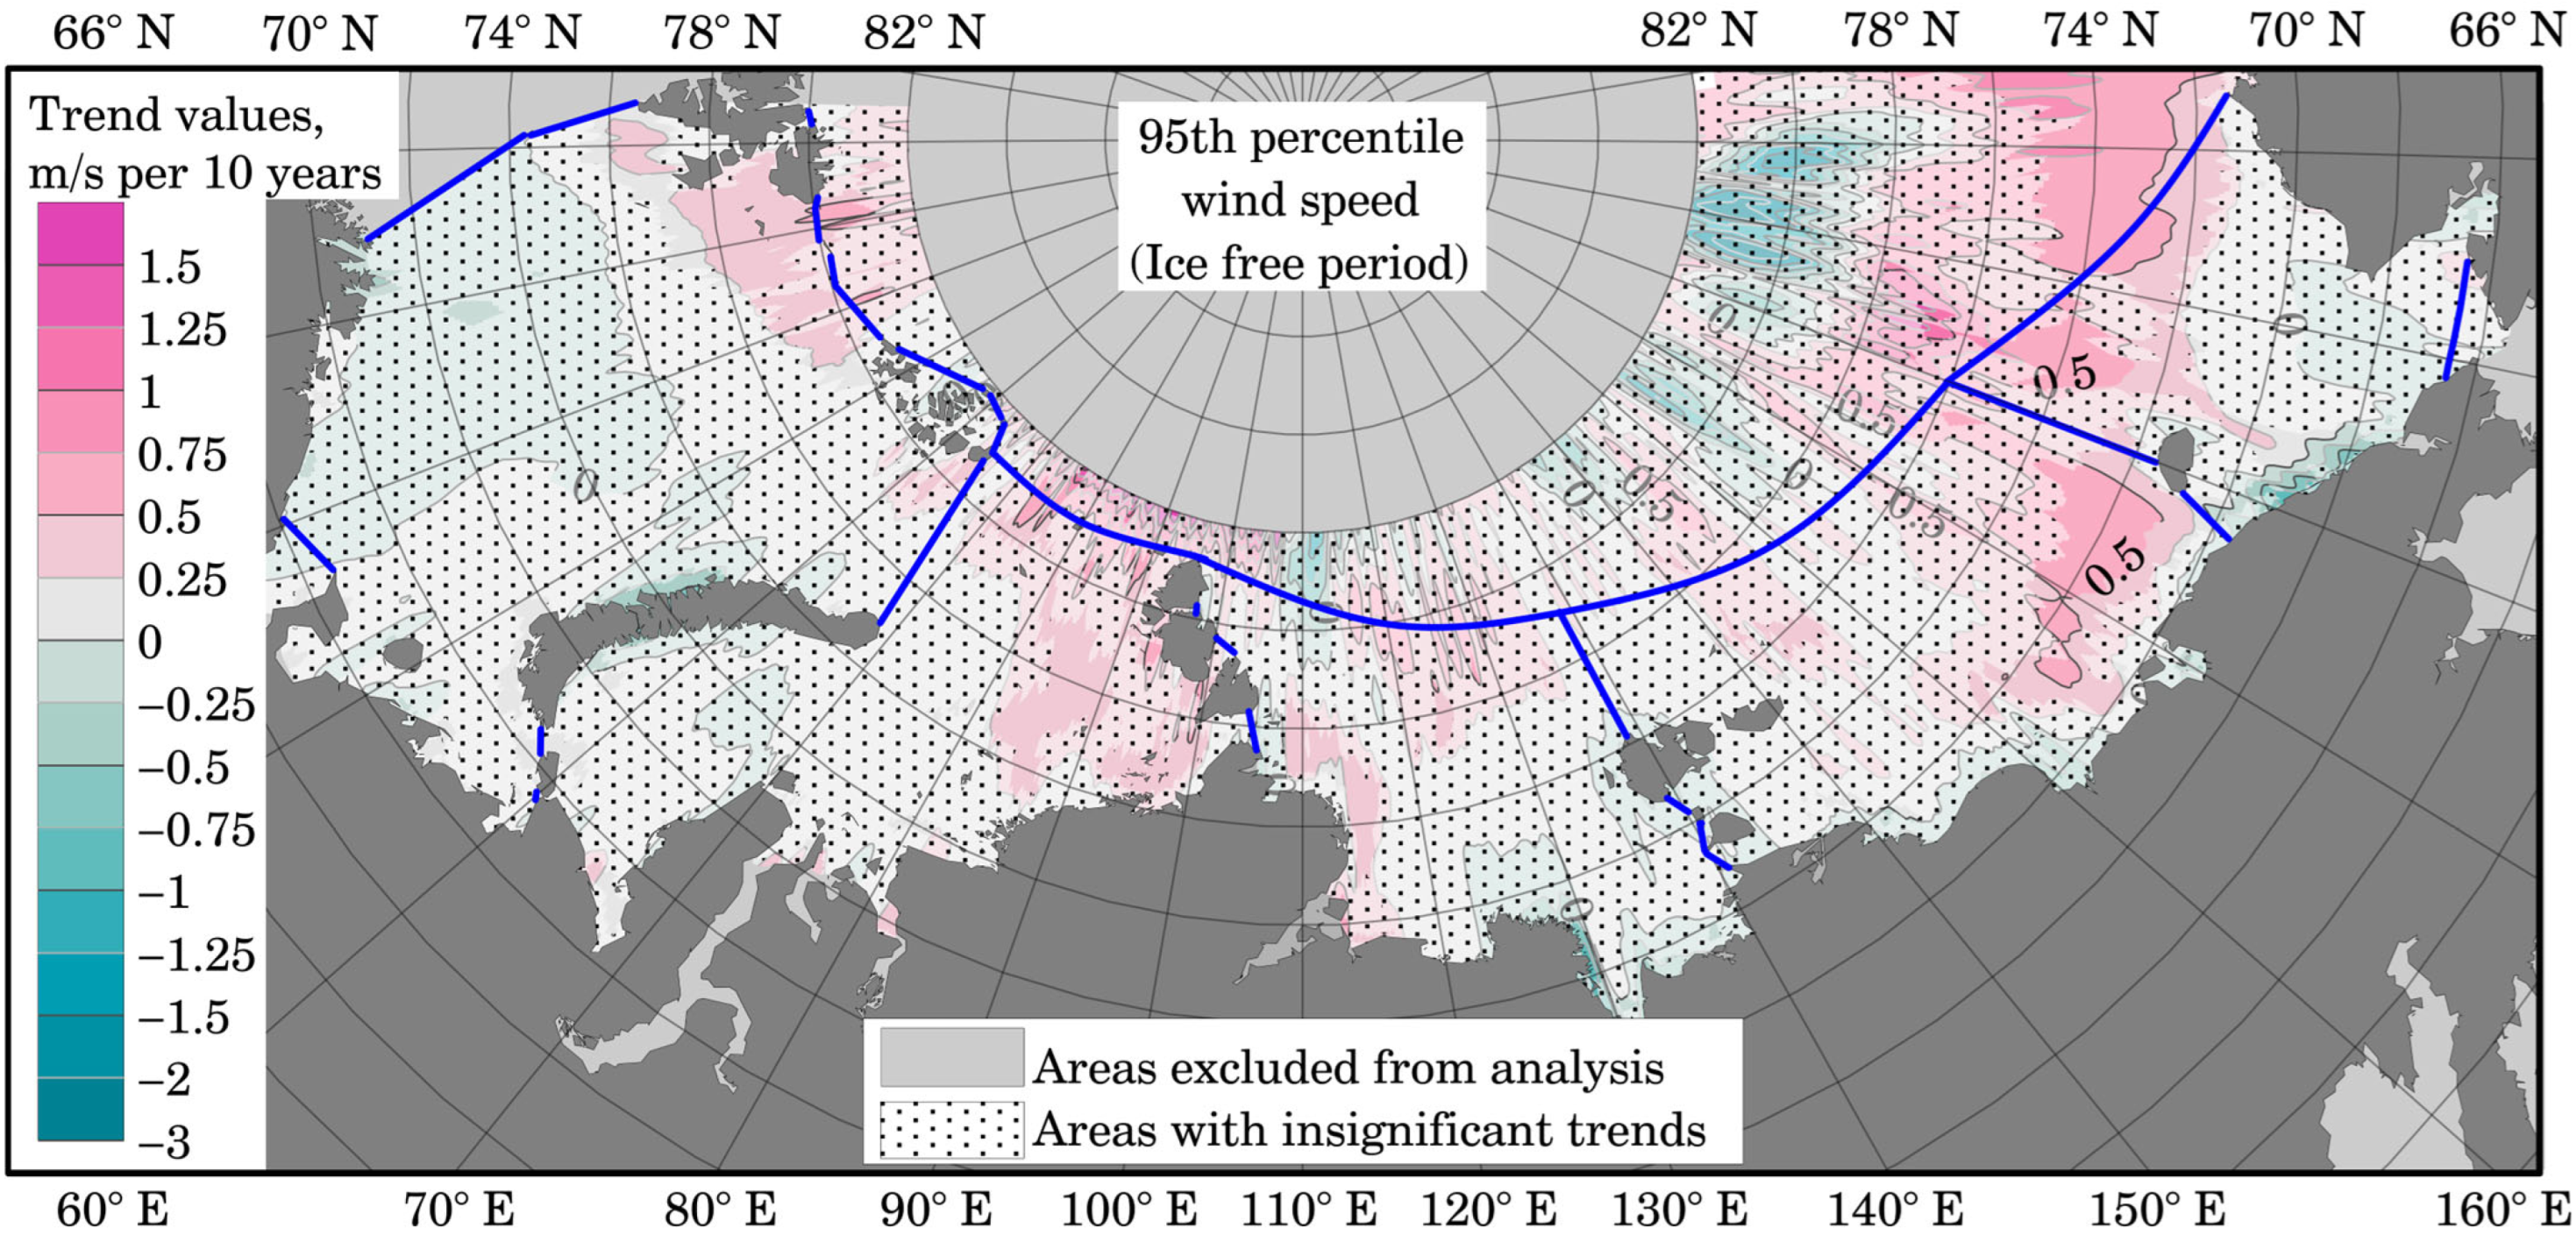
Figure A2 and Figure 4 present trend maps for the ice-free period. Here and throughout, the “Ice free period” label in the figures indicates that, for each individual computational grid node (represented by dots in Figure 1), annual values were calculated only when the ice fraction at that node was less than 0.5. Values associated with ice levels exceeding this critical threshold were excluded from the calculations.
Figure 4.
Spatial distribution of the trends for 95% percentile annual Hs (m/10 years). Distribution map for the ice-free period. Blue lines indicate the boundaries of the studied seas.
In Figure A2, the results indicate that areas exhibiting significant trends are very scarce compared to the distribution of mean annual Hs over the entire study period (Figure 2). The highest trend values are observed in the Kara Sea (near the Severnaya Zemlya archipelago) and the Chukchi Sea (at the boundary with the Beaufort Sea), yet they do not exceed 0.125 m per 10 years. Positive significant trends in the Kara Sea partially overlap with the Northern Sea Route, which could pose a challenge for mariners. According to the results obtained, the route option passing north of Komsomolets Island is currently experiencing the most rapid increase in mean Hs; should this trend persist, it could inflict serious damage upon vessels.
Maps depicting trend values for maximum Hs for the ice-free period were not constructed, as the maximum values over the full period and for the ice-free period are identical.
Figure 4 presents a map of trend values for the 95th percentile of Hs. The majority of trend values within the Eurasian Arctic are statistically insignificant. The spatial distribution of regions exhibiting significant trends closely resembles that of analogous regions shown in Figure 5, which may suggest that the underlying processes are of a similar nature. The values of these significant trends do not exceed 0.3 m, typically ranging from 0.05 to 0.1 m per decade.
Figure 5.
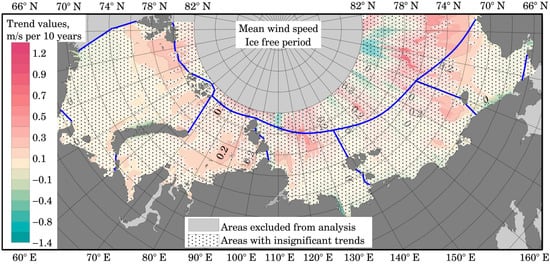
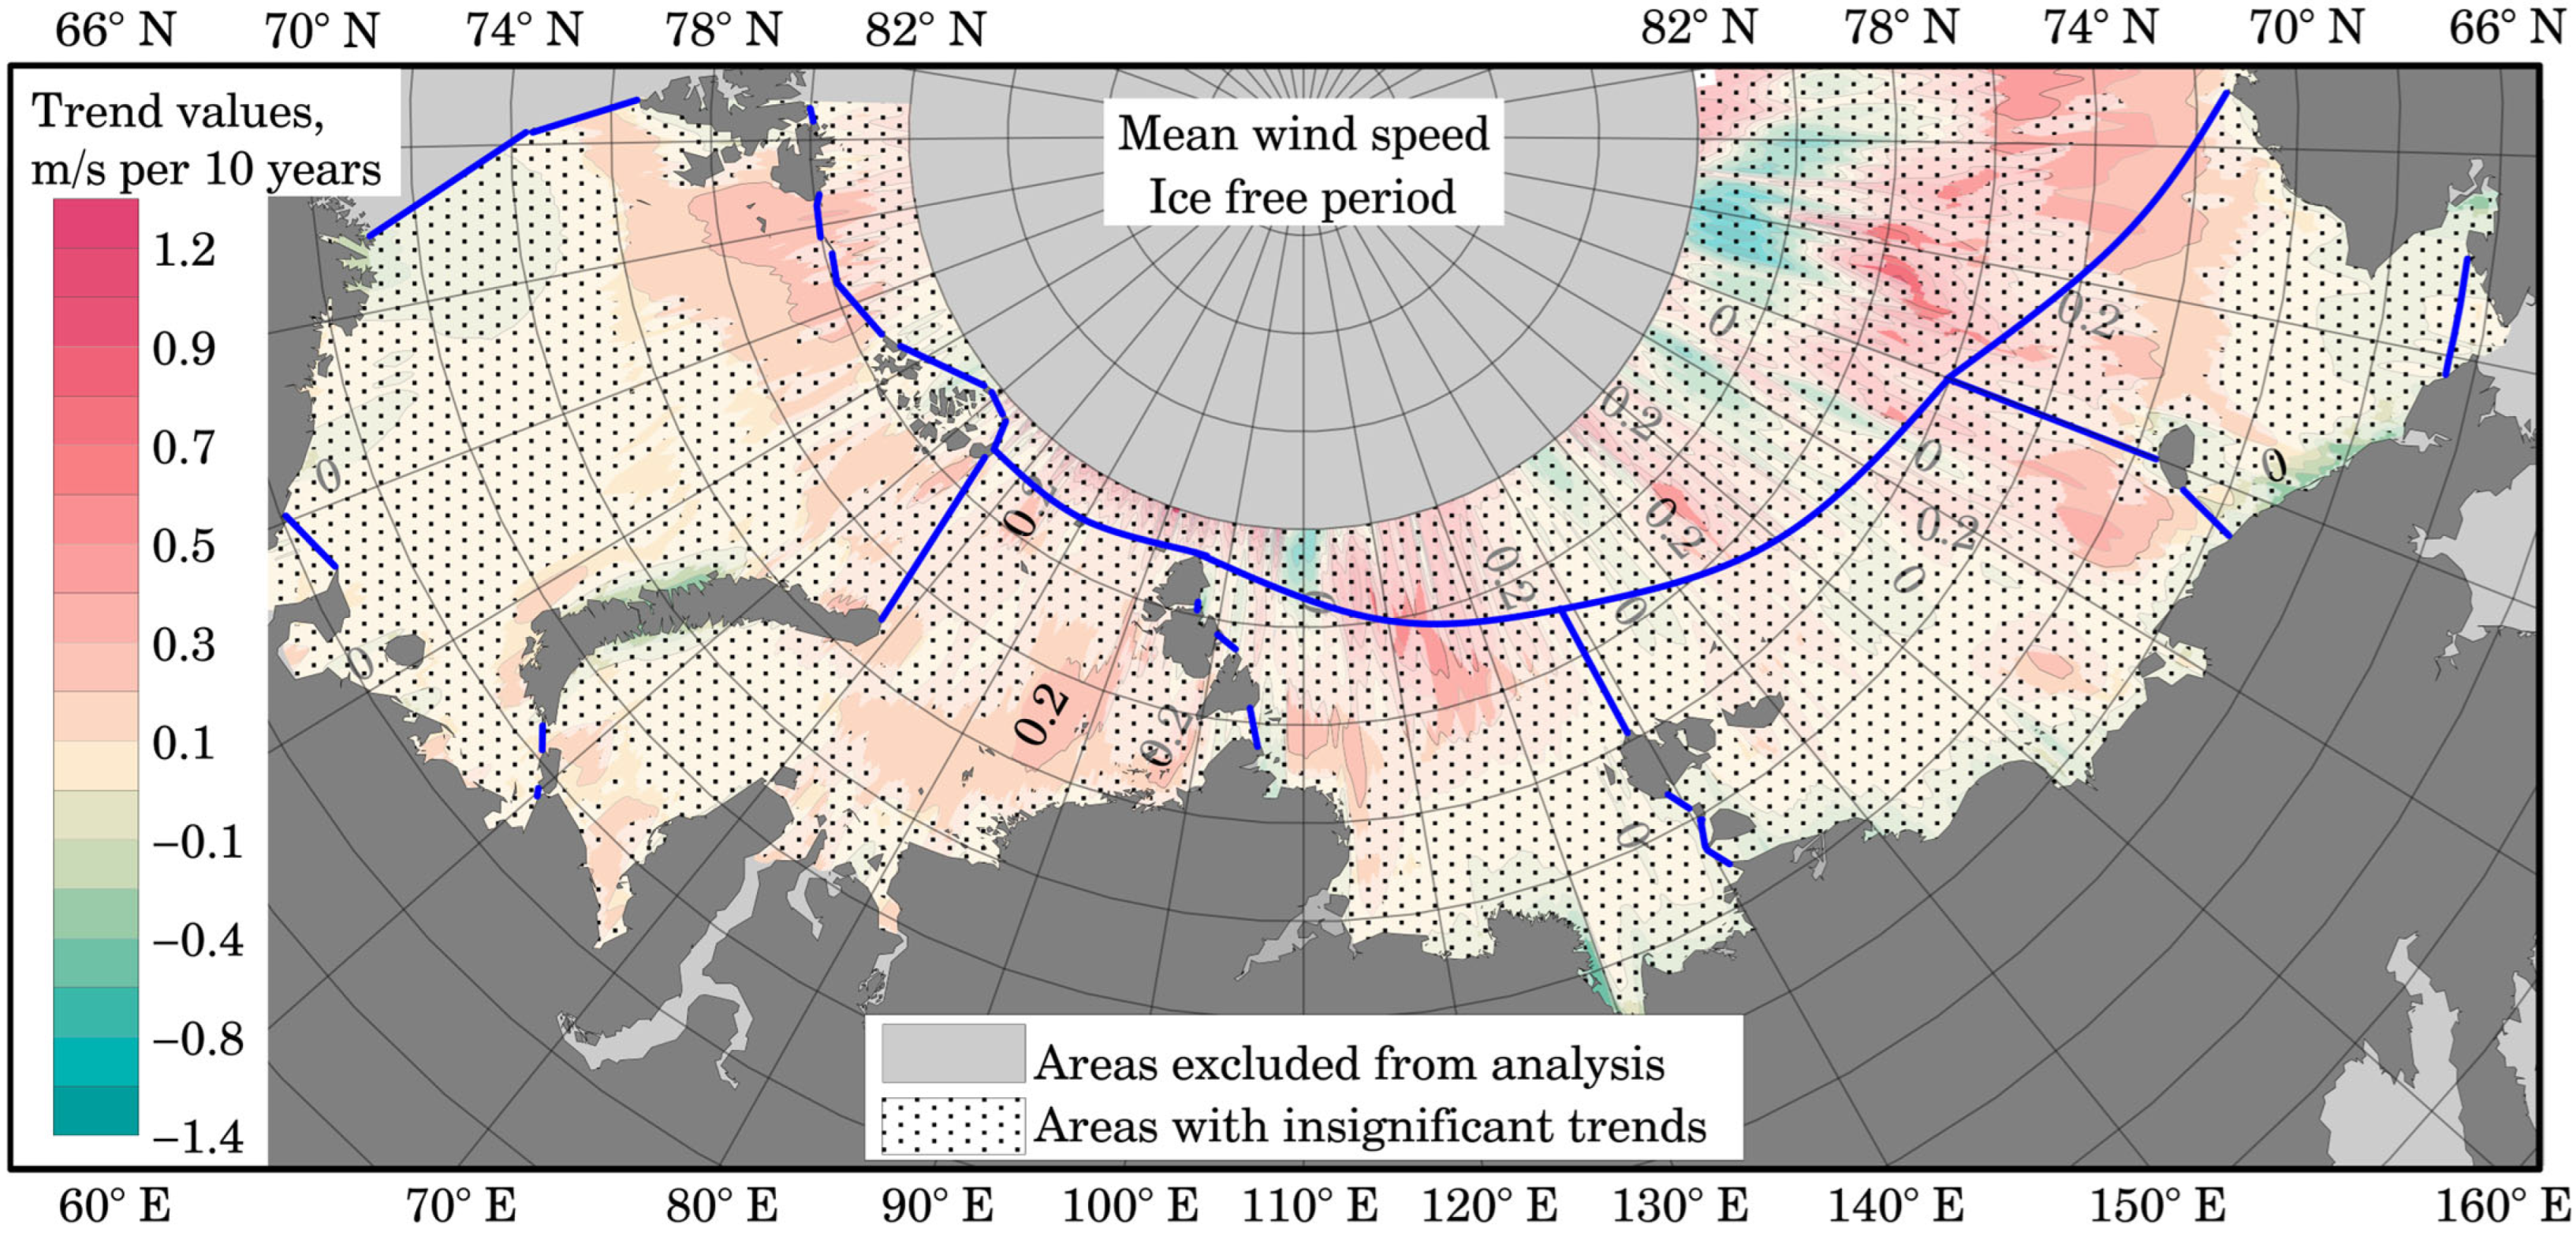
Spatial distribution of the trends for mean annual wind speed (m/s per 10 years). Distribution map for the ice-free period. Blue lines indicate the boundaries of the studied seas.
3.2. Trends in Wind Speed
To identify patterns within the positive, statistically significant trends in Hs, we also analyzed spatial distribution maps of wind speed trends. Figure 5 and Figure 6 present maps for the mean and 95th percentile wind speeds. Figure A3 and Figure A4 present the same parameters, but for the U and V components individually.
Figure 6.
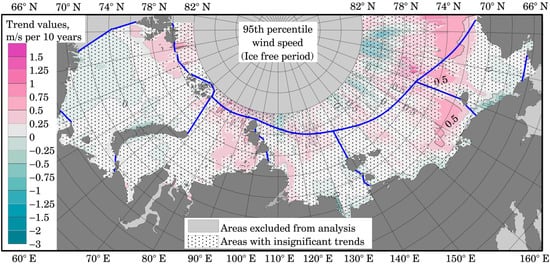
Spatial distribution of the trends for 95% percentile annual wind speed (m/s per 10 years). Distribution map for the ice-free period. Blue lines indicate the boundaries of the studied seas.
Figure 5 demonstrates that most of the selected seas are marked by positive, insignificant trends. However, in the high-latitude region of the Arctic Ocean (north of 78° N), areas with negative trends are observed. By comparing this with Figure 5, the analysis reveals that the positive wave trends in the vicinity of Spitsbergen, in the Kara Sea east of 70° E (along one of the routes of the Northern Sea Route), and in the northern part of the Chukchi Sea are most likely driven by significant trends in mean wind speed. The positive trends in these regions amount to 0.1–0.2 m/s per decade.
In addition to the increase in mean wind speeds (Figure 5), the 95th percentile of wind speed (Figure 6) also shows a consistent increase in the same regions described above. Furthermore—beyond the aforementioned regions—positive, statistically significant trends are also observed in the East Siberian Sea, specifically east of 160° E. According to Figure A2 and Figure 4, this same region also exhibits significant trends in Hs. A similar consistency in the area near the Taymyr Peninsula in the Laptev Sea: both the map of 95th-percentile Hs and the map of 95th-percentile wind speeds reveal areas where the observed trends are statistically significant. The value of these trends in the East Siberian and Chukchi Seas exceeds 0.5 m/s per decade, while in the remaining seas, the average value is greater than 0.25 m/s per decade. For the majority of the seas, however, the trends in the 95th percentile of wind speed remain close to zero and are not statistically significant—a finding that aligns with the regions exhibiting insignificant trends in wave activity.
Figure A3 presents the mean wind speeds for the U (Figure A3a) and V (Figure A3b) components. It is evident that, across almost the entire sea area, no significant trends are observed during the ice-free period. It may also be noted that in the southern parts of the Barents and Kara Seas, a slight positive trend is observed for the U component; this indicates an intensification of westerly transport—this phenomenon is also observed in the Arctic Ocean north of 78° N. However, the northern Barents Sea and the greater part of the East Siberian Sea are characterized by the opposite situation: the mean wind speed trends for the U component are negative, with absolute values not exceeding 0.6 m/s per decade. Regarding the V velocity component, an increase in wind speed directed from south to north is observed across most of the selected sea areas (the trends are negative and statistically insignificant, averaging up to −0.2 m/s per decade).
An important result is that no statistically significant large-scale trends are observed across most of the study area during the ice-free period. This suggests that the detected changes in Hs are not accompanied by comparable long-term changes in the mean atmospheric circulation intensity over the region.
For the percentile map by components (Figure A4), the situation is slightly different. Here—much like in Figure 3, Figure 4, Figure 5, Figure 6, Figure A2, Figure A3 and Figure A4—areas exhibiting significant positive trends can be observed. Taken together, the results imply that the increase in waves in the Kara and East Siberian Seas is caused mainly by the strengthening of the East wind component (trend value up to 1 m/s over 10 years in the East Siberian Sea).
3.3. Coupled Analysis of Wind, Wave, and Sea Ice Trends
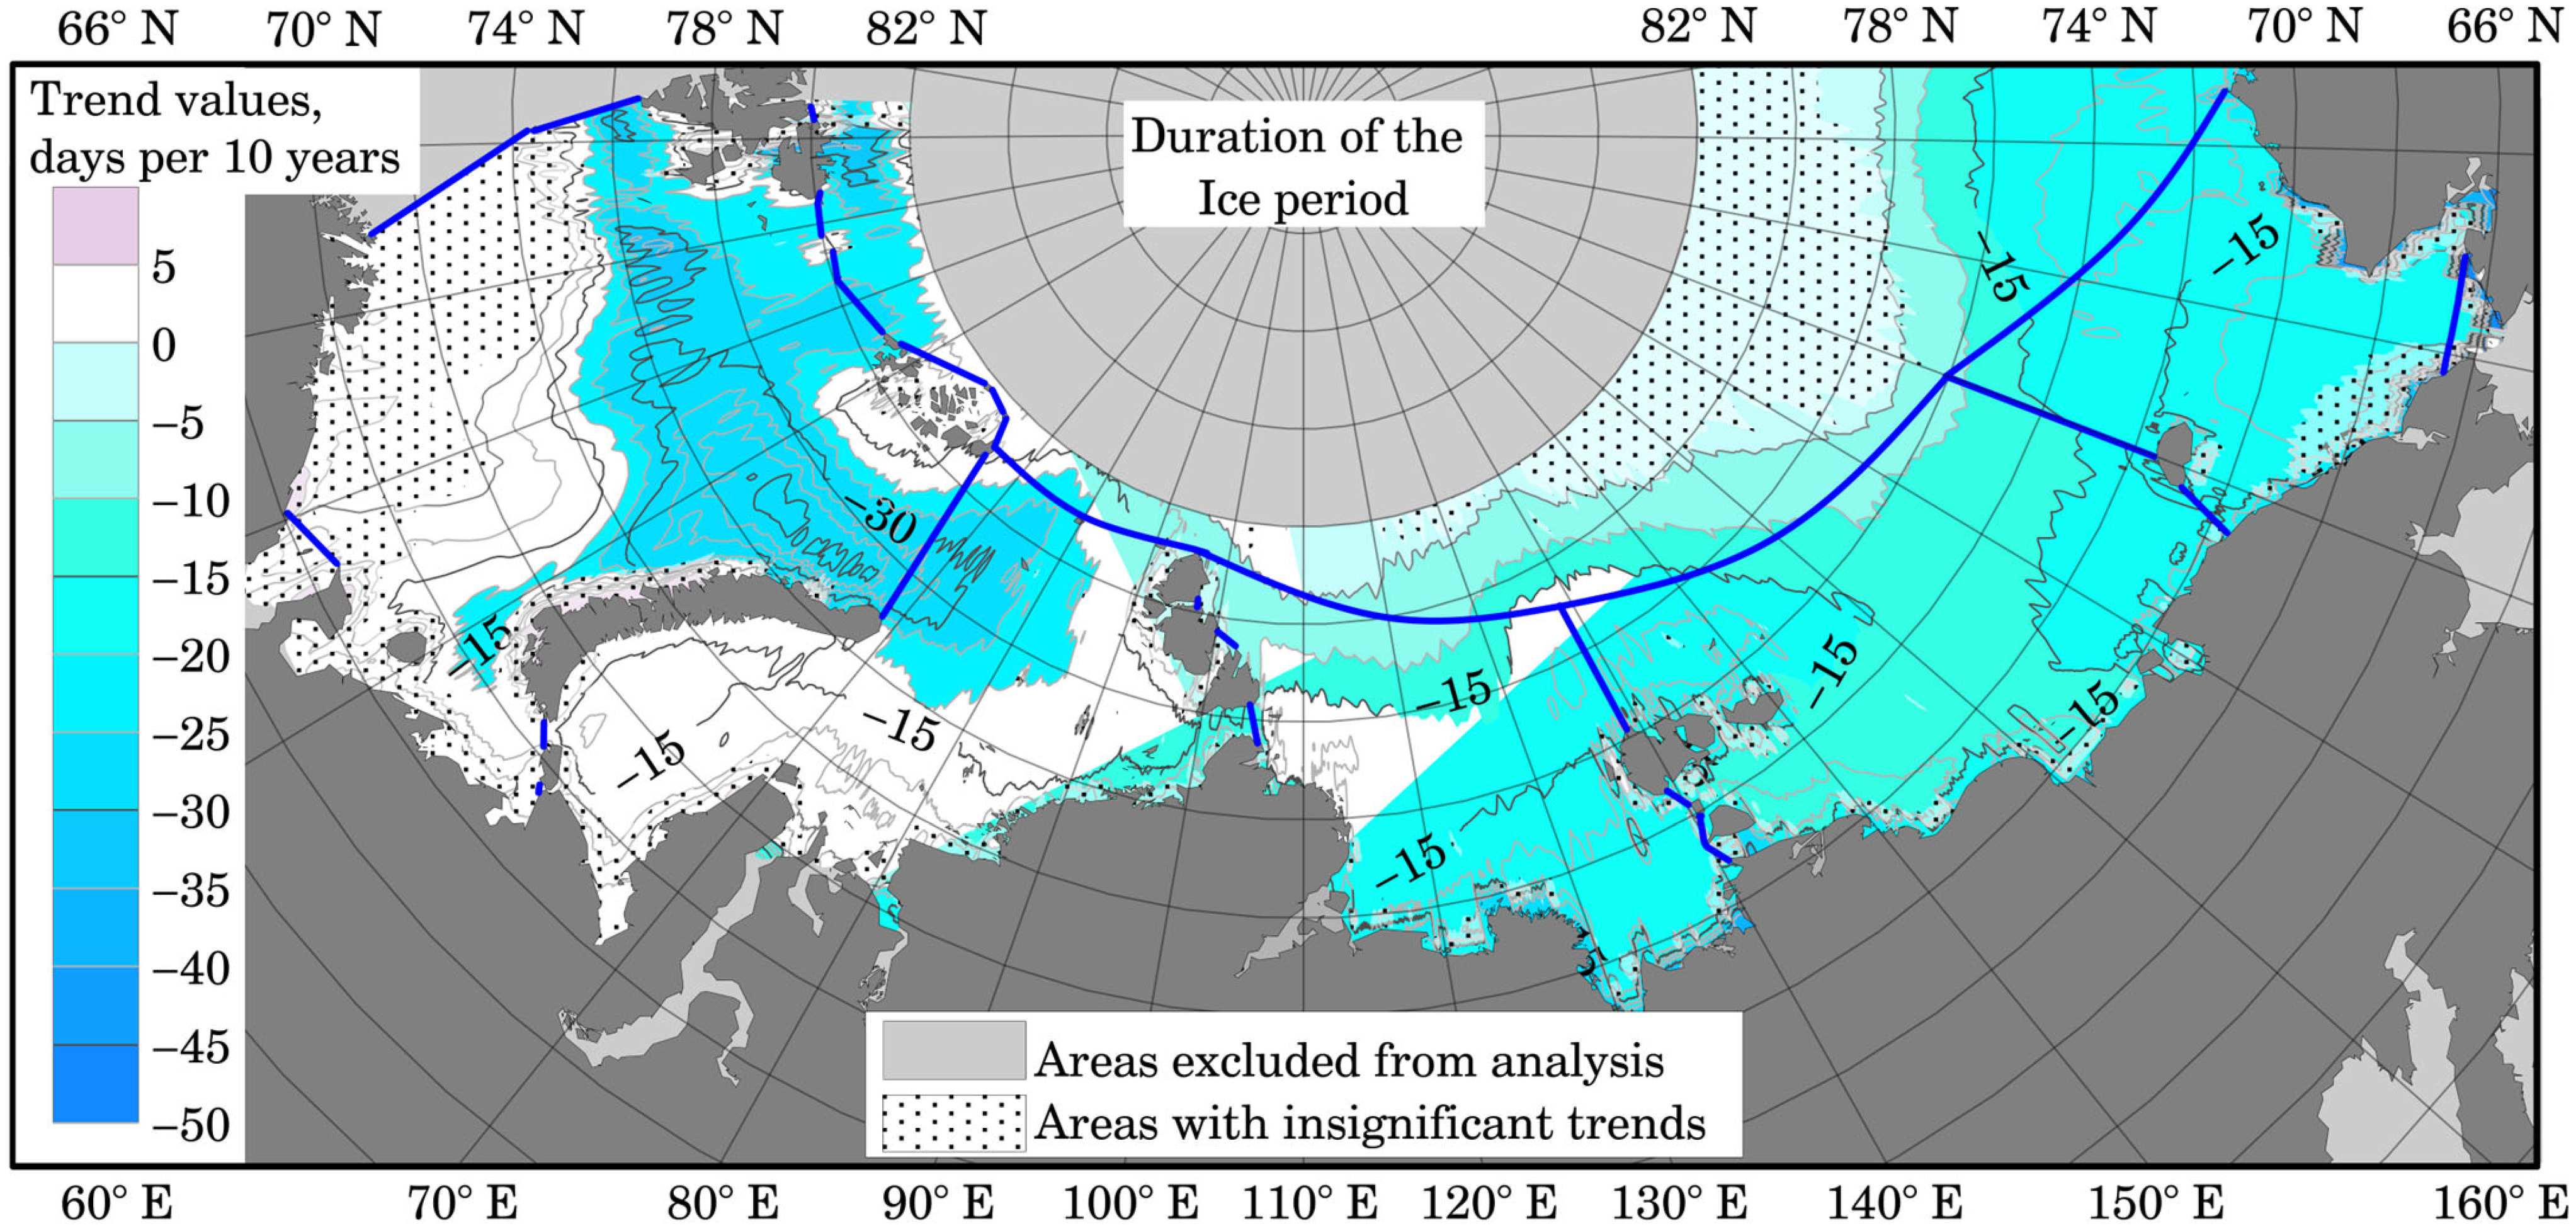
Figure 7 shows a map of the spatial distribution of trends in the duration of the ice period. As expected, the duration of the ice period is decreasing across the entire study area. The most significant trends are observed in the Barents Sea, where the open-water season is lengthening by more than 45 days per decade. For the Kara, Laptev, East Siberian, and Chukchi Seas, the average trend magnitude is approximately 20 days per decade.
Figure 7.
Spatial distribution of the trend in ice season duration. Blue lines indicate the boundaries of the studied seas.
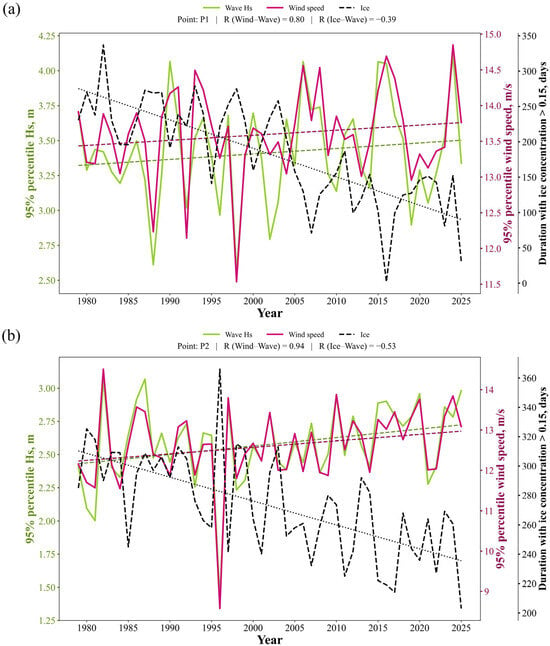
The points selected in each sea (marked with red triangles in Figure 1) were used for a more detailed analysis. At each point, the parameters examined in the preceding subsections were extracted—specifically, Hs (mean, maximum, and 95th percentile), wind parameters (mean and 95th percentile) and duration of the ice period. Subsequently, a correlation analysis was conducted to identify the highest R values between the wave and wind parameters.
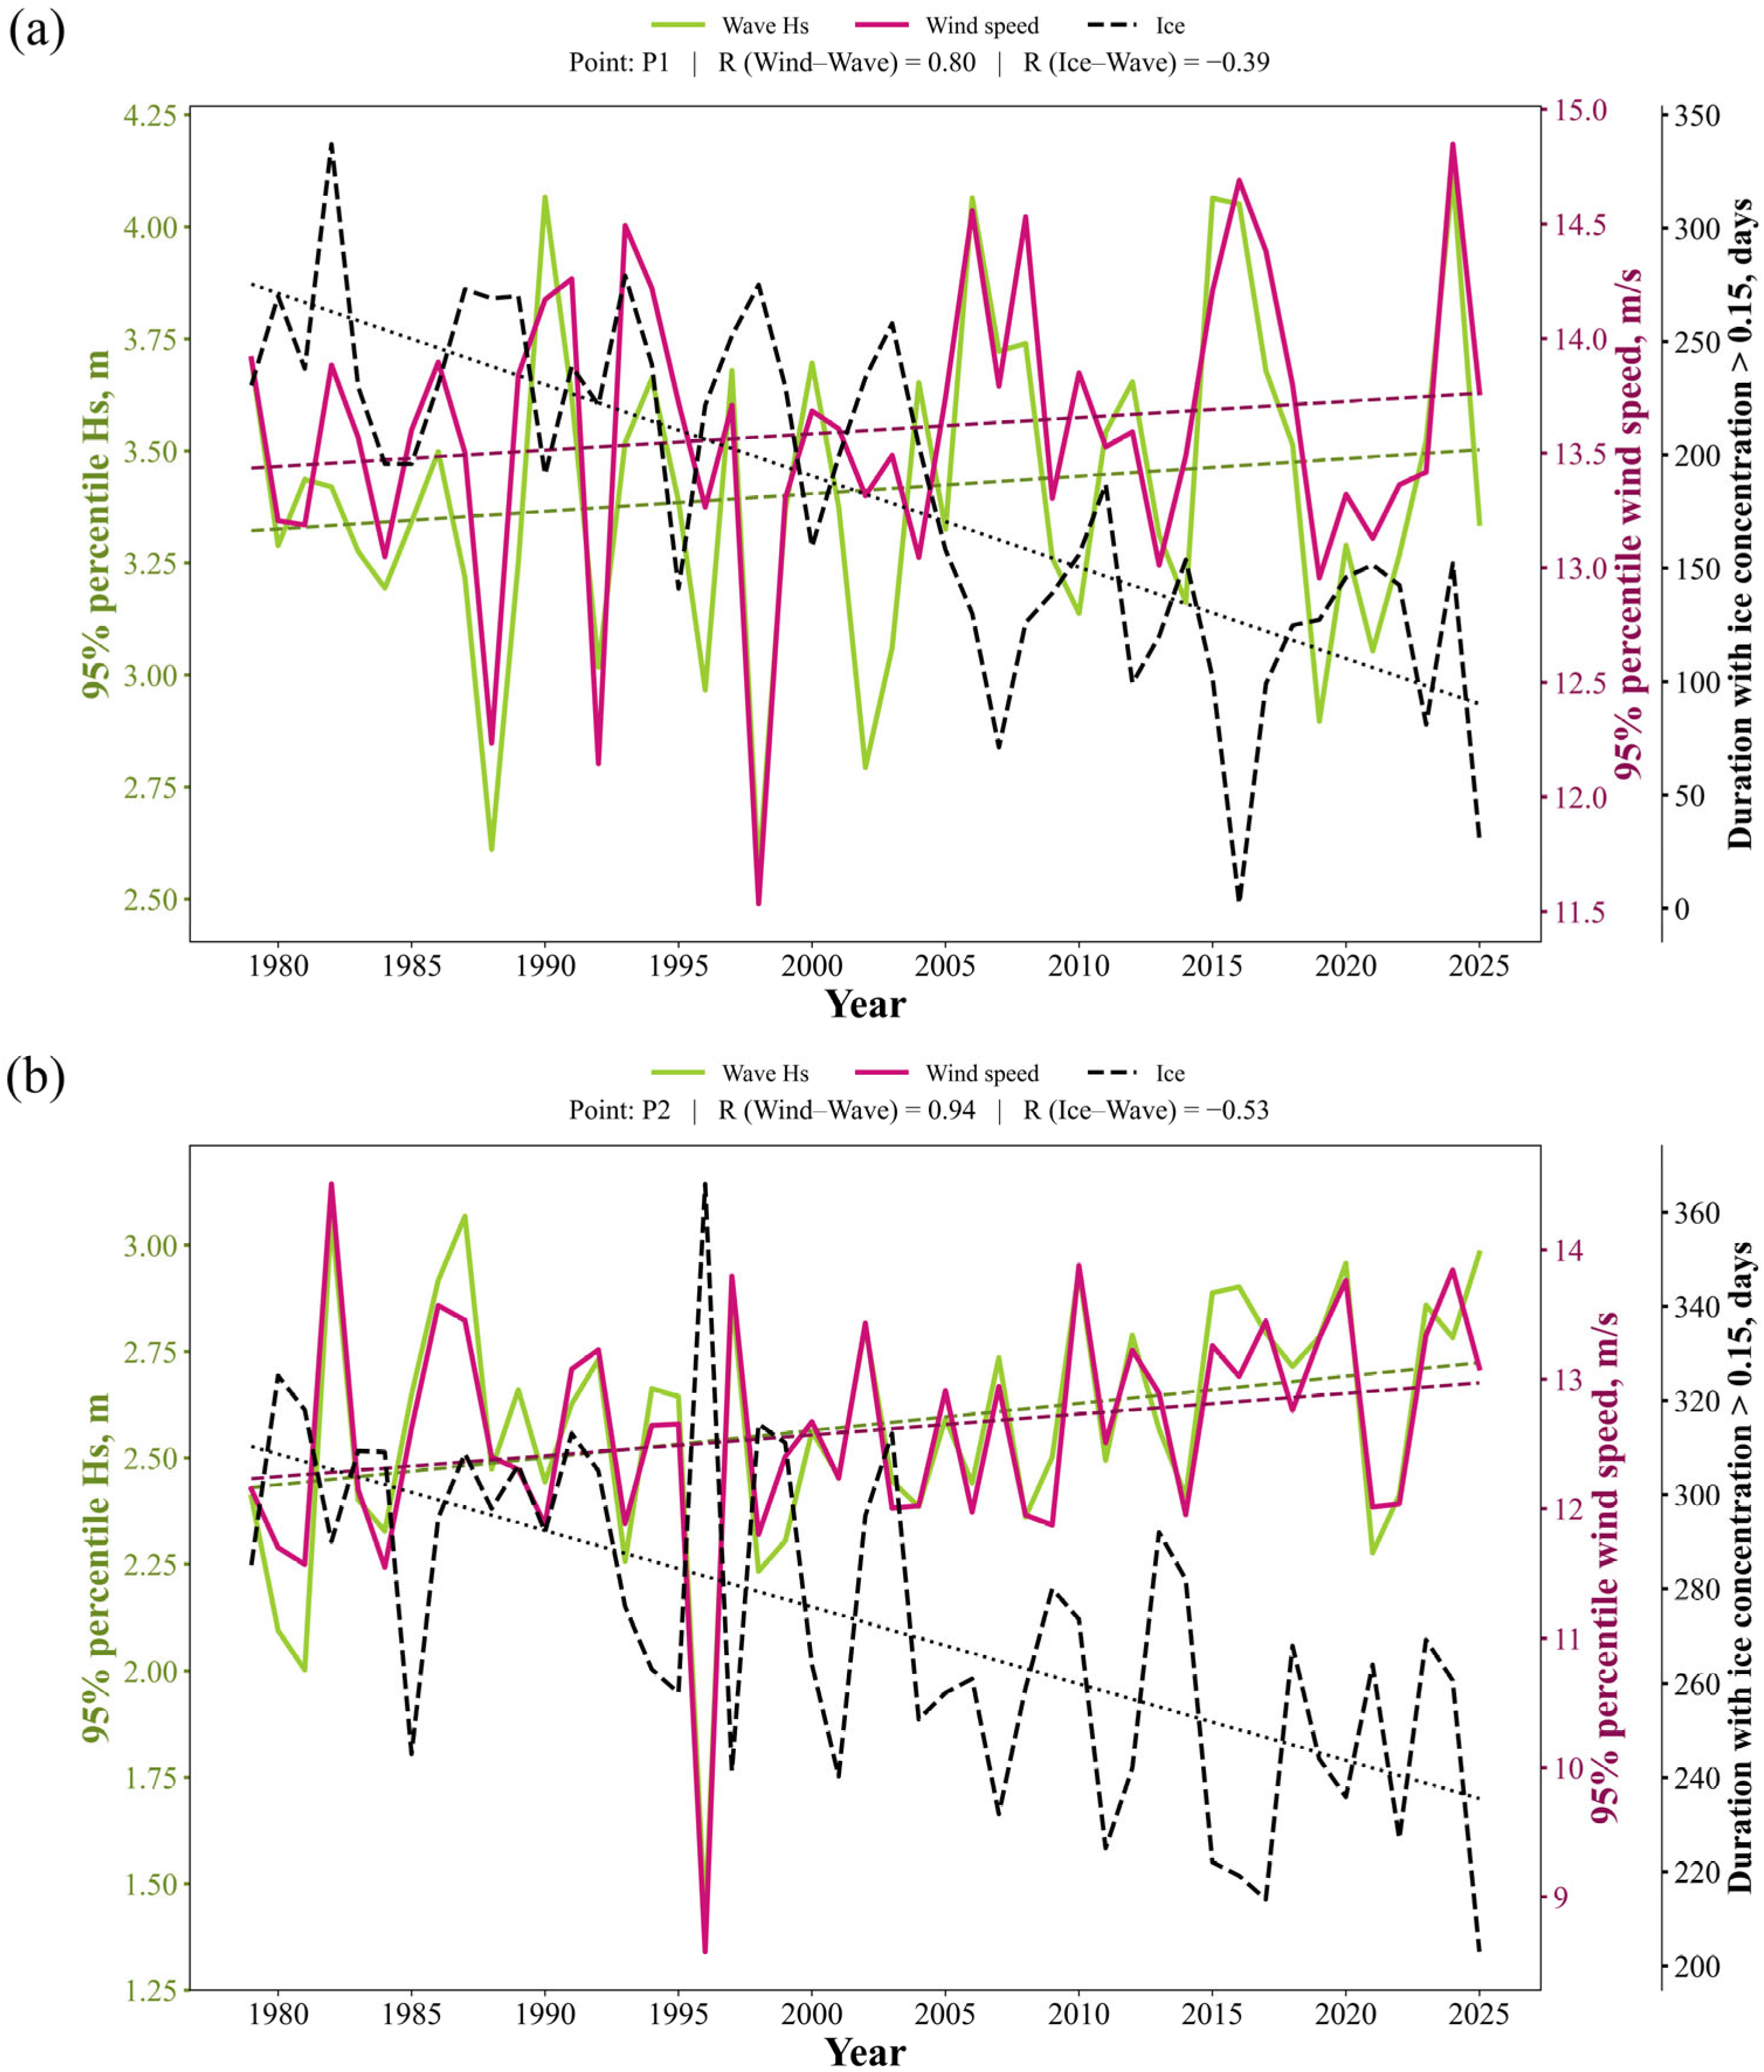
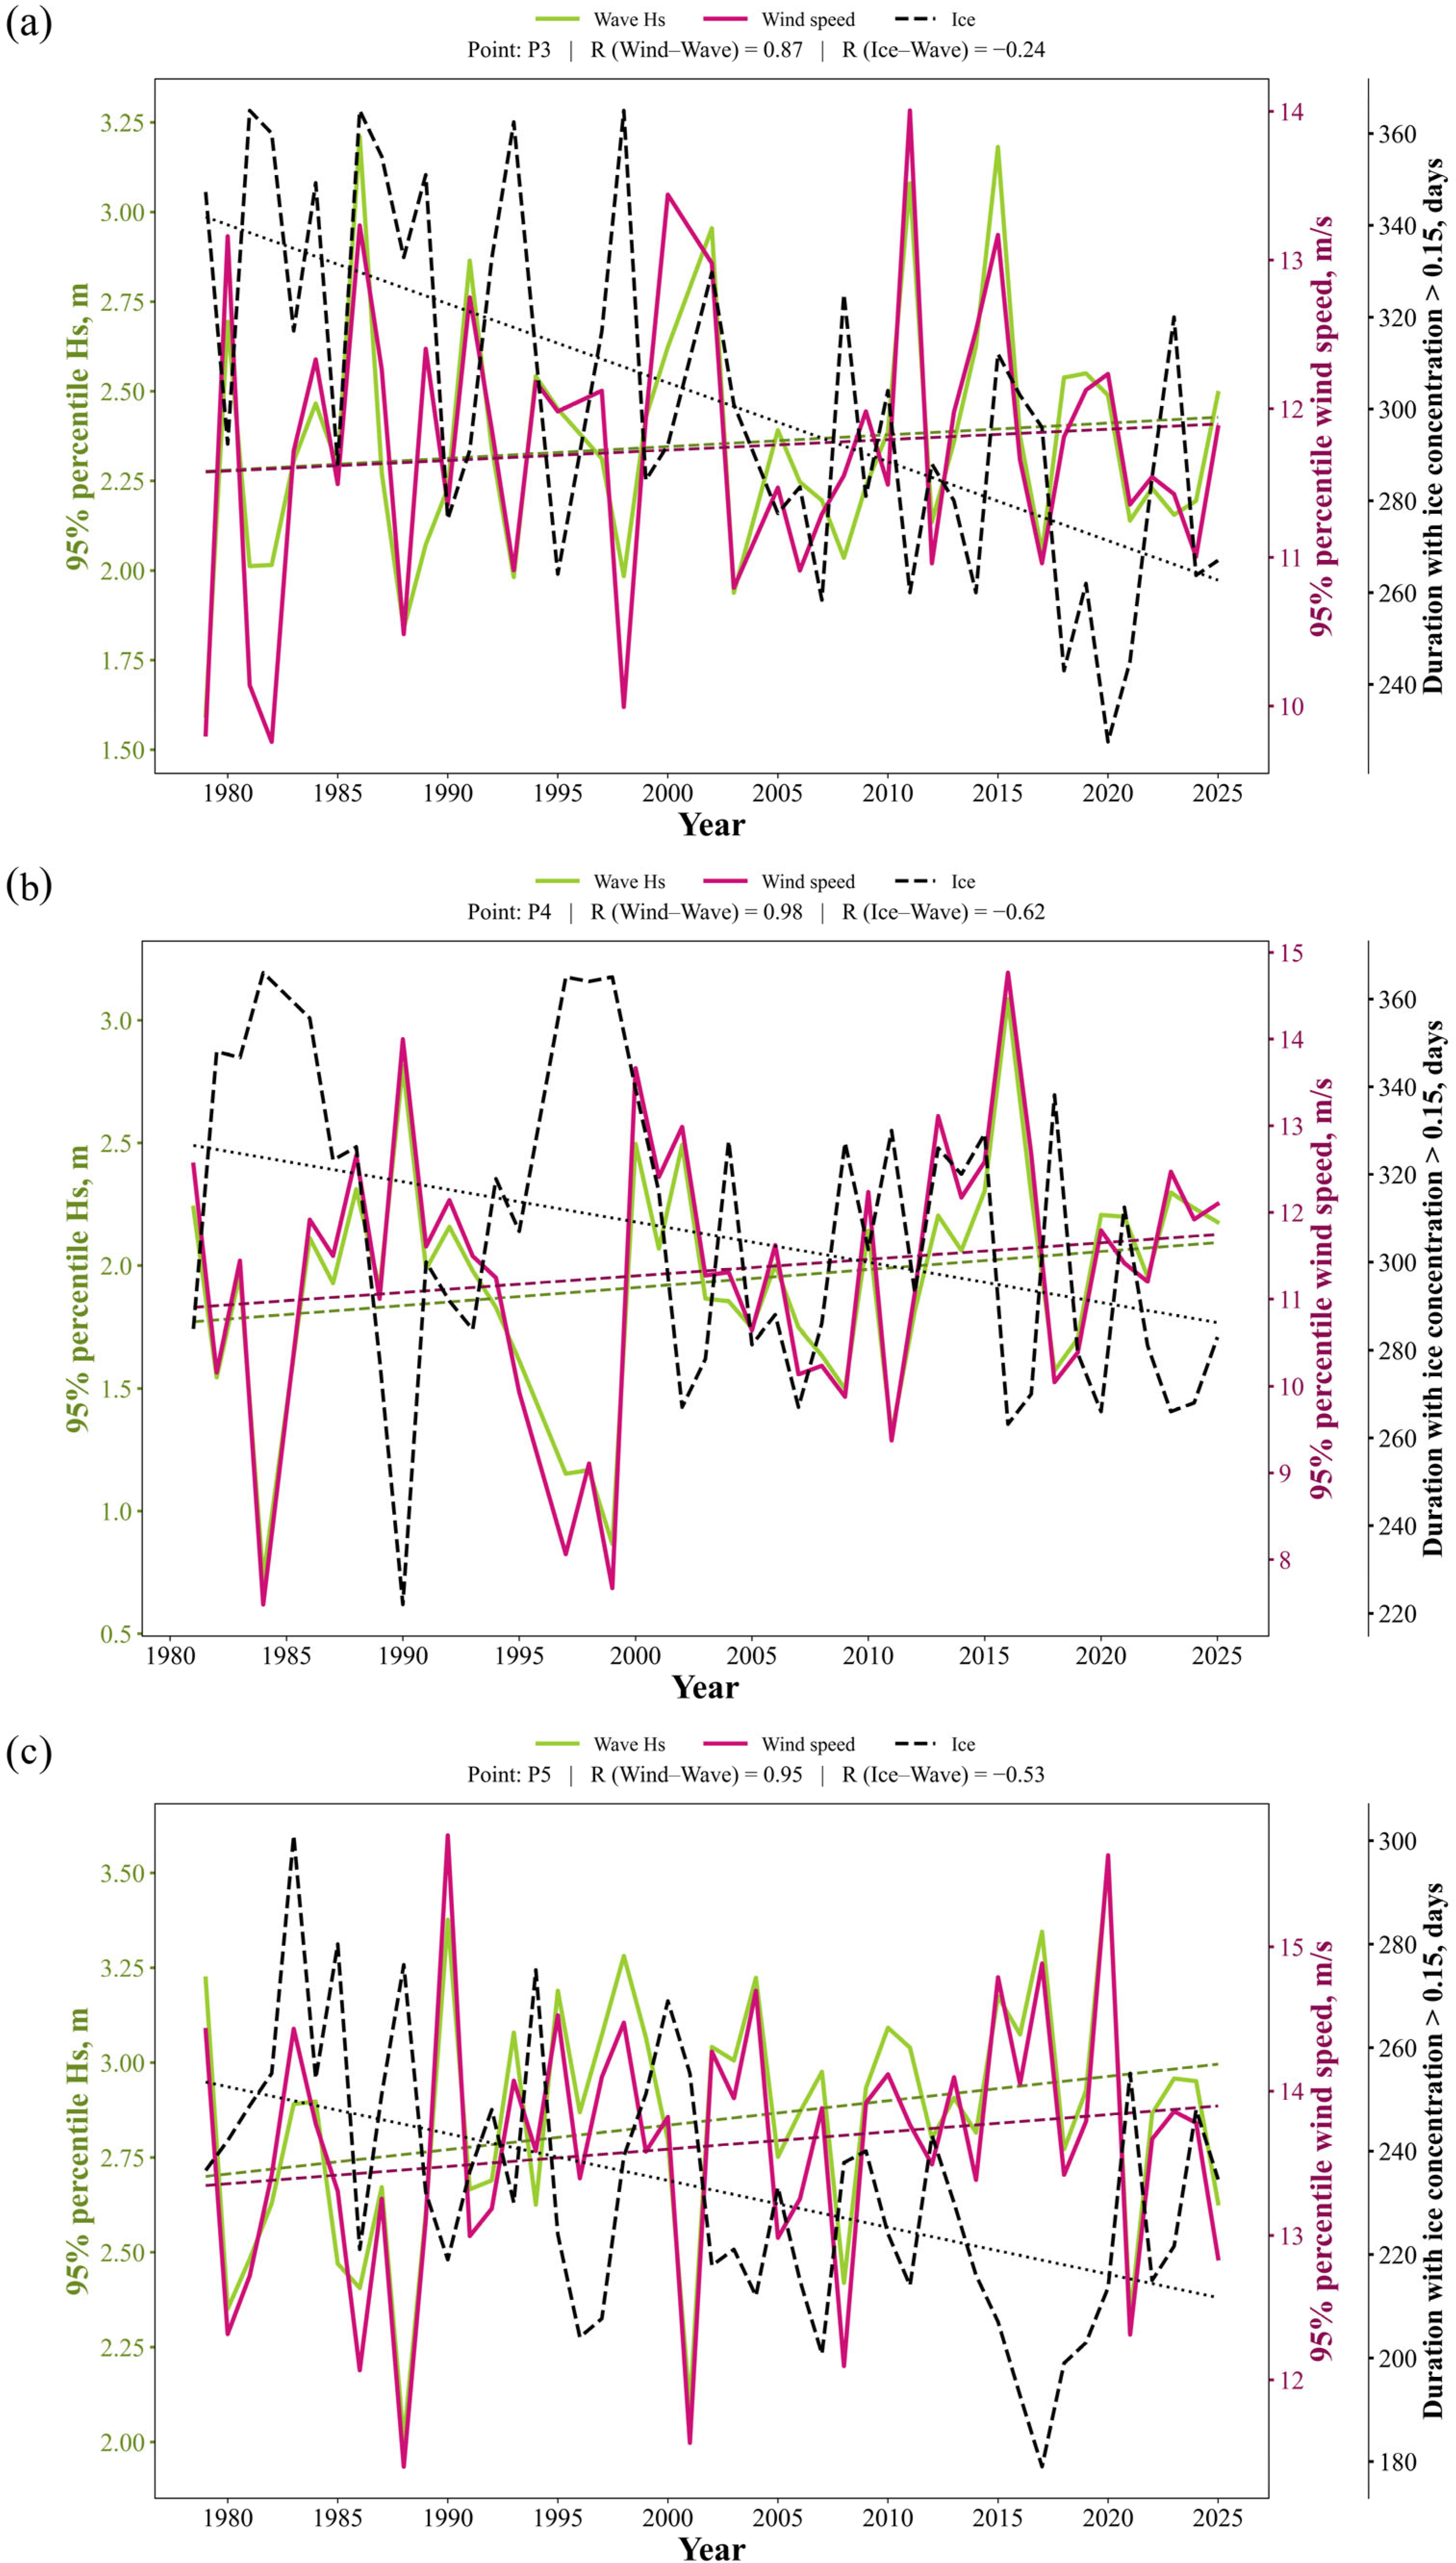
For the highest values of R, plots were generated for each location. Figure 8 presents the plots for the Western Arctic (Figure 8a for a location in the Barents Sea and Figure 8b for a location in the Kara Sea), while Figure 9 covers the Eastern Arctic (Figure 9a in the Laptev Sea, Figure 9b in the East Siberian Sea, and Figure 9c in the Chukchi Sea). The duration of the ice period has also been determined for each point.
Figure 8.
Time series of 95% percentile wind speed and significant wave height at a point in the Barents (a) and Kara (b) seas. Colored dashed lines (Wave Hs and Wind Speed) represent the linear trends of the corresponding variables. The black dotted line represents the linear trend of the duration with ice concentration > 0.15.
Figure 9.
Time series of 95% percentile wind speed and significant wave height at a point in the Laptev (a), East Siberian (b) and Chukchi (c) seas. Colored dashed lines (Wave Hs and Wind Speed) represent the linear trends of the corresponding variables. The black dotted line represents the linear trend of the duration with ice concentration > 0.15.
Consequently, across all locations, the highest correlation coefficient was observed when comparing the 95th percentile of Hs with the 95th percentile of wind speeds. It is worth noting that for the location in the East Siberian Sea, correlation coefficients exceeding 0.9 were found for all comparisons involving means and percentiles; this suggests that wave conditions in this sea are predominantly locally generated. Conversely, the location in the Barents Sea exhibited the lowest correlation, leading to the hypothesis that the influence of swell is significantly greater in this sea than in the others.
Figure 8 shows positive but statistically insignificant trends in the 95th percentile of wind and wave parameters, alongside a significant negative trend in the duration of the ice season.
Let us consider several scenarios for the Barents Sea (Figure 8a). A local minimum in wind and wave parameters is observed in 1992, coinciding with a slight reduction in ice cover duration compared to adjacent years. The following year, 1993, saw a sharp increase in the wind percentile and the duration of the ice season; however, wave height increased in tandem with the wind. A local minimum in ice cover occurred in 2007, yet there was no corresponding local peak in wave activity, likely due to reduced wind speeds that year.
Similar patterns are observed at the Kara Sea location (Figure 8b). During 1991–1992, wave percentile values rose despite the ice-free period duration remaining virtually unchanged—and actually increasing in 1991 compared to the previous year. Wind likely played a role here, as its percentile also increased during this period. However, a mutually reinforcing interaction is more characteristic of the atmosphere-ocean-ice system; for instance, 1996 saw an absolute minimum in the wave percentile, driven by a minimum in the wind percentile and an extended ice season. The response of the wave height percentile to changes in the open-water period duration is stronger here than in the Barents Sea (R = −0.53 in the Kara Sea vs. R = −0.39 in the Barents Sea). Nevertheless, one cannot definitively claim that the duration of the ice-free period is the determining factor for wave heights, as there are instances—such as 2001 in the Kara Sea—where ice cover was minimal, but wave heights did not increase due to low wind speeds.
Figure 9 presents graphs for points located in the Eastern Arctic. All trends are positive but statistically insignificant. Very high correlations are also observed here, particularly in the East Siberian Sea, where wind waves dominate the total wave field relative to swell.
Let us consider the situation for the Laptev Sea (Figure 9a). A local maximum in the wave percentile is observed in 1991, coinciding with an increase in wind speed, even though the duration of the ice-free period changed only slightly compared to the previous year. A similar situation occurred in 2011; while the ice season was shorter than in 2010, the primary driver of increased wave heights was a sharp intensification of the wind. Conversely, in 2007, the ice season was among the shortest in the study period, yet no significant increase in wave activity occurred due to relatively low wind speeds. In contrast, wave heights reached one of their highest levels in 2015 due to stronger winds, despite the ice season being longer than in adjacent years. Thus, while a shorter ice season promotes increased wave activity, interannual wind variability is, in most cases, the decisive factor for extreme wave heights.
Several characteristic scenarios can also be identified for the East Siberian Sea (Figure 9b). For instance, 2016 saw absolute maxima in both wind speed and wave height; although the ice season was indeed shorter, similarly low ice cover was observed in 2020 and 2023–2025, yet wave heights were lower during those years due to weaker winds. The year 2000 is also illustrative: despite a relatively long ice season compared to subsequent years, increased wind speed led to a significant rise in wave heights. Conversely, in 2018, the duration of open water was among the longest in the entire observational record (representing the shortest ice season), yet wave values remained relatively low due to weak winds. These examples demonstrate that even under favorable ice conditions, insufficient wind speed limits the development of wave activity.
In the Chukchi Sea (Figure 9c), the influence of wind is even more pronounced. For instance, a peak in wind speed percentiles was observed in 2020, corresponding to an absolute maximum in wave height, despite the ice season lasting slightly longer than in 2016–2019. Conversely, in 2017—which saw the shortest ice season of the entire period under review—wave heights were lower than in 2020, a result of weaker winds. A similar situation occurred in 2004: despite a relatively short ice season, wave heights remained high due to peak wind speeds. Meanwhile, in 2021, the duration of open water decreased only slightly compared to previous years, yet a significant weakening of the wind was accompanied by a sharp drop in wave heights. Thus, in the Chukchi Sea—as in the other regions examined—changes in the ice regime create the conditions for wave formation, but the immediate interannual variability of extreme wave heights is determined primarily by variations in wind forcing.
4. Discussion
4.1. Comparison with Previous Studies
Changes in wave heights are inextricably linked to changes in sea ice extent.
A system for forecasting sea ice and ocean conditions was implemented in [15]; the results demonstrated that the calculated ocean and sea ice parameters generally show satisfactory agreement with empirical data. According to [16], the most significant trends in sea ice concentration changes are observed in the Kara Sea (−0.60% per year), the Barents Sea (−0.54% per year), and the Chukchi Sea (−0.48% per year). In the East Siberian, Laptev, and Beaufort Seas, the absolute values of these trends do not exceed 0.44% per year. Study [17] estimates a reduction in sea ice thickness of approximately 52% between 1982 and 2020 and suggests that the Arctic Ocean could become completely ice-free during the summer by the early 2060s. However, such a scenario is possible only if the current rates of change in sea ice extent, concentration, and thickness persist.
When compared with the work of other authors [16,21,25,26,27,30,31], a high degree of consistency is observed in the obtained estimates, despite the use of different methodologies.
In the study [62], wave heights are compared across two 30-year periods; for the entire Arctic region, greater wave heights are observed during the 1990–2019 period relative to the 1960–1989 period.
The study [63] presents a comparison of two approaches for calculating the trend in annual maximum significant wave height (Hs) values. A comparison with Figure A1 reveals a match in the general distribution of trend magnitudes; furthermore, the results from both that article and the cited study indicate that the highest trend values are located in the northern parts of the Kara, East Siberian, and Chukchi Seas.
Regions exhibiting significant trends align visually well with the boundaries of ice cover distribution during “low-ice” years [64]. According to this study, the variability of ice extent in the Arctic Ocean is substantial. However, statistical assessments indicate that this variability exhibits two modes of sea ice area recurrence, featuring years of either elevated or reduced ice extent. During low-ice periods—a condition observed over the last two decades—the sea ice area ranges approximately from 8800 to 9900 thousand square kilometers. Thus, if specific locations experienced no wave activity prior to the beginning of the 21st century, but waves subsequently began to appear as the ice retreated, the resulting trend will be positive.
In the study [30], the most pronounced trends in annual mean values are reported in the Laptev and East Siberian Seas. This discrepancy is most likely attributable to the different modeling period selected (1992–2014). Furthermore, that study notes that in all Arctic seas—with the exception of the Beaufort Sea—trends in annual mean values are more pronounced than those observed in wave height percentiles. This suggests that moderate storms are undergoing changes and are beginning to occur more frequently than extreme ones. Our study, however, reveals a different pattern: the magnitude of trends for wave height percentiles exceeds that of the mean values, indicating that the Arctic is currently experiencing an intensification of extreme wave activity.
The observed positive trends in mean annual and maximum wave heights are consistent with earlier studies [21,28,53]. The study [28] also identifies negative trends in mean wave heights and percentiles within the Arctic Ocean, specifically north of 76° N and east of 150° E. The regions exhibiting the strongest trends in that study differ slightly from the locations identified in our work: there, the maximum trends are situated east of the Severnaya Zemlya archipelago, whereas our calculations place them to the west. However, this discrepancy may be attributed to the different time period analyzed (that study covered the years 1996–2015), as well as to the fact that it utilized satellite observational data rather than model simulations—a distinction that should lead to significant errors at high latitudes.
The use of wind speed percentiles in this article is motivated by the fact that the development of extreme wind-driven wave activity is determined not so much by mean wind values as by the frequency and intensity of strong wind events. It is precisely extreme and near-extreme wind speed values that make the primary contribution to the generation of high waves and govern the variability of wave characteristics. A number of studies have demonstrated that an increase in high wind speed percentiles correlates well with an increase in both extreme and mean wave characteristics—particularly in Arctic seas amidst diminishing ice cover [65,66,67]. Furthermore, the use of percentiles allows us to reduce the influence of short-term anomalies and more reliably identify long-term changes in the strong wind regime directly related to wave formation.
The spatial distribution of wind power density variation trend in [68] exhibits areas of statistically significant trends in the vicinity of the Novaya Zemlya archipelago, the Laptev Sea, and the Chukchi Sea, which is consistent with the results of the analysis of mean annual wind speeds and the 95th percentile presented in this article.
Typically, sea ice fields located to the north limit wave fetch when the wind blows from north to south. Consequently, positive trends in the zonal wind component may lead to the development of waves subject to less fetch limitation [53]. On the other hand, any substantial fetch limitation for the 3–5 m waves observed in the study area is likely confined to a distance of no more than 100–200 km from the ice edge; furthermore, given the dimensions of these seas, significant fetch limitation is unlikely to occur. An increase in the percentile of the meridional wind speed component exerts a greater influence on increasing mean Hs in the Chukchi Sea and in the Arctic Ocean along 160° W.
The presence of strong positive trends in the Chukchi Sea—specifically regarding wind percentiles—as well as a heterogeneous structure observed in both mean and percentile wind values, is also evident in satellite measurements and is described in the study by [28].
4.2. Limitations and Uncertainties
Several aspects should be considered when interpreting the results of this study.
First, long-term trends were evaluated using both parametric and non-parametric statistical approaches. The parametric approach was based on ordinary least squares linear regression, whereas the non-parametric analysis employed the modified Mann–Kendall test together with Sen’s slope estimator. The latter approach explicitly accounts for the influence of serial autocorrelation, which is common in climatic time series and may affect significance estimates obtained using conventional regression methods. Although both approaches rely on different statistical assumptions, they produced highly consistent spatial patterns and comparable trend magnitudes, indicating that the main conclusions of this study are robust with respect to the choice of trend estimation method.
Second, quantitative comparison with previous studies should be made with caution. Differences in the estimated trend magnitudes may arise not only from natural climate variability but also from differences in the forcing datasets, atmospheric reanalyses, wave and sea-ice models, model configurations, spatial resolution, simulation periods, and statistical methodologies. Consequently, absolute trend values reported by different studies are not always directly comparable, even when similar regions are investigated.
Third, the present analysis primarily focuses on pairwise relationships between wind, sea ice, and wave characteristics. While the results demonstrate clear spatial correspondence between changes in these variables, the underlying physical interactions are more complex. In particular, changes in sea ice influence wave development by modifying the available fetch, whereas wind forcing simultaneously affects both wave generation and sea-ice evolution. Therefore, the observed relationships should not be interpreted as evidence of direct causality, since feedbacks between the atmosphere, sea ice, and the wave field may act simultaneously.
Fourthly, the study [61] examines the relationships between atmospheric indices and the number of storms. It was found that the variability in the number of storms is weakly related to global atmospheric indices, except in the Barents and Bering Seas. Therefore, this analysis was not conducted in the present study. Study [44] also demonstrates that the formation of 3–4 m waves in the Kara Sea is influenced more by wind speed and duration than by fetch, whereas extreme waves exceeding 6–8 m require a combination of low ice cover and extreme wind conditions.
Fifthly, potential inhomogeneities associated with the transition from the NCEP/CFSR to the NCEP/CFSv2 reanalysis were additionally investigated. This issue is particularly important for the analysis of extreme wind characteristics, as changes in the native spatial resolution between reanalysis products may potentially influence the representation of upper-percentile wind speeds. It should be emphasized that all wind fields used in the present study were previously interpolated onto the common computational grid of the wave model. Therefore, the spatial resolution of the wind forcing applied for trend calculations remained unchanged throughout the entire analyzed period, including before and after 2011. Nevertheless, to explicitly evaluate the possible impact of the CFSR–CFSv2 transition, the homogeneity of annual wind time series was assessed at each grid point using the Pettitt change-point test [62].
The spatially averaged wind time series demonstrated no statistically significant change point, with a Pettitt test p-value of 0.35965, indicating no evidence of a systematic shift associated with the transition between the two reanalysis products. The grid-point analysis revealed that 20,256 out of 73,905 nodes exhibited statistically significant inhomogeneities according to the Pettitt test for the 95th percentile of wind speed. However, these detected change points were not concentrated around the CFSR–CFSv2 transition year. The highest number of points with detected changes occurred in 2008 (3299 points), 2009 (3112 points), and 2007 (2775 points), whereas a change point was recorded at ~600 points in 2011. Thus, no spatially coherent increase in the number of detected discontinuities was observed during the transition period between reanalysis products, suggesting that the detected changes are unlikely to be linked to the change in the wind input dataset.
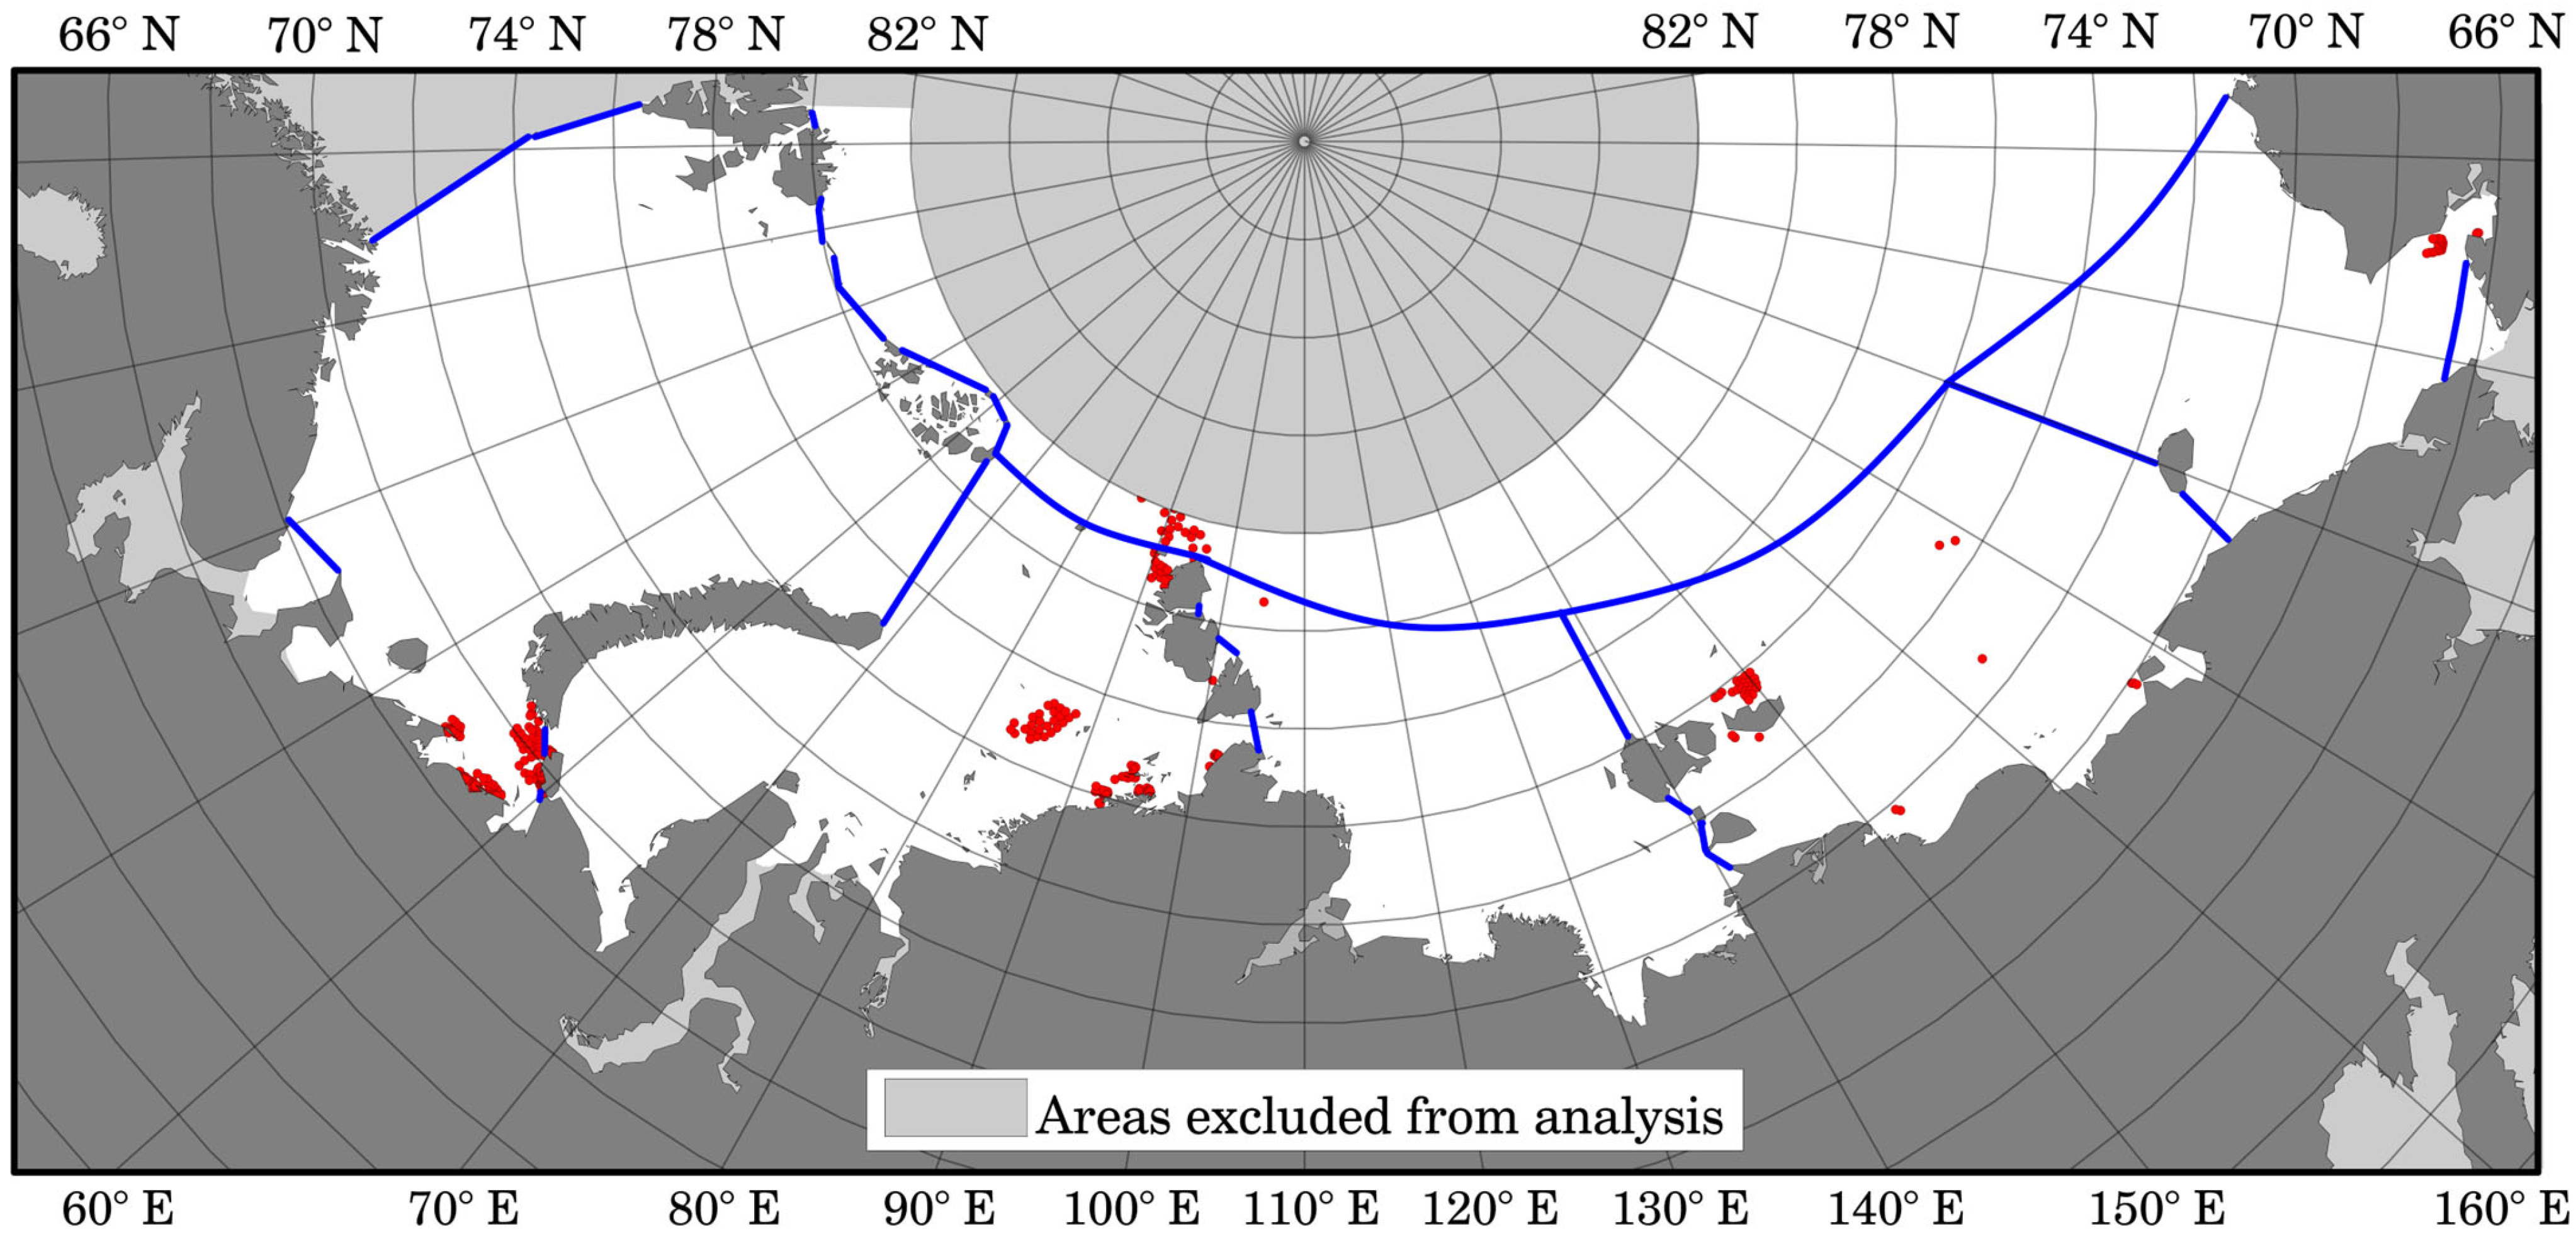
The majority of points with detected inhomogeneities (with change year 2011) are located in coastal areas and near islands (Figure A5), where statistically significant long-term wind speed trends were generally absent. Consequently, these points do not affect the main results presented in this study. Furthermore, all selected locations used for detailed analysis, including regions characterized by significant trends in wind and wave parameters, exhibited homogeneous time series. For the 95th percentile of wind speed, Pettitt test p-values at these locations ranged from 0.064 in the Kara Sea (with a detected change point in 2010) to 0.8883 in the Laptev Sea. Although the Kara Sea location showed the lowest p-value (0.05), it remained above the adopted significance threshold, indicating no statistically significant discontinuity.
Finally, the analyses presented here are based predominantly on linear trend estimates and spatial comparisons. Potential nonlinear interactions and feedback mechanisms within the coupled atmosphere–ice–ocean system were not explicitly investigated. Such processes may become increasingly important under rapidly changing Arctic conditions and should be addressed in future studies.
5. Conclusions
This study analyzes the spatiotemporal variability of wave conditions and wind regimes in the seas of the Eurasian Arctic, based on modeling results obtained using the third-generation spectral wave model WAVEWATCH III for the period 1979–2025. The analysis was conducted for every grid point across two computational grids, utilizing 3-h data on significant wave height (Hs) and wind speed. For wave parameters, annual mean values, maximums, and 95th percentiles were calculated for both the full study period and the ice-free periods. For wind parameters, mean values and 95th percentiles of wind speed were analyzed, as were the mean values and 95th percentiles of the U and V wind speed components during the ice-free periods. Additionally, time-series analysis was performed at selected specific locations.
Two methods were used to calculate trend magnitudes and assess their significance: linear regression and the modified Mann–Kendall test combined with Sen’s slope estimator. The consistency between the parametric and non-parametric trend estimates indicates that serial autocorrelation does not significantly influence the study’s conclusions. Consequently, the identified trends can be considered robust with respect to the choice of methodology.
The robustness of the identified wind trends was additionally evaluated by testing the homogeneity of annual wind time series using the Pettitt change-point test. No systematic discontinuity associated with the transition from CFSR to CFSv2 in 2011 was detected, indicating that the observed trends are unlikely to be caused by changes in the reanalysis forcing.
Over the entire modeling period, the entire Eurasian Arctic water area is exhibiting positive trends in mean annual Hs. The highest trend values were identified in the Barents Sea, where they reach 0.25 m per 10 years and are statistically significant. For maximum Hs, the most pronounced changes are observed in the Kara Sea, as well as specific areas of the East Siberian and Chukchi Seas. An analysis of the 95th percentile of Hs revealed that the most intense positive trends are observed in the Kara Sea, where their magnitude exceeds 0.3 m per 10 years.
For the ice-free period, the number of regions exhibiting statistically significant trends is substantially lower compared to the analysis of the entire simulation period. The highest trend values for mean wave heights were identified in the Kara Sea—in the vicinity of the Severnaya Zemlya archipelago—and in the Chukchi Sea, near the boundary with the Beaufort Sea; however, these values do not exceed 0.125 m per 10 years. Notably, in the Kara Sea, the areas of positive significant trends partially overlap with the Northern Sea Route, which could potentially lead to more challenging navigation conditions. The spatial distribution of significant trends in the 95th percentile of Hs in the ice-free period largely coincides with the distribution of trends in mean annual values, indicating a common underlying nature of the processes driving wave growth.
An analysis of the wind regime revealed that the majority of the seas of the Eurasian Arctic are characterized by positive, statistically insignificant trends in mean wind speed, of the order of 0.1–0.2 m/s per decade. Meanwhile, in the high-latitude sector of the Arctic Ocean—north of 78° N—areas exhibiting negative trends are observed.
A comparison of maps depicting trends in wave activity and wind speed revealed a high degree of consistency between the two. In the vicinity of Spitsbergen, in the Kara Sea east of 70° E (along one of the routes of the Northern Sea Route), as well as in the northern part of the Chukchi Sea, positive trends in wave activity are most likely driven by an increase in mean wind speed. A similar spatial consistency was observed for the 95th percentiles of both waves and wind. In the East Siberian and Chukchi Seas, the value of the trends in the 95th percentile of wind speed exceeds 0.5 m/s per decade, whereas in the other seas, it averages approximately 0.25 m/s per decade.
An analysis of wind components revealed a positive trend in the U-component within the southern regions of the Barents and Kara Seas. Regarding the V-component, an increase in southerly wind speeds is observed across the majority of the study area, manifesting as negative trends reaching values of up to −0.2 m/s per decade.
A joint analysis of wave fields and wind components suggests that the observed intensification of wave activity in the Kara and East Siberian Seas is primarily associated with an increase in westerly wind components. In the East Siberian Sea, the magnitude of the trend in the zonal wind component (U) reaches up to 1 m s−1 per decade in some regions.
Previous studies [61] indicate that the role of large-scale atmospheric circulation differs among the Russian Arctic seas. In the Barents Sea, positive Arctic Oscillation (AO) and North Atlantic Oscillation (NAO) phases are associated with a poleward shift in North Atlantic cyclone tracks and enhanced occurrence of extreme storms, whereas in the Kara Sea the relationship between storm activity and these atmospheric indices is weak. Consequently, the wind and wave trends identified in the present study are more likely to reflect changes in local wind forcing and sea-ice conditions than a direct response to large-scale atmospheric circulation, particularly in the inner Arctic seas.
A clear long-term decrease in sea-ice duration was identified across the entire Eurasian Arctic during 1979–2025. The strongest trend was observed in the Barents Sea, where the open-water season increased by more than 45 days per decade, while the Kara, Laptev, East Siberian, and Chukchi Seas exhibited a mean reduction in ice duration corresponding to approximately 20 days per decade. Spatial and temporal analyses consistently show that this reduction in ice cover creates favorable conditions for wave development, particularly by extending the open-water season.
At selected representative locations, the strongest statistical relationship was found between the 95th percentile of significant wave height (Hs) and wind speed, with correlation coefficients exceeding R > 0.9 in the East Siberian Sea, indicating predominantly locally wind-generated wave fields. In contrast, the Barents Sea showed the weakest correlation, consistent with a stronger influence of swell.
Based on the analysis of the time series, it was shown that a reduction in the ice season duration, or its persistence at a similar level, does not necessarily lead to an increase in wave heights in the absence of concurrent strengthening of wind forcing in the same year. However, it is difficult to refute that when both strong winds and an extended open-water period occur within the same year, wave heights tend to be higher compared to adjacent years.
The results indicate that the contribution of changes in wind regime to wave variability is substantially greater than the influence of the reduction in sea ice extent. These findings are underscored by the spatial distributions of statistically significant trends in wind and wave height during the ice-free period. However, to ensure full confidence in future studies, it will be necessary to analyze the distribution of wind trends over the entire study period, as this could also constitute a crucial step toward a comprehensive understanding of the processes at work in the Arctic. Furthermore, a large area exhibiting significant wave trends over the full period shows only weak correlation with wind trends; this may suggest the presence of nonlinear processes within the region or a more complex interplay within the ocean-atmosphere-ice system.
In summary, this study outlines avenues for further research, drawing the interim conclusion that, in the absence of statistically significant positive trends in wind speed, a substantial increase in wave activity in the Arctic is also unlikely to be observed.
The observed intensification of wave activity may have important implications for coastal erosion processes, navigational conditions, and the design and operation of offshore infrastructure in the Arctic marginal seas.
Author Contributions
The concept of the study was developed by S.M. S.M. did numerical simulations, analysis, and manuscript writing. E.K. did analysis, visualization, and manuscript writing. All authors have read and agreed to the published version of the manuscript.
Funding
Data analysis was performed by Kruglova E.E. and funded by the Ministry of Science and Higher Education of Russia, theme FMWE-2024-0016. Wave modeling was carried out by Myslenkov S.A. with financial support from the State assignment of IAP RAS 125020501524-9.
Data Availability Statement
The data presented in this study are available on request from the corresponding author due to restrictions related to proprietary research materials and computational datasets developed by the authors.
Acknowledgments
The authors express their gratitude to K.P. Myslenkova for the graduate course on writing articles in English. Thanks to the knowledge gained, the article has a higher level of language.
Conflicts of Interest
The authors declare no conflict of interest.
Appendix A
Table A1.
The coordinates of the selected points P1–P5.
Figure A1.
Spatial distribution of the trends for maximum annual Hs (m/10 years). Distribution map for the entire study period. Blue lines indicate the boundaries of the studied seas.
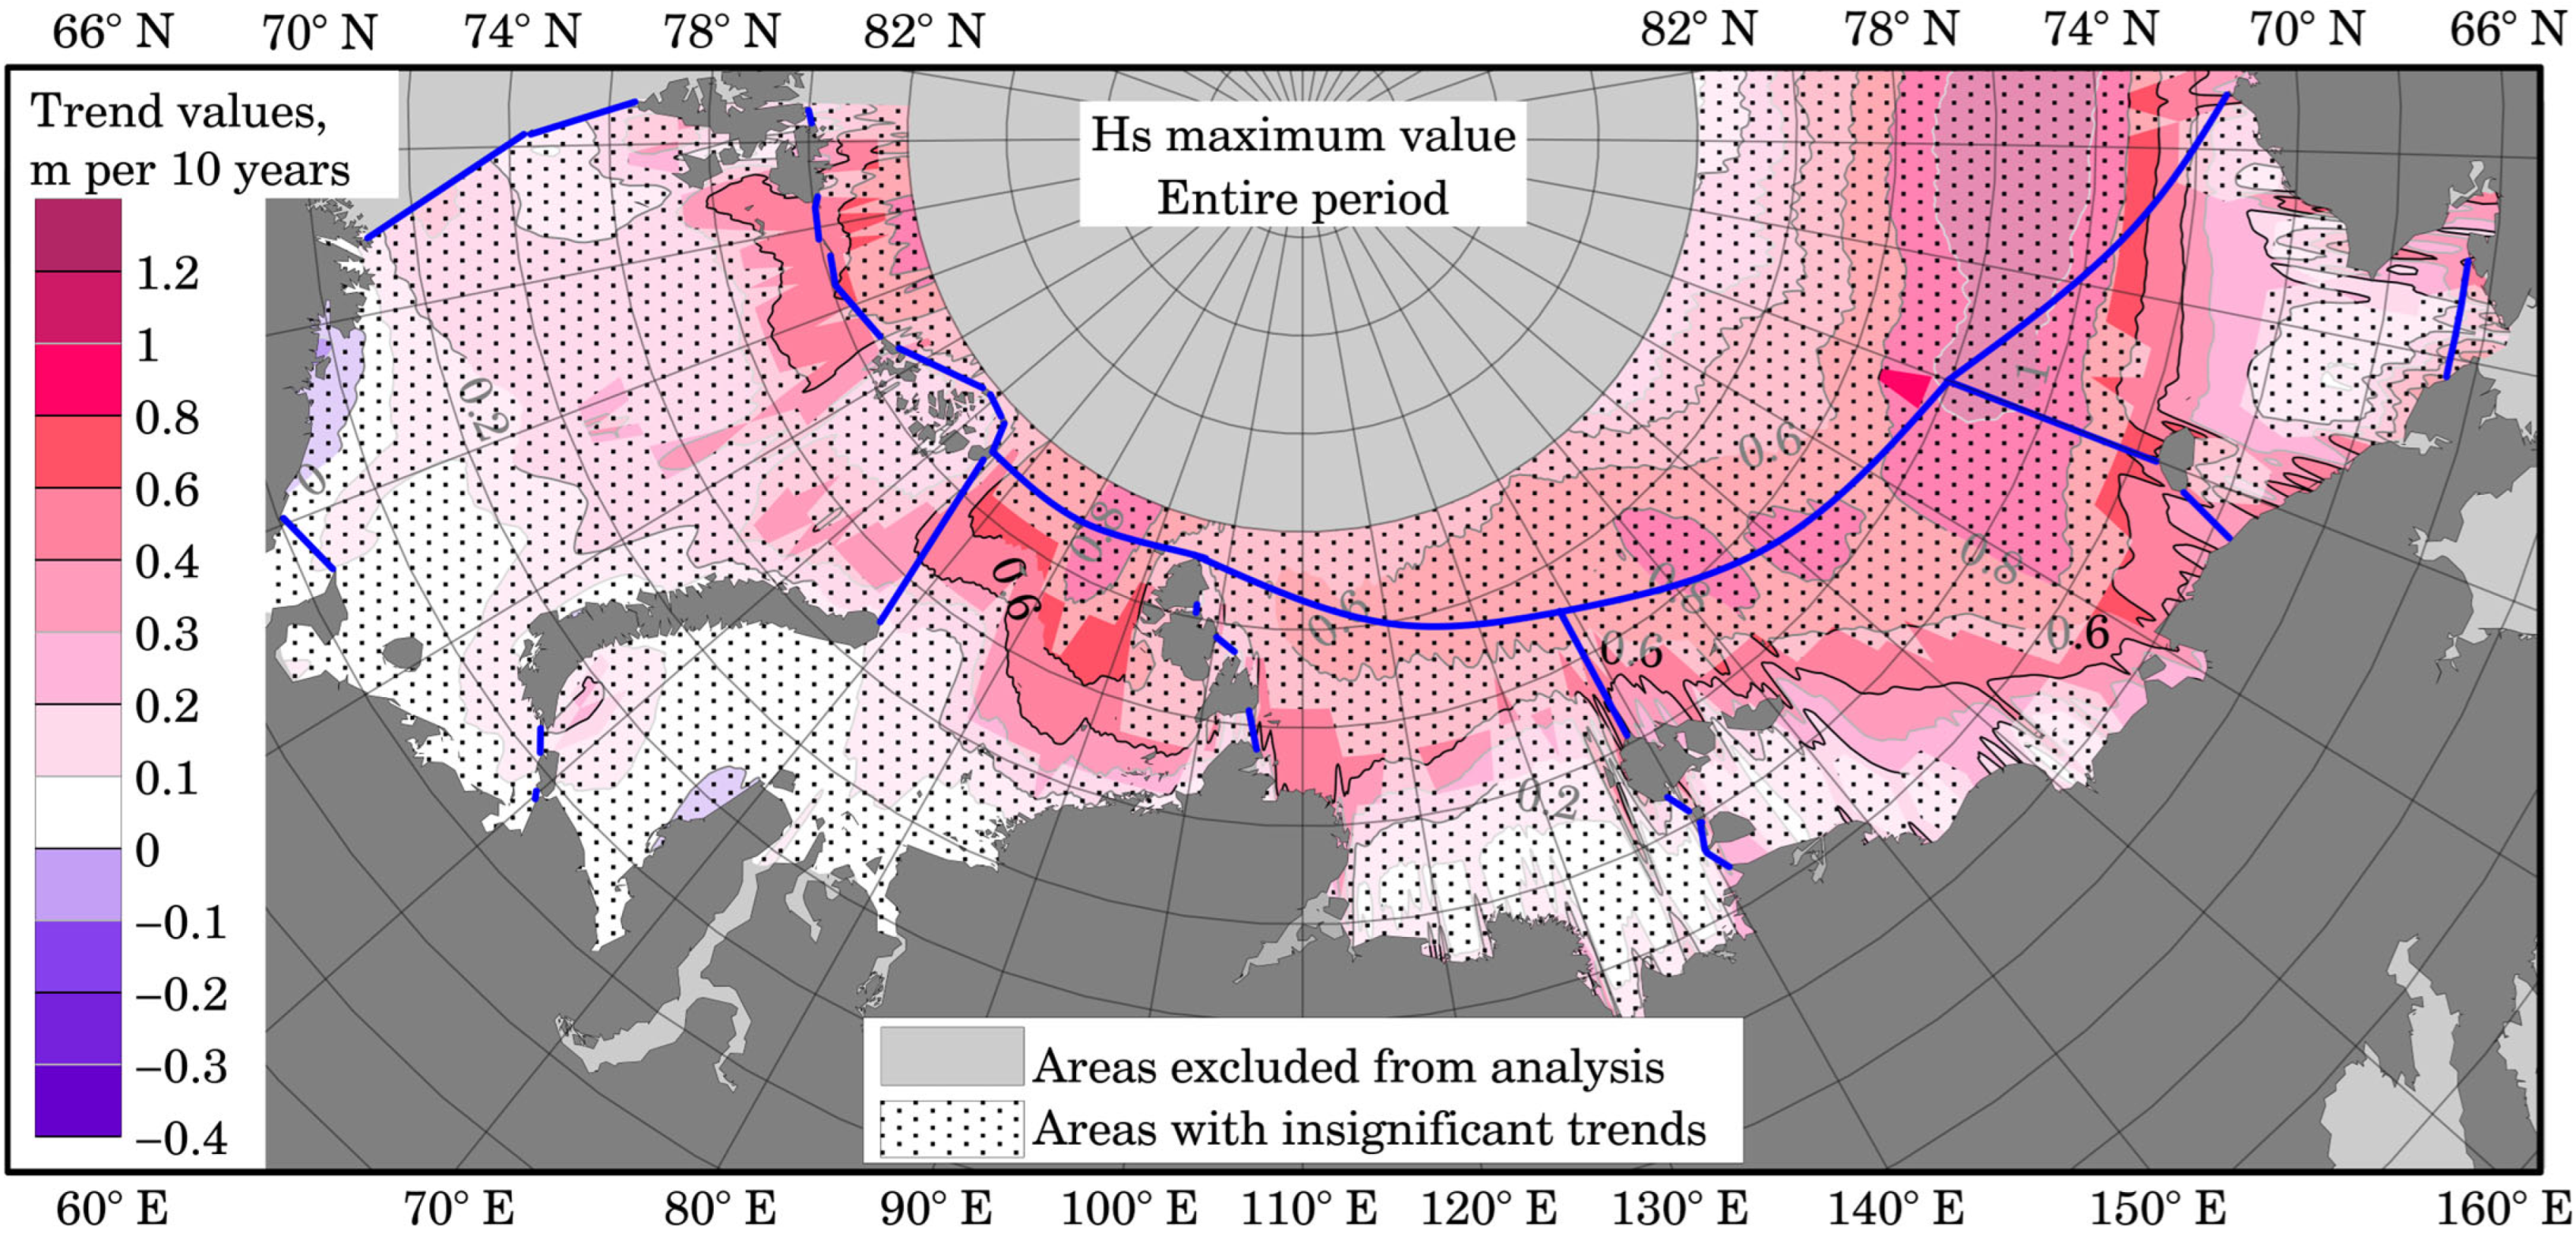
Figure A2.
Spatial distribution of the trends for average annual Hs (m/10 years). Distribution map for the ice-free period. Blue lines indicate the boundaries of the studied seas.
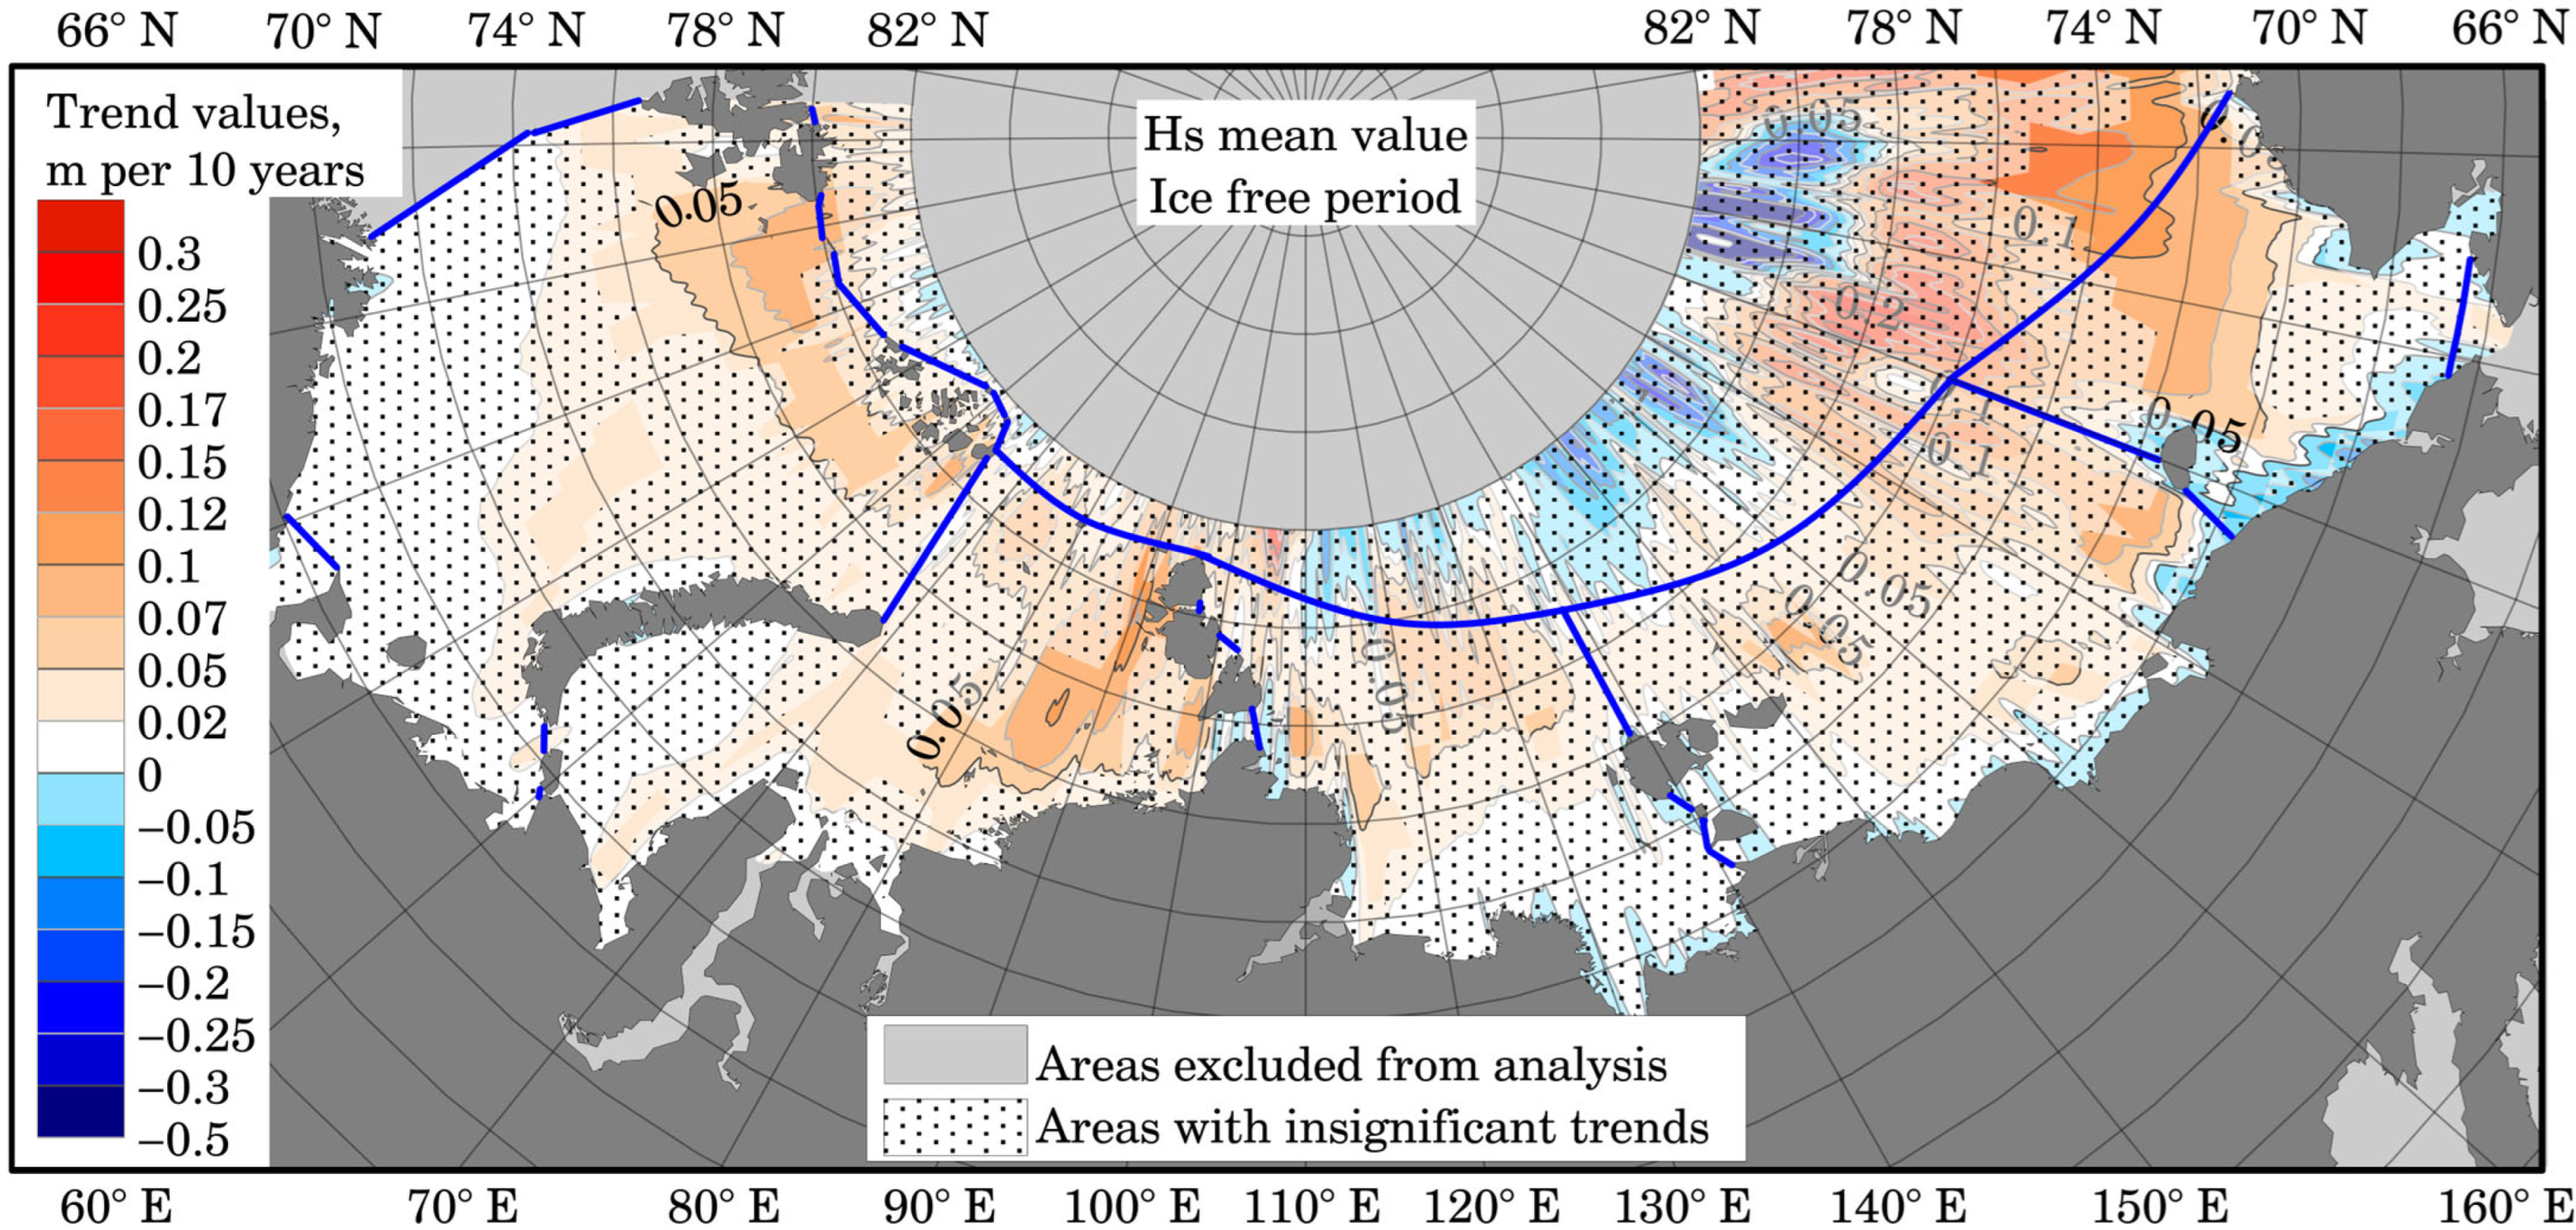
Figure A3.
Spatial distribution of the trends for mean annual wind speed for U (a) and V (b) components (m/s per 10 years). Distribution map for the ice-free period. Blue lines indicate the boundaries of the studied seas.
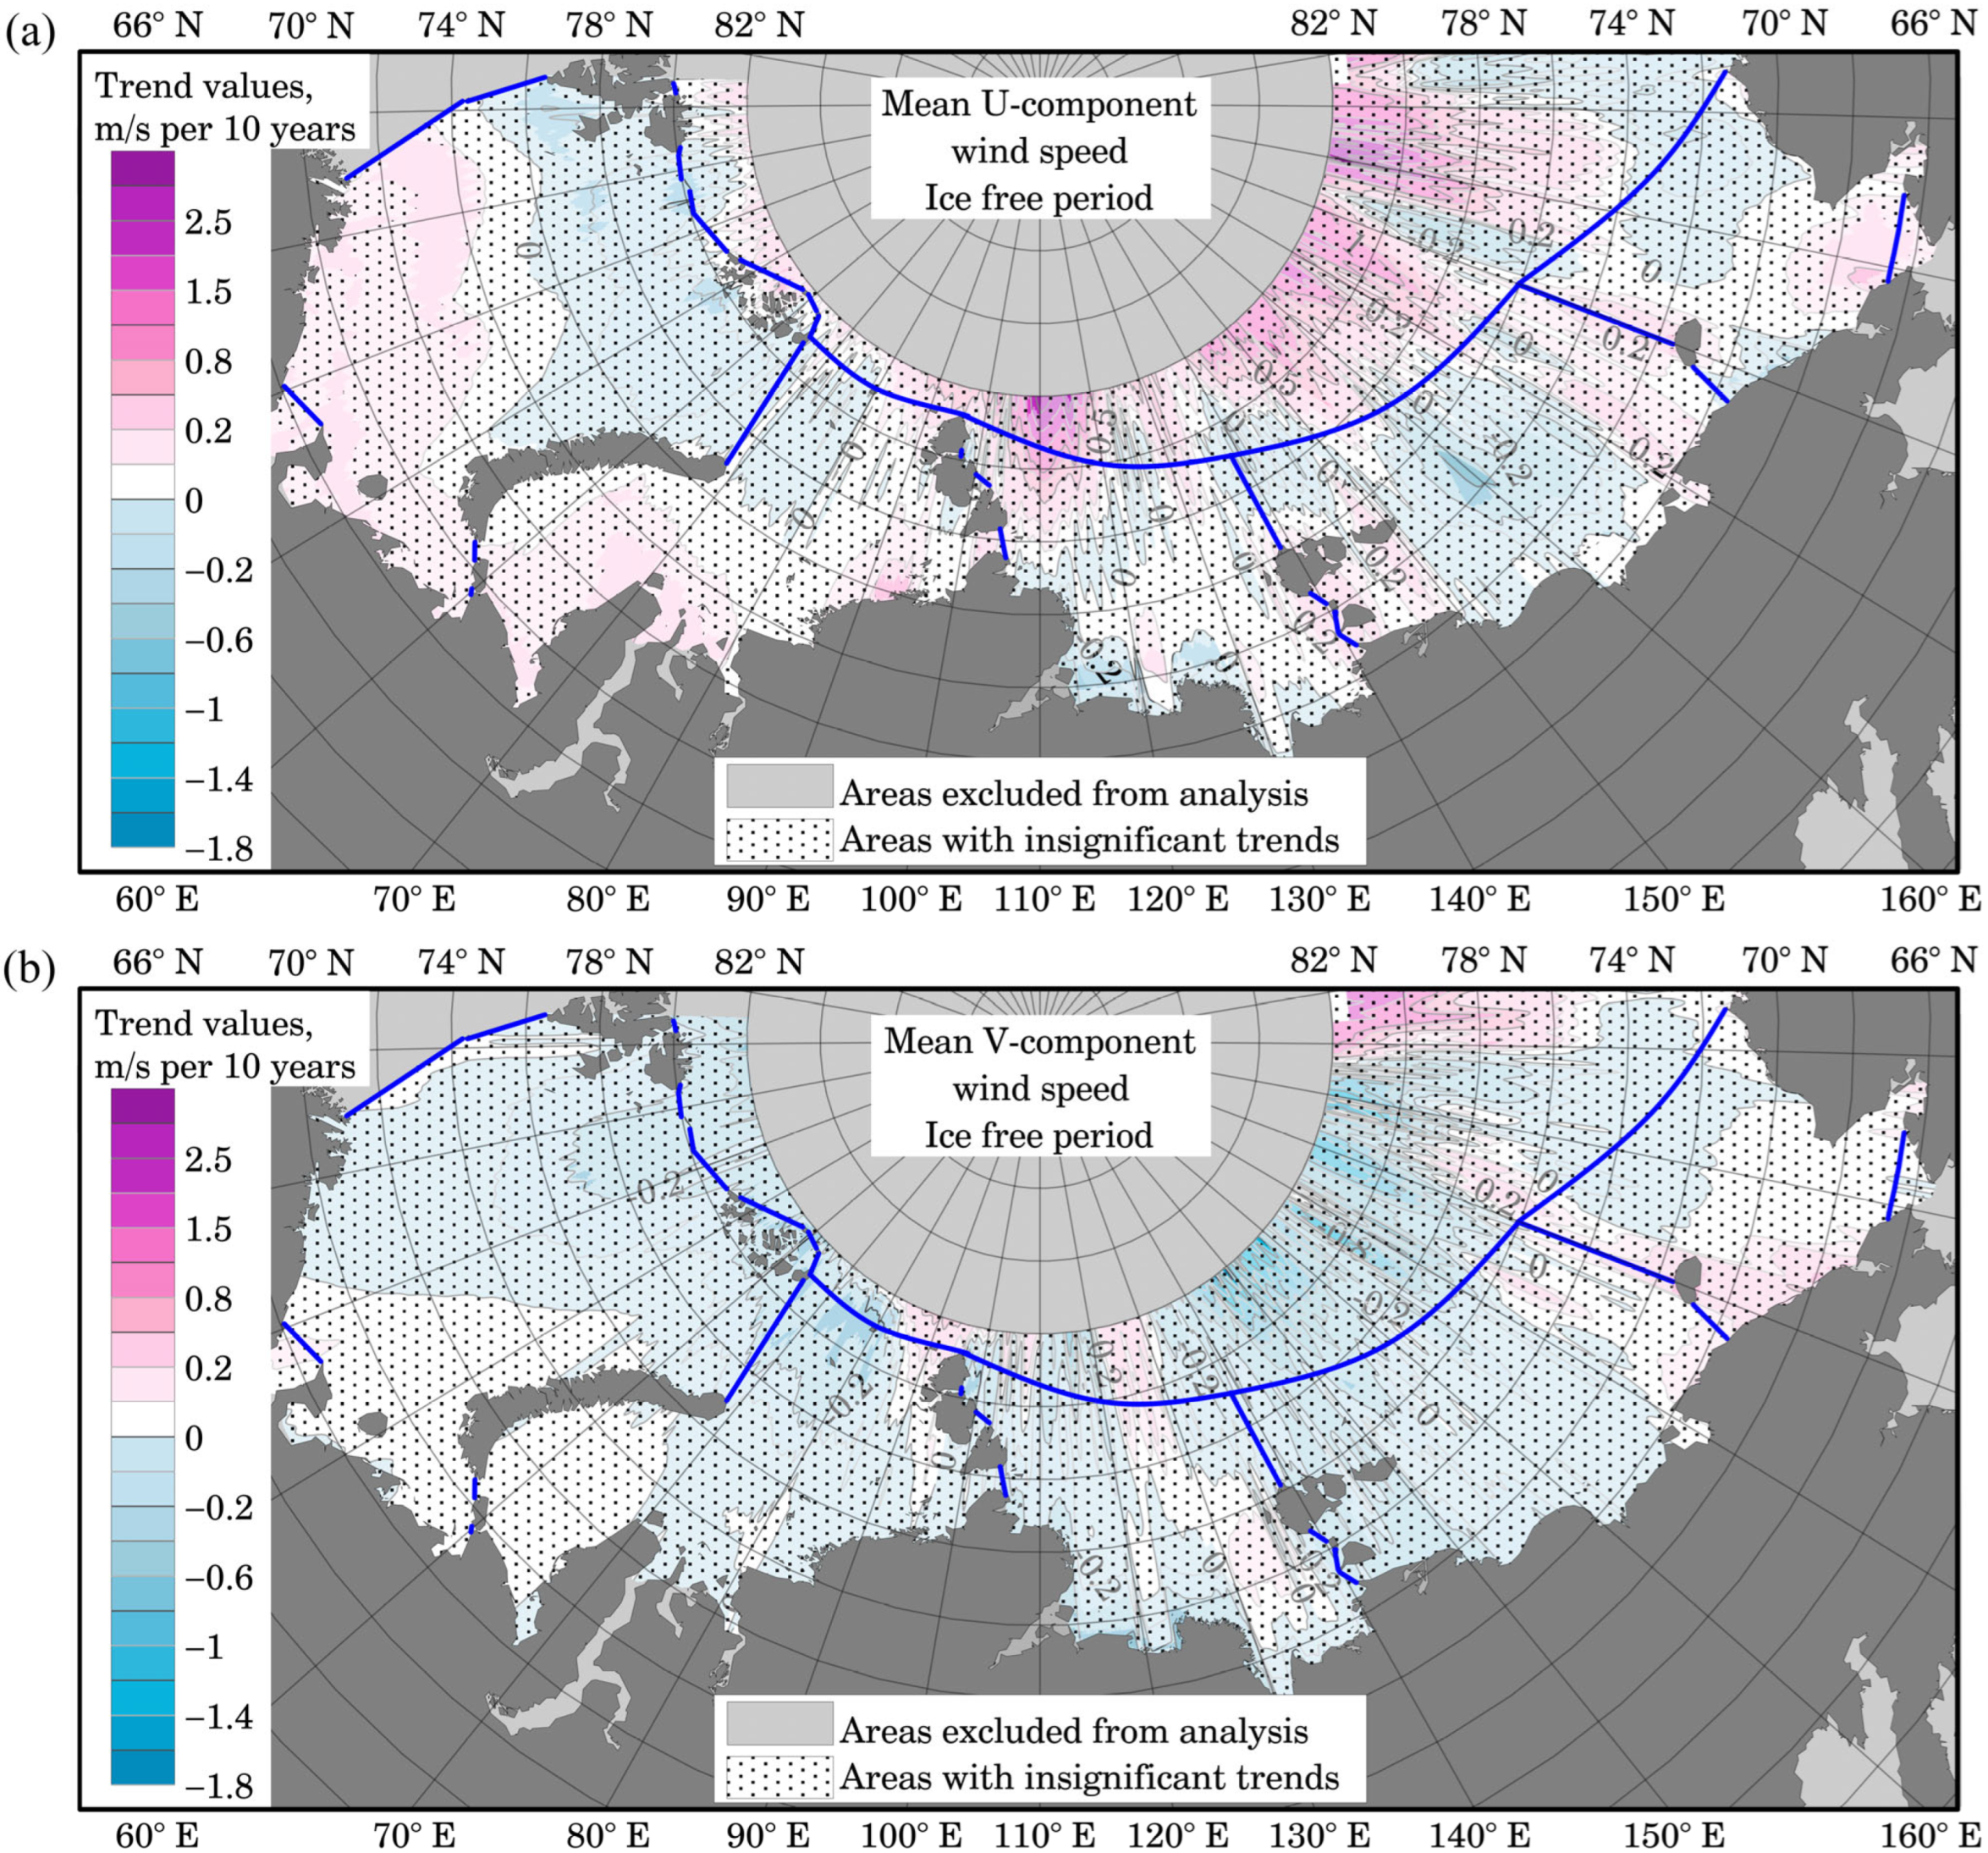
Figure A4.
Spatial distribution of the trends for 95% percentile annual wind speed for U (a) and V (b) components (m/s per 10 years). Distribution map for the ice-free period. Blue lines indicate the boundaries of the studied seas.
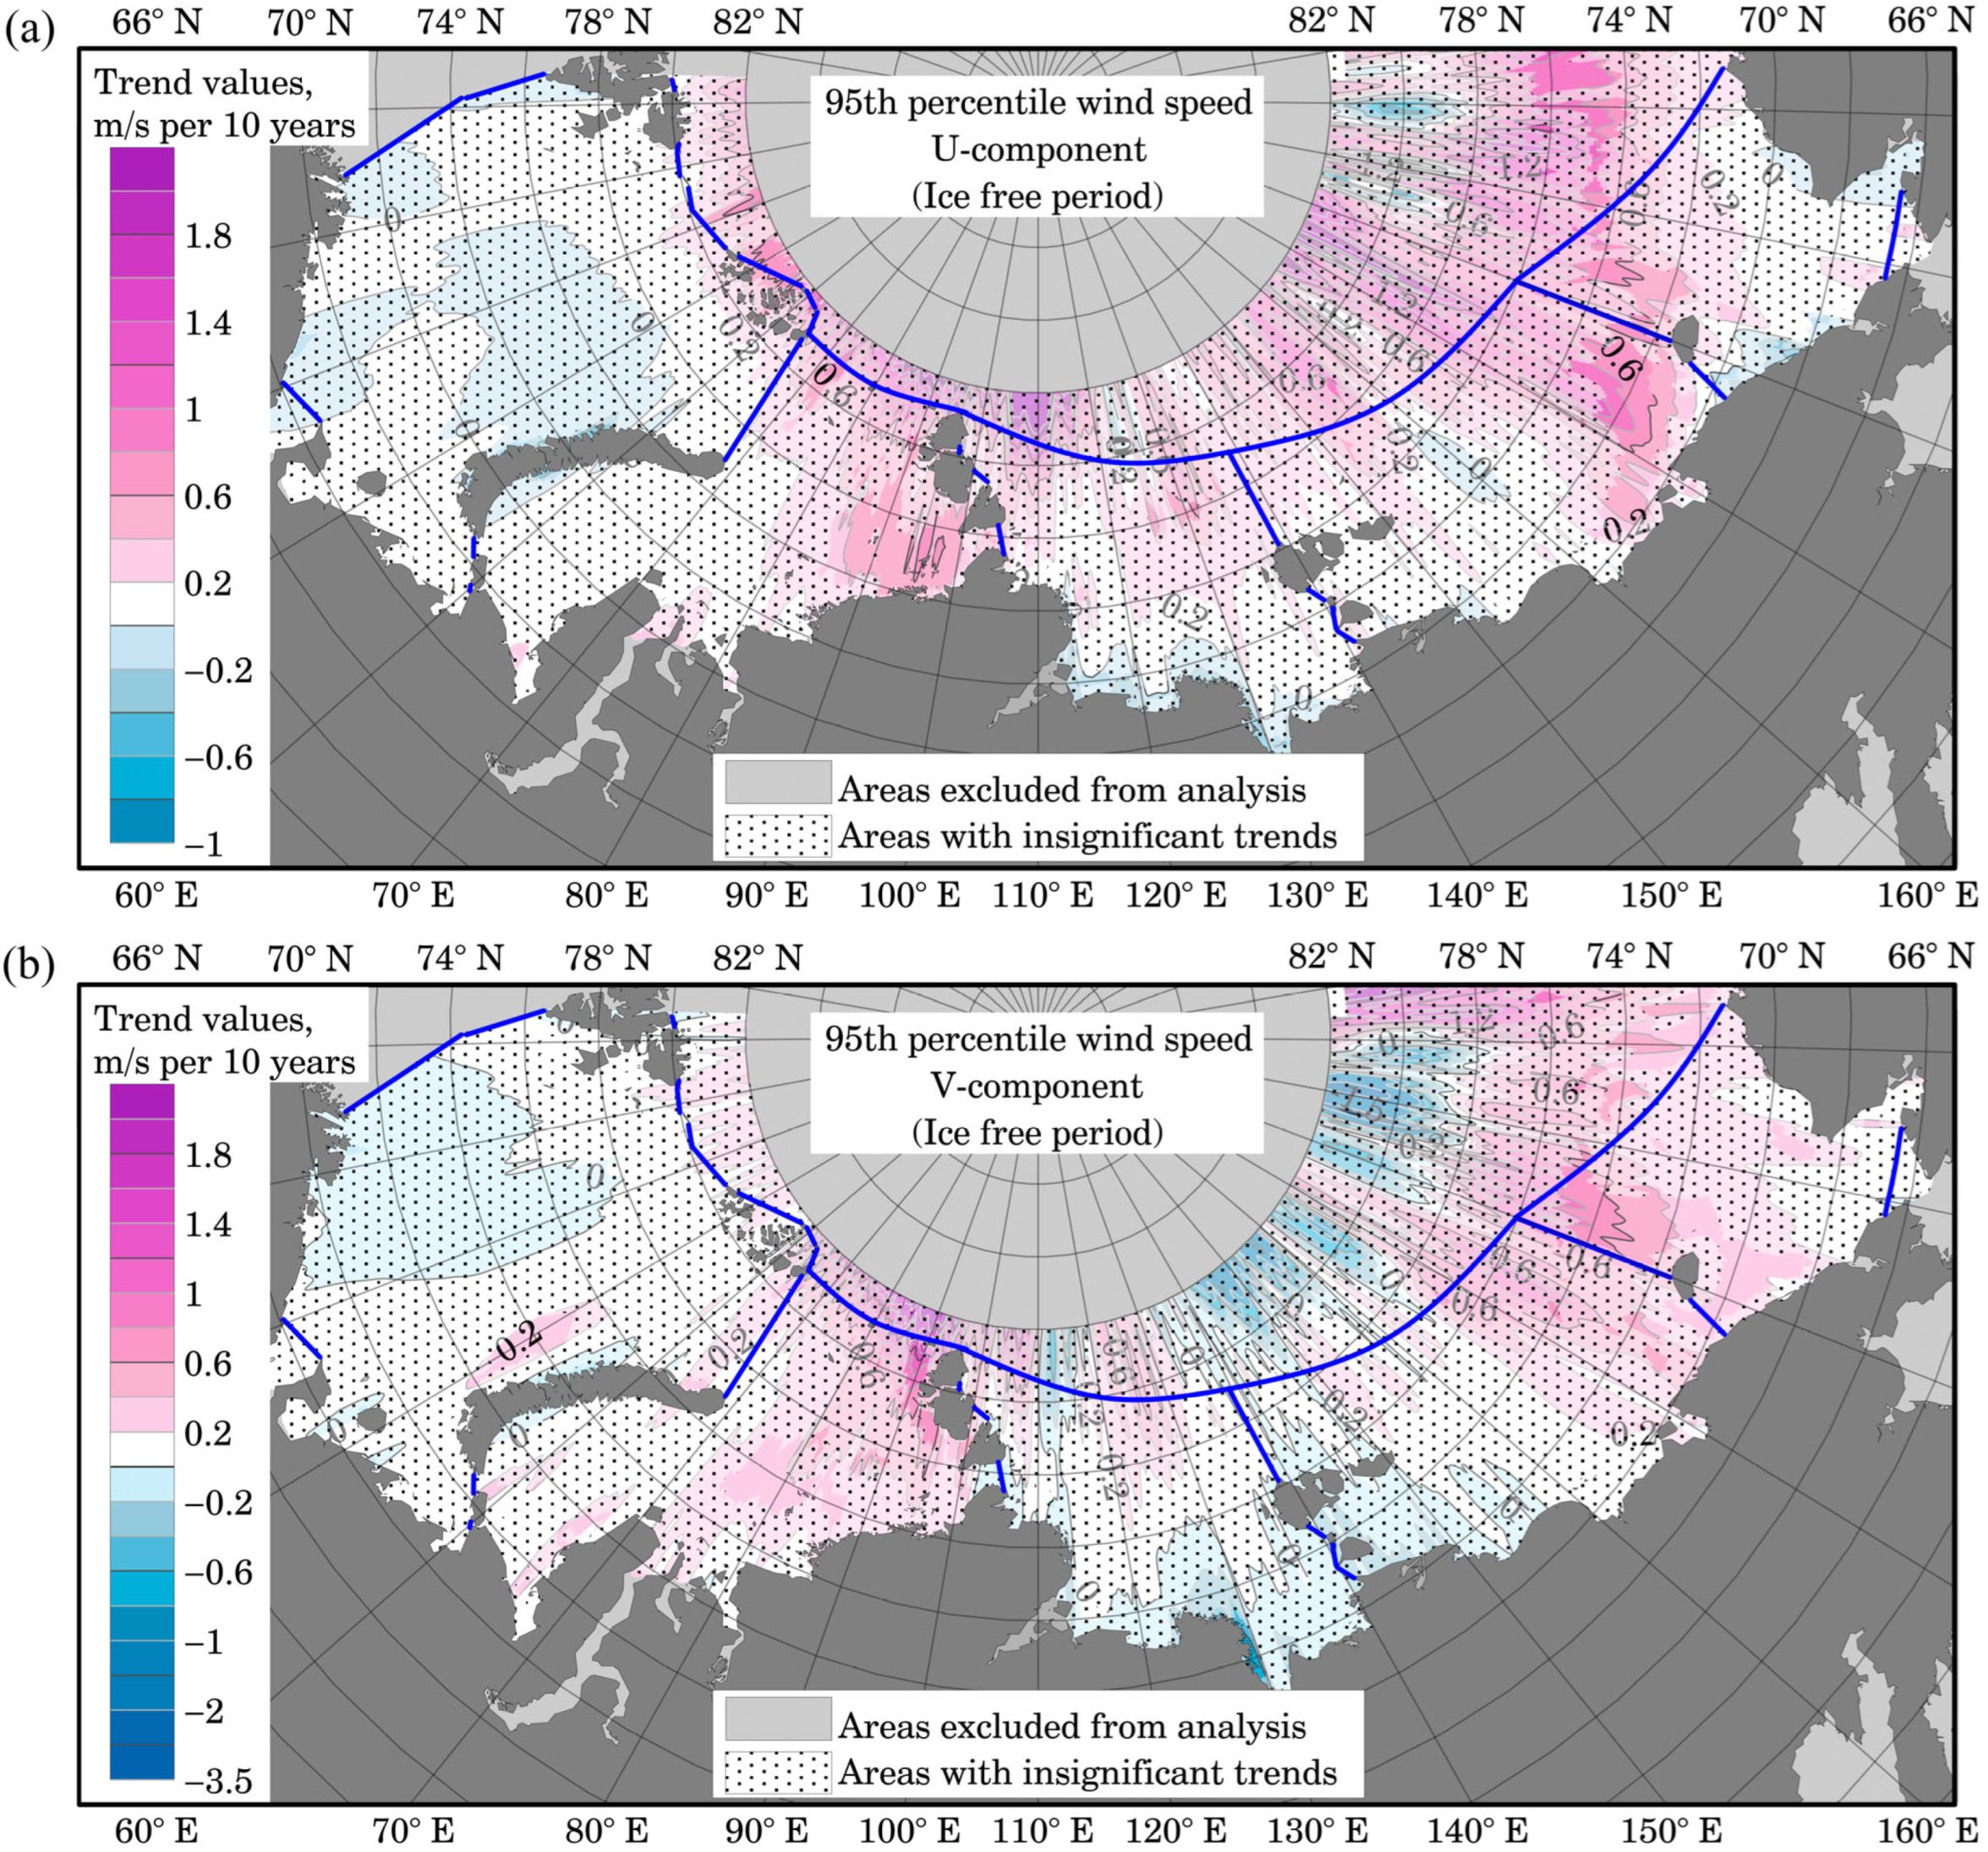
Figure A5.
Spatial distribution of nodes where inhomogeneous time series (with change year 2011) were detected (red circles). Blue lines indicate the boundaries of the studied seas.
References
- Smirnov, A.Y. The Northern Sea Route: Results and Prospects. Arct. Ecol. Econ. 2025, 15, 109–118. [Google Scholar] [CrossRef] [Scilit]
- Durnev, N.Y.; Katyukha, P.B. Research into the Development Prospects of the Northern Sea Route Amidst the Transformation of Global Energy Logistics. Innov. Invest. 2026, 4, 147–150. [Google Scholar]
- Lee, S.J.; Kim, J.; Yun, H.S. Deep Learning for Seasonal Navigability Prediction Along the Northern Sea Route: When Does It Add Value? Sustainability 2026, 18, 4873. [Google Scholar] [CrossRef] [Scilit]
- Rezvov, V.; Krinitskiy, M.; Gavrikov, A.; Koshkina, V.; Demidova, E. On the Phenomena-Oriented Validation of Spatial Neural-Network Based Surface Wind Downscaling over the Arctic Seas. Front. Mar. Sci. 2026, 13, 1765713. [Google Scholar] [CrossRef] [Scilit]
- Semenov, V.A.; Cherenkova, E.A. Estimates of Possible Changes in the Open-Water Period in the Russian Exclusive Economic Zone in the Arctic in the 21st Century. Dokl. Earth Sci. 2025, 520, 4. [Google Scholar] [CrossRef] [Scilit]
- Ivanov, V. Arctic Sea Ice Loss Enhances the Oceanic Contribution to Climate Change. Atmosphere 2023, 14, 409–419. [Google Scholar] [CrossRef] [Scilit]
- Wang, S.; Yu, F.; Min, C.; He, Y.; Pan, R.; Shu, Q. Projected Navigability of Arctic Shipping Routes Based on Climate Model FIO-ESM v2.1. Anthropocene 2024, 47, 100445. [Google Scholar] [CrossRef] [Scilit]
- Henke, M.; Miesse, T.; de Lima, A.D.S.; Ferreira, C.M.; Ravens, T.M. Increasing Coastal Exposure to Extreme Wave Events in the Alaskan Arctic as the Open Water Season Expands. Commun. Earth Environ. 2024, 5, 165. [Google Scholar] [CrossRef] [Scilit]
- Henke, M.T.; Miesse, T.; de Souza de Lima, A.; Ferreira, C.; Ravens, T.; Pundt, R. Evolving Arctic Maritime Hazards: Declining Sea Ice and Rising Waves in the Northwest Passage. Proc. Natl. Acad. Sci. USA 2024, 121, e2400355121. [Google Scholar] [CrossRef] [Scilit] [PubMed]
- Huang, X.; Wang, Q.; Li, X.; Wang, Y.; Yue, X.; Yue, Q.; Zhang, D. Navigation Risk Assessment of Arctic Shipping Routes Based on Bayesian Networks. J. Mar. Sci. Eng. 2025, 13, 2306. [Google Scholar] [CrossRef] [Scilit]
- Kumar, R.; Li, J.; Hedstrom, K.; Babanin, A.V.; Tang, Y. Intercomparison of Arctic Sea Ice Simulation in ROMS-CICE and ROMS-Budgell. Polar Sci. 2021, 29, 100716. [Google Scholar] [CrossRef] [Scilit]
- Ushakov, K.V.; Grankina, T.B.; Ibrayev, R.A.; Gromov, I.V. Simulation of Arctic and North Atlantic Ocean Water and Ice Seasonal Characteristics by the INMIO-CICE Coupled Model. IOP Conf. Ser. Earth Environ. Sci. 2016, 48, 012013. [Google Scholar] [CrossRef] [Scilit]
- Johnson, M.; Gaffigan, S.; Hunke, E.; Gerdes, R. A Comparison of Arctic Ocean Sea Ice Concentration among the Coordinated AOMIP Model Experiments. J. Geophys. Res. Oceans 2007, 112, C04S11. [Google Scholar] [CrossRef] [Scilit]
- Johnson, M.; Proshutinsky, A.; Aksenov, Y.; Nguyen, A.T.; Lindsay, R.; Haas, C.; Zhang, J.; Diansky, N.; Kwok, R.; Maslowski, W.; et al. Evaluation of Arctic Sea Ice Thickness Simulated by AOMIP Models. J. Geophys. Res. Oceans 2011, 117, C00D13. [Google Scholar]
- Butakov, N.Y.; Rubinstein, K.G.; Ignatov, R.Y. Calculation of Ocean and Sea Ice State Parameters for the Arctic. Arct. Ecol. Econ. 2025, 15, 127–136. [Google Scholar] [CrossRef] [Scilit]
- Wang, Y.; Bi, H.; Huang, H.; Liu, Y.; Liu, Y.; Liang, X.; Zhang, Z. Satellite-Observed Trends in the Arctic Sea Ice Concentration for the Period 1979–2016. J. Oceanol. Limnol. 2019, 37, 18–37. [Google Scholar]
- Wang, X.; Liu, Y.; Key, J.R.; Dworak, R. A New Perspective on Four Decades of Changes in Arctic Sea Ice from Satellite Observations. Remote Sens. 2022, 14, 1846. [Google Scholar] [CrossRef] [Scilit]
- Namir, I.; Hussain, M.A.; Ramanna, S.; Liu, Q.; Kathiravelu, P. Satellite Image Processing in the Circumpolar North: Understanding Climate Crisis by Predicting Sea Ice Extent in the Arctic. Remote Sens. Appl. Soc. Environ. 2025, 40, 101797. [Google Scholar] [CrossRef] [Scilit]
- Zhang, Z.L.; Hui, F.M.; Cheng, X. Satellite Observations Reveal the Impact of Changing Sea Ice on Wintertime Surface Turbulent Fluxes over the Arctic Ocean. Adv. Clim. Change Res. 2025, 16, 935–947. [Google Scholar] [CrossRef] [Scilit]
- Shabanov, P.A. Ice-Free Period in the East Siberian Sea According to Coastal and Remote Sensing Observations. J. Oceanol. Res. 2025, 53, 76–97. [Google Scholar]
- Cabral, I.S.; Young, I.R.; Toffoli, A. Long-Term and Seasonal Variability of Wind and Wave Extremes in the Arctic Ocean. Front. Mar. Sci. 2022, 9, 802022. [Google Scholar] [CrossRef] [Scilit]
- Extreme Arctic Waves Set to Hit New Heights. Nature 2020, 583, 495. [CrossRef] [Scilit]
- Casas-Prat, M.; Wang, X.L. Projections of Extreme Ocean Waves in the Arctic and Potential Implications for Coastal Inundation and Erosion. J. Geophys. Res. Oceans 2020, 125, e2019JC015745. [Google Scholar] [CrossRef] [Scilit]
- Waseda, T.; Nose, T.; Kodaira, T.; Sasmal, K.; Webb, A. Climatic Trends of Extreme Wave Events Caused by Arctic Cyclones in the Western Arctic Ocean. Polar Sci. 2021, 27, 100625. [Google Scholar] [CrossRef] [Scilit]
- Lopatukhin, L.I.; Bukhanovsky, A.V.; Degtyarev, A.B.; Rozhkov, V.A. Reference Data on the Wind and Wave Regime of the Barents, Okhotsk, and Caspian Seas; Russian Maritime Register of Shipping: St. Petersburg, Russia, 2003. [Google Scholar]
- Lopatukhin, L.I.; Bukhanovsky, A.V.; Chernysheva, E.S. Reference Data on the Wind and Wave Regime of the Japan and Kara Seas; Russian Maritime Register of Shipping: St. Petersburg, Russia, 2009; p. 358. [Google Scholar]
- Thomson, J.; Fan, Y.; Stammerjohn, S.; Stopa, J.; Rogers, W.E.; Girard-Ardhuin, F.; Ardhuin, F.; Shen, H.; Perrie, W.; Shen, H.; et al. Emerging Trends in the Sea State of the Beaufort and Chukchi Seas. Ocean Model 2016, 105, 1–12. [Google Scholar] [CrossRef] [Scilit]
- Liu, Q.; Babanin, A.V.; Zieger, S.; Young, I.R.; Guan, C. Wind and Wave Climate in the Arctic Ocean as Observed by Altimeters. J. Clim. 2016, 29, 7957–7975. [Google Scholar] [CrossRef] [Scilit]
- Miesse, T.W.; Henke, M.; de Souza de Lima, A.; Ferreira, C.M.; Ravens, T. The Critical Role of Sea Ice Products for Accurate Wind-Wave Simulations in the Arctic. Earth Space Sci. 2025, 12, e2024EA003803. [Google Scholar] [CrossRef] [Scilit]
- Stopa, J.E.; Ardhuin, F.; Girard-Ardhuin, F. Wave Climate in the Arctic 1992–2014: Seasonality and Trends. Cryosphere 2016, 10, 1605–1629. [Google Scholar] [CrossRef] [Scilit]
- Waseda, T.; Webb, A.; Sato, K.; Inoue, J.; Kohout, A.; Penrose, B.; Penrose, S. Correlated Increase of High Ocean Waves and Winds in the Ice-Free Waters of the Arctic Ocean. Sci. Rep. 2018, 8, 4489. [Google Scholar] [CrossRef] [Scilit] [PubMed]
- Wang, X.L.; Feng, Y.; Swail, V.R.; Cox, A. Historical Changes in the Beaufort–Chukchi–Bering Seas Surface Winds and Waves, 1971–2013. J. Clim. 2015, 28, 7457–7469. [Google Scholar] [CrossRef] [Scilit]
- Thomson, J.; Rogers, W.E. Swell and Sea in the Emerging Arctic Ocean. Geophys. Res. Lett. 2014, 41, 3136–3140. [Google Scholar] [CrossRef] [Scilit]
- Goharnejad, H.; Perrie, W.; Toulany, B.; Zhang, M.; Long, Z.; Casey, M.; Meylan, M.H. Arctic Wave Climate Including Marginal Ice Zone and Future Climate Scenario. J. Mar. Sci. Eng. 2025, 13, 1562. [Google Scholar] [CrossRef] [Scilit]
- Meucci, A.; Young, I.R.; Trenham, C.; Hemer, M. An 8-Model Ensemble of CMIP6-Derived Ocean Surface Wave Climate. Sci. Data 2024, 11, 100. [Google Scholar] [CrossRef] [Scilit] [PubMed]
- Anık, E.M.; Amarouche, K.; Kankal, M.; Akpınar, A. Machine Learning-Based Residual Bias Correction of SWAN Significant Wave Height Using Satellite Altimeter Observations as Ground Truth in the Black Sea. Ocean Eng. 2026, 359, 125991. [Google Scholar] [CrossRef] [Scilit]
- Hamzah, H.; Alkhabbaz, A.; Koprulu, A.; Jasim, L.M.; Alzubaidi, I.K.; Yaseen, A.H.; Yang, H.S.; Lee, Y.H. Integrated CFD and ANN Approach for Predicting Blade Deformation and Aerodynamic Response. Wind 2025, 5, 33. [Google Scholar] [CrossRef] [Scilit]
- Yang, H.S.; Alkhabbaz, A.; Lee, Y.H. Toward Reliable FOWT Modeling: A New Calibration Approach for Extreme Environmental Loads. Energies 2025, 18, 5545. [Google Scholar] [CrossRef] [Scilit]
- Yang, H.S.; Alkhabbaz, A.; Lee, Y.H. Analysis of Correction Factor Differences in Floating Offshore Wind Turbine Systems: Comparison Between Platform-Only and Fully Coupled Models. J. Ocean Eng. Technol. 2025, 39, 522–533. [Google Scholar] [CrossRef] [Scilit]
- Nesterov, E.S. Wind Waves in the Arctic Seas (Review). Hydrometeorol. Res. Forecast. 2020, 3, 19–41. [Google Scholar] [CrossRef] [Scilit]
- AARI. Review of Hydrometeorological Processes in the Arctic Ocean; Frolov, I.E., Ed.; AARI: St. Petersburg, Russia, 2016; p. 102. [Google Scholar]
- Golubkin, P.A.; Kudryavtsev, V.N.; Shapron, B. On the Development of Wind Waves in the Arctic Seas Based on AltiKa Altimeter Measurements. Mod. Probl. Remote Sens. Earth Space 2017, 14, 179. [Google Scholar] [CrossRef] [Scilit]
- Plotnikov, V.V.; Vrazhkin, A.N.; Mezentseva, L.I.; Druz, N.I.; Vakulskaya, N.M.; Dubina, V.A. Variability of the Hydrometeorological Regime of the Seas of the Eastern Sector of the Arctic (East Siberian, Chukchi) in the Modern Period. Bull. Tomsk Polytech. Univ. Georesour. Eng. 2020, 331, 103–115. [Google Scholar] [CrossRef] [Scilit]
- Myslenkov, S.; Platonov, V.; Kislov, A.; Silvestrova, K.; Medvedev, I. Thirty-Nine-Year Wave Hindcast, Storm Activity, and Probability Analysis of Storm Waves in the Kara Sea, Russia. Water 2021, 13, 648. [Google Scholar] [CrossRef] [Scilit]
- Myslenkov, S.A. Wind Wave Modeling in the Laptev, East Siberian, and Chukchi Seas. Oceanology 2024, 64, S88–S96. [Google Scholar] [CrossRef] [Scilit]
- Kruglova, E.E.; Myslenkov, S.A. Analysis of Storm Activity in the Kara Sea Based on Data from the WAVEWATCHIII Wave Model. Sci. Notes Russ. State Hydrometeorol. Univ. 2022, 69, 675–690. [Google Scholar]
- Kruglova, E.E.; Myslenkov, S.A. Intensification of Storm Activity in the Eastern Sector of the Russian Arctic. Arct. Ecol. Econ. 2024, 14, 522–535. [Google Scholar] [CrossRef] [Scilit]
- Tolman, H. The WAVEWATCH III Development Group User Manual and System Documentation of WAVEWATCH III Version 6.07. Available online: https://www.researchgate.net/publication/336069899_User_manual_and_system_documentation_of_WAVEWATCH_III_R_version_607 (accessed on 18 December 2020).
- Myslenkov, S.A.; Kruglova, E.E.; Bagatinsky, V.A. Recurrence of Storm Waves in the Laptev, East Siberian, and Chukchi Seas. Hydrometeorol. Res. Forecast. 2024, 1, 41. [Google Scholar] [CrossRef] [Scilit]
- Myslenkov, S.A.; Platonov, V.S. Evaluation of the Wind Speed and Wave Heights Simulation in the Kara Sea Using the COSMO-CLM and WAVEWATCH III Models. Phys. Oceanogr. 2023, 30, 78–97. [Google Scholar]
- Ribal, A.; Young, I.R. 33 Years of Globally Calibrated Wave Height and Wind Speed Data Based on Altimeter Observations. Sci. Data 2019, 6, 77. [Google Scholar] [CrossRef] [Scilit] [PubMed]
- Kruglova, E.E.; Myslenkov, S.A.; Tolstikov, A.V. Wave Climate of the White Sea. Oceanology 2026, 66, 143–152. [Google Scholar] [CrossRef] [Scilit]
- Li, J.; Ma, Y.; Liu, Q.; Zhang, W.; Guan, C. Growth of Wave Height with Retreating Ice Cover in the Arctic. Cold Reg. Sci. Technol. 2019, 164, 102790. [Google Scholar] [CrossRef] [Scilit]
- Atlas of Hydrometeorological and Ice Conditions of the Seas of the Russian Arctic; Neftyanoe Khozyaistvo: Moscow, Russia, 2015; p. 128.
- National Data Buoy Center (NDBC). Available online: https://www.ndbc.noaa.gov (accessed on 28 May 2026).
- Wojtysiak, K.; Herman, A.; Moskalik, M. Wind Wave Climate of West Spitsbergen: Seasonal Variability and Extreme Events. Oceanologia 2018, 60, 331–343. [Google Scholar] [CrossRef] [Scilit]
- Shao, W.; Yu, W.; Jiang, X.; Shi, J.; Wei, Y.; Ji, Q. Analysis of Wave Distributions Using the WAVEWATCH-III Model in the Arctic Ocean. J. Ocean Univ. China 2022, 21, 15–27. [Google Scholar] [CrossRef] [Scilit]
- Baklagin, V.N. Long-Term Variability in the Timing of Stable Ice Formation and the Duration of Ice Phenomena in the White Sea Based on Satellite and In Situ Observations (1980–2020). Ice Snow 2025, 65, 502–517. [Google Scholar]
- Hamed, K.H.; Rao, A.R. A Modified Mann-Kendall Trend Test for Autocorrelated Data. J. Hydrol. 1998, 204, 182–196. [Google Scholar] [CrossRef] [Scilit]
- Hussain, M.M.; Mahmud, I. pyMannKendall: A Python Package for Non Parametric Mann Kendall Family of Trend Tests. J. Open Source Softw. 2019, 4, 1556. [Google Scholar] [CrossRef] [Scilit]
- Myslenkov, S.; Kruglova, E.; Medvedeva, A.; Silvestrova, K.; Arkhipkin, V.; Akpinar, A.; Dobrolyubov, S. Number of Storms in Several Russian Seas: Trends and Connection to Large-Scale Atmospheric Indices. Russ. J. Earth Sci. 2023, 23, 1–31. [Google Scholar] [CrossRef] [Scilit]
- Pettitt, A.N. A non-parametric approach to the change-point problem. J. R. Stat. Soc. C Appl. 1979, 28, 126–135. [Google Scholar] [CrossRef] [Scilit] [PubMed]
- Kamranzad, B.; Amarouche, K.; Akpinar, A. Linking the Long-Term Variability in Global Wave Energy to Swell Climate and Redefining Suitable Coasts for Energy Exploitation. Sci. Rep. 2022, 12, 14692. [Google Scholar] [CrossRef] [Scilit] [PubMed]
- Yulin, A.V.; Vyazigina, N.A.; Egorova, E.S. Interannual and Seasonal Variability of Sea Ice Area in the Arctic Ocean Based on Satellite Observations. Russ. Arct. 2019, 7, 28–40. [Google Scholar]
- Young, I.R.; Vinoth, J.; Zieger, S.; Babanin, A.V. Investigation of Trends in Extreme Value Wave Height and Wind Speed. J. Geophys. Res. Oceans 2012, 117, C00J06. [Google Scholar] [CrossRef] [Scilit]
- Young, I.R.; Ribal, A. Multiplatform Evaluation of Global Trends in Wind Speed and Wave Height. Science 2019, 364, 548–552. [Google Scholar] [CrossRef] [Scilit] [PubMed]
- Stopa, J.E.; Cheung, K.F.; Tolman, H.L.; Chawla, A. Patterns and Cycles in the Climate Forecast System Reanalysis Wind and Wave Data. Ocean Model. 2013, 70, 207–220. [Google Scholar] [CrossRef] [Scilit]
- Wang, K.; Wu, D.; Wu, K.; Yu, K.; Zheng, C. Interdecadal variation trend of Arctic wind energy. Energies 2023, 16, 6545. [Google Scholar] [CrossRef] [Scilit]

Disclaimer/Publisher’s Note: The statements, opinions and data contained in all publications are solely those of the individual author(s) and contributor(s) and not of MDPI and/or the editor(s). MDPI and/or the editor(s) disclaim responsibility for any injury to people or property resulting from any ideas, methods, instructions or products referred to in the content. |
© 2026 by the authors. Licensee MDPI, Basel, Switzerland. This article is an open access article distributed under the terms and conditions of the Creative Commons Attribution (CC BY) license.