


Abstract
Background: This study aims to thoroughly examine the relationship between weather conditions and reported pulmonary tuberculosis (PTB) cases in Haikou City. The goal is to provide a scientific basis for developing more targeted and timely prevention measures, thereby enhancing local efforts to control PTB. Methods: In this retrospective time-series study from 2010 to 2023, a total of 22,083 PTB cases (15,723 males and 6360 females) were analyzed. Using monthly PTB case counts (overall and stratified by sex and age) and meteorological variables, descriptive analyses along with distributed lag non-linear models (DLNMs) and generalized additive distributed lag models (GADLMs) combined with quasi-Poisson regression model regression were applied. Results: Taking the median of each meteorological factor as the reference, temperature exhibited significant delayed effects. For the overall population, temperatures between 14.30 °C and 24.24 °C posed significant lagged risks, with the effect decreasing as temperature rose. At the minimum monthly average temperature (14.30 °C), the relative risk (RR) peaked at lag 7 months (RR = 1.37, 95% CI: 1.23–1.53). Sex-stratified analysis showed similar patterns for males (14.30–23.94 °C) and females (14.30–23.84 °C), with peak RRs of 1.40 (1.25–1.58) and 1.37 (1.21–1.56), respectively, at 14.30 °C. In the adults group, temperatures between 14.30 °C and 25.45 °C produced significant lagged effects (maximum lag 14 months), with the highest RR of 1.42 (1.27–1.60) at lag 8 under 14.30 °C. The older age group showed a linear association. Average relative humidity exhibited a weak lag-4 correlation with PTB counts in some subgroups, but model testing indicated no statistically significant lagged risk effect in any group. Conclusions: A significant nonlinear lagged exposure–response relationship exists between temperature and PTB incidence in Haikou, with population-specific variations, while relative humidity shows no significant lagged effect. These findings underscore the necessity of incorporating temporal lag effects and population differences into regional PTB early warning and prevention strategies.
1. Introduction
Tuberculosis (TB) is a major global public health challenge. It is a chronic infectious disease caused by the bacterium Mycobacterium tuberculosis (M.tb). The most common form is pulmonary tuberculosis (PTB). The global TB situation remained a serious challenge in 2023. There were approximately 10.8 million new cases, showing an increase from 2022. Meanwhile, deaths from TB reached 1.25 million, making it the world’s leading cause of death from a single infectious agent. Among the 30 countries with the highest TB burden globally, China ranks third in the number of new TB cases. These cases account for 6.8 percent of the global total [1]. In 2023, the estimated number of new TB patients in China was 741,000. Among notifiable infectious diseases in China, PTB continued to rank second in incidence. In 2023, the reported incidence of PTB in Hainan Province ranked second, only after viral hepatitis, among the notifiable infectious diseases in China [2]. With comprehensive control measures in place, the incidence of PTB in Hainan Province has shown a downward trend. In 2022, the annual reported PTB incidence fell to 82.56 per 100,000 people. However, PTB remains a serious threat to the health of local residents and its control still faces multiple challenges.
Previous studies have shown that climate factors are linked to TB incidence [3,4,5,6,7]. This finding has been further supported by several studies conducted in China [5,6,7]. However, variations were observed in the associations between specific meteorological factors and TB risk across different population subgroups [8,9]. Hainan Province is located in the southernmost part of China and has a tropical monsoon climate. Previous studies have found that in Hainan, both lower temperatures and lower humidity are associated with a significant delayed risk of tuberculosis [10]. Due to variations in geography and climate across the province, weather conditions differ among the eastern, western, northern, and southern regions of Hainan. As the capital of Hainan Province, Haikou City is located in the northernmost part of Hainan Island. Its unique geographical location and climate may have a specific delayed effect on PTB incidence. However, there is currently limited research on the delayed effects of weather factors on PTB incidence in Haikou City. Therefore, studying the relationship between weather conditions and PTB incidence in Haikou is important, both in theory and in practice, for improving local PTB control strategies.
Previous studies have widely investigated the complex, delayed relationships between environmental factors and infectious diseases (including PTB and hepatitis B) across various settings, often utilizing distributed lag non-linear models (DLNMs) [11,12,13,14,15,16,17]. While previous studies have explored meteorological impacts on PTB at the provincial level in Hainan [10], generalized provincial models inherently average data across dense cities and sparsely populated rural areas, potentially masking significant spatial heterogeneity. Haikou, the provincial capital and the northernmost city of Hainan Island, differs from the province as a whole in climatic characteristics across both spatial and temporal dimensions, boasting a unique microclimate characterized by consistently higher temperatures and humidity compared to the provincial baseline. Furthermore, as the most urbanized and densely populated city on the island, Haikou presents a distinct epidemiological context. Therefore, relying on province-wide generalizations is insufficient for precise local health management. Therefore, conducting a localized assessment of meteorological impacts on PTB in Haikou is essential.
Given the current lack of subgroup-based research on the relationship between PTB and meteorological factors, this study systematically collected meteorological data in Haikou and constructed DLNMs and generalized additive distributed lag models (GADLMs) for the overall PTB population and subgroups stratified by sex and age. The aim was to explore the nonlinear and lagged associations between PTB incidence and meteorological factors and to provide a scientific basis for developing precise PTB prevention and control strategies based on meteorological conditions.
2. Materials and Methods
2.1. Study Area
Haikou City is located in the northern part of Hainan Island, between 19°31′32″–20°04′52″ N and 110°07′22″–110°42′32″ E, and serves as the capital of Hainan Province. Its administrative divisions include Xiuying District, Longhua District, Qiongshan District, and Meilan District. Haikou covers a land area of 2304.84 km2 and a sea area of approximately 830 km2. It borders Wenchang City to the east, Ding’an County to the south, Chengmai County to the west, and faces the Leizhou Peninsula of Guangdong Province across the Qiongzhou Strait to the north. Haikou has a tropical monsoon climate characterized by year-round warmth and humidity, abundant sunshine, and a long summer with virtually no winter. By the end of 2023, the permanent resident population of Haikou was approximately 2.93 million.
2.2. Tuberculosis Incidence Data
Data on reported PTB cases in Haikou City from January 2010 to December 2023 were obtained from the Chinese Infectious Disease Surveillance System (CIDSS), managed by the Chinese Center for Disease Control and Prevention (China CDC) [18]. PTB cases were defined according to the International Classification of Diseases, Tenth Revision (ICD-10) codes A15–A16. During the 14-year study period, the diagnostic criteria for PTB in China transitioned from the older standard (WS 288-2008) to the updated standard (WS 288-2017) implemented in 2018, which placed greater emphasis on molecular biological testing [19]. No individual-level records, specific residential coordinates, or identifiable private information were accessed during this study.
2.3. Meteorological Data
Meteorological data were obtained from the Monthly Spatial Interpolation Dataset of Chinese Meteorological Elements (www.gisrs.cn), from which we extracted the 2010–2023 monitoring data covering Haikou City. The extracted meteorological variables included average temperature (°C), average atmospheric pressure (hPa), average relative humidity (%), and precipitation (mm), and all regional meteorological datasets for Haikou City in this study were matched and extracted based on the geographical coordinates of Haikou national primary meteorological reference station (Longitude: 110.35° E, Latitude: 20.03° N).
2.4. Statistical Methods
A stratified analysis was conducted in this study. We first analyzed the overall PTB population in Haikou and then performed subgroup analyses by sex (male and female) and age group: children and adolescents (0–18 years), adults (19–64 years), and older adults (≥65 years). Descriptive statistics were used to summarize the monthly PTB case counts and meteorological variables, including mean, standard deviation, and percentiles. Spearman’s rank correlation coefficients were used to assess correlations among meteorological factors. When strong collinearity existed between meteorological variables, only the most representative variables were included in the model. Cross-correlation coefficients (CCC) were used to explore the lagged correlations between meteorological factors and PTB case counts.
Assuming that the monthly number of PTB cases followed a quasi-Poisson distribution, DLNMs and GADLMs were used to investigate the nonlinear and lagged associations between meteorological factors and PTB incidence. Four types of models were constructed and compared (Appendix A). If the nonlinear lag effect of the cross-basis term of a meteorological factor was not statistically significant, or if the lagged risk effect of that factor on PTB incidence was not significant in the model output, a GADLM was used instead. Ultimately, the first DLNM was selected for analysis.
The DLNM (Model 1) is expressed as:
where EYt is the average number of PTB cases per month, TEM is the monthly average temperature. cb is the cross basis function of temperature, lag is the longest lag time. ns is the natural spline function, df1, df3 all are degrees of freedom (df). The time series variable time was modeled using a natural cubic spline to adjust for seasonal and long-term trends. The month variable was included as a categorical variable, β is the regression coefficient corresponding to the month, α is the intercept.
log[E(Yt)] = α + cb(TEMt,lag,df1) + ns(timet,df3) + β montht
Model parameter determination was performed as follows. First, generalized linear models with natural spline functions were used to examine the nonlinear associations between meteorological factors and monthly PTB case counts. Based on the significance of the regression coefficients and the minimum Akaike information criterion (AIC), the optimal number and locations of internal knots for the spline functions of temperature and relative humidity were selected. After determining the internal knots in the exposure–response dimension of the cross-basis term, the degrees of freedom for the lag dimension were further specified. For the temperature cross-basis, the maximum lag time was set a priori to 13 months [10], while also considering a reference value of up to 20 months [16]. The prior degrees of freedom for the natural cubic spline of the time variable were set to either 6 or 7. Models were evaluated based on the significance of the relative risk (RR) at the maximum lag time and AIC. The model with the smallest AIC value was selected to analyze the relationship between meteorological factors and PTB case numbers.
This study used relative risk (RR) and its 95% confidence interval (95% CI) based on quasi-Poisson regression principles to quantify the delayed effects of meteorological factors on PTB [20]. All analyses were conducted in R software version 4.3.1, with the “DLNM” package applied to construct the DLNM [21] and the “MGCV” package implemented for GADLM fitting [22], following previously published standard methodological frameworks. A two-sided p-value < 0.05 was considered statistically significant.
3. Results
3.1. Descriptive Characteristics
From 2010 to 2023, a total of 22,083 reported PTB cases were identified in Haikou City, Hainan Province, with a monthly average of 132 cases. Among them, 15,723 cases occurred in males, with a monthly average of 94 cases, and 6360 cases occurred in females, with a monthly average of 38 cases. The male-to-female ratio was 2.47:1. By age group, 863 cases were reported in the children and adolescents group, with a monthly average of 6 cases; 16,674 cases were reported in the adults group, accounting for the largest proportion, with a monthly average of 100 cases; and 4546 cases were reported in the older adults group, with a monthly average of 28 cases. During the study period, the mean monthly average temperature was 24.75 °C, the mean monthly atmospheric pressure was 1004.44 hPa, the mean monthly relative humidity was 81.70%, and the mean monthly precipitation was 151.29 mm. Because most variables exhibited non-normal distributions, detailed descriptive statistics are presented using percentiles in Table 1.
Table 1.
Basic characteristics of reported PTB and basic characteristics of meteorological factors in Haikou City, Hainan Province from 2010 to 2023.
3.2. Correlation Analysis of Meteorological Factors
Spearman’s rank correlation coefficients among meteorological factors were calculated (Supplementary Table S1). Strong correlations were observed between average temperature and atmospheric pressure, and between average temperature and precipitation, with correlation coefficients of −0.86 and 0.54, respectively. To avoid multicollinearity, average temperature was selected as the primary meteorological variable for subsequent analyses of its association with PTB incidence.
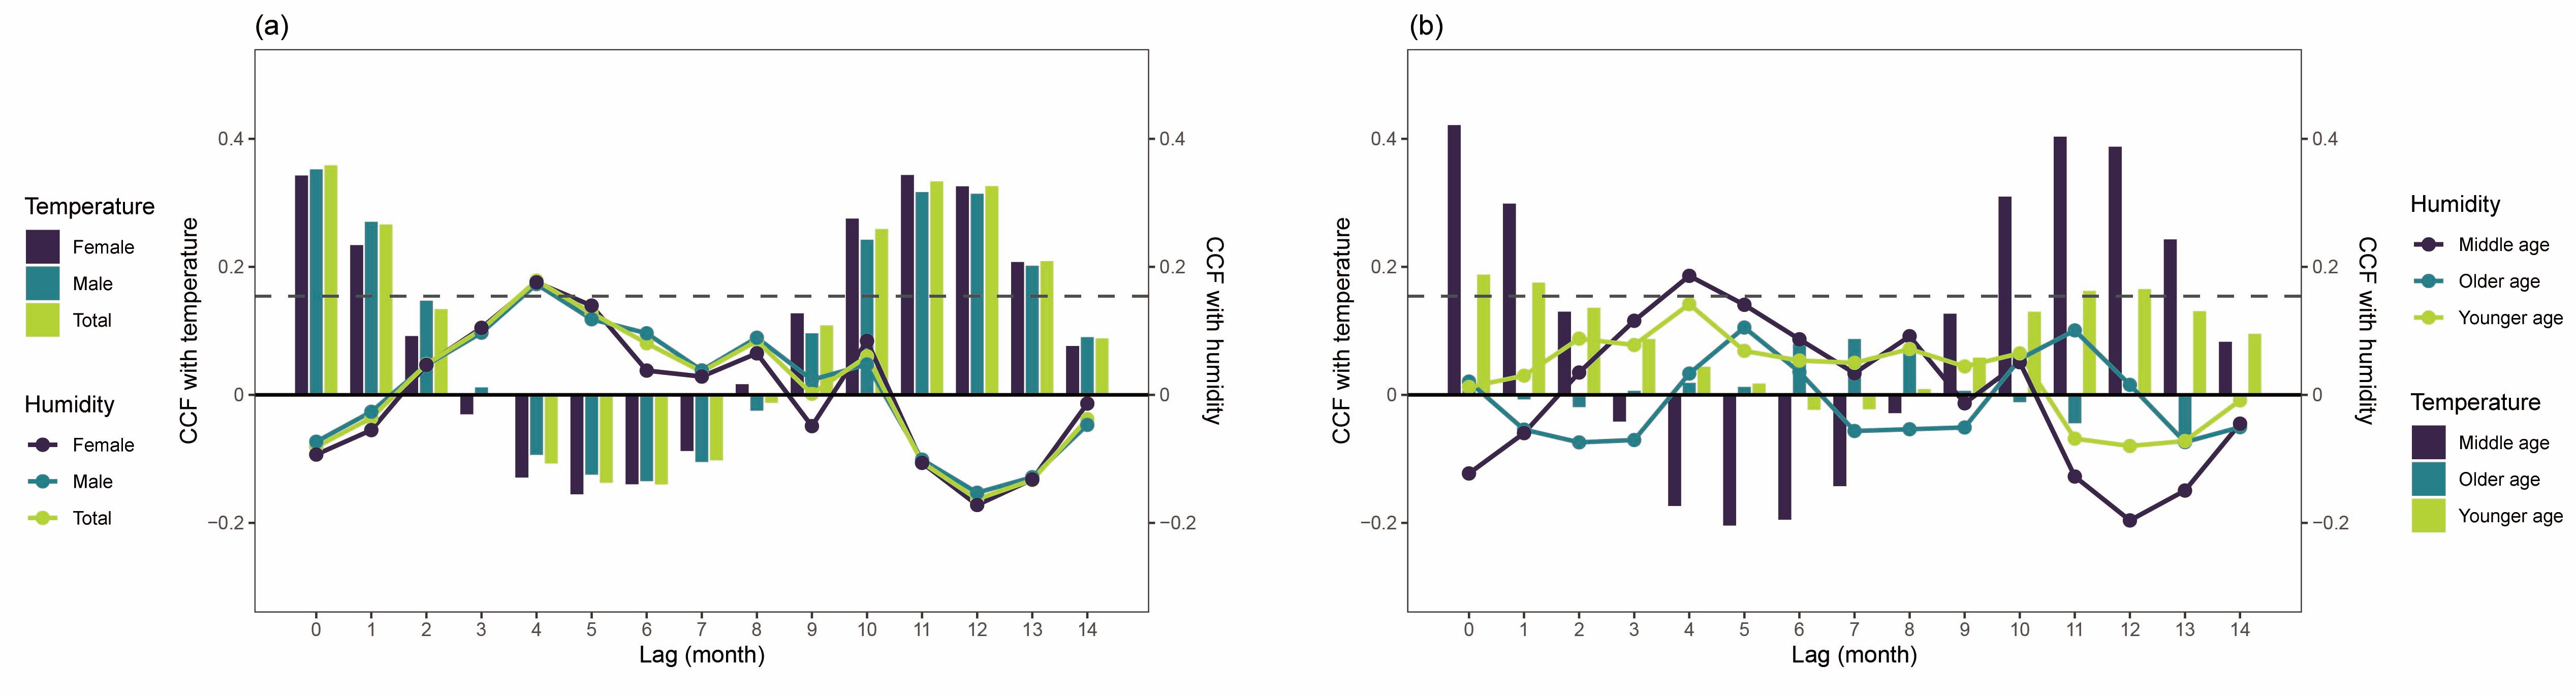
The cross-correlation function plots of average temperature and relative humidity with the numbers of incident cases in different populations are shown in Figure 1. A significant lagged correlation was observed between the number of incident cases in the total population and temperature (Figure 1a). Significant lagged correlations with temperature were also found for both male and female incident cases. No significant lagged correlation with temperature was found for the low-age group, whereas significant lagged correlations with temperature were observed for both the adults group and the older adults group (Figure 1b). Average relative humidity showed weak but significant positive lag-4 correlations with incident cases among males, females, and the adults group (cross-correlation coefficient < 0.2). No significant lagged correlation was found between relative humidity and the total PTB incidence, the low-age group, or the older adults group.
Figure 1.
Cross-correlation function plots of average temperature and relative humidity with the numbers of incident PTB cases in different populations. (a) Total, male, and female gender-stratified groups. (b) Three age-stratified groups.
3.3. Analysis of the Lagged Risk Effects of Meteorological Factors on the Total Number of PTB Cases in Haikou City
Because the cross-basis term for average temperature was statistically significant in the fitted models, whereas no significant association was identified for average relative humidity, Model 1 was retained for subsequent analysis. The maximum lag time for average temperature was determined to be 13 months. Within the temperature cross-basis, natural cubic splines with 3 degrees of freedom were applied to both the exposure and lag dimensions. The optimal internal knots were located at 27.90 °C and 28.62 °C, and the optimal degree of freedom for the time variable was 6 (Supplementary Tables S2 and S3).
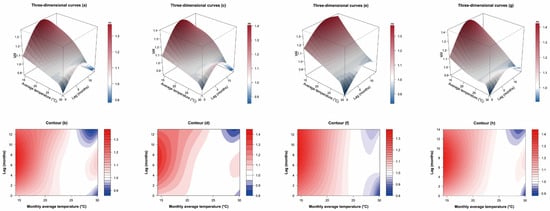
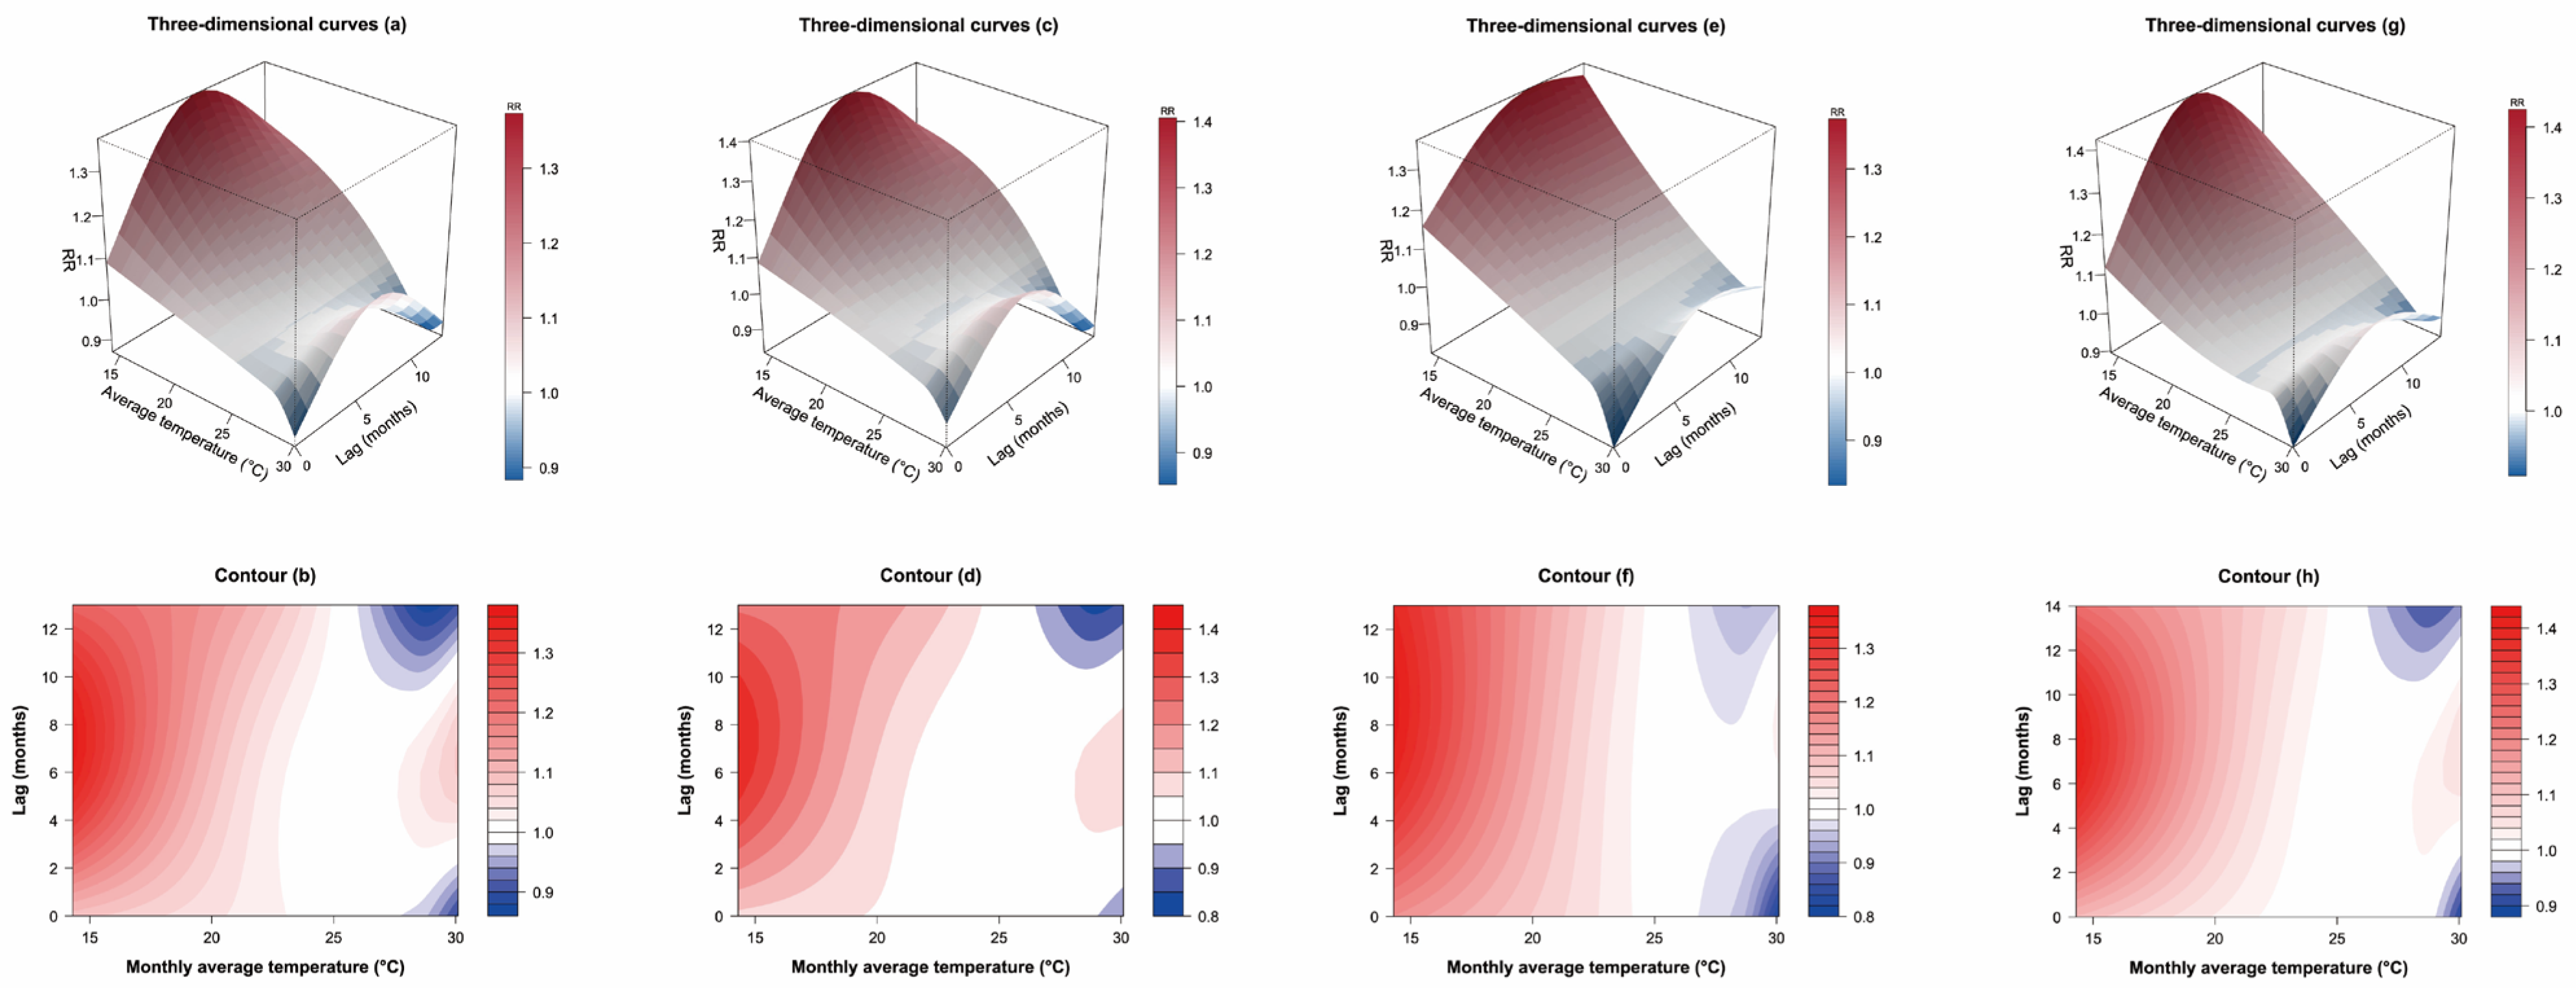
Figure 2a presents the three-dimensional exposure–lag–response surface for average temperature and PTB incidence over 0–13 lag months, with 25.45 °C (the median monthly average temperature) taken as the reference value; the corresponding contour plot is shown in Figure 2b.
Figure 2.
Three-dimensional exposure–lag–response diagram and corresponding contour map of the risk of PTB at different lagged monthly average temperatures. (a,b) Overall population. (c,d) Male population. (e,f) Female population. (g,h) Adults group.
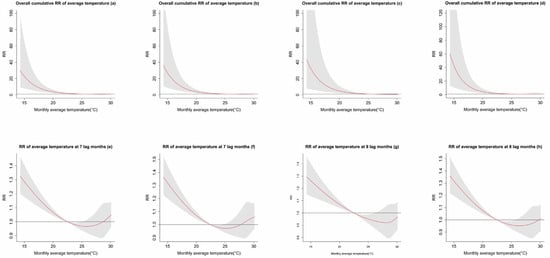
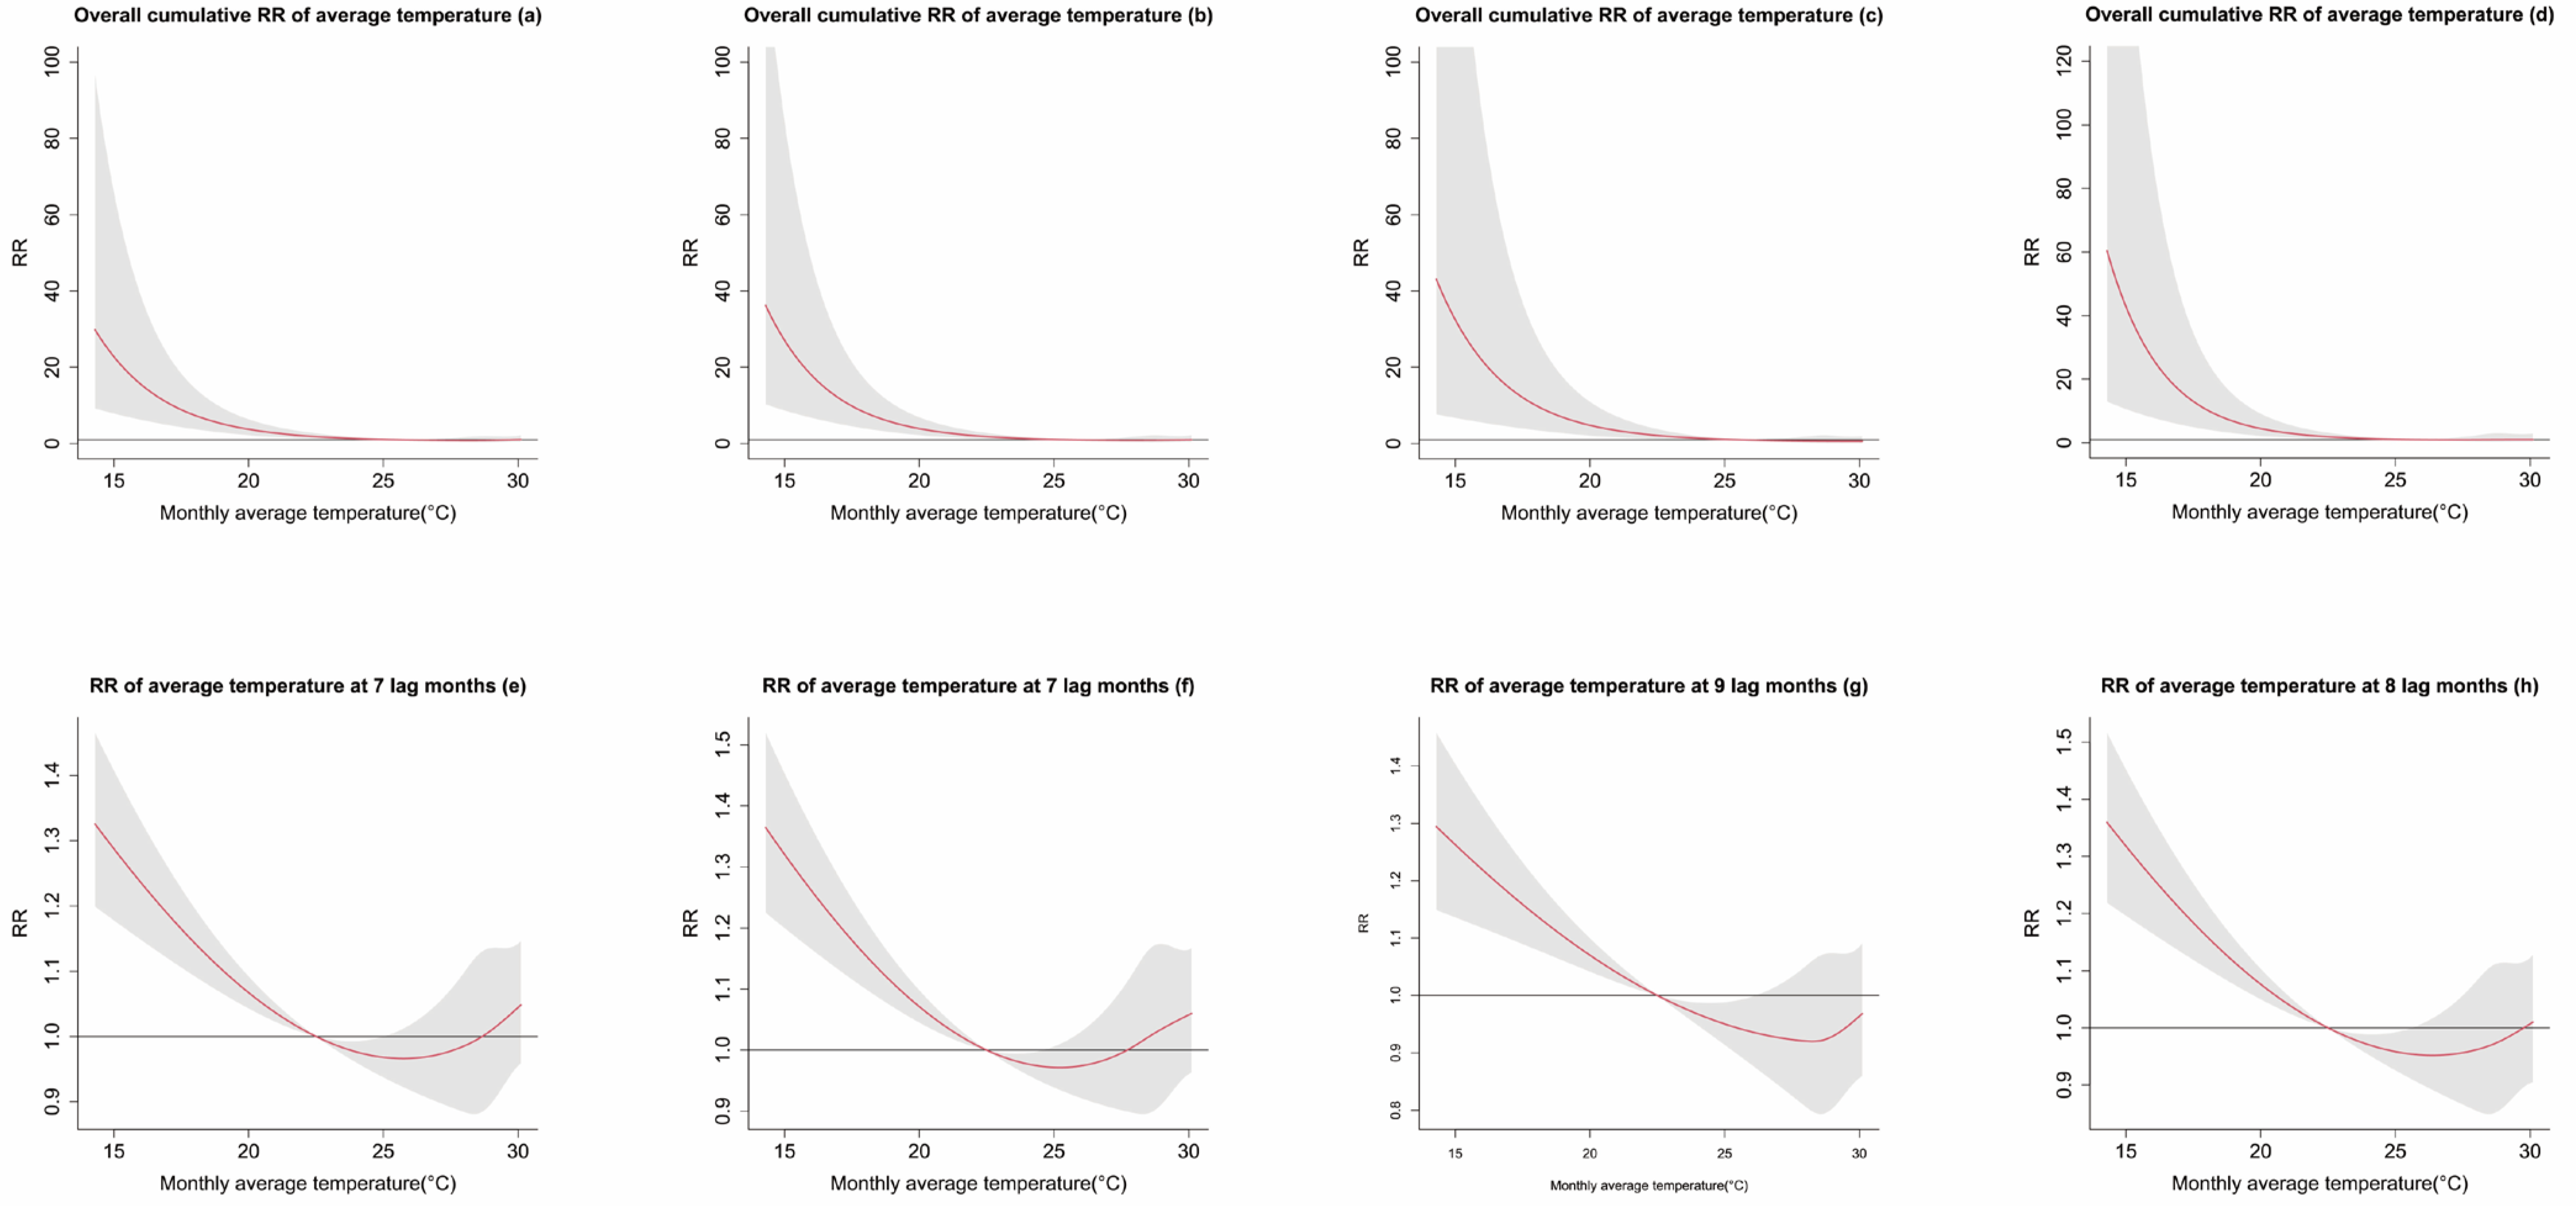
The strongest cumulative association was observed at the lowest average temperature, 14.30 °C, where the cumulative RR for PTB incidence reached 29.85 (95% CI: 9.22–96.66) (Supplementary Table S7). Overall, temperatures below 24.24 °C were associated with a statistically significant cumulative lag effect on PTB incidence, and the estimated RR gradually declined as temperature increased. By contrast, no statistically significant cumulative effect was detected when temperature exceeded 24.24 °C (p > 0.05), as illustrated in Figure 3a.
Figure 3.
Cumulative RR (95% CI) of temperature over the full lag period: (a) Overall population, (b) Male, (c) Female, (d) Adult group. Exposure–response associations at the peak lag month: (e) Overall population, (f) Male, (g) Female, (h) Adult group. The red solid line in each subplot denotes the estimated cumulative RR of PTB incidence across varying temperature levels, with the median temperature specified as the reference value (RR = 1). The light grey shaded band surrounding the line represents the 95% CI of the estimated effect.
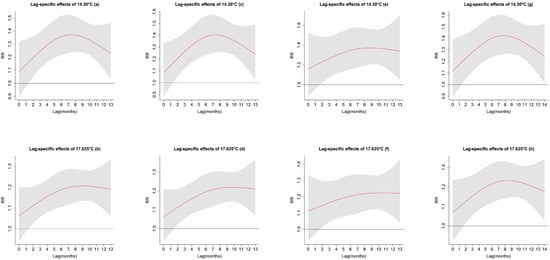
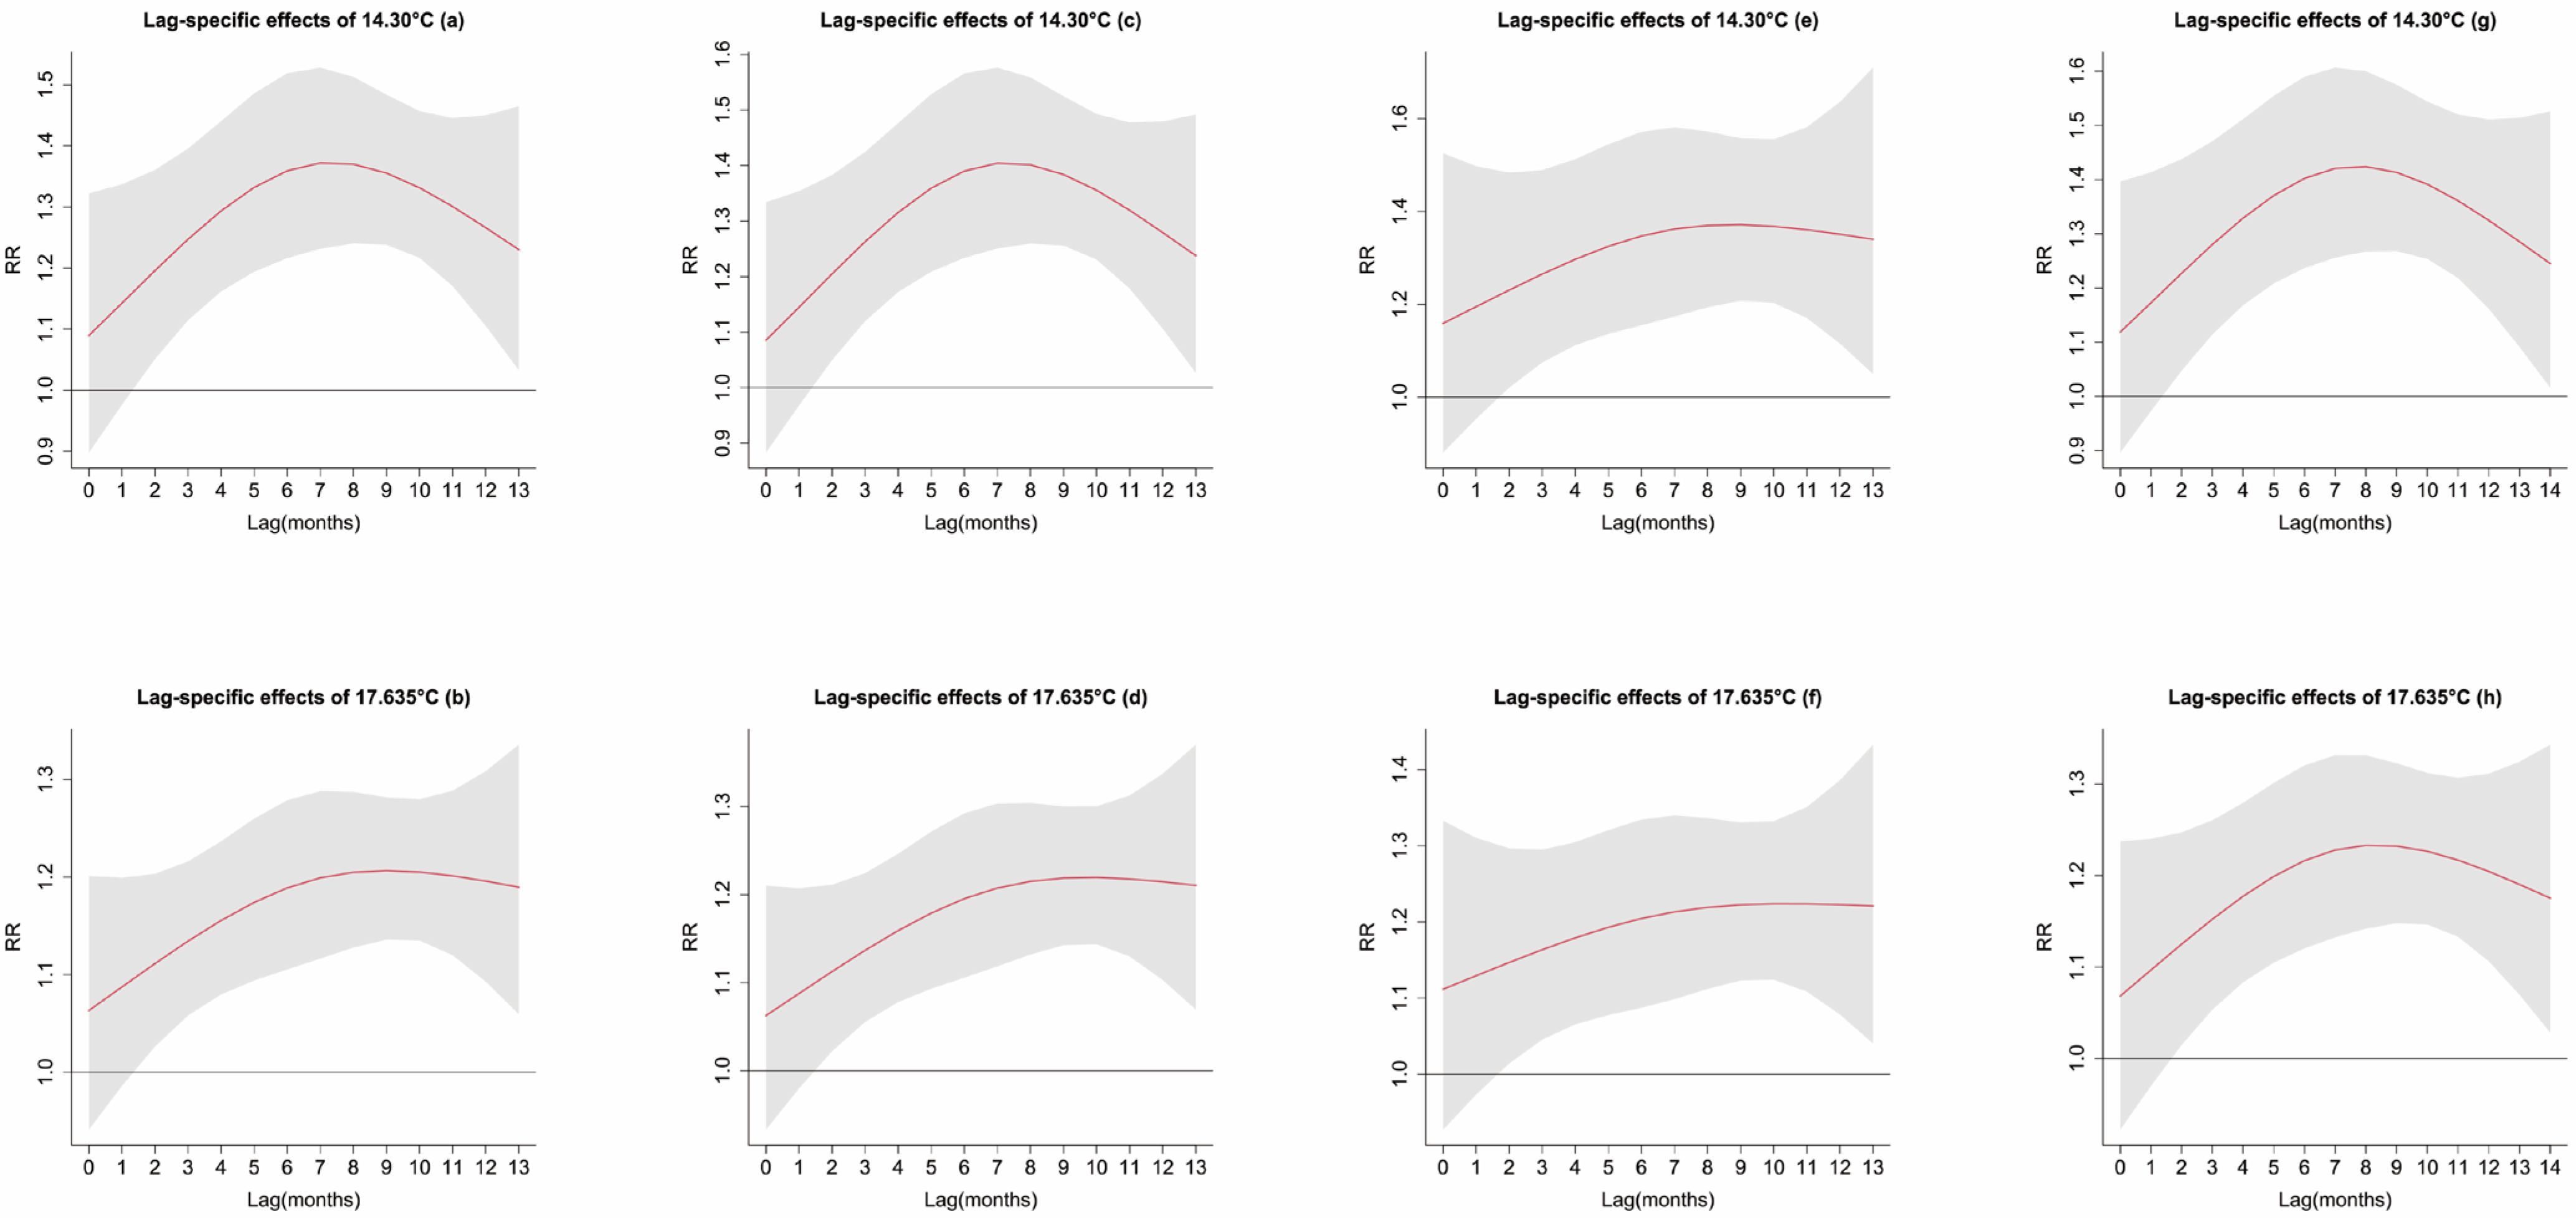
At both 14.30 °C and 17.64 °C, the lag-specific RR displayed a rise-then-fall pattern over time (Supplementary Table S8). Specifically, at 14.30 °C, the delayed effect reached its maximum at lag 7 months, corresponding to an RR of 1.37 (95% CI: 1.23–1.53) (Figure 4a). At 17.64 °C, the peak lag effect appeared later, at lag 9 months, with an RR of 1.21 (95% CI: 1.14–1.28) (Figure 4b).
Figure 4.
Relative risk ratios (RR) and 95% confidence intervals between specific monthly average temperatures and PTB incidence across different lag months: (a,b) Overall population; (c,d) Male population; (e,f) Female population; (g,h) Adults group.The red solid line in each subplot denotes the estimated relative risk of PTB incidence across different lag months, and the light grey shaded band surrounding the line represents the 95% confidence interval of the corresponding effect estimate.
A significant lag-specific risk effect was identified at lag 7 months for temperatures between 14.30 °C and 22.49 °C. Within this temperature interval, the RR decreased progressively with increasing temperature. The largest lag-7 RR was recorded at 14.30 °C, reaching 1.37 (95% CI: 1.23–1.53), as shown in Figure 3e.
3.4. Gender-Stratified Analysis of the Lagged Risk Effects of Meteorological Factors on PTB Incidence
For both male and female subgroups, average temperature showed a statistically significant association with PTB incidence, so Model 1 was selected as the final model for both stratified analyses (Appendix B). The temperature lag duration for both groups was set to 13 months. In the cross-basis specification, natural cubic spline functions with 3 degrees of freedom were used for both the exposure and lag dimensions, with optimal internal knots identified at 27.90 °C and 28.62 °C. The optimal degree of freedom for time was 6 for the male subgroup, and 7 for the female subgroup (Supplementary Tables S2, S4 and S5).
Taking the median temperature of 25.45 °C as the reference, the three-dimensional plots describing the lagged temperature-related relative risk (RR) for male and female PTB incidence are presented in Figure 2c,e, respectively, with their corresponding contour representations provided in Figure 2d,f.
The cumulative risk for both subgroups peaked at 14.30 °C: the cumulative RR for males was 36.21 (95% CI: 10.28–127.53), while the cumulative RR for females reached 43.07 (95% CI: 7.65–242.59) (Supplementary Table S7). Temperatures lower than 23.94 °C in males and 23.84 °C in females were associated with significant cumulative lagged effects, and these effects weakened as temperature increased. No statistically significant cumulative association between temperature and PTB incidence was observed above these respective thresholds (all p > 0.05), as shown in Figure 3b,c.
For both subgroups at the selected low-temperature points 14.30 °C and 17.64 °C, the RR of PTB cases first increased and then decreased as the lag period lengthened (Supplementary Table S8). The maximum delayed effect for males at 14.30 °C occurred at lag 7 months (RR = 1.40, 95% CI: 1.25–1.58), while the peak effect for females at 14.30 °C appeared at lag 9 months (RR = 1.37, 95% CI: 1.21–1.56). For 17.64 °C, the peak RR reached 1.22 for both groups, occurring at lag 10 months for males (95% CI: 1.14–1.30) and lag 10 months for females (95% CI: 1.12–1.33) (Figure 4c–f).
For temperatures ranging from 14.30 °C to 22.49 °C, significant risk elevations were detected at different lag time points across genders: males showed significantly elevated RRs at lag 7 months, while females showed the corresponding significant risk effects at lag 9 months. Across this temperature range, the RR declined as temperature rose for both subgroups. The highest RR at the gender-specific peak lag point was observed at 14.30 °C, with an estimate of 1.40 (95% CI: 1.25–1.58) for males at lag 7 months and 1.37 (95% CI: 1.21–1.56) for females at lag 9 months, as shown in Figure 3f,g.
3.5. Age-Stratified Analysis
3.5.1. Analysis of the Lagged Risk Effects of Meteorological Factors on the Number of PTB Cases in the Adults Group
For the adults group, the cross-basis term for average temperature remained statistically significant in the constructed models, so Model 1 was selected for further analysis (Appendix C). The maximum lag for temperature was extended to 14 months. Both the exposure–response and lag–response dimensions were modeled using natural cubic splines with 3 degrees of freedom. The internal knots of the cross-basis were placed at 27.9 °C and 28.62 °C, and the optimal degree of freedom for time was 7 (Supplementary Tables S2 and S6).
Using the median monthly average temperature (25.45 °C) as the reference point, the three-dimensional exposure–lag–response surface for PTB incidence in the adults group is shown in Figure 2g, with the contour plot presented in Figure 2h.
In this age group, temperatures below 25.45 °C were associated with significant cumulative lagged effects on PTB incidence, and the corresponding RR decreased as temperature increased. The most pronounced cumulative effect occurred at 14.30 °C, where the cumulative RR reached 61.37 (95% CI: 13.51–278.82) (Supplementary Table S7). No statistically significant cumulative effect was identified when temperature was above 25.45 °C (p > 0.05), as shown in Figure 3d.
At 14.30 °C and 17.64 °C, the lag–response curves showed a similar temporal pattern, with RR increasing initially and subsequently declining over longer lags (Supplementary Table S8). The peak effect at 14.30 °C appeared at lag 8 months, with an RR of 1.42 (95% CI: 1.27–1.60) (Figure 4g), whereas at 17.64 °C the peak occurred at lag 9 months, corresponding to an RR of 1.23 (95% CI: 1.15–1.32) (Figure 4h).
For temperatures between 14.30 °C and 22.49 °C, statistically significant risk effects were detected at lag 8 months in the adults group. As temperature increased within this interval, the RR gradually declined. The maximum lag-8 RR was observed at 14.30 °C, reaching 1.42 (95% CI: 1.27–1.60), as shown in Figure 3h.
3.5.2. Analysis of the Lagged Risk Effects of Meteorological Factors on the Number of PTB Cases in the Older Adults Group
In the older adults group, a linear regression model was fitted to assess the association between the number of PTB cases and average temperature. The slope parameter was statistically significant (t = 3.074, p < 0.05), indicating a linear relationship between temperature and PTB incidence in this group. Further attempts were made to construct lag models; however, none of these models reached statistical significance (Appendix D).
3.6. Sensitivity Analysis
To assess the robustness of the model results, we performed a sensitivity analysis by varying the degrees of freedom (df) for the smooth function of long-term time trend while keeping the other model parameters unchanged, including the maximum lag, knot locations, and the degrees of freedom for the spline functions. Specifically, the df for the time trend was set to 5, 6, and 7. The results showed that, in the overall population as well as in males, females, and the adults group, the overall shapes of the cumulative exposure–response curves between monthly average temperature and PTB incidence were generally consistent across different df values. Specifically, the relative risk increased at lower temperatures, and the cumulative RR gradually decreased and approached 1 as temperature increased (Supplementary Figure S1). Although some differences in effect estimates were observed at the lower end of the temperature range under different df specifications, the overall trend and main conclusions remained materially unchanged, indicating that the study findings were robust.
4. Discussion
In Haikou City, Hainan Province, the sex distribution of PTB cases showed a male-to-female ratio of 2.47:1, with more cases occurring among males than females. This finding is consistent with studies from Kazakhstan and Hangzhou, China [23,24], suggesting that males may be a high-risk population for PTB. The sex ratio in Haikou was lower than that reported in Dazhu County, Sichuan Province (2.99:1) and Guangdong Province (2.63:1) [25,26], but higher than that reported among the floating population in Beijing (2.2:1) [27]. In terms of age distribution, the numbers of PTB cases differed substantially across age groups. The low-age group had the fewest cases (3.91%), followed by the older adults group (20.59%). The age distribution pattern of PTB in Hainan was similar to that reported in Guangdong Province [26]. The adults group accounted for the majority of PTB cases (75.51%), which is consistent with findings from Hangzhou and Beijing [23,24,25,26,27], suggesting that young and adults may be the key target population for PTB prevention and control.
Using a distributed lag nonlinear model and taking the median value of meteorological factors as the reference, this study found that low temperature had significant delayed and cumulative risk effects on PTB incidence in the total population in Haikou. When the average temperature ranged from 14.30 °C to 24.24 °C, a significant lagged risk effect on PTB incidence was observed in the total population of Haikou, and the lagged RR decreased with increasing temperature. Existing evidence has shown that the risk of PTB incidence in Hainan gradually decreases with increasing temperature under low-temperature conditions [10]. The finding that low temperature is a lagged risk factor for PTB incidence in the total population is also consistent with several previous studies. For example, extreme low temperature was found to be a significant risk factor for respiratory diseases in Lanzhou, China [12], and studies from Japan further indicated that extreme low temperature is an important risk factor for TB incidence [4]. In addition, studies from Jiangsu Province, Hong Kong SAR, Southwest China, Kashgar City, and Bangladesh consistently showed that low-temperature environments were significantly positively associated with the risk of TB incidence and constituted an important risk factor [3,6,8,16,17]. However, a study from Urumqi reported that extreme low temperature had a protective effect on PTB [13], which is inconsistent with our findings. One possible explanation is the marked climatic differences between Urumqi and Haikou. The extreme low temperatures in Urumqi (−20 °C to −9 °C) differ substantially from the minimum average temperature of 14.3 °C in Haikou, which may account for the discrepancy.
The effect of low temperature on PTB transmission may be the result of multiple mechanisms acting together. First, from the perspective of environmental microbiology, high temperature and strong ultraviolet radiation can significantly reduce the biological activity concentration of Mycobacterium tuberculosis (M.tb) in the air, thereby effectively suppressing the transmission risk of PTB [28,29]. Second, from the perspective of environmental epidemiology, low-temperature conditions are often accompanied by the use of indoor heating systems, which may increase air pollutant concentrations and create favorable conditions for the transmission of M.tb. Although low temperature and high pressure in winter may reduce the suspension time of M.tb in the air by decreasing the movement rate of air molecules, this inhibitory effect is often offset by the marked increase in indoor transmission risk [30]. From an immunological perspective, reduced sunshine duration in winter can lead to vitamin D deficiency in the population, thereby impairing normal host immune function. This immunosuppressive state not only increases the risk of TB onset but may also promote the reactivation of latent infection [31,32]. From the perspective of behavioral epidemiology, low-temperature conditions substantially alter human behavioral patterns, increasing the amount of time spent indoors, crowding, and poor ventilation, all of which provide suitable conditions for M.tb transmission [33]. Through the complex interaction between the environment, host, and pathogen, temperature plays a key role in the transmission dynamics of PTB.
Both 14.30 °C and 17.635 °C had significant risk effects on PTB incidence in the total population of Haikou during lag 2–13 months, with the longest significant lag period reaching 13 months. Moreover, as the lag order increased, the risk of PTB incidence first increased and then decreased, peaking at lag 7 months at the minimum monthly average temperature of 14.30 °C (RR = 1.37, 95% CI: 1.23–1.53). These results are consistent with previous findings from Hainan Province, where the longest lagged risk period for PTB incidence was also 13 months and the risk effect likewise first increased and then decreased with increasing lag order [10]. The trend of the lag effect of PTB incidence in the total population in Haikou was similar to that in Hong Kong. However, in Hong Kong, the lag effect lasted up to 20 months and the maximum risk effect occurred at lag 14 months, which differs from the present findings [16]. In addition, a study from Bangladesh showed that the lag effect of low temperature on TB incidence could last for as long as six quarters, and the lagged risk effect continued to increase with increasing lag order [3], which is also inconsistent with our findings.
The sex-stratified analysis in Haikou showed that both males and females exhibited similar lagged exposure–response relationships with average temperature. Significant risk effects on PTB incidence were observed when the temperature ranged from 14.30 °C to 23.94 °C in males and from 14.30 °C to 23.84 °C in females. In both groups, the cumulative RR peaked at the minimum temperature of 14.3 °C (males: RR = 36.21, 95% CI: 10.28–127.53; females: RR = 43.07, 95% CI: 7.65–242.59), and the longest lag period in both groups was 13 months. Under low-temperature conditions, the PTB risk in both male and female subgroups gradually decreased as temperature increased. The peak lag-specific risk occurred at lag 7 months in males (RR = 1.40, 95% CI: 1.25–1.58) and lag 9 months in females (RR = 1.37, 95% CI: 1.21–1.56). A study from Lanzhou reported that extreme low temperature was a risk factor for PTB incidence in both males and females, which is consistent with our findings. However, unlike our study, that study found that the lag effect of extreme low temperature lasted longer in males than in females, with the longest lag period being 30 days in males and 27 days in females [12].
Studies have shown that there are significant sex differences in susceptibility to extreme temperature exposure, with females exhibiting greater vulnerability. This difference may be attributed to both physiological and socioeconomic factors. Physiologically, females generally have a lower basal metabolic rate and a smaller body surface area-to-weight ratio, resulting in relatively weaker thermoregulatory capacity. Socially, females may differ systematically from males in outdoor activity patterns and occupational exposure characteristics [34]. The lag-specific risk peak in females appeared at lag 9 months, which may be related to their relatively weaker thermoregulatory ability, whereas the peak in males appeared at lag 7 months. The shorter lagged disease effect in males under extreme temperature exposure may be associated with stronger compensatory mechanisms and greater occupational exposure [35].
The age-stratified analysis showed that, in the adults group, significant lagged risk effects on PTB incidence were observed during lag 2–14 months when the temperature ranged from 14.30 °C to 25.45 °C, and the RR decreased as temperature increased. As the lag order increased, the risk of PTB incidence in the adults group first increased and then decreased, reaching its highest value at lag 8 months at the minimum monthly average temperature of 14.30 °C (RR = 1.42, 95% CI: 1.27–1.60). In the older adults group, the logarithm of the number of PTB cases showed a linear relationship with temperature. A study in Lanzhou found that extreme low temperature was a risk factor for PTB incidence in adults populations, which is consistent with our results. That study also found risk effects of extreme temperature on PTB incidence in both elderly and low-age populations, which differs from the present study [12]. The absence of a lagged risk effect of average temperature in the low-age group in our study may be due to the relatively small number of reported cases.
Studies have shown that susceptibility to average temperature differs across populations. From the age perspective, elderly populations are generally more sensitive to extreme temperature changes because of relatively weakened immune function [12,36]. At the same time, under extreme low-temperature conditions, older adults may actively reduce outdoor and social activities because of diminished physiological adaptability, and such self-protective behavior may reduce their opportunities for exposure to M.tb, thereby lowering the risk of PTB incidence. In contrast, adult populations have different occupational characteristics and activity patterns and generally face greater occupational exposure risk, such as commuting by public transportation and working in crowded office environments. Our study found that high temperature did not show a significant risk effect on PTB incidence in any population subgroup. This differs from findings in Kashgar, where the risk of TB incidence continued to increase with increasing lag order, the longest lag effect reached 21 days, and high temperature had a protective effect in males but a possible delayed risk effect in females and adults and elderly populations [8]. However, both low and high temperatures were confirmed to be risk factors for respiratory diseases in Lanzhou [12]. In addition, high temperature was identified as a risk factor for TB incidence in Bangladesh [3]. These findings suggest that the effects of temperature on TB incidence exhibit substantial regional and population heterogeneity and may be related to local climate, population structure, socioeconomic status, and behavioral patterns.
This study found no significant association between average relative humidity and PTB incidence in the total population or in sex-specific subgroups in Haikou. This result differs from findings at the provincial level in Hainan, where low relative humidity showed delayed and nonlinear risk effects on PTB incidence, and the risk effect first increased and then decreased with both increasing relative humidity and increasing lag period [10]. This discrepancy may be attributable to regional differences in meteorological conditions across eastern, southern, western, and northern Hainan, whereas Haikou, located in the northernmost part of Hainan Island, has a unique geographical location and climatic profile. Specifically, the minimum relative humidity in Haikou (73.6%) is notably higher than the provincial minimum (68.98%), and its mean relative humidity (81.7%) is nearly equivalent to the 75th percentile (P75 = 81.88%) of the entire province. In other words, the range of relative humidity variation in Haikou is relatively narrow compared with the whole province. This restricted range of humidity fluctuation may weaken the statistical ability to identify the potential correlation between relative humidity and PTB incidence, eventually leading to the non-significant result observed in this study.
However, this study found that both the adults group and the older adults group were associated with PTB incidence at lag 4 months in relation to relative humidity. Studies from Hainan Province indicated that although the extreme values of relative humidity in the province were overall lower than those in Haikou, both areas showed a similar declining trend in risk effects with increasing relative humidity within the range of 75–80% [10]. A study in Jiangsu showed that minimum relative humidity was significantly negatively correlated with PTB incidence at lag 4 months [6], and a study in Southwest China further demonstrated that minimum relative humidity was negatively correlated with TB incidence at lag 4 months [17]. In addition, a study from Bangladesh found a positive contemporaneous association between low humidity and TB incidence, but this association gradually weakened as lag time increased [3]. A study from Hong Kong showed that when relative humidity was below 84.0%, the number of TB notifications increased significantly over lag 3–20 months [16]. These findings differ from ours, possibly because of regional diversity in meteorological conditions and uneven distributions of local socioeconomic factors, such as health service conditions, population density, and lifestyle habits. The absence of an association between relative humidity and PTB incidence in the low-age group in our study may be due to the small number of cases and stronger immunity in this group, which may have limited the ability to detect such an association.
This study has several notable strengths. First, it innovatively adopted a comprehensive lag–exposure–response analytical framework (DLNM) to systematically evaluate the complex delayed effects of meteorological factors on PTB incidence in a tropical city. Second, we conducted detailed stratified analyses by sex and age group, moving beyond general population trends. These findings provide robust scientific evidence for establishing a meteorology-based early warning system and optimizing region-specific, population-targeted prevention and control strategies.
Nevertheless, this study still has several limitations. First, due to the inherent nature of ecological studies utilizing aggregated registry data, individual-level confounding factors could not be assessed. Crucial variables such as social factors, occupational activities, and harmful behavioral habits (e.g., smoking and alcohol consumption) were not incorporated into the model, which might influence PTB susceptibility. Second, other macro-environmental confounders, such as air pollution, and potential interactions among covariates were not evaluated, which may have introduced some bias into the estimates of lagged meteorological effects. Third, over the prolonged study period, continuous advancements and optimization of PTB diagnostic technologies likely improved case ascertainment rates. This study focuses on the lagged effects of meteorological factors on TB. Since the analysis relies on temporal variation and includes time trends and sensitivity tests for degrees of freedom, the potential influence of detection methods is considered acceptable for the findings on environmental lag effects. Finally, the study used monthly PTB incidence and meteorological data. This temporal resolution may not fully capture the acute, short-term lagged effects of meteorological fluctuations, thereby limiting the precision and timeliness of the proposed prevention measures to some extent.
5. Conclusions
The results showed that there was a significant nonlinear lagged exposure–response relationship between temperature and PTB incidence in Haikou, and that this relationship exhibited marked population-specific heterogeneity. Relative humidity showed no lagged risk effect on PTB incidence in any population in Haikou. These results provide important scientific evidence for the establishment of an early warning system and the optimization of prevention and control strategies for PTB in Haikou. They also suggest that, when formulating intervention measures, it is necessary to fully consider the temporal lag effects of meteorological factors and their differential impacts on different populations so as to achieve precision prevention and control.
Supplementary Materials
The following supporting information can be downloaded at: https://www.mdpi.com/article/10.3390/atmos17070696/s1, Table S1: Spearman Correlation Coefficients Between Meteorological Factors; Table S2: Final Selected Models and Their Corresponding Parameters; Table S3: Parameter Determination for Time and Degrees of Freedom in the Total Population Model; Table S4: Parameter Determination for Time and Degrees of Freedom in the Male Population Model; Table S5: Parameter Determination for Time and Degrees of Freedom in the Female Population Model; Table S6: Parameter Determination for Time and Degrees of Freedom in the Adults Group Model; Table S7: Cumulative Relative Risk (RR) and 95% Confidence Interval (95% CI) of PTB Incidence Associated with Temperature at Different Lag Periods; Table S8: Relative Risk (RR) and 95% Confidence Interval (95% CI) for PTB Incidence at Specific Temperatures across Lag Months; Figure S1: Cumulative risk (95% CI) of monthly average temperature on PTB under different degrees of freedom of time during the entire lag period.
Author Contributions
R.Z., Conceptualization, Software, Data analyze, Visualization, Writing—original draft. X.L., Data curation, Data analysis. Y.J., Conceptualization, Project administration, Writing—review and editing. Y.H., Software, Visualization. R.C., Resource, Investigation. M.D., Data curation. W.L., Conceptualization, Methodology, Writing—review and editing. All authors have read and agreed to the published version of the manuscript.
Funding
This work was supported by Research Fund for Key Research and Development Project in Hainan, Grant Award No. ZDYF2021GXJS018.
Institutional Review Board Statement
As no individually identifiable human subject information was accessed or utilized in this study, the research is exempted from formal ethical review.
Informed Consent Statement
The research exclusively utilized fully anonymized and pre-aggregated secondary epidemiological data (city-level monthly case counts) obtained from the Chinese Infectious Disease Surveillance System (CIDSS). Does not involve any individual patient information, subject recruitment or intervention measures. Ethical approval from the institutional review board is not required for this type of study.
Data Availability Statement
Restrictions apply to the availability of these data. Data were obtained from Chinese Center for Disease Control and Prevention and are available from https://www.chinacdc.cn with the permission of Chinese Center for Disease Control and Prevention.
Acknowledgments
The authors thank all those who participated in this study.
Conflicts of Interest
The authors declare that there are no conflicts of interest.
Appendix A
The four types of models constructed in this paper are as follows:
The first type: DLNM model (Model 1) is expressed as:
The second type: DLNM model (Model 2) is expressed as:
The third type: GADLM model (Model 3) is expressed as:
The fourth type: (Model 4) is expressed as:
where is the average number of PTB cases per month, is the monthly average temperature, RH is the monthly relative humidity. is the cross basis function of temperature, is the longest lag time. is the natural spline function, all are degrees of freedom. for time series variables, natural cubic spline functions are introduced to control seasonal trends and long-term trends. is the month variable, is the regression coefficient corresponding to the month, is the intercept.
Appendix B
The model construction process for tuberculosis incidence by gender and meteorological factors is as follows:
During the construction of the male model, the cross-basis term for average temperature showed statistical significance, while average relative humidity only showed a weak correlation with male PTB cases at a 4-month lag. Therefore, Model 2 was attempted, but the natural spline term for average relative humidity in the model was not statistically significant (see Table A1). Consequently, Model 1 was ultimately selected for the final analysis.
For female PTB incidence, the association with meteorological factors was consistent with that observed in males, leading to the same selection of Model 1 for modeling (see Table A2).
Table A1.
Test of the Natural Spline Regression Term for Average Relative Humidity in Model 2 (Males).
Table A2.
Test of the Natural Spline Regression Term for Average Relative Humidity in Model 2 (Females).
Appendix C
The model construction process for tuberculosis incidence in the middle age group and meteorological factors is as follows:
During the model construction for the adults group, the cross-basis term for average temperature showed statistical significance. Although average relative humidity showed a weak but statistically significant correlation with PTB incidence at a 4-month lag, Model 2 was attempted to further examine this relationship. However, in Model 2, the delayed risk effect of average relative humidity on PTB incidence in the adults group was not statistically significant. Therefore, Model 1 was ultimately selected for the final analysis (see Table A3).
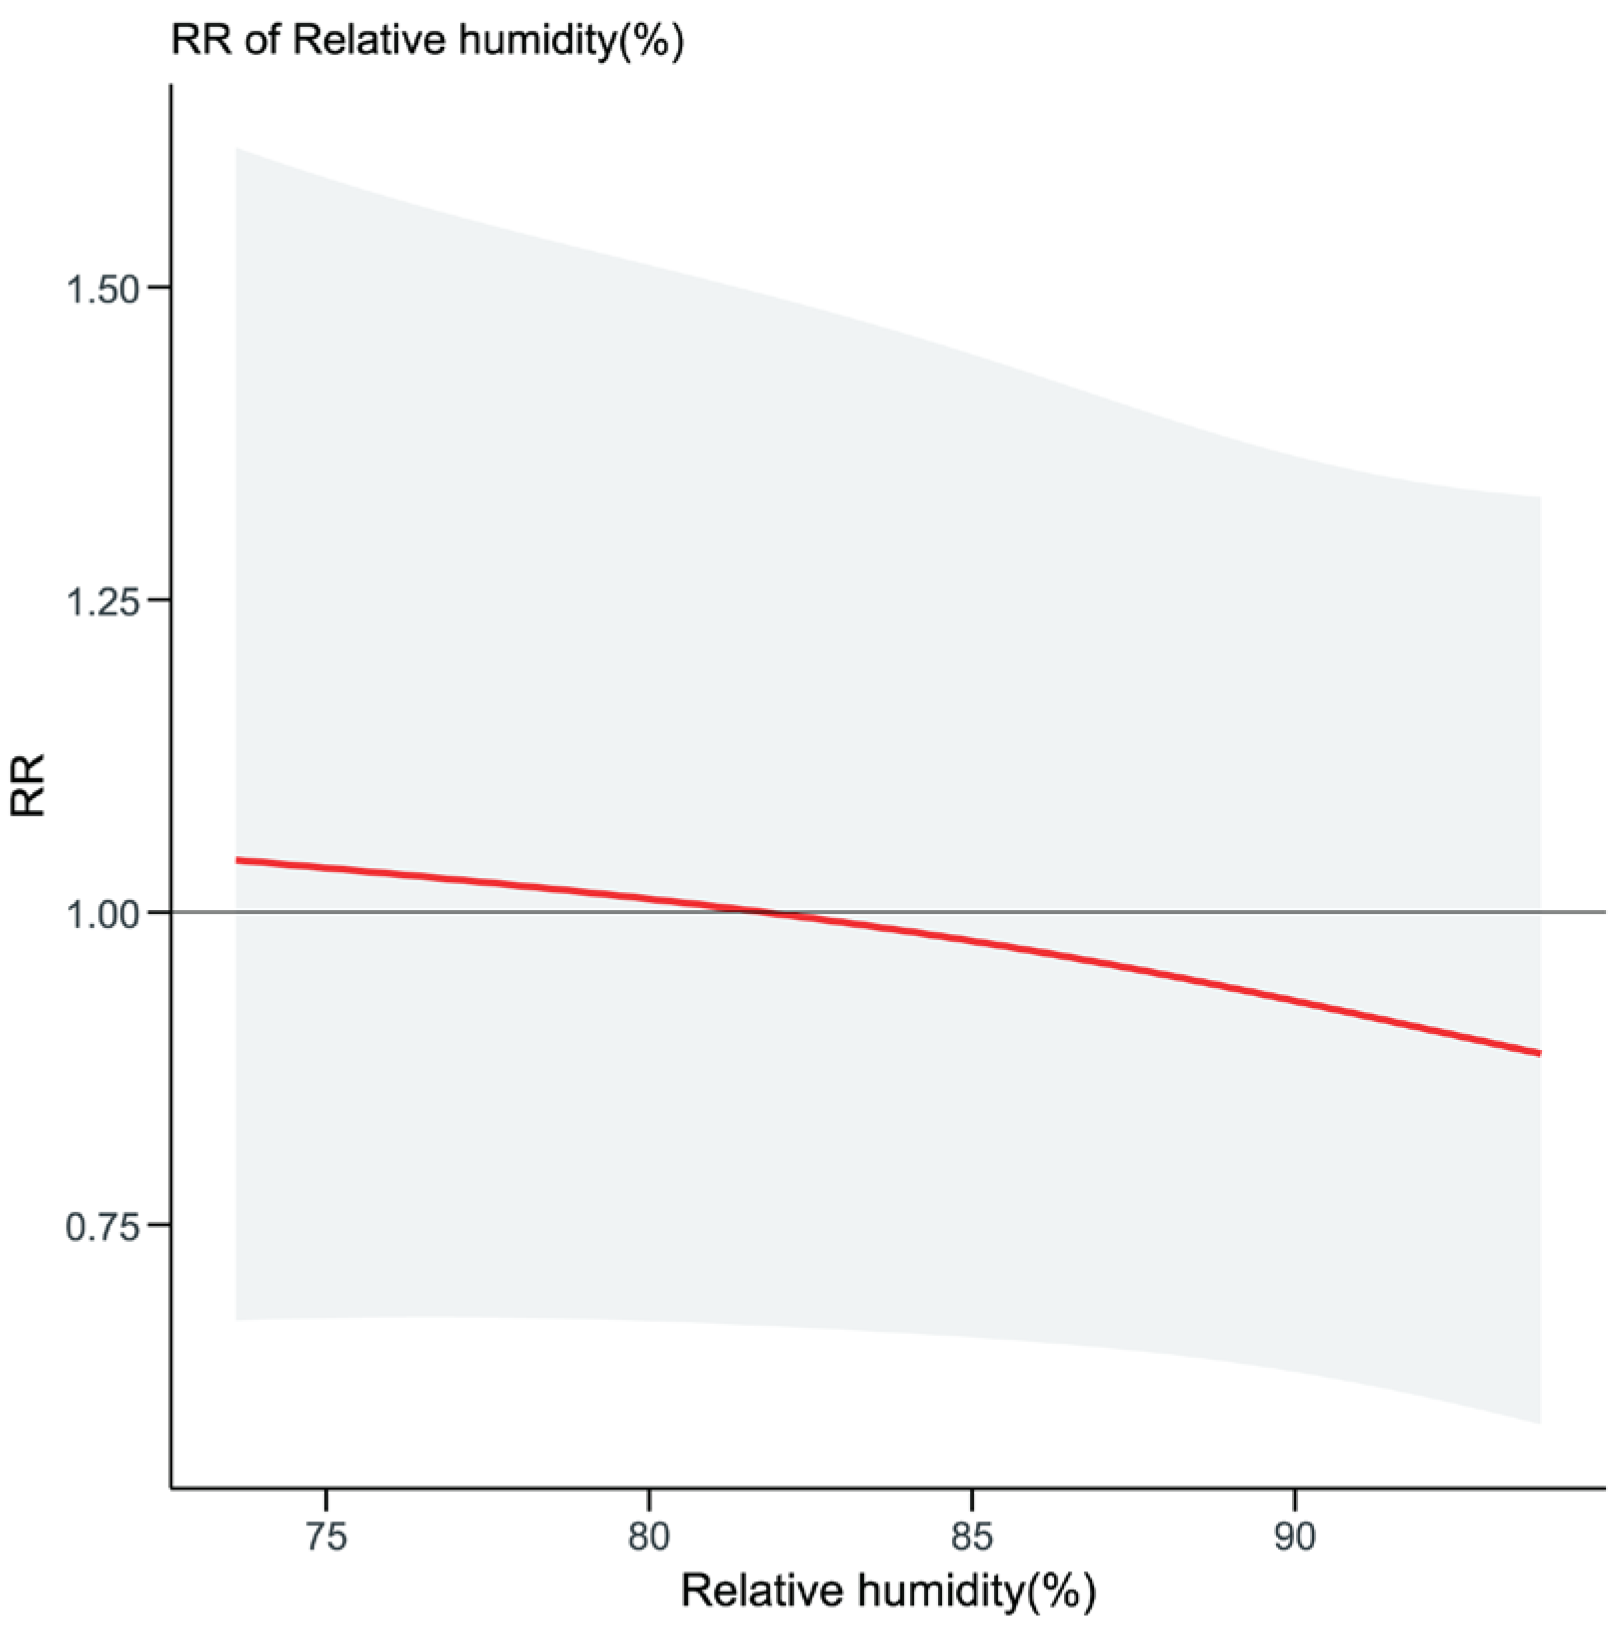
In Model 2, the key parameters were determined as follows: the maximum lag for average temperature was set to 14 months; the degrees of freedom for both the exposure-lag dimensions in the cross-basis were set to 3 using natural cubic splines; the knots for the natural spline in the cross-basis were set at 27.9 °C and 28.62 °C. For relative humidity at lag 4, the optimal knot for the natural spline function was 87%, with degrees of freedom set to 2. The optimal degrees of freedom for the time variable were set to 7. The RR plot for relative humidity is shown in Figure A1.
Table A3.
Parameter Table for Model 2 (Adults Group).
Figure A1.
Relative risk (95% CI) of PTB incidence associated with relative humidity in the adults group under Model 2. The red solid line in each subplot denotes the estimated RR of PTB incidence across varying relative humidity. The light grey shaded band surrounding the line represents the 95% CI of the estimated effect.
Appendix D
The process of constructing a model for pulmonary tuberculosis incidence in older adults age group with meteorological factors is as follows:
During the model construction for older adults group, a weak but statistically significant correlation was observed between average relative humidity at a 4-month lag and PTB incidence. Therefore, Model 3 was attempted. However, the risk effect of average relative humidity on PTB incidence in older adults group in Model 3 was not statistically significant. Since a linear relationship was identified between PTB case numbers and temperature, Model 4 was subsequently attempted. However, the risk effect of average temperature on PTB incidence in older adults group in Model 4 was also not statistically significant (see Table A4).
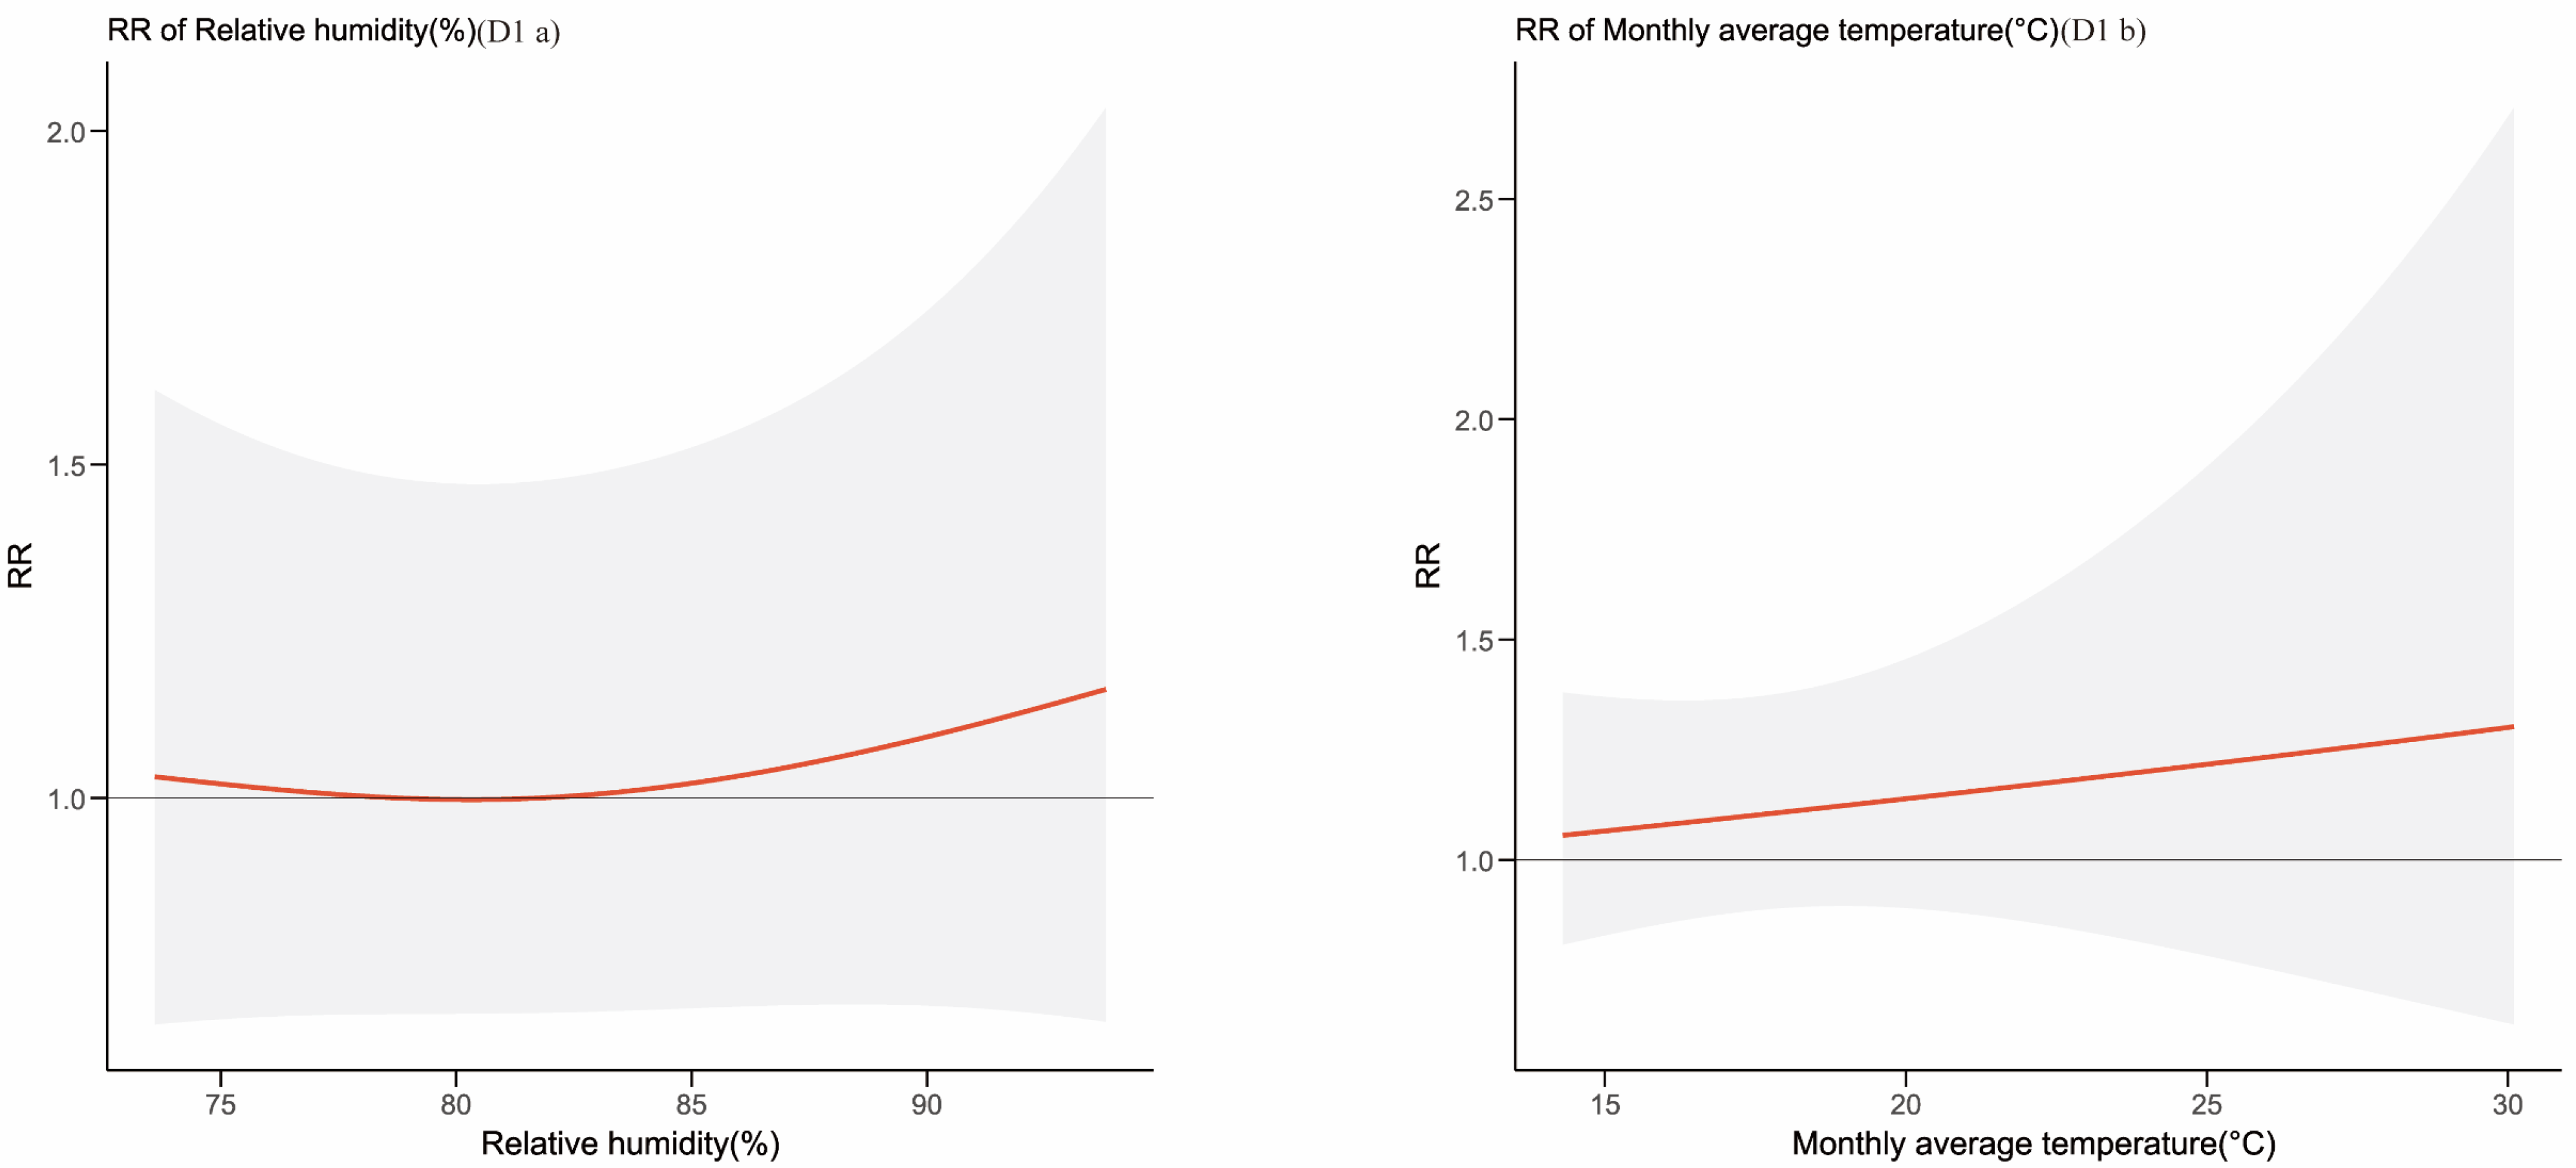
In Model 3, the optimal knot and degrees of freedom for the natural spline function of relative humidity were determined to be 80.9% and 2, respectively. The optimal degrees of freedom for the time variable were set to 7. The RR plot for relative humidity is shown in Figure A2a.
In Model 4, the optimal degrees of freedom for the time variable were set to 7. The RR plot for average temperature is shown in Figure A2b.
Table A4.
Parameter Tables for Models 3 and 4 (Older Adults Group, ≥ 65 years).
Figure A2.
Risk (95% CI) of pulmonary tuberculosis incidence associated with relative humidity in Model 3 (a) and average temperature in Model 4 (b) for older adults group. The red solid line in each subplot denotes the estimated RR of PTB incidence across varying levels of meteorological factors. The light grey shaded band surrounding the line represents the 95% CI of the estimated effect.
References
- WHO. Global Tuberculosis Report 2024. Global Tuberculosis Report 2024. 2024. Available online: https://www.who.int/publications/i/item/9789240101531 (accessed on 14 July 2026).
- Hainan Provincial Bureau of Statistics. Hainan Statistical Yearbook; China Statistics Press: Beijing, China, 2024. Available online: https://stats.hainan.gov.cn/tjj/tjsu/ndsj/2024/202412/P020250116308974141111.pdf (accessed on 14 July 2026).
- Kuddus, M.A.; McBryde, E.S.; Adegboye, O.A. Delay effect and burden of weather-related tuberculosis cases in Rajshahi province, Bangladesh, 2007–2012. Sci. Rep. 2019, 9, 12720. [Google Scholar] [CrossRef] [Scilit]
- Onozuka, D.; Hagihara, A. The association of extreme temperatures and the incidence of tuberculosis in Japan. Int. J. Biometeorol. 2015, 59, 1107–1114. [Google Scholar] [CrossRef] [Scilit] [PubMed]
- Wang, W.; Guo, W.; Cai, J.; Guo, W.; Liu, R.; Liu, X.; Ma, N.; Zhang, X.; Zhang, S. Epidemiological characteristics of tuberculosis and effects of meteorological factors and air pollutants on tuberculosis in Shijiazhuang, China: A distribution lag non-linear analysis. Environ. Res. 2021, 195, 110310. [Google Scholar] [CrossRef] [Scilit] [PubMed]
- Li, Z.; Liu, Q.; Zhan, M.; Tao, B.; Wang, J.; Lu, W. Meteorological factors contribute to the risk of pulmonary tuberculosis: A multicenter study in eastern China. Sci. Total Environ. 2021, 793, 148621. [Google Scholar] [CrossRef] [Scilit] [PubMed]
- Nie, Y.; Yang, Z.; Lu, Y.; Bahani, M.; Zheng, Y.; Tian, M.; Zhang, L. Interaction between air pollutants and meteorological factors on pulmonary tuberculosis in northwest China: A case study of eight districts in Urumqi. Int. J. Biometeorol. 2024, 68, 691–700. [Google Scholar] [CrossRef] [Scilit] [PubMed]
- Zheng, Y.; Emam, M.; Lu, D.; Tian, M.; Wang, K.; Peng, X. Analysis of the effect of temperature on tuberculosis incidence by distributed lag non-linear model in Kashgar city, China. Environ. Sci. Pollut. Res. Int. 2023, 30, 11530–11541. [Google Scholar] [CrossRef] [Scilit] [PubMed]
- He, T.; Qian, X.; Huang, J.; Li, G.; Guo, X. A mediation analysis of meteorological factors on the association between ambient carbon monoxide and tuberculosis outpatients visits. Front. Public Health 2025, 13, 1526325. [Google Scholar] [CrossRef] [Scilit] [PubMed]
- Li, W.; Wang, X.; Bi, B.; Lu, J.; Li, Z.; Cao, L.; Zhang, H. Influence of Temperature and Humidity on the Incidence of Pulmonary Tuberculosis in Hainan, China, 2004–2018. Biomed. Environ. Sci. 2024, 37, 1080–1085. [Google Scholar] [CrossRef] [Scilit] [PubMed]
- Huang, K.; Yang, X.J.; Hu, C.Y.; Ding, K.; Jiang, W.; Hua, X.G.; Liu, J.; Cao, J.Y.; Sun, C.Y.; Zhang, T.; et al. Short-term effect of ambient temperature change on the risk of tuberculosis admissions: Assessments of two exposure metrics. Environ. Res. 2020, 189, 109900. [Google Scholar] [CrossRef] [Scilit] [PubMed]
- Feng, F.; Ma, Y.; Zhang, Y.; Shen, J.; Wang, H.; Cheng, B.; Jiao, H. Effects of extreme temperature on respiratory diseases in Lanzhou, a temperate climate city of China. Environ. Sci. Pollut. Res. Int. 2021, 28, 49278–49288. [Google Scholar] [CrossRef] [Scilit] [PubMed]
- Nie, Y.; Lu, Y.; Wang, C.; Yang, Z.; Sun, Y.; Zhang, Y.; Tian, M.; Rifhat, R.; Zhang, L. Effects and Interaction of Meteorological Factors on Pulmonary Tuberculosis in Urumqi, China, 2013–2019. Front. Public Health 2022, 10, 951578. [Google Scholar] [CrossRef] [Scilit] [PubMed]
- Baek, K.; Choi, J.; Park, J.T.; Kwak, K. Influence of temperature and precipitation on the incidence of hepatitis A in Seoul, Republic of Korea: A time series analysis using distributed lag linear and non-linear model. Int. J. Biometeorol. 2022, 66, 1725–1736. [Google Scholar] [CrossRef] [Scilit] [PubMed]
- Chaw, L.; Liew, S.Q.R.; Wong, J. Association between climate variables and pulmonary tuberculosis incidence in Brunei Darussalam. Sci. Rep. 2022, 12, 8775. [Google Scholar] [CrossRef] [Scilit] [PubMed]
- Xu, M.; Li, Y.; Liu, B.; Chen, R.; Sheng, L.; Yan, S.; Chen, H.; Hou, J.; Yuan, L.; Ke, L.; et al. Temperature and humidity associated with increases in tuberculosis notifications: A time-series study in Hong Kong. Epidemiol. Infect. 2020, 149, e8. [Google Scholar] [CrossRef] [Scilit] [PubMed]
- Xiao, Y.; He, L.; Chen, Y.; Wang, Q.; Meng, Q.; Chang, W.; Xiong, L.; Yu, Z. The influence of meteorological factors on tuberculosis incidence in Southwest China from 2006 to 2015. Sci. Rep. 2018, 8, 10053. [Google Scholar] [CrossRef] [Scilit] [PubMed]
- Yang, S.; Wu, J.; Ding, C.; Cui, Y.; Zhou, Y.; Li, Y.; Deng, M.; Wang, C.; Xu, K.; Ren, J.; et al. Epidemiological features of and changes in incidence of infectious diseases in China in the first decade after the SARS outbreak: An observational trend study. Lancet Infect. Dis. 2017, 17, 716–725. [Google Scholar] [CrossRef] [Scilit] [PubMed]
- Liu, E.; Zhou, L.; Wang, L. Comprehensive interpretation of the Classification of tuberculosis (WS 196-2017). Chin. J. Antituberc. 2018, 40, 234–238. [Google Scholar] [CrossRef]
- Diggle, P.J.; Heagerty, P.J.; Liang, K.Y.; Zeger, S.L. Analysis of Longitudinal Data, 2nd ed.; Oxford University Press: Oxford, UK, 2002. [Google Scholar] [CrossRef] [Scilit]
- Gasparrini, A. Distributed lag linear and non-linear models in R: The package dlnm. J. Stat. Softw. 2011, 43, 1–20. [Google Scholar] [CrossRef] [Scilit] [PubMed]
- Wood, S.N. Generalized Additive Models: An Introduction with R, 2nd ed.; Chapman and Hall/CRC: Boca Raton, FL, USA, 2017. [Google Scholar] [CrossRef] [Scilit]
- Yerezhepov, D.; Gabdulkayum, A.; Akhmetova, A.; Abilova, Z.; Rakhimova, S.; Kairov, U.; Akilzhanova, A.; Kozhamkulov, U. Epidemiological and genetic aspects of pulmonary tuberculosis in Kazakhstan. J. Infect. Public Health 2024, 17, 102540. [Google Scholar] [CrossRef] [Scilit] [PubMed]
- Niu, T.; He, F.; Yang, J.; Ma, C.; Xu, J.; Sun, T.; Zhang, X.; Chen, S.; Ru, C. The epidemiological characteristics and infection risk factors for extrapulmonary tuberculosis in patients hospitalized with pulmonary tuberculosis infection in China from 2017 to 2021. BMC Infect. Dis. 2023, 23, 488. [Google Scholar] [CrossRef] [Scilit] [PubMed]
- Wang, Q.; Zhu, J.; Zhang, L.; Xie, L. Regional and epidemiological characteristics of tuberculosis and treatment outcomes in West China. Front. Public Health 2023, 11, 1254579. [Google Scholar] [CrossRef] [Scilit] [PubMed]
- Zhou, F.J.; Wu, H.Z.; Li, J.W.; Feng, H.Y.; Huang, S.S.; Chen, L.; Liao, Q.H.; Wen, W.P. Epidemiological characteristics of pulmonary tuberculosis in Guangdong province from 2016 to 2020. Zhonghua Liu Xing Bing. Xue Za Zhi 2022, 43, 1568–1574. [Google Scholar] [CrossRef] [PubMed]
- Yang, X.Y.; Chen, S.S.; Yi, J.L.; Zhao, Y.F.; Chen, H.; Dai, X.W.; Ding, B.C.; Pang, M.D.; Li, Q.; Zhao, Z.Y.; et al. Analysis of tuberculosis epidemiological characteristics and drug resistance among the floating population in Beijing in 2019. Zhonghua Liu Xing Bing Xue Za Zhi 2023, 44, 949–953. [Google Scholar] [CrossRef] [PubMed]
- Fernandes, F.M.C.; Martins, E.S.; Pedrosa, D.M.A.S.; Evangelista, M.D.S.N. Relationship between climatic factors and air quality with tuberculosis in the Federal District, Brazil, 2003–2012. Braz. J. Infect. Dis. 2017, 21, 369–375. [Google Scholar] [CrossRef] [Scilit] [PubMed]
- Mamahlodi, M.T. Potential benefits and harms of the use of UV radiation in transmission of tuberculosis in South African health facilities. J. Public Health Afr. 2019, 10, 742. [Google Scholar] [CrossRef] [Scilit] [PubMed]
- Chen, R.; Yin, P.; Wang, L.; Liu, C.; Niu, Y.; Wang, W.; Jiang, Y.; Liu, Y.; Liu, J.; Qi, J.; et al. Association between ambient temperature and mortality risk and burden: Time series study in 272 main Chinese cities. BMJ 2018, 363, k4306. [Google Scholar] [CrossRef] [Scilit] [PubMed]
- Cohen, A.; Mehta, S. Pollution and tuberculosis: Outdoor sources. PLoS Med. 2007, 4, e142. [Google Scholar] [CrossRef] [Scilit] [PubMed]
- Chong, K.C.; Yeoh, E.K.; Leung, C.C.; Lau, S.Y.F.; Lam, H.C.Y.; Goggins, W.B.; Zhao, S.; Ran, J.; Mohammad, K.N.; Chan, R.W.Y.; et al. Independent effect of weather, air pollutants, and seasonal influenza on risk of tuberculosis hospitalization: An analysis of 22-year hospital admission data. Sci. Total Environ. 2022, 837, 155711. [Google Scholar] [CrossRef] [Scilit] [PubMed]
- Li, Y.; Leung, G.M.; Tang, J.W.; Yang, X.; Chao, C.Y.; Lin, J.Z.; Lu, J.W.; Nielsen, P.V.; Niu, J.; Qian, H.; et al. Role of ventilation in airborne transmission of infectious agents in the built environment—A multidisciplinary systematic review. Indoor Air 2007, 17, 2–18. [Google Scholar] [CrossRef] [Scilit] [PubMed]
- Saran, A.; Singh, S.; Gupta, N.; Walke, S.C.; Rao, R.; Simiyu, C.; Malhotra, S.; Mishra, A.; Puskur, R.; Masset, E.; et al. Interventions promoting resilience through climate smart agricultural practices for women farmers: A systematic review. Campbell Syst. Rev. 2024, 20, e1426. [Google Scholar] [CrossRef] [Scilit] [PubMed]
- Bunker, A.; Wildenhain, J.; Vandenbergh, A.; Henschke, N.; Rocklöv, J.; Hajat, S.; Sauerborn, R. Effects of Air Temperature on Climate-Sensitive Mortality and Morbidity Outcomes in the Elderly; a Systematic Review and Meta-analysis of Epidemiological Evidence. eBioMedicine 2016, 6, 258–268. [Google Scholar] [CrossRef] [Scilit] [PubMed]
- Gasparrini, A.; Guo, Y.; Hashizume, M.; Lavigne, E.; Zanobetti, A.; Schwartz, J.; Tobias, A.; Tong, S.; Rocklöv, J.; Forsberg, B.; et al. Mortality risk attributable to high and low ambient temperature: A multicountry observational study. Lancet 2015, 386, 369–375. [Google Scholar] [CrossRef] [Scilit] [PubMed]

Disclaimer/Publisher’s Note: The statements, opinions and data contained in all publications are solely those of the individual author(s) and contributor(s) and not of MDPI and/or the editor(s). MDPI and/or the editor(s) disclaim responsibility for any injury to people or property resulting from any ideas, methods, instructions or products referred to in the content. |
© 2026 by the authors. Licensee MDPI, Basel, Switzerland. This article is an open access article distributed under the terms and conditions of the Creative Commons Attribution (CC BY) license.