1. Introduction
Located along the coast of southern China with a subtropical climate, the Pearl River Estuary is frequently affected by severe weather such as rainstorms and typhoons. Hailstorm is also a type of hazardous weather which could damage crops, properties [
1,
2,
3], and even cause physical injuries [
4]. Mainly a mid-latitude phenomenon [
5], hail is relatively rare over southern China, mostly occurring in spring months of March and April [
6,
7]. In Hong Kong, only 16 hail reports were recorded during the past 25 years (2001–2025) [
8], and the occurrence of hail over the territory also peaks in March and April, but hail may still happen in the summer months at times. Although rare, hail could still bring damaging impacts to the Pearl River Estuary [
9,
10] and it would be in our interest to investigate the structure and hail-producing mechanisms of the related weather systems over the region for a better understanding and more effective nowcast.
During the pre-summer rainy season, rainstorms, sometimes accompanied with mesoscale convective systems (MCSs), occur over southern China in the warm sector at least 200 km ahead of a cold front or without a cold front; these rainstorms are referred to as warm-sector heavy rainfall [
11,
12,
13]. The pre-storm environment is typically associated with low-level jet, a deep moist layer, high convective available potential energy (CAPE), low-level warm advection and some other thermodynamic factors and is triggered by a mid-level westerly trough [
14,
15]. The freezing level during the springtime is also generally lower than that of the summer. Two of the hail cases presented below are associated with such MCSs.
Weather radars are indispensable tools for monitoring and nowcasting the severe weather. Apart from observed Doppler velocity and radar reflectivity, the three-dimensional (3-D) wind field retrieved from multiple weather radars would be useful for understanding the wind structure of the severe weather, which may help in the nowcasting of such. There are various ways to perform 3-D wind retrieval based on multiple weather radar data [
16,
17,
18,
19]. A method based on the 3-D variational data assimilation technique has been described in Chan et al. [
20]. The accuracy of this Pythonic Direct Data Assimilation (PyDDA)-based retrieval approach, using the same radar network and cost-function configuration adopted in the present study, has recently been quantitatively validated against independent wind profiler observations, showing good agreement in both wind speed and direction [
21].
Previous PyDDA-based studies have primarily applied 3-D wind retrieval to individual convective events (e.g., Chong et al. [
22]) and have also been used to study several mid-latitude hail events [
23,
24]. This paper provides, to our knowledge, the first unified 3-D wind field comparison across three distinct hail-producing storm types over the Pearl River Estuary, namely, a supercell, a squall line, and a single-cell thunderstorm. This comparative framework enables the mechanisms of hail maintenance and deposition to be examined consistently across storm types under different synoptic forcing, shear profile, and lifecycle, offering a perspective on hail-producing convection that is not otherwise obtainable from conventional single-radar observations. The cases include a supercell in Guangzhou in April 2024, a squall line in Hong Kong in March 2025, and a suspected hail event associated with a rapidly developing deep-layered single-cell thunderstorm in Hong Kong in August 2025. As a further novel contribution, the radar-retrieved 3-D wind field is compared for the first time with satellite-borne radar observations, demonstrating consistency in capturing deep convective structure. The remainder of this paper is organized as follows:
Section 2 describes the wind retrieval methodology and the weather radar network;
Section 3,
Section 4 and
Section 5 present the three hail case studies;
Section 6 compares the radar-retrieved wind field with satellite-borne radar observations; and
Section 7 concludes the paper.
2. The Wind Retrieval Algorithm and Weather Radars in Use
The 3-D wind retrieval methodology is based on the publicly available PyDDA package [
25]. PyDDA performs three-dimensional variational analysis (3DVAR) by minimizing a cost function, which is defined as a weighted sum of multiple constraint terms. These constraints include radial velocity observations from weather radars, mass continuity, vertical vorticity, radiosonde observations, smoothness, model background fields, and point observations [
26,
27,
28]. The equation of the cost function can be found in Jackson et al. [
25]. The weights of these cost-function terms are adjustable parameters that reflect the relative importance of individual constraints. To emphasize the importance of the observed radial velocities, only the first two terms in the cost function are used (i.e., weights for the rest of the terms being set to zero). This configuration was chosen to maximize fidelity to direct radar observations rather than impose additional structural constraints that could smooth over the fine-scale updraft–downdraft couplets relevant to hail deposition. Retrieval accuracy is sensitive to dual-Doppler baseline geometry, with a larger error where radar beams cross at near-parallel angles. This uncertainty source is consistent with those documented in prior PyDDA applications [
21,
25] and are taken into account in the qualitative interpretation of updraft and downdraft magnitudes throughout this study.
The model adopted for the 3DVAR analysis is the Weather Research and Forecasting (WRF) model configured with a spatial resolution at 2 km, which is run operationally at the Hong Kong Observatory (HKO) [
29]. This 2 km WRF model mainly serves to provide a first guess to the 3DVAR analysis and does not impose a constraint during cost-function minimization (the weight of the “model” cost-function term being set to zero). Pre-processing of the weather radar data has been performed, including removing non-meteorological signals with a correlation coefficient (RhoHV) less than 0.8 and de-aliasing of the Doppler velocities.
Quantitative validation of the PyDDA-retrieved wind field has been conducted in a companion study using the same retrieval methodology and radar network configuration [
21]. In that study, the retrieved horizontal wind speed and direction at multiple heights (1–6 km above sea level) were compared against independent wind profiler observations at Sham Shui Po, with more than 360 data points collected during a series of rain events. The comparison yielded a root-mean-square difference of approximately 5.7 m/s for wind speed and 36.4 degrees for wind direction, with a correlation coefficient of approximately 0.9 and a best-fit regression slope close to unity, indicating that the PyDDA retrieval is quantitatively consistent with independent in situ observations. This validation result is applicable to the present study, as the retrieval algorithm and cost-function configuration are unchanged between the two studies. Direct in situ validation of the retrieved vertical velocity field remains challenging. As demonstrated by Lau et al. [
21], vertical velocity measured by a wind profiler in rain is dominated by the terminal velocity of falling raindrops rather than true air motion, precluding a direct comparison with the retrieved updraft and downdraft magnitudes discussed here. Rigorous vertical velocity validation using independent platforms remains a priority for future work.
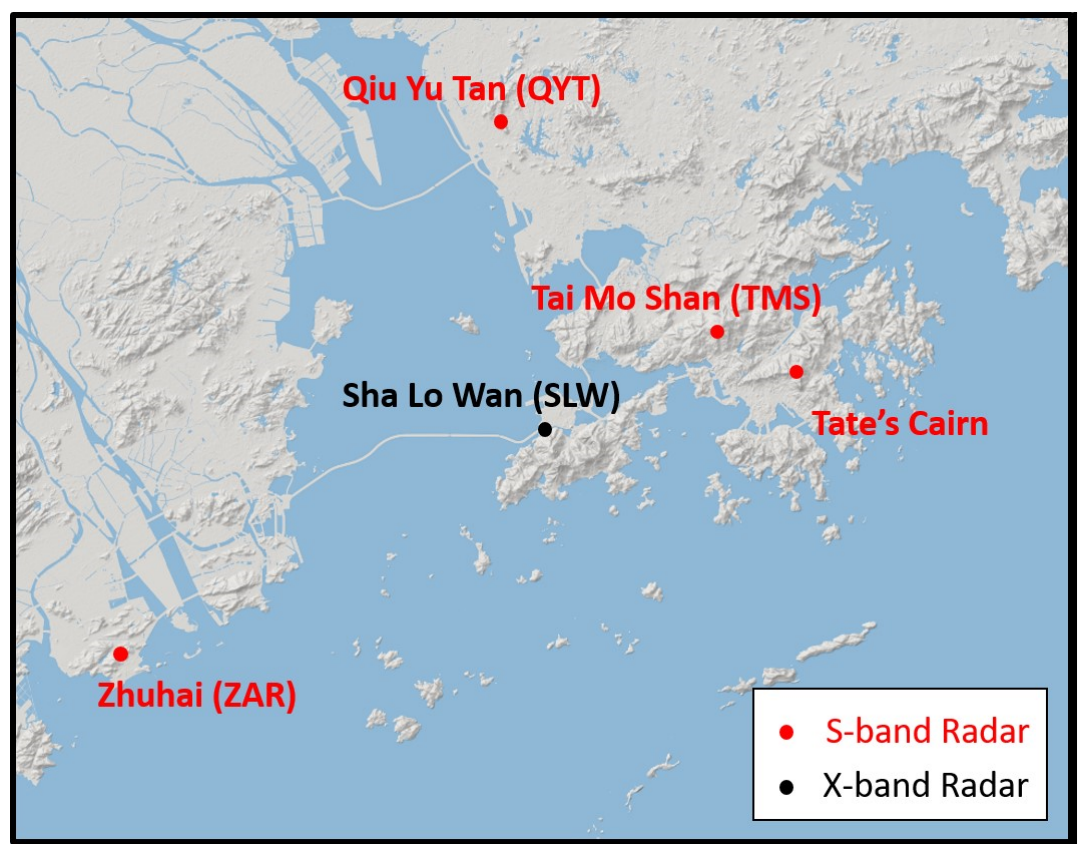
A total of five weather radars are used in the multiple-Doppler radar wind analysis, including two long-range S-band weather radars on top of two mountains in Hong Kong, namely, Tai Mo Shan (TMS) and Tate’s Cairn; one S-band radar in Shenzhen at Qiu Yu Tan (QYT); and one S-band radar in Zhuhai (ZAR). For detecting rather isolated convection in Hong Kong, such as the third case, the X-band phased-array weather radar at Sha Lo Wan (SLW) is also considered. Apart from its finer resolution, the SLW radar can provide a volume scan within a period of about 1.5 min by electronic scanning. The locations of the radars are given in
Figure 1.
3. Case 1: Hail and Tornado Under Supercell Storm in Guangzhou on 27 April 2024
On 27 April 2024, a tornado with an Enhanced Fujita (EF) scale of 2 or EF2 accompanied by giant hail with a diameter up to 150 mm struck Zengcheng District, Guangzhou, Guangdong Province, killing five people and causing extensive damage [
10,
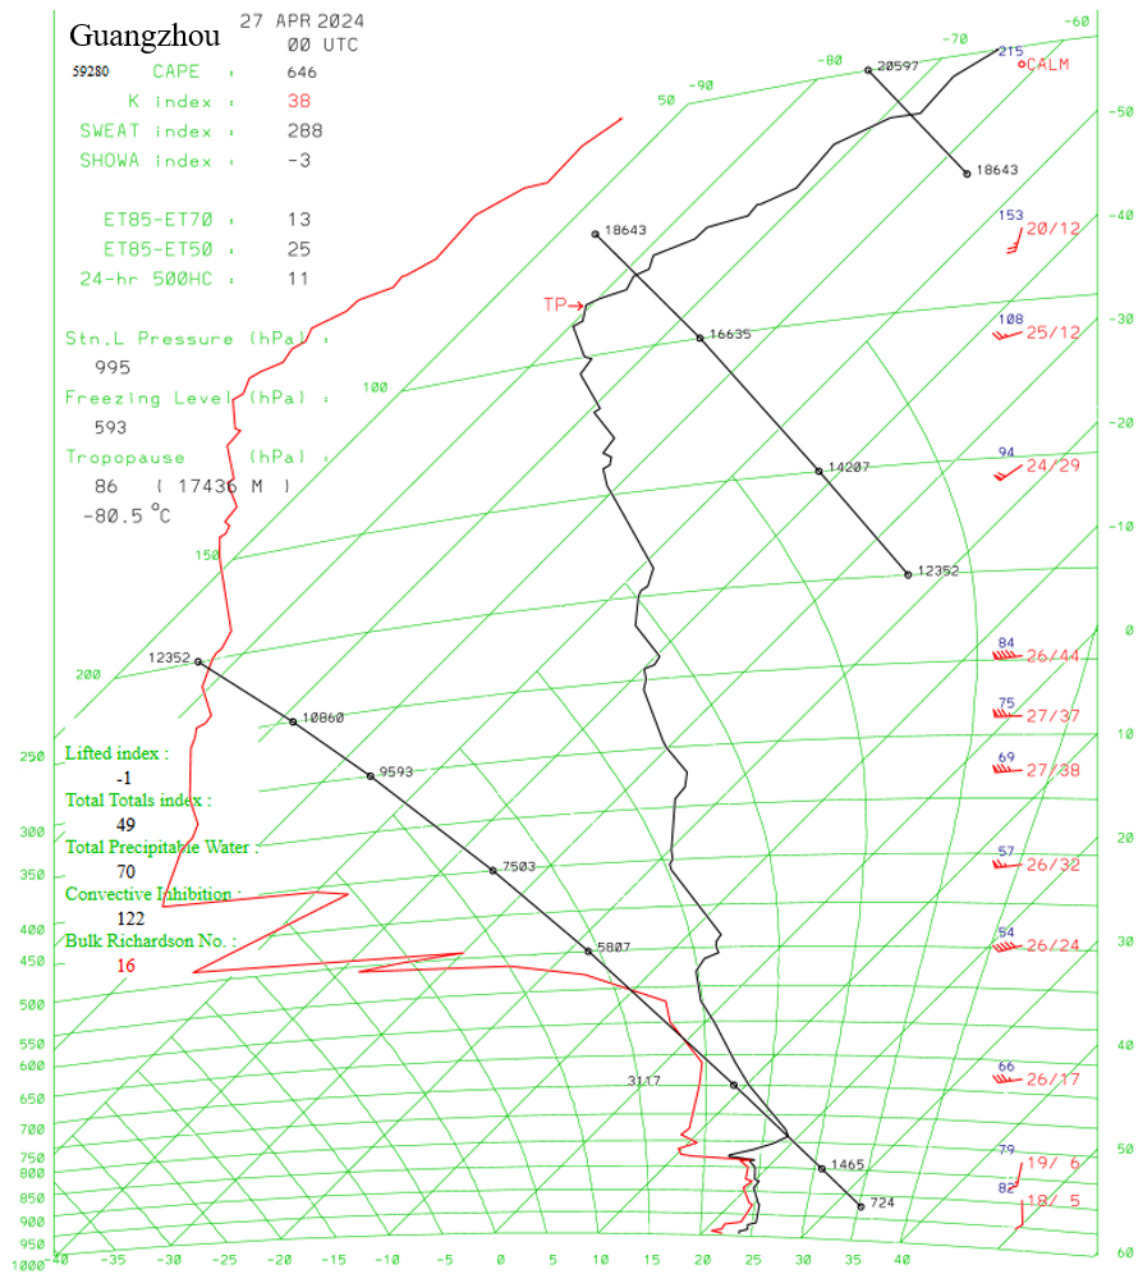
30]. Synoptically, Guangdong was located in the warm sector without clear frontal characteristics to the north in this case. A 500 hPa flow over Guangdong was dry and perturbed westerly flow with a jet strength up to 45 knots. A low-level warm and moist southwesterly jet at 850–925 hPa, with wind speed up to 30 knots, was also present along the coast of Guangdong; there was speed convergence of a low-level jet approaching the coast. The radiosonde ascent over Guangzhou at 00 UTC (08 HKT, HKT = UTC + 8 h) that morning (
Figure 2) showed an unstable atmosphere with a K Index of 38 and CAPE of 646 J/kg, even with a near-surface inversion present under nocturnal cooling, and the surface temperature later rose to 29 degrees around noon. With a moist low level and very dry mid-level, once convections are triggered, thunderstorms could be rather violent and a dry mid-level would be conducive to hail formation under dry growth. The veering of winds along the profile showed warm advection and vertical wind shear below 700 hPa. Thermodynamically, the Bulk Richardson Number was 16, a value within the optimal range for supercell development [
31].
The supercell thunderstorm responsible for the tornado persisted for 4.5 h after initiation. According to radar analysis, three major hail episodes occurred during the event, centered at around 15:00, 15:30, and 16:30 HKT respectively. This event exemplifies the increasing threat of springtime frontal supercells in southern China when high moisture coincides with strong vertical wind shear [
32,
33], underscoring the urgent need for enhanced nowcasting in densely populated coastal megacities.
Hail is often observed near tornadoes, and one of the primary reasons is that the intense updraft associated with tornadic supercells suspends hailstones above the freezing level until they become too heavy to be supported [
34,
35]. The same mechanism was evident in this case.
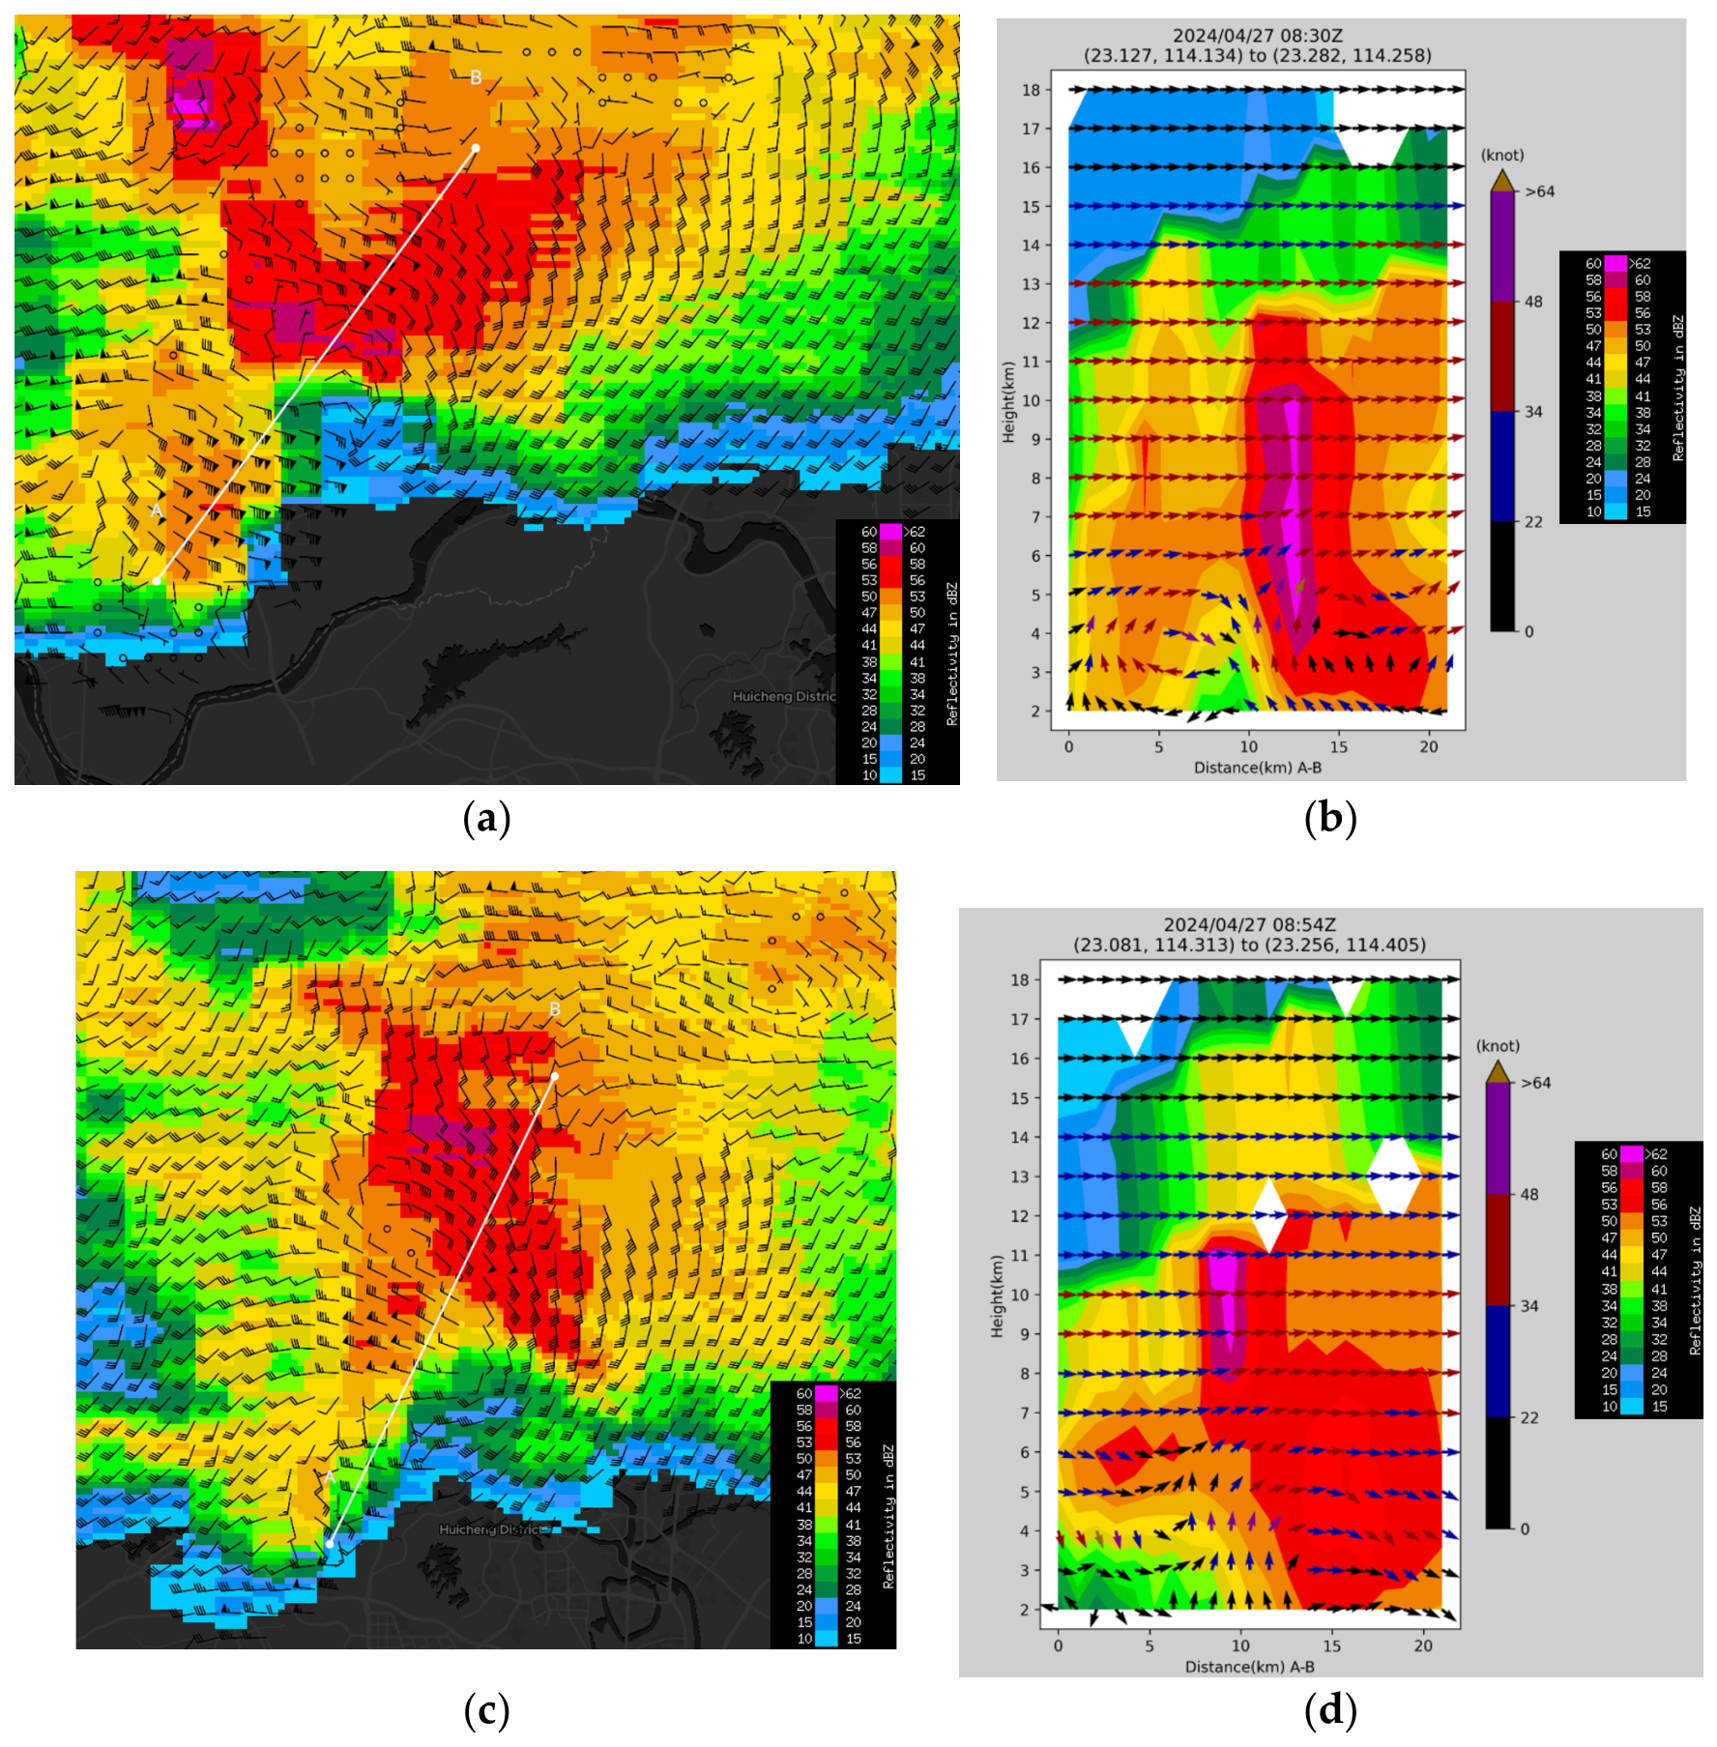
Figure 3 shows the radar imagery and cross sections along the supercell at ~16:30 and 16:54 HKT. A cyclonic rotating feature at 3 km could be clearly identified with a Bounded Weak Echo Region (BWER) over the southern tip of the circulation, and high reflectivity echoes over the northern flank, where updraft is the most prominent. Strong updrafts near the center of the vortex sustained purplish echoes (>60 dBZ) up to 9–11 km altitude, which is a clear signature of large hailstones. Further looking into the cross section in
Figure 3c,d, the rear-flank downdraft and forward-flank downdraft could be seen over the southwestern and northeastern tips of the cross section respectively.
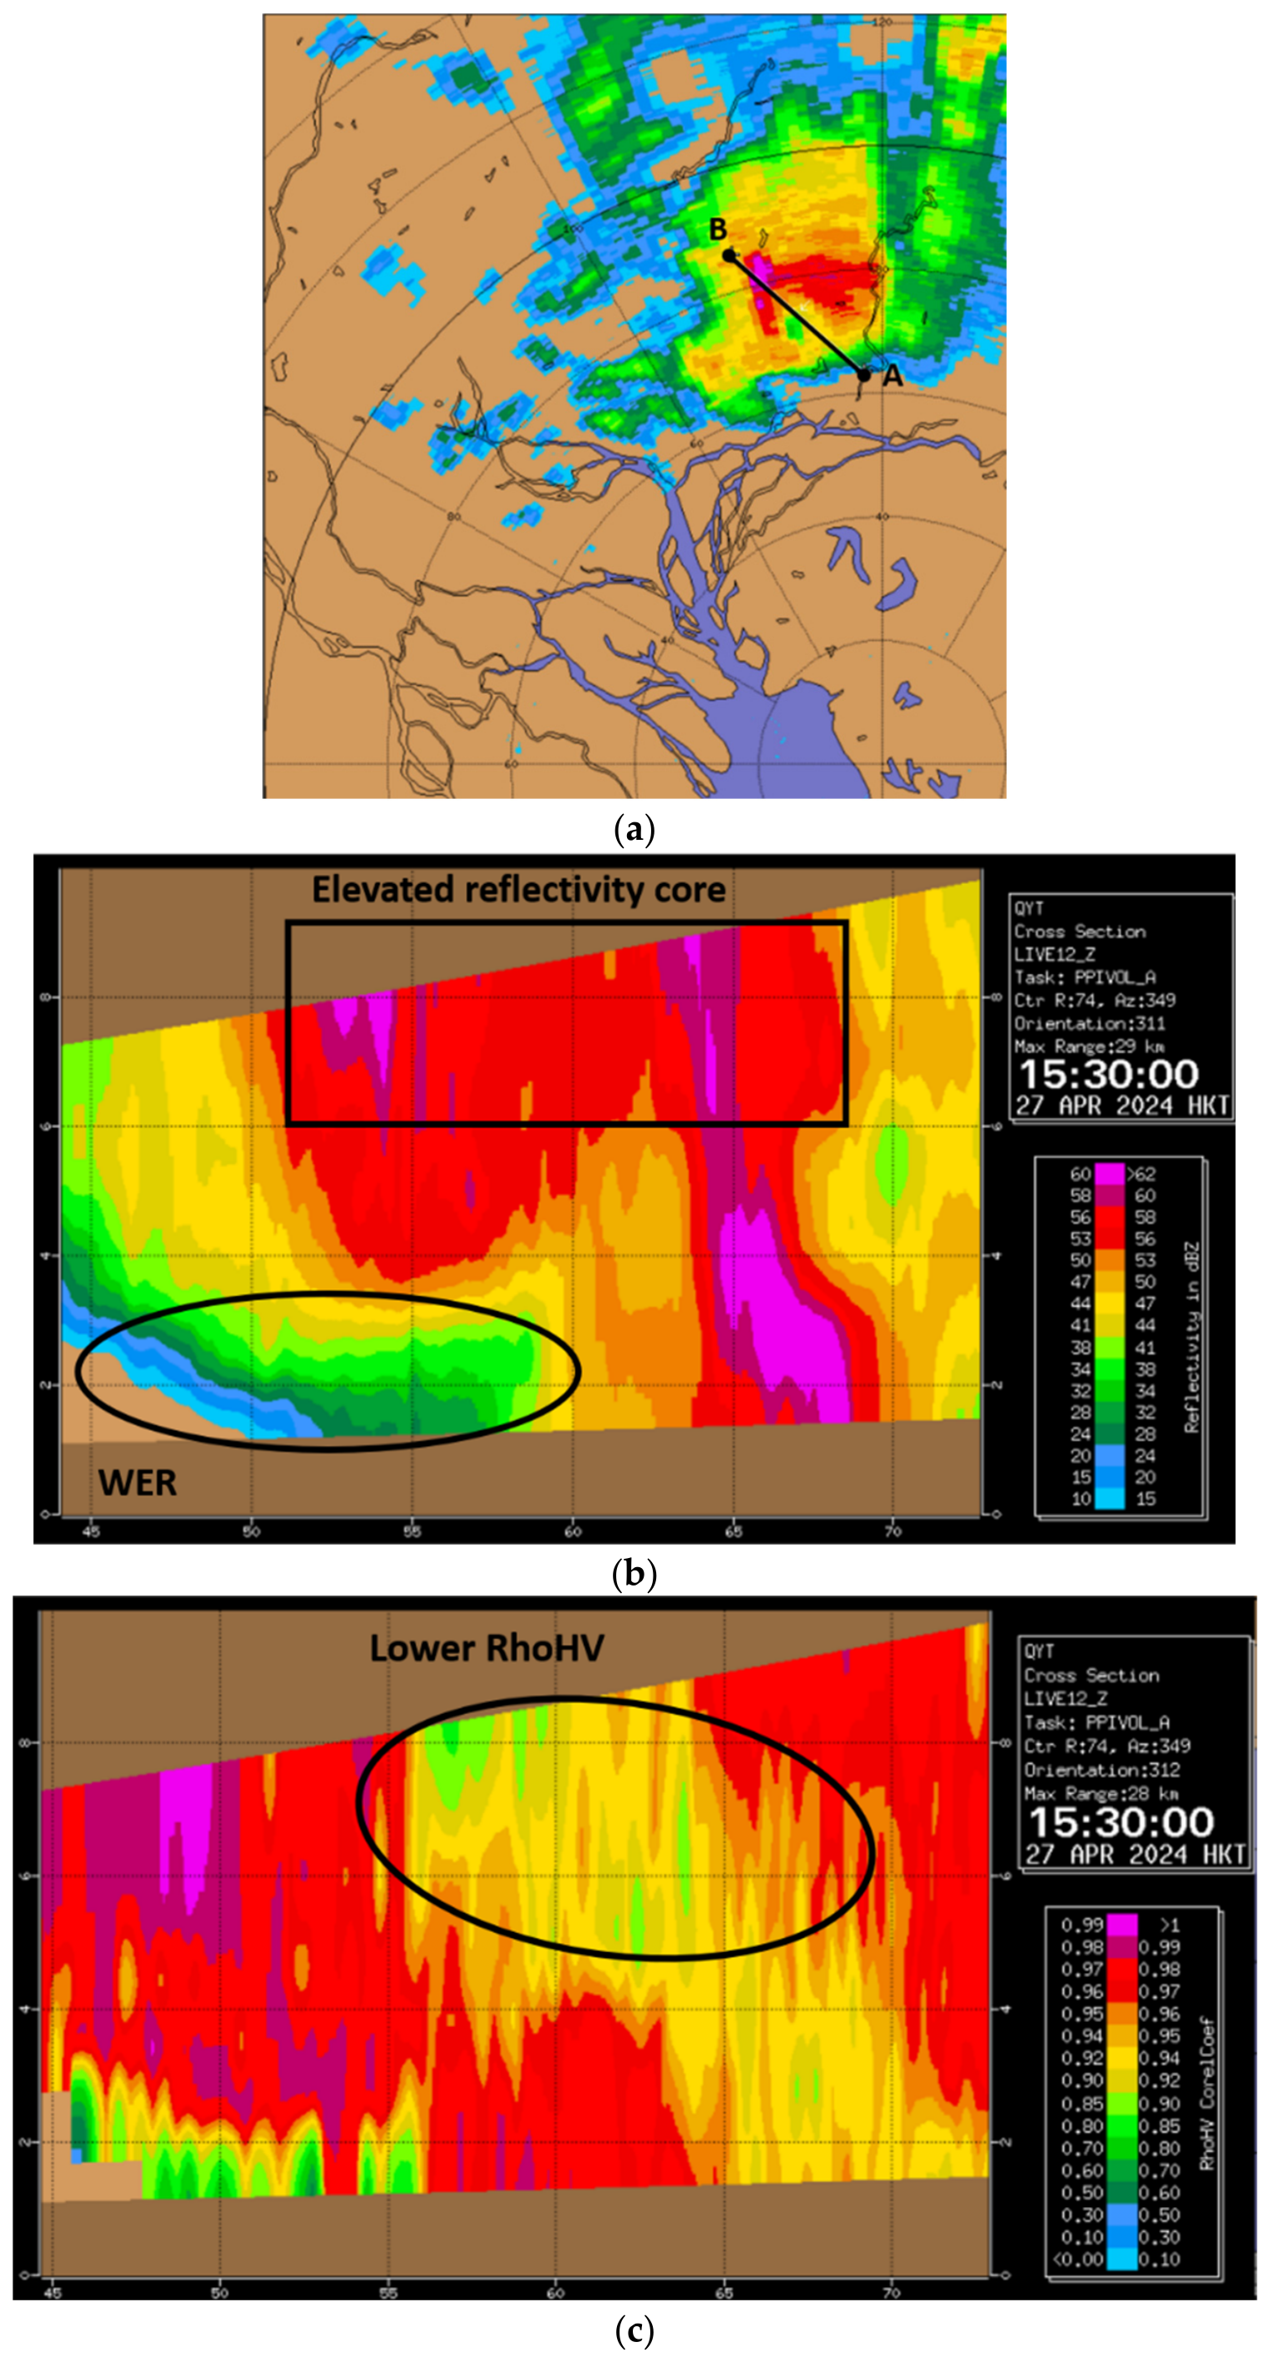
The largest hailstones reached the surface between 15:30 and 15:36 HKT near Zengcheng [
30]. A supercell structure typically found in hail-bearing storms [
32,
33,
36] can be identified as shown in
Figure 4, with an extensive area of an elevated high reflectivity core and a weak echo region (WER). The elevated reflectivity core was in an area of a relatively low correlation coefficient (RhoHV) with values down to 0.8, indicating possible large hail with irregular shapes. The RhoHV remained low as the hail falls to the surface near B due to a mixture of hydrometeors (hail and rain).
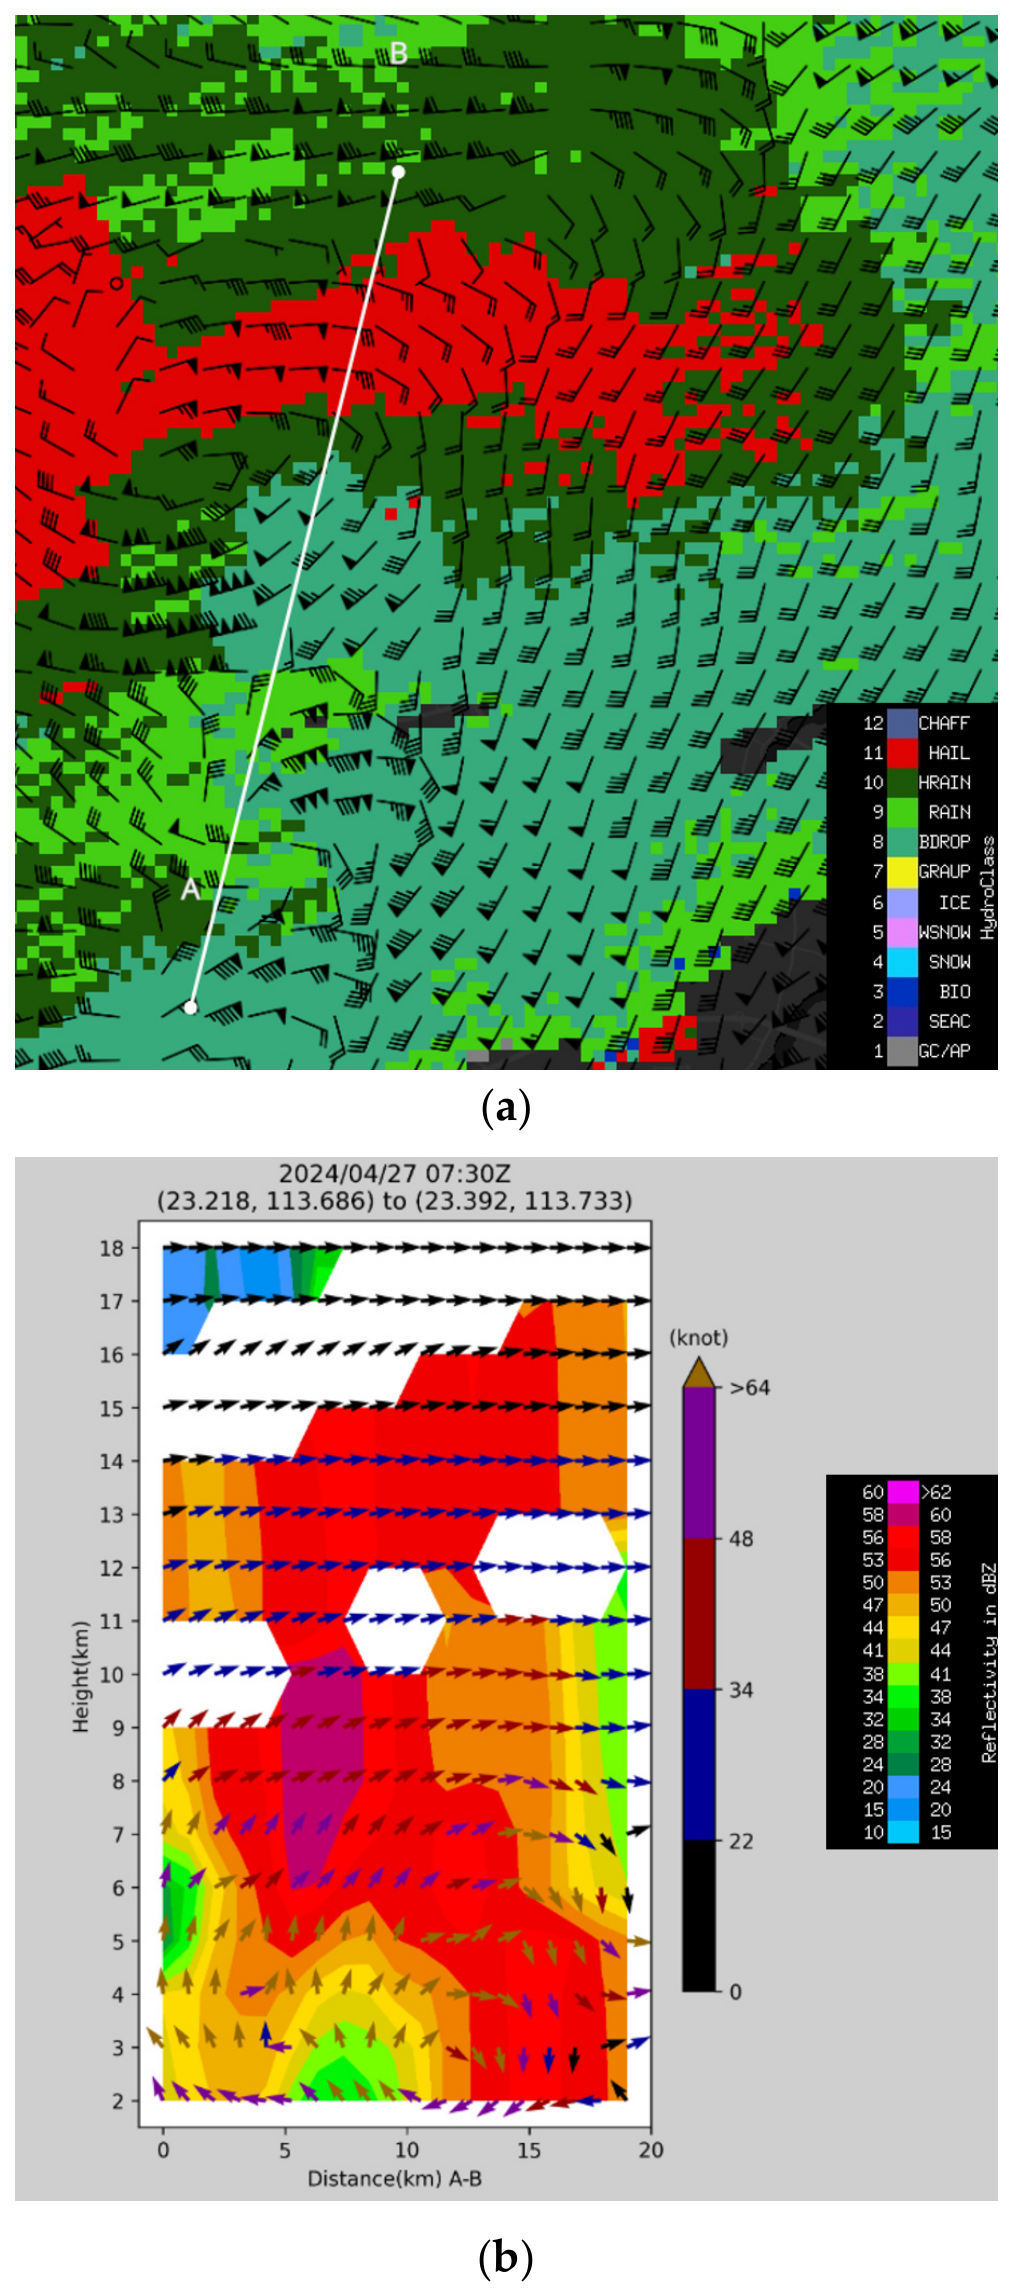
Figure 5 presents the 0.0° PPI hydrometeor classification (HCL) from the TMS radar, overlaid with wind analysis at 3 km altitude. A large area of hail was identified on the northern flank of the supercell, associated with the elevated intense echo. The vertical cross section through the vortex center revealed a reflectivity core (>58 dBZ) suspended between 6 and 10 km by an updraft reaching more than 30 m/s. Compared to the storm structure at 16:30 HKT, a strong downdraft of similar intensity in the forwardflank downdraft region (about 5 km downshear of this core) was observed. This led to the rapid descent of giant hailstones, minimizing melting and preserving their extreme size when reaching the surface.
4. Case 2: Hail Under Squall Line in Hong Kong on 15 March 2025
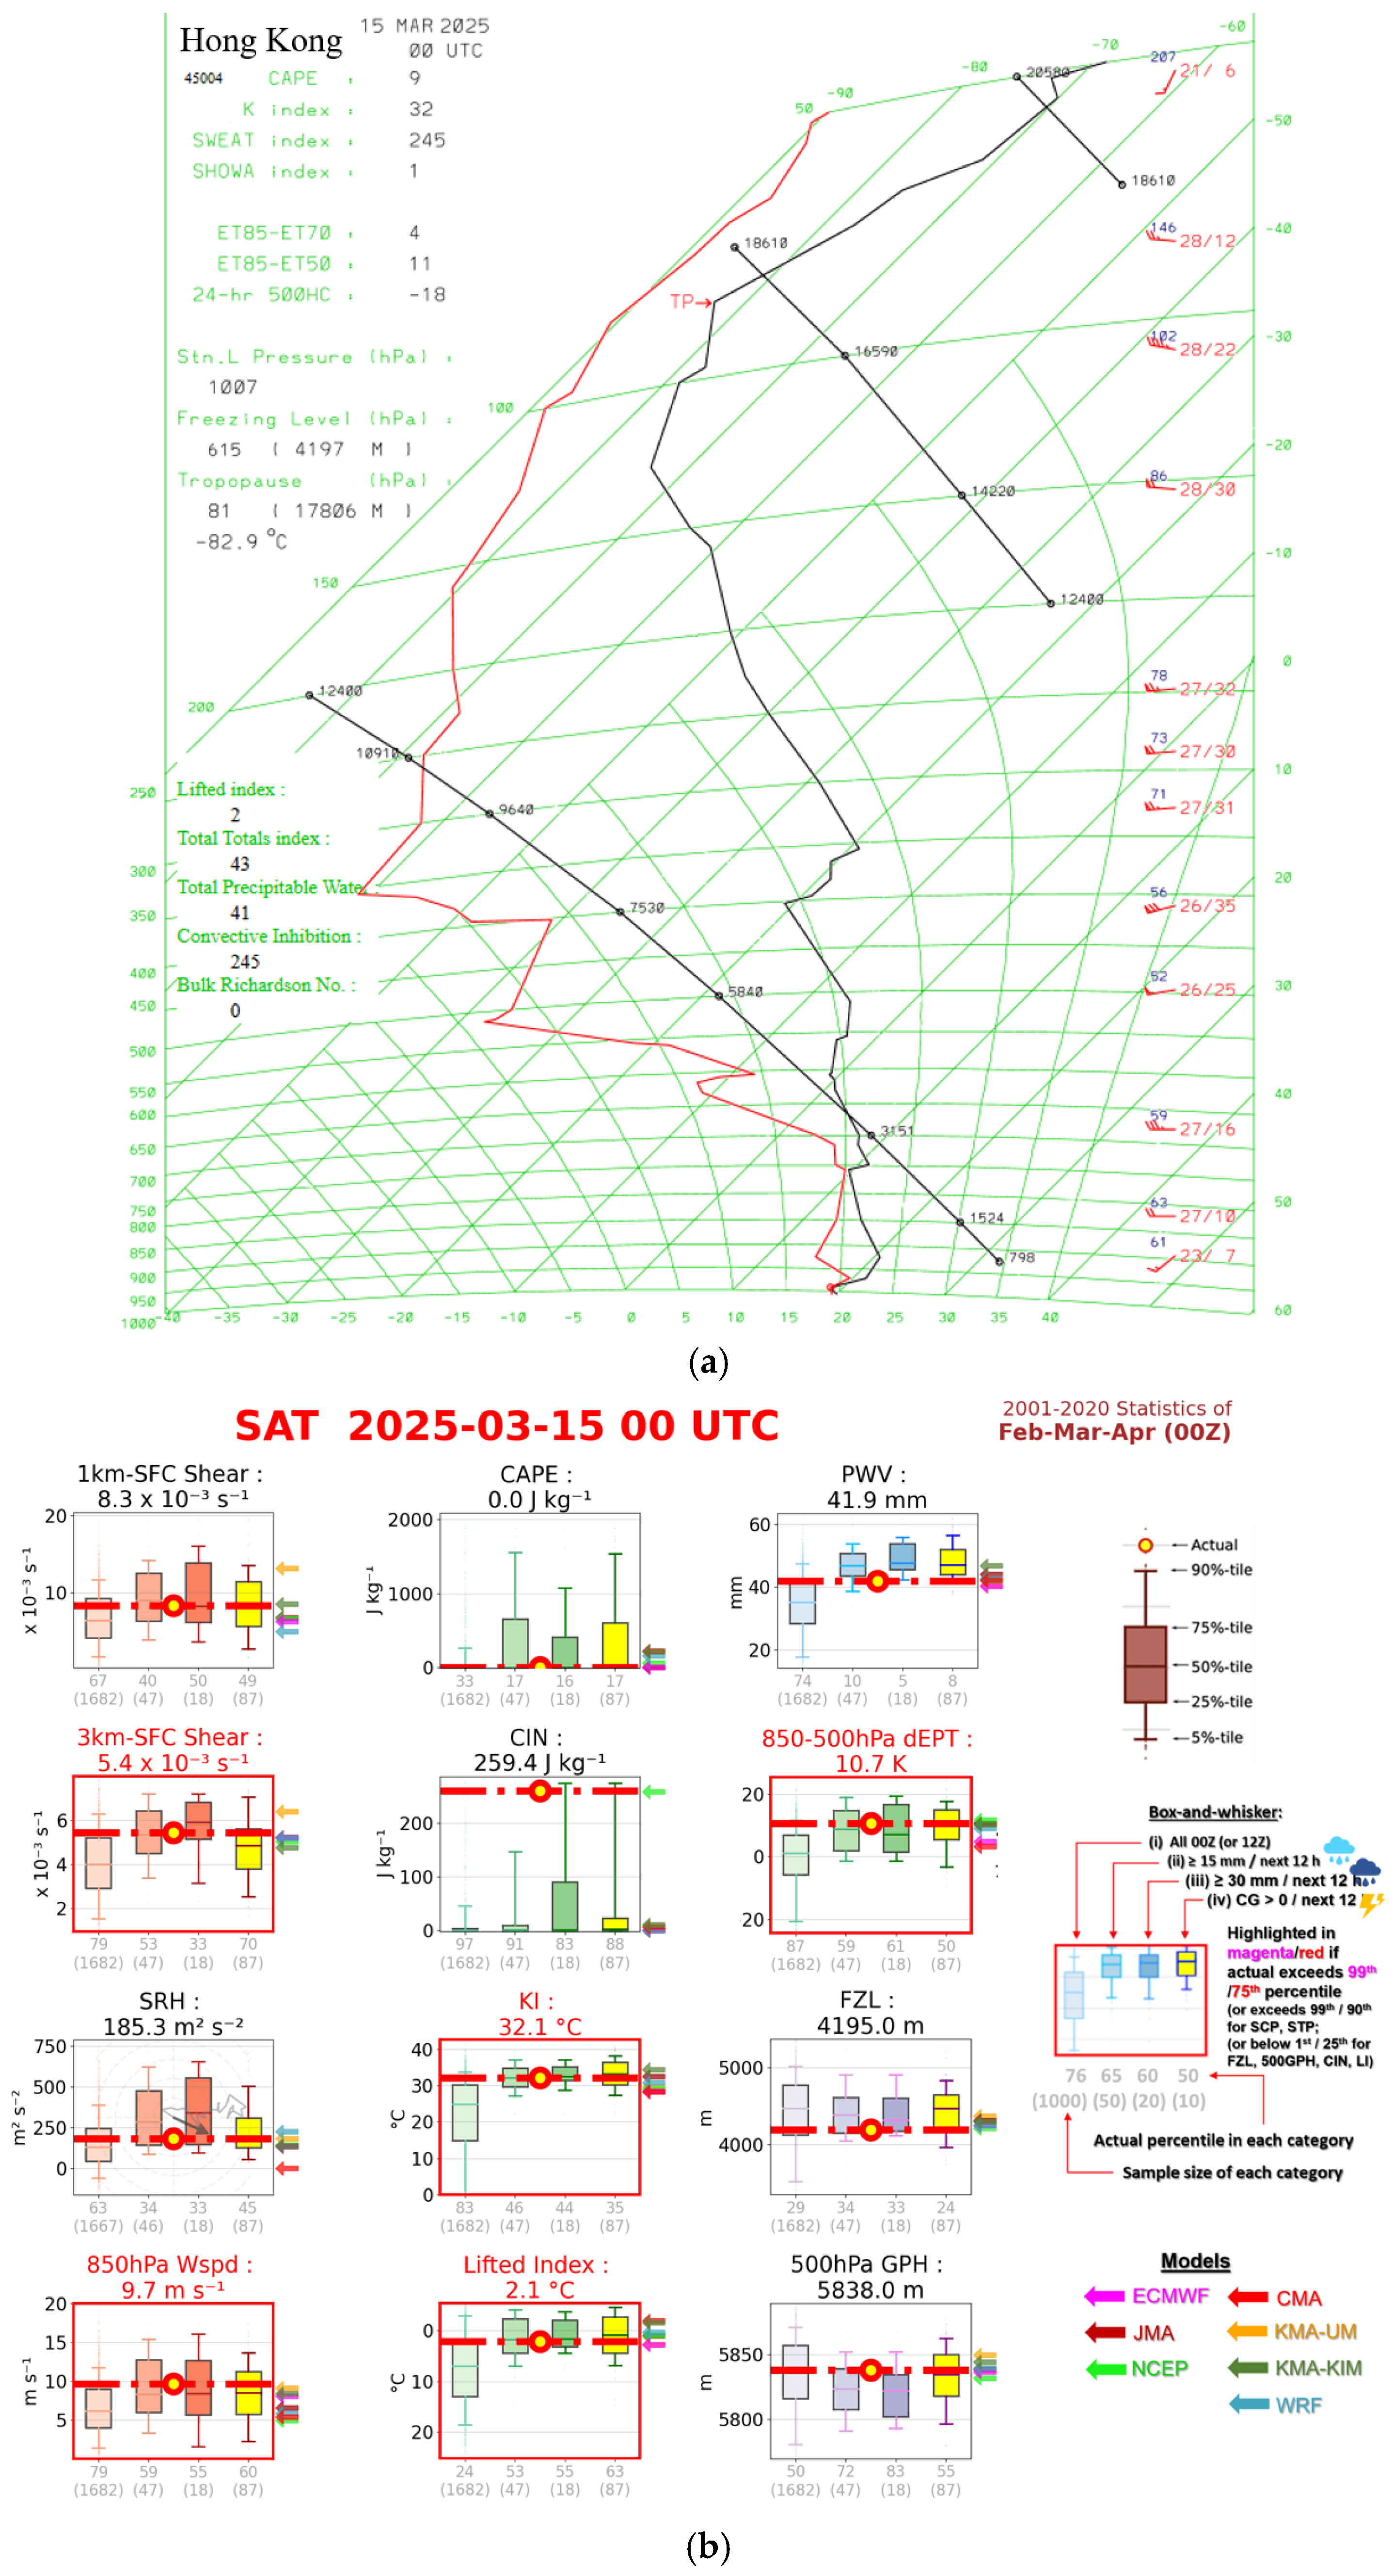
On 15 March 2025, the South China coast was located in the warm sector ahead of a cold front. The tephigram on that morning (
Figure 6a) showed a loaded-gun sounding with a thick moist layer below 750 hPa and a dry mid-level, and low-level winds veered with height, signifying warm advection. These factors were favorable for intense convections including hailstorms. However, there was a shallow but sharp inversion at the boundary layer, restricting the development of convection at that time. The diagnostics of the radiosonde data is shown in
Figure 6b, and major indices were compared with the climatology of February and April in 2001 to 2020. The box will be highlighted in red if it exceeds the upper quartile of climatology. The atmosphere was marginally convective, with a KI of 32, and a relatively high 850 hPa wind speed and wind shear below 3 km. The freezing level was 4.2 km, below the climatological mean. The low CAPE and high convective inhibition (CIN) were attributable to the shallow inversion; upon day heating and warm advection, the atmosphere could become more convective. Radiometer data at King’s Park showed CAPE reached about 630 J/kg at 05 UTC.
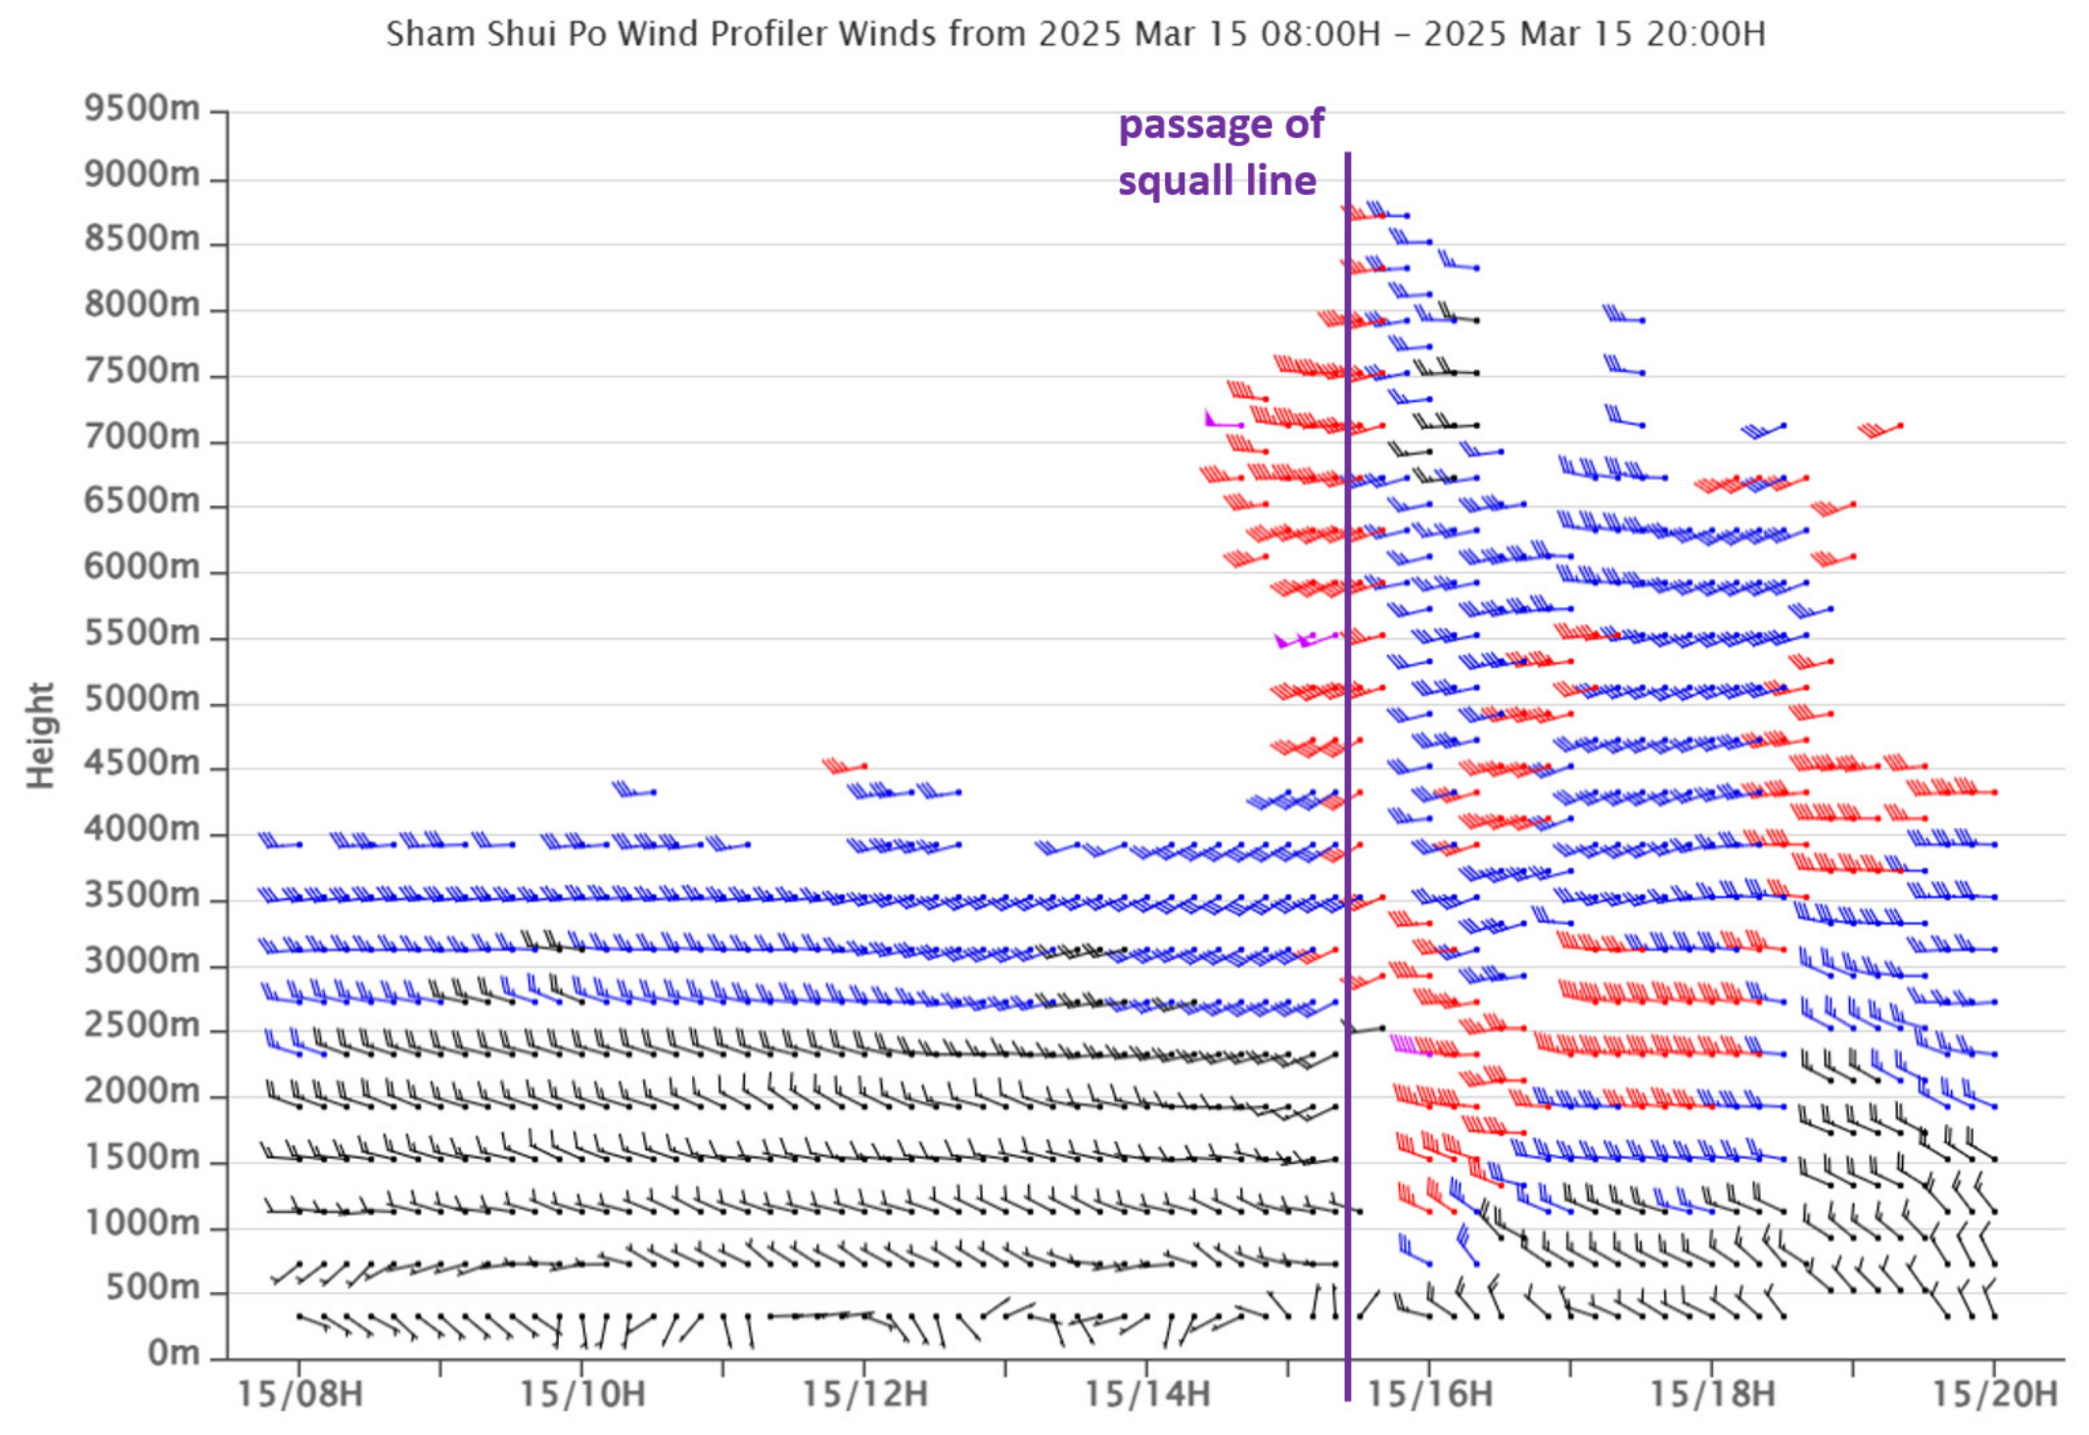
In the early afternoon of 15 March, surface temperatures over Hong Kong generally rose to 26 degrees, meaning the boundary layer was warmed up to the extent that the inversion was eroded. A squall line that could be traced back to Guangxi Province, sustained on its way moving eastwards to the Pearl River Estuary, eventually moved across Hong Kong at 14:50–15:40 HKT (HKT = UTC + 8 h), and Hong Kong was mainly under the effect of the bow-shaped echo with damaging winds. During its passage, winds at 2000–6000 m turned from west–southwesterlies to westerlies (
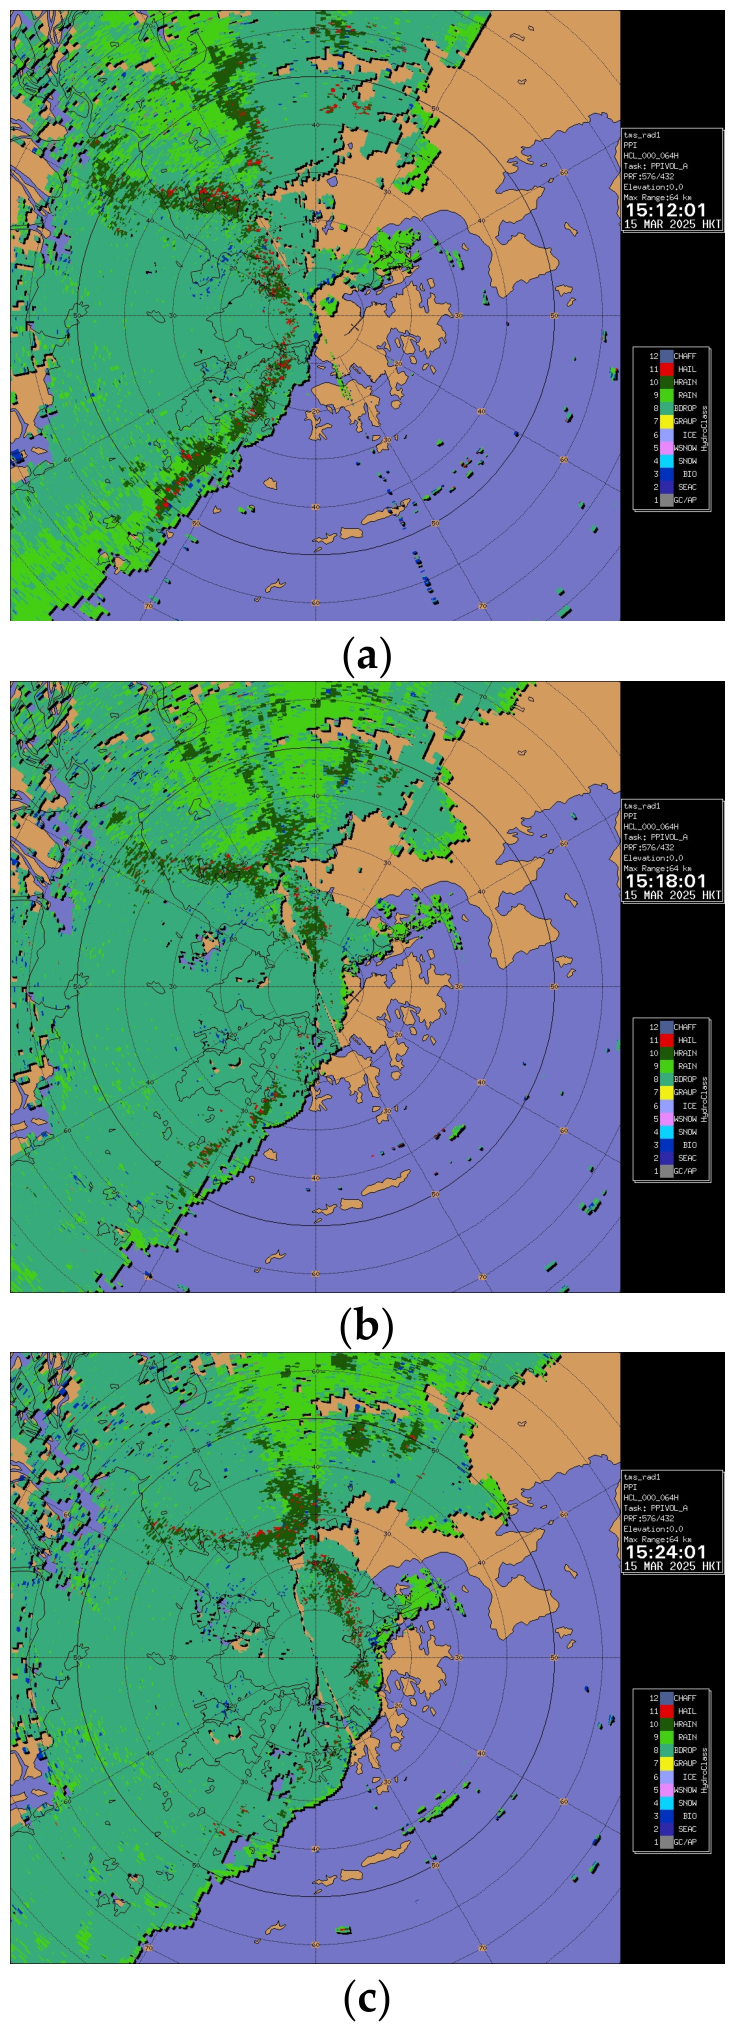
Figure 7), meaning the squall line was aligned with a mid-level wave. Hydrometeor classification based on the Tai Mo Shan Radar showed signatures of isolated hail along the bow-shaped echo in 0.0-degree plan position indicator (PPI) scans (
Figure 8). There was a hail report at Lai Chi Shan, Tai Po, over the northeastern part of Hong Kong at 15:24 HKT, with a hail diameter of about 0.5 cm. No hail report was received in other places in Hong Kong, or Shenzhen where the bookend vortex [
37] of the squall line passed through. This hail case is considered marginal, yet the initiation mechanism was well captured by three-dimensional wind analysis from radar.
Hail can be generated in intense squall lines [
38]. There has been analysis on the three-dimensional structure of a squall line of this case in Chan et al. [
20], and the discussion in this paper will focus on the mechanisms relevant to the production of hail.
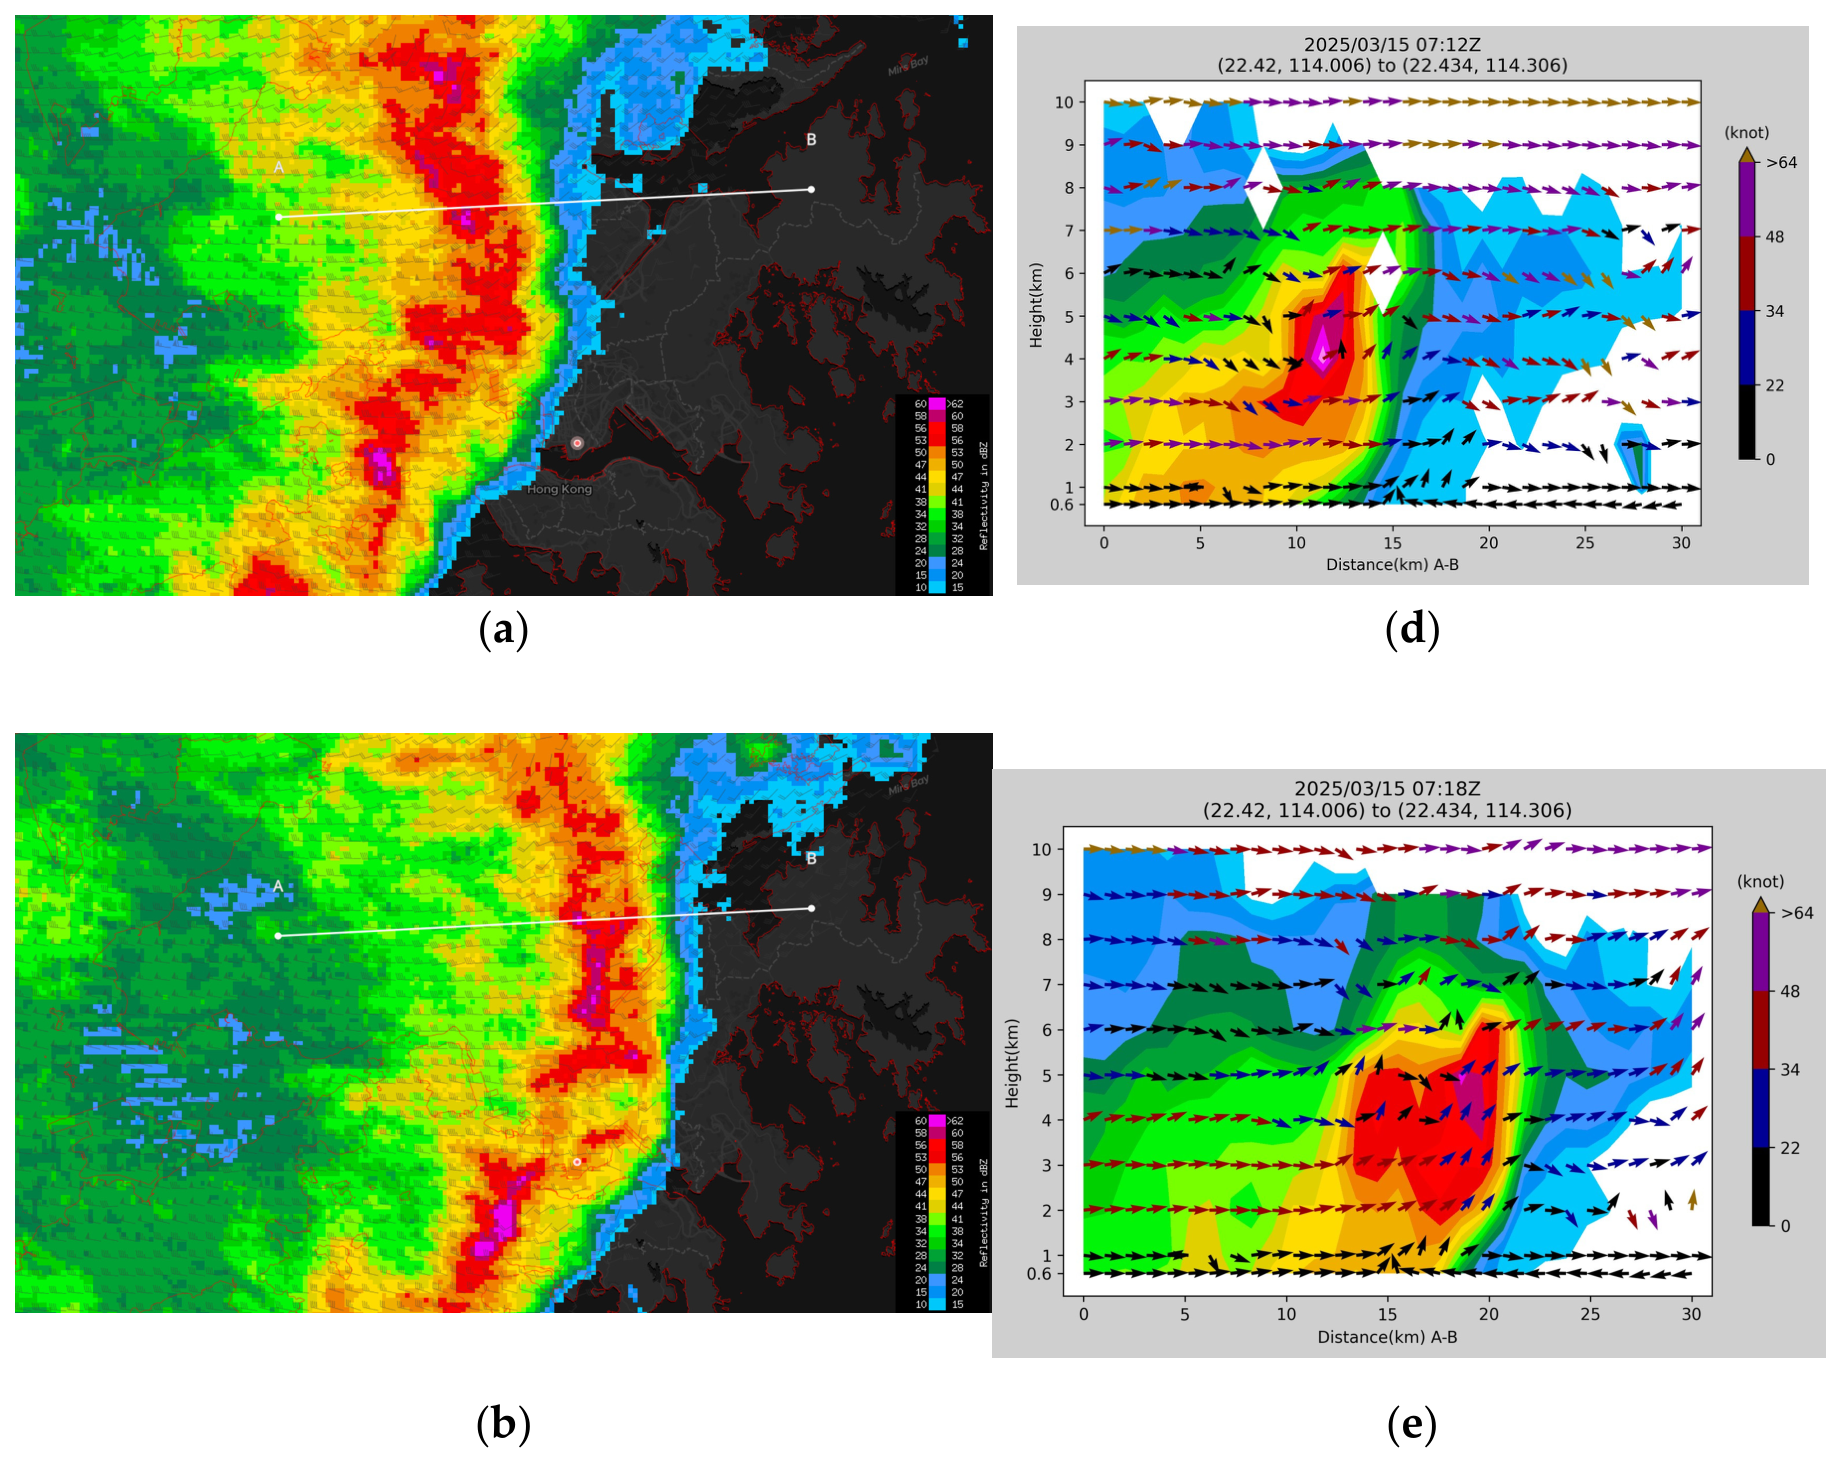
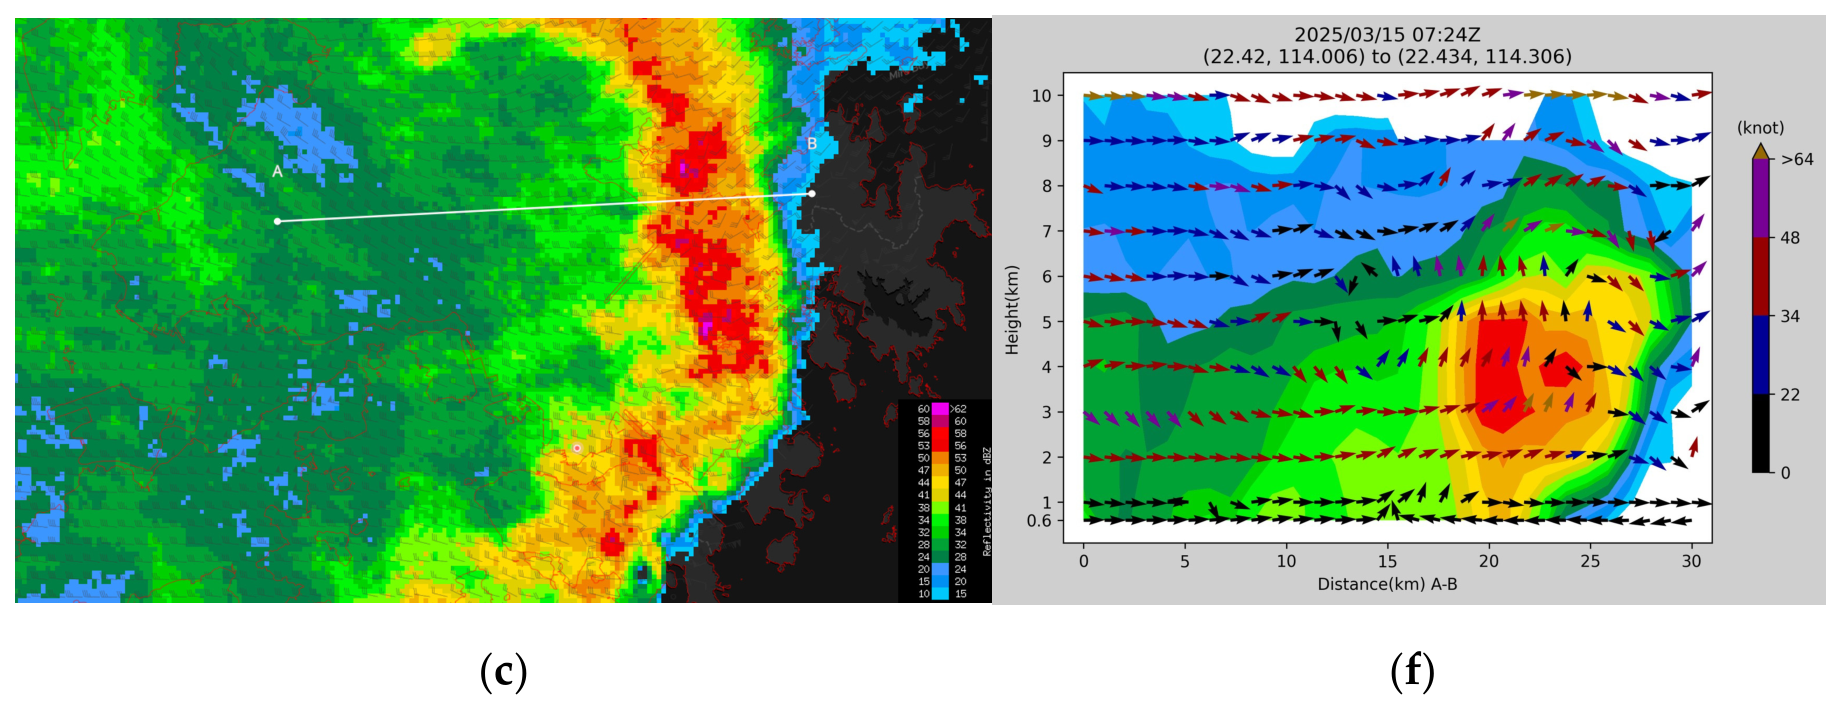
Figure 9 shows the evolution of a squall line at 15:12–24 HKT and a cross section with the horizontal orientation being parallel to the movement of the squall line. The hail report location is around the midpoint of the cross section.
Referring to the echoes at 15:12 HKT in
Figure 9a,b, an overhanging purplish reflectivity core (reflectivity above 60 dBZ) at 4–5 km, with most parts above the freezing level, was observed along the bow echo. From the cross section, the leading edge of the bow was generally upright, with a slight signature of front-tilting, particularly below 2 km; such an alignment maintains the overhanging signature of the intense echo. As westerlies strengthen with height, the upshear and downshear directions would be the west and the east respectively. The RKW88 theory [
39] suggested a balanced circulation induced by the cold pool, and environment shear would constitute an optimal state for updraft of a squall line. The nearly upright structure of the leading edge revealed the circulations are almost balanced in this case. In addition, a rear-inflow jet can be identified at 2–5 km, which could support the updraft and the frontier of the squall line up to 7–8 km [
40], sustaining the bow [
37]. It is also mentioned in the WR04 theory [
41] that maximum vertical velocity increases with shear depth and elevation, and this would induce strong isolated convective cells; the suspected hail-producing echo in this case also took the form of an intense overhanging echo embedded in the bow. The front-tilting at the lower level could be attributed to surface drag, which weakens the cold-pool-induced shear, but the drag can also trigger stronger and more upright new convective cells at the gust front [
42]. In short, the radar features of the squall line corroborate significant updraft in the form of isolated cells, which is consistent with the observations of the updraft along the reflectivity core and the report of hail.
As the squall line moved eastwards at 15:18 HKT and 15:24 HKT in
Figure 9c,d and
Figure 9e,f respectively, the original purplish echo core decayed gradually as the updraft weakened, while another echo to its west intensified along with a strong updraft. Comparing the cross sections at 15:12 HKT and 15:18 HKT, the area of reddish reflectivity (reflectivity of 52–60 dBZ) had a descending trend, likely because the weakened updraft was no longer able to support the hail or heavy hydrometeor. The descending echoes roughly corresponded to the midpoint of the horizontal axis.
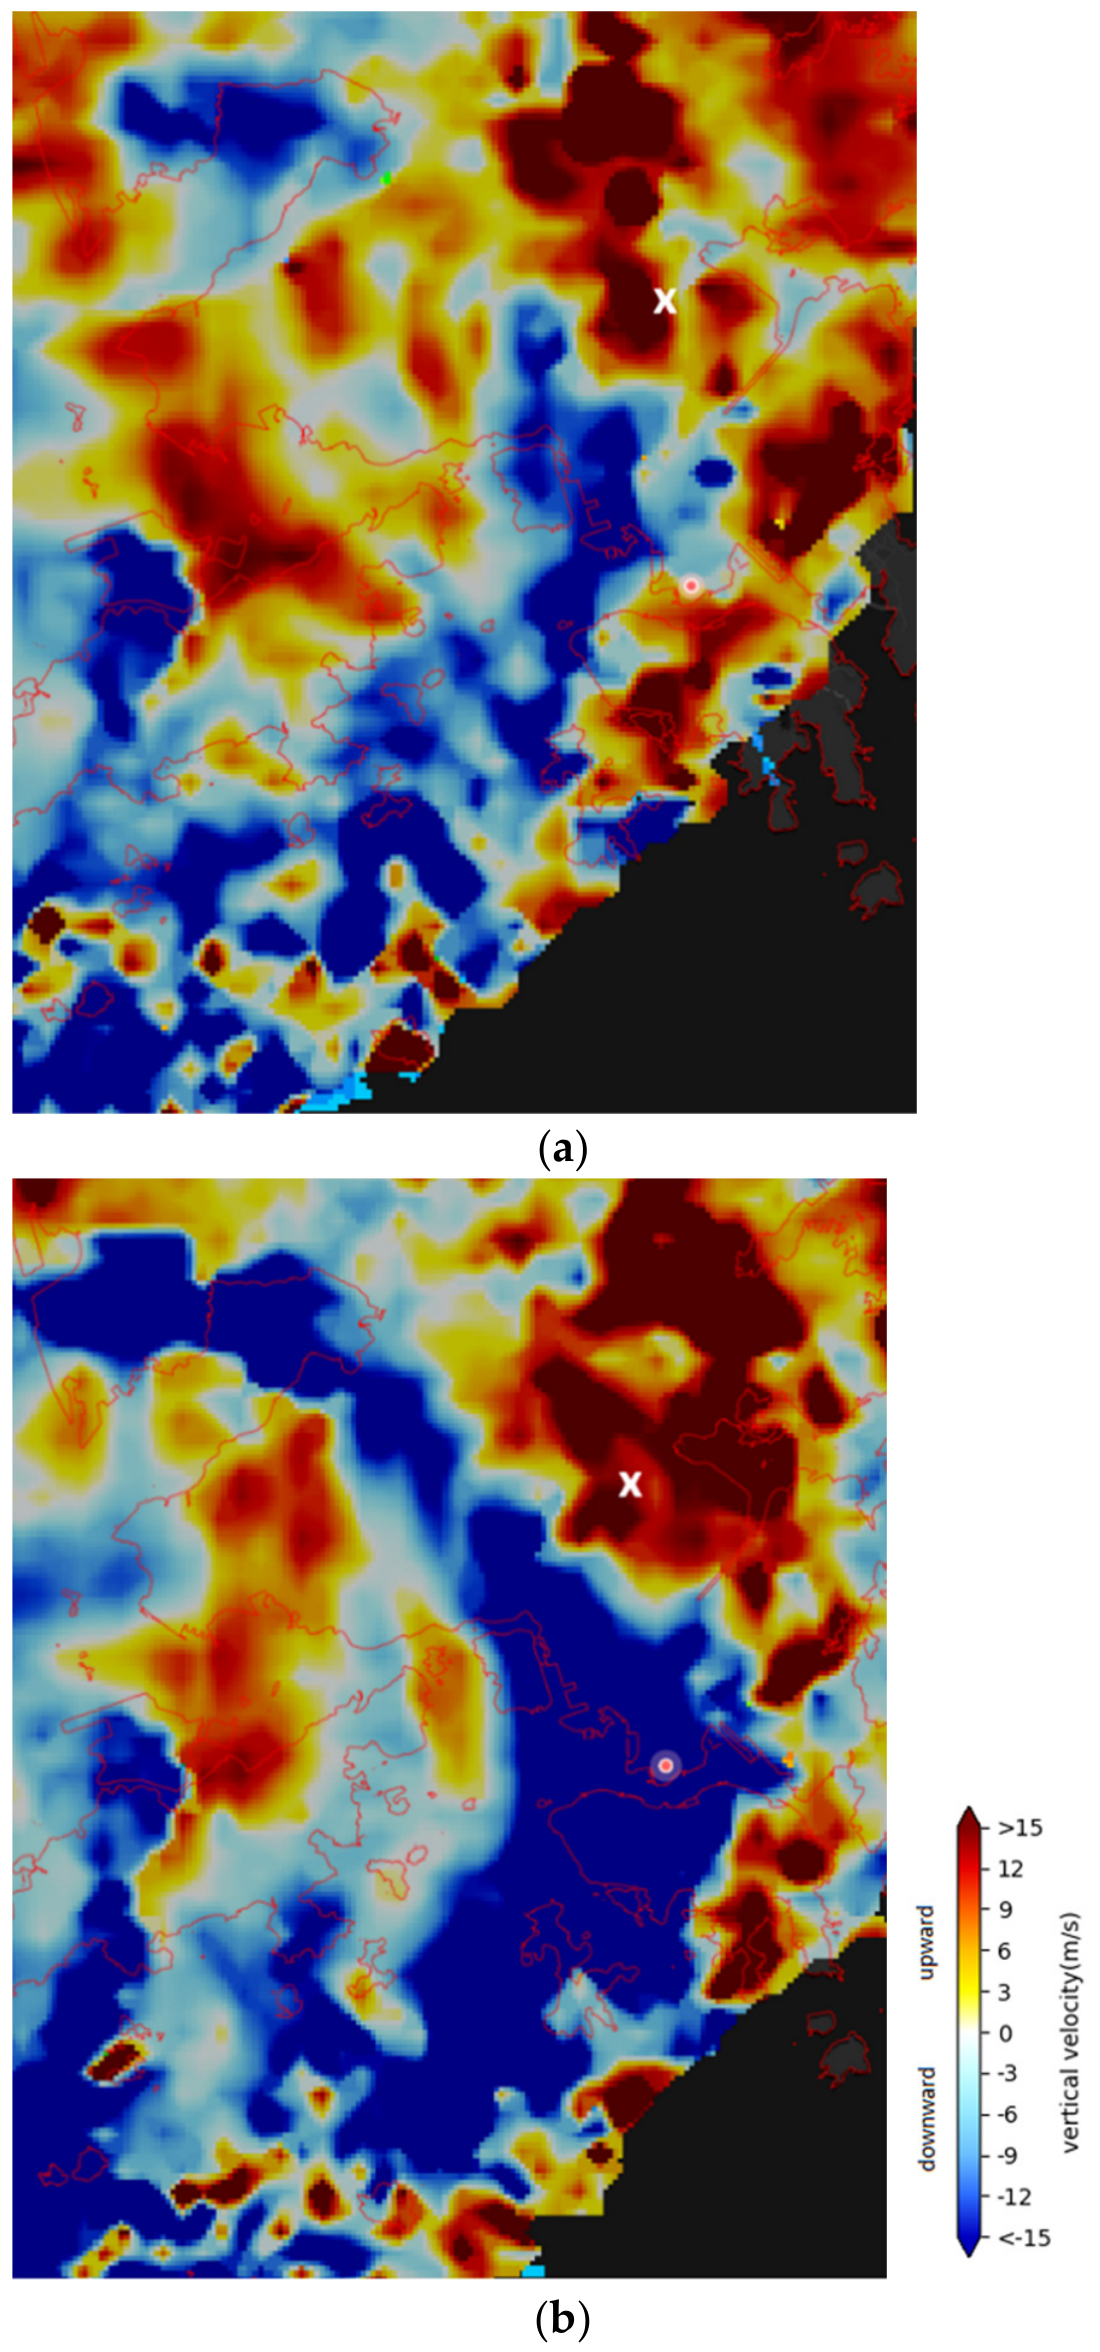
Figure 10 shows the radar-retrieved vertical velocity in the vicinity, and multiple peaks of updrafts above 10 m/s could be seen along the bow echo, while there was a large descending area at its rear. At 15:18 HKT, the hail report location was in between two areas of strong updraft, corresponding to the original purplish echo to its east and the new reddish echo to its west. The weakening of the updraft of the original echo and the gap in between would likely be a window for hailstones to fall. Considering the terminal velocity of a hailstone with a diameter of 5 mm and a drag coefficient of 0.4 as the shape is close to a sphere, the terminal velocity of the hailstone would be about 10 m/s [
43]. If the hailstone fell from the echo core at 4.5 km to the surface, it would take about 7.5 min. The actual falling speed could be affected by both the melting speed of the hailstone aloft and the ambient updraft velocity; still, the order of the estimated falling time agrees with radar and actual observations.
It is also noticed that there was another purplish echo further to the south in
Figure 9a,c, but the echo core was only at around 3 km. The squall line in this case is similar to the north section of a squall line case in South Korea in Swastiko et al. [
44]; however, the rear-tilting in that case shows the cold pool was more dominant.
5. Case 3: Suspected Hail Under Single-Cell Thunderstorm in Hong Kong on 26 August 2025
It is also not uncommon for intense single-cell thunderstorms to be capable of producing hailstones [
45]. During the daytime of 26 August 2025, due to prolonged solar heating, an isolated intense convection developed over the western part of the New Territories of Hong Kong. Radar signatures showed hail may reach the surface at around 07 UTC, but there was a lack of reliable observational reports in this case. Based on King’s Park radiometer data, the CAPE reached 4866 J/kg with a CIN of 0 J/kg at 05 UTC, indicative of possible intense local convective development; however, the wind shear at the low level was rather weak, so the development of convections with rotational features would be less likely.
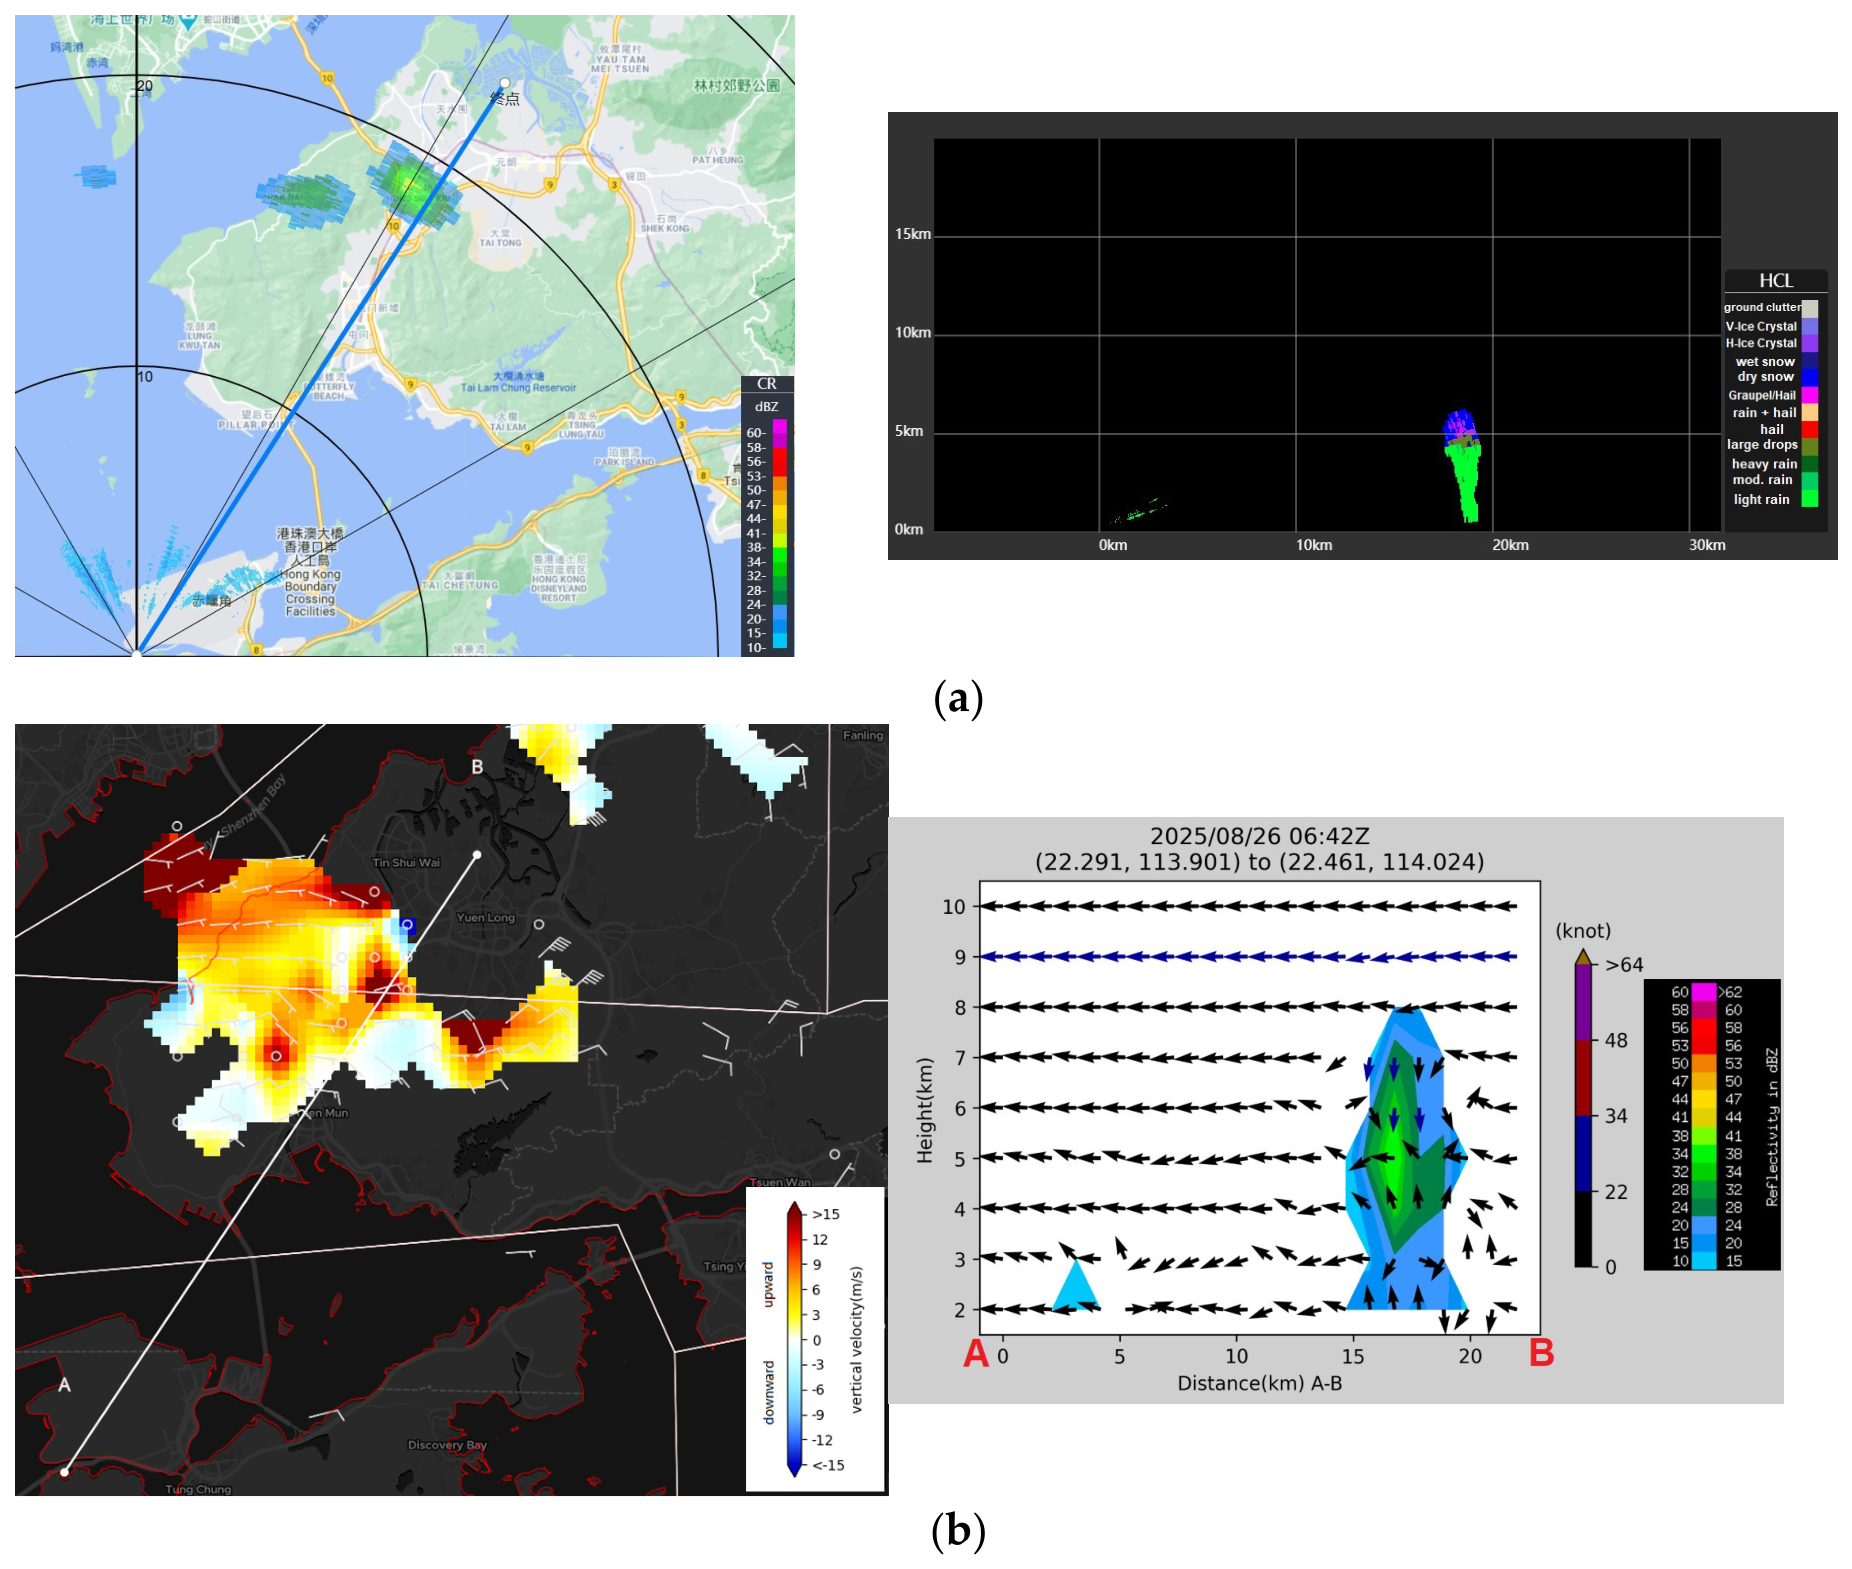
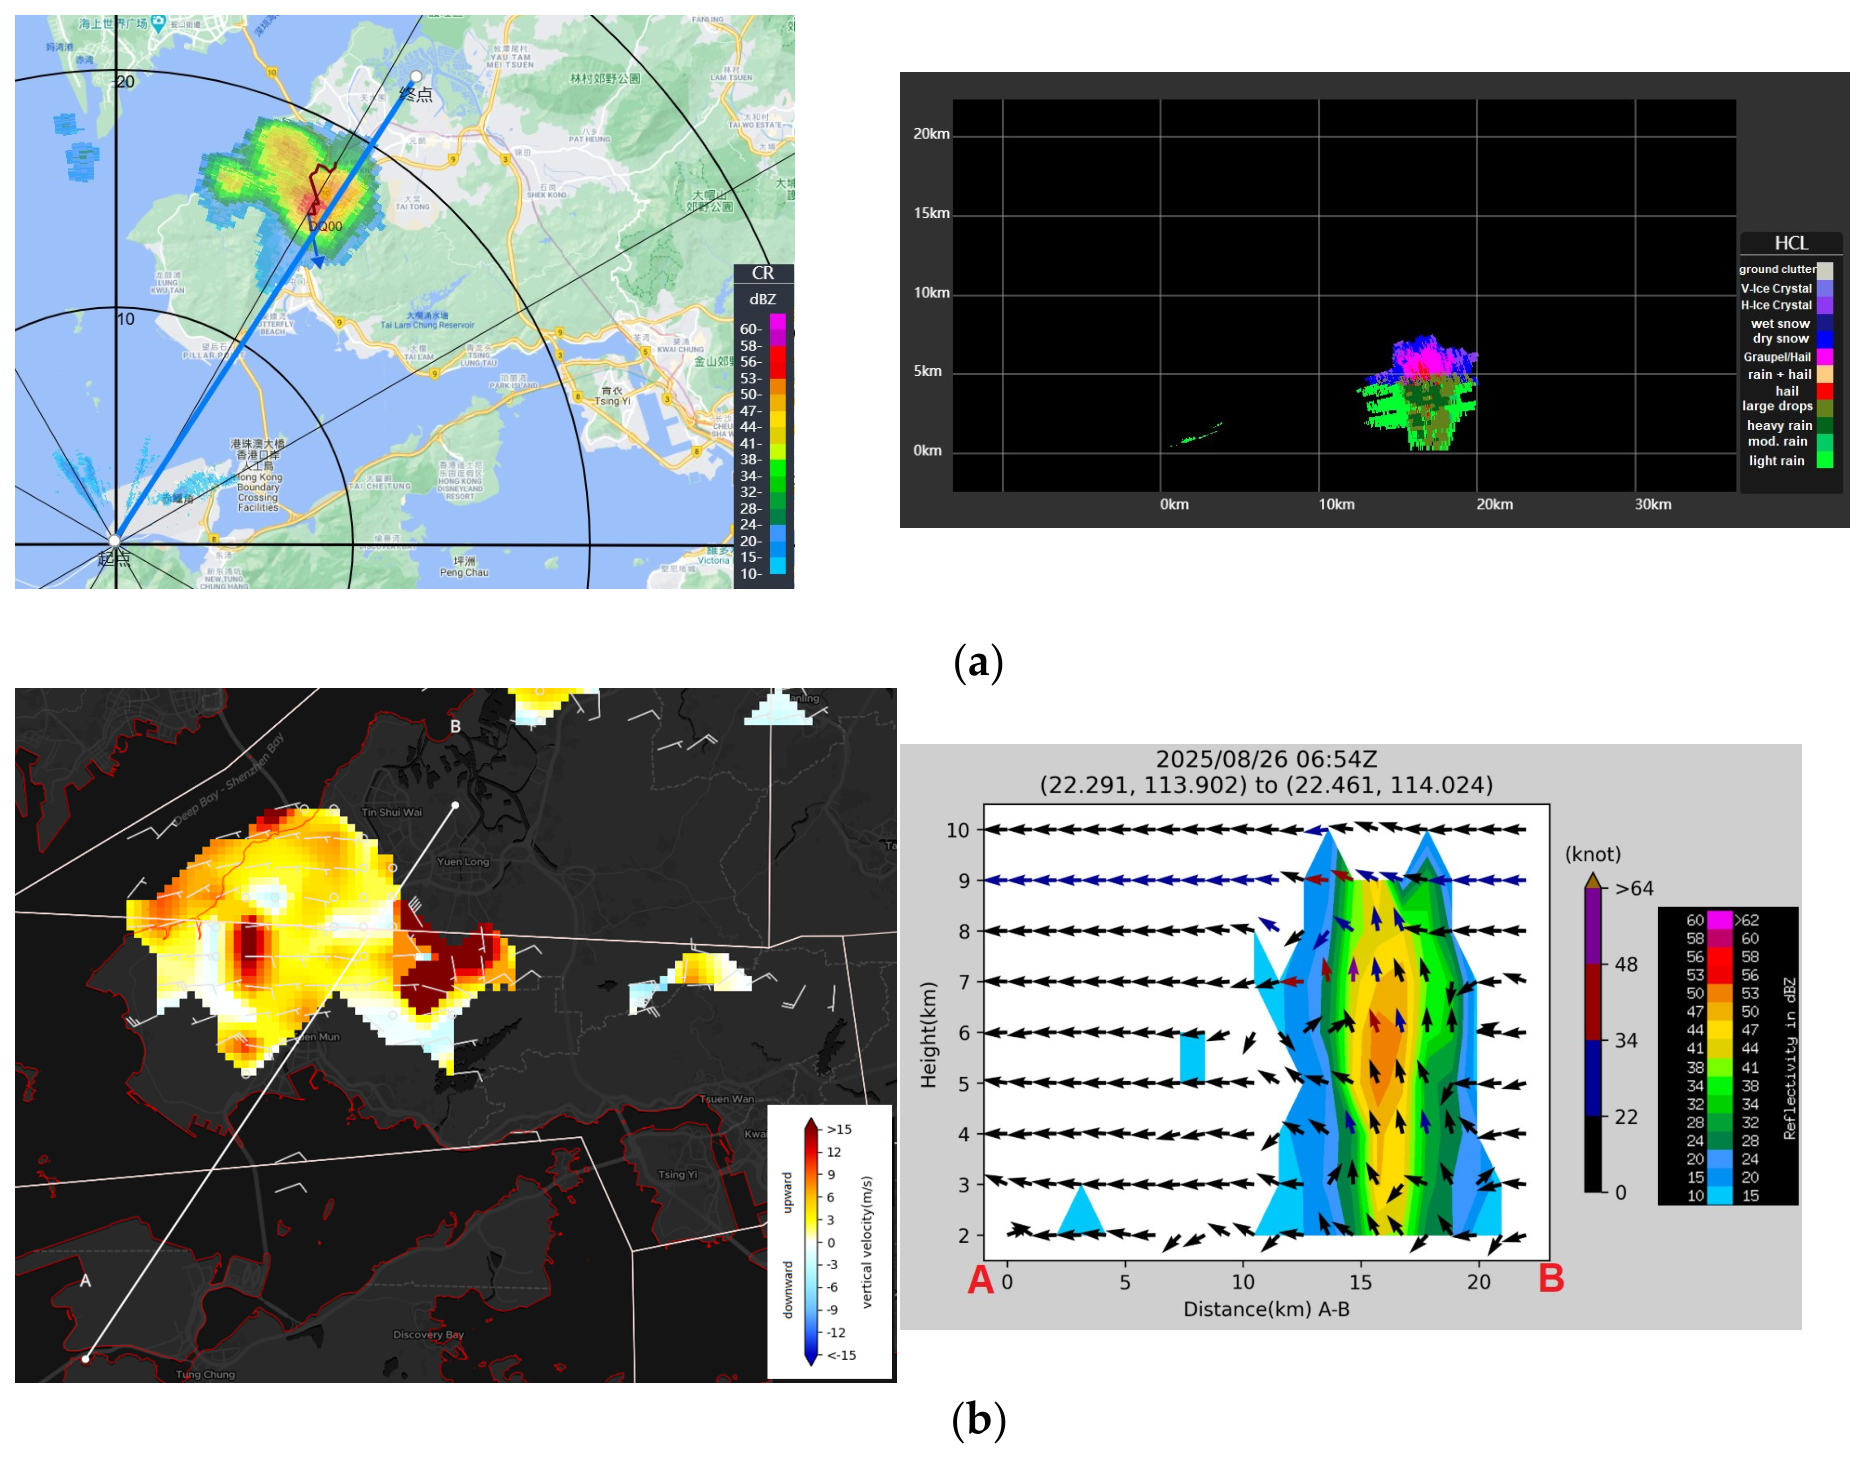
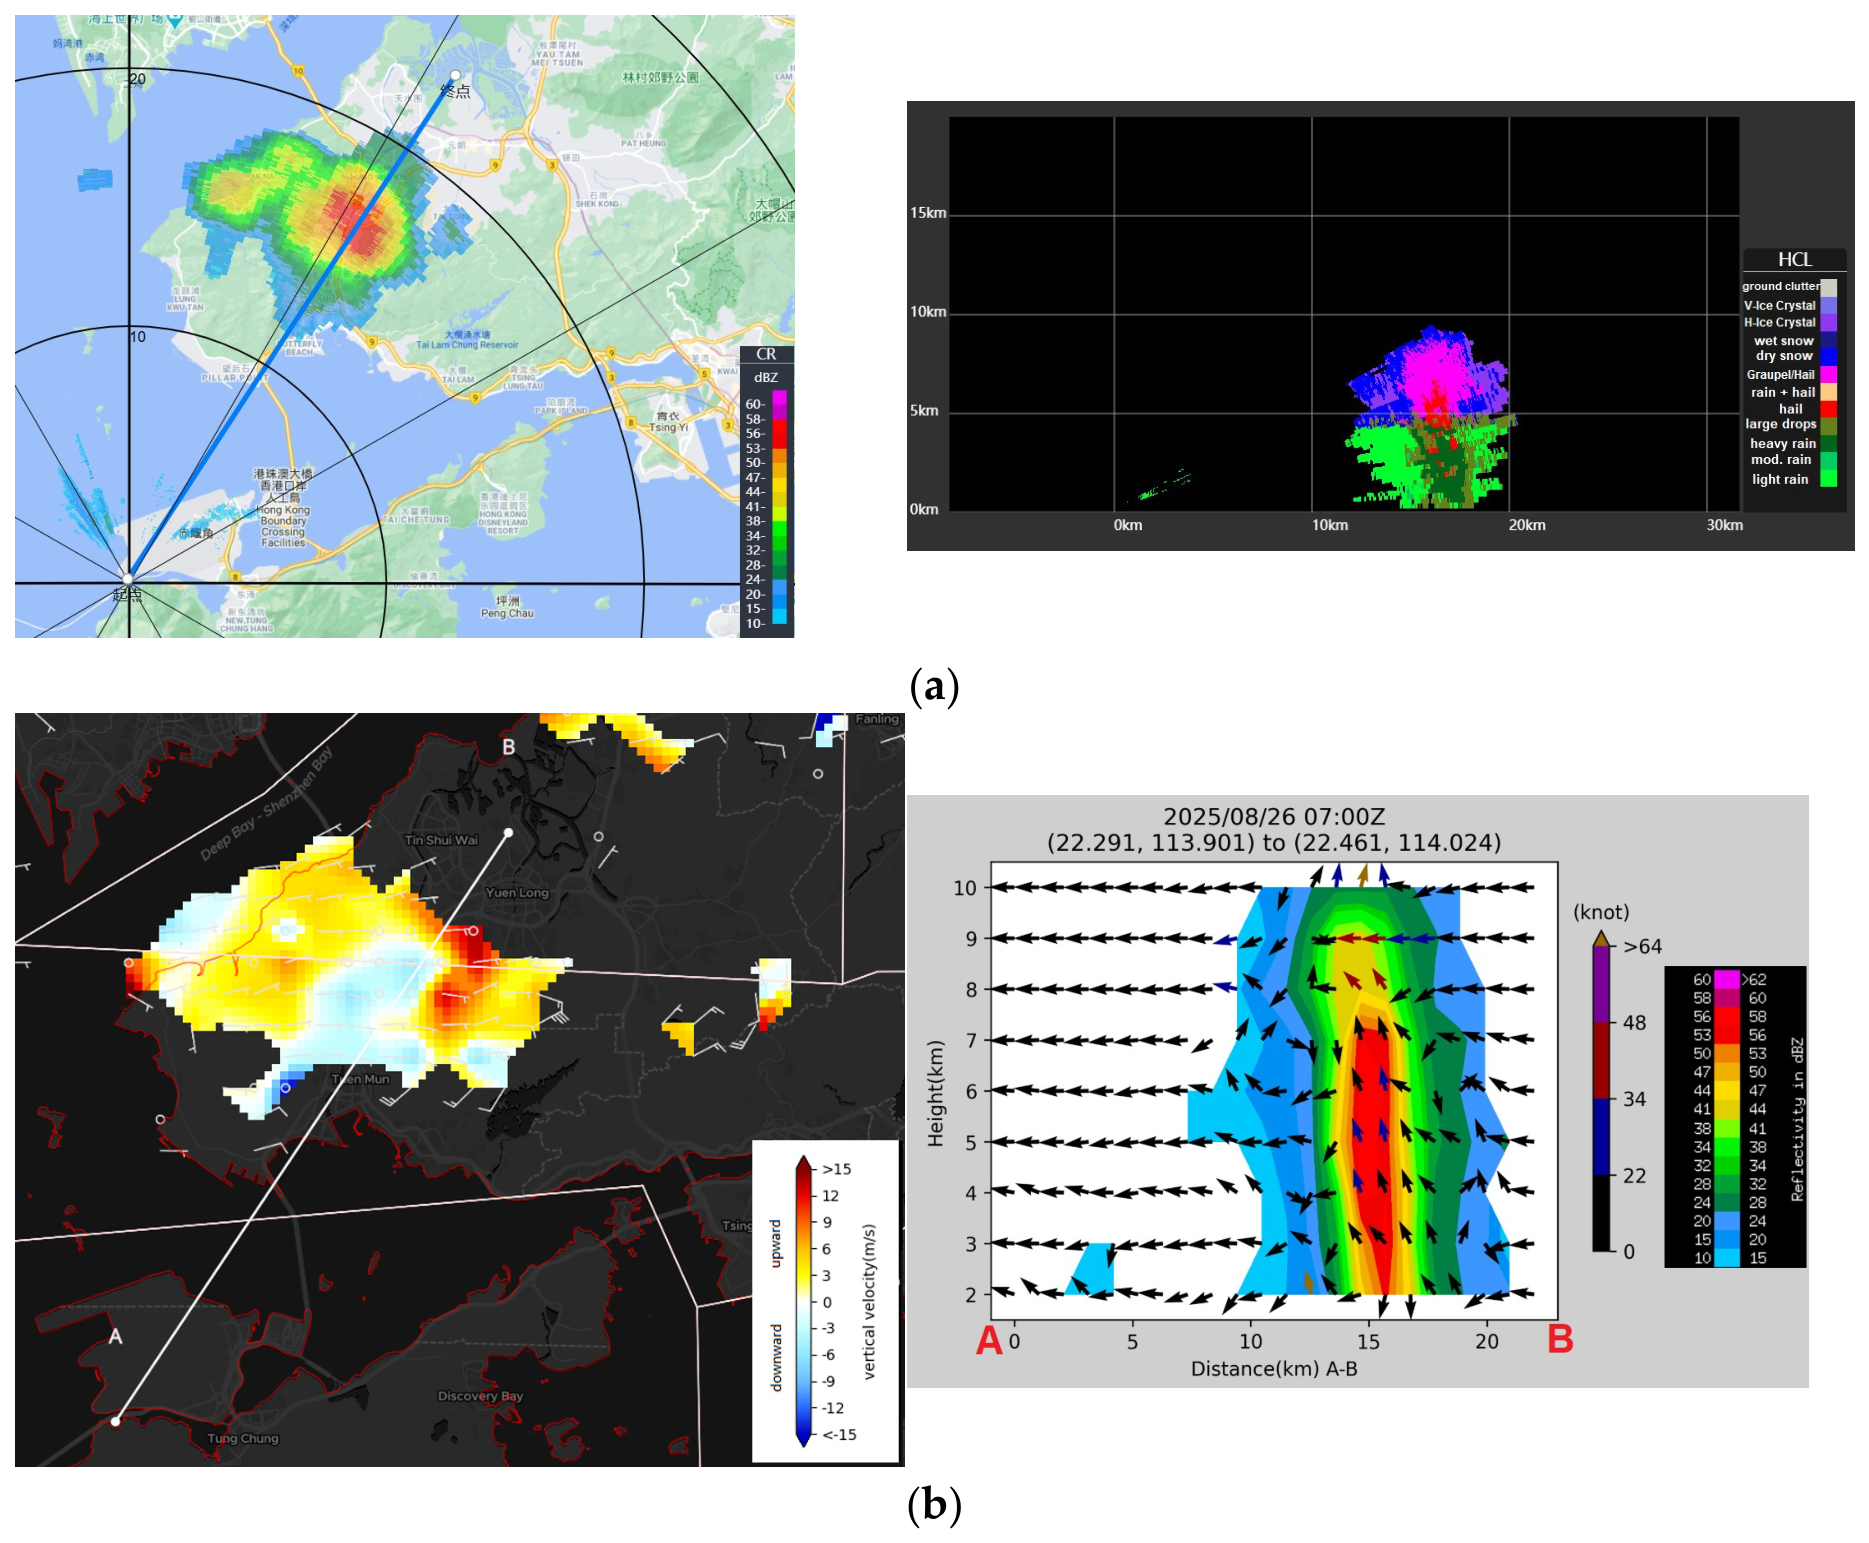
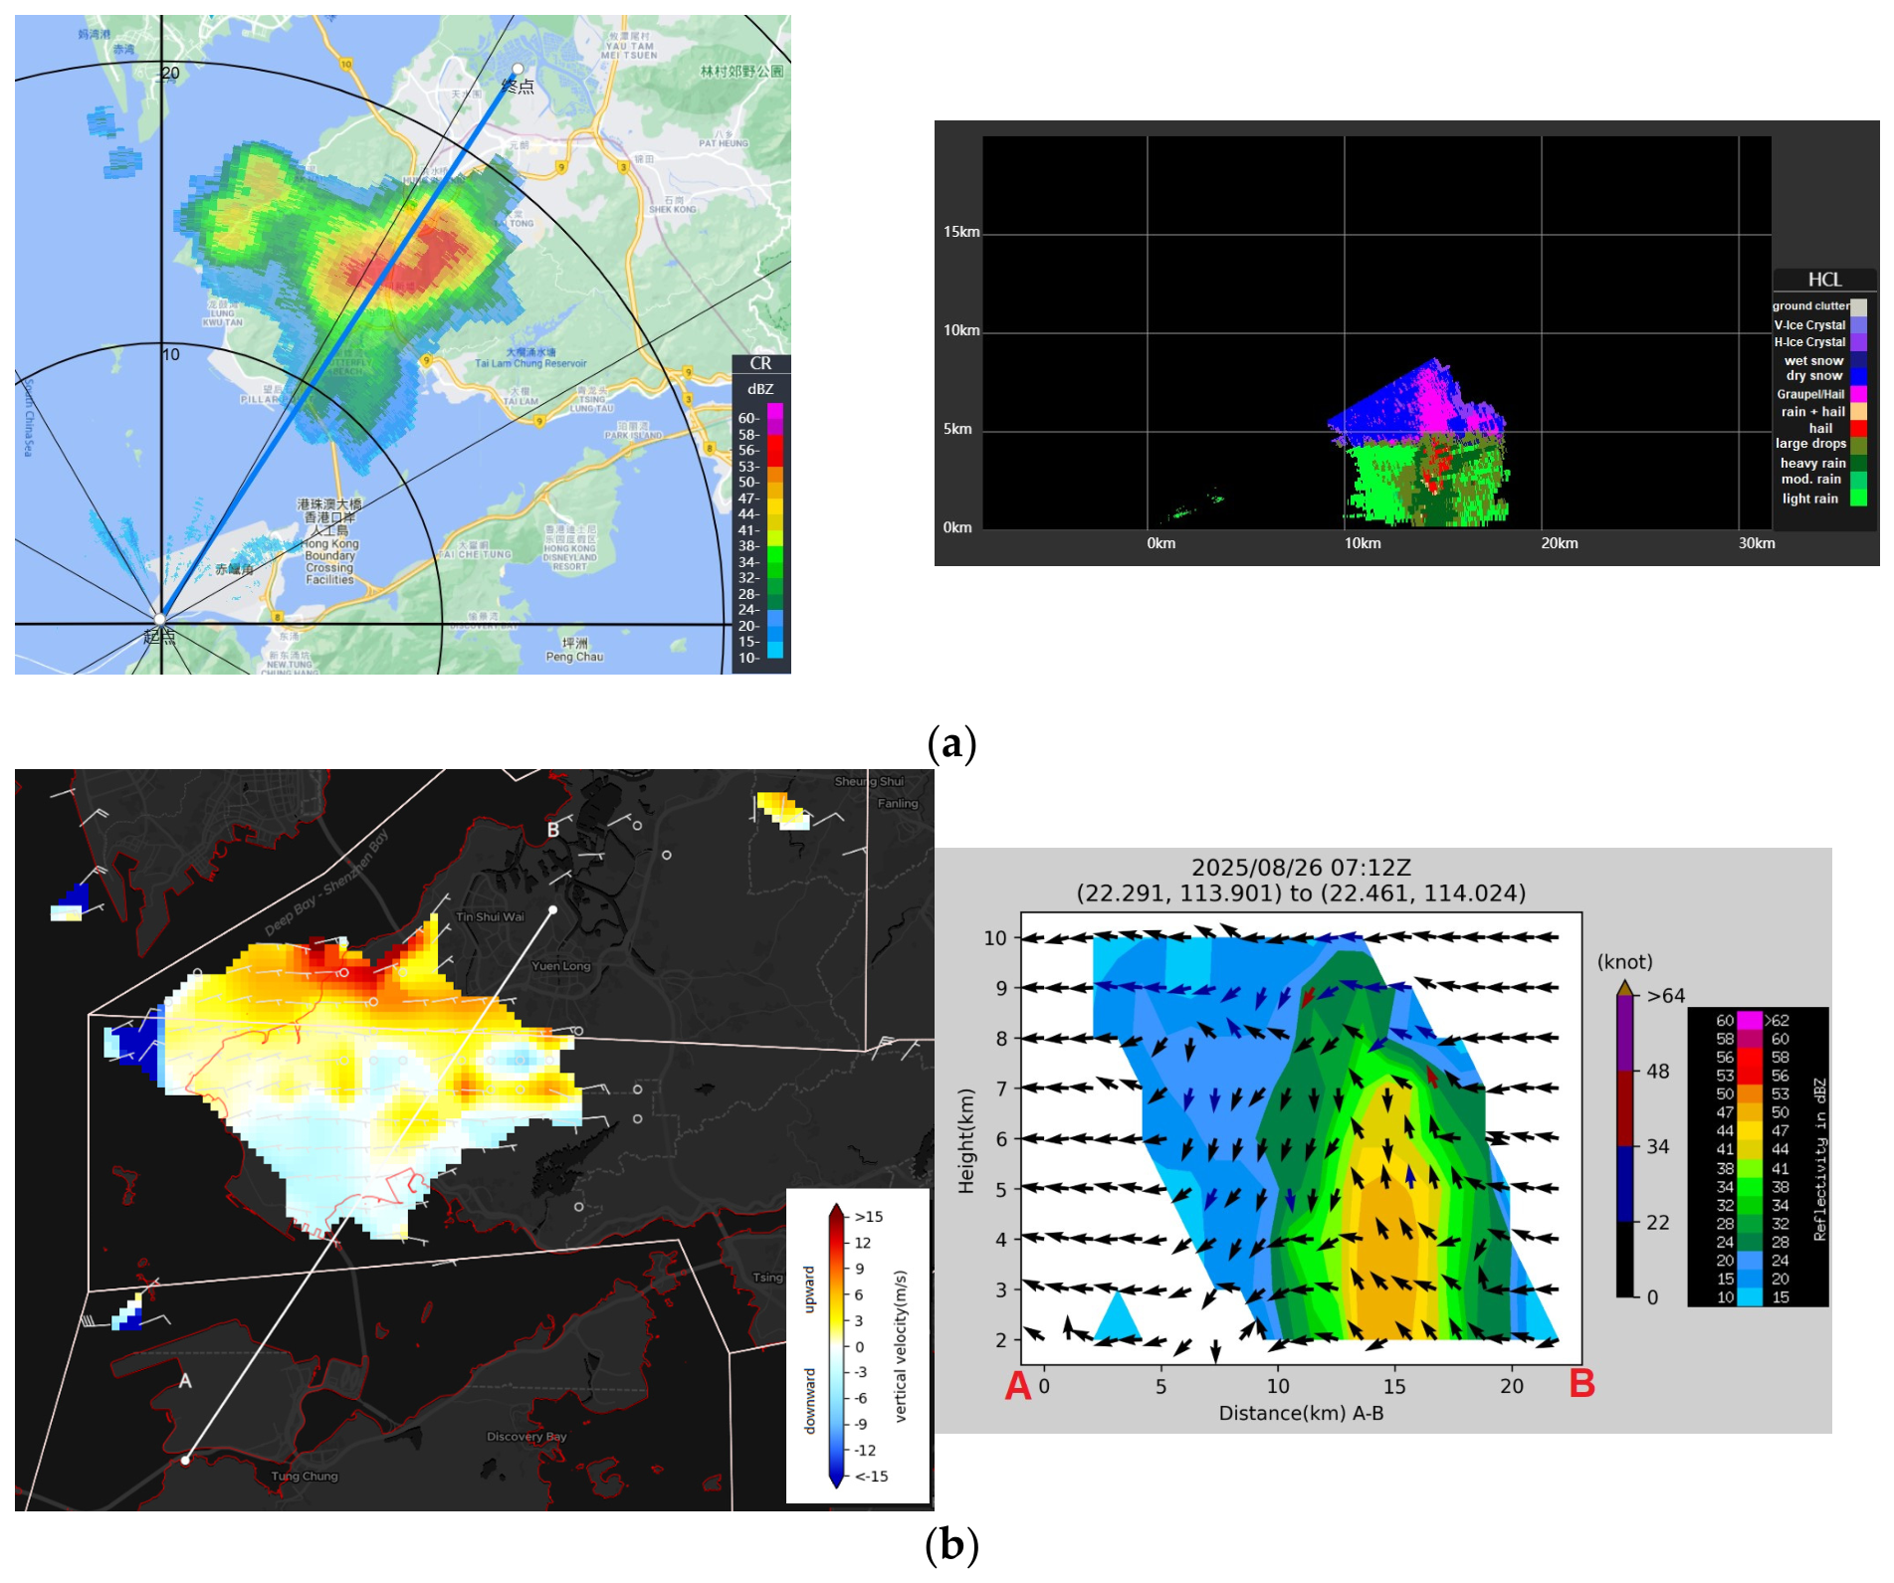
A sequence of the development and weakening and the hailstorm is shown in
Figure 11,
Figure 12,
Figure 13 and
Figure 14. In
Figure 11a, the hydrometeor classification by the dual-polarization X-band radar at SLW is shown, and
Figure 11b is the corresponding retrieved wind field, especially showing the vertical circulation.
Figure 11 is analyzed at 14:42 HKT, the time when the convection just developed and no organized vertical circulation is seen, but the updraft at 2 km exceeded 15 m/s, hinting at the development of the convective cell. In
Figure 12, a strong and almost vertically oriented updraft, up to around 18 m/s, is analyzed 12 min later at 14:54 HKT in the 3-D wind field (
Figure 12b) and hail (colored red) could be identified at a height of about 5 km above ground (
Figure 12a). The radar observation of the freezing level slightly below 5 km is consistent with the radiosonde ascent at 00 UTC, of which the measured freezing level was around 4.9 km. The strong updraft continued in the next time step at 15:00 HKT (
Figure 13b). The height of the updraft increased from about 8 km above ground (
Figure 12b) to more than 10 km above ground (
Figure 13b). At the same time, a downdraft was also present in the western side of the major updraft. From
Figure 13a, there was extensive hail development compared with 6 min ago near the freezing level, and some hail was transported towards the ground. It appears that, while the updraft maintained the intense convection supporting hail development, the downdraft transported the hailstones to the surface. The observations of this case showed the typical requirement of hail growth time of 10 min [
46] and hail growth at −10 °C to −25 °C [
47,
48,
49] could be relaxed. It should be noted that this study infers hail growth conditions qualitatively from the retrieved kinematic structure (updraft magnitude and residence time above the freezing level) rather than through explicit microphysical parameterization or microphysics modeling. A fully quantitative treatment of hail growth and melting rates, coupling the retrieved 3-D wind field with a microphysical growth model, will be explored in the future. The convection weakened afterwards, as shown in the weakening of the updraft (
Figure 14b) and the hail largely descended to a height of about 2 km above ground (
Figure 14a). Some hail might have reached the surface in
Figure 14a. This case shows a typical life cycle of an intense single-cell storm, with a weak shear environment, strong vertical development and a short lifetime.
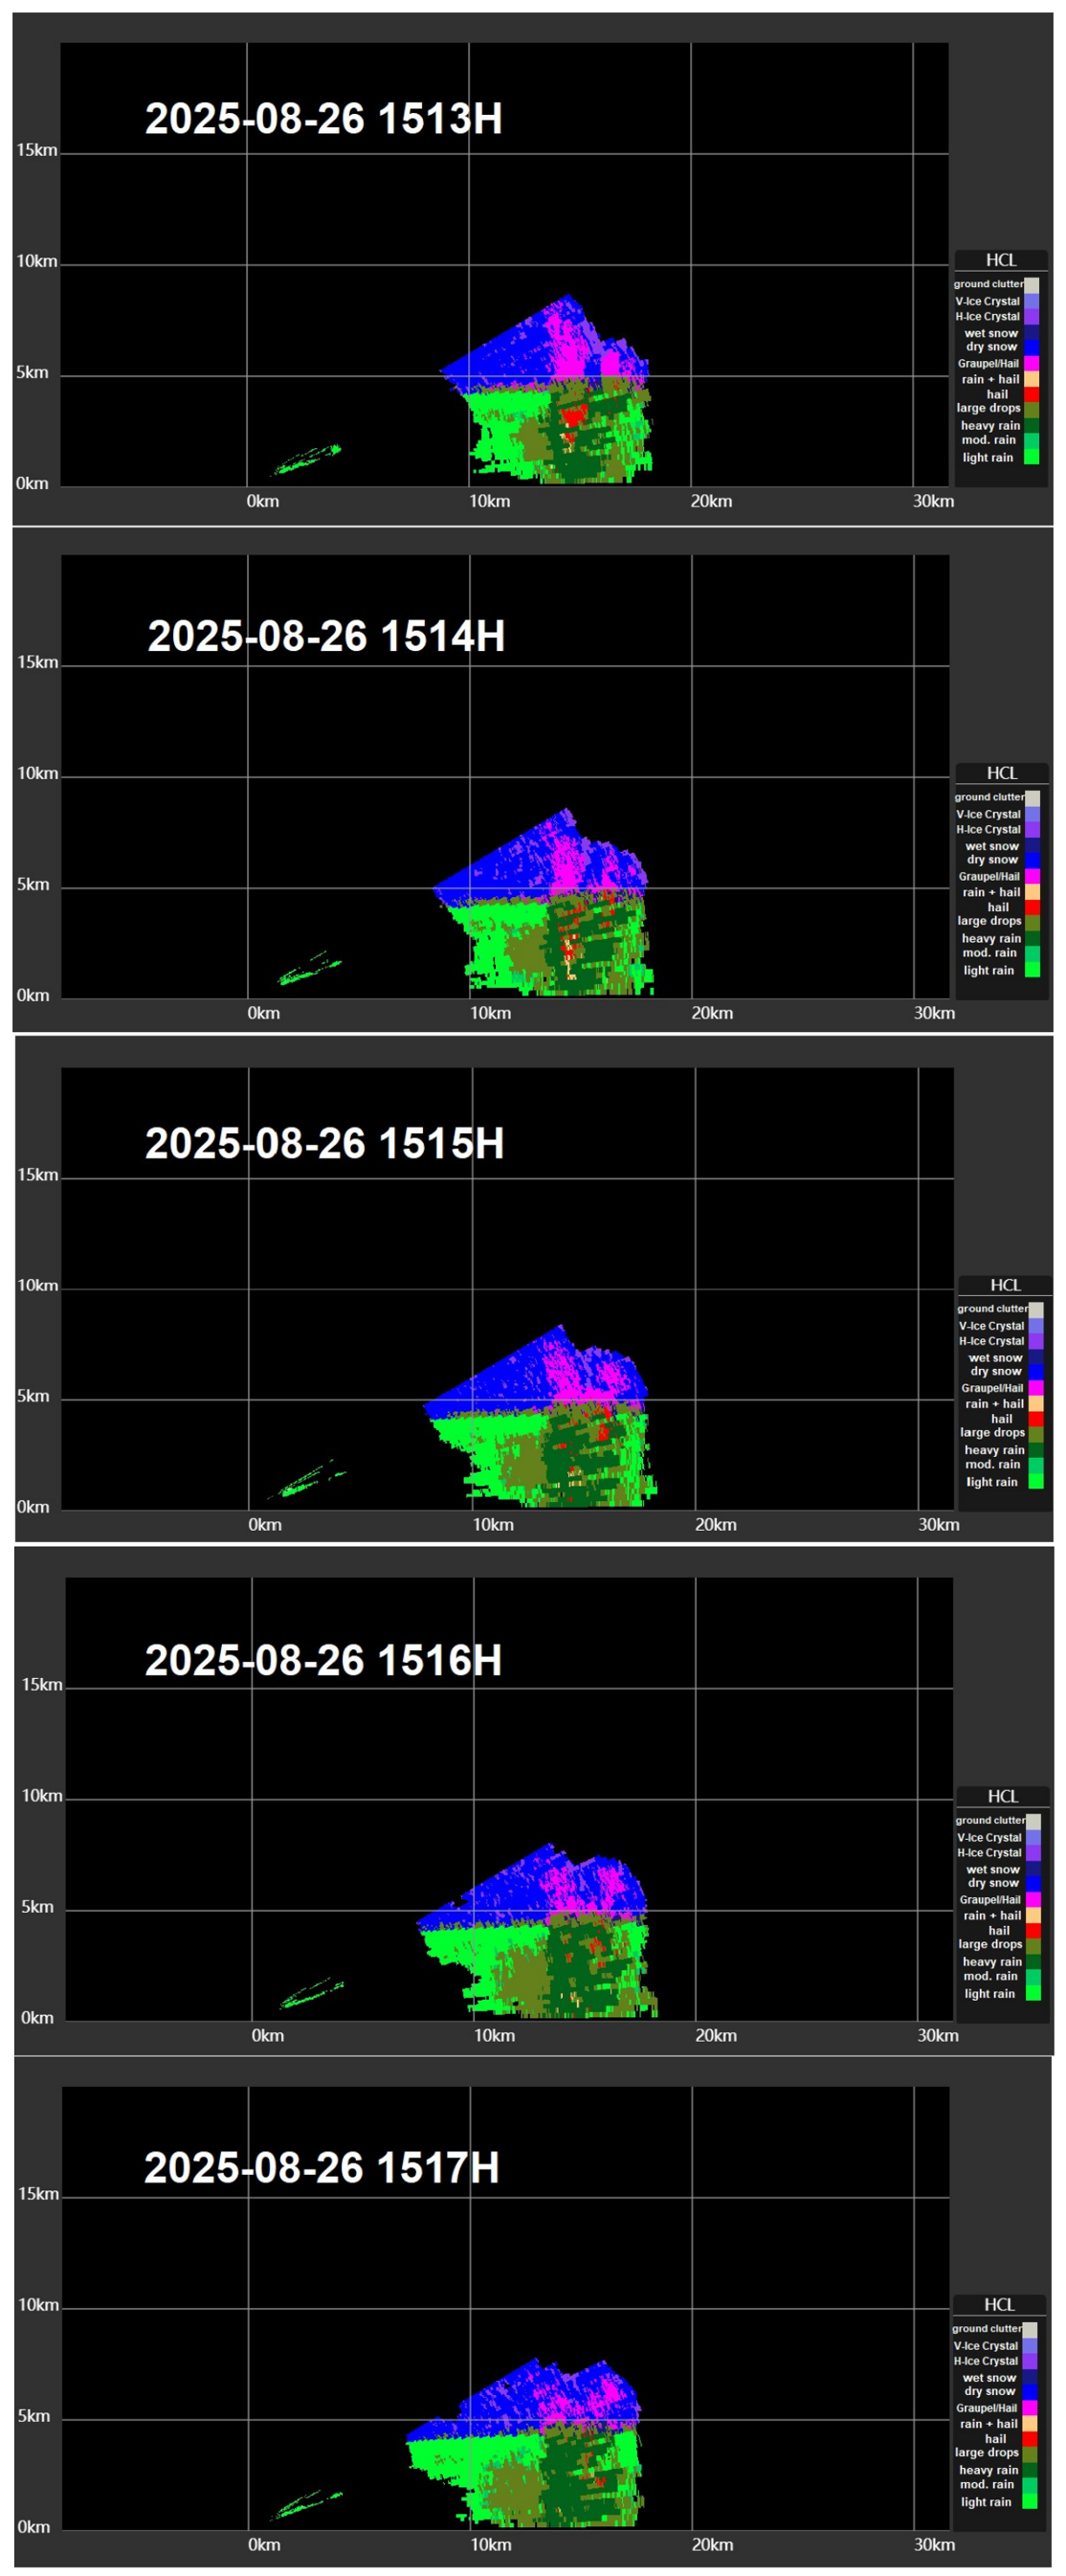
A sequence of the hydrometeor classification of the SLW radar is shown in
Figure 15, with vertical cross sections across the hailstorm. The radar pictures were updated every minute using the volume electronic scanning of this phased-array radar. From 15:13 to 15:14 HKT, the hail (colored red) fell towards the ground. Some isolated hail managed to reach the ground at the times 15:15 and 15:16 HKT. The storm weakened at the following minute (15:17 HKT). The hailstorm evolves rapidly and is well captured by the minute-to-minute update of the phased-array radar. Such details may not be available from the conventional mechanically steering antenna weather radar, which normally requires about 6 min in order to complete one volume scan.
The hydrometeor classification and the 3-D retrieved wind fields are independent observations of the weather radars. Yet they are found to have a high degree of consistency. About the same time, suspected hail was observed by members of the public for this event; although considered less reliable and with no information about hail size, the report seemed to be consistent with both hydrometeor classification and the vertical circulation retrieved from the radars. The 3-D wind field once again provides a unique perspective about the evolution of the hailstorm. However, the present vertical cross sections (in
Figure 11a,
Figure 12a and
Figure 13a for hydrometeor classification and in
Figure 11b,
Figure 12b,
Figure 13b and
Figure 14b for vertical circulations) have to be made manually. It would be desirable to automate the selection of vertical cross-sectional planes and the generation of the vertical cross sections in order to highlight the locations of the hail and the occurrence of the updraft–downdraft couplet to alert the weather forecasters. The main barriers to automation are twofold: first, an objective algorithm is needed to identify the orientation and location of the cross-sectional plane that best captures the storm-relative updraft–downdraft couplet, for example, by applying a vertical velocity gradient threshold to locate the strongest updraft core at each analysis time; second, real-time computational throughput must be sufficient to generate and disseminate such cross sections within the 6 min radar volume-scan cycle to be operationally useful. Addressing both aspects is a planned direction for future work.
6. Comparison of 3-D Wind Field of Convections with Satellite Observation
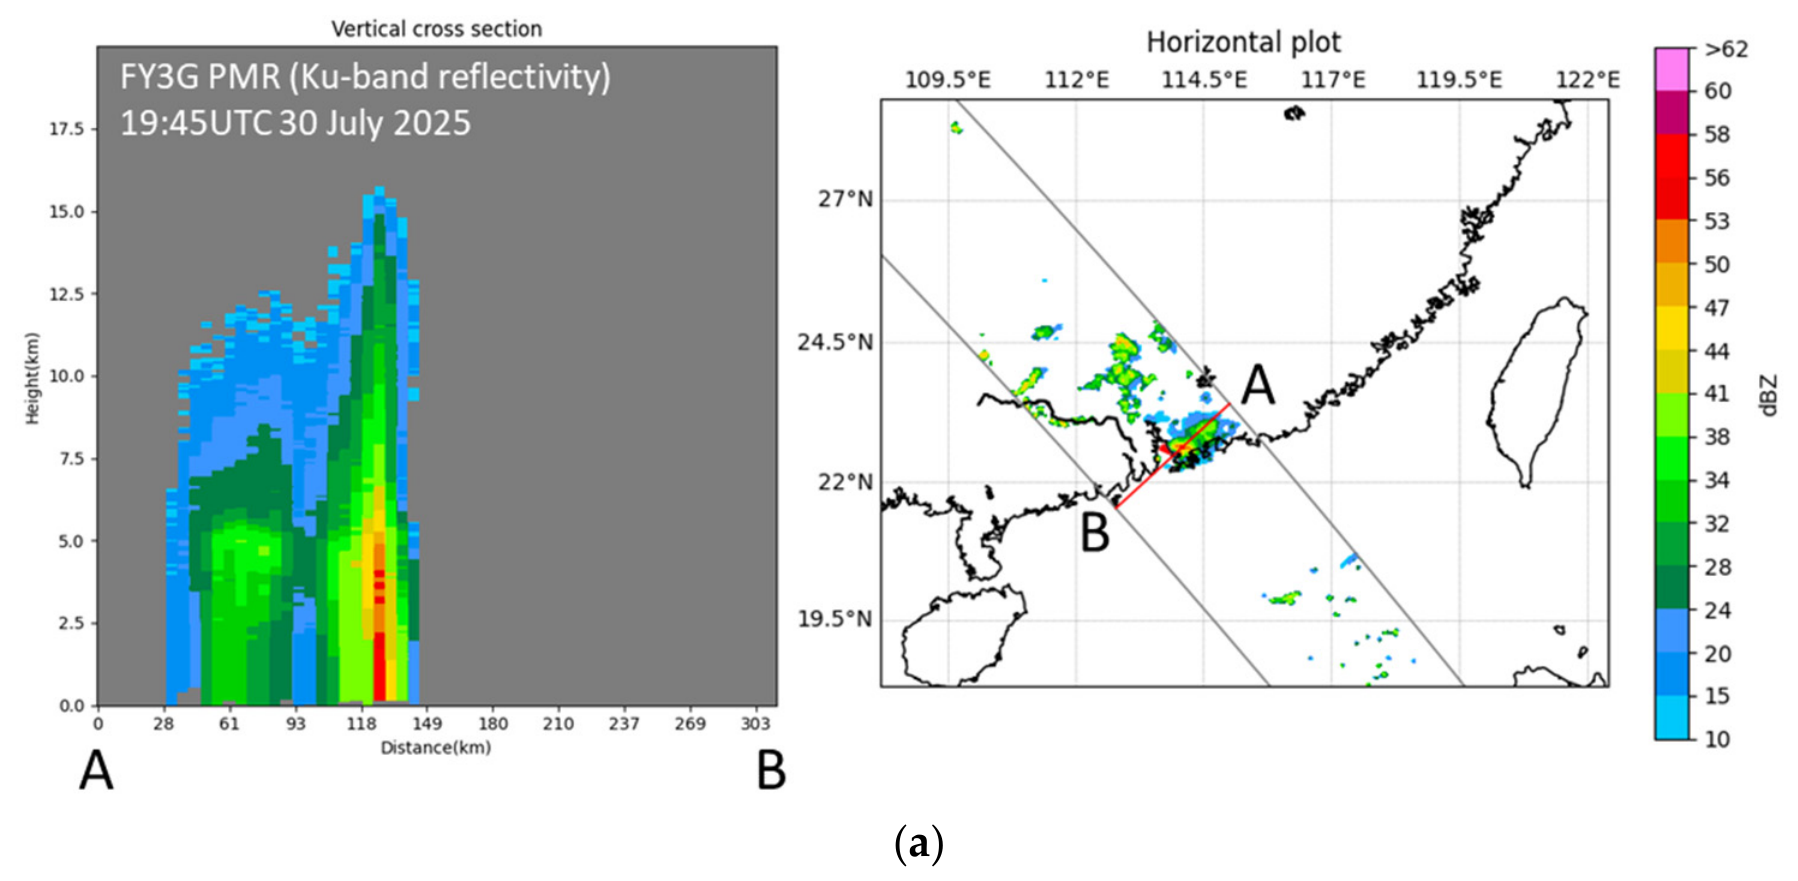
In the period 29 July to 5 August 2025, a number of heavy rainstorms occurred over Hong Kong. Observation of the heavy rain to the north of Hong Kong in the early morning on 31 July 2025 was made using the precipitation measurement radar (PMR) onboard the polar-orbiting satellite Fengyun-3G (FY3G) [
50,
51]. A sample is shown in
Figure 16a, showing the radar reflectivity shoots up vertically to reach 15 km above ground. However, the satellite-borne radar did not measure the vertical velocity to show the vertical circulation pattern.
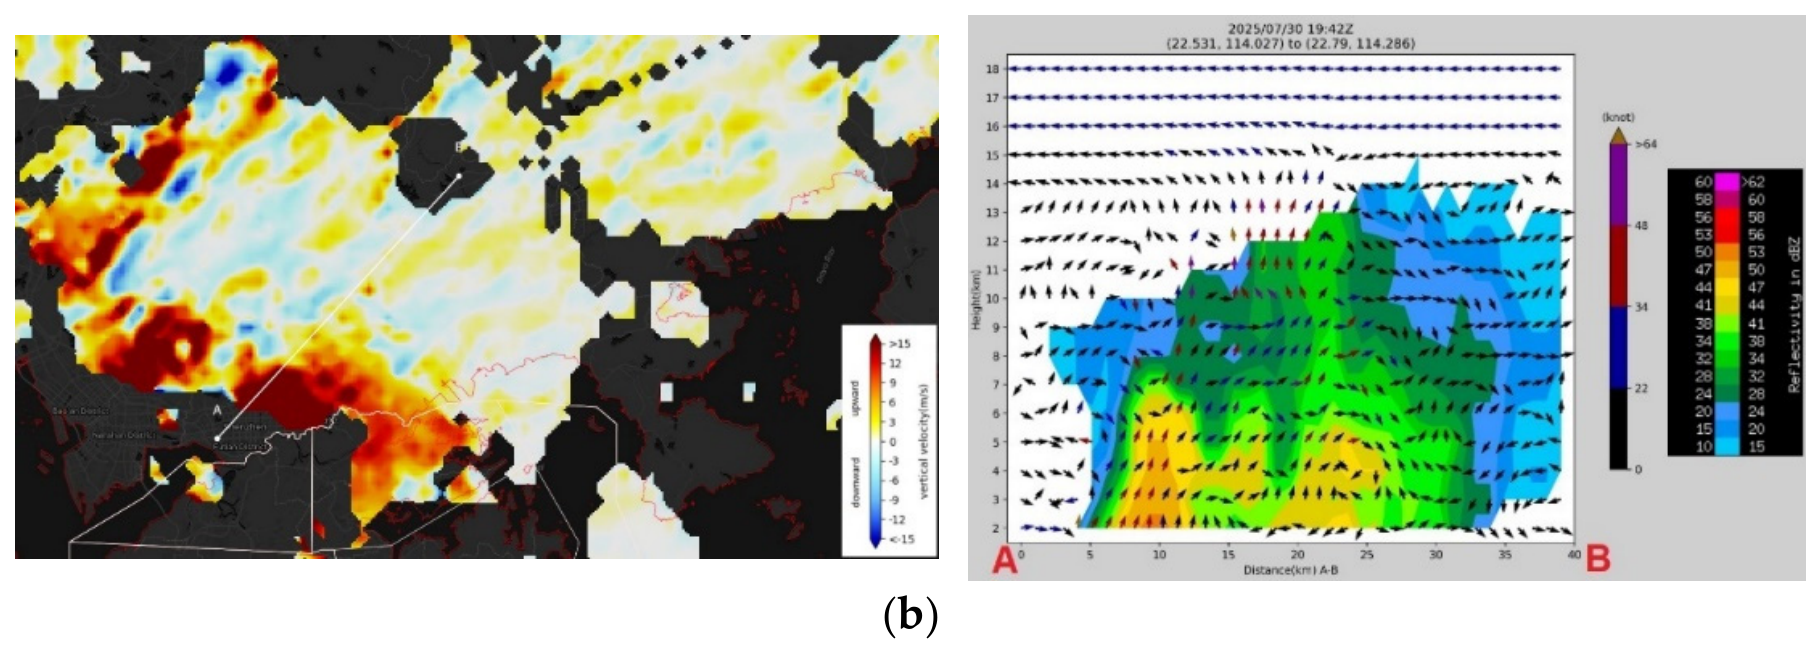
The 3-D wind field retrieved from the weather radars near Hong Kong is shown in
Figure 16b. A special retrieval is made in order to reach a height of 18 km above sea level. The 2 km vertical velocity field shows significant updraft for the weather radar echoes to the north of Hong Kong. From a vertical cross section, the updraft is analyzed to extend to a height of about 15 km above sea level, which is consistent with the satellite observation.
The ground-based weather radar and satellite-borne radar are independent observations. Yet the 3-D wind field retrieved from the former has good consistency with the satellite observation, at least for this particular case.
Ground-based weather radar has a spatial resolution of a few dozen to hundred meters and the order of minutes in temporal resolution, while the satellite-borne radar has a much coarser resolution in the horizontal direction (around 5 km). Due to the nature of a polar-orbiting satellite, a satellite-borne radar only provides a single observation at one instance to the target. Therefore, it is difficult for a satellite-borne radar by nature to capture the mesoscale feature of the convection and track its evolution as compared with the ground-based radars. Nevertheless, it is shown in
Figure 16 that both types of radar are consistent in observing the relatively large-scale structure of convections (extended to a few kilometers in horizontal and vertical directions), including the overshooting echoes above the height of 15 km. In view of the rapidly changing nature of convections, ground-based weather radars will remain the central equipment to weather monitoring and forecasting tools, while satellite-borne radar could serve as a sentinel to monitor the weather over the regions poorly covered by the ground-based radar network, e.g., oceans.
7. Conclusions
Hailstorms are rare over the Pearl River Estuary but can damage crops and properties and cause injuries. During the springtime, when the setting favorable for warm-sector heavy rainfall is accompanied with a strong shear environment and low freezing level, MCSs may develop and some of such MCSs are hail-bearing. This paper analyzes the 3-D wind fields retrieved from a network of five Doppler weather radars using the PyDDA algorithm across three distinct types of hail-bearing convections. The reliability of this retrieval approach is substantiated by independent quantitative validation against wind profiler observations in Lau et al. [
21], lending confidence to the vertical circulation features analyzed in the three hail cases presented in this paper. The analysis would also be helpful to understand the structure of the respective weather systems over southern China, regardless of whether they are hail-producing.
In the supercell case, hail was suspended over the northern flank of the circulation with the strongest updraft, the vertical velocity exceeded 30 m/s at times above the weak echo region, and the most giant hailstones could be attributed to the forward-flank downdraft. For hail observed along the bow echo of a squall line, isolated areas of hail were sustained by a sufficiently strong updraft. Such a strong updraft could be explained by classical conceptual models, with upright vertical orientation and supported by a rear-inflow jet. The continuous development of upright new convective cells could be attributed to surface drag. Regarding the hail-producing single cell in the summer, it could be observed that hail could be generated within a few minutes near the freezing level when the echo is rapidly developing vertically, and the observed vertical velocity of about 18 m/s also confirmed the trend of vertical growth. The deposition of hail observed in the hydrometeor classification of the SLW radar was consistent with the analyzed vertical circulation. The aforementioned 3-D structure of hail-bearing convections could not be inspected with such detail solely with conventional radar observations, and the vertical wind is particularly useful. The 3-D retrieved wind field is also found to be consistent with the observation of a satellite-borne radar as well, for a convective cell with an updraft extending up to 15 km above sea level.
Quantitatively, the three cases spanned a wide range of updraft intensity (10–30+ m/s) and hail size (0.5 cm to 150 mm) yet shared a common structural signature: an elevated reflectivity core suspended between approximately 4 and 10 km, generally straddling the local freezing level, supported by updrafts strong enough to overcome hailstone terminal velocities of roughly 10 m/s for a 5 mm stone. The hail size and the updraft also agreed with previous studies [
52]. Hail deposition to the surface in all three storms coincided with a transition from updraft dominance to downdraft or updraft-gap conditions. A summary of the three cases is given in
Table 1.
The magnitude of the retrieved updraft is sensitive to both the spatial resolution of the contributing radars and the assumptions embedded in the retrieval cost function. The choice to assign zero weight to the smoothness and model constraint terms in this study favors sharper, observation-driven gradients at the possible expense of some noise sensitivity. As such, the absolute updraft values presented should be interpreted as indicative of storm intensity and relative differences between cases rather than as precise point measurements.
The combination of the 3-D retrieved wind field with conventional observations were shown to have the potential to facilitate nowcasting of the development of intense and damaging thunderstorm cells; however, this is still subject to the identification of the storm-relative updraft–downdraft couplet, which is not always clear cut, and the demand of the computational cost would be rather high. The cross-sectional plane for various parameters needs to be selected based on the understanding and experiences on typical structures of various thunderstorm cells and the shear environment. To generalize the results and to apply such information in an operational environment, a larger collection of cases are required, and some automatic rules would have to be established to extract useful information from the vertical velocity pattern in the 3-D wind field. The analysis presented in this paper may also be extended to other weather systems such as rainbands and the hot tower of tropical cyclones to nowcast the associated violent gusts and identify precursors of rapid intensification.