


Abstract
Understanding the factors controlling tropospheric nitrogen dioxide (NO2) variability is essential for improving air-quality assessment and environmental management in tropical regions. This study analyzed the spatial and interannual variability of tropospheric NO2 in ten municipalities of Mato Grosso do Sul, Brazil, located within the Cerrado–Pantanal transition zone, during the period 2020–2024. Tropospheric NO2 column densities were obtained from Sentinel-5P/TROPOMI observations and integrated with environmental and anthropogenic indicators, including fire density derived from the Brazilian National Institute for Space Research (INPE), land-use and land-cover data from MapBiomas, road density, and meteorological variables obtained from CEMTEC-MS. Descriptive statistics, Pearson correlation analysis, and multiple linear regression were applied to evaluate the relationships between NO2 concentrations and the explanatory variables. The results revealed moderate spatial variability of tropospheric NO2, with annual mean column densities ranging from 1.42 × 10⁻⁵ to 1.74 × 10⁻⁵ mol·m−2. Higher concentrations were observed in municipalities characterized by greater urbanization and transport infrastructure, particularly Três Lagoas, Corumbá, and Ladário. Pasture area exhibited the strongest negative association with NO2 concentrations (r = −0.81, p = 0.004), followed by agricultural area (r = −0.67, p = 0.034), whereas fire density showed a moderate positive relationship with NO2 variability (r = 0.62, p = 0.056), highlighting the contribution of biomass burning to regional atmospheric pollution. Meteorological variables, especially precipitation and wind speed, also influenced NO2 distribution through atmospheric removal and dispersion processes. These findings demonstrate that tropospheric NO2 variability in Mato Grosso do Sul is controlled by the combined effects of land use, biomass burning, urban infrastructure, and meteorological conditions. The study provides new insights into the environmental drivers of atmospheric pollution in the Cerrado–Pantanal transition region and contributes to the development of monitoring and air-quality management strategies in tropical environments.
Keywords:
tropospheric NO2; biomass burning; land use; Pantanal; Cerrado; remote sensing; air quality 1. Introduction
Nitrogen dioxide (NO2) is one of the main trace gases present in the troposphere and plays a fundamental role in atmospheric chemistry, air quality degradation, and atmosphere–climate interactions. Its primary emission sources are associated with high-temperature combustion processes, including vehicular traffic, industrial activities, power generation, and biomass burning. After being emitted into the atmosphere, NO2 participates in complex photochemical reactions that contribute to the formation of secondary pollutants, especially tropospheric ozone (O3) and atmospheric aerosols, both of which are associated with adverse impacts on human health, ecosystems, and the Earth’s radiative balance [1,2,3,4]. In addition to acting as a pollutant near the surface, tropospheric ozone also plays an important role as a greenhouse gas in the middle and upper troposphere [5,6,7].
Over recent decades, several regions worldwide have experienced significant increases in surface O3 concentrations, a trend expected to continue throughout the twenty-first century due to changes in atmospheric emissions, climate, and land use, particularly in urban areas [8,9,10,11]. These increases represent a major threat to human health, vegetation, and natural ecosystems, amplifying the environmental and socioeconomic costs associated with air pollution.
Tropospheric O3 is secondarily formed in the atmosphere through photochemical reactions involving carbon monoxide (CO), volatile organic compounds (VOCs), and nitrogen oxides (NOx ≡ NO + NO2) [12,13,14]. Although anthropogenic precursor emissions are the primary driver of surface ozone formation, recent studies have demonstrated that the terrestrial biosphere, land cover, and meteorological conditions exert significant influence on the spatial and temporal variability of tropospheric O3 and NO2 [7,15].
The atmospheric variability of NO2 and O3 is strongly controlled by meteorological factors, including air temperature, solar radiation, precipitation, relative humidity, and wind speed. These variables directly influence atmospheric dispersion mechanisms, dry and wet deposition, regional transport, and the photochemical production of atmospheric oxidants [7,16]. In tropical regions, characterized by strong climatic seasonality, these relationships become even more relevant due to the frequent occurrence of prolonged dry periods, high temperatures, and intense fire activity.
In Brazil, biomass burning represents one of the main sources of NOx, CO, and VOC emissions, significantly influencing atmospheric chemical composition at local and regional scales. Recent studies have shown that the occurrence of fire hotspots in Brazilian biomes is strongly dependent on meteorological conditions, particularly air temperature, precipitation, water deficit, and wind speed [17,18]. The intensification of fires during dry periods favors increases in atmospheric pollutant concentrations and enhances the photochemical production of tropospheric ozone [7].
Vegetation also plays an important role in atmospheric ozone dynamics, acting both as a source and a sink of pollutants. The terrestrial biosphere constitutes an important source of biogenic volatile organic compound (BVOC) emissions, especially isoprene, which may contribute either to O3 formation or removal depending on NOx availability and local atmospheric conditions [19,20]. In addition, vegetation promotes ozone removal through dry deposition via stomatal uptake by leaves, while simultaneously regulating water vapor and energy fluxes between the surface and the atmosphere [21,22,23].
Anthropogenic Land Use and Land Cover Change (LULCC), including agricultural expansion, urbanization, and deforestation, represents an important modifier of atmospheric chemistry and air quality. Previous studies have shown that deforestation and urbanization have globally reduced isoprene emissions by 15–22%, while also significantly decreasing ozone dry deposition, resulting in regional changes in surface O3 concentrations of approximately ±10 ppb [15]. These changes are particularly important in tropical regions undergoing rapid agricultural expansion and intense landscape transformation.
In Central-Western Brazil, especially in the state of Mato Grosso do Sul, the coexistence of the Cerrado and Pantanal biomes creates a complex environmental dynamic marked by the interaction between agricultural expansion, recurrent fires, climatic variability, and land-use change. Recent studies conducted in the region have highlighted significant spatiotemporal variability in atmospheric ozone and its relationship with meteorological and environmental factors [23,24,25]. Furthermore, analyses conducted in Brasília demonstrated that dry and fire periods are associated with increased concentrations of ozone and other atmospheric pollutants, highlighting the role of climatic seasonality in air quality dynamics [26].
Recent studies have also demonstrated the potential of advanced statistical techniques and artificial intelligence in the analysis and prediction of atmospheric ozone variability. LSTM neural networks applied to O3 concentration forecasting have shown satisfactory performance in representing the temporal dynamics of the pollutant [26]. Similarly, studies on global solar radiation and atmospheric variability have contributed to a better understanding of the meteorological processes associated with the photochemical formation of atmospheric pollutants in Brazil [27].
Given this context, understanding the combined influence of biomass burning, land-use change, and meteorological conditions on tropospheric NO2 variability becomes essential for improving environmental monitoring strategies and air quality management in tropical regions. Despite the increasing availability of atmospheric products derived from remote sensing, studies integrating meteorological variables, fires, and land use to explain the spatial and interannual dynamics of NO2 in Central-Western Brazil, especially in the Cerrado–Pantanal transition region, remain limited.
The novelty of this study lies in the integration of satellite-derived tropospheric NO2 observations, fire occurrence, land-use indicators, road infrastructure, and meteorological controls within a single analytical framework applied to municipalities located in the Cerrado–Pantanal transition zone.
Therefore, the present study aims to analyze the spatial and interannual variability of tropospheric NO2 concentrations in municipalities of Mato Grosso do Sul, Brazil, during the period 2020–2024, as well as to evaluate the relative influence of biomass burning, land use and land cover, road infrastructure, and meteorological conditions on the observed patterns of atmospheric pollution.
2. Materials and Methods
2.1. Area of Study
The study area comprises ten municipalities located in the state of Mato Grosso do Sul, distributed between the Cerrado and Pantanal biomes. The region presents marked contrasts in terms of land cover, population density, infrastructure and hydrological dynamics.
The spatial distribution of the municipalities, the main rivers and highways crossing the study area, and the conceptual framework linking land use, biomass burning, road infrastructure, meteorological conditions, and tropospheric NO2 variability are summarized in Figure 1, Table 1.
Figure 1.
Location of the ten municipalities of Mato Grosso do Sul, Brazil.
Table 1.
Geographic coordinates and altitude of the municipalities analyzed in Mato Grosso do Sul, Brazil [28,29,30].
2.2. NO2 Data and Fire Foci
Average tropospheric NO2 column densities were derived from Sentinel-5P/TROPOMI Level-2 products provided by the European Space Agency (ESA, Paris, France) through the Copernicus Data Space Ecosystem (https://dataspace.copernicus.eu/, accessed 15 June 2026). Data were filtered using the quality assurance criterion (qa_value > 0.75) recommended for tropospheric NO2 retrievals [29,30,31].
Average tropospheric NO2 column densities were derived from Sentinel-5P/TROPOMI Level-2 products for the period 2020–2024. Data were filtered using the quality assurance criterion recommended for tropospheric NO2 retrievals (p_value > 0.75). Only valid satellite observations covering the municipalities included in the study were considered.
Tropospheric NO2 column densities were spatially aggregated within the municipal boundaries of the ten municipalities analyzed in Mato Grosso do Sul. For each municipality and year, annual mean values were calculated from all valid observations available during the study period. This procedure minimized the influence of short-term fluctuations associated with meteorological variability and emphasized the spatial and interannual patterns of tropospheric NO2 across the study area.
The use of annual averages is particularly suitable for regional-scale analyses because it reduces the influence of episodic atmospheric events and provides a more robust representation of long-term emission patterns associated with land use, biomass burning, urbanization, transport infrastructure, and meteorological controls.
Tropospheric NO2 column densities are expressed in units of 10−5 mol·m−2.
2.3. Land Use, Infrastructure and Meteorological Variables
The explanatory variables related to land use and land cover were obtained from the MapBiomas Project, São Paulo, Brazil (https://mapbiomas.org/, accessed 15 June 2026), reference [32] which provides annual land-use and land-cover maps for the entire Brazilian territory based on Landsat imagery and a standardized classification methodology.
Agricultural area (%) corresponded to the sum of temporary and permanent crop classes, while pasture (%) included areas predominantly occupied by extensive livestock production. Urban area (%) represented built-up surfaces and infrastructure associated with urban land use. These variables were included as proxies for different degrees of human occupation and potential emission sources or modulators of atmospheric pollutants, particularly nitrogen oxides.
Road infrastructure was represented by road density (km·km−2), calculated as the ratio between the total length of the road network and the territorial area of each municipality. This indicator was used to represent the intensity of transport infrastructure and potential vehicular emission sources, since road traffic is widely recognized as an important contributor to NOx emissions and tropospheric NO2 variability. However, because road density depends on municipal area, it was interpreted with caution, especially in municipalities with large territorial extensions, where important transportation corridors may coexist with low road density values.
The meteorological variables were obtained from the Center for Weather, Climate and Water Resources Monitoring of Mato Grosso do Sul (CEMTEC-MS), Campo Grande, MS, Brazil (https://www.cemtec.ms.gov.br/, accessed 15 June 2026) [31], the official agency responsible for climate and hydrometeorological monitoring in the state. Annual averages of precipitation (mm), temperature (°C), and wind speed (km·h−1) were considered for the period from 2020 to 2024. Precipitation was included because of its role in wet pollutant removal processes; temperature was considered because of its influence on photochemical reactions, atmospheric stability, and fire-related emission processes; and wind speed was used as an indicator of atmospheric dispersion efficiency in the boundary layer [32,33].
The inclusion of temperature complements the meteorological block of the study, allowing the assessment of climatic conditions associated not only with pollutant dispersion and removal but also with the atmospheric processes that influence NO2 formation, persistence, and fire activity. Therefore, the meteorological variables were incorporated as environmental controls capable of modulating the relationship between emission sources and tropospheric NO2 column densities [34,35].
Fire occurrence was represented by fire-density indicators derived from fire hotspot data provided by the Brazilian National Institute for Space Research (INPE), São José dos Campos, SP, Brazil, through the BDQueimadas database (https://terrabrasilis.dpi.inpe.br/queimadas/, accessed 15 June 2026). These data were used to represent biomass-burning activity as an episodic source of nitrogen oxides and other combustion-related atmospheric pollutants [36,37].
The integration of land-use variables, road infrastructure, fire occurrence, and meteorological data allowed the construction of a consistent set of explanatory indicators to evaluate, in a hypothesis-driven framework, the relative influence of structural and environmental factors on the spatial and interannual variability of tropospheric NO2 in the municipalities analyzed (Table 2).
H1 (Fires).
Fire density, derived from INPE fire foci data, represents an episodic source of NO2 emissions, whose influence may be intensified during warmer and drier periods.
H2 (Land use).
Agricultural area, pasture, and urban area derived from MapBiomas reflect different territorial patterns of human occupation, which may either contribute to or dilute average NO2 concentrations depending on the intensity of local emission sources.
H3 (Meteorological modulation).
Precipitation, temperature, and wind speed obtained from CEMTEC-MS act as key environmental controls on NO2 variability by influencing wet deposition, photochemical activity, fire-related emissions, and atmospheric dispersion.
The environmental, meteorological, land-use, infrastructure, and fire datasets used in this study, together with their respective sources and spatial and temporal resolutions, are summarized in Table 2.
Table 2.
Data sources used in the study.
2.4. Statistical Analysis
Descriptive statistics were initially calculated for all variables, including mean, median, standard deviation, minimum, maximum, and quartile values. The normality of the variables was evaluated using the Shapiro–Wilk (SW) test, while homogeneity of variance was assessed through Levene’s test.
The analytical dataset consisted of annual observations for each municipality during the period 2020–2024. Therefore, the final database contained 50 municipality-year observations (10 municipalities × 5 years). For each municipality and year, annual mean tropospheric NO2 column density and all explanatory variables (fire density, land-use indicators, road density, precipitation, temperature, and wind speed) were compiled prior to statistical analysis. Thus, the statistical analyses were conducted using municipality-year observations rather than a single average value per municipality.
Pearson’s correlation analysis was applied to investigate the relationships between tropospheric NO2 column densities and the explanatory variables, including fire density, agricultural area, pasture area, urban area, road density, precipitation, and wind speed. Correlation coefficients (r) were classified according to their magnitude as weak (|r| < 0.30), moderate (0.30 ≤ |r| < 0.70), and strong (|r| ≥ 0.70).
To evaluate the influence of meteorological conditions on the relationship between biomass burning and tropospheric NO2 concentrations, partial correlation analyses were performed, controlling for precipitation and wind speed. This procedure allowed the isolation of the direct association between fire density and NO2 variability, minimizing the confounding effects of atmospheric dispersion and wet deposition processes.
The statistical significance of all correlation coefficients was evaluated using Student’s t-test, adopting a significance level of 5% (p < 0.05). All statistical analyses were conducted using R software (version 4.3.2; R Core Team, Vienna, Austria; https://www.r-project.org/, accessed 15 June 2026).
The relationships among variables were further explored using correlation matrices and scatter plots with fitted regression lines to identify potential nonlinearities and influential observations. These analyses provided the basis for selecting explanatory variables for the regression modeling described in the following section.
2.5. Multiple Linear Regression Analysis
To quantify the relative contribution of environmental and anthropogenic drivers to tropospheric NO2 variability, a Multiple Linear Regression (MLR) model was developed. The dependent variable was the annual mean tropospheric NO2 column density obtained from Sentinel-5P/TROPOMI observations, whereas the independent variables included fire density, agricultural area (%), pasture area (%), urban area (%), road density (km·km−2), annual precipitation (mm), and mean wind speed (km·h−1).
The general form of the regression model is expressed as
where:
NO2 represents the mean tropospheric NO2 column density;
β0 is the intercept;
β1–β7 are the regression coefficients associated with each explanatory variable;
ε represents the random error term.
The multiple linear regression model was fitted using the complete municipality-year dataset (n = 50 observations). This sample size provided sufficient degrees of freedom for evaluating the combined effects of environmental, land-use, infrastructure, and meteorological variables on tropospheric NO2 variability.
Model coefficients were estimated using the Ordinary Least Squares (OLS) method. Prior to model fitting, multicollinearity among predictors was assessed through the Variance Inflation Factor (VIF). Variables presenting VIF values greater than 5 were considered potentially collinear and were carefully evaluated before inclusion in the final model. The statistical significance of each regression coefficient was assessed using Student’s t-test, and variables with p < 0.05 were considered statistically significant contributors to NO2 variability.
Model performance was evaluated through the coefficient of determination (R2), Mean Absolute Error (MAE), Mean Squared Error (MSE), and Root Mean Square Error (RMSE). Residual diagnostics were also performed to verify compliance with regression assumptions, including linearity, independence, homoscedasticity, and normality of residuals.
Additionally, the relative importance of each explanatory variable was quantified using standardized regression coefficients, allowing comparison of the magnitude of the influence of anthropogenic and environmental factors on tropospheric NO2 concentrations across the municipalities analyzed.
2.6. Model Performance Evaluation
The performance of the regression model was evaluated using the following statistical metrics:
- Coefficient of determination (R2)
- Mean Absolute Error (MAE)
- Mean Squared Error (MSE)
- Root Mean Square Error (RMSE)
These indicators were used to assess the predictive performance and fitness of the regression model.
Residual analysis was also conducted to verify whether the regression assumptions were satisfied, including the absence of systematic patterns and the homoscedasticity of residuals.
3. Results
Table 3 presents the descriptive statistics of the environmental, land-use, infrastructure, fire, and meteorological variables derived from the complete municipality-year dataset (n = 50 observations), corresponding to ten municipalities monitored annually during the period 2020–2024. Mean tropospheric NO2 concentrations ranged from 1.417 to 1.739 × 10⁻⁵ mol·m−2, with an average value of 1.489 × 10⁻⁵ mol·m−2 and a relatively low standard deviation (0.099), indicating moderate spatial variability among the municipalities. In contrast, fire density showed high dispersion, ranging from 8.0 × 10⁻⁵ to 2.02 × 10⁻³ km−2, reflecting the strong spatial heterogeneity of biomass-burning activity in the study area.
Table 3.
Descriptive statistics of the variables analyzed in the municipalities of Mato Grosso do Sul, Brazil, during the period 2020–2024. Statistics were calculated from the complete municipality-year dataset (n = 50 observations).
Land-use and land-cover variables indicate the predominance of rural landscapes in the region. Agricultural areas represented, on average, 35.4% of the municipal territory, followed by pasture areas with an average of 25.9%. Urban areas presented a relatively low average proportion of 4.3%, varying from 3.0% to 6.0%, which reflects the limited urban extent of most municipalities included in the analysis. Road density ranged from 0.30 to 1.25 km·km−2, indicating marked differences in transport infrastructure and territorial organization among municipalities.
The meteorological variables showed climatic conditions typical of the Cerrado–Pantanal transition region. Mean annual temperature ranged from 23.5 to 25.8 °C, with an average of 24.4 ± 0.8 °C. Annual precipitation varied from 1050 to 1500 mm, with a mean value of 1327 ± 168 mm, indicating relevant spatial differences in rainfall distribution among the municipalities. Mean wind speed ranged from 2.7 to 3.8 m s−1, with an average of 3.08 ± 0.41 m s−1, suggesting moderate variability in atmospheric dispersion conditions.
Overall, the descriptive statistics indicate that tropospheric NO2 variability in the municipalities of Mato Grosso do Sul is influenced by the combined effects of land use, fire occurrence, infrastructure, and meteorological conditions. Municipalities with greater urban influence and more developed transport infrastructure tend to present higher NO2 concentrations, whereas municipalities dominated by agricultural and pasture landscapes generally show lower NO2 levels. In addition, precipitation, temperature, and wind speed may modulate NO2 concentrations by influencing wet removal, photochemical activity, fire-related emissions, and atmospheric dispersion processes.
3.1. Spatial Variability of Tropospheric NO2 Among Municipalities
The spatial distribution of tropospheric NO2 in the municipalities of Angélica, Aparecida do Taboado, Corumbá, Deodápolis, Douradina, Fátima do Sul, Ladário, Porto Murtinho, Três Lagoas and Vicentina was highly heterogeneous, as evidenced by the descriptive statistics of tropospheric column densities. This heterogeneity reflects the coexistence of areas with different intensities of urbanization, agricultural activities and mobility patterns.
On a regional scale, considering the ten municipalities together, fewer hot spots were identified than cold spots; however, hot spots had a higher mean spatial extension. The most extensive and intense hot spots are mainly concentrated in municipalities with a higher degree of urbanization and more developed road infrastructure, such as Três Lagoas, Corumbá and Ladário, where there are higher population densities, greater vehicular flow and the presence of industrial and logistical activities. These municipalities had the highest annual averages of tropospheric NO2 among the group analyzed.
On the other hand, municipalities with a predominantly rural profile, such as Angélica, Deodápolis, Douradina, Fátima do Sul and Vicentina, are mostly characterized by the presence of cold spots, associated with lower densities of roads, a lower percentage of urban area and a greater participation of agricultural areas, pastures and native vegetation. In these areas, the annual averages of tropospheric NO2 were systematically lower than those observed in the more urbanized municipalities.
It is also noteworthy that some hot spots identified are not necessarily associated with continuous urban areas but with specific areas of intense anthropogenic activity, such as road corridors, specific industrial areas and regions with greater circulation of cargo vehicles. This pattern is particularly evident in municipalities such as Aparecida do Taboado and Porto Murtinho, where transport infrastructure plays a relevant role in the spatial redistribution of tropospheric NO2.
The analysis at the municipal level revealed that the identification of hot spots and cold spots is sensitive to the spatial scale adopted. In more aggregated analyses, areas with moderate NO2 concentrations can be masked by the influence of more intense urban centers. When the analysis is conducted at a municipal or intra-urban scale, new local hot spots and cold spots emerge, highlighting the importance of the multiscale approach to understanding the spatial patterns of atmospheric pollution.
In general, the results reinforce that the spatial patterns of tropospheric NO2 in the analyzed municipalities are controlled by the interaction between land use and land cover, population density, road infrastructure and local characteristics of the emitting sources. The identification of hot spots and cold spots provides relevant subsidies for understanding the processes that govern the spatial distribution of NO2 and the planning of public policies aimed at the control of air pollution at the municipal and regional scales.
3.2. Analysis of Impact Factors
The influence of land use, fire occurrence, road infrastructure, and meteorological conditions on tropospheric NO2 variability in the ten municipalities of Mato Grosso do Sul was evaluated using Pearson correlation analysis between annual mean NO2 column densities and the explanatory variables presented in Table 4. The analysis included land-use indicators, fire-density metrics, road density, and climatic variables, namely mean annual temperature, annual precipitation, and mean wind speed.
Table 4.
Correlation coefficients (ρ) between mean tropospheric NO2 (2020–2024), land use, and fire density in the 10 cities of Mato Grosso do Sul.
Table 4 summarizes the Pearson correlation coefficients (r) and associated p-values between tropospheric NO2 concentrations and the selected environmental and anthropogenic variables. The results indicate that NO2 variability is associated with different land-use patterns, biomass-burning activity, urbanization levels, road infrastructure characteristics, and meteorological conditions. The magnitude and statistical significance of the correlations should be interpreted considering the spatial scale of analysis and the complexity of the environmental processes involved.
Pasture area exhibited the strongest negative correlation with tropospheric NO2 (r = −0.81, p = 0.004; Table 4). This significant inverse association indicates that municipalities with a greater proportion of pasture-dominated landscapes tended to present lower atmospheric NO2 concentrations. These areas are generally characterized by lower population density, reduced vehicular traffic, and the absence of major industrial emission sources, resulting in lower nitrogen oxide emissions. Thus, pasture cover may act as an indicator of predominantly rural landscapes with lower combustion-related anthropogenic activity.
Agricultural area also showed a moderate negative correlation with tropospheric NO2 (r = −0.67, p = 0.034; Table 4). Although agricultural activities may contribute to atmospheric emissions through machinery operation, soil management, and biomass handling, municipalities with larger proportions of cropland generally presented lower NO2 concentrations than more urbanized municipalities. This pattern suggests that agricultural landscapes in the study area are mainly associated with diffuse and spatially dispersed emission sources and lower intensity of fossil-fuel combustion compared with urban and industrial environments.
Urban area percentage showed a weak positive correlation with tropospheric NO2 (r = +0.33, p = 0.352; Table 4). Although this relationship was not statistically significant, its positive direction is consistent with the expected contribution of urban activities to NO2 emissions. Urban areas concentrate emission sources such as road traffic, commercial activities, energy consumption, and localized industrial or logistical operations. Therefore, urbanization may contribute to NO2 increases, but, in the present dataset, its isolated effect was weak when evaluated at the municipal scale.
Fire density presented a moderate positive correlation with tropospheric NO2 (r = +0.62, p = 0.056; Table 4), suggesting a tendency for municipalities with higher fire occurrence to present increased NO2 concentrations. Although this relationship was marginally non-significant at the 5% level, it indicates the potential contribution of biomass burning to regional NO2 variability. During combustion processes, nitrogen stored in vegetation and organic matter can be released into the atmosphere as nitrogen oxides, contributing to the tropospheric NO2 column detected by satellite observations. The correlations by spatial regime reinforce this pattern, with rural fire density showing a moderate positive association (r = +0.63, p = 0.051) and urban fire density showing a very strong and statistically significant positive association (r = +0.98, p < 0.001). This result suggests that the combined influence of fire occurrence and local urban emission sources may strongly enhance NO2 concentrations in more urbanized municipalities.
An apparently unexpected result was observed for road density, which showed a moderate negative correlation with tropospheric NO2 (r = −0.69, p = 0.027; Table 4). In general, road infrastructure is expected to be positively associated with NO2 concentrations because vehicular traffic is an important source of nitrogen oxide emissions. However, in the present study, road density was calculated as the ratio between total road length and municipal area (km·km−2). Therefore, this indicator is strongly affected by the territorial size of each municipality. Large municipalities such as Corumbá and Porto Murtinho may have low road density values despite the presence of important transportation corridors and localized emission sources. Consequently, the negative correlation should not be interpreted as evidence that transportation reduces atmospheric pollution but rather as a scale effect associated with municipal territorial extent and the spatial aggregation of infrastructure indicators.
The meteorological variables showed moderate but statistically non-significant associations with tropospheric NO2. Mean annual temperature was positively correlated with NO2 (r = +0.41, p = 0.239; Table 4), suggesting that warmer conditions may favor photochemical activity, atmospheric stability, and fire-related emission processes. Annual precipitation showed a moderate negative correlation (r = −0.58, p = 0.079), indicating a possible role of rainfall in wet removal and atmospheric cleansing of NO2. Wind speed also showed a moderate negative correlation with NO2 (r = −0.46, p = 0.181), consistent with the role of ventilation and atmospheric dispersion in reducing pollutant accumulation. However, because only annual mean wind speed was considered, this result does not capture the influence of wind direction, transport pathways, or vertical mixing, which are also important controls of atmospheric pollutant concentrations.
Overall, the results presented in Table 4 indicate that tropospheric NO2 variability in Mato Grosso do Sul is influenced by the combined effects of land use, fire occurrence, urbanization, road infrastructure, and meteorological conditions. Pasture and agricultural areas were negatively associated with NO2 concentrations, reflecting the predominance of rural landscapes with lower emission intensity. In contrast, fire density and urban-related variables showed positive associations, indicating the contribution of biomass burning and anthropogenic activities to NO2 enhancement. The climatic variables suggest additional modulation through photochemical activity, wet removal, and atmospheric dispersion, although their correlations were not statistically significant. These findings highlight the importance of interpreting NO2 variability as the result of multiple interacting environmental and anthropogenic factors in the Cerrado–Pantanal transition region.
The analysis by spatial regimes indicated that the association between fire density and NO2 was stronger in urban municipalities (r = +0.98, p < 0.001) than in rural municipalities (r = +0.63, p = 0.051). This pattern suggests a possible synergistic effect between emissions from biomass burning and local anthropogenic sources, such as traffic, urban activities, and localized combustion processes. The meteorological variables also showed relevant but non-significant relationships with NO2, with precipitation and wind speed presenting negative correlations, consistent with wet removal and atmospheric dispersion processes, while temperature showed a positive association, possibly related to photochemical activity and fire-prone conditions.
Overall, the results indicate that tropospheric NO2 variability in Mato Grosso do Sul is governed by the combined effects of land use, biomass burning, urbanization, and meteorological modulation. Municipalities characterized by greater urban influence and fire occurrence tended to exhibit higher NO2 concentrations, whereas agricultural and pasture-dominated landscapes were generally associated with lower values. These findings emphasize the importance of considering both environmental and anthropogenic drivers when evaluating air-quality patterns in the Cerrado–Pantanal transition zone.
Figure 2 summarizes the relationships between tropospheric NO2 concentrations and the main environmental, climatic, and anthropogenic drivers in the municipalities of Mato Grosso do Sul. Panel (a) shows the relationship between mean tropospheric NO2 column density and fire density for the period 2020–2024. The positive slope of the fitted regression line indicates that municipalities with higher fire density tended to present higher NO2 levels, reinforcing the contribution of biomass burning to regional NO2 variability.
Figure 2.
Integrated analysis of the factors influencing tropospheric NO2 variability in the municipalities of Mato Grosso do Sul, Brazil (2020–2024). (a) Relationship between mean tropospheric NO2 column density and fire density, with the fitted regression line. (b) Conceptual diagram illustrating the main anthropogenic, environmental, and meteorological drivers of NO2 variability, including biomass burning, agricultural activities, urbanization, road transport, land use and land cover, precipitation, temperature, and wind speed. (c) Pearson correlation matrix showing the relationships between NO2 and the explanatory variables, including fire density, agricultural area, pasture, urban area, road density, precipitation, temperature, and wind speed.
Panel (b) presents a conceptual representation of the principal drivers influencing tropospheric NO2 variability in the study region. These include biomass burning, agricultural activities, urbanization, road transport, land-use and land-cover patterns, and meteorological conditions. Biomass burning and urban activities represent direct or indirect sources of nitrogen oxide emissions, whereas agricultural and pasture-dominated landscapes are generally associated with lower average NO2 concentrations. Meteorological variables, including precipitation, temperature, and wind speed, act as modulators of atmospheric NO2 by influencing wet removal, photochemical activity, fire-related emissions, and atmospheric dispersion.
Panel (c) displays the correlation matrix between NO2 and the explanatory variables considered in the analysis, including fire density, agricultural area, pasture, urban area, road density, precipitation, temperature, and wind speed. Fire density showed a positive correlation with NO2, indicating the influence of biomass-burning emissions on tropospheric column concentrations. In contrast, variables associated with rural land use, especially pasture and agricultural area, exhibited negative correlations with NO2, suggesting lower emission intensity in predominantly rural municipalities. Precipitation and wind speed also showed negative correlations with NO2, consistent with atmospheric cleansing and dispersion processes, whereas temperature showed a positive association, possibly reflecting its role in photochemical activity and fire-prone conditions.
Taken together, the three panels demonstrate that the spatial variability of tropospheric NO2 in the municipalities of Mato Grosso do Sul is influenced by the combined effects of biomass burning, land-use structure, urbanization, road infrastructure, and meteorological modulation. These results emphasize the multifactorial nature of air pollution dynamics in the Cerrado–Pantanal transition region and highlight the importance of integrating climatic variables into the interpretation of satellite-derived NO2 patterns.
3.3. Regression Model and Performance Evaluation
To evaluate the relative contribution of environmental, climatic, and anthropogenic factors to tropospheric NO2 variability, a multiple linear regression model was fitted using the annual mean tropospheric NO2 column density as the dependent variable. The explanatory variables included fire density, agricultural area (%), pasture area (%), urban area (%), road density (km·km−2), annual precipitation (mm), mean annual temperature (°C), and mean wind speed (m·h−1).
The inclusion of meteorological variables allowed the model to account not only for emission-related factors, such as biomass burning, urbanization, and transport infrastructure, but also for atmospheric processes associated with pollutant removal, photochemical activity, fire-prone conditions, and dispersion. Precipitation was included as an indicator of wet removal processes, temperature as a proxy for photochemical and fire-related atmospheric conditions, and wind speed as an indicator of ventilation and pollutant dispersion.
Table 5 presents the estimated regression coefficients for the explanatory variables included in the model. Positive coefficients indicate variables associated with increased tropospheric NO2 concentrations, whereas negative coefficients indicate variables associated with pollutant dilution, removal, or dispersion.
Table 5.
Regression Model Coefficients for Tropospheric NO2.
3.4. Model Performance
The performance of the model was evaluated using the coefficient of determination (R2) and the error metrics MAE, MSE and RMSE (Table 6).
Table 6.
Model performance metrics.
The performance metrics presented in Table 6 indicate that the multiple linear regression model was able to explain a substantial proportion of the spatial variability of tropospheric NO2 concentrations among the municipalities analyzed. The coefficient of determination (R2 = 0.74) indicates that approximately 74% of the observed variability was explained by the set of explanatory variables included in the model, whereas the remaining 26% may be associated with factors not explicitly considered in the analysis, such as local emission sources, atmospheric transport processes, and other environmental characteristics.
The error metrics (MAE = 0.027, MSE = 0.0013, and RMSE = 0.036) were relatively low, indicating limited differences between observed and predicted values. However, these values should be interpreted considering the scale of the dependent variable, whose concentrations varied within a relatively narrow range. Therefore, the low error values do not imply the absence of uncertainty but rather suggest that the model provides a reasonable representation of the spatial distribution of tropospheric NO2 across the study area.
Overall, the results presented in Table 6 indicate that the model achieved satisfactory predictive performance and captured the main spatial patterns of tropospheric NO2 variability, although part of the variability remains unexplained and may be related to additional anthropogenic and meteorological factors not included in the regression model.
3.5. Observed Versus Predicted NO2 Concentrations
Figure 3 compares the observed and predicted tropospheric NO2 concentrations obtained from the multiple linear regression model. Most observations are distributed near the 1:1 reference line, indicating a satisfactory agreement between measured and estimated values. This pattern suggests that the model was able to reproduce the main spatial gradients of NO2 among the municipalities of Mato Grosso do Sul.
Figure 3.
Relationship between observed and predicted tropospheric NO2 concentrations obtained from the multiple linear regression model for the municipalities of Mato Grosso do Sul, Brazil (2020–2024). The dashed diagonal line represents the 1:1 relationship, indicating ideal agreement between observed and predicted values. Points located close to the line indicate better model performance, whereas deviations from the line represent residual differences between observed and estimated NO2 concentrations. Model performance metrics are shown in the plot.
Although some dispersion around the reference line is evident, the overall distribution of points indicates that the model adequately represents the dominant variability of tropospheric NO2 in the study area. The observed deviations between measured and predicted values are expected in regional-scale analyses, reflecting the influence of local factors and atmospheric processes that are not fully captured by the explanatory variables included in the model.
The consistency between the observed-versus-predicted relationship shown in Figure 3 and the performance metrics presented in Table 6 supports the use of the regression model as a useful tool for evaluating the influence of land use, fire occurrence, and infrastructure characteristics on tropospheric NO2 variability. Nevertheless, the results should be interpreted with caution, given that approximately one-quarter of the observed variability remains unexplained by the model.
3.6. Residual Analysis
Figure 4 presents the residual graph of the multiple linear regression model applied to tropospheric NO2 concentrations. The residuals are distributed around the zero line, with no clear evidence of a systematic trend or strong deviation pattern across the range of predicted values. This indicates that the model reproduced the general spatial variability of NO2 reasonably well among the municipalities analyzed.
Figure 4.
Residual graph of the multiple linear regression model applied to tropospheric NO2 concentrations in the municipalities of Mato Grosso do Sul, Brazil (2020–2024). Residuals were calculated as the difference between observed and predicted NO2 values. The dashed horizontal line represents zero residual, indicating perfect agreement between observed and predicted concentrations. Points distributed close to this line suggest adequate model fit, whereas larger positive or negative deviations indicate municipalities where the model respectively underestimates or overestimates tropospheric NO2 concentrations.
The absence of a pronounced funnel-shaped pattern suggests that heteroscedasticity was not visually evident in the residual distribution. In addition, the dispersion of positive and negative residuals around zero indicates that the model did not consistently overestimate or underestimate NO2 concentrations. Therefore, the residual analysis supports the adequacy of the model fit, although the results should be interpreted with caution due to the small sample size.
3.7. Relative Importance of the Variables
Figure 5 presents the relative importance of the explanatory variables included in the multiple linear regression model for tropospheric NO2. The results indicate that road density was the most important predictor, followed by fire density and urban areas. Together, these variables suggest that transport infrastructure, biomass burning, and urbanization are the main factors associated with the spatial variability of tropospheric NO2 among the municipalities analyzed.
Figure 5.
Relative importance of the explanatory variables in the multiple linear regression model for tropospheric NO2 in the municipalities of Mato Grosso do Sul, Brazil (2020–2024). The figure shows the relative contribution of land-use, fire, infrastructure, and meteorological variables to the explanation of tropospheric NO2 variability.
The high relative importance of road density highlights the role of transport infrastructure and circulation networks in shaping NO2 concentrations. Although road density showed a negative correlation in the bivariate analysis, its strong contribution in the regression model indicates that road-related spatial organization remains an important explanatory component when evaluated together with other environmental and anthropogenic variables. Fire density also presented high relative importance, reinforcing the role of biomass burning as a relevant regional source of nitrogen oxides. In addition, the contribution of urban areas indicates that municipalities with greater urbanization tend to be more strongly influenced by anthropogenic emission sources, including traffic, commercial activities, energy use, and localized industrial or logistical processes.
Meteorological variables also contributed to the model, although with lower relative importance than the main structural and emission-related variables. Temperature, precipitation, and wind speed provided complementary information by representing atmospheric processes associated with photochemical activity, fire-prone conditions, wet removal, and pollutant dispersion. These results indicate that meteorological conditions modulate NO2 variability, even when they are not the dominant predictors in the regression model.
Variables associated with rural land use, particularly agricultural area and pasture, showed comparatively lower relative importance. This suggests that these variables are useful for characterizing the landscape structure of the municipalities, but their direct contribution to explaining tropospheric NO2 variability was smaller than that of transport infrastructure, fire occurrence, and urbanization.
Overall, the results indicate that the spatial variability of tropospheric NO2 in the municipalities of Mato Grosso do Sul is mainly explained by structural and emission-related factors associated with road infrastructure, biomass burning, and urbanization, while meteorological conditions act as secondary modulators of atmospheric concentrations. These findings reinforce the multifactorial nature of NO2 variability in the Cerrado–Pantanal transition region.
4. Discussion
The results of this study indicate that tropospheric NO2 variability in the municipalities of Mato Grosso do Sul is influenced by the combined effects of land-use patterns, biomass burning, urbanization, transport infrastructure, and meteorological conditions. Higher NO2 concentrations were generally observed in municipalities with greater urban influence and more developed infrastructure, whereas lower concentrations were associated with predominantly rural landscapes, especially those characterized by larger proportions of agricultural and pasture areas. This pattern is consistent with previous studies showing that urbanization, transportation activities, industrial emissions, and land-use structure are key drivers of tropospheric NO2 variability at regional and local scales [15,30,34,35,37,38,39,40,41].
Urban area showed a weak positive correlation with tropospheric NO2 (r = +0.33, p = 0.352), indicating that municipalities with a larger urban proportion tended to present higher NO2 concentrations. Although this relationship was not statistically significant, its positive sign is consistent with the role of urban areas as centers of vehicular traffic, commercial activities, energy consumption, and localized industrial or logistical emissions. Therefore, urbanization should not be interpreted as the only controlling factor but rather as one component of a broader set of anthropogenic drivers influencing NO2 variability. Similar relationships between urban land use and NO2 enhancement have been reported in previous studies, particularly in regions undergoing economic expansion and changes in land-use structure [35,37,38,39,40,41].
Biomass burning also emerged as an important factor associated with tropospheric NO2 concentrations. Fire density showed a moderate positive association with NO2 (r = +0.62, p = 0.056), suggesting that municipalities with higher fire occurrence tended to present higher NO2 levels. Although this correlation was marginally non-significant at the 5% level, it indicates the potential contribution of biomass burning to regional NO2 enhancement. During combustion processes, nitrogen stored in vegetation and soil organic matter may be released into the atmosphere as NO and NO2, increasing tropospheric column concentrations detected by satellite observations. Similar associations between fire occurrence and atmospheric pollutant concentrations have been reported in tropical ecosystems and regions affected by recurrent seasonal burning [17,18,23,25,42,43,44,45,46].
The analysis by spatial regimes provides additional evidence that the effect of fire occurrence on NO2 may depend on the local emission context. The correlation between fire density and NO2 was stronger in urban municipalities (r = +0.98, p < 0.001) than in rural municipalities (r = +0.63, p = 0.051). This result suggests a possible synergistic effect between emissions from biomass burning and local anthropogenic sources, including traffic, urban activities, and localized combustion processes. In this sense, fire emissions may enhance NO2 concentrations more strongly where background anthropogenic emissions are already present. However, because the number of municipalities analyzed was limited, this result should be interpreted as an exploratory indication rather than definitive causal evidence.
The negative correlations observed for agricultural area (r = −0.67, p = 0.034) and pasture area (r = −0.81, p = 0.004) indicate that municipalities dominated by rural landscapes tended to present lower tropospheric NO2 concentrations than more urbanized municipalities. These landscapes are generally associated with lower population density, reduced industrial activity, and lower vehicular traffic intensity, resulting in fewer combustion-related emission sources. Although agricultural practices can contribute to atmospheric emissions through machinery operation, soil management, and biomass handling, their contribution to NO2 concentrations in the municipalities analyzed appears to be lower than that associated with urban and transport-related activities. This interpretation is consistent with studies showing that land-use and land-cover patterns can modulate atmospheric composition by altering emission sources, vegetation cover, deposition processes, and surface-atmosphere exchanges [15,19,20,21,22,47].
An apparently unexpected result was observed for road density, which showed a moderate negative correlation with tropospheric NO2 (r = −0.69, p = 0.027). In general, road infrastructure and vehicular traffic are expected to be positively associated with NO2 concentrations because transport is an important source of nitrogen oxide emissions. However, in the present study, road density was calculated as the ratio between total road length and municipal area. Therefore, this indicator is strongly influenced by the territorial size of each municipality. Large municipalities such as Corumbá and Porto Murtinho may present low road density values despite containing important transportation corridors and localized emission sources. Thus, the negative correlation should not be interpreted as evidence that road infrastructure reduces atmospheric pollution but rather as a scale effect related to municipal territorial extent and the spatial aggregation of infrastructure indicators. This finding highlights the importance of carefully interpreting normalized infrastructure variables in regional-scale environmental studies.
Meteorological conditions also contributed to the interpretation of tropospheric NO2 variability. Temperature, precipitation, humidity, and wind speed influence atmospheric transport, dilution, deposition, and chemical transformation processes [7,16]. In this study, mean annual temperature showed a moderate positive association with NO2 (r = +0.41, p = 0.239), suggesting that warmer conditions may favor photochemical activity, atmospheric stability, and fire-prone conditions. Annual precipitation showed a moderate negative correlation with NO2 (r = −0.58, p = 0.079), consistent with the role of rainfall in wet removal and atmospheric cleansing. Wind speed also showed a negative association (r = −0.46, p = 0.181), suggesting that stronger ventilation may favor dispersion and reduce local pollutant accumulation. Although these meteorological correlations were not statistically significant, they are physically consistent with atmospheric processes that regulate NO2 concentrations and with previous studies emphasizing the importance of meteorological controls on air quality in tropical regions [7,16,17,25].
The multiple linear regression model explained a substantial proportion of the spatial variability of tropospheric NO2 among the municipalities analyzed. The coefficient of determination (R2 = 0.74) indicates that approximately 74% of the observed variability was captured by the set of explanatory variables included in the model. This performance can be considered satisfactory for a regional-scale environmental analysis, especially considering the complexity of atmospheric pollution processes and the limited number of municipalities. However, approximately 26% of the variability remained unexplained, indicating that additional factors not explicitly included in the model may also contribute to NO2 patterns. These factors may include industrial emission intensity, real traffic volume, fleet composition, fuel type, wind direction, boundary-layer height, atmospheric stability, regional transport, topography, and localized emission sources.
The relatively low values of MAE, MSE, and RMSE indicate small differences between observed and predicted NO2 values. However, these error metrics must be interpreted in relation to the numerical scale of the dependent variable, since tropospheric NO2 column densities varied within a narrow range. Therefore, low error values do not imply the absence of uncertainty but rather indicate that the model reproduced the general spatial pattern of NO2 concentrations with limited residual error. The observed-versus-predicted analysis and the residual graph support this interpretation, since most points were distributed near the 1:1 reference line and residuals were generally centered around zero. Nevertheless, deviations remained for some municipalities, reflecting the influence of local processes and unmeasured variables not fully represented by the model.
The relative importance analysis further indicated that road density, fire density, and urban area were the main predictors in the regression model, whereas meteorological variables acted as secondary modulators. This result suggests that structural and emission-related factors, particularly transport infrastructure, biomass burning, and urbanization, are central to explaining NO2 variability in the study area. At the same time, temperature, precipitation, and wind speed provide important complementary information because they influence photochemical processes, wet deposition, fire activity, and atmospheric dispersion. Therefore, the results reinforce that tropospheric NO2 variability in Mato Grosso do Sul cannot be attributed to a single factor but rather to the interaction between emission sources, land-use structure, fire dynamics, and atmospheric conditions.
A major contribution of this study is the integrated use of satellite-derived NO2 observations from Sentinel-5P/TROPOMI with land-use, biomass-burning, road infrastructure, and meteorological data in a region where long-term, ground-based air-quality monitoring remains limited [28,29,30,31,32,48]. While previous studies have already demonstrated the utility of satellite remote sensing for air-quality monitoring, fewer studies have simultaneously evaluated the combined influence of land use, fire density, infrastructure, and meteorological conditions on tropospheric NO2 variability in the Cerrado–Pantanal transition region. Therefore, the novelty of the present study lies not simply in the use of satellite data but in the integrated municipal-scale assessment of multiple environmental and anthropogenic drivers in a region characterized by strong contrasts in biomes, land use, infrastructure, and fire occurrence.
Study Limitations and Future Perspectives
Although this study provides important insights into the environmental and anthropogenic factors associated with tropospheric NO2 variability in Mato Grosso do Sul, several limitations should be considered. First, the analysis was based on tropospheric NO2 column densities derived from Sentinel-5P/TROPOMI observations. Although satellite products provide broad spatial coverage and are especially valuable in regions with limited monitoring infrastructure, they represent vertically integrated atmospheric columns rather than direct near-surface concentrations. Consequently, local-scale variability related to emission sources, boundary-layer dynamics, vertical mixing, and near-surface exposure may not be fully captured.
Second, annual averages were used to characterize NO2 concentrations, fire occurrence, land-use patterns, and meteorological conditions. This approach reduces short-term variability and facilitates the identification of broad spatial patterns, but it may mask seasonal contrasts associated with dry periods, biomass-burning events, rainfall variability, and episodic meteorological extremes. Future studies should therefore explore monthly or seasonal analyses to better capture the temporal coupling between fires, meteorological conditions, and NO2 enhancement.
Third, the study included only ten municipalities, which limits the statistical power of correlation and regression analyses. For this reason, the coefficients and p-values should be interpreted as exploratory evidence of associations rather than definitive causal relationships. Expanding the analysis to a larger number of municipalities or longer time series would improve the robustness of the statistical inference and allow the use of more complex modeling approaches.
Fourth, some explanatory variables were represented by aggregated municipal indicators. Road density, for example, was calculated as total road length divided by municipal area, which may introduce scale effects in municipalities with very large territorial extensions. Similarly, urban area, agricultural area, and pasture percentage describe general land-use structure but do not fully capture the intensity of emissions, traffic volume, industrial activity, or land management practices. Future research should incorporate more direct indicators of emission intensity, such as vehicle fleet, traffic counts, industrial activity, energy consumption, and fire radiative power.
Another important limitation is the limited availability of ground-based air-quality monitoring stations across Mato Grosso do Sul, which restricts the direct validation of satellite-derived NO2 observations. Expanding regional monitoring networks through conventional stations and low-cost sensor technologies would improve the validation of satellite products and provide more detailed information on near-surface pollutant concentrations. Recent studies have shown that low-cost sensors can increase monitoring coverage in regions where conventional infrastructure is sparse, supporting environmental monitoring and validation efforts [49].
Despite these limitations, the integrated approach adopted in this study provides a useful framework for evaluating air-quality dynamics in regions with scarce ground observations. The combination of satellite remote sensing, fire data, land-use information, infrastructure indicators, and meteorological variables can support environmental monitoring and guide public policies aimed at reducing emissions from biomass burning, transport activities, and urban expansion. Future studies should prioritize higher temporal resolution, improved emission inventories, ground-based validation, and spatially explicit modeling to better understand the mechanisms controlling tropospheric NO2 variability in the Cerrado–Pantanal transition region.
5. Conclusions
This study evaluated the spatial variability of tropospheric NO2 in ten municipalities of Mato Grosso do Sul, Brazil, during the period 2020–2024, using Sentinel-5P/TROPOMI observations integrated with fire density, land-use and land-cover, road density, and meteorological variables. The results showed moderate spatial variability in tropospheric NO2, with higher concentrations generally associated with municipalities under greater urban influence and lower concentrations observed in predominantly rural municipalities.
The correlation analysis indicated that pasture and agricultural areas were negatively associated with tropospheric NO2, reflecting the lower emission intensity of rural landscapes. In contrast, fire density showed a positive association with NO2, suggesting that biomass burning contributes to regional NO2 enhancement. The stronger association observed between fire density and NO2 in urban municipalities suggests a possible combined effect of biomass-burning emissions and local anthropogenic sources.
The inclusion of meteorological variables improved the interpretation of NO2 variability. Temperature showed a positive association with NO2, while precipitation and wind speed showed negative associations, consistent with the roles of photochemical activity, wet removal, and atmospheric dispersion. Although these climatic relationships were not statistically significant, they provide useful evidence that meteorological conditions act as additional modulators of tropospheric NO2 concentrations.
The multiple linear regression model explained an important portion of the spatial variability of tropospheric NO2 among the municipalities analyzed. Road density, fire density, and urban area were the most relevant predictors, indicating that transport infrastructure, biomass burning, and urbanization are key factors associated with NO2 variability in the study region. However, the results should be interpreted with caution due to the small number of municipalities analyzed and the use of annual aggregated data.
The main contribution of this study is the integrated municipal-scale assessment of satellite-derived NO2, biomass burning, land use, infrastructure, and meteorological conditions in the Cerrado–Pantanal transition region. This approach provides useful information for identifying areas more susceptible to NO2 enhancement and can support environmental monitoring and air-quality management in regions where ground-based monitoring networks remain limited. Future studies should include higher temporal resolution, ground-based validation, traffic and industrial emission data, and expanded monitoring networks using conventional and low-cost sensors.
Author Contributions
A.D.S.: Conceptualization, methodology, formal analysis, investigation, writing—original draft preparation, supervision. E.B.D.S.: Data curation, methodology, formal analysis, writing—review and editing. J.F.d.O.J.: Conceptualization, validation, writing—review and editing, supervision. I.P.: Statistical analysis, methodology, validation, writing—review and editing. R.D.S.P.: Data curation, investigation, visualization, writing—review and editing. D.C.S.N.: Investigation, data curation, writing—review and editing. E.S.D.M.: Formal analysis, software, visualization, writing—review and editing. D.Ö.: Statistical analysis, methodology, validation, writing—review and editing. W.A.F.: Supervision, conceptualization, writing—review and editing. H.G.P.: Supervision, conceptualization, writing—review and editing. All authors have read and agreed to the published version of the manuscript.
Funding
This research did not receive any specific grant from funding agencies in the public, commercial, or not-for-profit sectors.
Institutional Review Board Statement
Not applicable.
Informed Consent Statement
Not applicable.
Data Availability Statement
The datasets used in this study are publicly available from the following sources: Tropospheric NO2 column density data were obtained from the Sentinel-5P/TROPOMI mission of the European Space Agency (ESA) and are available through the Copernicus Open Access Hub and Google Earth Engine platforms. Fire occurrence data were obtained from the Brazilian National Institute for Space Research (INPE) through the BDQueimadas database (https://queimadas.dgi.inpe.br/queimadas/bdqueimadas, accessed on 2 July 2026). Land use and land cover data were obtained from the MapBiomas Project (Collection 9), available at https://mapbiomas.org, accessed on 3 July 2026. Meteorological data (precipitation, air temperature, and wind speed) were provided by the Center for Monitoring Weather, Climate and Water Resources of Mato Grosso do Sul (CEMTEC-MS). The processed datasets and R scripts used for the statistical analyses are available from the corresponding author upon reasonable request. Credit to the authors.
Conflicts of Interest
The authors declare that they have no competing interests.
References
- World Health Organization (WHO). WHO Global Air Quality Guidelines: Particulate Matter (PM2.5 and PM10), Ozone, Nitrogen Dioxide, Sulfur Dioxide and Carbon Monoxide; World Health Organization: Geneva, Switzerland, 2021. [Google Scholar]
- United States Environmental Protection Agency (US EPA). Integrated Science Assessment for Oxides of Nitrogen—Health Criteria; U.S. Environmental Protection Agency: Washington, DC, USA, 2016.
- UN United Nations. Sustainable Development Goals, United Nations Announces 2019 Climate Action Summit ‘Clean Air Initiative’, Calls on Governments at All Levels to Join. 2019. Available online: https://www.un.org/sustainabledevelopment/blog/2019/07/clean-air--initiative-calls-climate-action/ (accessed on 1 February 2026).
- Vos, T.; Lim, S.S.; Abbafati, C.; Abbas, K.M.; Abbasi, M.; Abbasifard, M.; Abbasi-Kangevari, M.; Abbastabar, H.; Abd-Allah, F.; Abdelalim, A.; et al. Global burden of 369 diseases and injuries in 204 countries and territories, 1990–2019: A systematic analysis for the Global Burden of Disease Study 2019. Lancet 2020, 396, 1204–1222. [Google Scholar] [CrossRef] [PubMed]
- Monks, P.S.; Archibald, A.T.; Colette, A.; Cooper, O.; Coyle, M.; Derwent, R.; Fowler, D.; Granier, C.; Law, K.S.; Mills, G.E.; et al. Tropospheric ozone and its precursors from the urban to the global scale from air quality to short-lived climate forcer. Atmos. Chem. Phys. 2015, 15, 8889–8973. [Google Scholar] [CrossRef] [Scilit]
- Lefohn, A.S.; Malley, C.S.; Simon, H.; Wells, B.; Xu, X.; Zhang, L.; Wang, T.; Molina, L.T. Tropospheric ozone assessment report: Global ozone metrics for climate change, human health, and crop/ecosystem research. Elem. Sci. Anthr. 2018, 6, 28. [Google Scholar] [CrossRef] [Scilit] [PubMed]
- Lu, X.; Hong, J.; Zhang, L.; Cooper, O.R.; Schultz, M.G.; Xu, X.; Wang, T.; Gao, M.; Zhao, Y.; Zhang, Y. Meteorology and climate influences on tropospheric ozone: A review of natural sources, chemistry, and transport patterns. Curr. Pollut. Rep. 2019, 5, 238–260. [Google Scholar] [CrossRef] [Scilit]
- Cooper, O.R.; Parrish, D.D.; Ziemke, J.; Balashov, N.V.; Cupeiro, M.; Galbally, I.E.; Gilge, S.; Horowitz, L.; Jensen, N.R.; Lamarque, J.-F.; et al. Global distribution and trends of tropospheric ozone: An observation-based review. Elem. Sci. Anthr. 2014, 2, 000029. [Google Scholar] [CrossRef] [Scilit]
- Gaudel, A.; Cooper, O.R.; Ancellet, G.; Barret, B.; Boynard, A.; Burrows, J.P.; Clerbaux, C.; Coheur, P.-F.; Cuesta, J.; Cuevas Agulló, E.; et al. Tropospheric Ozone Assessment Report: Present-day distribution and trends of tropospheric ozone relevant to climate and global atmospheric chemistry model evaluation. Elem. Sci. Anthr. 2018, 6, 39. [Google Scholar] [CrossRef] [Scilit]
- Sicard, P. Ground-level ozone over time: An observation-based global overview. Curr. Opin. Environ. Sci. Health 2021, 19, 100226. [Google Scholar] [CrossRef] [Scilit]
- Wang, L.; Tai, A.P.; Tam, C.Y.; Sadiq, M.; Wang, P.; Cheung, K.K. Impacts of future land use and land cover change on mid-21 st-century surface ozone air quality: Distinguishing between the biogeophysical and biogeochemical effects. Atmos. Chem. Phys. Discuss. 2019, 20, 11349–11369. [Google Scholar] [CrossRef] [Scilit]
- Jacob, D.J. Heterogeneous chemistry and tropospheric ozone. Atmos. Environ. 2000, 34, 2131–2159. [Google Scholar] [CrossRef] [Scilit]
- Seinfeld, J.H.; Pandis, S.N. Atmospheric Chemistry and Physics: From Air Pollution to Climate Change, 3rd ed.; Wiley: New York, NY, USA, 2016. [Google Scholar]
- Koppmann, R. Volatile Organic Compounds in the Atmosphere; Wiley-Blackwell: Hoboken, NJ, USA, 2020. [Google Scholar]
- Heald, C.L.; Spracklen, D.V. Land use change impacts on air quality and climate. Chem. Rev. 2015, 115, 4476–4496. [Google Scholar] [CrossRef] [Scilit] [PubMed]
- Jacob, D.J.; Winner, D.A. Effect of climate change on air quality. Atmos. Environ. 2009, 43, 51–63. [Google Scholar] [CrossRef] [Scilit]
- Pivello, V.R.; Vieira, I.; Christianini, A.V.; Ribeiro, D.B.; da Silva Menezes, L.; Berlinck, C.N.; Melo, F.P.L.; Marengo, J.A.; Tornquist, C.G.; Tomas, W.M.; et al. Understanding Brazil’s Catastrophic Fires: Causes, Consequences and Policy Needed to Prevent Future Tragedies. Perspect. Ecol. Conserv. 2021, 19, 233–255. [Google Scholar] [CrossRef] [Scilit]
- da Silva, C.A., Jr.; Teodoro, P.E.; Coll, R.D.; Ribeiro Teodoro, L.P.; Lima, M.; Pantaleao, A.d.A.; Rojo Baio, F.H.; de Azevedo, G.B.; de Oliveira Sousa Azevedo, G.T.; Capristo-Silva, G.F.; et al. Persistent fire foci in all biomes undermine the Paris Agreement in Brazil. Sci. Rep. 2020, 10, 16246. [Google Scholar] [CrossRef] [Scilit] [PubMed]
- Guenther, A.B.; Jiang, X.; Heald, C.L.; Sakulyanontvittaya, T.; Duhl, T.; Emmons, L.K.; Wang, X. The Model of Emissions of Gases and Aerosols from Nature version 2.1 (MEGAN2.1): An extended and updated framework for modeling biogenic emissions. Geosci. Model Dev. 2012, 5, 1471–1492. [Google Scholar] [CrossRef] [Scilit]
- Fiore, A.M.; Horowitz, L.W.; Purves, D.W.; Levy, H.; Evans, M.J.; Wang, Y.; Li, Q.; Yantosca, R.M. Evaluating the contribution of changes in isoprene emissions to surface ozone trends over the eastern United States. J. Geophys. Res. Atmos. 2005, 110, D12303. [Google Scholar] [CrossRef] [Scilit]
- Hollaway, M.J.; Arnold, S.R.; Collins, W.J.; Folberth, G.; Rap, A. Sensitivity of midnineteenth century tropospheric ozone to atmospheric chemistry-vegetation interactions. J. Geophys. Res. Atmos. 2017, 122, 2452–2473. [Google Scholar] [CrossRef] [Scilit]
- Sadiq, M.; Tai, A.P.K.; Lombardozzi, D.; Martin, M.V. Effects of ozone-vegetation coupling on surface ozone air quality via biogeochemical and meteorological feedbacks. Atmos. Chem. Phys. 2017, 17, 3055–3066. [Google Scholar] [CrossRef] [Scilit]
- Targino, A.; Harrison, R.M.; Krecl, P.; Glantz, P.; de Lima, C.H.; Beddows, D.C.S. Surface Ozone Climatology of South Eastern Brazil and the Impact of Biomass Burning Events. J. Environ. Manag. 2019, 252, 109645. [Google Scholar] [CrossRef] [Scilit] [PubMed]
- Rudke, A.; Martins, L.D.; Martins, J.A.; Mantoani, M.C.; Andrade, M.d.F.; Kumar, P.; Alves, R.A.; Pedruzzi, R.; Thompson, T.; Sobrinho, O.M.; et al. Where There Is Smoke, There Is Fire: Long- and Mid-Range Biomass Burning Role on São Paulo State Air Quality. Environ. Pollut. 2025, 384, 126993. [Google Scholar] [CrossRef] [Scilit] [PubMed]
- Yin, Y.; Zhang, F.; Wu, Q.; Sun, L.; Li, Y.; Wang, P.; Liu, Z.; Cui, T.; Zhou, Z.; Hou, R.; et al. Spatiotemporal Evolution and Influencing Factors of Air Pollutants in the Three Major Urban Agglomerations of the Yellow River Basin. Atmosphere 2026, 17, 242. [Google Scholar] [CrossRef] [Scilit]
- Chang, Y.-S.; Chiao, H.-T.; Abimannan, S.; Huang, Y.-P.; Tsai, Y.-T.; Lin, K.-M. An LSTM-Based Aggregated Model for Air Pollution Forecasting. Atmos. Pollut. Res. 2020, 11, 1451–1463. [Google Scholar] [CrossRef] [Scilit]
- dos Santos, C.M.; Rossi, T.J.; Pai, A.D.; Escobedo, J.F.; Souza, A.; Silva, M.B.P. Analysis of the Total, Annual, and Inter-Annual Hourly Mean Direct Solar Normal Irradiation. Arab. J. Geosci. 2022, 15, 219. [Google Scholar] [CrossRef] [Scilit]
- Veefkind, J.P.; Aben, I.; McMullan, K.; Förster, H.; De Vries, J.; Otter, G.; Claas, J.; Eskes, H.J.; De Haan, J.F.; Kleipool, Q.; et al. TROPOMI on the ESA Sentinel-5 precursor: A GMES mission for global observations of the atmospheric composition for climate, air quality and ozone layer applications. Remote Sens. Environ. 2012, 120, 70–83. [Google Scholar] [CrossRef] [Scilit]
- Huang, M.; Carmichael, G.R.; Pierce, R.B.; Jo, D.S.; Park, R.J.; Flemming, J.; Emmons, L.K.; Bowman, K.W.; Henze, D.K.; Davila, Y.; et al. Impact of intercontinental pollution transport on North American ozone air pollution: An HTAP phase 2 multi-model study. Atmos. Chem. Phys. 2017, 17, 5721–5750. [Google Scholar] [CrossRef] [Scilit] [PubMed]
- Larkin, A.; Geddes, J.A.; Martin, R.V.; Xiao, Q.; Liu, Y.; Marshall, J.D.; Brauer, M.; Hystad, P. Global land use regression model for nitrogen dioxide air pollution. Environ. Sci. Technol. 2017, 51, 6957–6964. [Google Scholar] [CrossRef] [Scilit] [PubMed]
- Centro de Monitoramento do Tempo e do Clima de Mato Grosso do Sul (CEMTEC-MS). Banco de Dados Meteorológicos. Secretaria de Estado de Meio Ambiente, Desenvolvimento, Ciência, Tecnologia e Inovação de Mato Grosso do Sul, Brazil. Available online: https://www.cemtec.ms.gov.br/bancodedados/ (accessed on 1 February 2026).
- Copernicus Sentinel-5P. Sentinel-5P TROPOMI Level-2 Nitrogen Dioxide Product User Manual. European Space Agency/Copernicus Programme. Available online: https://sentinels.copernicus.eu/documents/247904/2474726/Sentinel-5P-Level-2-Product-User-Manual-Nitrogen-Dioxide.pdf (accessed on 1 February 2026).
- Copernicus Data Space Ecosystem. Sentinel-5P Level-2 NO2 Data. Available online: https://documentation.dataspace.copernicus.eu/Data/SentinelMissions/Sentinel5P.html (accessed on 1 February 2026).
- Qu, K.; Yan, Y.; Wang, X.; Jin, X.; Vrekoussis, M.; Kanakidou, M.; Brasseur, G.P.; Lin, T.; Xiao, T.; Cai, X.; et al. The effect of cross-regional transport on ozone and particulate matter pollution in China: A review of methodology and current knowledge. Sci. Total Environ. 2024, 947, 174196. [Google Scholar] [CrossRef] [Scilit] [PubMed]
- Vratolis, S.; Gini, M.I.; Bezantakos, S.; Stavroulas, I.; Kalivitis, N.; Kostenidou, E.; Louvaris, E.; Siakavaras, D.; Biskos, G.; Mihalopoulos, N.; et al. Particle number size distribution statistics at City-Centre Urban Background, urban background, and remote stations in Greece during summer. Atmos. Environ. 2019, 213, 711–726. [Google Scholar] [CrossRef] [Scilit]
- Instituto Nacional de Pesquisas Espaciais (INPE). BDQueimadas—Banco de Dados de Queimadas. Programa Queimadas, In-stituto Nacional de Pesquisas Espaciais, Brazil. Available online: https://terrabrasilis.dpi.inpe.br/queimadas/bdqueimadas/ (accessed on 1 February 2026).
- van Geffen, J.; Eskes, H.J.; Boersma, K.F.; Veefkind, J.P.; Loyola, D. S5P TROPOMI tropospheric NO2 slant column retrieval: Method, stability, uncertainties and comparisons with OMI. Atmos. Meas. Tech. 2019, 13, 1315–1335. [Google Scholar] [CrossRef] [Scilit]
- Schneider, P.; Lahoz, W.A.; Van der A, R. Recent satellite-based trends of tropospheric nitrogen dioxide over large urban agglomerations worldwide. Atmos. Chem. Phys. 2015, 15, 1205–1220. [Google Scholar] [CrossRef] [Scilit]
- Vienneau, D.; de Hoogh, K.; Bechle, M.J.; Beelen, R.; Van Donkelaar, A.; Martin, R.V.; Millet, D.B.; Hoek, G. Western European land use regression incorporating satellite- and ground-based measurements of NO2 and PM10. Environ. Sci. Technol. 2013, 47, 13555–13564. [Google Scholar] [CrossRef] [Scilit] [PubMed]
- Xu, X.; Lin, W.; Wang, T.; Yan, P.; Tang, J.; Meng, Z.; Wang, Y. Long-term trend of surface ozone at regional backround station in eastern China 1991–2006: Enhanced variability. Atmos. Chem. Phys. 2008, 8, 2595–2607. [Google Scholar] [CrossRef] [Scilit]
- Rahaman, S.N.; Zeyad, M.; Ahmed, S.M.M.; Zim, A.H. Effect of vegetation and land surface temperature on NO2 concentration: A Google Earth Engine-based remote sensing approach. Urban Clim. 2023, 47, 101336. [Google Scholar] [CrossRef] [Scilit]
- Requia, W.J.; Amini, H.; Mukherjee, R.; Gold, D.R.; Schwartz, J.D. Health impacts of wild fi re-related air pollution in Brazil: A nationwide study of more than 2 million hospital admissions between 2008 and 2018. Nat. Commun. 2021, 12, 6555. [Google Scholar] [CrossRef] [Scilit] [PubMed]
- Franco, M.A.; Morais, F.G.; Rizzo, L.V.; Palácios, R.; Valiati, R.; Teixeira, M.; Machado, L.A.; Artaxo, P. Aerosol optical depth and water vapor variability assessed through autocorrelation analysis. Meteorol. Atmos. Phys. 2024, 136, 15. [Google Scholar] [CrossRef] [Scilit]
- Nassarden, D.; Menezes, J.; Pessoa, C.B.; Carneiro, A.; dos Santos, L.O.F.; Cirino, G.; Imbiriba, B.; Sallo, F.; Curado, L.F.A.; Rodrigues, T.R.; et al. Evaluation and calibration of MERRA-2 and CAMS reanalysis for PM2.5 in a semi-urbanized area in the south of the Amazon. Air Qual. Atmos. Health 2025, 18, 1957–1972. [Google Scholar] [CrossRef] [Scilit]
- Rodrigues, S.; Cirino, G.; Moreira, D.; Pozzer, A.; Palácios, R.; Lee, S.C.; Imbiriba, B.; Nogueira, J.; Vitorino, M.I.; Vourlitis, G. Enhanced net CO2 exchange of a semideciduous forest in the southern Amazon due to diffuse radiation from biomass burning. Biogeosciences 2024, 21, 843–868. [Google Scholar] [CrossRef] [Scilit]
- Curado, L.F.A.; de Paulo, S.R.; da Silva, H.J.A.; Palacios, R.S.; Marques, J.B.; de Paulo, I.J.C.; Dalmagro, H.J.; Rodrigues, T.R. Effect of biomass burning emission on carbon assimilation over Brazilian Pantanal. Theor. Appl. Climatol. 2023, 155, 999–1006. [Google Scholar] [CrossRef] [Scilit]
- Zhu, J.; Tai, A.P.; Hung Lam Yim, S. Effects of ozone–vegetation interactions on meteorology and air quality in China using a two-way coupled land–atmosphere model. Atmos. Chem. Phys. 2022, 22, 765–782. [Google Scholar] [CrossRef] [Scilit]
- MapBiomas Project. Collection 9 of the Annual Land Use and Land Cover Maps of Brazil. Available online: https://brasil.mapbiomas.org/ (accessed on 1 February 2026).
- Shikhovtsev, M.Y.; Makarov, M.M.; Aslamov, I.A.; Tyurnev, I.N.; Molozhnikova, Y.V. Application of Modern Low-Cost Sensors for Monitoring of Particle Matter in Temperate Latitudes: An Example from the Southern Baikal Region. Sustainability 2025, 17, 3585. [Google Scholar] [CrossRef] [Scilit]
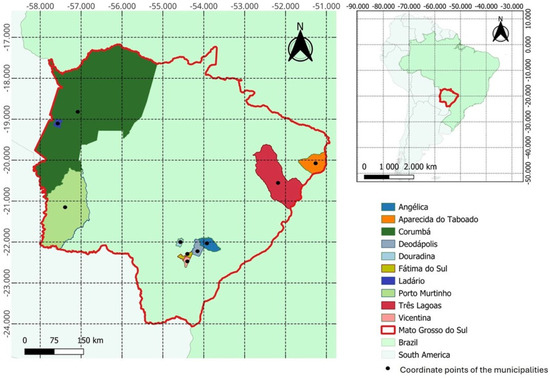
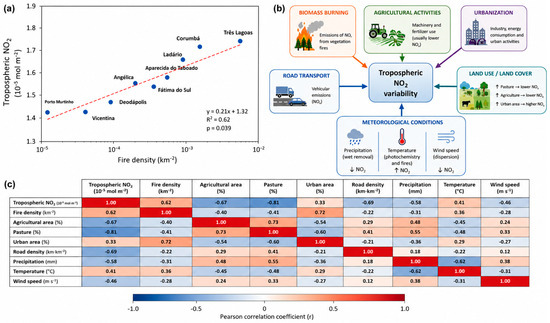
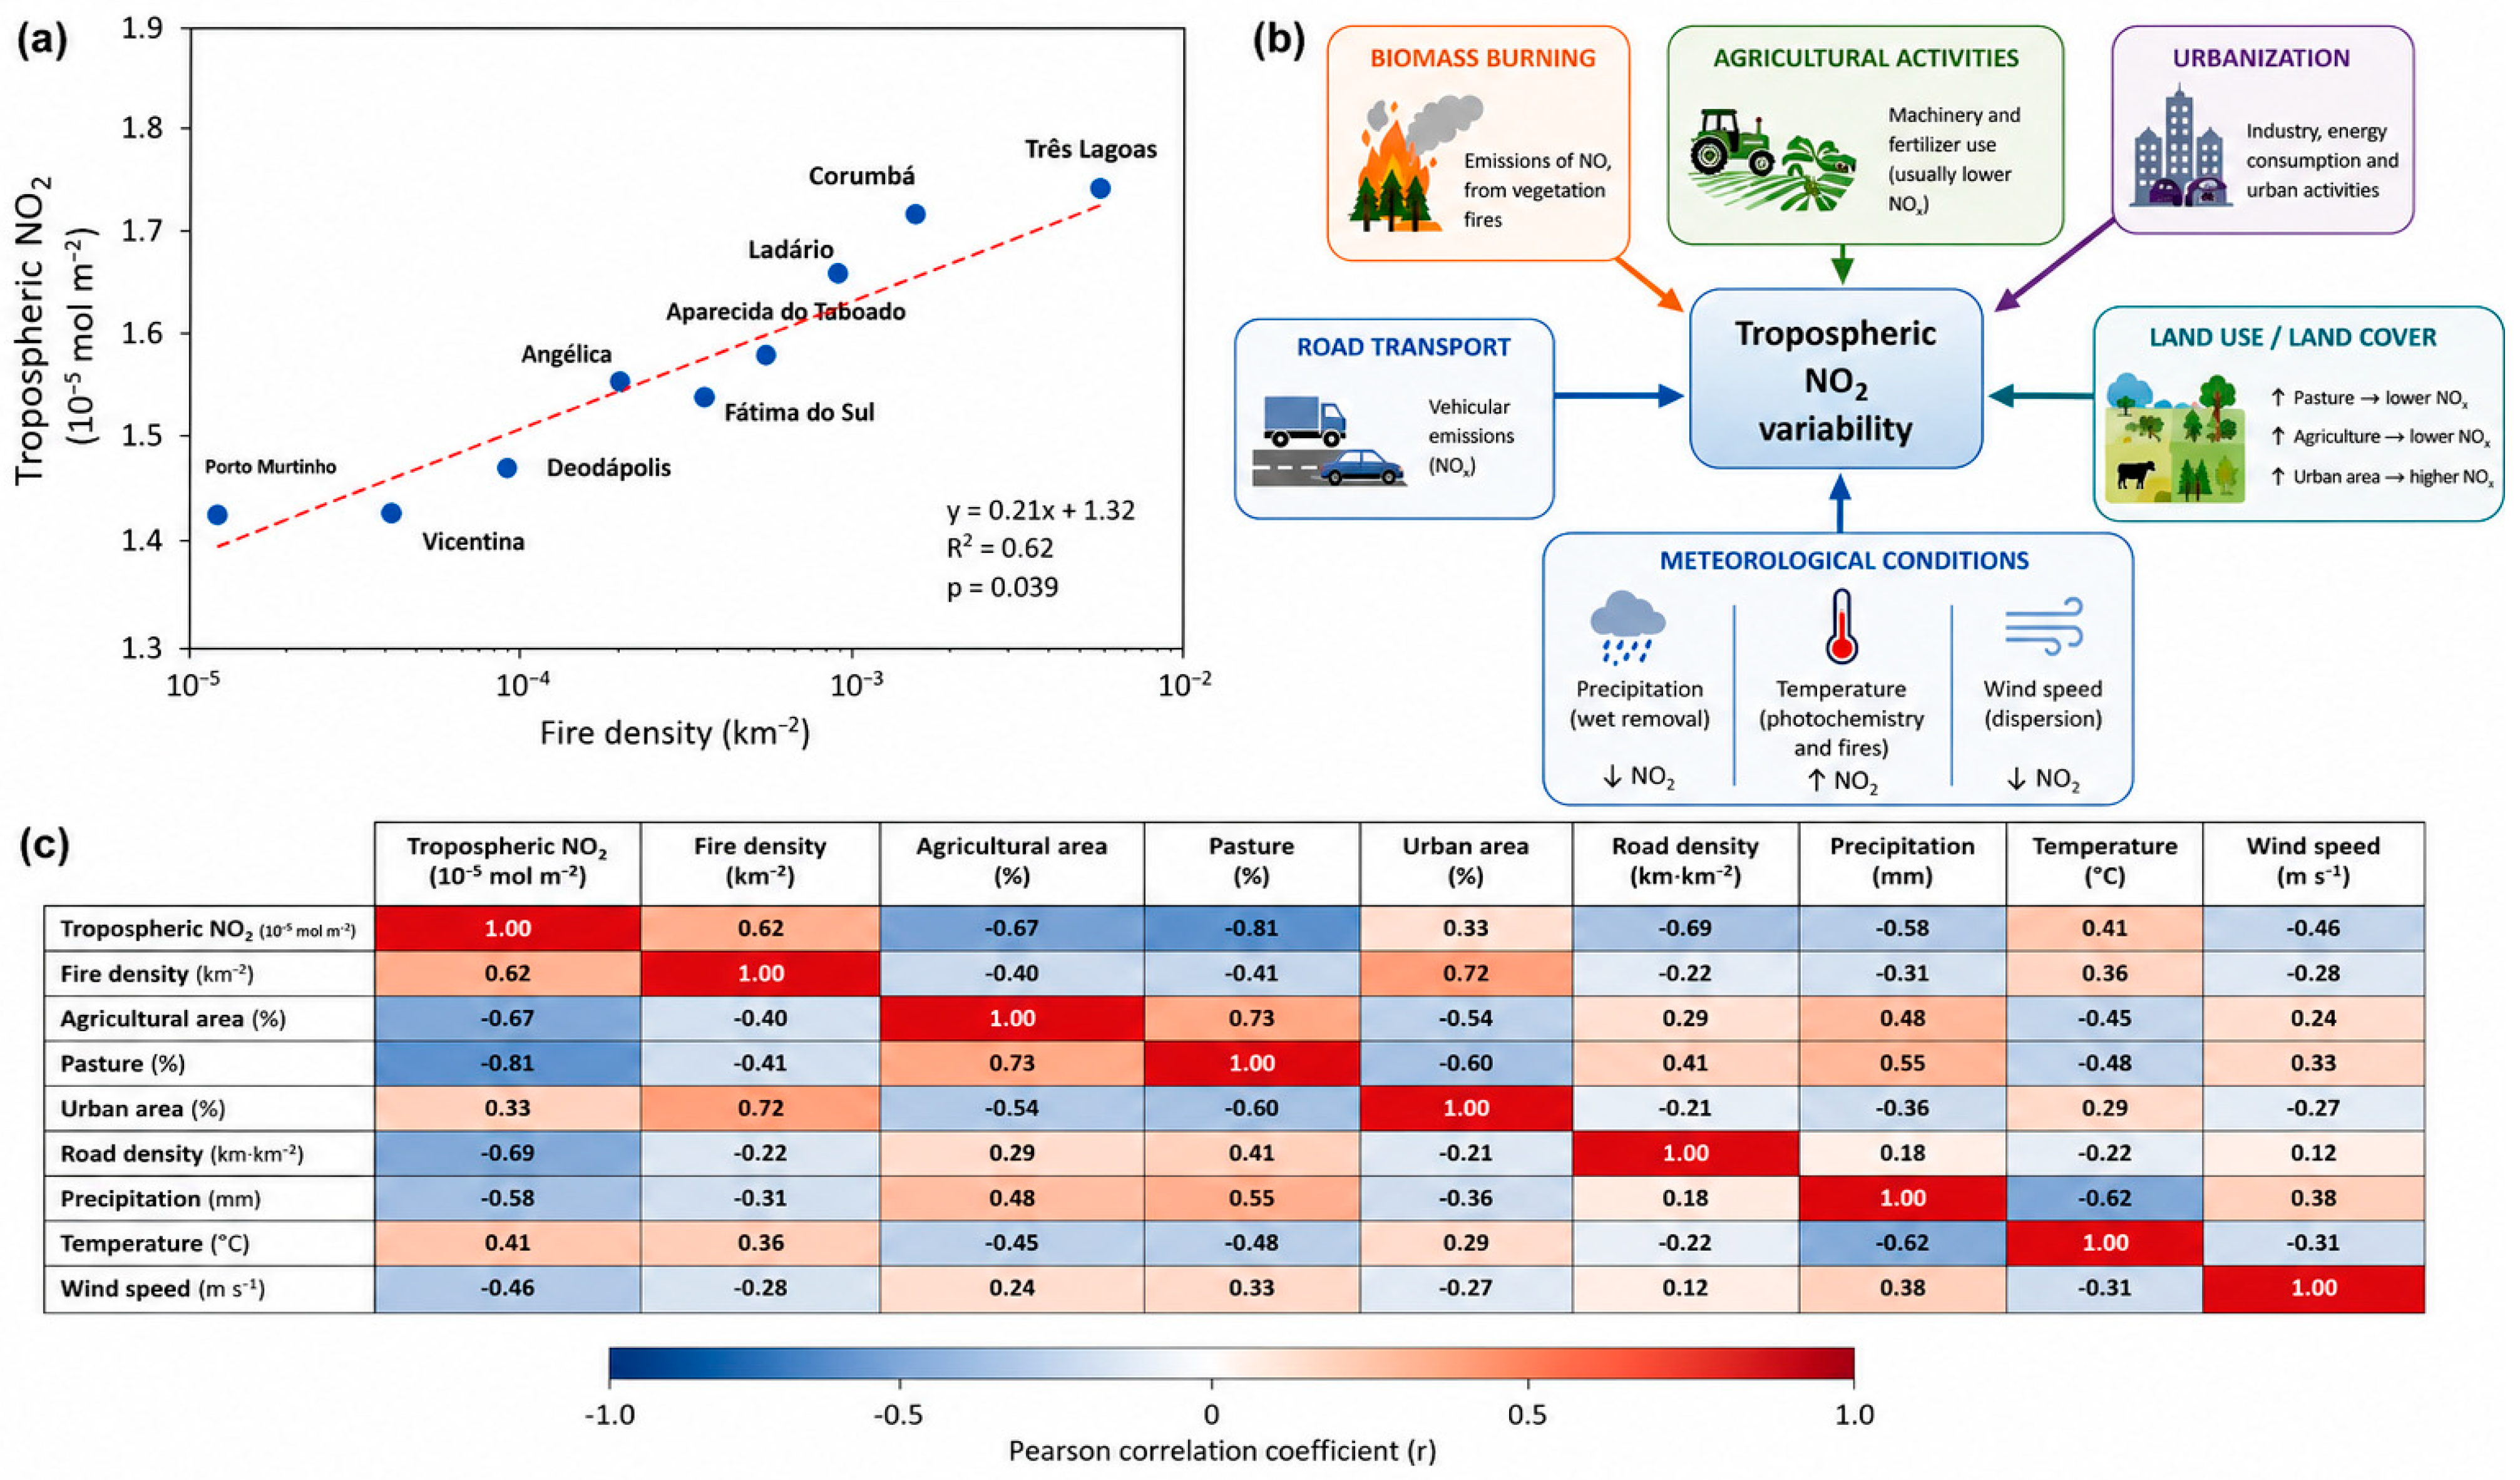
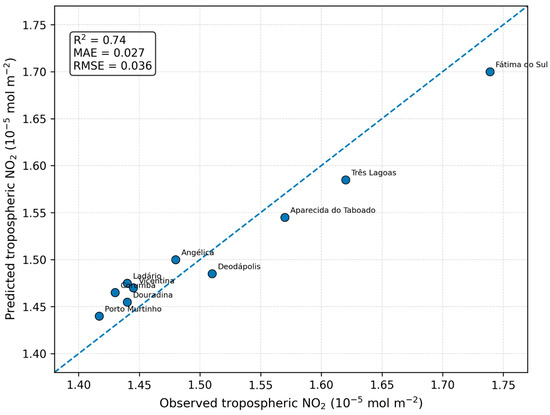
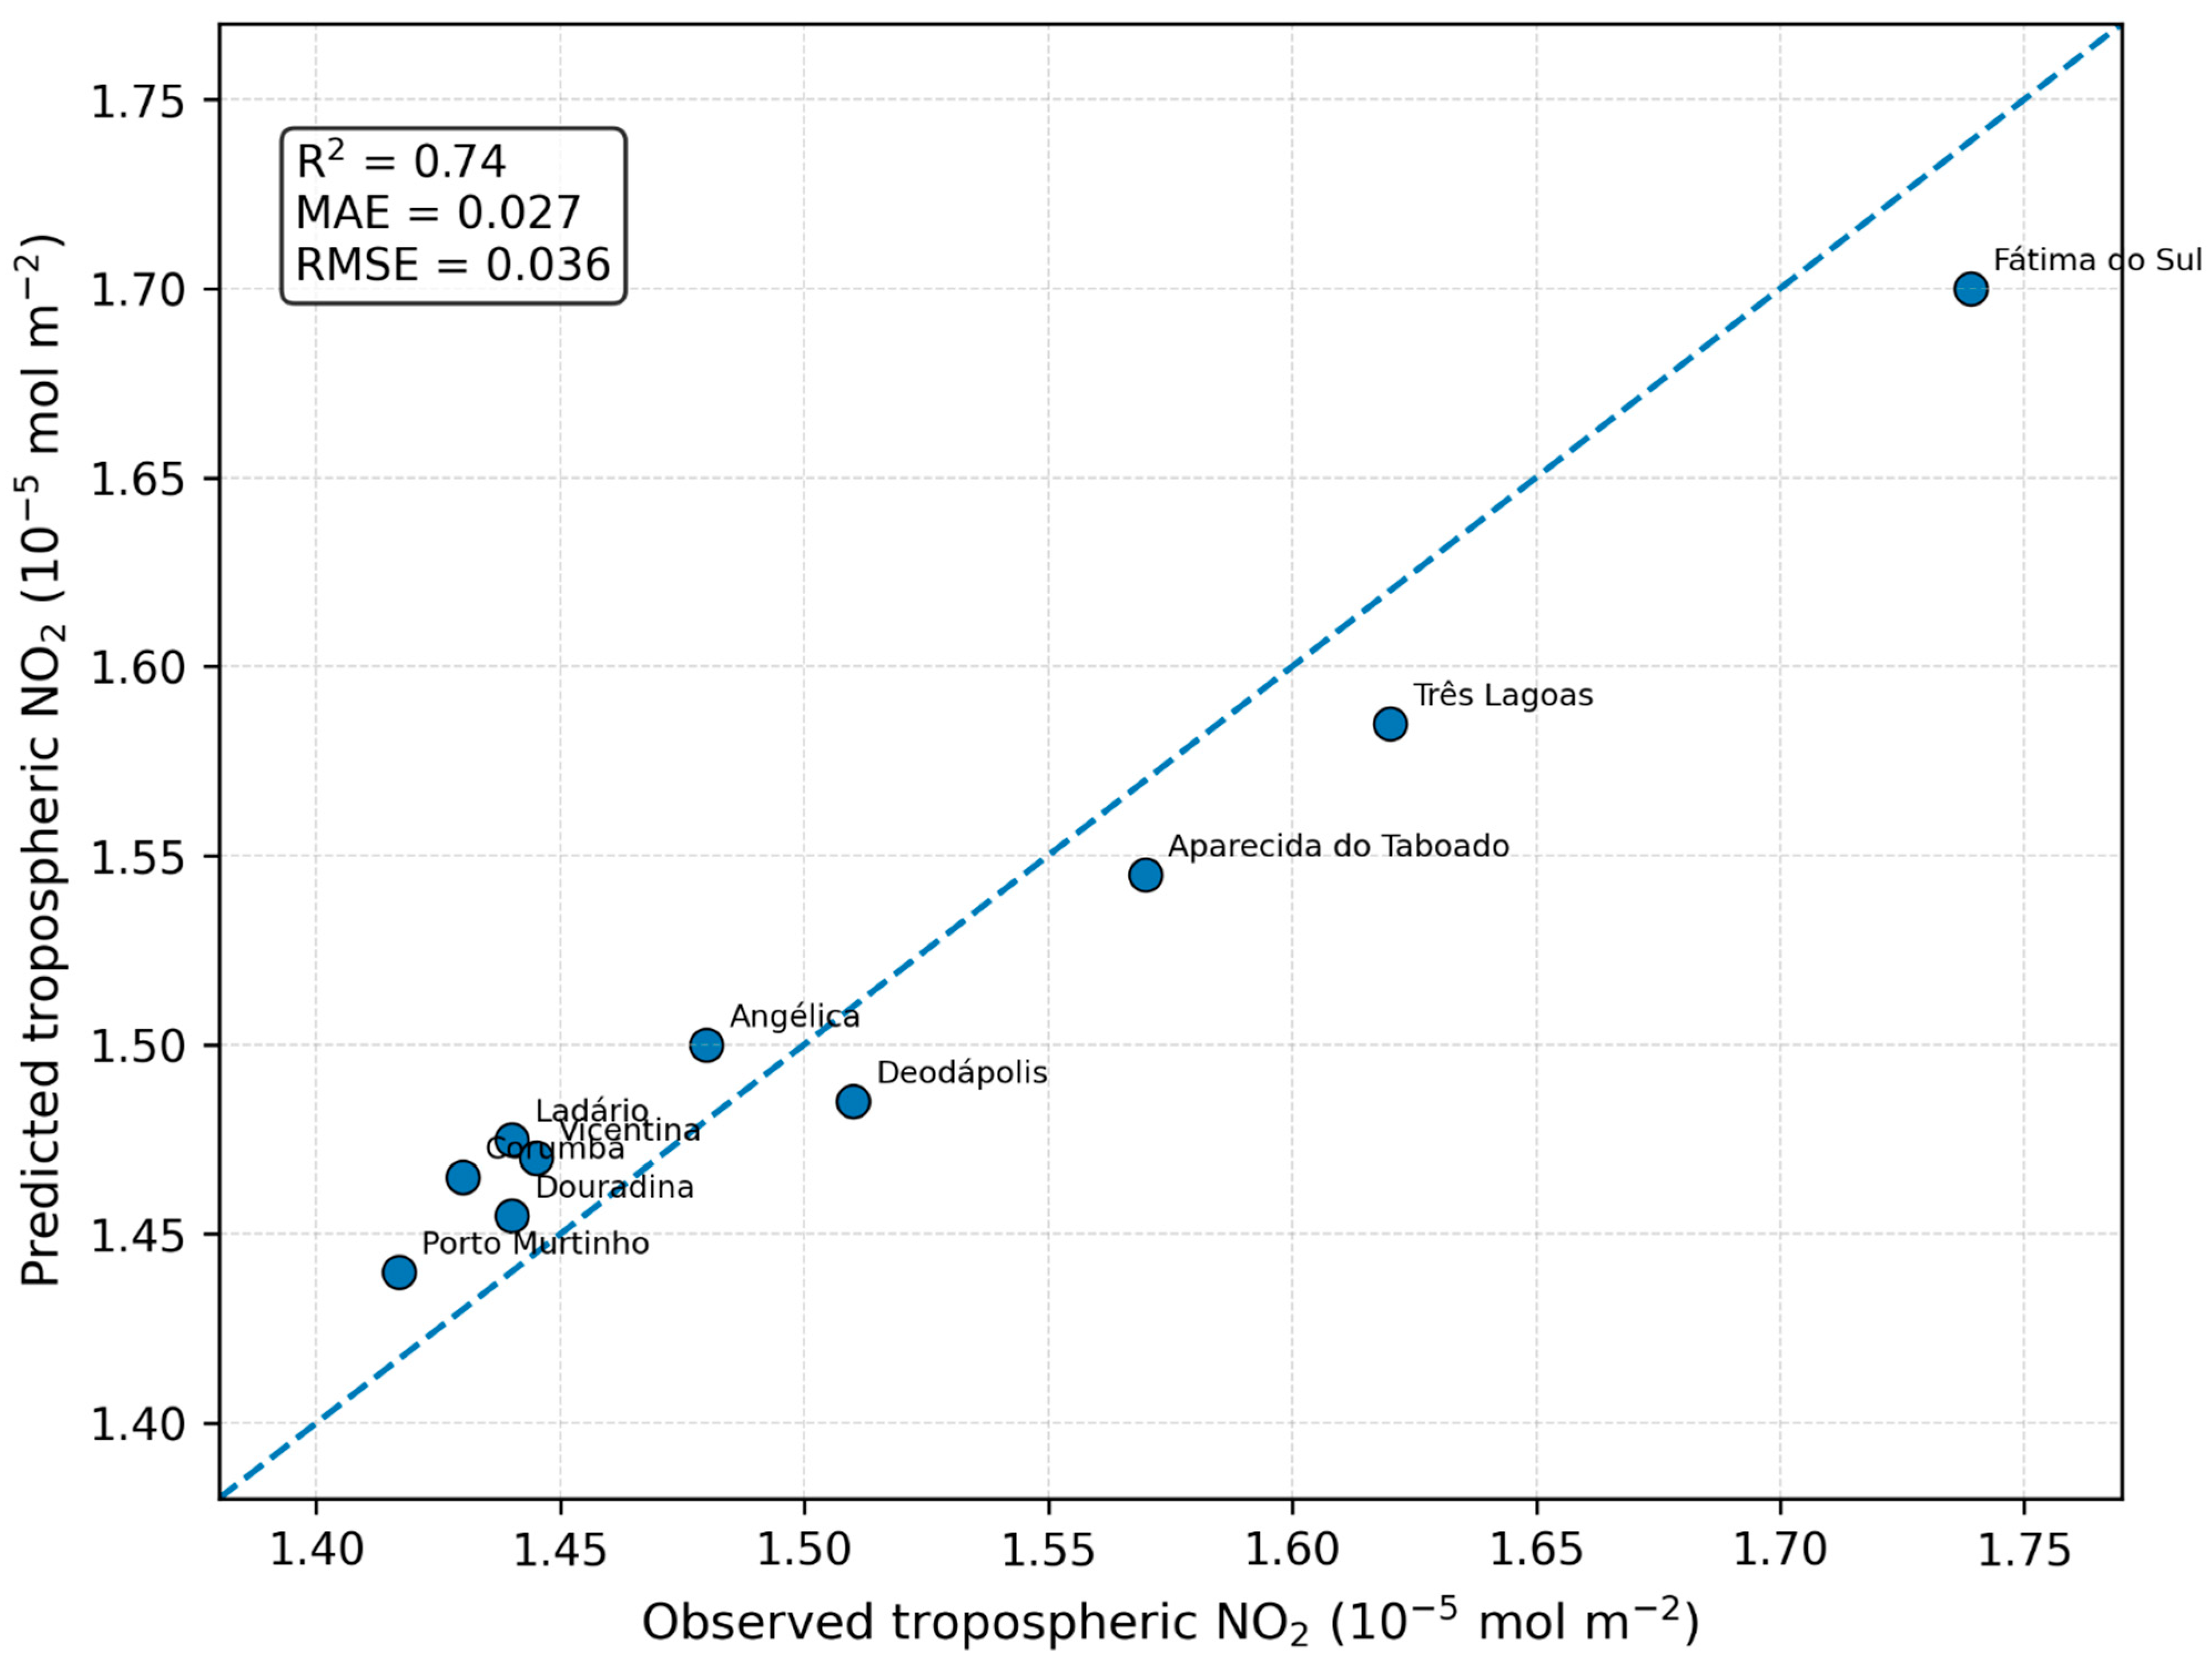
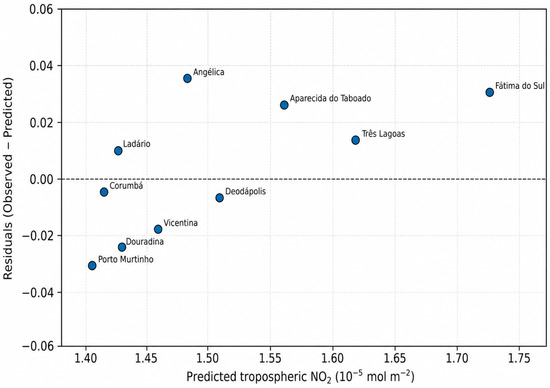
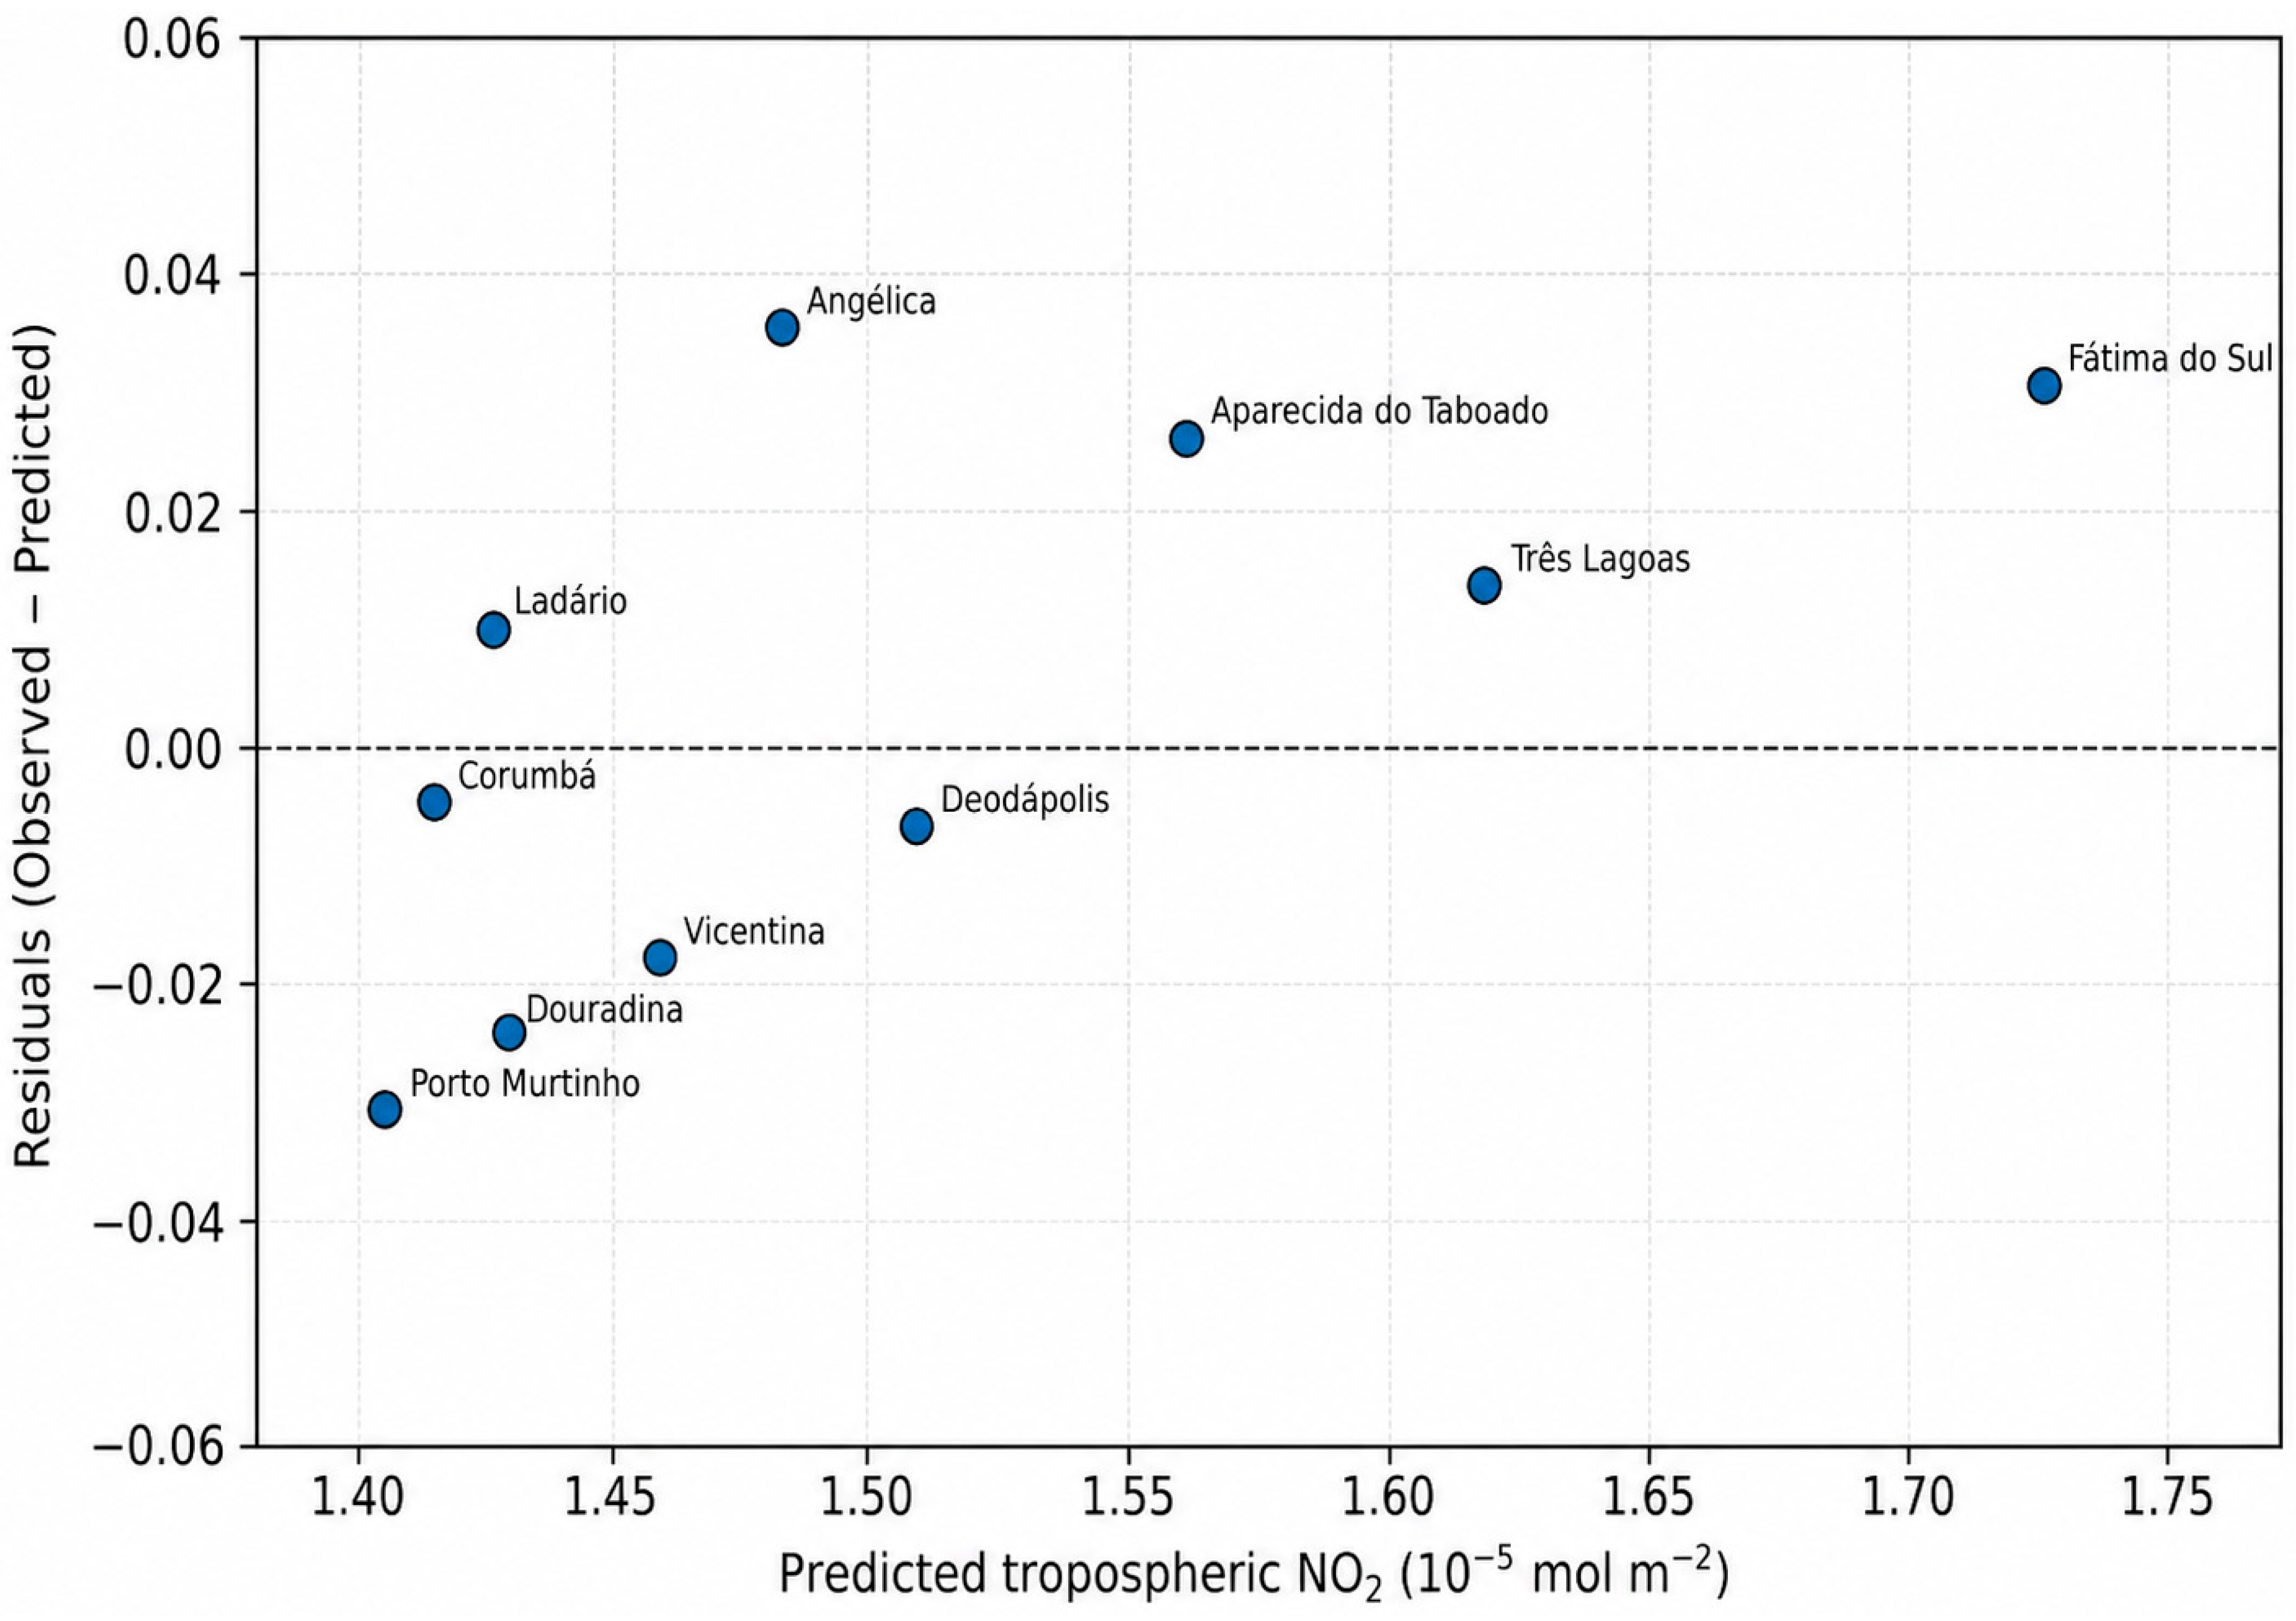
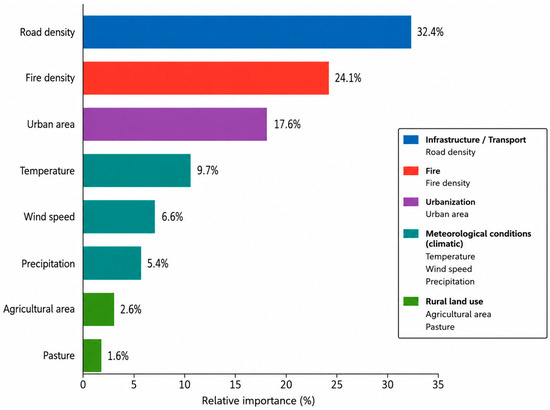

Disclaimer/Publisher’s Note: The statements, opinions and data contained in all publications are solely those of the individual author(s) and contributor(s) and not of MDPI and/or the editor(s). MDPI and/or the editor(s) disclaim responsibility for any injury to people or property resulting from any ideas, methods, instructions or products referred to in the content. |
© 2026 by the authors. Licensee MDPI, Basel, Switzerland. This article is an open access article distributed under the terms and conditions of the Creative Commons Attribution (CC BY) license.