


Abstract
Pollen exposure drives allergic disease in millions of Americans, yet no standardized, publicly available national pollen dataset has existed until now. We describe the first nationally standardized and publicly available dataset of pollen season timing and airborne pollen concentrations. The data were derived from the National Allergy Bureau™ (NAB™), the only pollen and mold measuring network in the United States certified by the American Academy of Allergy, Asthma & Immunology (AAAAI), and curated, processed, and disseminated by the U.S. Centers for Disease Control and Prevention (CDC). The 2003–2024 dataset provides standardized measures of (1) taxa-specific historical average main pollen season (MPS) concentrations and timing (e.g., start dates, peak dates, end dates, season length); (2) taxa-specific yearly MPS concentrations and timing; (3) grouped weekly MPS concentrations, levels, and timing; and (4) grouped daily pollen levels and MPS timing. Pollen concentrations are reported as pollen grains per cubic meter (PPCM). MPS timing is computed using a 3-day consecutive method: season start occurs after the first occurrence of three consecutive days with concentrations > 1.0 PPCM; season peak is the day of maximum concentration; and season end occurs after the first occurrence of three consecutive days with concentrations < 1.0 PPCM after the peak. Historical average timing is calculated in a 365-day-of-year format and converted to calendar dates using 2024 as a reference year for display and consistency. By combining long-term data from monitoring sites across the country, this dataset shows how pollen levels vary over time and across geographic locations. This resource supports tracking pollen trends, linking pollen with weather and climate factors, and informing public health action, clinical care, and communication about population exposure and the impact to allergic diseases such as asthma and hay fever.
1. Introduction
Airborne pollen affects millions of Americans and represents a major public health challenge. Breathing in airborne pollen can cause allergic reactions that lead to inflammation and allergic rhinitis, commonly known as hay fever, which is characterized by symptoms such as sneezing, nasal congestion, and a runny nose. Beyond allergic responses, large quantities of pollen can also physically irritate mucous membranes, affecting even those without pollen allergies. Allergic rhinitis affects between 15% to 30% of the United States (U.S.) population, and pollen exposure can also worsen asthma symptoms [1,2]. Airborne pollen concentrations are associated with increased asthma-related emergency department visits, especially during peak pollen season [3,4]. The medical costs for allergic rhinitis, including both direct and indirect costs, exceed $18B annually [5]. Shifting temperatures and rainfall patterns have changed when and how intensely pollen seasons occur across North America. In many regions, pollen seasons now start earlier and last longer [6,7,8]. As pollen exposure expands in magnitude, frequency, and allergenicity collecting consistent pollen data over time is critical for tracking how these exposures change and affect public health.
Until now, access to reliable, consistent pollen measurements has been limited in the U.S. This has made it difficult to compare pollen seasons across regions, understand year to year variation, and study how weather and climate drive pollen levels. The National Allergy Bureau™ (NAB™), part of the American Academy of Allergy, Asthma & Immunology (AAAAI) Aeroallergen Network, has operated and certified the only U.S. pollen and mold counting network since the 1990s [9]. However, NAB data is not publicly available at the national level and was previously not standardized in a format suited for environmental health research and public health decision-making.
To fill this gap, the CDC and AAAAI is launching the first publicly available, standardized dataset of airborne pollen concentrations and season timing in North America using pollen concentration data collected from NAB certified monitoring stations, with data processing performed by the U.S. Centers for Disease Control and Prevention (CDC). The dataset will be available through CDC’s National Environmental Public Health Tracking Network (Tracking Network), a dynamic, web-based system that integrates standardized data on environmental hazards, exposures, and health effects [10], utilizing a network of partners with vast expertise. Data are disseminated through the Tracking Network’s flagship product, the Data Explorer [10], and through dashboards, an application programming interface (API), and other tools. The pollen data are available from 2003 through 2024 and includes ready-to-use pollen measures including: main pollen season (MPS) start date, peak date, end date, season length, seasonal pollen concentration (i.e., seasonal pollen integral), and categorical pollen levels. Pollen data are available at multiple time scales including historical averages, yearly data, weekly, and daily pollen data (grouped pollen only). Data availability varies by year and pollen type for each NAB site. By pairing certified monitoring data with transparent, reproducible methods and outputs, this resource enhances public accessibility to nationally consistent pollen information and supports public health surveillance, clinical decision-making, risk communication, and research on climate-driven changes in pollen exposure and allergic disease burdens.
2. Materials and Methods
2.1. Data Source and Geographic Representation
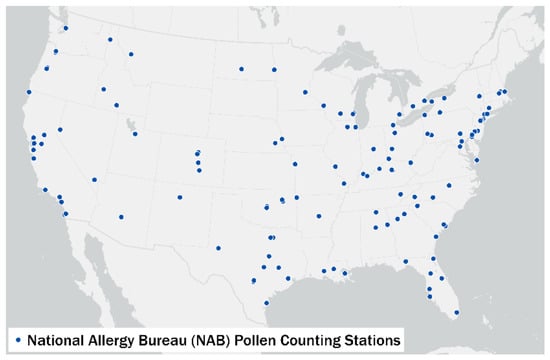
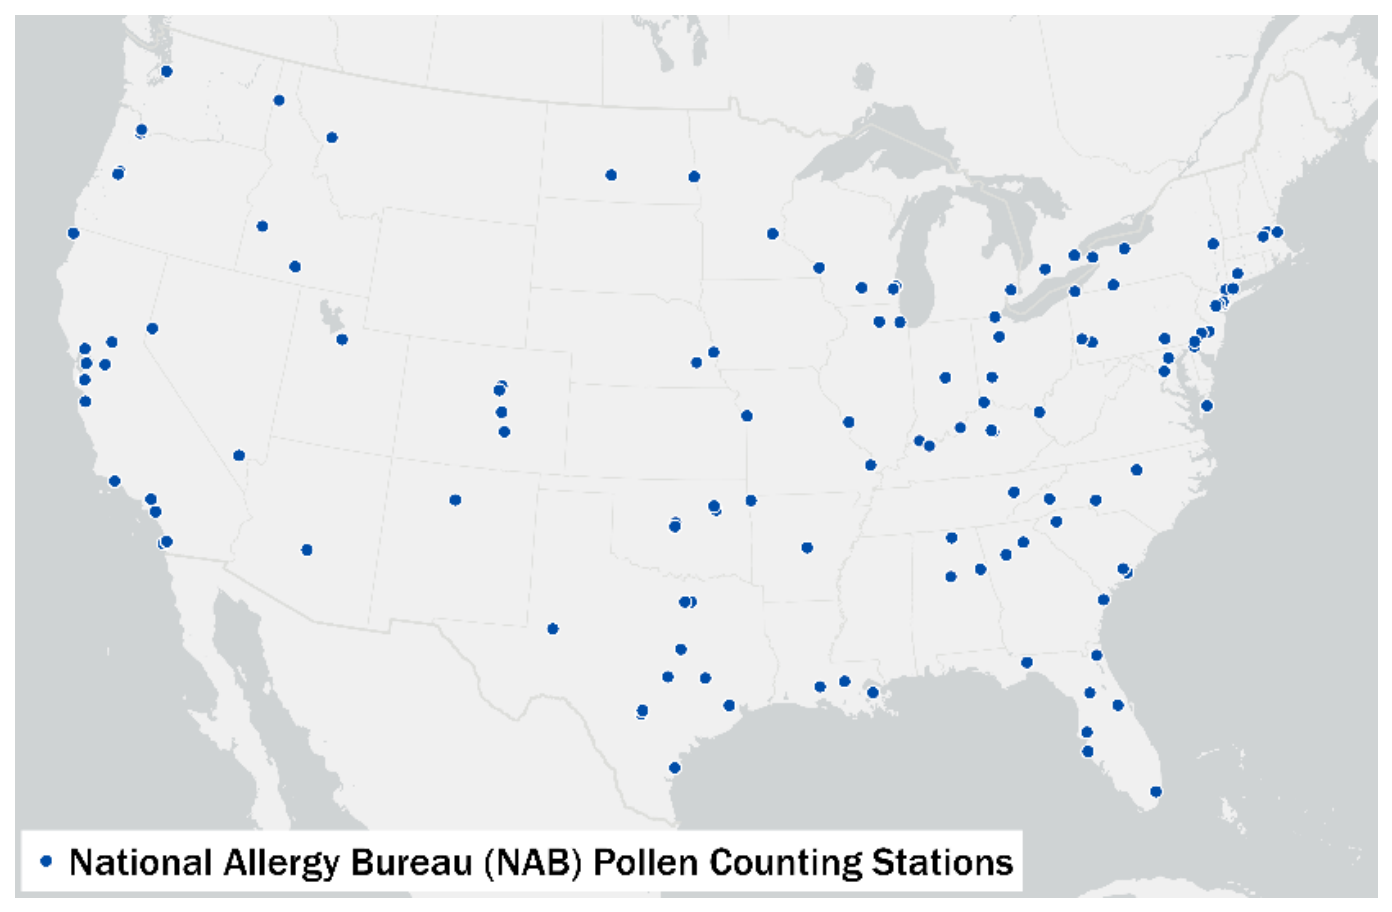
Daily pollen concentration data were provided by 125 NAB-certified counting stations located in the continental U.S., although only 42 NAB stations are currently active. The data are shown as points on a map, each representing a National Allergy Bureau (NAB) pollen monitoring station (Figure 1). Station measurements are best interpreted as representative of pollen measures for the surrounding area, but there can be substantial variation in airborne pollen concentrations at neighborhood-level spatial scales due to differences in plant distributions, phenology, and meteorology. Although there is much uncertainty in the effective range of a pollen monitoring station, epidemiological analyses have often found the strongest associations between pollen and health effects occur at a spatial scale of approximately 5–25 km, suggesting that NAB pollen measurement are representative of areas at least this size [3,4]. All statistical analyses and data figures were performed and developed using R (version 4.4.1, R Core Team, 2024). Spatial analyses and mapping were conducted using ArcGIS Pro (version 3.5.3; Esri, 2025, Redlands, CA, USA).
Figure 1.
Pollen counting stations of the NAB.
2.2. Sampling Equipment, Collection Schedule, and Laboratory Analysis
Airborne pollen grains were collected using NAB certified volumetric sampling equipment, including Rotorod samplers or Burkard samplers. The Rotorod sampler uses rotating sticky arms to collect airborne particles, with the amount of air sampled estimated from how fast the rods spins, and works best for larger particles like pollen but can be affected by wind conditions. In contrast, the Burkard sampler uses suction to pull in particles on a sticky sampling surface at a constant rate, allowing for more accurate measurement of air volume and more consistent collection of both large and small pollen particles [11].
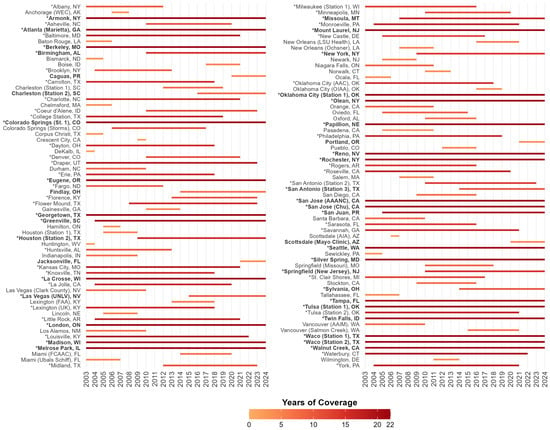
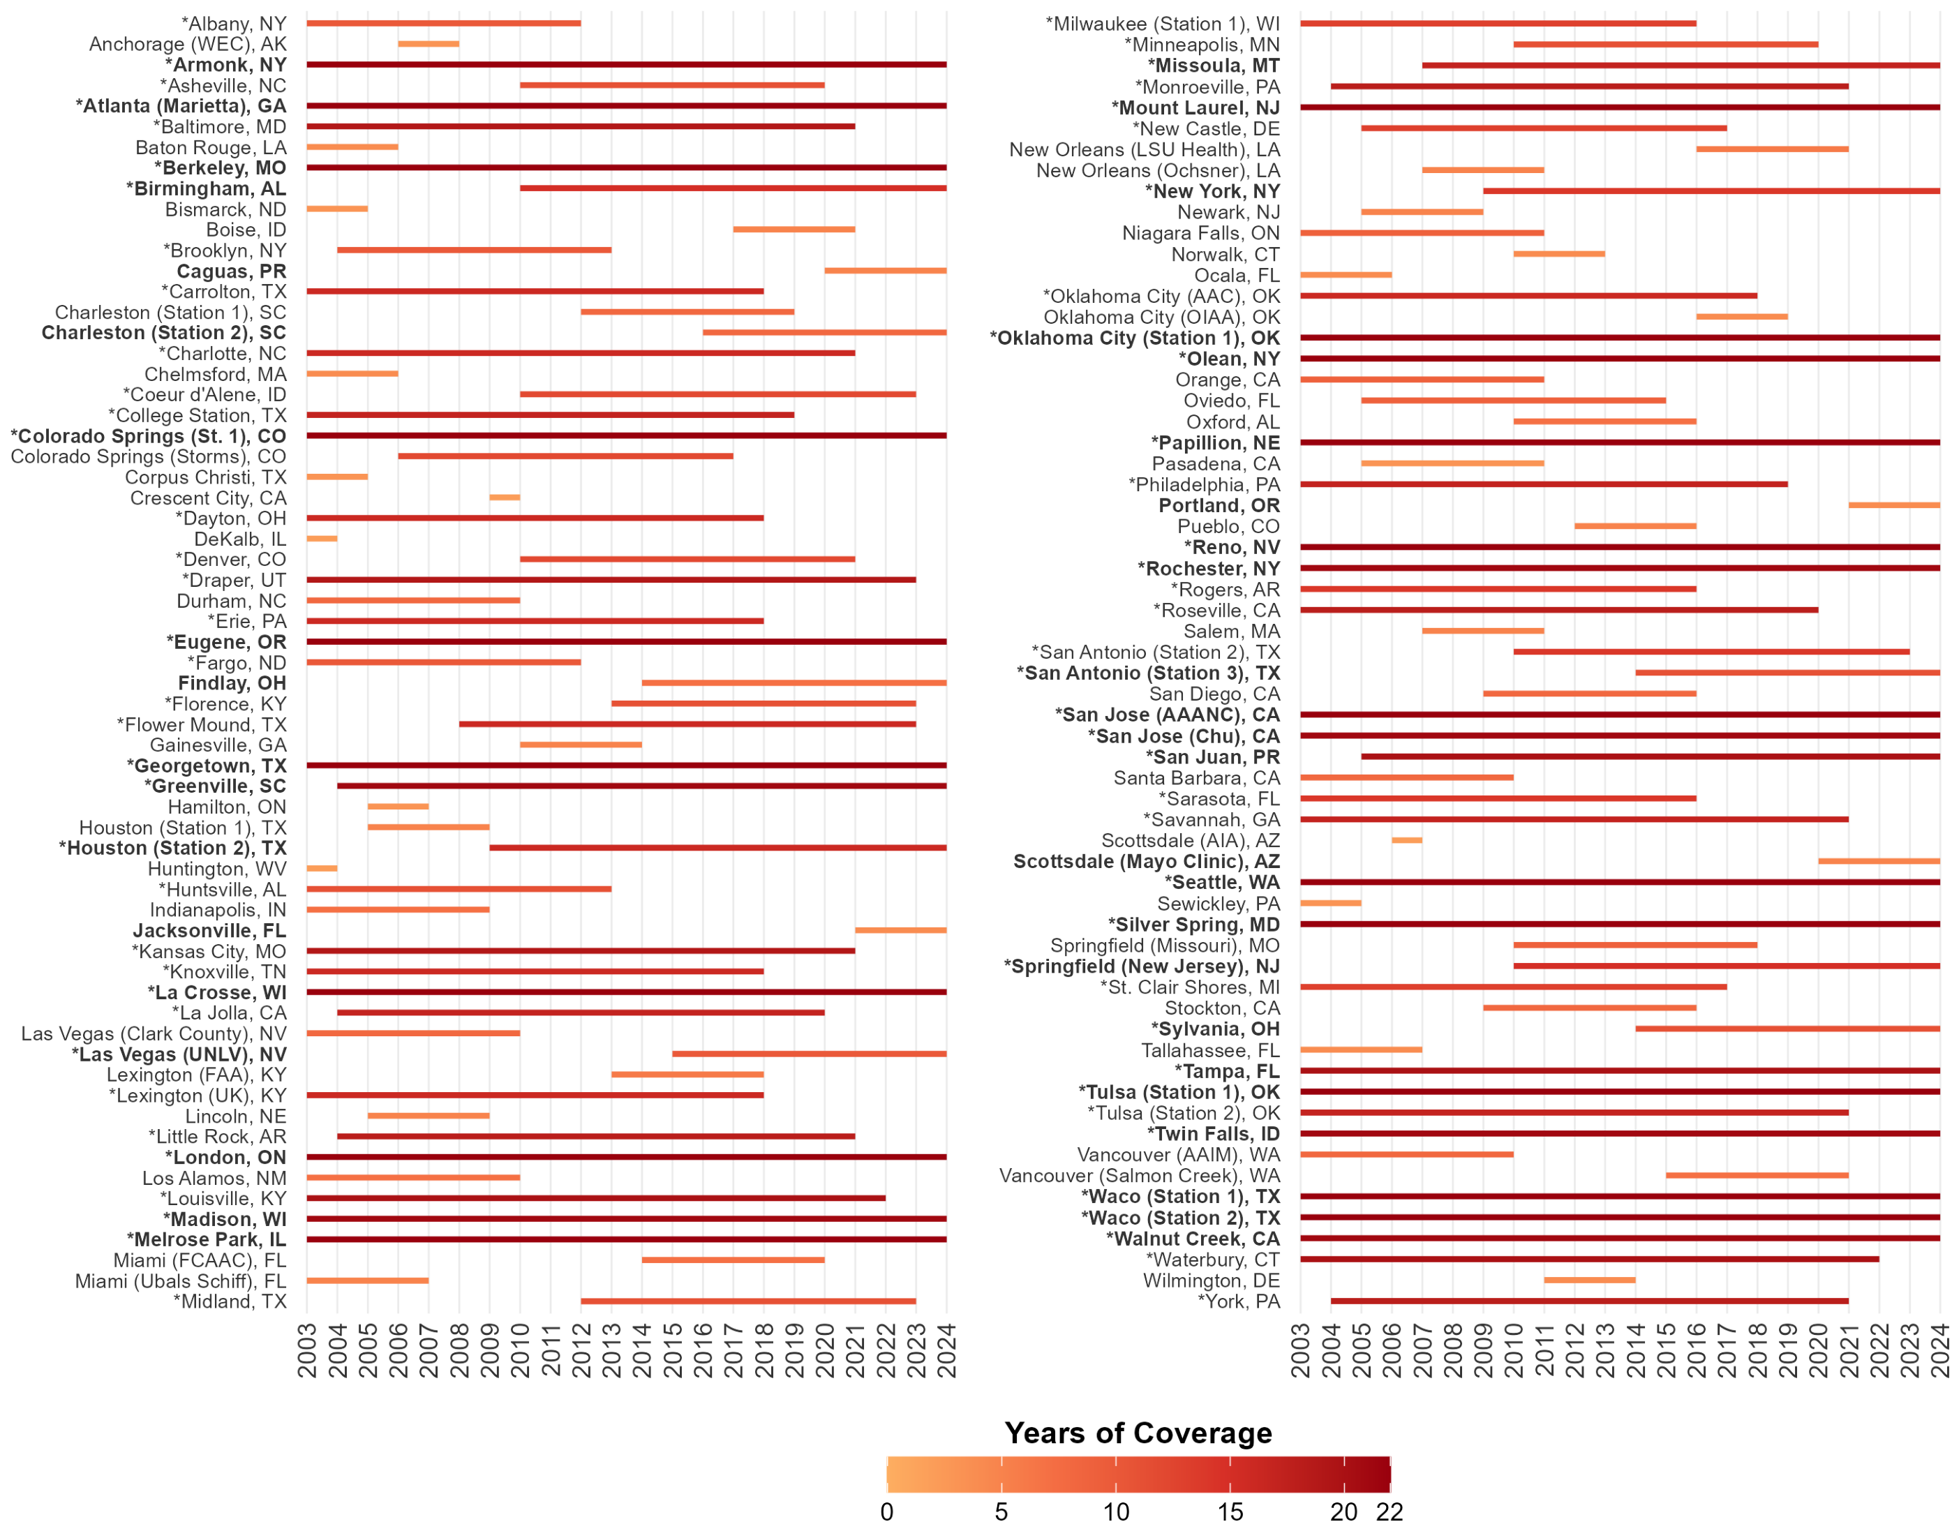
Collected samples are analyzed by microscopy at the genus level to identify and count pollen grains. Pollen concentrations are reported as pollen grains per cubic meter (PPCM). Collection schedules vary by station and season, commonly 3 days per week (e.g., within a Sunday-Thursday window) outside peak periods, with daily collection at some stations during periods of historically high pollen concentrations. However, because these NAB pollen stations are self-funded, not all have the resources or staff to maintain consistent collection, resulting in significant gaps in the pollen records at many stations (See Figure 2). NAB counting stations adhere to certification standards that include regular calibration of collection equipment, standardized counting procedures, and quality control reviews of pollen identification [9].
Figure 2.
Temporal pollen data coverage for the National Allergy Bureau (NAB) pollen counting stations, 2003–2024. Stations in bold are currently active; stations marked with an asterisk (*) have 10 years of pollen observations or more.
NAB-certified counting stations operate under standardized certification and quality assurance procedures established by the American Academy of Allergy, Asthma & Immunology, including requirements for equipment calibration, technician certification, pollen identification, counting methods, and periodic quality control review. Although NAB-certified stations follow established monitoring protocols, sampling schedules and instrumentation may vary among stations and over time. To improve comparability across stations, CDC applied consistent data quality review procedures, season definitions, concentration calculations, and metric derivation methods to all observations. For this analysis, standardization refers to the processing and derivation of pollen metrics rather than identical sampling equipment or collection schedules across monitoring locations.
2.3. Pollen Taxa and Groupings
Public NAB reporting commonly provides grouped pollen products. In this dataset, grouped taxa include: grouped all pollen, grouped trees, and grouped weeds. Grouped grass pollen metrics were excluded from selected products to align with National Allergy Bureau™ (NAB™) data sharing policies. Public release of grouped grass data could allow inference of taxa-specific concentrations in some contexts; therefore, these metrics are not included. In addition, several allergenic plant taxa identified to genus or family level are available for annual and historical season timing metrics, which were chosen based on allergenicity and their known significance to public health: Acer (Maple), Ambrosia (Ragweed), Cupressaceae (Juniper/Cypress), Fraxinus (Ash), Morus (Mulberry), Pinaceae (Pine), Populus (Poplar/Cottonwood/Aspen), Quercus (Oak), and Ulmus (Elm).
2.4. Pollen Season Definition and Rationale
Pollen season timing is calculated using a three consecutive-observations method:
Season Start: The first occurrence of three consecutive-observations with pollen concentrations >1.0 PPCM for each pollen type
Season Peak: The date of maximum pollen concentration
Season End: The first occurrence of three consecutive-observations with concentrations <1.0 PPCM after the peak
Season Length: The number of days from season start to season end
We utilized a consecutive-observation method to define main pollen season timing, consistent with methods applied in previous pollen-related research [12,13]. We selected this approach due to the ability to effectively capture MPS start and end dates, even when pollen observations are not available for the entire year [14,15]. Additionally, this approach allow MPS start and end dates to be calculated as the season progresses, lends to rapid analysis and reporting of MPS timing, and provides consistent metrics across locations and pollen types when sampling data is temporally limited [15]. A threshold of 1.0 PPCM was selected because it represents the minimum detectable concentration indicating the presence of airborne pollen and provides a consistent threshold that can be applied across pollen taxa and monitoring locations. Coupling the 1.0 PPCM threshold with a requirement for three consecutive observations helps minimize the influence of isolated pollen detections resulting from meteorological variability, long-distance transport, or measurement variability, providing a more robust estimate of MPS onset and end.
Alternative approaches for defining pollen seasons, including cumulative percentage and percentile-based methods, have been described in the aerobiological literature. We selected the consecutive-observation method because it has been applied in previous pollen season studies and can be consistently implemented across stations with varying observation schedules.
2.5. Standardized Pollen Measures and Summary Statistics
We provide a dataset that includes a combination of established aerobiological indicators, statistical summary measures, and standardized dataset products derived from NAB pollen observations. Established aerobiological indicators include main pollen season (MPS) start, peak, end, and season length. Statistical summary measures include pollen concentrations calculated at multiple temporal scales, as outlined in Table 1. Pollen dates were converted to a 365 day of year format using 2024 as the reference year for all date calculations, the last year of pollen data for this release. For consistency with public health reporting and plain-language clarity, we use the term seasonal pollen concentration; however, this metric is equivalent to the Seasonal Pollen Integral (SPIn) commonly used in aerobiology and represents the cumulative sum of daily pollen concentrations over a defined pollen season. Terminology used throughout this manuscript and in the dataset follows recommended aerobiological nomenclature where applicable, including use of Pollen Concentration Per Cubic Meter (PPCM), Main Pollen Season (MPS), and Seasonal Pollen Integral (SPIn) [16].
Table 1.
Summary of Derived Pollen Metrics in the CDC Standardized Pollen Dataset.
2.6. Pollen Level Categorization
Daily pollen levels are determined from PPCM concentrations that fall within the following thresholds, which are based on the proportion of days exceeding these PPCM numbers:
Grouped Trees
Very High: ≥1500 PPCM
High: 90–1500 PPCM
Moderate: 15–90 PPCM
Low: <15 PPCM
Grouped Weeds
Very High: ≥500 PPCM
High: 50–500 PPCM
Moderate: 10–50 PPCM
Low: <10 PPCM
3. Results: Dataset Description—Geography, Time Period
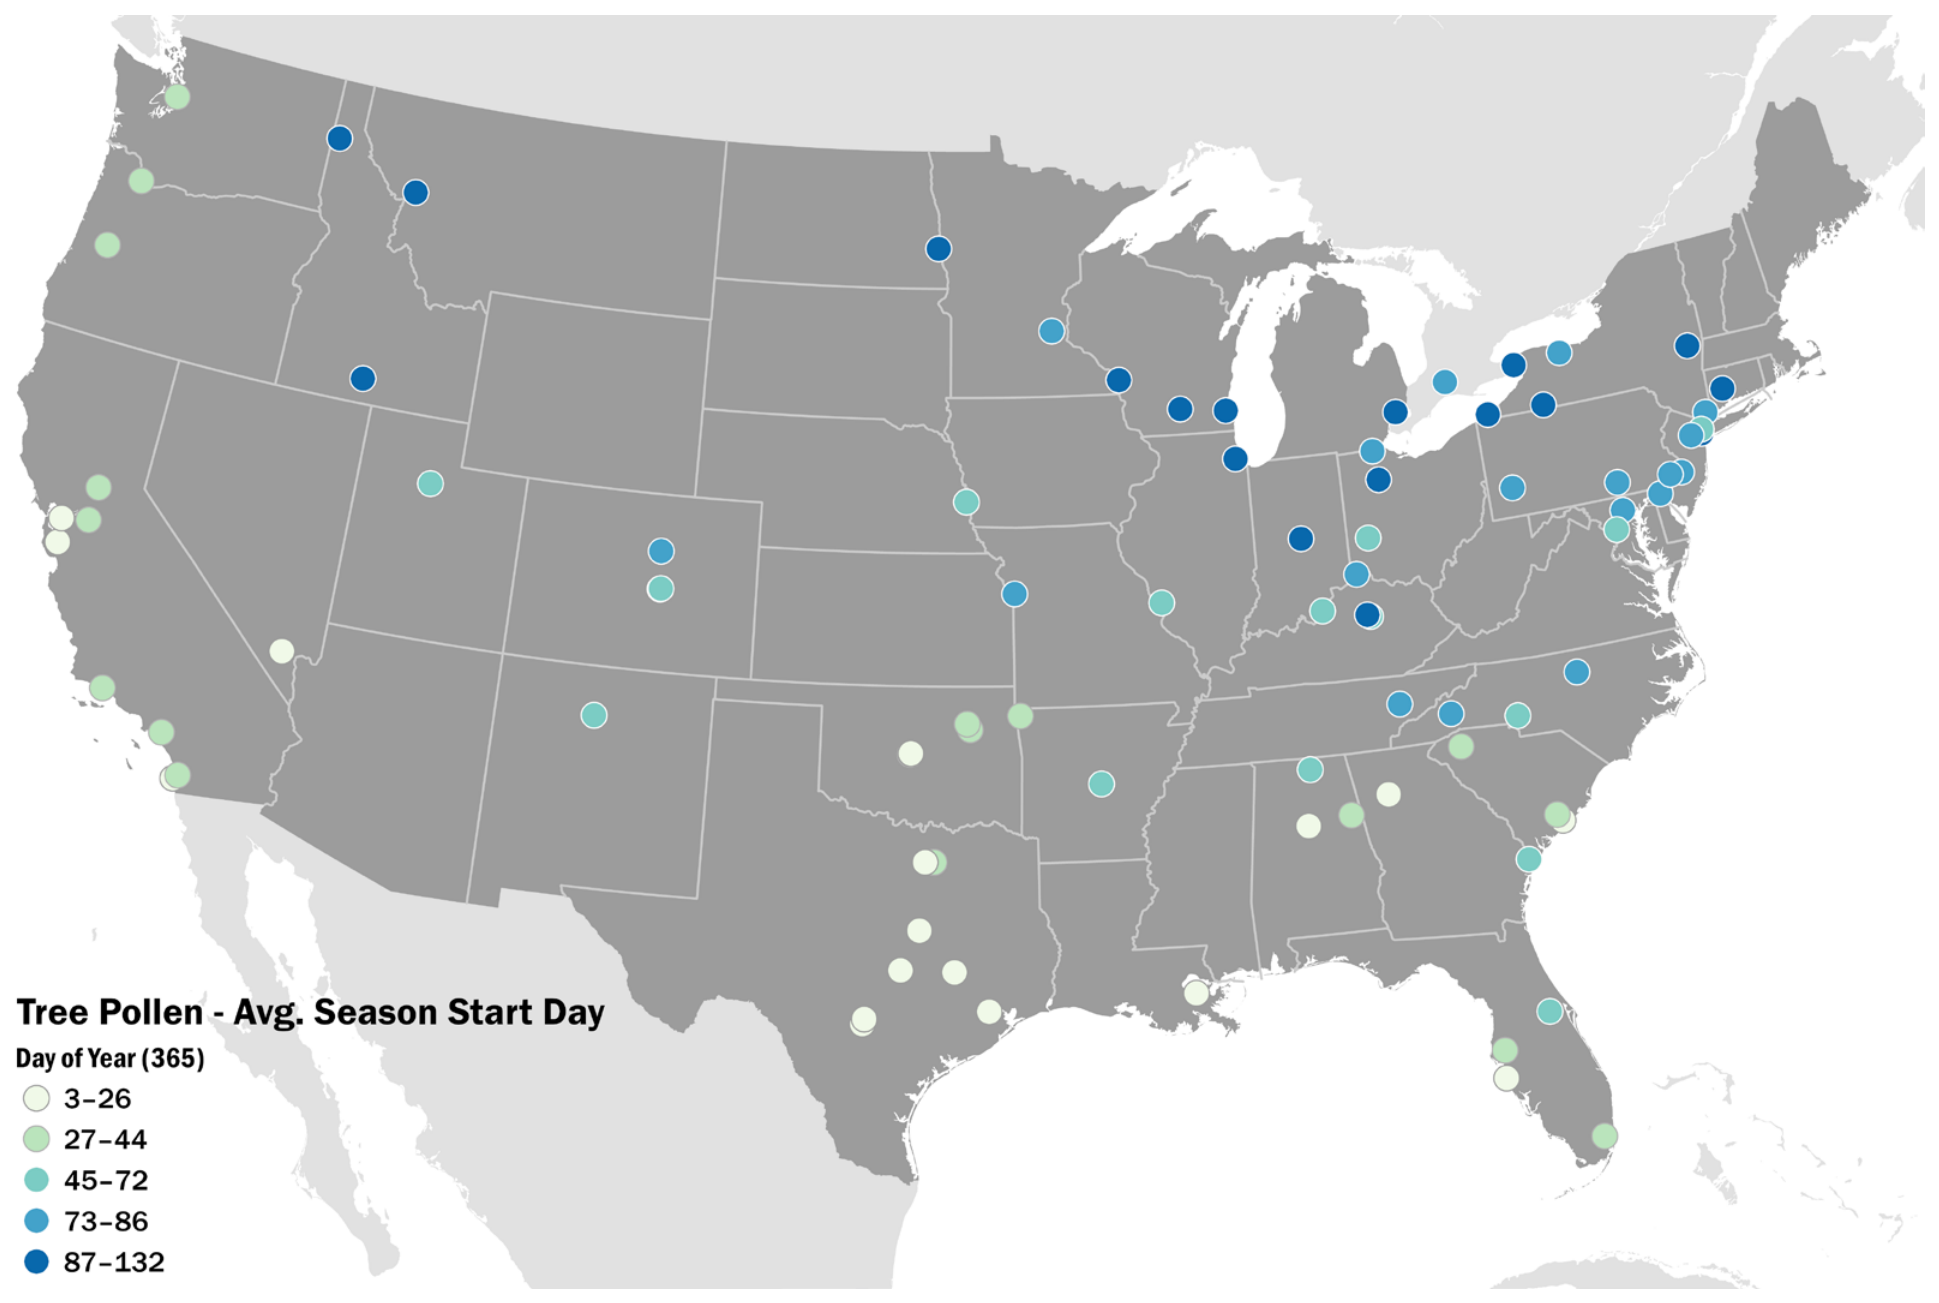
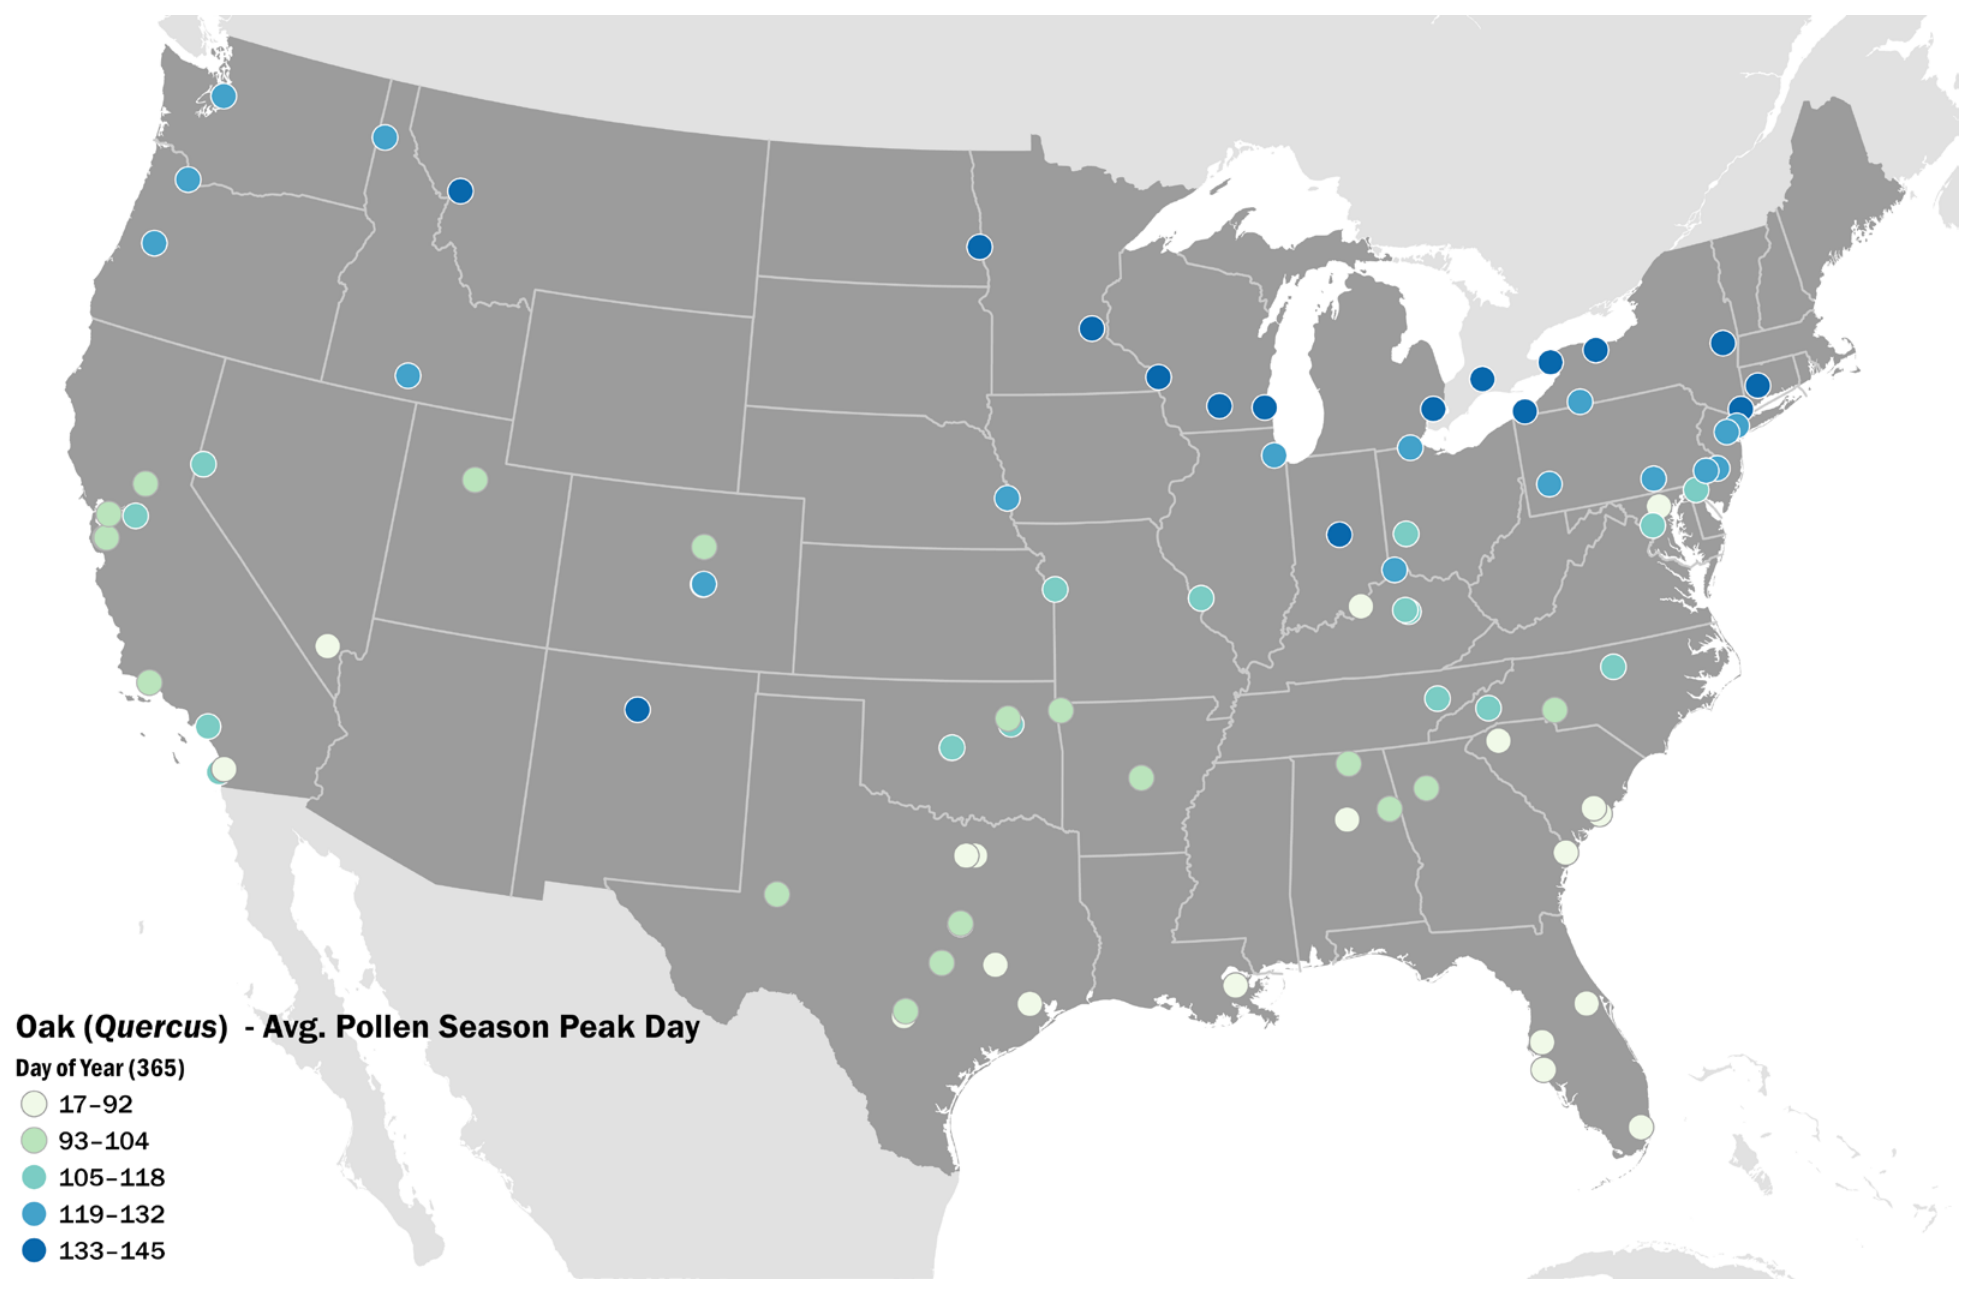
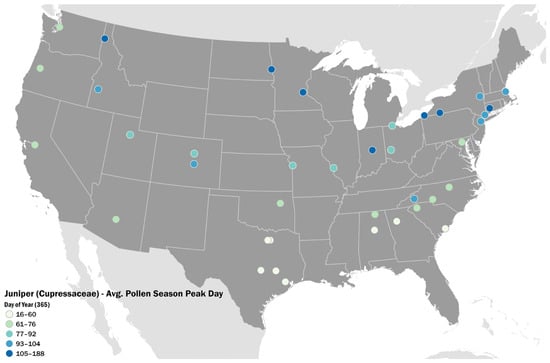
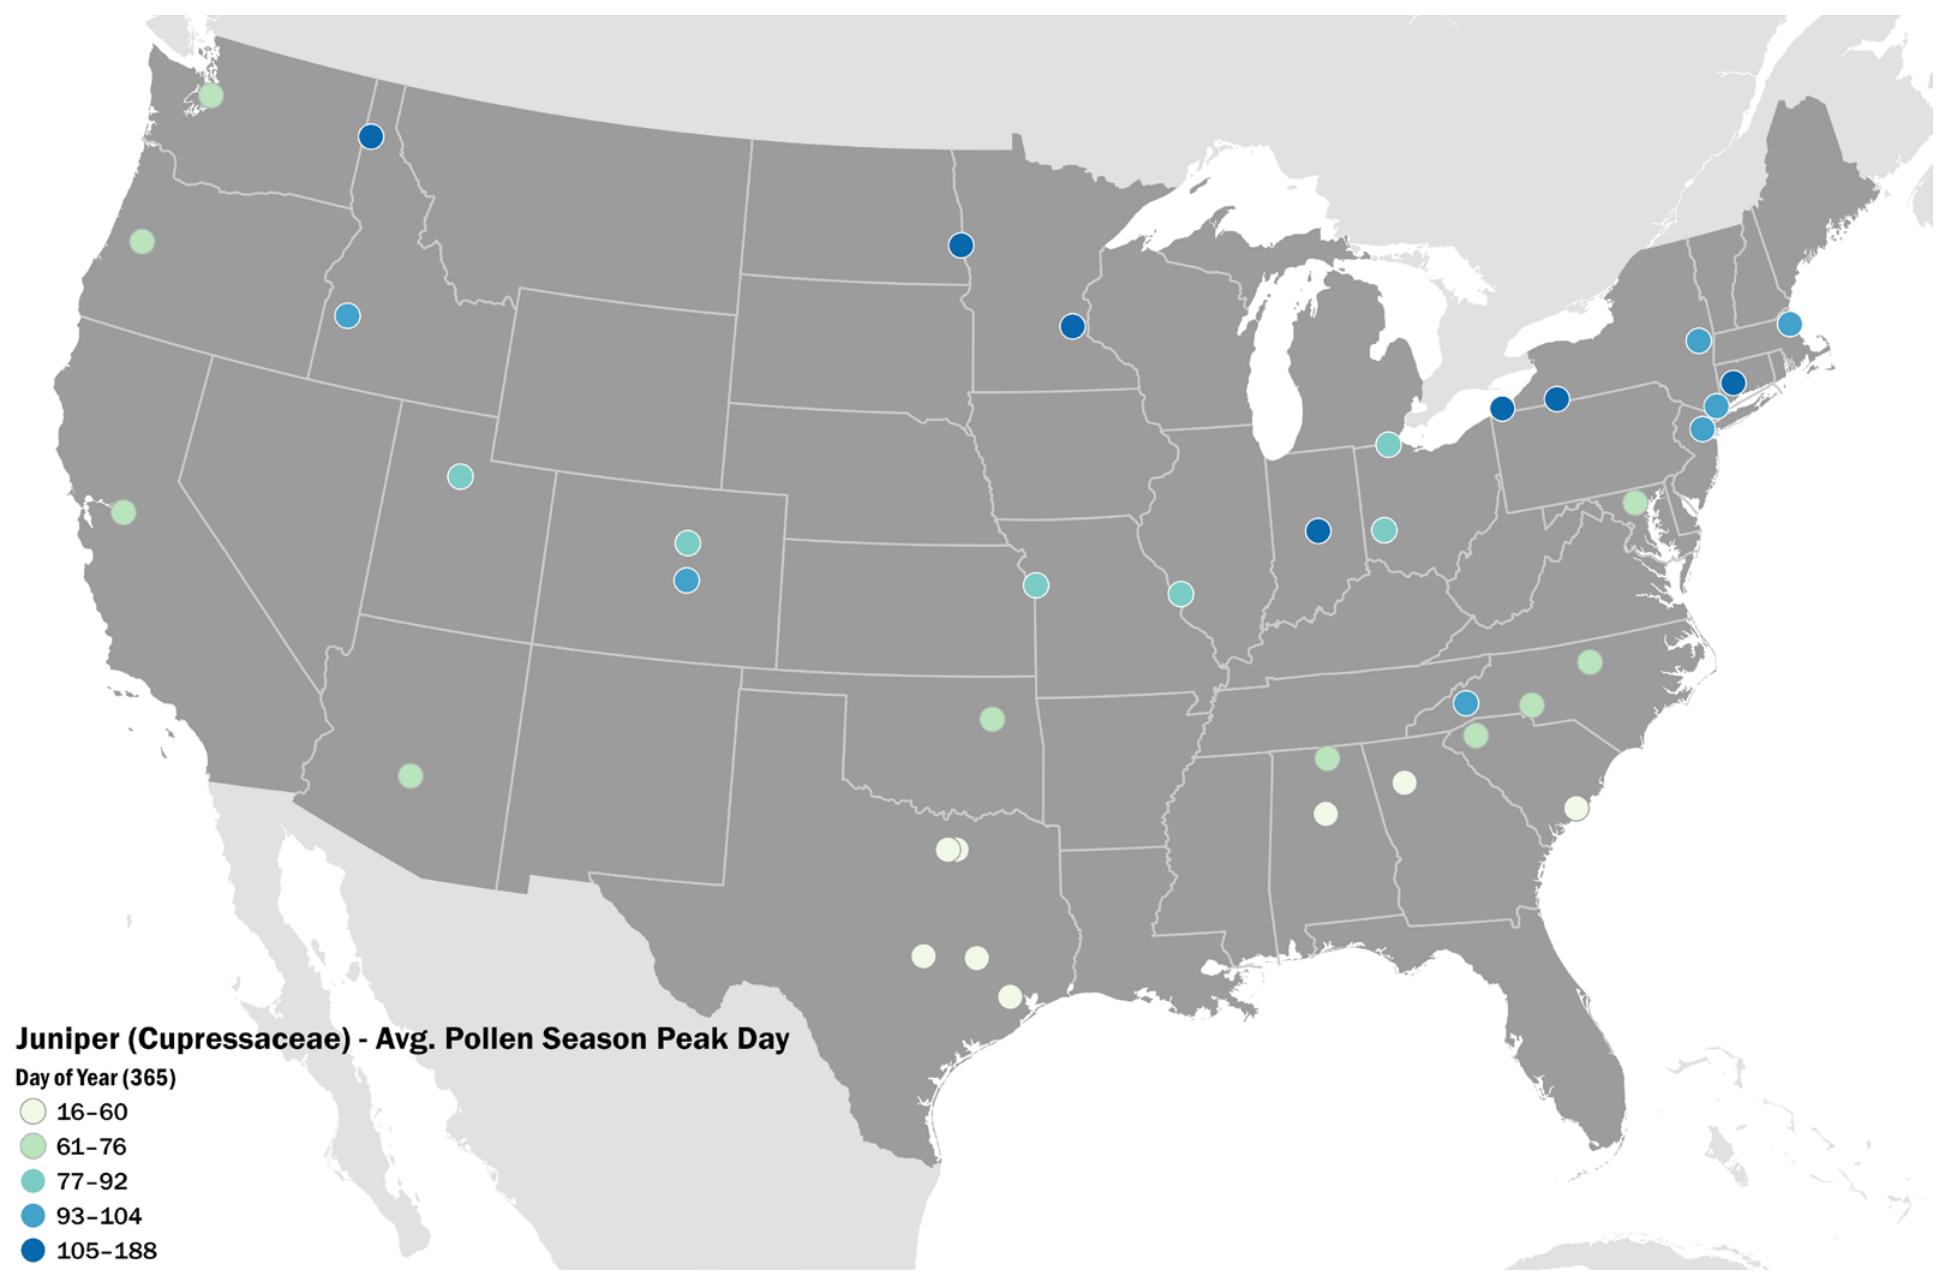
Data availability varies by station and pollen taxon; the current dataset spans 2003–2024 for all years in which observations are available and is designed for annual updates. Grouped trees pollen measures have the greatest spatial and temporal coverage (See Figure 3). Taxa-specific pollen data coverage also varies by location, with Oak pollen having more observation locations (See Figure 4) as compared to Juniper/Cyprus pollen locations (See Figure 5).
Figure 3.
Average main pollen season start day for trees in the Continental United States. The number values in the legend reflect the average start day for tree pollen, according to a 365-day calendar year. In the southeastern U.S. tree pollen started earlier than in the higher latitude regions of the U.S. Only stations with five years of observation data and greater are shown.
Figure 4.
Average Peak Day for Quercus (Oak) Pollen. Only stations with 5 years of observation data and greater are shown.
Figure 5.
Average Peak Day for Cupressaceae (Juniper/Cypress). Only stations with 5 years of observation data and greater are shown.
As of 2024, there were 42 currently active NAB pollen stations of the 131 that reported observations from 2021–2024 with a median record length of 18.5 years. Thirty stations have long-term pollen observations spanning 20 years or more, and 75 stations have 10 years of observations or more. The most abundant pollen taxa throughout the period were Quercus (Oak) and Cupressaceae (Juniper/Cypress), which in addition to Pinaceae (Pine) were the most reported throughout the NAB station network (Table 2). Ambrosia (Ragweed) pollen had the highest number of observations per year followed by Acer (Maple) and Cupressaceae (Juniper/Cypress) (Table 2).
Table 2.
NAB Pollen Observations.
Over the 22 year study period, NAB stations collected over 1,175,000 distinct pollen observations from 125 different stations, reporting within 42 states. These totals include only the subset of taxa included in the analysis and do not include grouped trees, weed, or grass pollen measures. Therefore, the provided count of distinct pollen observations represents just a portion of the full set of pollen observations collected by the NAB.
4. Discussion
By combining NAB-certified pollen observations with standardized data processing methods, this dataset provides a consistent approach for describing main pollen season timing and concentrations across monitoring locations in the U.S. Using uniform season definitions and concentration metrics reduces differences caused by varying analytic methods and allows more reliable comparisons across locations and over time. This standardization strengthens the foundation for national environmental public health surveillance of pollen exposure.
Pollen monitoring provides important information for understanding patterns of aeroallergen exposure and their health effects. This dataset supports environmental public health surveillance, health communication and alert systems, and clinical care by helping clinicians determine the timing of preventive and therapeutic treatment for patients with allergic disease. It also provides accessible information that members of the public can use to increase awareness of pollen conditions near where they live, which may help guide daily activities and symptom management during high pollen periods. Long-term, standardized pollen measurements support research on changes in pollen seasons and their relationships with climate and health outcomes. These data are especially relevant for sensitive populations, including people with asthma and other respiratory conditions, who may experience worsening symptoms during periods of elevated pollen concentrations.
Making these data publicly available through Data.CDC.gov and the CDC National Environmental Public Health Tracking Network increases access for health departments, researchers, clinicians, and the public. The dataset can support monitoring of seasonal pollen patterns, evaluation of long-term trends, and studies examining relationships between pollen exposure, climate variability, and allergic disease outcomes. Standardized historical and annual measures also make it easier to assess whether pollen seasons are changing in timing or intensity.
Several limitations should be considered. Sampling schedules vary by station and season, and some stations have gaps in data collection that may affect seasonal estimates, comparison between sites, and calculation of season start and end dates. Monitoring locations are limited to selected cities, so spatial coverage is not uniform across the country. Several states, such as Maine and South Dakota, do not have a monitoring location. In addition, station measurements reflect conditions near the monitoring site and may not represent pollen levels across larger geographic areas. Analyses of long-term trends are more robust when based on stations with consistent multi-year records and stable monitoring practices. We did not interpolate pollen data for those days without pollen concentrations because we utilized a consecutive-observation method, where MPS timing is defined only from days with actual measurements. Interpolating missing pollen observations was also avoided to prevent introducing unnecessary uncertainty into the dataset.
An additional limitation is that NAB stations utilize different certified sampling instruments, primarily Rotorod and Burkard samplers. Although NAB certification procedures promote consistency in collection and identification practices, instrument-specific differences may contribute to variability in measured pollen concentrations. Users should therefore exercise caution when making direct quantitative comparisons of absolute pollen concentrations among stations using different sampling technologies. The creation of the dataset involved a selection of specific methods (for example, the use of three consecutive-observations with pollen concentrations >1.0 PPCM to define season start), and using different methods would likely result in a different dataset. However, standardized pollen season metrics, including MPS start, peak, end, and duration, are calculated using a consistent methodology across all stations, supporting broad spatial and temporal comparisons. We provide a standardized pollen dataset in terms of reporting structure, taxonomic classifications, units, and derived season metrics.
Daily pollen concentration categories (Low, Moderate, High, and Very High) follow thresholds used by the NAB for public reporting purposes. These categories are based on historical monitoring and reporting conventions and do not necessarily correspond to clinically meaningful exposure thresholds, which may vary by pollen taxon, geographic region, population sensitivity, and environmental conditions.
Despite these limitations, this dataset improves the availability and consistency of pollen information in the U.S. Continued monitoring and expanded geographic coverage would further strengthen the ability to track pollen exposure, understand regional differences, and support research and public health actions related to allergic disease.
The dataset demonstrates the substantial geographic and temporal scope of long-term pollen monitoring in the U.S. Across 22 years of observations (2003–2024), NAB stations contributed more than 1.17 million pollen observations from 131 monitoring locations in 42 states. Although data availability varied among taxa and stations, grouped tree and weed pollen measures provided the broadest spatial and temporal coverage, while taxa-specific coverage reflected regional differences in vegetation distributions. As of 2024, 42 stations maintained active reporting during 2021–2024, with a median record length of 18.5 years, and 30 stations contributed records spanning at least two decades. The dataset also captured clear geographic variability in pollen season timing, with tree pollen seasons generally beginning earlier in the southeastern U.S. than in higher-latitude regions. Among the taxa examined, Quercus, Cupressaceae, and Pinaceae were the most widely reported across the monitoring network, while Ambrosia generated the greatest number of annual observations. Collectively, these findings highlight both the breadth of the monitoring network and the value of long-term standardized observations for characterizing regional and temporal variability in pollen exposure.
5. Conclusions
Airborne pollen is a growing public health concern, yet researchers, clinicians, and health departments lacked a nationally consistent, standardized dataset to study and communicate pollen exposure over geography and time. By compiling, standardizing, and publicly releasing NAB-certified pollen monitoring data through Data.CDC.gov and CDC’s National Environmental Public Health Tracking Network, this effort addresses a longstanding gap in environmental public health surveillance. The resulting dataset captures more than two decades of observations from a nationwide monitoring network and provides standardized measures of pollen season timing and concentrations that can support research, clinical practice, public health communication, and surveillance. As pollen seasons continue to shift in response to changing environmental conditions, sustained pollen monitoring will be essential for identifying populations at increased risk, tracking changes in exposure, and informing interventions to protect public health.
Author Contributions
Conceptualization, A.P.M., C.L.B., P.J.S.; methodology, A.P.M., C.L.B., A.K.W.; data curation, A.K.W., C.L.B.; writing—original draft preparation, A.P.M., P.J.S.; writing—technical subject matter expertise review and editing, D.S.W.K., P.G., A.R., D.V., A.P.M., J.J.H. All authors have read and agreed to the published version of the manuscript.
Funding
This research received no external funding.
Institutional Review Board Statement
Not applicable.
Informed Consent Statement
Not applicable.
Data Availability Statement
Raw pollen data are provided by the National Allergy Bureau™ (NAB™) (https://pollen.aaaai.org/). The processed dataset will be available through https://data.cdc.gov/ and the National Environmental Public Health Tracking Network’s Data Explorer at https://ephtracking.cdc.gov/. The dataset is planned to be updated annually in coordination with the NAB to incorporate new monitoring data. Users who identify potential errors or data quality issues are encouraged to contact the corresponding author at mqa2@cdc.gov.
Acknowledgments
The authors thank Emily Prezzato, MPH, for her instrumental contributions to this project, including data management to support integration into the National Environmental Public Health Tracking Network and development of the partnership with the National Allergy Bureau™ (NAB™). The authors also acknowledge the NAB-certified monitoring stations and participating staff for collecting and maintaining the long-term pollen observations used in this dataset.
Conflicts of Interest
The authors declare no conflict of interest. The findings and conclusions in this report are those of the authors and do not necessarily represent the official position of the Centers for Disease Control and Prevention.
Abbreviations
The following abbreviations are used in this manuscript:
| AAAAI | American Academy of Allergy, Asthma & Immunology |
| API | Application Programming Interface |
| CDC | Centers for Disease Control and Prevention |
| MPS | Main Pollen Season |
| NAB | National Allergy Bureau |
| PPCM | Pollen grains Per Cubic Meter |
| SPIn | Seasonal Pollen Integral |
References
- Bernstein, J.A.; Bernstein, J.S.; Makol, R.; Ward, S. Allergic Rhinitis: A Review. JAMA 2024, 331, 866–877. [Google Scholar] [CrossRef] [Scilit] [PubMed]
- Wheatley, L.M.; Togias, A. Allergic rhinitis. N. Engl. J. Med. 2015, 372, 456–463. [Google Scholar] [CrossRef] [Scilit] [PubMed]
- Katz, D.S.W.; Zigler, C.M.; Bhavnani, D.; Balcer-Whaley, S.; Matsui, E.C. Pollen and viruses contribute to spatio-temporal variation in asthma-related emergency department visits. Environ. Res. 2024, 257, 119346. [Google Scholar] [CrossRef] [Scilit] [PubMed]
- Lappe, B.L.; Ebelt, S.; D’Souza, R.R.; Manangan, A.; Brown, C.; Saha, S.; Harris, D.; Chang, H.H.; Sole, A.; Scovronick, N. Pollen and asthma morbidity in Atlanta: A 26 year time series study. Environ. Int. 2023, 177, 107998. [Google Scholar] [CrossRef] [Scilit] [PubMed]
- Meltzer, E.O. Allergic Rhinitis: Burden of Illness, Quality of Life, Comorbidities, and Control. Immunol. Allergy Clin. N. Am. 2016, 36, 235–248. [Google Scholar] [CrossRef] [Scilit] [PubMed]
- Anderegg, W.R.L.; Abatzoglou, J.T.; Anderegg, L.D.L.; Bielory, L.; Kinney, P.L.; Ziska, L. Anthropogenic climate change is worsening North American pollen seasons. Proc. Natl. Acad. Sci. USA 2021, 118, e2013284118. [Google Scholar] [CrossRef] [Scilit] [PubMed]
- Ziska, L.; Knowlton, K.; Rogers, C.; Dalan, D.; Tierney, N.; Elder, M.A.; Filley, W.; Shropshire, J.; Ford, L.B.; Hedberg, C.; et al. Recent warming by latitude associated with increased length of ragweed pollen season in central North America. Proc. Natl. Acad. Sci. USA 2011, 108, 4248–4251. [Google Scholar] [CrossRef] [Scilit] [PubMed]
- Schramm, P.J.; Brown, C.L.; Saha, S.; Conlon, K.C.; Manangan, A.P.; Bell, J.E.; Hess, J.J. A systematic review of the effects of temperature and precipitation on pollen concentrations and season timing, and implications for human health. Int. J. Biometeorol. 2021, 65, 1615–1628. [Google Scholar] [CrossRef] [Scilit] [PubMed]
- Outdoor Allergens. Available online: https://www.aaaai.org/tools-for-the-public/conditions-library/allergies/outdoor-allergens-ttr (accessed on 14 June 2026).
- National Environmental Public Health Tracking Network. Available online: https://ephtracking.cdc.gov/ (accessed on 4 March 2026).
- Levetin, E. Methods for aeroallergen sampling. Curr. Allergy Asthma Rep. 2004, 4, 376–383. [Google Scholar] [CrossRef] [Scilit] [PubMed]
- Pfaar, O.; Bastl, K.; Berger, U.; Buters, J.; Calderon, M.A.; Clot, B.; Darsow, U.; Demoly, P.; Durham, S.R.; Galán, C.; et al. Defining pollen exposure times for clinical trials of allergen immunotherapy for pollen-induced rhinoconjunctivitis—An EAACI position paper. Allergy 2017, 72, 713–722. [Google Scholar] [CrossRef] [Scilit] [PubMed]
- Ziska, L.H.; Makra, L.; Harry, S.K.; Bruffaerts, N.; Hendrickx, M.; Coates, F.; Saarto, A.; Thibaudon, M.; Oliver, G.; Damialis, A.; et al. Temperature-related changes in airborne allergenic pollen abundance and seasonality across the northern hemisphere: A retrospective data analysis. Lancet Planet. Health 2019, 3, e124–e131. [Google Scholar] [CrossRef] [Scilit] [PubMed]
- Manangan, A.; Brown, C.; Saha, S.; Bell, J.; Hess, J.; Uejio, C.; Fineman, S.; Schramm, P. Long term pollen trends and associations between pollen phenology and seasonal climate in Atlanta, Georgia (1992–2018). Ann. Allergy Asthma Immunol. 2021, 127, 471–480. [Google Scholar] [CrossRef] [Scilit] [PubMed]
- Bastl, K.; Kmenta, M.; Berger, U.E. Defining Pollen Seasons: Background and Recommendations. Curr. Allergy Asthma Rep. 2018, 18, 73. [Google Scholar] [CrossRef] [Scilit] [PubMed]
- Galán, C.; Ariatti, A.; Bonini, M.; Clot, B.; Crouzy, B.; Dahl, A.; Fernandez-González, D.; Frenguelli, G.; Gehrig, R.; Isard, S.; et al. Recommended terminology for aerobiological studies. Aerobiologia 2017, 33, 293–295. [Google Scholar] [CrossRef] [Scilit]

Disclaimer/Publisher’s Note: The statements, opinions and data contained in all publications are solely those of the individual author(s) and contributor(s) and not of MDPI and/or the editor(s). MDPI and/or the editor(s) disclaim responsibility for any injury to people or property resulting from any ideas, methods, instructions or products referred to in the content. |
© 2026 by the authors. Licensee MDPI, Basel, Switzerland. This article is an open access article distributed under the terms and conditions of the Creative Commons Attribution (CC BY) license.