


Abstract
Inhomogeneities in climate observations can bias assessments of regional and local climate change. Taking Xinxiang, a major grain-producing region in Henan Province, China, as the study area, this study compiled temperature observations from eight national basic meteorological stations for 1951–2024. The RHtestsV4 software package was employed, using the penalized maximal t test (PMT) and a mean-adjustment scheme for series homogeneity testing and correction. Climate change characteristics in Xinxiang were analyzed at annual, seasonal, and monthly time scales and across stations to describe spatial patterns. The results indicate that the temperature series in this region exhibit marked inhomogeneity, with minimum temperature (Tmin) being the most sensitive to inhomogeneous factors; station relocation is the primary cause (accounting for over 50%). Over the past ~60 years, the regional mean warming rate increased from 0.278 °C/decade before correction to 0.370 °C/decade after correction. At the seasonal scale, spring showed the strongest warming (0.433 °C/decade), and at the monthly scale, March had the highest warming rate (0.68 °C/decade). Homogenization reduces non-climatic noise such as station relocation, improves the representation of regional temperature contrasts, highlights the stronger warming response in rapidly urbanizing areas in the east, and better represents the spatial pattern and temporal evolution of temperature.
1. Introduction
Climate change and its impacts on human society remain a major scientific and societal concern. Reliable climate change assessments require long, consistent, and well-documented observational records. However, non-climatic factors such as station relocation, instrument replacement, and changes in observing practices can introduce systematic biases and artificial shifts in climate time series. Since the early 1980s, extensive research has been conducted on climate data homogeneity, showing that series adjusted for breakpoints can more accurately reflect underlying climate change [1,2,3]. Chinese meteorological researchers have also conducted numerous studies on climate data homogeneity, particularly on temperature homogenization, developing datasets such as the China Homogenized Historical Temperature Dataset [4,5,6,7,8,9,10,11,12,13].
In homogeneity research, objective statistical tests are widely adopted to detect undocumented changepoints. Zhai Panmao used the E–P technique to identify pronounced inhomogeneities in Chinese radiosonde series during the 1960s [14]. Liu Xiaoning employed the Standard Normal Homogeneity Test (SNHT) and found that instrument changes were the main cause of inhomogeneity in annual mean wind speed in China [15]. Li Q. X. et al. utilized the TPR method combined with metadata to produce the first version of the homogenized historical temperature dataset for China [5]. These works have provided crucial technical and data foundations for subsequent regional climate change studies [16]. In recent years, the RHtests software package, based on penalized maximal F and t tests, has been widely applied due to its high level of automation. For instance, Xu W. H. et al. performed homogeneity testing and correction on daily maximum and minimum temperatures in China from 1951 to 2010 [8], and Si Peng and Xu Wenhui conducted homogeneity analysis on daily temperature series in Tianjin from 1951 to 2012 [17]. Zhang Yao et al. performed homogenization adjustments and long-term trend analyses of the daily mean, maximum, and minimum temperature records from 83 meteorological stations in Heilongjiang Province for the period 1951–2019 [18]. Many homogenization studies in China focus on large spatial scales or rapidly urbanizing regions, whereas areas with relatively moderate urbanization remain comparatively under-studied.
Xinxiang is one of China’s key grain-producing regions. Although the urbanization impact in Xinxiang City is weaker than that in major metropolitan areas, discontinuities in station records due to environmental and operational changes remain difficult to avoid. At present, Xinxiang mainly relies on datasets such as the 1981–2010 climate normals, whereas high-precision homogenization of long-term temperature series has not been systematically conducted [19]. Therefore, this study aims to construct a long-term homogenized temperature dataset for Xinxiang City for 1951–2024 using the RHtests method, to quantitatively assess the inhomogeneity characteristics of the original temperature series and their main causes, and to systematically investigate the influence of homogenization on regional temperature trends and spatial patterns. Specifically, three key questions are addressed: (1) whether significant inhomogeneities exist in the temperature series of the Xinxiang region and what the major sources of such inhomogeneities are; (2) how homogenization affects the long-term trends of regional temperature change; and (3) how the spatial distribution of temperature differs before and after homogenization. Answering these questions will provide a more reliable data basis and scientific support for regional climate assessment, as well as the optimization of agricultural production patterns.
2. Data and Methods
2.1. Data
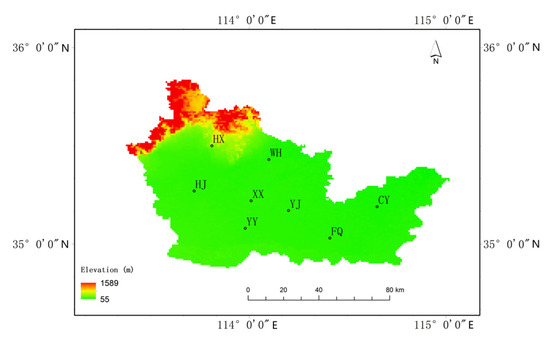
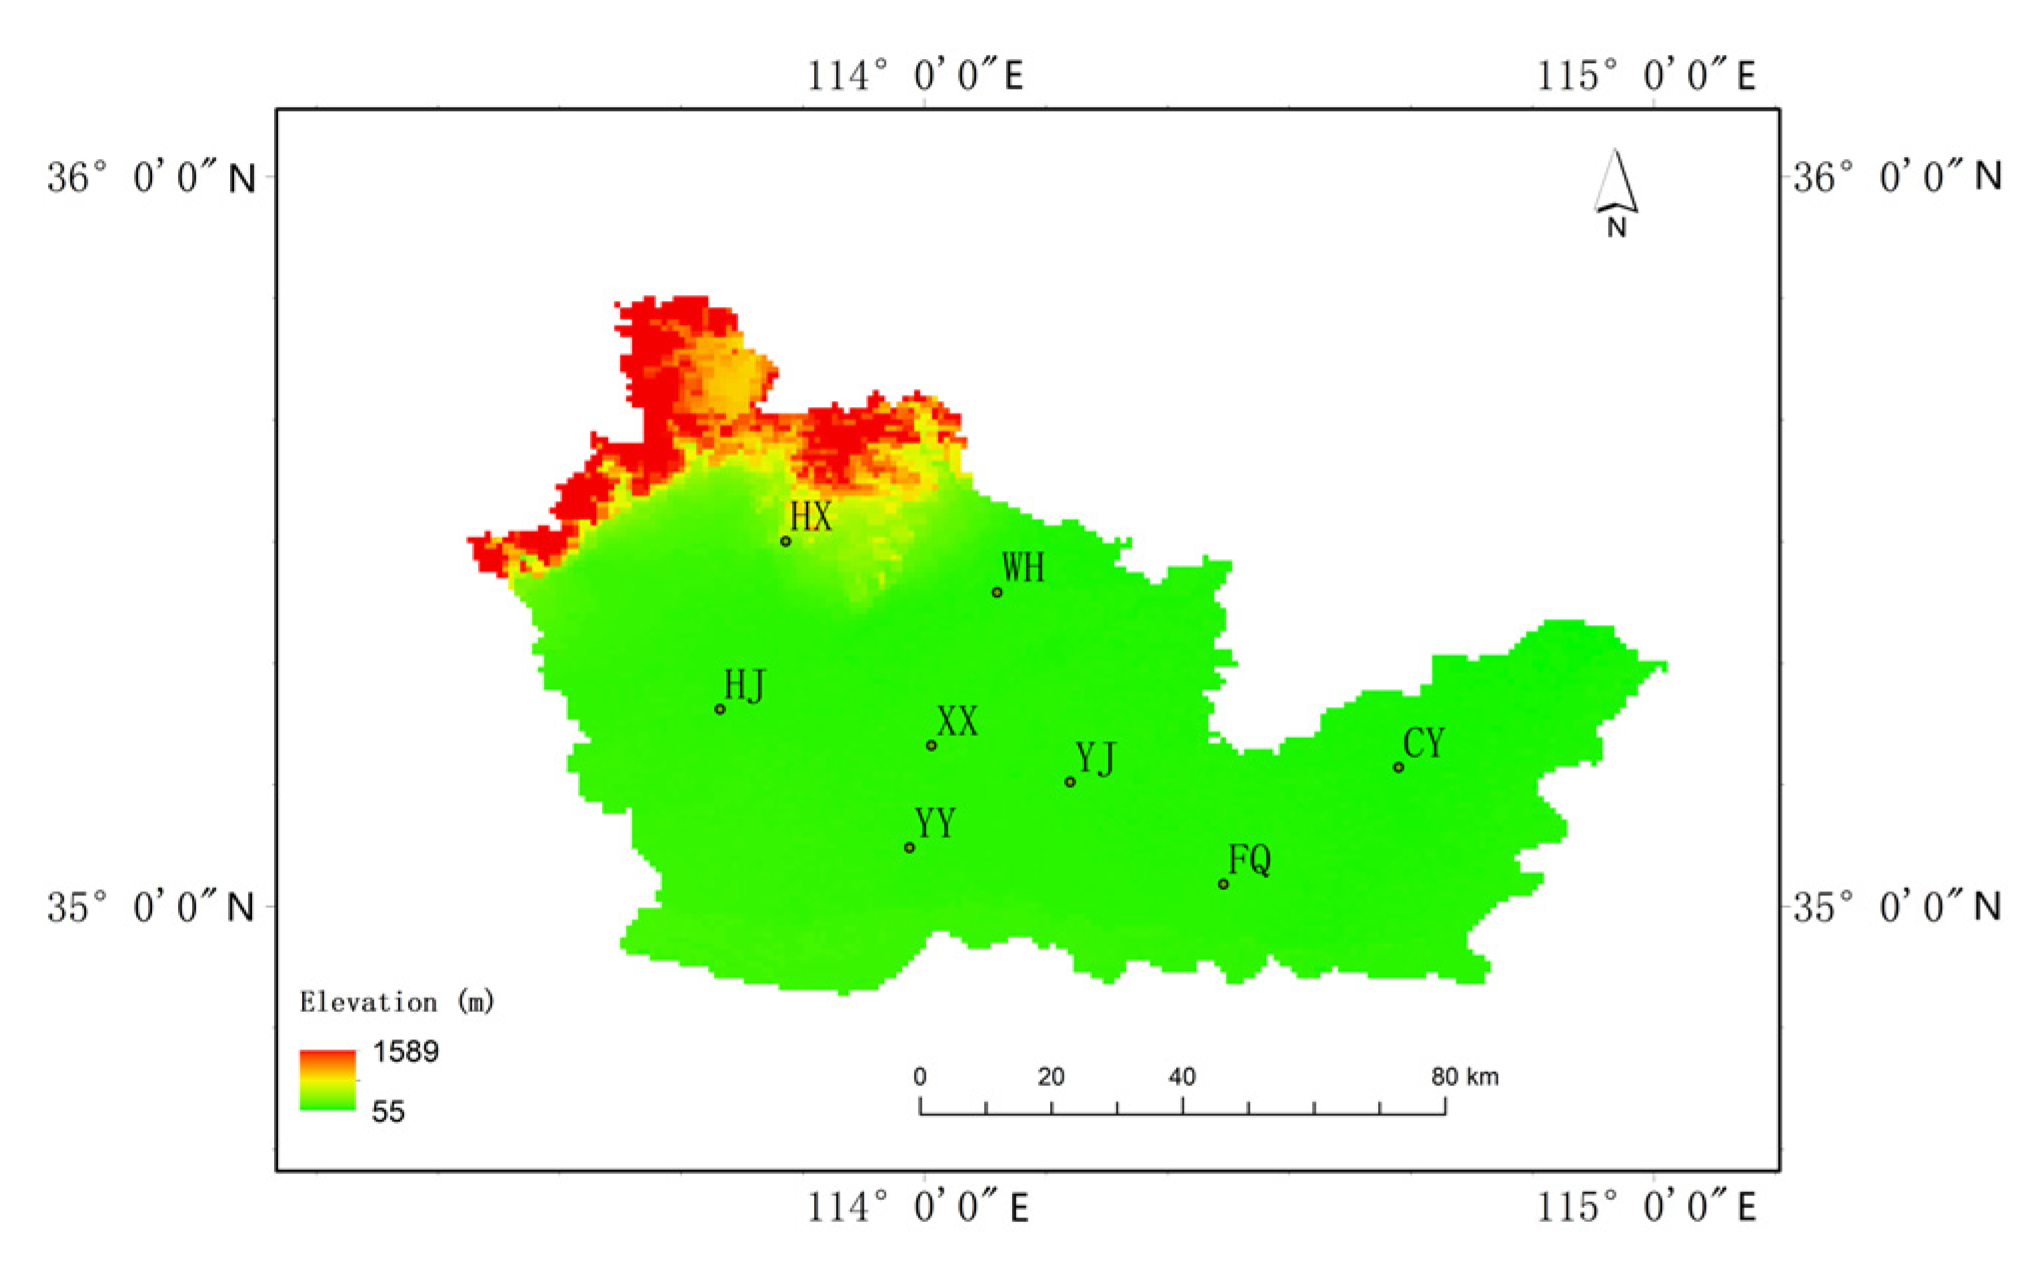
Based on the principles of relatively uniform spatial distribution and sufficiently long record length, eight national basic meteorological stations in Xinxiang City were selected for the homogenization analysis. The spatial distribution of these stations is shown in Figure 1.
Figure 1.
Locations of meteorological stations in Xinxiang City (shading indicates elevation).
The data used in this study were obtained from the surface meteorological observations archived in the China Meteorological Data Operational System (MDOS). The dataset includes annual and monthly mean temperature (Tmean), mean maximum temperature (Tmax), and mean minimum temperature (Tmin) records since the establishment of each station. All observations had undergone three-level quality control and abnormal record processing at the station, provincial, and national levels, including climate threshold checks, internal consistency checks, and spatiotemporal consistency checks [20]. In addition, historical metadata for national surface meteorological stations in China, such as station relocation, environmental changes, and instrument replacement, were also collected. In this study, these metadata were further used to verify the accuracy of breakpoints detected by statistical methods.
The starting years of the records differ among stations (Table 1). Overall, the data completeness is high, with an average completeness rate of 99.8%. Although a few stations contain limited missing data, these gaps are mainly concentrated in the early period after station establishment. To ensure the temporal consistency of the station series, the analysis period in Section 4 was defined as 1962–2024, during which complete and continuous observational records are available for all eight stations.
Table 1.
Basic information of the eight national basic meteorological stations in Xinxiang.
2.2. Methods
Absolute tests are based solely on the statistical properties of a single station series and thus are unable to reliably distinguish genuine climatic variations from artificial breakpoints. By contrast, relative tests depend on a well-constructed reference series that captures the regional climatic signal. Comparison between the candidate series and the reference series therefore allows non-climatic breakpoints to be identified and located with greater reliability.
Therefore, the homogenization procedure adopted in this study comprised two main steps: First, a stable and reliable reference series was constructed. Second, homogeneity testing and adjustment of the candidate series were conducted relative to the reference series. The procedure is described below.
2.2.1. Construction of the Reference Series
The reference series was constructed from neighboring-station observations within a specified distance of the target station [21]. The procedure is as follows:
- (1)
- First-order differencing was applied to all stations according to Equation (1) [22]:
- (2)
- Correlation coefficients were calculated between the first-difference series of the target station and each neighboring station. For candidate reference stations with the highest correlations, statistical significance was evaluated using the Multivariate Random Block Permutation (MRBP) test [23].
- (3)
- The first-difference series of the selected reference stations were combined into a first-difference reference series using a correlation-weighted average (Equation (2)). Here, Re denotes the first-difference reference series, Pej is the first-difference series of the j-th reference station, cj is the correlation coefficient between the first-difference series of the reference station and that of the target station, and m is the number of reference stations.
- (4)
- Inverse differencing was applied to the first-difference reference series to obtain the final reference series (Equation (3)). In addition, represents the mean of all reference stations, and R denotes the final reference series.
2.2.2. Homogeneity Testing and Adjustment
The homogeneity testing and adjustment were performed using the RHtestsV4 software package based on the R language platform [24]. The software implements penalized maximal tests, including the Penalized Maximal F Test (PMF) and the Penalized Maximal t Test (PMT) [25,26,27]. This study employed the PMT method because it is more sensitive to small mean shifts [28]. Methods for adjusting climate series include simple and multiple linear regression, composite methods, difference methods, ratio methods, and quantile matching [29]. Based on the statistical characteristics of annual and monthly data, this study used the mean-adjustment method integrated into RHtestsV4 [4]. All tests were conducted at a 5% significance level.
3. Homogenization of Temperature Series
3.1. Statistical Characteristics of Breakpoints
Using the methods described above, homogeneity tests were conducted for all stations. Two types of breakpoints were retained: (1) Type-0 breakpoints supported by metadata and (2) Type-1 breakpoints without metadata support but showing strong statistical evidence or occurring simultaneously in different temperature series.
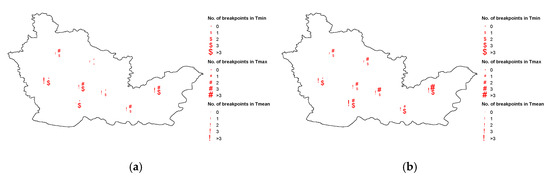
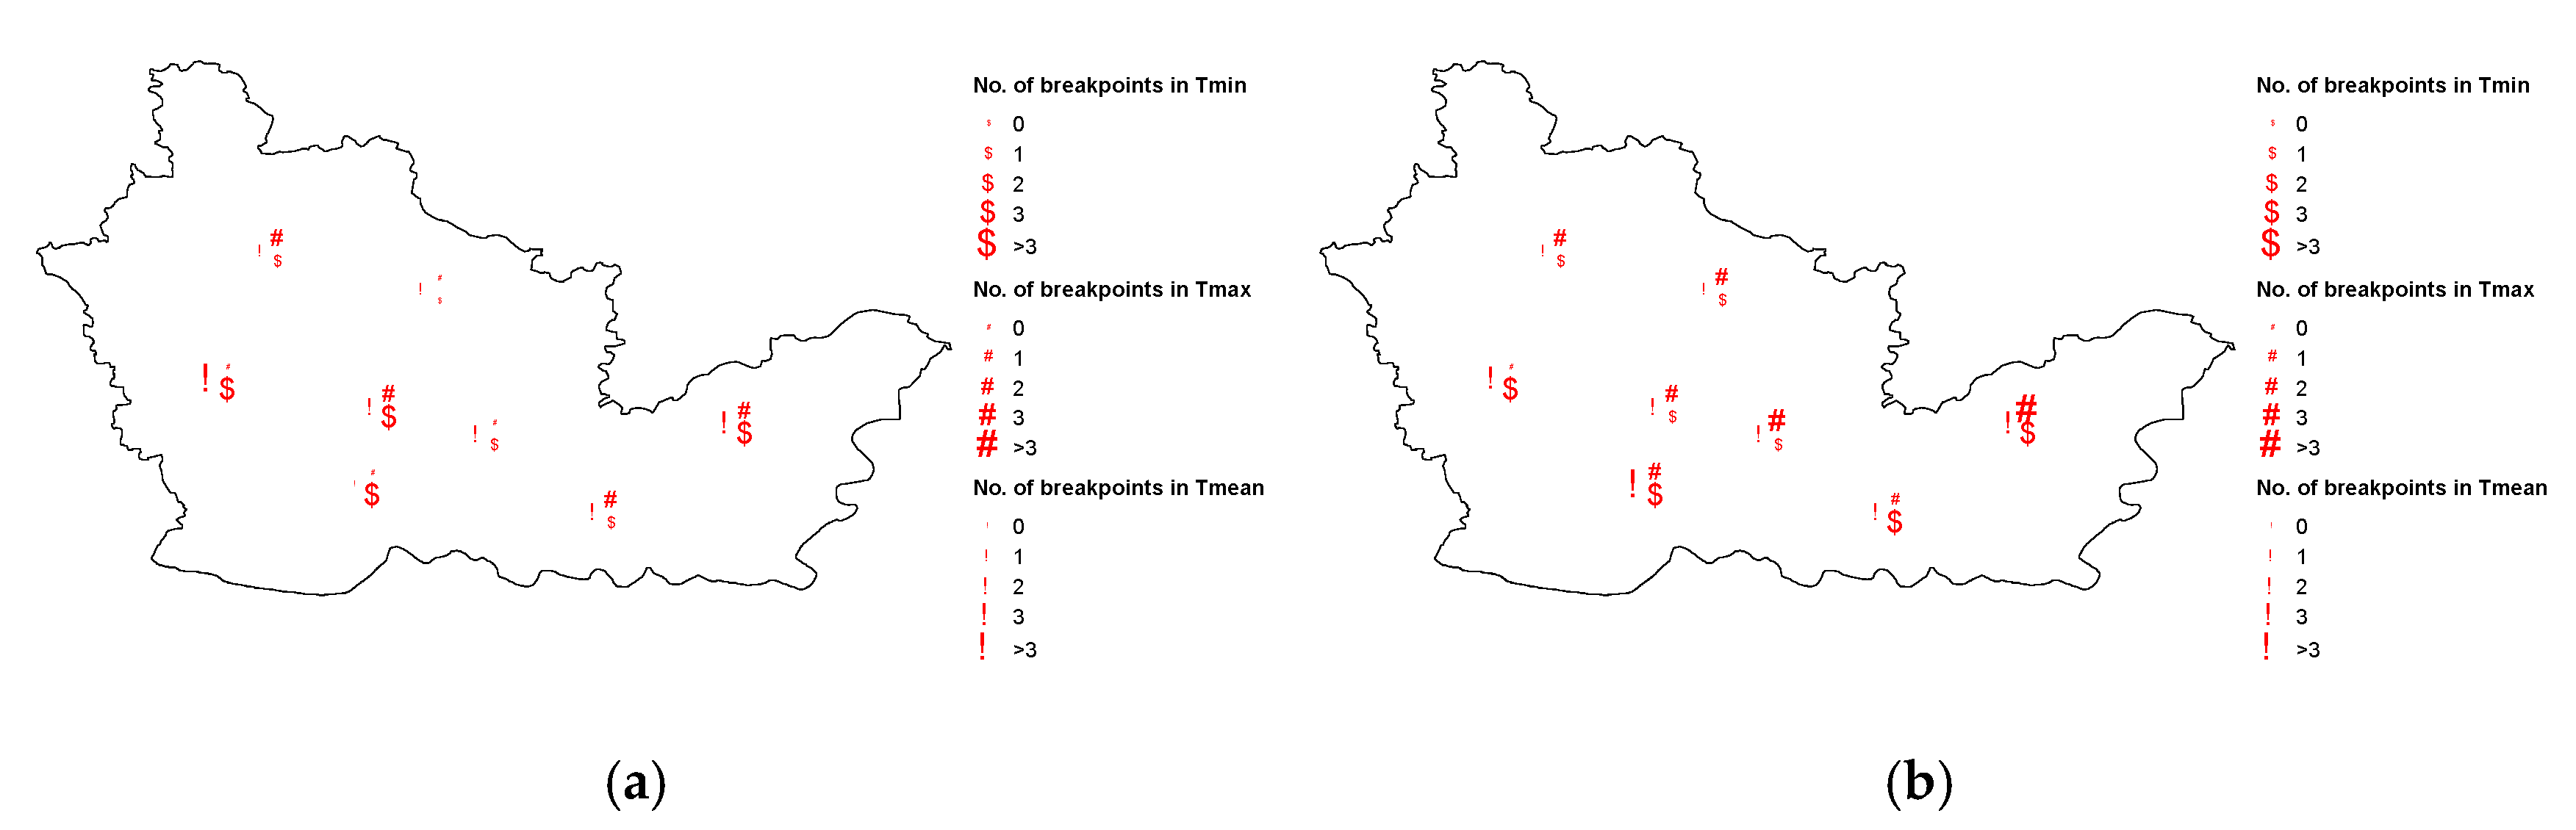
According to Table 2 and Figure 2, fewer breakpoints were detected in the annual and monthly series of Tmax, whereas Tmin exhibits a much higher sensitivity to breakpoints than Tmax. Spatially, stations in the southern and eastern parts have more breakpoints.
Table 2.
Number of stations with 0, 1, 2, 3, and >3 breakpoints in annual and monthly series for Tmean, Tmax, and Tmin.
Figure 2.
Spatial distribution of the number of breakpoints in annual (a) and monthly (b) series for Tmean, Tmax, and Tmin.
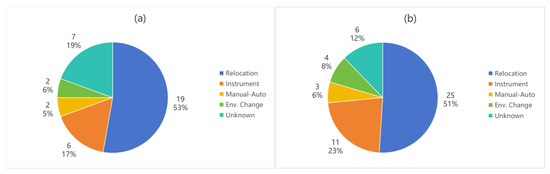
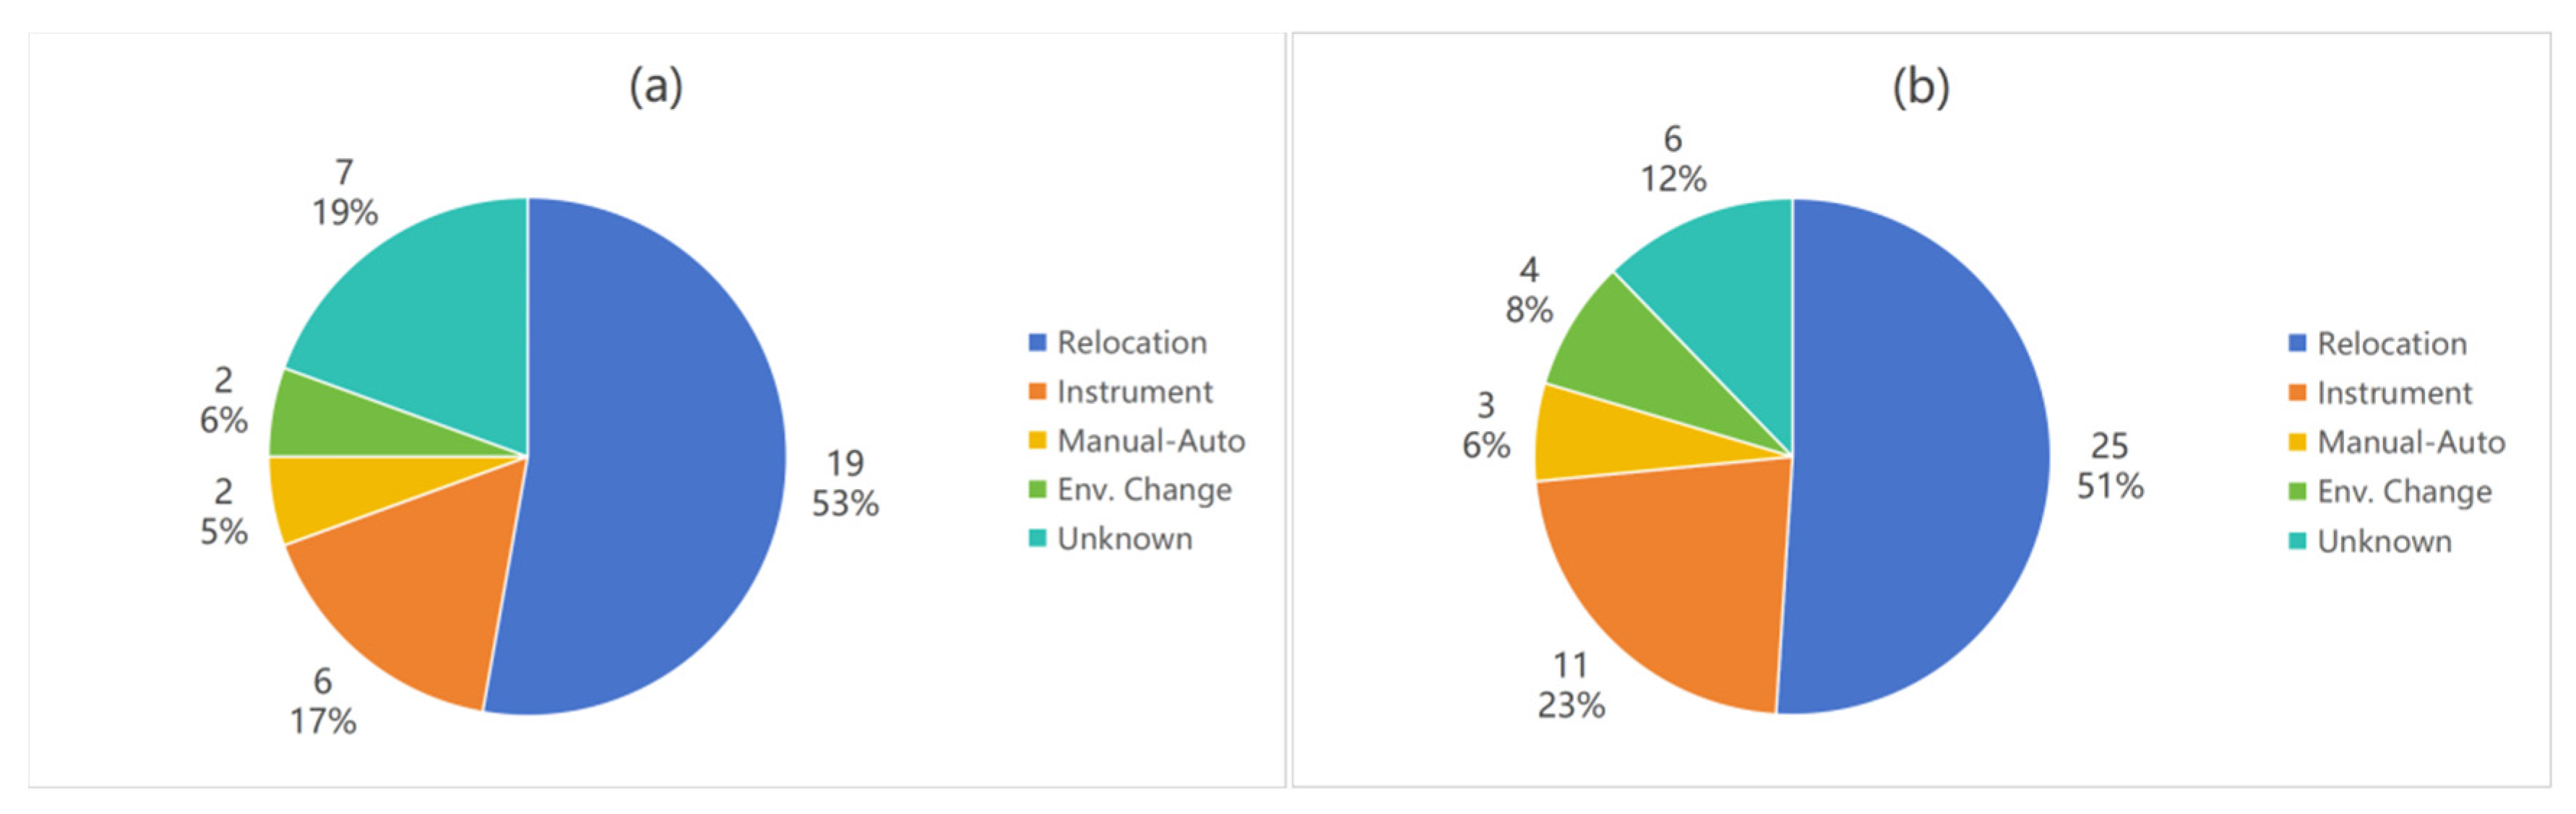
According to Table 3 and Figure 3, most breakpoints are supported by metadata (81% for annual series and 88% for monthly series). Station relocation is the dominant cause, accounting for more than 50% in each case; instrument replacement is the second-most important factor.
Table 3.
Number of breakpoints attributed to different causes in annual (a) and monthly (b) series for Tmean, Tmax, and Tmin.
Figure 3.
Number and proportion of breakpoints attributed to different causes in annual (a) and monthly (b) temperature series.
3.2. Specific Causes of Breakpoints and Analysis of Adjustment Magnitudes
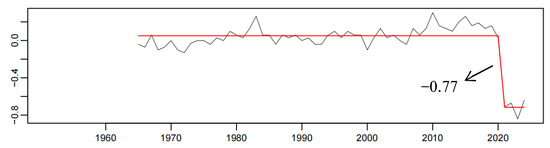
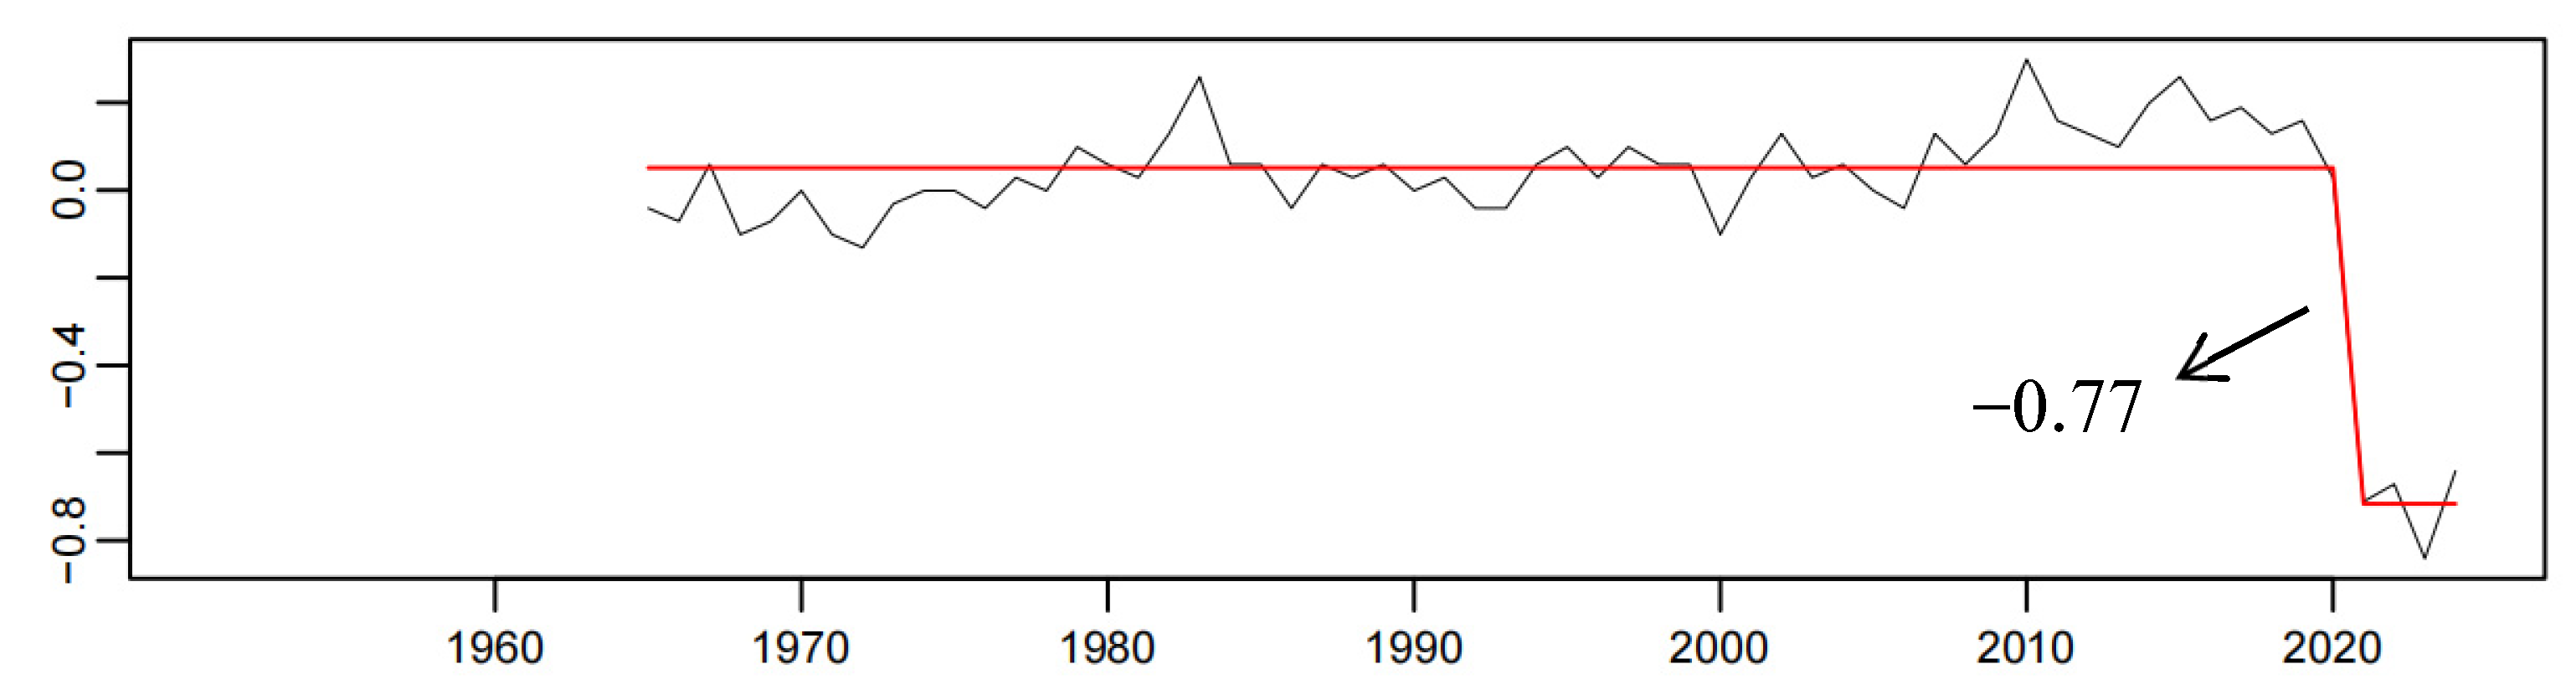
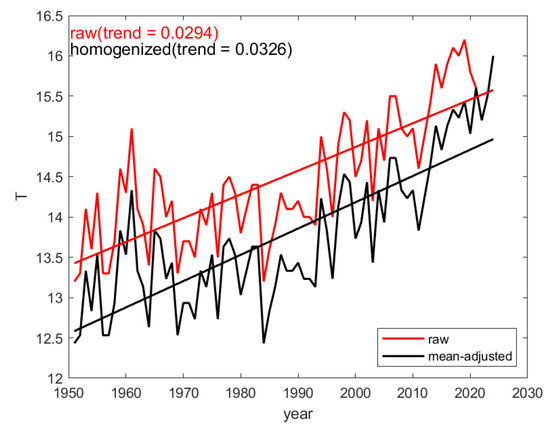
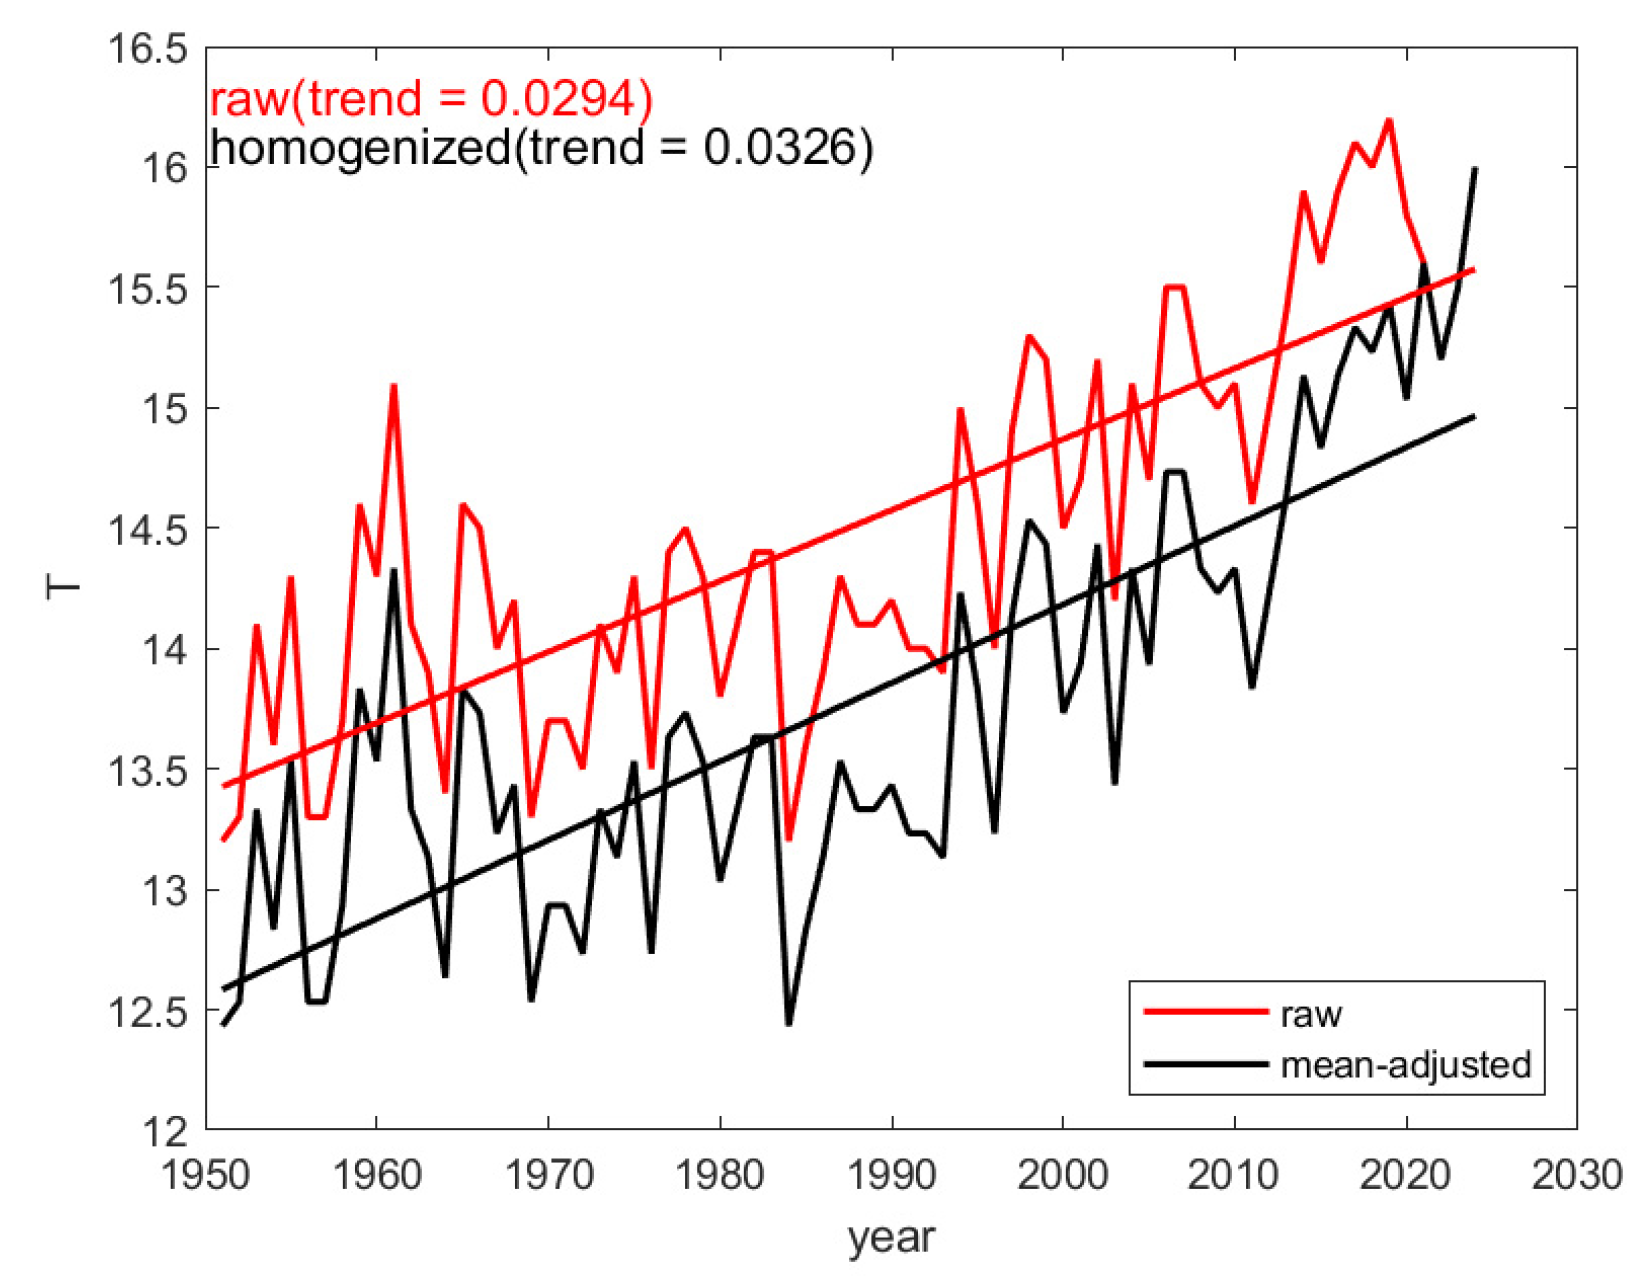
Taking Xinxiang station as an example (Figure 4), the station was relocated 14 km eastward in 2021, resulting in an adjustment magnitude of −0.77 °C in the annual mean temperature series. After homogenization (Figure 5), its warming rate was adjusted from 0.294 °C/decade to 0.326 °C/decade, reducing the artificial cooling bias associated with the relocation.
Figure 4.
RHtestsV4 results for annual mean temperature at Xinxiang station (the curve shows base minus reference).
Figure 5.
Annual mean temperature at Xinxiang station before and after homogenization (red: original; black: homogenized).
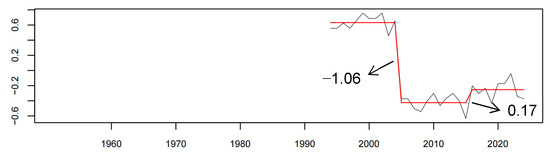
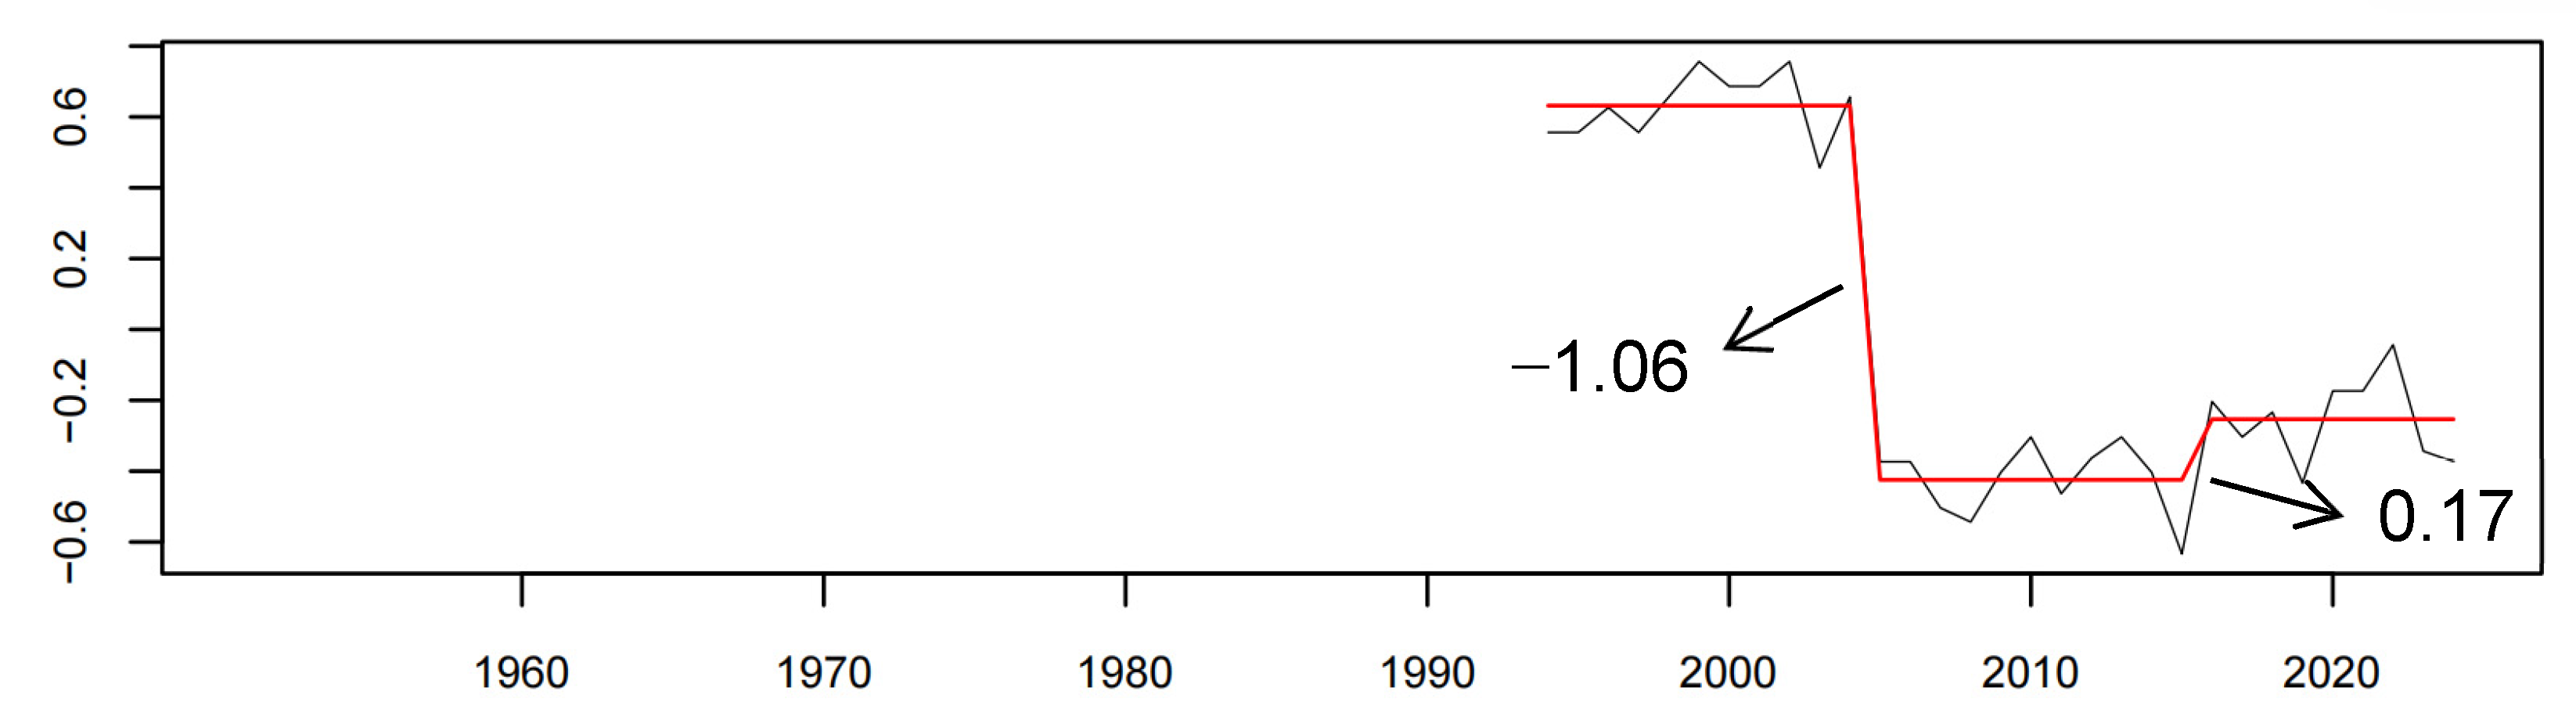
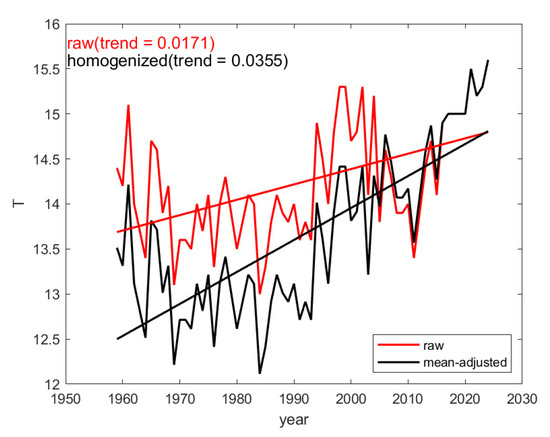
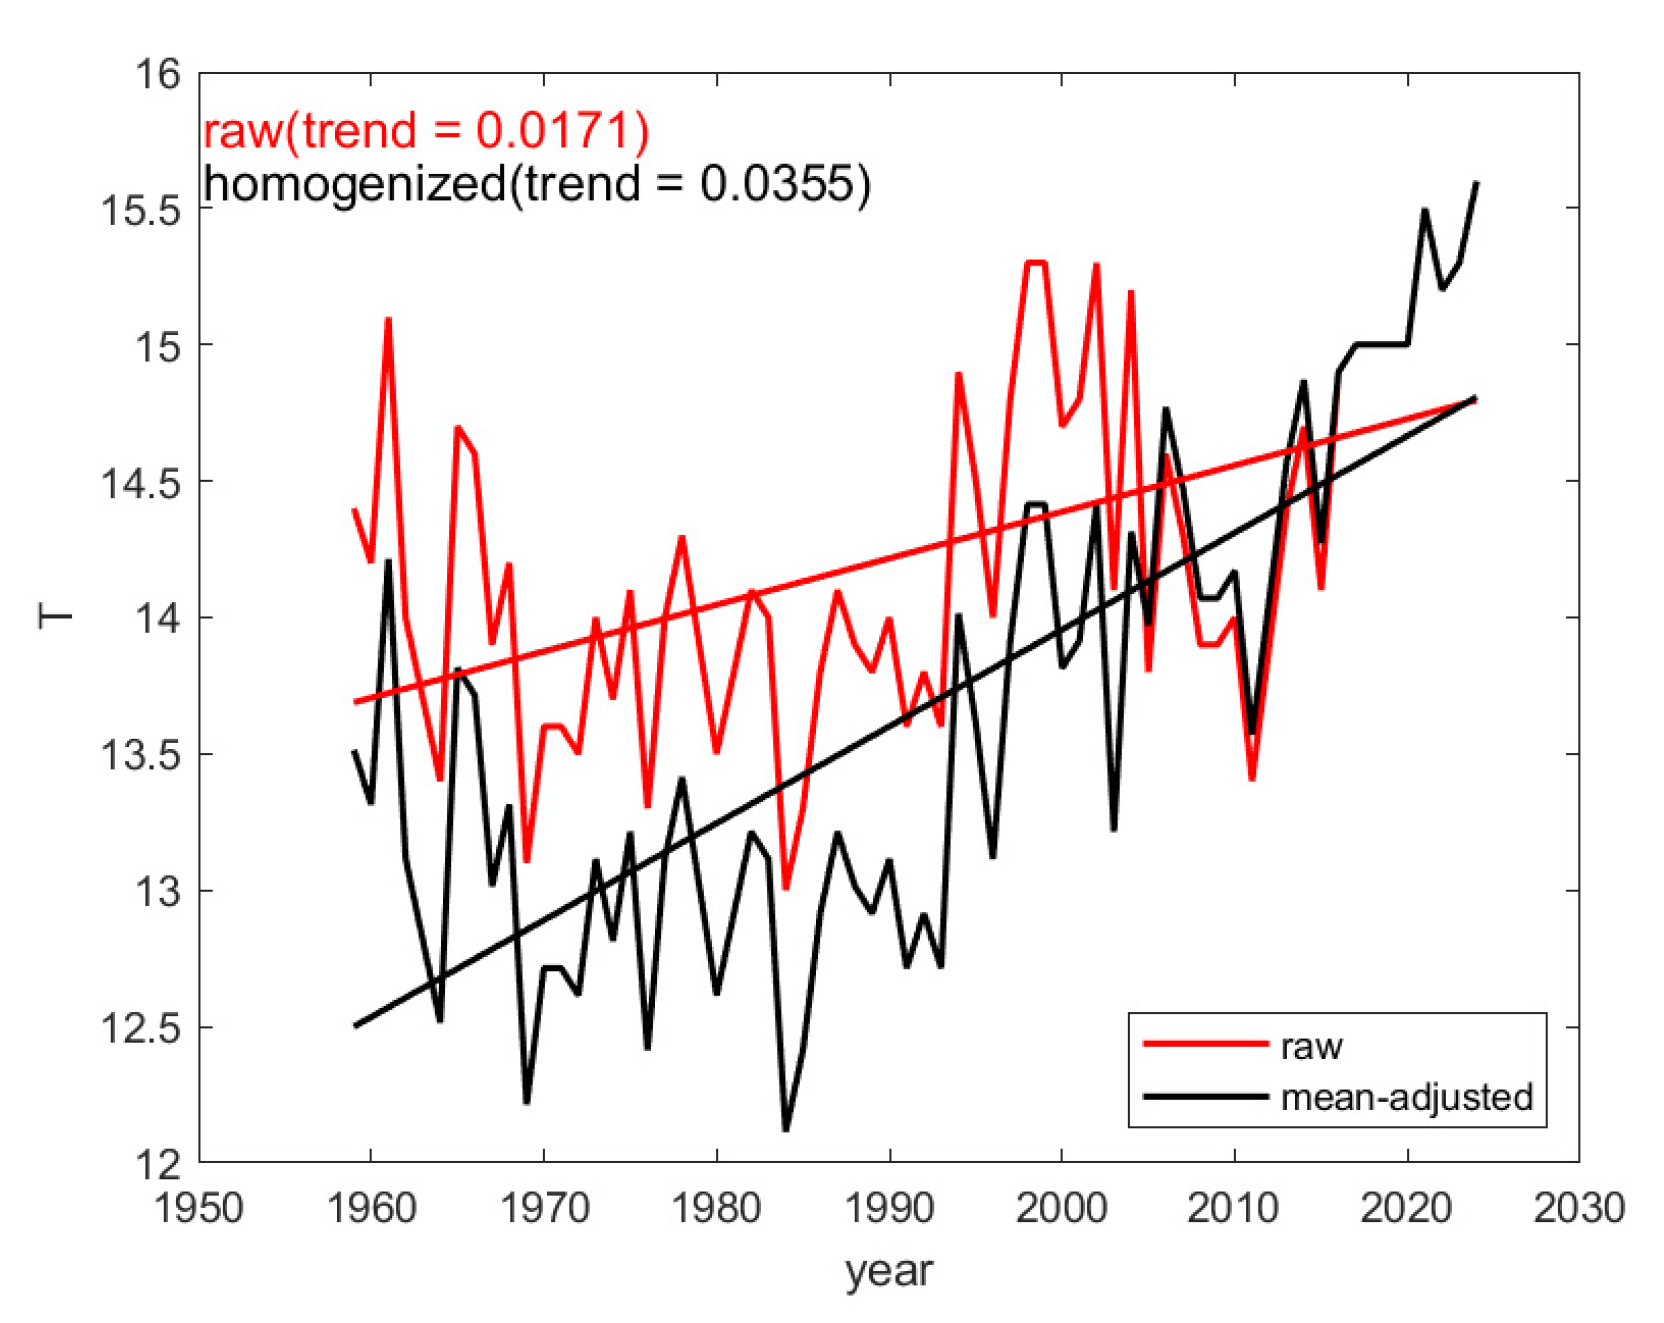
Taking Fengqiu Station as an example (Figure 6), two breakpoints were detected in the annual mean temperature series. Specifically, the station relocation in 2004 corresponded to a breakpoint of −1.06, whereas the instrument replacement in 2015 corresponded to a breakpoint of 0.17. After homogenization (Figure 7), the warming trend increased from 0.171 °C/10a in the original series to 0.355 °C/10a in the homogenized series.
Figure 6.
RHtestsV4 results for annual mean temperature at Fengqiu station (the curve shows base minus reference).
Figure 7.
Annual mean temperature at Fengqiu station before and after homogenization (red: original; black: homogenized).
As shown in Table 4, discontinuities at Huixian, Xinxiang, Huojia, and Yuanyang stations are primarily attributable to station relocation. Breakpoints related to relocation occurred mostly after 2000, likely because rapid urban expansion necessitated station moves. The discontinuity at Fengqiu station resulted from both relocation and instrument changes, with instrumentation evolving from manual thermometers to automatic sensors and then to higher-precision sensors.
Table 4.
Adjustment information for homogenization of annual temperature series at eight meteorological stations in Xinxiang.
Station metadata indicate that the transition to automated observations in Xinxiang occurred around 2010 but did not generate a coherent regional signal in the homogeneity results. Automation-related breakpoints were identified only at Weihui and Yanjin stations, with both positive and negative adjustments, indicating that automation-related observational biases are highly localized and station dependent.
For Changyuan station, the most recent relocation occurred in 2024. Because only one year of observations was available at the new site, a breakpoint could not be directly detected by RHtestsV4. Comparison with neighboring stations indicated an anomalous temperature decrease in 2024, opposite to surrounding behavior; this was interpreted as a systematic relocation-induced bias and corrected using the neighboring-station comparison method.
Breakpoints associated with station relocation are mainly concentrated in annual Tmean and Tmin series, indicating that these variables are more sensitive to changes in station exposure and the local environment. In terms of adjustment magnitude, the mean adjustment for Tmin is the largest (−0.56 °C; range −1.96 to 1.00 °C), followed by Tmean (−0.31 °C; −1.32 to 0.66 °C) and Tmax (−0.12 °C; −0.48 to 0.31 °C). This suggests that nighttime low temperatures respond most strongly to inhomogeneous factors.
4. Climate Change Characteristics
4.1. Changes in Temperature Trends Before and After Homogenization
In this section, the regional mean temperature series for Xinxiang City was constructed by calculating the arithmetic average of the homogenized temperature series from the eight stations. Since the original series at each station had already undergone independent homogenization testing and adjustment using the aforementioned methods, the inhomogeneous breakpoints in each station record were effectively removed, thereby minimizing mutual interference from concurrent inhomogeneities among stations. A simple linear regression model was then applied to quantify the long-term temperature trends. On this basis, the Mann–Kendall nonparametric test was further employed to assess the significance of the temperature trends at the 0.05 significance level.
4.1.1. Annual Changes
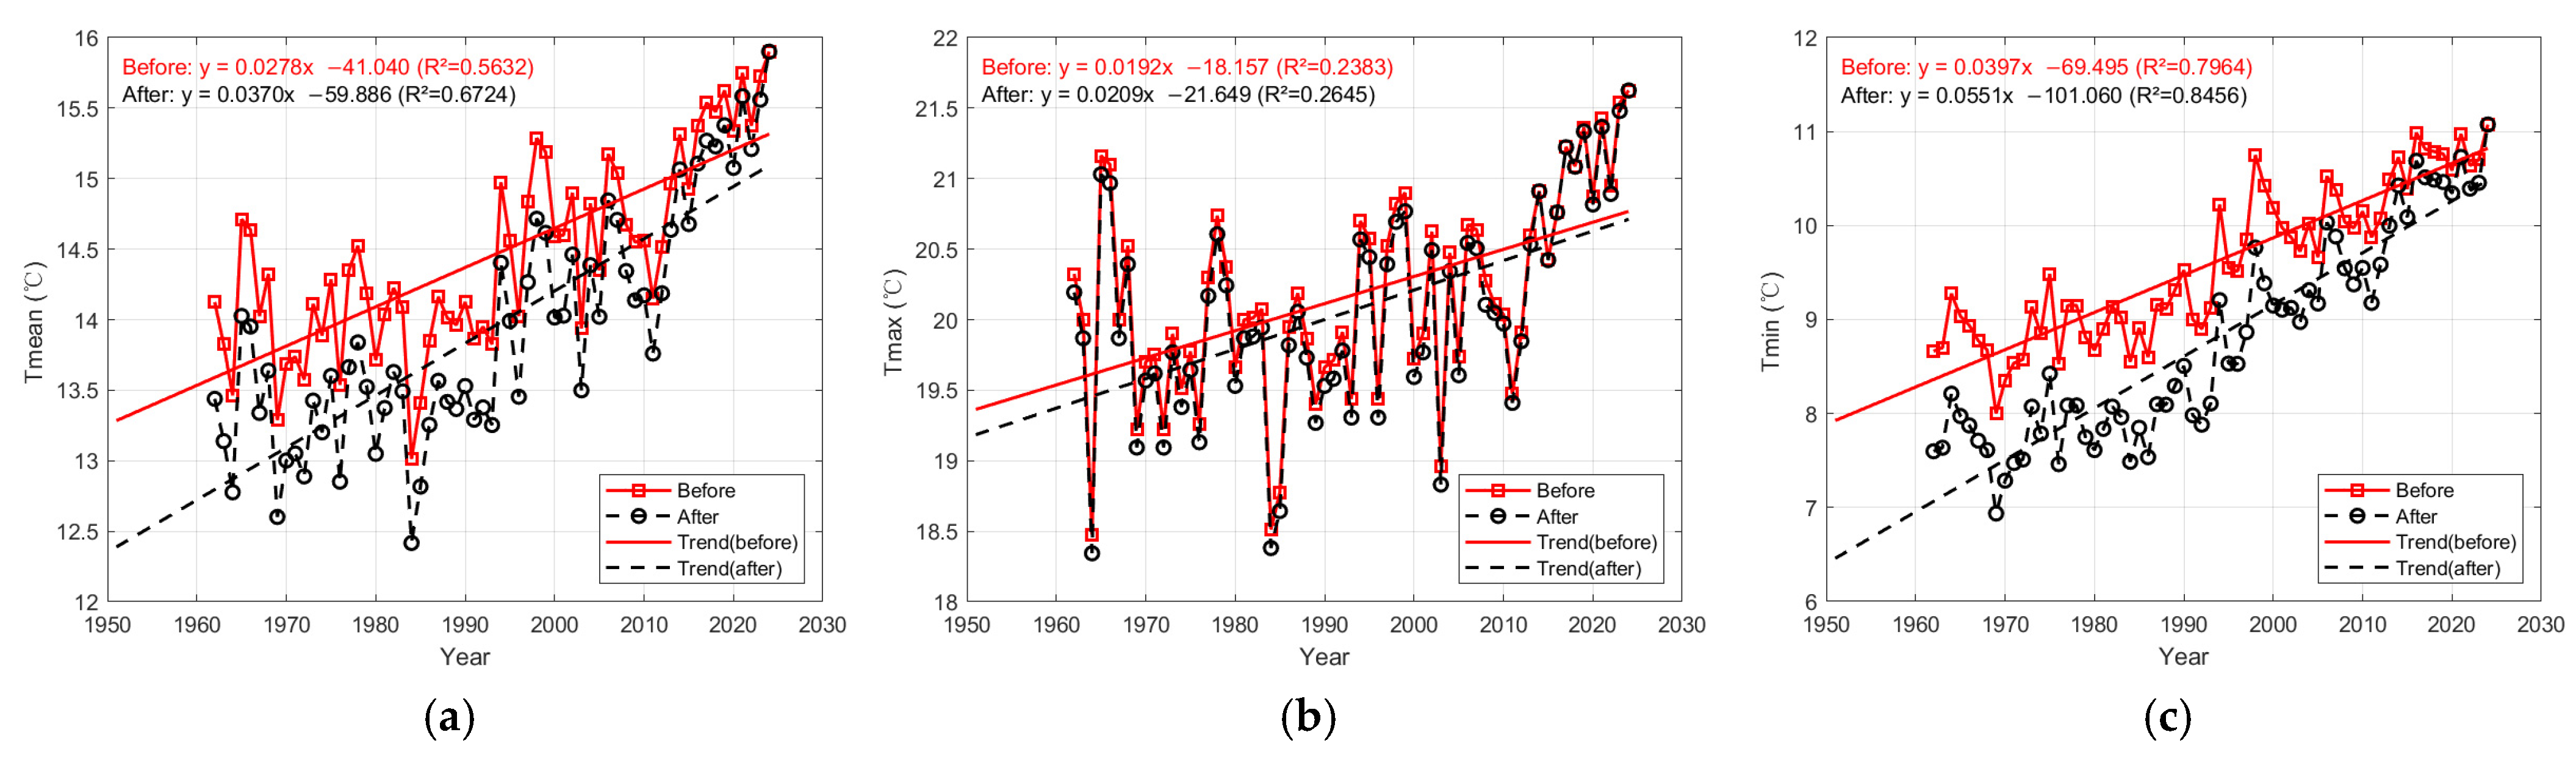
During 1962–2024 (excluding 1951–1961 because station data were incomplete), the annual mean temperature in Xinxiang City shows a clear increasing trend in both the original and homogenized series (Figure 8). Before homogenization, the warming rate was 0.278 °C/decade; after homogenization, it was 0.370 °C/decade, an increase of 0.092 °C/decade (33%). The long-term mean was adjusted from 14.5 °C to 13.9 °C, a decrease of 0.6 °C. The maximum annual mean temperature occurred in 2024 for both series (15.9 °C); the minimum occurred in 1984 (13.0 °C before and 12.4 °C after homogenization), a decrease of 0.6 °C.
Figure 8.
Annual Tmean (a), annual Tmax (b), and annual Tmin (c) before (red) and after (black) homogenization in Xinxiang City.
For annual mean Tmax, the warming rates before and after homogenization were 0.192 °C/decade and 0.209 °C/decade, respectively, an increase of 0.017 °C/decade (9%). The long-term mean decreased from 20.2 °C to 20.1 °C (−0.1 °C). The maximum occurred in 2024 (21.6 °C) for both series; the minimum occurred in 1964 (18.5 °C before and 18.3 °C after homogenization), a decrease of 0.2 °C.
For annual mean Tmin, the warming rates before and after homogenization were 0.397 °C/decade and 0.551 °C/decade, respectively, an increase of 0.154 °C/decade (39%). The long-term mean was adjusted from 9.6 °C to 8.8 °C (−0.8 °C). The maximum occurred in 2024 (11.1 °C) for both series; the minimum occurred in 1969 (8.0 °C before and 6.9 °C after homogenization), a decrease of 1.1 °C.
The homogenized series preserves the extreme years of the original series and reproduces the overall warming behavior, supporting the plausibility of the adjustments. Differences between the original and homogenized series are largest for annual Tmin, including the warming rate, long-term mean, and extremes. This is likely because Tmin typically occurs under stable nighttime conditions with strong near-surface radiative cooling, making it highly sensitive to local environmental changes [30]. Moreover, Tmin is a key indicator for defining the frost-free period and assessing chilling injury and frost damage, with direct implications for winter-crop risk assessment and planting-layout optimization [31]. Therefore, accurate homogenization of Tmin is essential for reliably assessing changes in nighttime climate resources and for agricultural climate-risk assessments in Xinxiang.
For the long-term temperature trends, the homogenized series was examined using the Mann–Kendall test (Table 5). The test statistics for annual mean temperature, annual mean maximum temperature, and annual mean minimum temperature were 7.046, 4.188, and 8.583, respectively, all exceeding the critical value of 1.96 at the 95% confidence level. This indicates that the homogenized temperature series in the Xinxiang region showed a significant warming trend.
Table 5.
Results of the Mann-Kendall trend test for annual mean, mean maximum, and mean minimum air temperatures in Xinxiang City.
4.1.2. Seasonal Changes
Seasons were defined as follows: spring (March–May), summer (June–August), autumn (September–November), and winter (December–February).
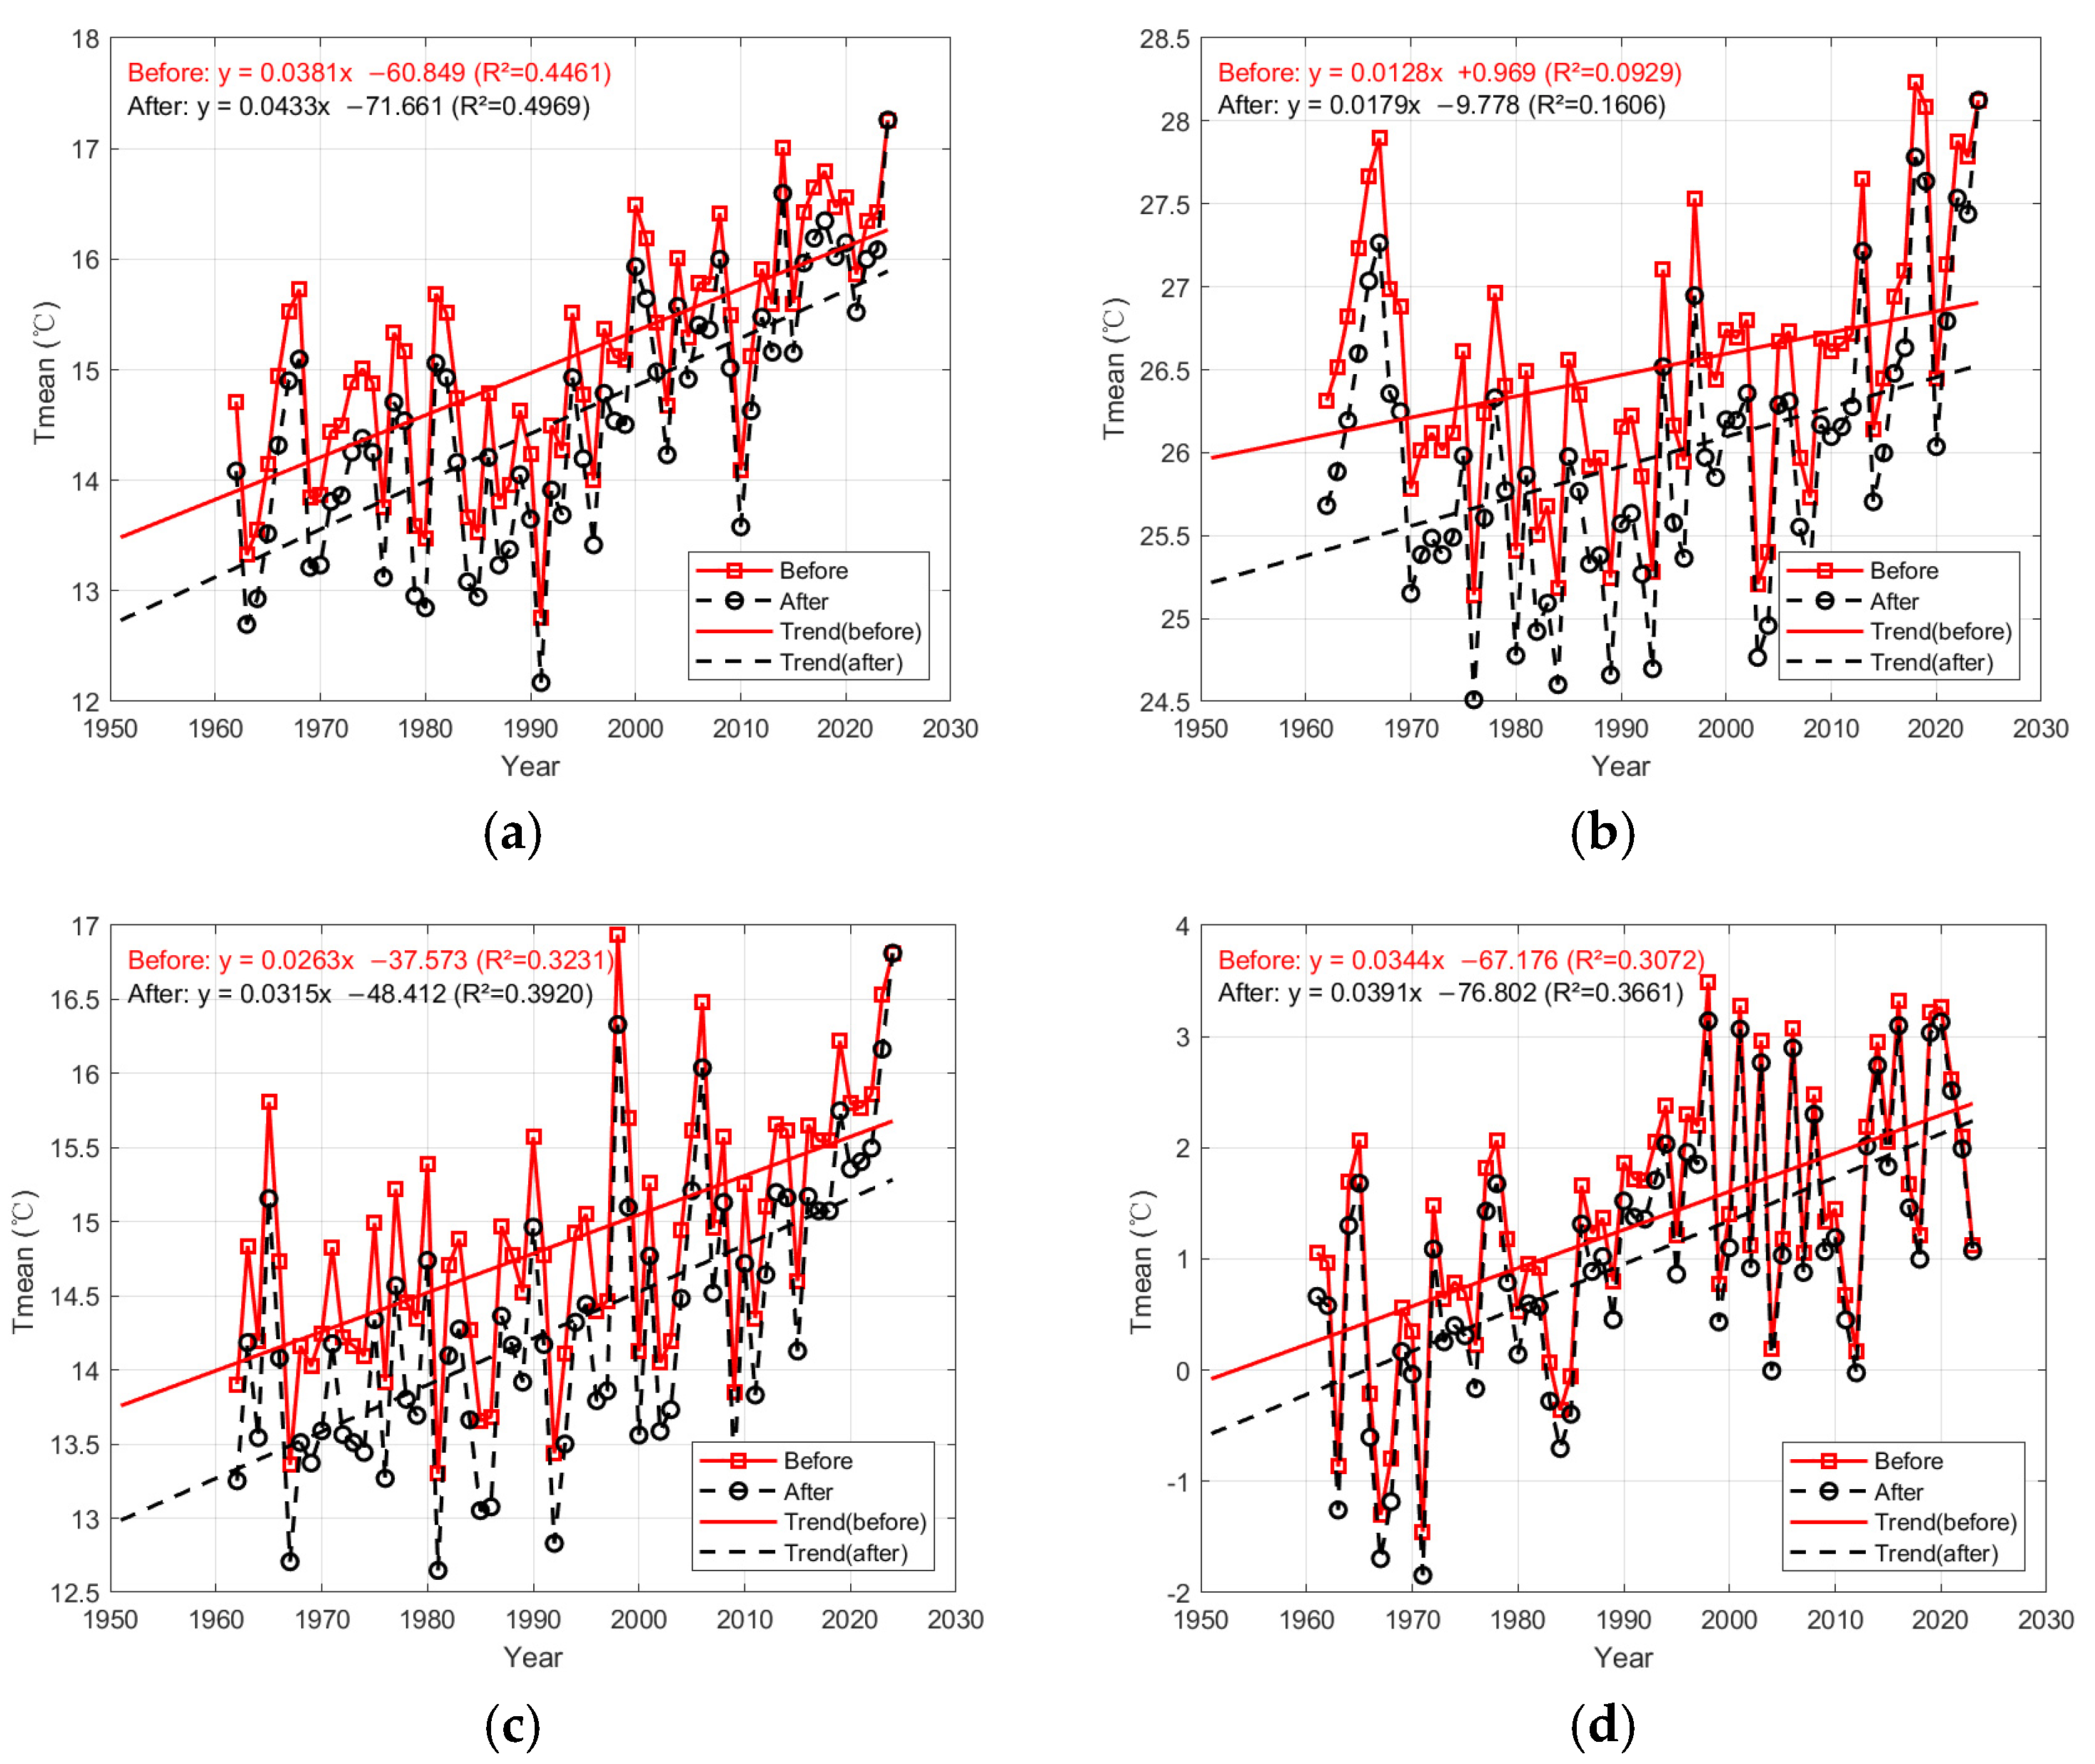
From Figure 9, Figure 10 and Figure 11 and Table 6, seasonal mean temperatures in Xinxiang show consistent increasing trends before and after homogenization. Before homogenization, spring exhibited the strongest warming (0.381 °C/decade), followed by winter (0.344 °C/decade), autumn (0.263 °C/decade), and summer (0.128 °C/decade). After homogenization, spring still shows the largest warming (0.433 °C/decade), followed by winter (0.391 °C/decade) and autumn (0.315 °C/decade), with summer being the weakest (0.179 °C/decade). The seasonal warming rates increased by 0.052 °C/decade (14%), 0.051 °C/decade (40%), 0.052 °C/decade (20%), and 0.047 °C/decade (14%), respectively.
Figure 9.
Seasonal Tmean before (red) and after (black) homogenization in Xinxiang City: spring (a), summer (b), autumn (c), and winter (d).
Figure 10.
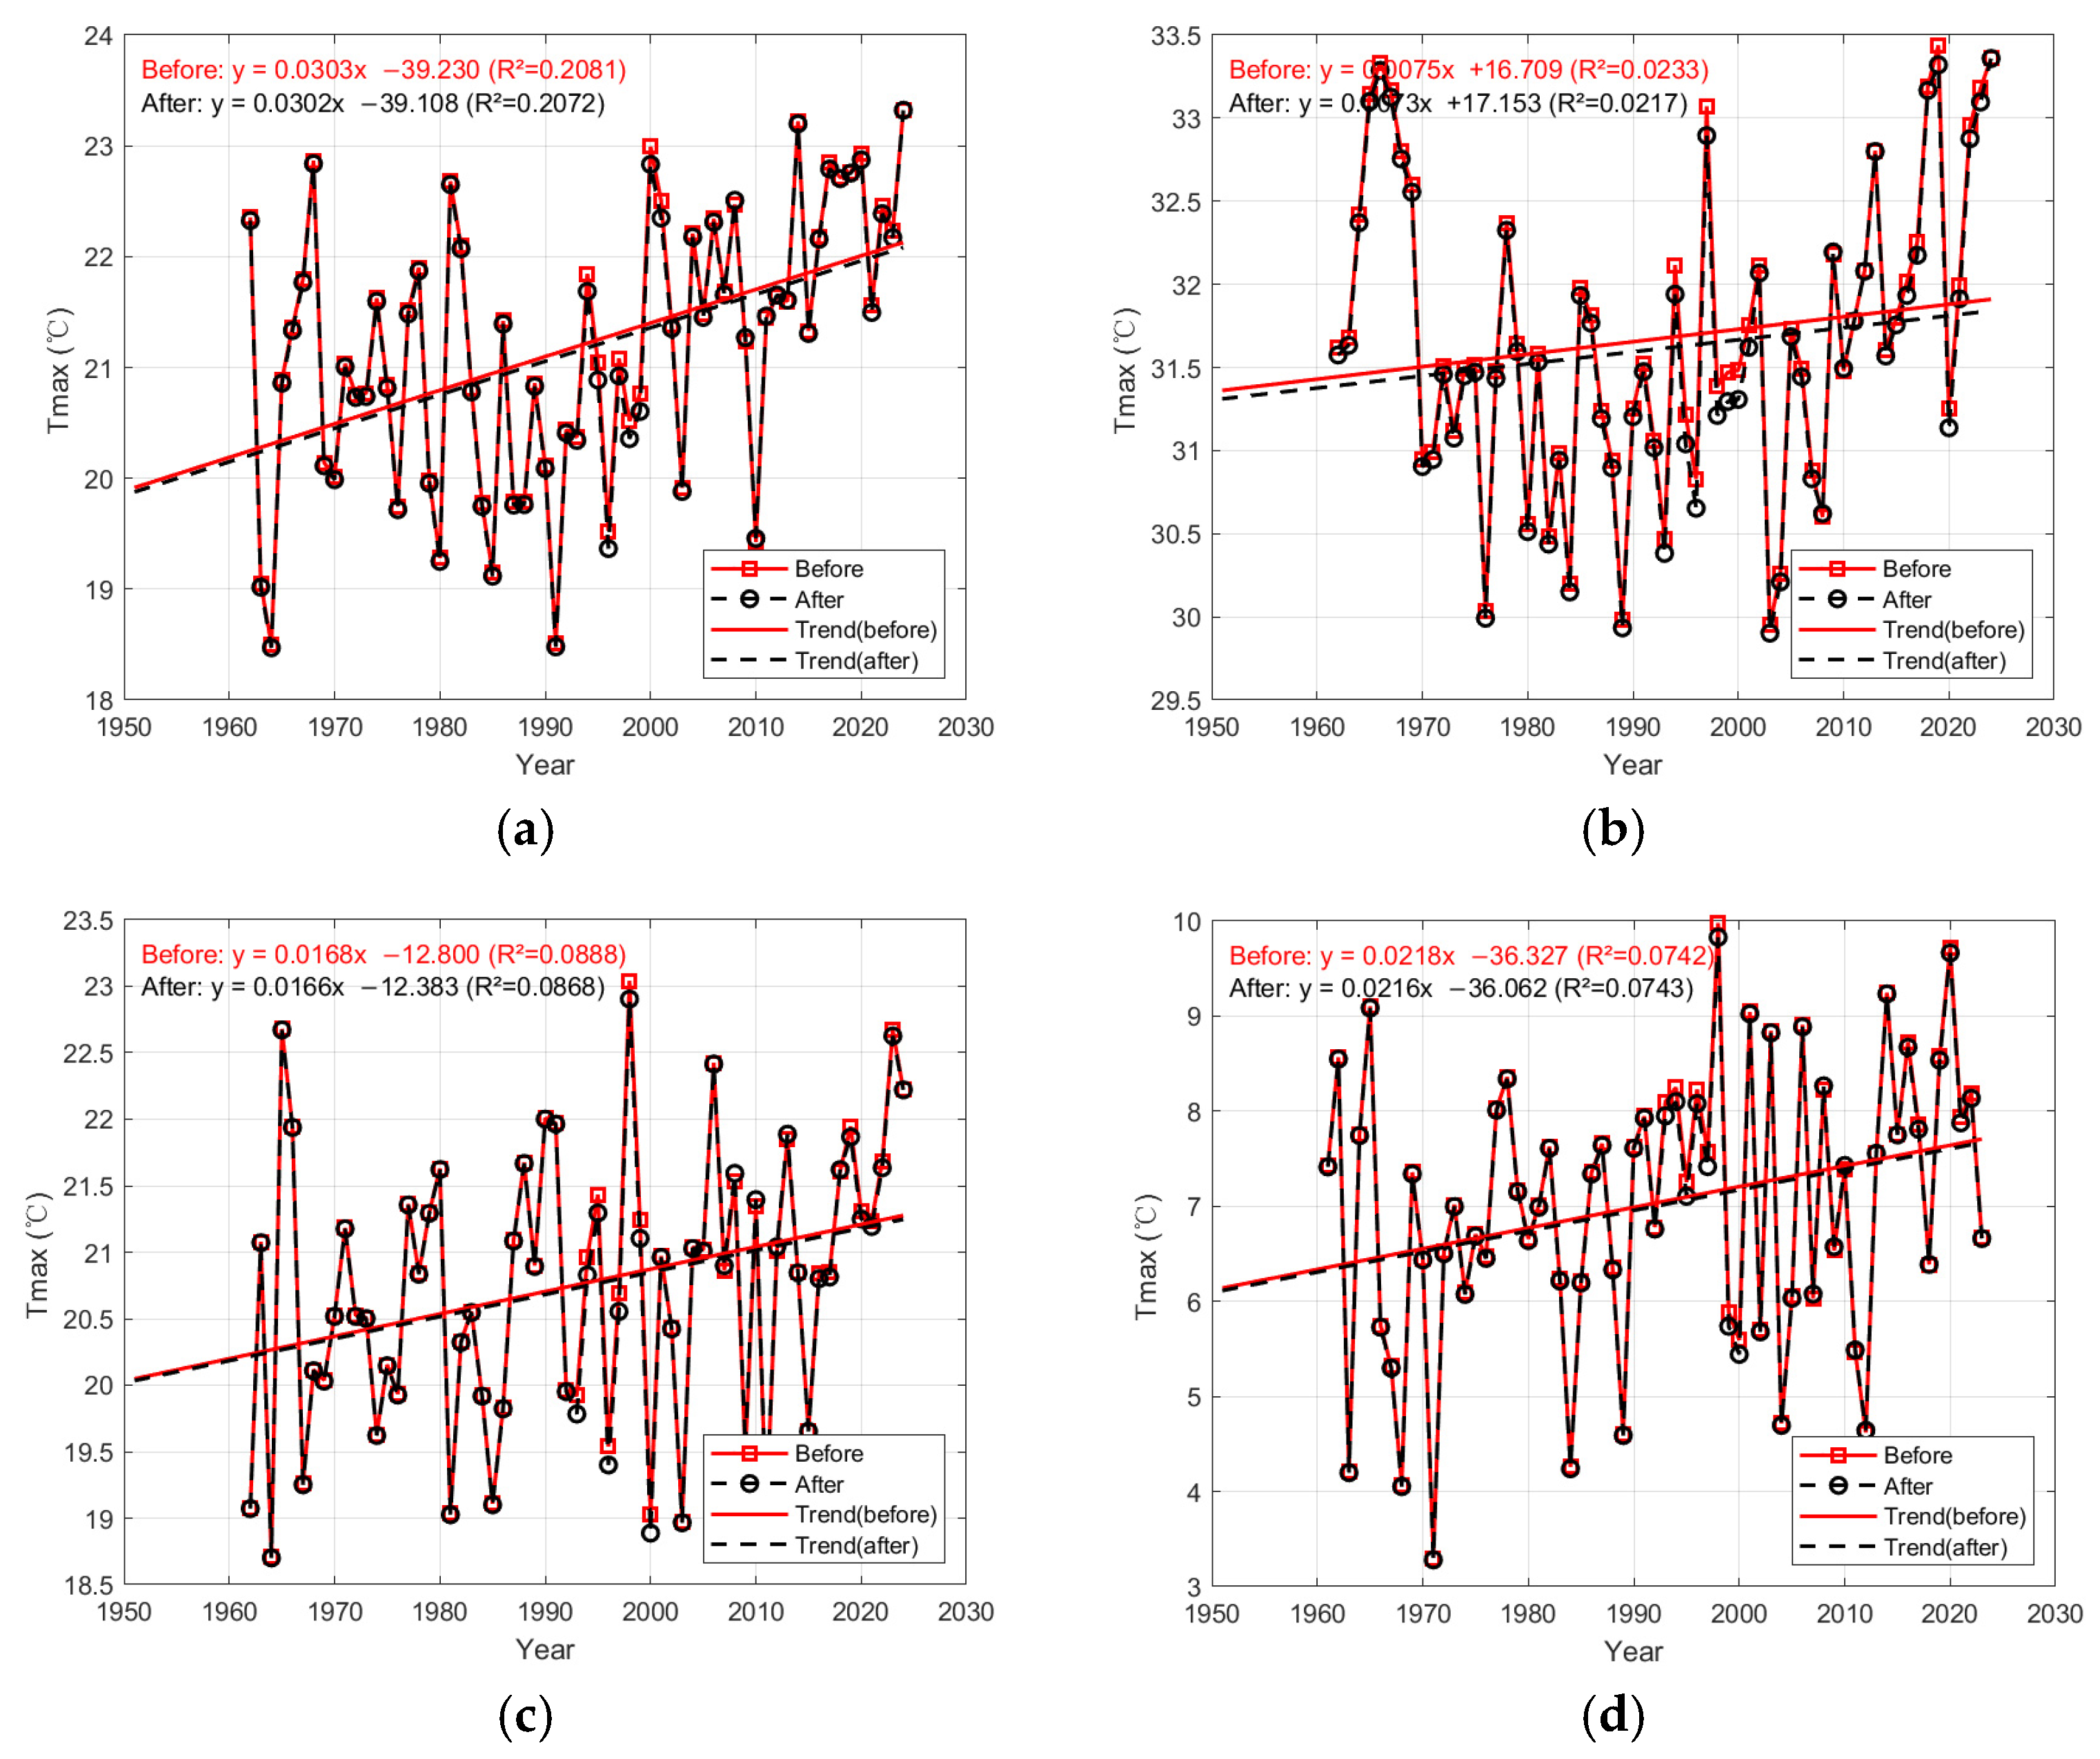
Seasonal Tmax before (red) and after (black) homogenization in Xinxiang City: spring (a), summer (b), autumn (c), and winter (d).
Figure 11.
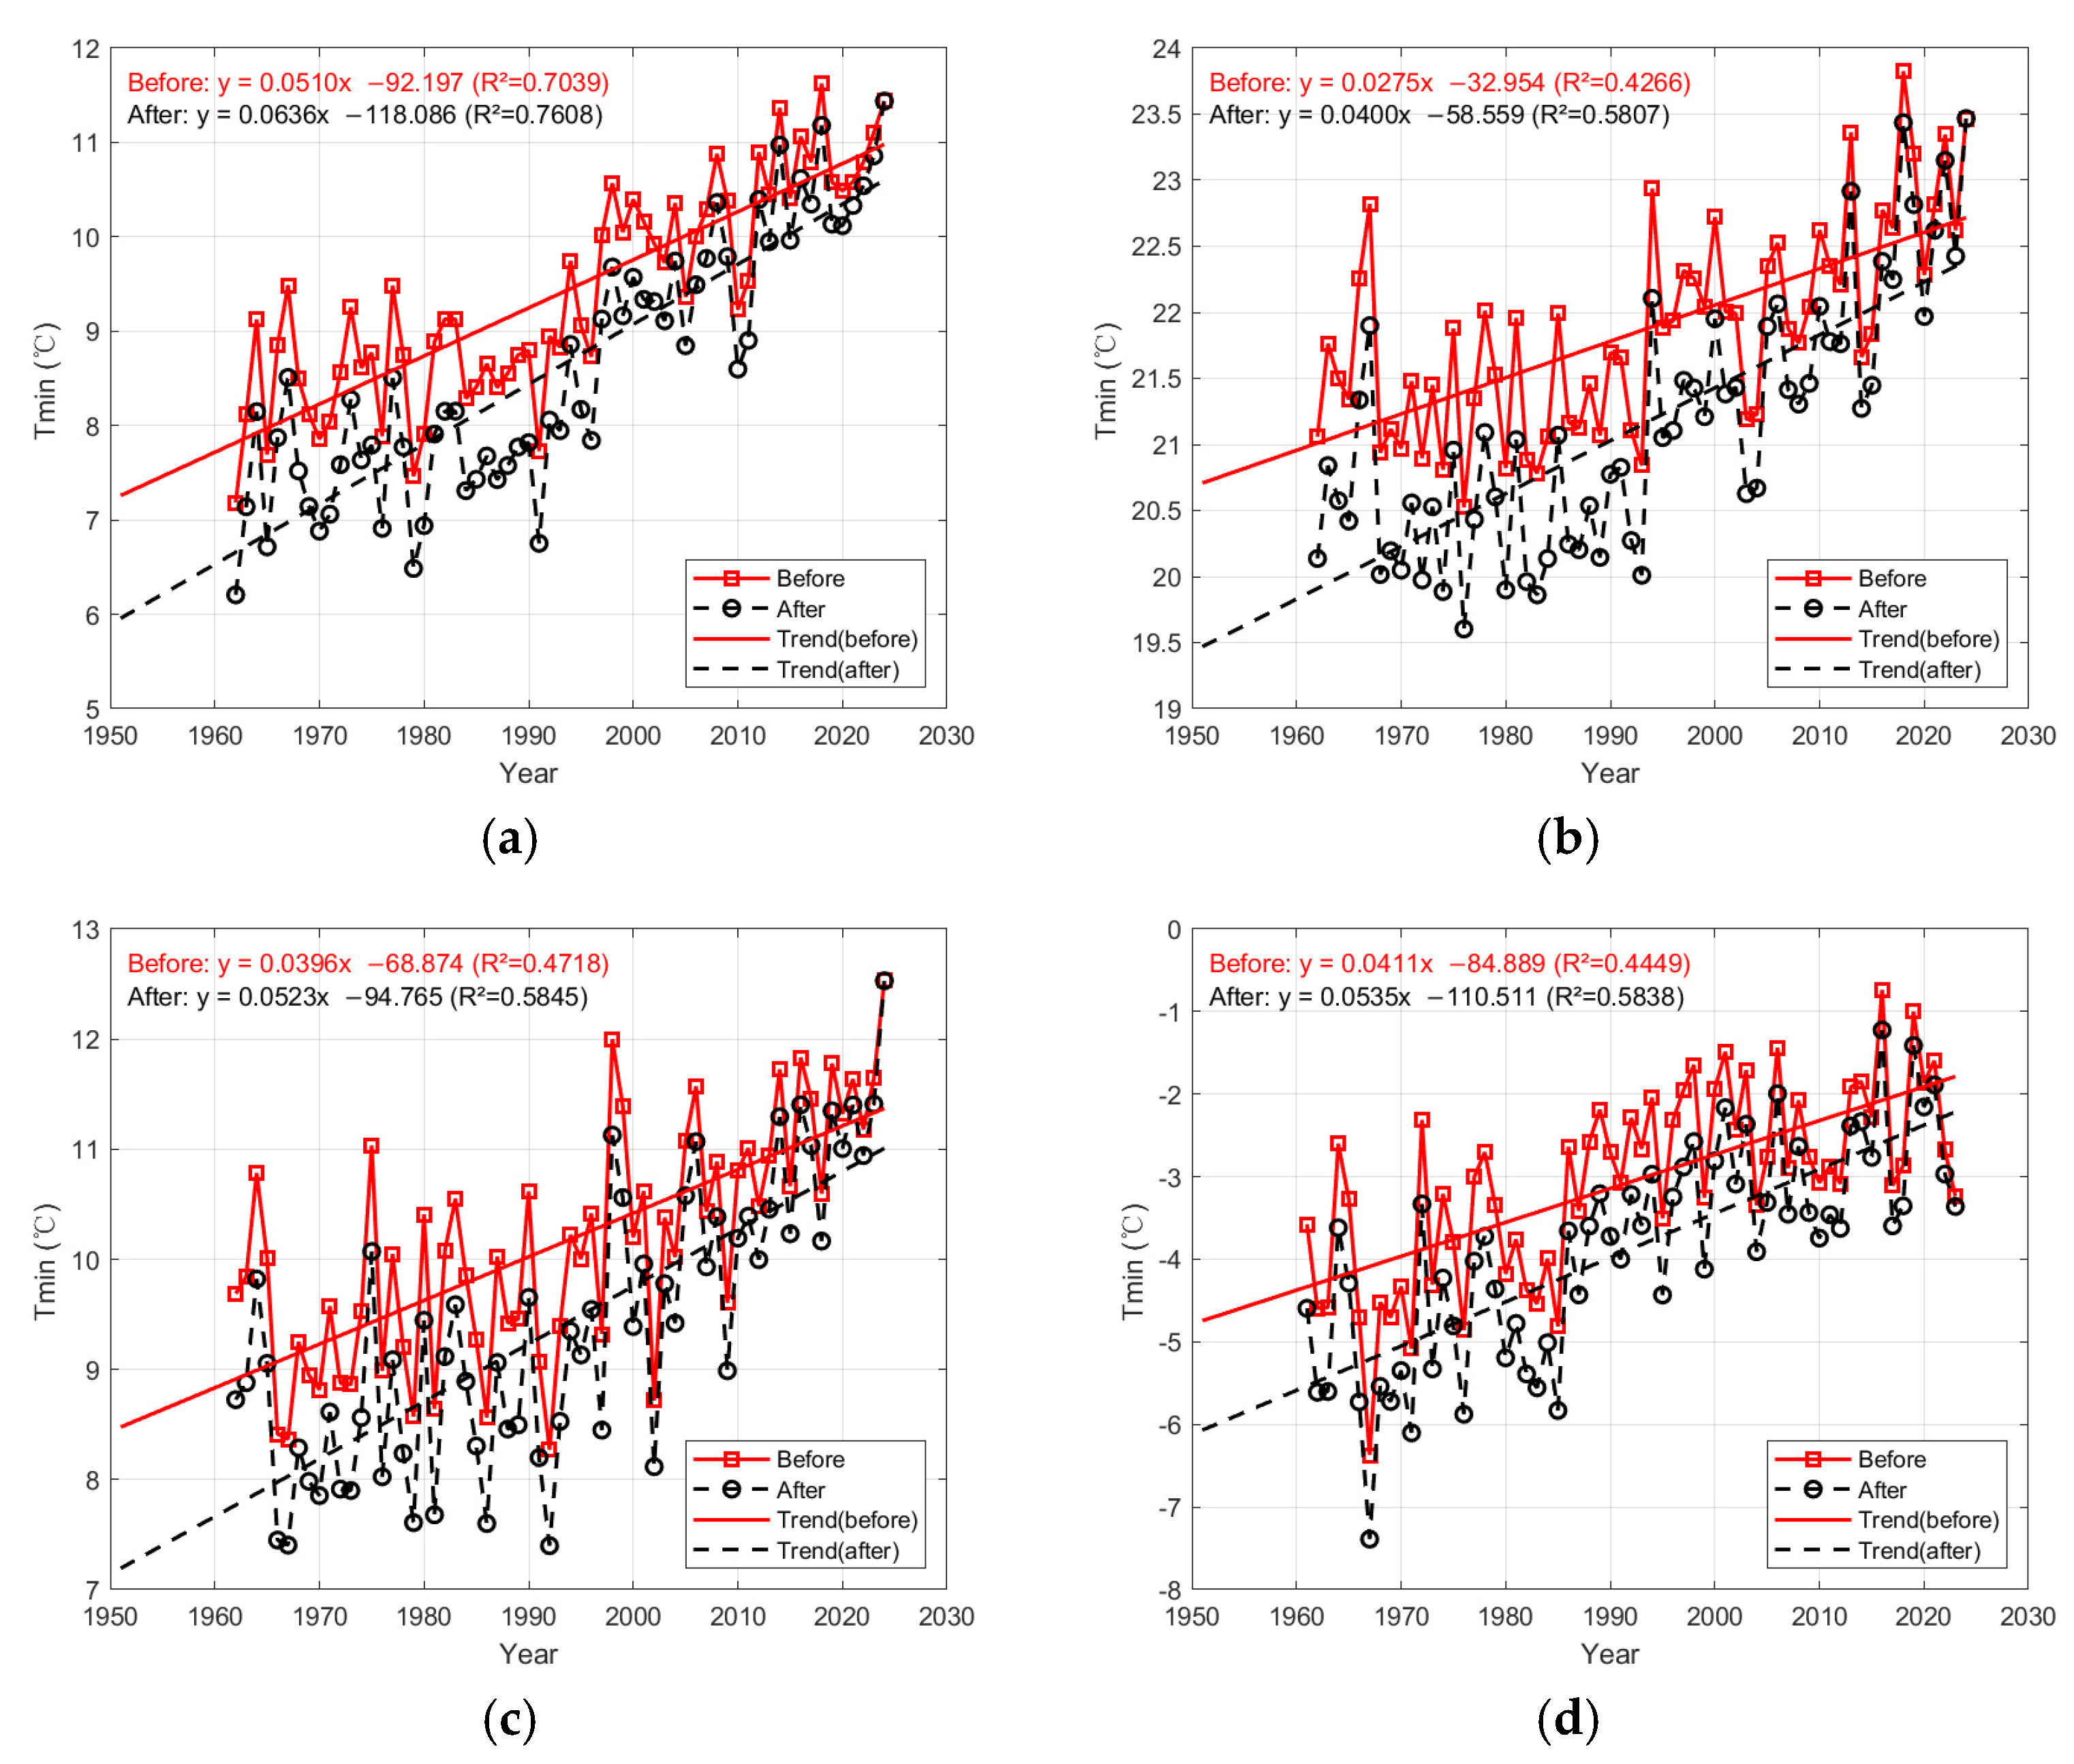
Seasonal Tmin before (red) and after (black) homogenization in Xinxiang City: spring (a), summer (b), autumn (c), and winter (d).
Table 6.
Linear trend rates of seasonal temperature in Xinxiang City (°C/decade).
For seasonal Tmax and Tmin, spring also exhibits the strongest warming. The warming rates for Tmax before and after homogenization are 0.303 °C/decade and 0.302 °C/decade, respectively. For Tmin, the corresponding rates are 0.510 °C/decade and 0.636 °C/decade.
The stronger spring warming compared with the annual trend suggests that spring temperature changes contribute substantially to overall warming in Xinxiang. Consistent with the annual results, the warming rate of Tmin in each season exceeds that of Tmax, indicating a relatively larger contribution of nighttime warming.
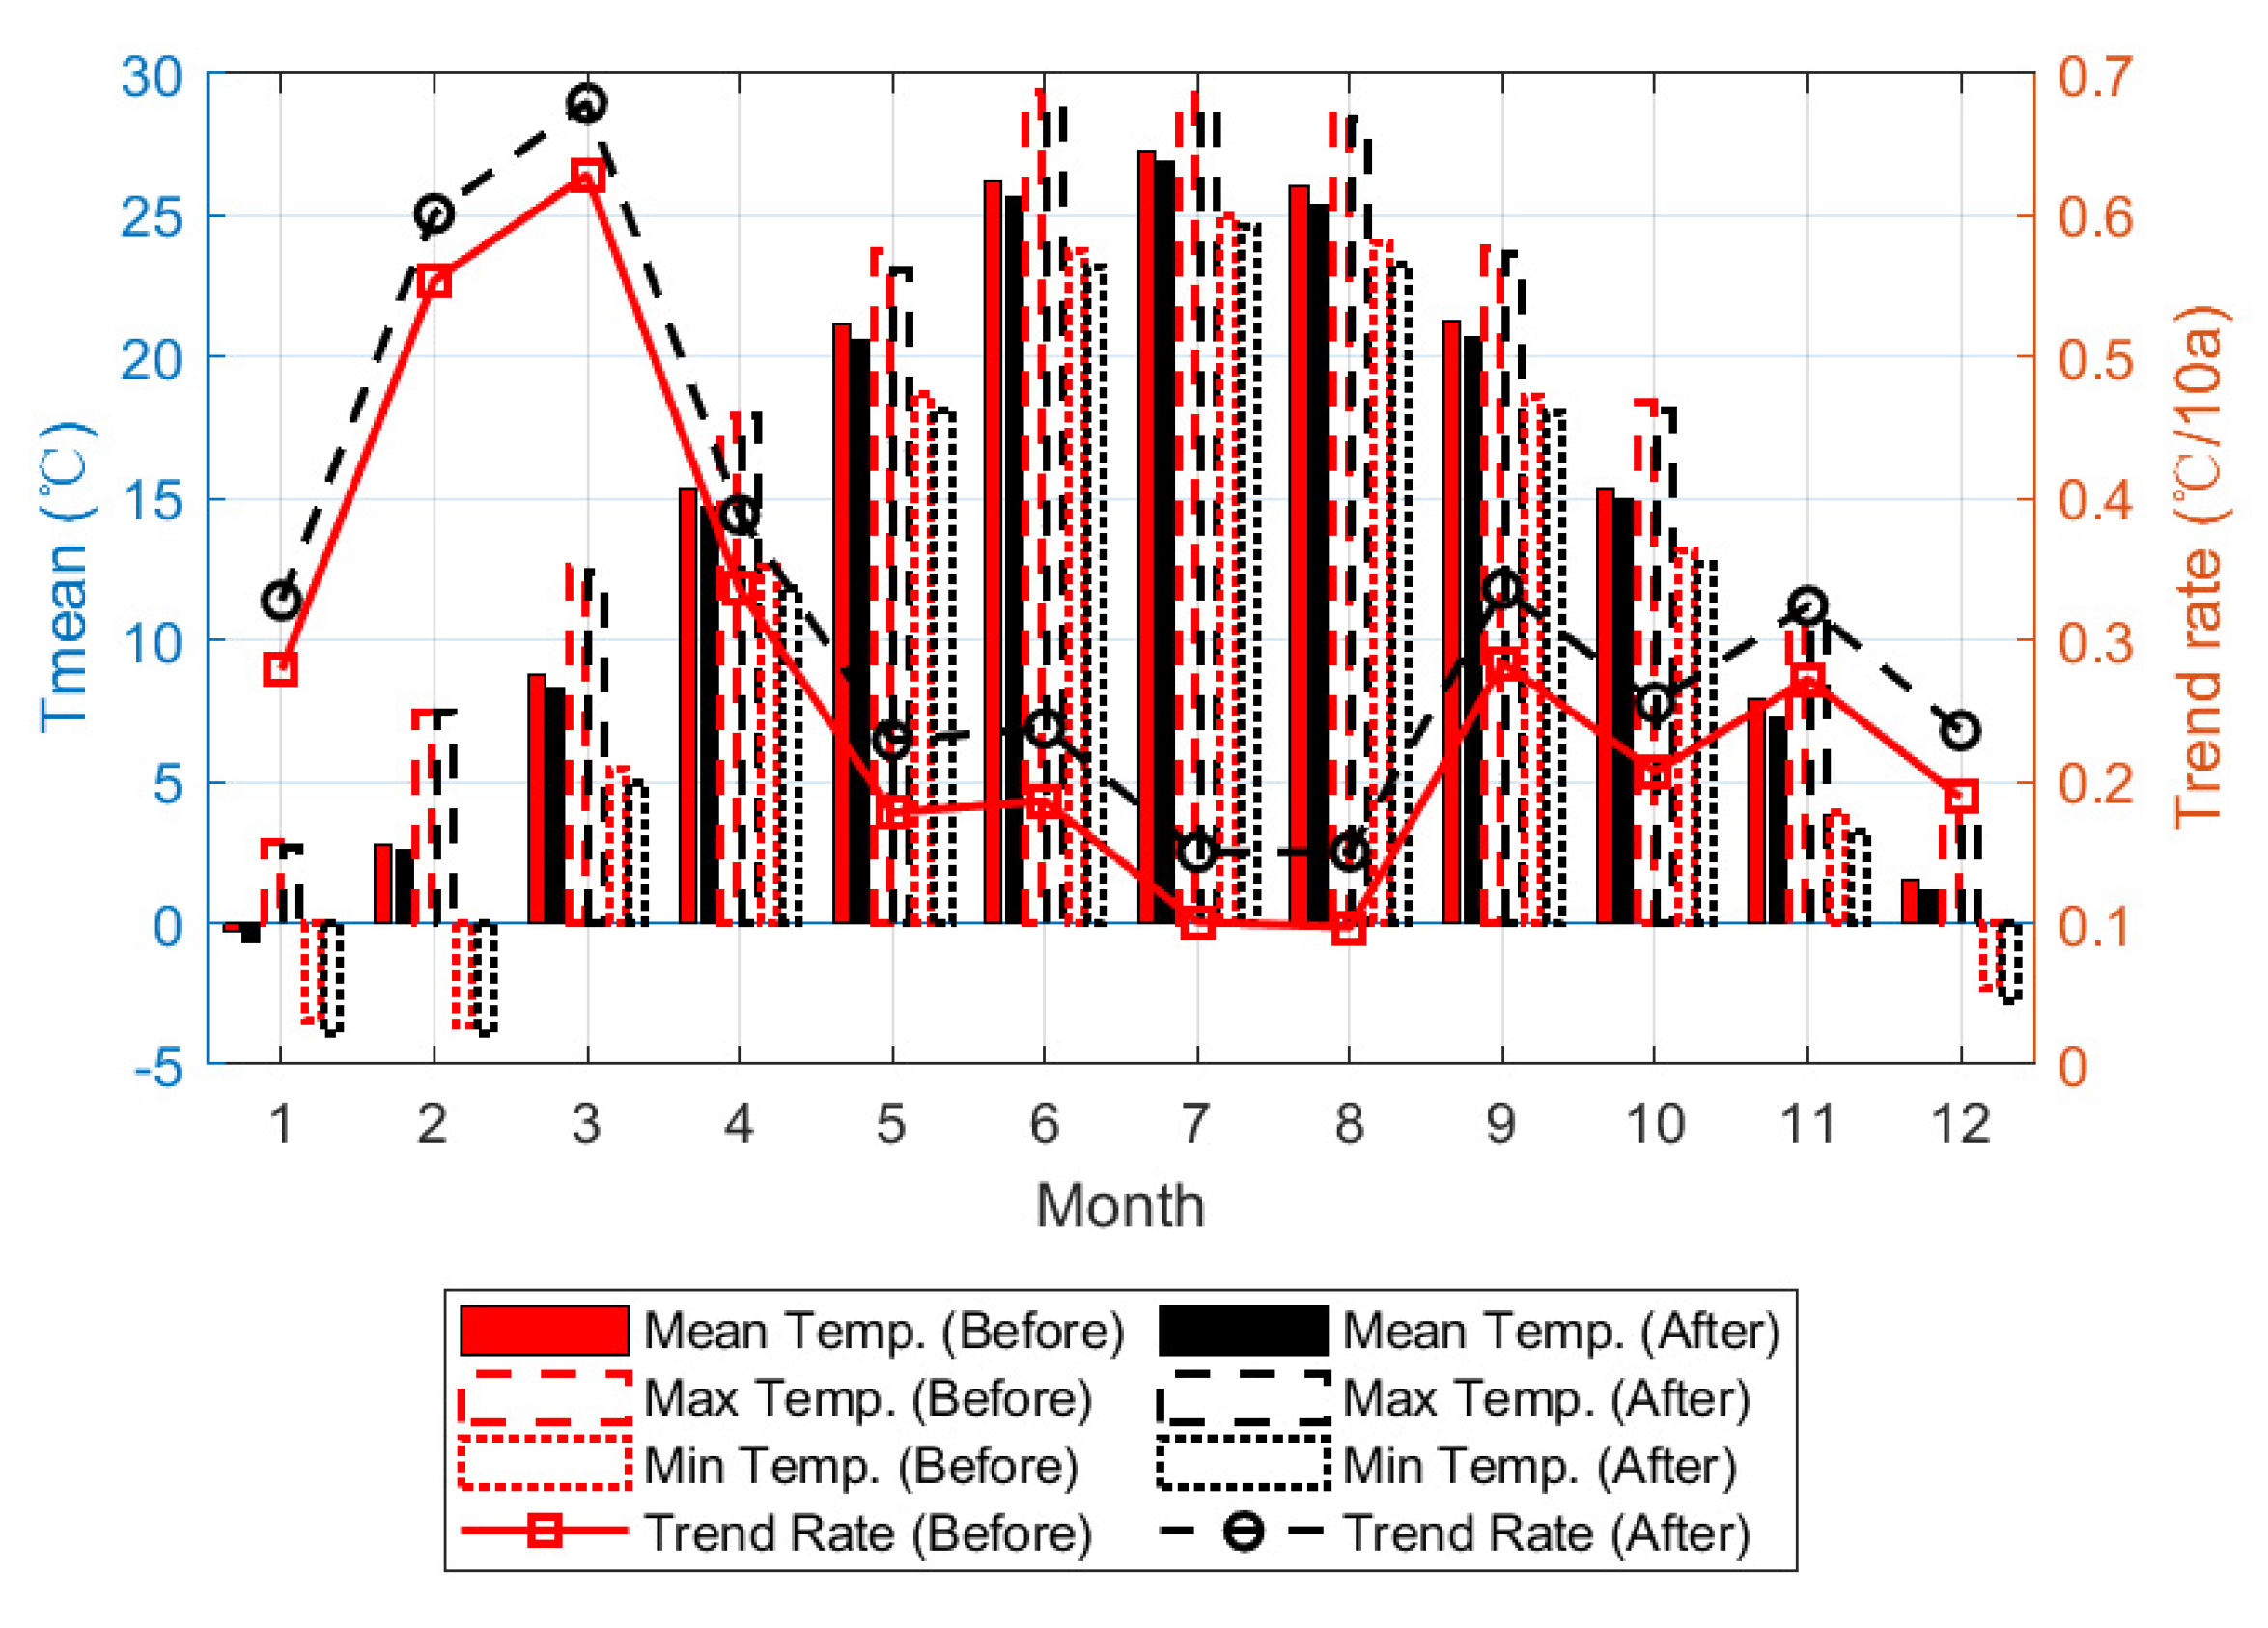
4.1.3. Monthly Changes
The main effects of homogenization on monthly temperature in Xinxiang are reflected in the adjustment of extremes and a clearer representation of long-term trends. For monthly Tmean (Figure 12), the peak occurs in July and the minimum in January, showing a typical unimodal seasonal cycle. This pattern is unchanged after homogenization, consistent with the climatological seasonal variation in North China. After homogenization, both monthly means and extremes decrease, indicating that homogenization reduced records influenced by non-climatic factors.
Figure 12.
Monthly temperature (January–December) before (red) and after (black) homogenization in Xinxiang City.
In terms of trends, before homogenization, monthly Tmean increased by 0.097–0.629 °C/decade, with the highest rate in March (0.63 °C/decade), followed by February (0.55 °C/decade) and April (0.34 °C/decade). After homogenization, monthly warming rates range from 0.15 to 0.68 °C/decade, with March still exhibiting the largest increase (0.68 °C/decade), followed by February (0.60 °C/decade) and April (0.39 °C/decade).
Overall, spring warming is the most pronounced in Xinxiang, and March warms the fastest. This pattern is consistent with recent studies reporting enhanced spring warming in different regions, such as the shift of the fastest warming season from winter to spring in the arid region of Northwest China [32], spring becoming the fastest warming season in Shanxi Province after the mid-1990s [33], and observations in Central Asia showing stronger warming rates in March compared to other months [34]. The rapid warming in spring, particularly in March, is relevant for regional agricultural production because it coincides with key stages such as crop regreening, flowering, and spring sowing. Temperature increases during this period can affect crop phenology, growing-season length, and agricultural water allocation.
4.2. Impact of Homogenization on Spatial Patterns and Trends
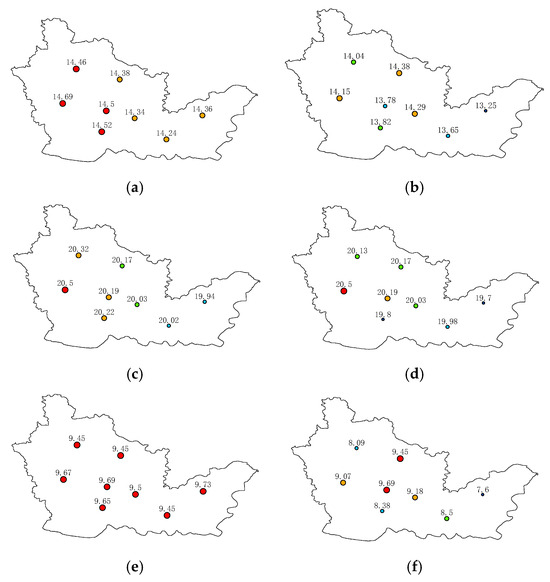
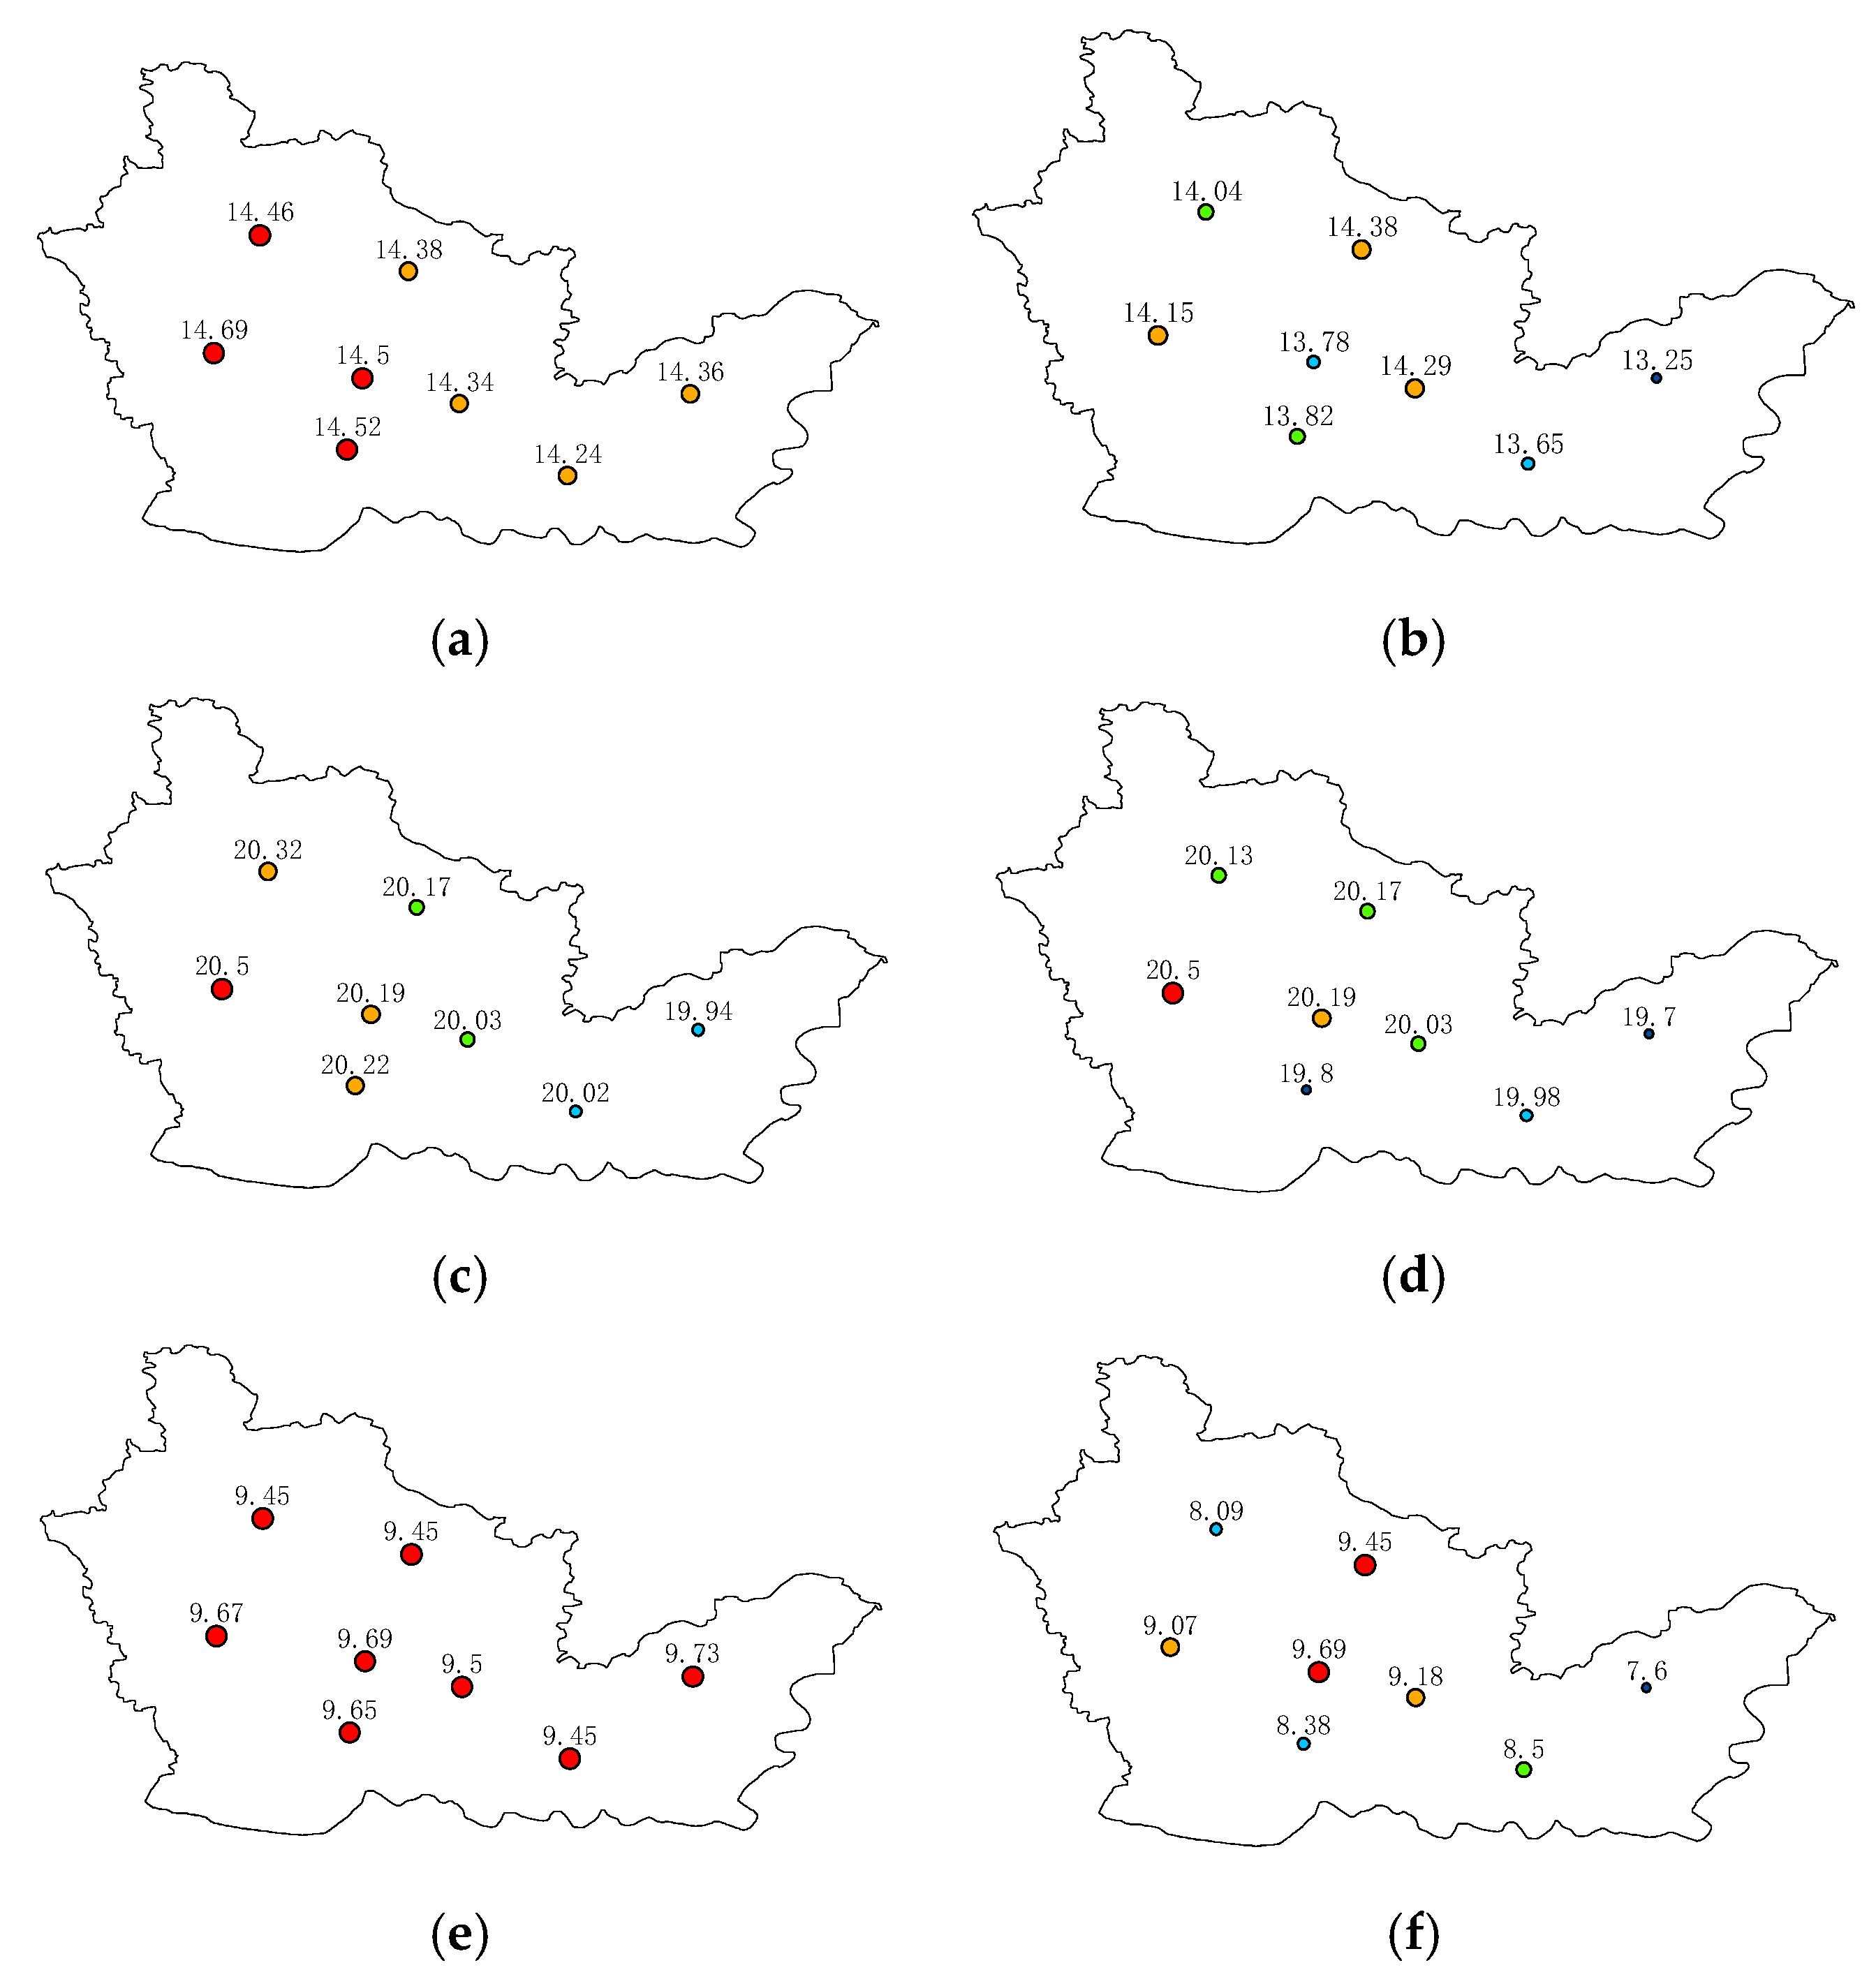
Figure 13 shows how homogenization modifies the spatial distribution of temperature across stations in Xinxiang. Before homogenization, the annual Tmean ranges from 14.2 to 14.7 °C (Figure 13a), exhibiting higher values in the west and lower values in the east. After homogenization, Tmean decreases to 13.3–14.4 °C (Figure 13b), with a cooling range of −1.11 to 0 °C, closely related to negative adjustments associated with station relocations in recent years. The higher values at western stations before homogenization likely included non-climatic influences such as local heat-island effects at earlier sites. After homogenization, spatial heterogeneity induced by non-climatic factors is reduced, thereby revealing a more physically meaningful regional gradient.
Figure 13.
Spatial patterns of annual Tmean (a,b), annual Tmax (c,d), and annual Tmin (e,f) before (left) and after (right) homogenization in Xinxiang City (unit: °C).
Adjustments for Tmax are smaller, consistent with its lower sensitivity to non-climatic changes. Before homogenization (Figure 13c), station Tmax ranges from 19.9 to 20.5 °C, with a west-high/east-low pattern. After homogenization (Figure 13d), values range from 19.7 to 20.5 °C; only four stations show slight decreases (−0.42 to 0 °C), and the overall west-high/east-low pattern is preserved.
Differences in Tmin before and after homogenization are the most pronounced. Before homogenization (Figure 13e), station Tmin ranges from 9.5 to 9.7 °C, showing small inter-station differences and no clear gradient. After homogenization (Figure 13f), Tmin decreases substantially to 7.6–9.7 °C (cooling range −3.13 to 0 °C), and spatial contrasts increase markedly, producing a pattern of higher values in central Xinxiang and lower values in the east. Foothill stations in the northwest also exhibit lower temperatures, reflecting topographic influences. Overall, homogenization reduces the masking effect of urbanization on the spatial characteristics of Tmin and reveals a pattern shaped by terrain and land-surface conditions.
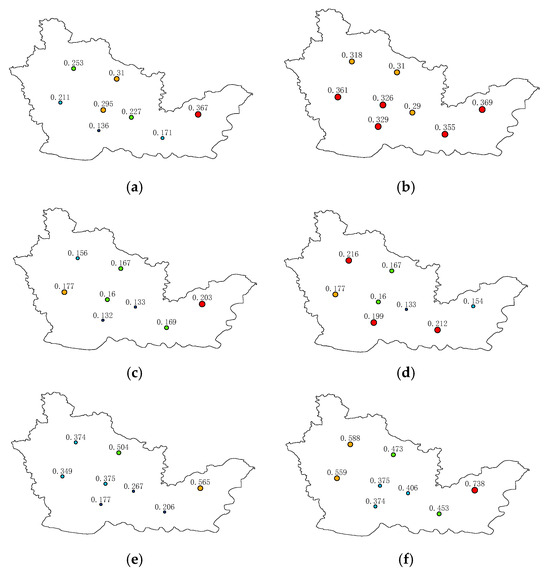
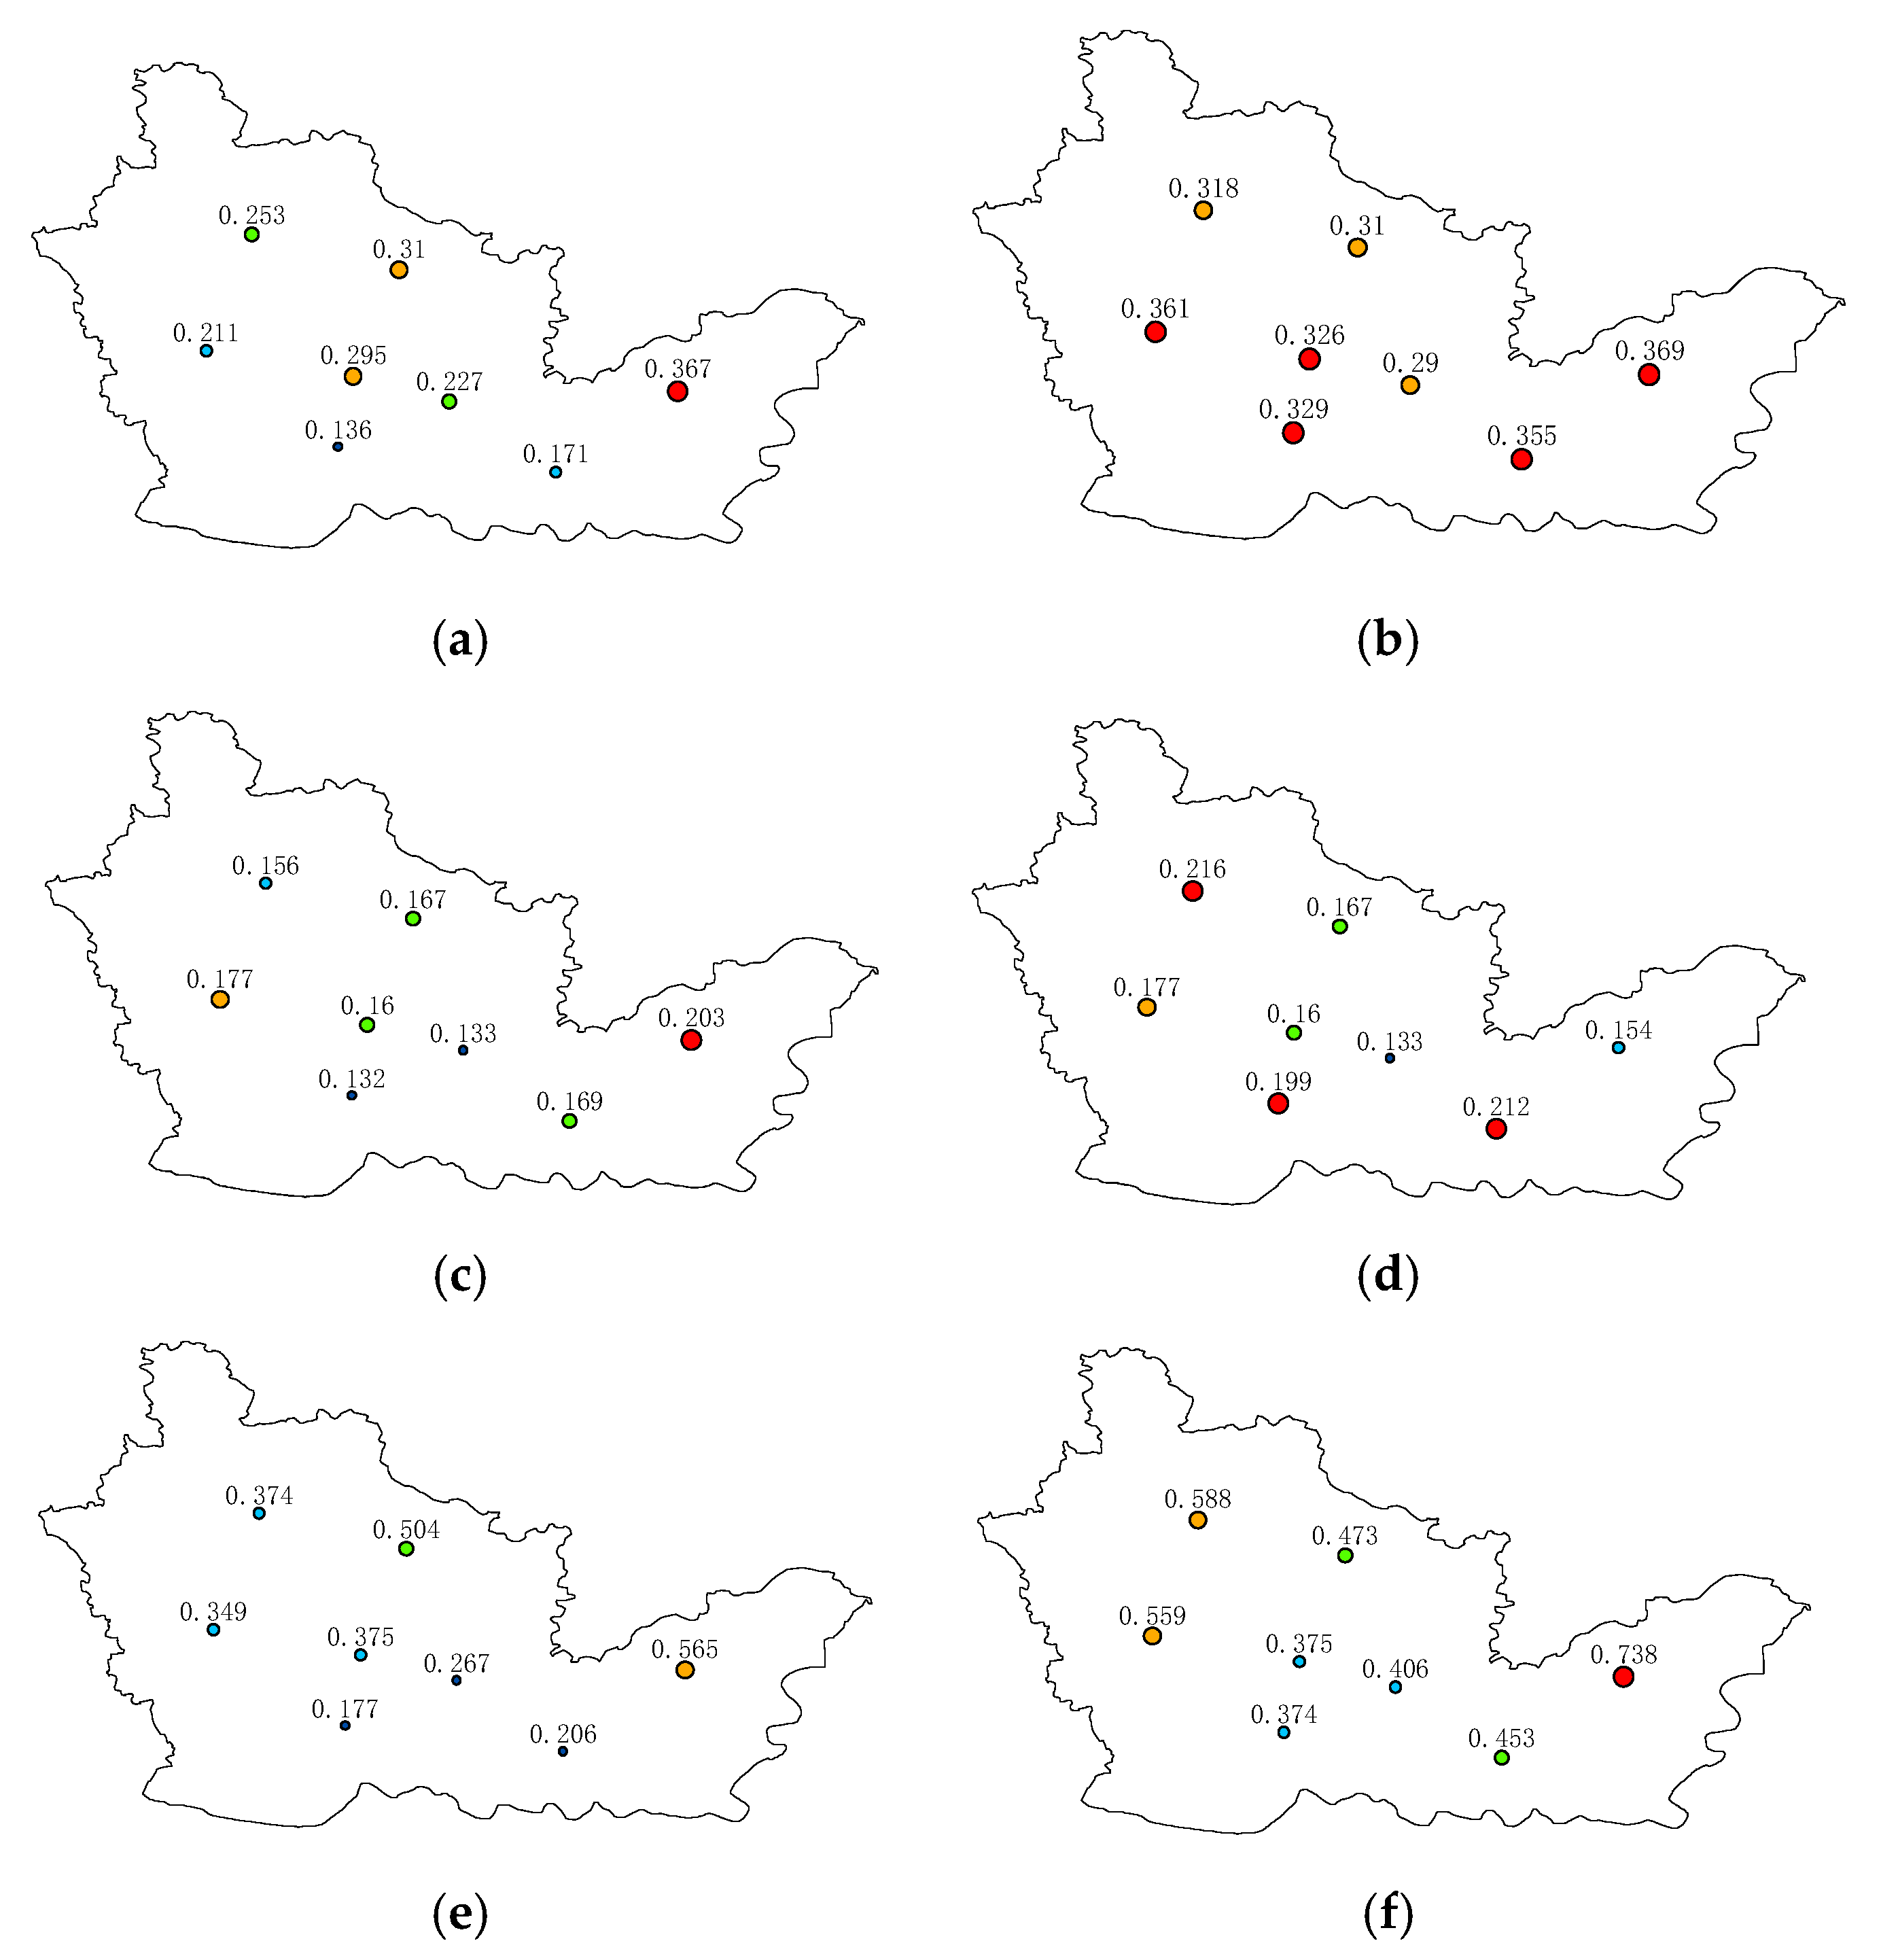
Figure 14 shows the spatial distribution of linear trend coefficients before and after homogenization. For annual Tmean, the warming rate ranges from 0.136 to 0.367 °C/decade before homogenization (Figure 14a), with larger values at eastern and central stations. After homogenization (Figure 14b), the range becomes 0.29–0.369 °C/decade, indicating an overall enhancement and a more balanced spatial distribution, which better reflects regionally coherent warming.
Figure 14.
Spatial patterns of linear trend coefficients for annual Tmean (a,b), annual Tmax (c,d), and annual Tmin (e,f) before (left) and after (right) homogenization in Xinxiang City (unit: °C/decade).
For annual Tmax, the warming rate ranges from 0.132 to 0.203 °C/decade before homogenization (Figure 14c). After homogenization (Figure 14d), it ranges from 0.16 to 0.216 °C/decade; high-trend areas extend southward, while the central region warms more slowly.
Annual Tmin exhibits the strongest warming and the largest adjustments. Before homogenization (Figure 14e), the warming rate ranges from 0.177 to 0.565 °C/decade, with strong spatial contrasts. After homogenization (Figure 14f), the warming rate ranges from 0.368 to 0.737 °C/decade, showing stronger warming in the east and west and relatively moderate warming in the central area.
Spatial patterns of warming trends in Xinxiang are not fully consistent with the spatial distribution of mean temperature. One explanation is that the impact of urbanization on temperature depends not only on the current level of urbanization but also on the rate of urban expansion [35,36]. Rapid expansion in the eastern part of the region in recent years may therefore contribute to stronger warming trends there compared with the long-established urban core.
Overall, the spatial characteristics of temperature change in Xinxiang reflect the combined effects of heterogeneous urbanization rates, asymmetric responses among temperature variables, and local geographic background. Homogenization corrects non-climatic biases, clarifies the stronger warming response in the eastern region, and improves the interpretability of spatial contrasts, providing a useful basis for understanding climate evolution in small and medium-sized cities.
5. Discussion
Compared with previous homogenization studies conducted, this study has several distinctive features. First, it focuses on a small and medium-sized city region, thereby filling an important gap in homogenization research at this spatial scale. Existing studies have mainly concentrated on national-scale datasets or large cities, whereas small- and medium-sized cities have long been excluded from systematic homogenization efforts because of low station density and incomplete historical records [9,10,11,37]. In this study, a long-term homogenized temperature dataset for the Xinxiang region covering 1951–2024 was developed, providing a technical framework for similar regions.
Second, in addition to statistical testing, this study systematically incorporated station metadata, such as station relocation and instrument replacement, to verify detected breakpoints. At the annual and monthly scales, 81% and 88% of the breakpoints, respectively, were supported by metadata (Figure 3). This level of verification is superior to that in many studies relying solely on statistical methods, and it makes the adjustment results more physically grounded and interpretable [17,38,39].
Third, the data series extends to 2024, covering the period of accelerated global warming since the 2010s, and therefore provides a more complete representation of recent climate change characteristics [40,41]. These features enable the present study not only to verify previously reported patterns, but also to reveal the regional climate characteristics of Xinxiang, a small- to medium-sized city, with greater precision.
Despite these contributions, several limitations should also be acknowledged. First, the construction of the reference series during homogenization was constrained by station distribution density, which may have reduced its representativeness, and the climatic background differences among neighboring stations were not fully quantified. Second, there remains uncertainty regarding the causes of some breakpoints. In particular, several breakpoints with “unknown causes” were identified only through statistical testing, and the effects of hidden non-climatic factors may therefore have been overlooked. Third, the mean-adjustment method addresses only shifts in the mean and does not account for other forms of inhomogeneity, such as variance changes or trend reversals; its applicability to extreme temperature series therefore requires further evaluation. Fourth, differences in the degree of urbanization among stations were not explicitly distinguished, which may have led to some confounding between urban heat island effects and the signal of actual climate warming. Nevertheless, the focus of this study is mainly on the long-term trend changes and regional spatial patterns of temperature series before and after homogenization correction; these limitations do not affect the main conclusions of this study.
6. Conclusions and Future Perspectives
This study used RHtestsV4 to homogenize temperature series in Xinxiang and to better characterize regional climate change in both time and space. The main conclusions are as follows:
- (1)
- A homogenized annual and monthly dataset of Tmean, Tmax, and Tmin for Xinxiang during 1951–2024 was developed. The dataset can support applications such as agricultural climate-risk assessment and planting-structure optimization in major grain-producing areas. The adjustment results indicate pronounced inhomogeneity in the original series. Station relocation is the leading cause (accounting for more than 50%), and Tmin is the most sensitive variable, with a mean adjustment magnitude of −0.56 °C.
- (2)
- After homogenization, trend estimates become more representative and spatially coherent. Warming rates of annual Tmean, Tmax, and Tmin increased from 0.278, 0.192, and 0.397 °C/decade to 0.370, 0.209, and 0.551 °C/decade, corresponding to increases of 33%, 9%, and 39%, respectively. Seasonally, spring shows the strongest warming (0.433 °C/decade), and monthly trends indicate the fastest warming in March (0.68 °C/decade).
- (3)
- The spatial distribution of temperature reflects joint influences of topography and urbanization. Homogenization reduces non-climatic noise and clarifies the underlying regional gradient. Adjustments are most pronounced for Tmin, which helps reduce the masking effect of urban heat-island influences and reveals a pattern of higher values in the central area and lower values in the east. After homogenization, warming trends are systematically enhanced, highlighting a stronger warming response in the rapidly urbanizing eastern region.
The difference in warming rates before and after homogenization was mainly caused by non-climatic factors, such as station relocation, which led the original series to systematically underestimate the long-term regional warming trend. This underscores the necessity of homogenization for accurately revealing regional climate change characteristics, while also providing a useful technical framework and practical reference for temperature homogenization and climate change assessment in similar small- and medium-sized cities. The findings of this study offer scientific support for the utilization of agro-climatic resources and meteorological disaster risk prevention in Xinxiang, and have important implications for agricultural planning, territorial spatial planning, water resource optimization, and adaptive urban development in the region.
Future work should focus on several aspects. First, by integrating high-resolution remote sensing data and urbanization indicators, methods such as urban–rural comparison and numerical simulation can be used to quantitatively distinguish the contributions of the urban heat island effect and background warming. Second, reanalysis data and machine learning techniques may help optimize the construction of reference series, particularly in regions with sparse station networks. Third, alternative adjustment methods, such as quantile matching and variance adjustment, should be tested to evaluate the effects of inhomogeneity on extreme climate indices. Fourth, metadata systems should be further improved to reduce the number of breakpoints with unknown causes. Finally, the methodology developed in this study could be extended to other small- and medium-sized cities across the North China Plain, providing broader support for climate adaptation strategies in major agricultural regions.
Author Contributions
Conceptualization, Q.L.; data curation, Y.C.; formal analysis, Y.C.; software, Y.C., Q.L. and B.J.; writing—original draft, Y.C.; writing—review and editing, Q.L. All authors have read and agreed to the published version of the manuscript.
Funding
This research received no external funding.
Institutional Review Board Statement
Not applicable.
Informed Consent Statement
Not applicable.
Data Availability Statement
The meteorological data used in this study were obtained from the Henan, China Meteorological Administration and are subject to third-party restrictions. Due to the terms of the data use agreement, the authors are not permitted to publicly share the raw data. Researchers who meet the criteria for access to confidential data may contact the author for further assistance.
Conflicts of Interest
The authors declare no conflicts of interest.
Abbreviations
The following abbreviations are used in this manuscript:
| PMF | Penalized Maximal F Test |
| PMT | Penalized Maximal t Test |
| MRBP | Multivariate Random Block Permutation |
| SNHT | Standard Normal Homogeneity Test |
References
- Winkler, J.A.; Skaggs, R.H.; Baker, D.G. Effect of temperature adjustments on the Minneapolis-St.Paul urban heat island. J. Appl. Meteorol. 1981, 20, 1295–1300. [Google Scholar] [CrossRef] [Scilit]
- Alexandersson, H. A homogeneity test applied to precipitation data. Int. J. Climatol. 2009, 6, 661–675. [Google Scholar] [CrossRef] [Scilit]
- O’Neil, P.; Connolly, R.; Connolly, M.; Soon, W.; Chimani, B.; Crok, M.; de Vos, R.; Harde, H.; Kajaba, P.; Nojarov, P.; et al. Evaluation of the Homogenization Adjustments Applied to European Temperature Records in the Global Historical Climatology Network Dataset. Atmosphere 2022, 13, 285. [Google Scholar] [CrossRef] [Scilit]
- Li, Q.X.; Liu, X.N.; Zhang, H.Z.; Tu, Q.P. Homogeneity study of in situ observations climate series. Meteor. Sci. Technol. 2003, 31, 3–10. (In Chinese) [Google Scholar] [CrossRef]
- Ju, X.H.; Tu, Q.P.; Li, Q.X. Homogeneity test and reduction of monthly total solar radiation over China. Trans. Atmos. Sci. 2006, 336–341. (In Chinese) [Google Scholar] [CrossRef]
- Li, Q.X.; Zhang, H.Z.; Liu, X.N.; Chen, J.I.; Li, W.; Jones, P. A mainland China homogenized historical temperature dataset of 1951–2004. Bull. Amer. Meteor. Soc. 2009, 90, 1062–1065. [Google Scholar] [CrossRef] [Scilit]
- Cao, L.J.; Ju, X.H.; Liu, X.N. Penalized Maximal F Test for the Homogeneity Studyof theAnnual Mean Wind Speed over China. Meteor. Mon. 2010, 36, 52–56. (In Chinese) [Google Scholar]
- Li, Q.X.; Peng, J.D.; Shen, Y. Development of China homogenized monthly precipitation dataset during 1900 to 2009. Acta Geo Sina 2012, 67, 301–311. (In Chinese) [Google Scholar] [CrossRef] [Scilit]
- Xu, W.H.; Li, Q.X.; Wang, X.L.; Yang, S.; Cao, L.; Feng, Y. Homogenization of Chinese daily surface air temperatures and analysis of trends in the extreme temperature indices. J. Geophys. Res. 2013, 118, 9708–9720. [Google Scholar] [CrossRef] [Scilit]
- He, Y.; Wang, K.; Yang, K.; Zhou, C.; Shao, C.; Yin, C. Homogenized daily sunshine duration over China from 1961 to 2022. Earth Syst. Sci. Data 2025, 17, 1595–1611. [Google Scholar] [CrossRef] [Scilit]
- Chen, J.; Hu, T.; Wang, J.; Yan, Z.; Li, Z. A method for homogenization of complex daily mean temperature data: Application at Beijing Observatory (1915–2021) and trend analysis. Int. J. Climatol. 2024, 44, 1955. [Google Scholar] [CrossRef] [Scilit]
- Zhang, Z.; Wang, K. Homogenization of observed surface wind speed based on geostrophic wind theory over China from 1970 to 2017. J. Clim. 2023, 36, 3667–3679. [Google Scholar] [CrossRef] [Scilit]
- Si, P.; Guo, J.; Zhao, Y.; Wang, J.; Cao, L.; Wang, M.; Wang, Q.; Feng, J. New series of daily maximum and minimum temperature observations for Beijing, China since 1841. Acta Meteorol. Sin. 2022, 80, 136–152. (In Chinese) [Google Scholar]
- Zhai, P.M. Some cross errors and biases in China’s historical radiosonde data. Acta Meteor. Sin. 1997, 55, 563–572. (In Chinese) [Google Scholar]
- Liu, X.N. The homogeneity test on mean annual wind speed over China. Quart. J. Appl. Meteor. 2000, 27–34. (In Chinese) [Google Scholar]
- Li, Q.; Zhang, H.; Liu, X.; Huang, J. Urban heat island effect on annual mean temperature during the last 50 years in China. Theor. Appl. Climatol. 2004, 79, 260–268. [Google Scholar] [CrossRef] [Scilit]
- Si, P.; Xu, W.H. Homogeneity of Tianjin daily surface air temperatures by software pack RHtestsV4 during 1951 to 2012. Clim. Environ. Res. 2015, 20, 663–674. (In Chinese) [Google Scholar]
- Zhang, Y.; Cao, L.J.; Zhu, Y.N. Homogeneity Correction and Long-Term Trend Analysis of Heilongjiang Temperature Data. Clim. Environ. Res. 2023, 28, 461–470. (In Chinese) [Google Scholar]
- Zhang, Q.Z.; Wang, G.A. Discussion on the application of historical meteorological data in Henan. Technol. Wind 2021, 5, 97–98. (In Chinese) [Google Scholar] [CrossRef]
- Zhang, Q.; Zhao, Y.F.; Fan, S.H. Development of hourly precipitation datasets for national meteorological stations in China. Torrential Rain Disasters 2016, 35, 182–186. (In Chinese) [Google Scholar] [CrossRef]
- Li, Q.X. Introduction to the Study of Climate Data Homogeneity; Meteorological Press: Beijing, China, 2011; pp. 22–53. (In Chinese) [Google Scholar]
- Peterson, T.C.; Karl, T.R.; Jamason, P.F.; Knight, R.; Easterling, D.R. First difference method: Maximizing station density for the calculation of long-term global temperature change. J. Geophys. Res. Atmos. 1998, 103, 25967–25974. [Google Scholar] [CrossRef] [Scilit]
- Mielke, P.W., Jr. Non-metric statistical analyses: Some metric alternatives. J. Stat. Plan. Inference 1986, 13, 377–387. [Google Scholar] [CrossRef] [Scilit]
- Menne, M.J.; Williams, C.N., Jr. Homogenization of temperature series via pairwise comparisons. J. Clim. 2009, 22, 1700–1717. [Google Scholar] [CrossRef] [Scilit]
- Wang, X.L.; Feng, Y. RHtestsV4 User Manual; Climate Research Division, Atmospheric Science and Technology Directorate, Science and Technology Branch, Environment Canada: Toronto, ON, Canada, 2013. [Google Scholar]
- Wang, X.L. Penalized maximal F test for detecting undocumented mean shift without trend change. J. Atmos. Ocean. Technol. 2008, 25, 368–384. [Google Scholar] [CrossRef] [Scilit]
- Wang, X.L. Accounting for autocorrelation in detecting mean shifts in climate data series using the penalized maximal t or F test. J. Appl. Meteorol. Climatol. 2008, 47, 2423–2444. [Google Scholar] [CrossRef] [Scilit]
- Sun, J.; Li, S.H.; Li, Q.X.; Wang, R.Y.; Zhang, T.Y.; Wang, Y. Preliminary analysis of homogeneity testing and correction of temperature data in Chongqing. J. Southwest China Norm. Univ. 2014, 39, 173–179. (In Chinese) [Google Scholar] [CrossRef]
- Song, C.H.; Sun, A.J. The research on adjusting homogeneity temperature series. Plateau Meteor. 1995, 2, 88–93. (In Chinese) [Google Scholar]
- Li, Q.X.; Menne, M.J.; Williams, C.N., Jr.; Sun, B. Detection of discontinuities in Chinese temperature series using a multiple test approach. Clim. Environ. Res. 2005, 5, 736–742. (In Chinese) [Google Scholar]
- Wu, X.Y.; Lin, Y.; Chen, W.J.; He, X.N. Analysis of the Spatial and Temporal Distribution Characteristics of Frost in Fujian and Its Circulation Background. Trans. Atmos. Sci. 2016, 39, 501–509. (In Chinese) [Google Scholar] [CrossRef]
- Sun, F.; Li, Y.; Chen, Y.; Fang, G.; Duan, W.; Li, B.; Li, Z.; Hao, X.; Yang, Y.; Zhang, X. The dominant warming season shifted from winter to spring in the arid region of Northwest China. npj Clim. Atmos. Sci. 2024, 7, 178. [Google Scholar] [CrossRef] [Scilit]
- Wang, W.C.; Wang, X.Q. Seasonal differences and attribution of climate warming in Shanxi Province. J. Meteor. Environ. 2025, 41, 9–17. (In Chinese) [Google Scholar]
- World Weather Attribution. Extraordinary March Heatwave in Central Asia up to 10 °C Hotter in a Warming Climate. PreventionWeb. 2025. Available online: https://www.preventionweb.net/news/extraordinary-march-heatwave-central-asia-10-degc-hotter-warming-climate (accessed on 6 April 2026).
- Yang, H.; Wang, X.F.; Zhang, S.L.; Li, X. Change characteristics of urban heat island effect and its response to urban expansion in Gansu Province. Remote Sens. Technol. Appl. 2025, 40, 110–121. (In Chinese) [Google Scholar]
- Qiao, Z.; Lu, Y.; He, T.; Wu, F.; Xu, X.; Liu, L.; Wang, F.; Sun, Z.; Han, D. Spatial expansion paths of urban heat islands in Chinese cities: Analysis from a dynamic topological perspective for the improvement of climate resilience. Resour. Conserv. Recycl. 2026, 188, 106680. [Google Scholar] [CrossRef] [Scilit]
- Si, P.; Li, Q.; Jones, P. Construction of homogenized daily surface air temperature for Tianjin city during 1887–2019. Earth Syst. Sci. Data 2021, 13, 2211–2226. [Google Scholar] [CrossRef] [Scilit]
- Zhan, L.; Dong, B.H.; Xu, B.; Li, Y.; Xin, J.J.; Wang, L.Y. Centennial Homogenized Monthly/Yearly Mean Temperature Dataset at Jiujiang Meteorological Station, Jiangxi Province of China (1924–2023). GCdataPR 2025, 9, 87–95+212–220. [Google Scholar] [CrossRef] [Scilit]
- Ji, X.; Ding, Y.; Li, F.; Zuo, X. Comparative analysis of the mean temperature trend before and after homogenization of the mean temperature data in He’nan province. J. Meteorol. Environ. 2021, 37, 43–52. (In Chinese) [Google Scholar]
- IPCC. Summary for Policymakers. In Climate Change 2023: Synthesis Report; Contribution of Working Groups I, II and III to the Sixth Assessment Report of the Intergovernmental Panel on Climate Change; Core Writing Team, Lee, H., Romero, J., Eds.; IPCC: Geneva, Switzerland, 2023; pp. 1–34. [Google Scholar]
- IPCC. Climate Change 2021—The Physical Science Basis: Working Group I Contribution to the Sixth Assessment Report of the Intergovernmental Panel on Climate Change; Cambridge University Press: Cambridge, UK, 2021. [Google Scholar]

Disclaimer/Publisher’s Note: The statements, opinions and data contained in all publications are solely those of the individual author(s) and contributor(s) and not of MDPI and/or the editor(s). MDPI and/or the editor(s) disclaim responsibility for any injury to people or property resulting from any ideas, methods, instructions or products referred to in the content. |
© 2026 by the authors. Licensee MDPI, Basel, Switzerland. This article is an open access article distributed under the terms and conditions of the Creative Commons Attribution (CC BY) license.