


Abstract
Nanoparticles (interchangeably called ultrafine particles) constitute one of the growing risks encountered in everyday life. Both short- and long-term exposure to them, as well as to particulate matter in general, may pose serious health risks. In this study, we focus on monitoring of particle concentration in urban air for 200 days, with special attention to nanoparticles. The overall data coverage exceeded 80%, reaching over 97% in three selected months. Measurements were carried out at 25.5 m height in southern Warsaw, in close vicinity to residential blocks with apartments also at the same level. Data were collected from January to first half of August 2025 using a Grimm MINI-WRAS portable wide-range aerosol spectrometer and a thermo-hygro-barometer. Over the 8-month period, significant variations between months and days in both nanoparticle and all particulate matter concentrations were observed. Winter months were almost four times more polluted with particles (both nanoparticles and those above 100 nm) than spring and summer periods. Although nanoparticle concentration in colder months was higher, the percentage of nanoparticles was lower. An important aspect of these investigations was comparing the obtained results with publicly available air pollution data from urban air quality monitoring stations, which represent ground-level measurements. At rooftop altitude, PM2.5/PM10 ratios were significantly higher than those measured at ground level.
1. Introduction
The issue of air pollution and its impact on health have been the subject of research for several decades, both worldwide and in Poland. It is well known that both short-term and long-term exposure to ambient particulate matter are associated with increased mortality and morbidity [1]. The situation is no different in Warsaw, Poland, where exposure to PM2.5 and PM10 fractions contributes to more frequent hospitalisations and an increased risk of premature death [2]. In recent years, growing attention has been paid to ultrafine particles (nanoparticles). For example, the WHO guidelines issued in 2021 [3] include good practice statements recommending the integration of ultrafine particle monitoring into routine air quality assessments. At the same time, the European Union is adopting Directive (EU) 2024/2881 [4], under which monitoring of ultrafine particles becomes mandatory at designated supersites and in areas with high exposure potential.
These small particles have the ability to penetrate deep into the lungs and translocate beyond them [5]. Inhalation of nanoparticles can lead to oxidative stress, pulmonary inflammation and cardiovascular events [6]. They are able to settle in organs, cross cell membrane barriers, and enter the bloodstream [7]. Moreover, they can cause DNA methylation, increasing the risk of cancer and altering cell replication [8]. In Montreal and Toronto, ultrafine particles lead to approximately 1100 nonaccidental deaths every year [9]. Nanoparticle air pollution in major cities originates from various sources, such as wear and tear of tyres and combustion engines [10]. In one study [11], the authors found that 29% of all ultrafine particles at roadside originate from vehicle emissions. Each of these sources poses a distinct health risk. Nanoparticles carrying polycyclic aromatic hydrocarbons (PAHs) are particularly hazardous, which are generated during the operation of diesel engines with defective catalysts [12]. These particles consist of a soot/ash core, which easily attracts volatile chemical compounds [13]. The associated health hazards are more prominent during the daytime, as reported in [14]. Another important source of nanoparticles in ambient air is condensation of semi-volatile vapours and sulphuric acid nucleation [15].
Until recently, the scientific literature on air pollution in Poland has been dominated by studies focusing on PM2.5 and PM10 fractions. In recent years, however, an increasing number of studies have begun to address the PM1 fraction, including those involving long-term monitoring. The results of such long-term monitoring in Warsaw are described in [16]. To determine particulate matter concentrations, the authors used a PALAS Fidas 200 spectrometer, which enabled the analysis of particles in the size range from 0.100 µm to 27.384 µm. Another example is the study described in [17], in which the authors focused on the PM1 fraction in Warsaw. PM1 mass was measured using the gravimetric method, enabling a detailed analysis of the chemical composition of the collected particles. To date, no publication presenting monitoring data for particles below 100 nm in Warsaw Poland’s largest urban agglomeration is available. Although ultrafine particles (diameter < 100 nm) and PNC (particle number concentrations) are recognised as a critical component of urban air pollution with significant adverse health effects, long-term high-resolution measurements of ambient nanoparticle levels remain extremely scarce in Poland. The longest published study lasted nominally 9 months in Zabrze [18]; however, the actual percentage of valid measurement time (data coverage) was not reported in the paper. The authors used a Electrical Low-Pressure Impactor (ELPI) (ELPI, Dekati Ltd., Kangasala, Finland) to measure particles below 100 nm. Other Polish research, such as [19], consisted of shorter campaigns focused mainly on the chemical composition of quasi-ultrafine particles.
The official monitoring network operated by the Chief Inspectorate of Environmental Protection (GIOŚ) measures only mass concentrations of PM2.5 and PM10 using reference methods and does not provide any data on particle number or ultrafine particles.
It should be added that majority of the studies on particulate matter pollution are performed at ground level. Nevertheless, some researchers have tried to quantify the influence of height on measured particle concentration. The impact of height is stronger for large particle fractions, such as PM10 and PM2.5, than for finer fractions like PM1 [20]. However, contrary to simple assumptions that particulate matter pollution should be found in greater concentrations closer to the ground, no consistent trend was observed. Additionally, the authors demonstrated the significance of hazy conditions: the impact of height decreased drastically, ranging 2.9–22.0%, while in non-hazy conditions, the effect was much stronger, reaching up to 52.6%. In another study [21], the authors simultaneously examined the impact of measurement height and surrounding environment type, obtaining similarly inconclusive results. Nevertheless, in a forest park, a clear tendency was found the lower the altitude and the lower the particle concentration (measured between 1.5 m and 100 m above ground).
However, in the high-rise building area, the tendency was less pronounced, and particle concentration varied significantly depending on the season. In another study [22], the authors managed to measure particle concentrations up to 290 m. In almost all cases, the higher the altitude, the higher the particle concentration. Overall concentration profiles around buildings depend heavily on complex flow patterns forming around them [23]. PM pollution differs greatly from PN (particle number) and chemical pollution in the instance of propagation, showing only insignificant dependence on gravitational force.
In Poland, research on particulate matter concentrations at different heights is also conducted. However, the literature in this field remains rather limited. Additionally, the issue of changes in the ratios of different PM fractions with varying height is still poorly recognised and insufficiently studied. In the study by [24], which examined air quality in a complex urban terrain (Kraków), data analysis revealed that the poorest aero-sanitary conditions prevailed up to approximately 60 m above ground level (a.g.l.), where PM10 concentrations reached their highest values. Above this altitude, pollutant levels decreased markedly. The lowest PM10 concentrations were observed in the zone between 100 and 120 m a.g.l.
A similar conclusion—that pollutant concentrations decrease with height—is reported in a study [25]. The measurements were performed at the Palace of Culture and Science in Warsaw, at five heights ranging from 3 m to 166 m above ground level. Using PM10 concentrations measured by low-cost SPS30 sensors, the aerosol average scattering coefficient (ASC) (SPS30, Sensirion AG, Stäfa, Switzerland) was calculated. The observed decline in ASC with increasing altitude corresponds directly to a reduction in airborne particulate pollution.
A comprehensive study conducted at roof level (on the roof of a building) was carried out in Kraków [26]. The research focused on the analysis of the PM1 fraction, both in terms of the mass concentration of particles and their chemical composition. The study did not include larger particles, nor did it separately analyze the nano-fraction.
Given the gaps in the existing scientific literature described above—specifically, the unavailability of data concerning nanoparticle air pollution and the limited information on the effect of height on different particulate matter fractions, with particular consideration of the heights at which residential buildings and apartments are situated—the present study was undertaken to broaden the current understanding of air quality in Warsaw. In order to determine the seasonality of changes in pollutant concentrations, including nanoparticles, the measurements were performed over a 200-day period. The study employed the Wide-Range Aerosol Spectrometer (MINI-WRAS Model 1371, Grimm, Friedersdorf, Germany), which allows for the detection of particles ranging from 10 nm to 35 µm. This exceptionally broad particle size range renders the present study unique among similar investigations. This instrument enabled detailed real-time characterisation of particles and allowed derivation of PM2.5 and PM10 mass concentrations from particle number data.
The overall data coverage exceeded 80%, reaching over 97% in three selected months. Such a high data recovery rate is rarely reported in long-term urban aerosol studies performed in Poland and, therefore, constitutes an additional unique feature of the present study. The rooftop results were systematically compared with concurrent PM2.5 and PM10 mass concentrations from the three nearest GIOŚ reference stations. Due to fundamental methodological differences, the comparison focuses on trends and PM2.5/PM10. The elevated measurement height (25.5 m above ground) is particularly relevant in this densely built-up area, where high-rise residential buildings (up to 11 storeys, over 30 m height) are located in the immediate vicinity, making the rooftop level representative of the actual breathing zone of residents living on upper floors.
2. Materials and Methods
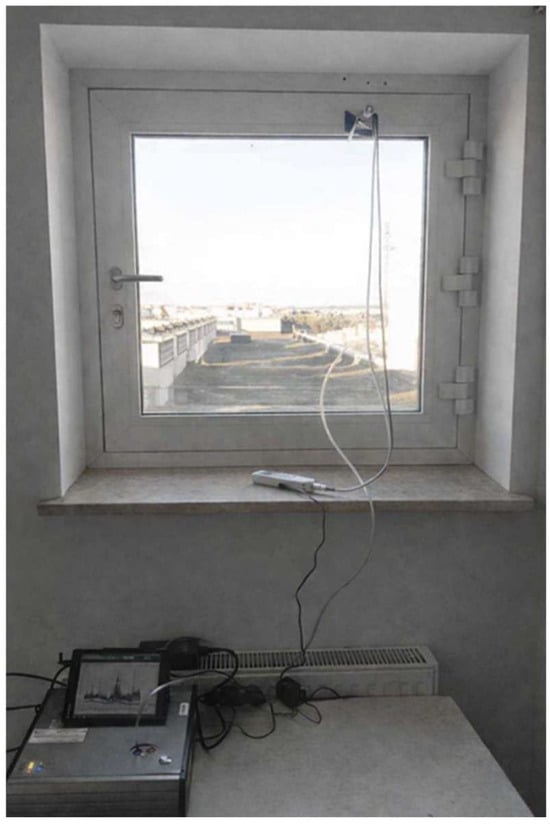
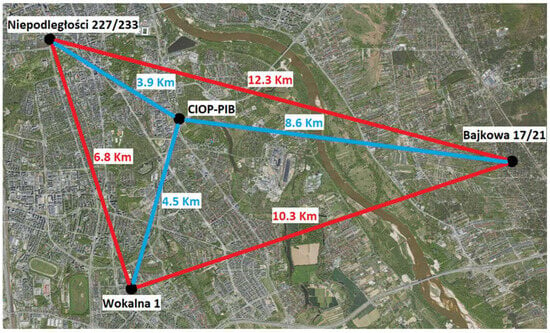
During the experiment, particle concentration and meteorological parameters were measured. The study was conducted in the main building of the Central Institute for Labour Protection—National Research Institute (CIOP-PIB) located at Czerniakowska 16, Warsaw, Poland. The particle counter, thermo-hygro-barometer and aerosol sampler were located on the 7th floor on the west side, which is the highest point (52.2001, 21.0523) in an approximately 70 m circle. The elevation from the ground level is 25.5 m while simultaneously being 112 m above sea level (not including elevation from the ground). Continuous measurement was available thanks to a carefully made opening through the window frame, allowing the probes to be placed outdoors while the main part of the devices stayed indoors (Figure 1). The measurement point is near 2 high-capacity roads which are not included in the clean transport zone. Nearby are residential buildings ranging from low-rise (3–4 storeys) to high-rise (up to 11 storeys). The location of the study was chosen for several reasons. Being close to a fairly typical area of developing cities, such as high-rise residential buildings near high-capacity roads, is one of the reasons. Another reason is that the measurement point is in the blind spot of the government air quality monitoring stations’ coverage which will be shown in greater detail in Figure 2 and Table 1. In the near future, a larger population will probably be exposed to this type of atmospheric pollution due to the completion of the construction of a medium-rise residential building on Polski Walczącej Avenue. Additionally, neighbouring family allotment gardens may be sold to a developer company, which was observed by the authors through the poster campaign placed on the fences. The final reason for conducting the experiment from the building of CIOP-PIB is for convenience. Having secure locations and the ability to quickly check and maintain equipment were of great help.
Figure 1.
View of rooftop measurement site at CIOP-PIB.
Figure 2.
Information on air quality monitoring stations. Layout of air quality monitoring stations and measuring points in Warsaw (Poland).
Table 1.
Characteristics of the three nearest GIOŚ air quality monitoring stations used for comparison.
Particle number concentrations and size distributions were measured in real time using the MINI-WRAS (Wide-Range Aerosol Spectrometer) (MINI-WRAS Model 1371, Grimm, Friedersdorf, Germany). The measurement enables continuous quantification of particle concentrations and size distributions of the airborne particulates. The MINI-WRAS combines an OPC (optical particle counter) for large particles and an EMA (electrical mobility analyser), also called Nanosizer by the manufacturer, for particles up to 193 nm, providing a wide detection range of 10–35,000 nm. Ambient air is continuously drawn through a silica gel dehumidifier supplied to both detectors. Results are saved every minute (temporal resolution of 1 min), while the device works every day, every hour. Any breaks were for device maintenance and conservation. The manufacturer declares ±40% measurement uncertainty for the Nanosizer part of the device (number concentration and geometric mean diameter), and for OPC counting efficiency, it was 98.2% for 0.3 μm, 99.5% for 0.5 μm, 91.8% for 1.0 μm, and 91.0% for 5 μm, meeting the requirements for ISO 21501-1. Calibration of the device was performed at the manufacturer’s facility in April 2024 (prior to the measurement campaign) and after the measurement cycle in January 2026. Calibration is based on a reference system with a centrepiece consisting of a Grimm SMPS+C model 5416 calibrated with NIST-certified PSL particles, verified every year. The standard calibration method refers to the PTB Braunschweig method, which uses polydisperse dolomite particles. According to the data from the first certificate, the highest deviations from the reference unit was 0.98%. After the test calibration, the largest difference was −1.8%, while the average deviation was 0.29%. During the starting procedure, MINI-WRAS self-checks for malfunctions. Silica gel in the dehumidifier was being replaced as needed, typically during the weekly routine data backup on Mondays at about 8:00 (UTC+2:00); to ensure the proper state of the device, it was checked twice a day, usually at 8:00 and 15:00 (UTC+2:00), with an exception of Saturdays and Sundays. There were no issues with insufficient battery charge due to the device being constantly plugged into the electrical network (except for maintenance and conservation). Possible bias related to the dehumidifier is the case of insufficient drying, where condensation may happen on particles, increasing their optical diameter. Another problem which may appear with high humidity in the device is the disruption of the electrical measurement in the Nanosizer.
For the purpose of creating this work, nanoparticle concentration was defined as the sum of concentrations from the first seven channels. Channel ranges were 10–14, 14–19, 19–27, 27–37, 37–52, 52–72 and 72–100 nm. In case of missing data, there were no actions taken to approximate lost data due to discrepancies in these types of measurements. Additionally, the MINI-WRAS results enabled the measurement of PM2.5 and PM10 particle concentrations. When calculating PM2.5 and PM10 values, the default particle density value of 1.68 g/cm3 in the MINI-WRAS was applied. Datasets were stored on the external drive by uploading them every week. PM2.5 and PM10 concentrations obtained with the MINI-WRAS at the CIOP-PIB rooftop site were compared with the results from the three nearest GIOŚ (Chief Inspectorate of Environmental Protection) air quality monitoring stations. The PM2.5 and PM10 data for the GIOŚ stations were retrieved from the publicly available database [27].
In the present article, the density of atmospheric particulate matter in Warsaw was not determined. The available literature lacks data specific to Warsaw. Particle density depends primarily on the chemical composition of the dust and is influenced by both natural and anthropogenic conditions. Among the studies justifying the choice of 1.68 g/cm3 (proposed as the default density by the manufacturer of the MINI-WRAS counter) is the study [28] conducted in Germany, where the mean density determined for urban aerosol was 1.6 (±0.5) g/cm3. It is worth noting the large diurnal variability in the cited study, ranging 1.0–2.5 g/cm3. Another example is the study [29], in which the mean particle density in China ranged 1.67–1.76 g/cm3. Other research carried out in the Czech Republic [30] indicated seasonal changes in density. In one of the analysed methods of density determination, values of 1.4–1.6 g/cm3 were obtained for the summer season and 1.3–1.75 g/cm3 for the winter season.
The distance between the stations was 6.8–12.3 km, while the distance to the measurement point was 3.9–8.6 km. The layout is shown in Figure 2. Black colour indicates the names of all measurement points, red represents the distance between stations, and blue shows the distance between the measurement site of this study and the air quality monitoring stations. Two of these stations (Bajkowa and Wokalna) are classified as UB (urban background) while the Niepodległości station is UT (urban traffic) station. Other information about these stations is shown in Table 1. From this point, stations will be referred to by their assigned symbol.
According to Polish regulations, air sampling at air quality monitoring stations is typically performed at a height ranging from 1.5 m (breathing zone) to 4 m above ground level, which is a 21.5–24 m difference compared to measurement point at CIOP-PIB.
Ambient meteorological parameters were monitored with a thermo-hygro-barometer (LB-580, LAB-EL Elektronika Laboratoryjna sp. z o.o., Reguły, Poland) with a probe (LB-584, LAB-EL Elektronika Laboratoryjna sp. z o.o., Reguły, Poland). It was chosen due to its wide range of allowed working conditions, large amount of data storage capacity and backup power supply in case of a power outage. Working conditions for air temperatures are in the range of −40–85 °C, humidity ranges between 10 and 95% for air temperature up to 60 °C and allowed air pressure in the range of 500–1100 hPa.
3. Results
3.1. Data Coverage
Measurements were conducted from January to the first half of August 2025. The study was carried out for 200 days. Table 2 presents data coverage for this period. The average temporal data coverage was over 80%, which is deemed sufficient for reliable conclusions. Among the most intensively measured months are March, May and July, all of them with coverage higher than 97%. However, it is important to note that in June and August, the measurement coverage was below 60%. Lower values are a result of a one-week break in June and termination of the measurement campaign on 11 August.
Table 2.
Data coverage of measurement.
3.2. Particle Concentration Daily Averages
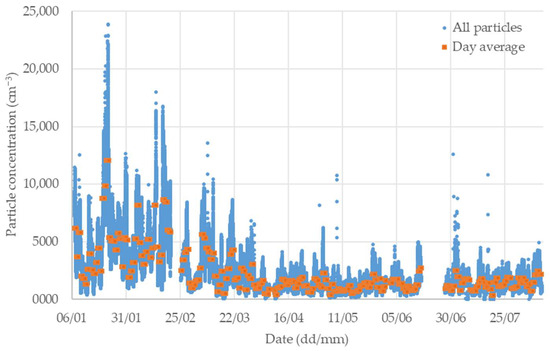
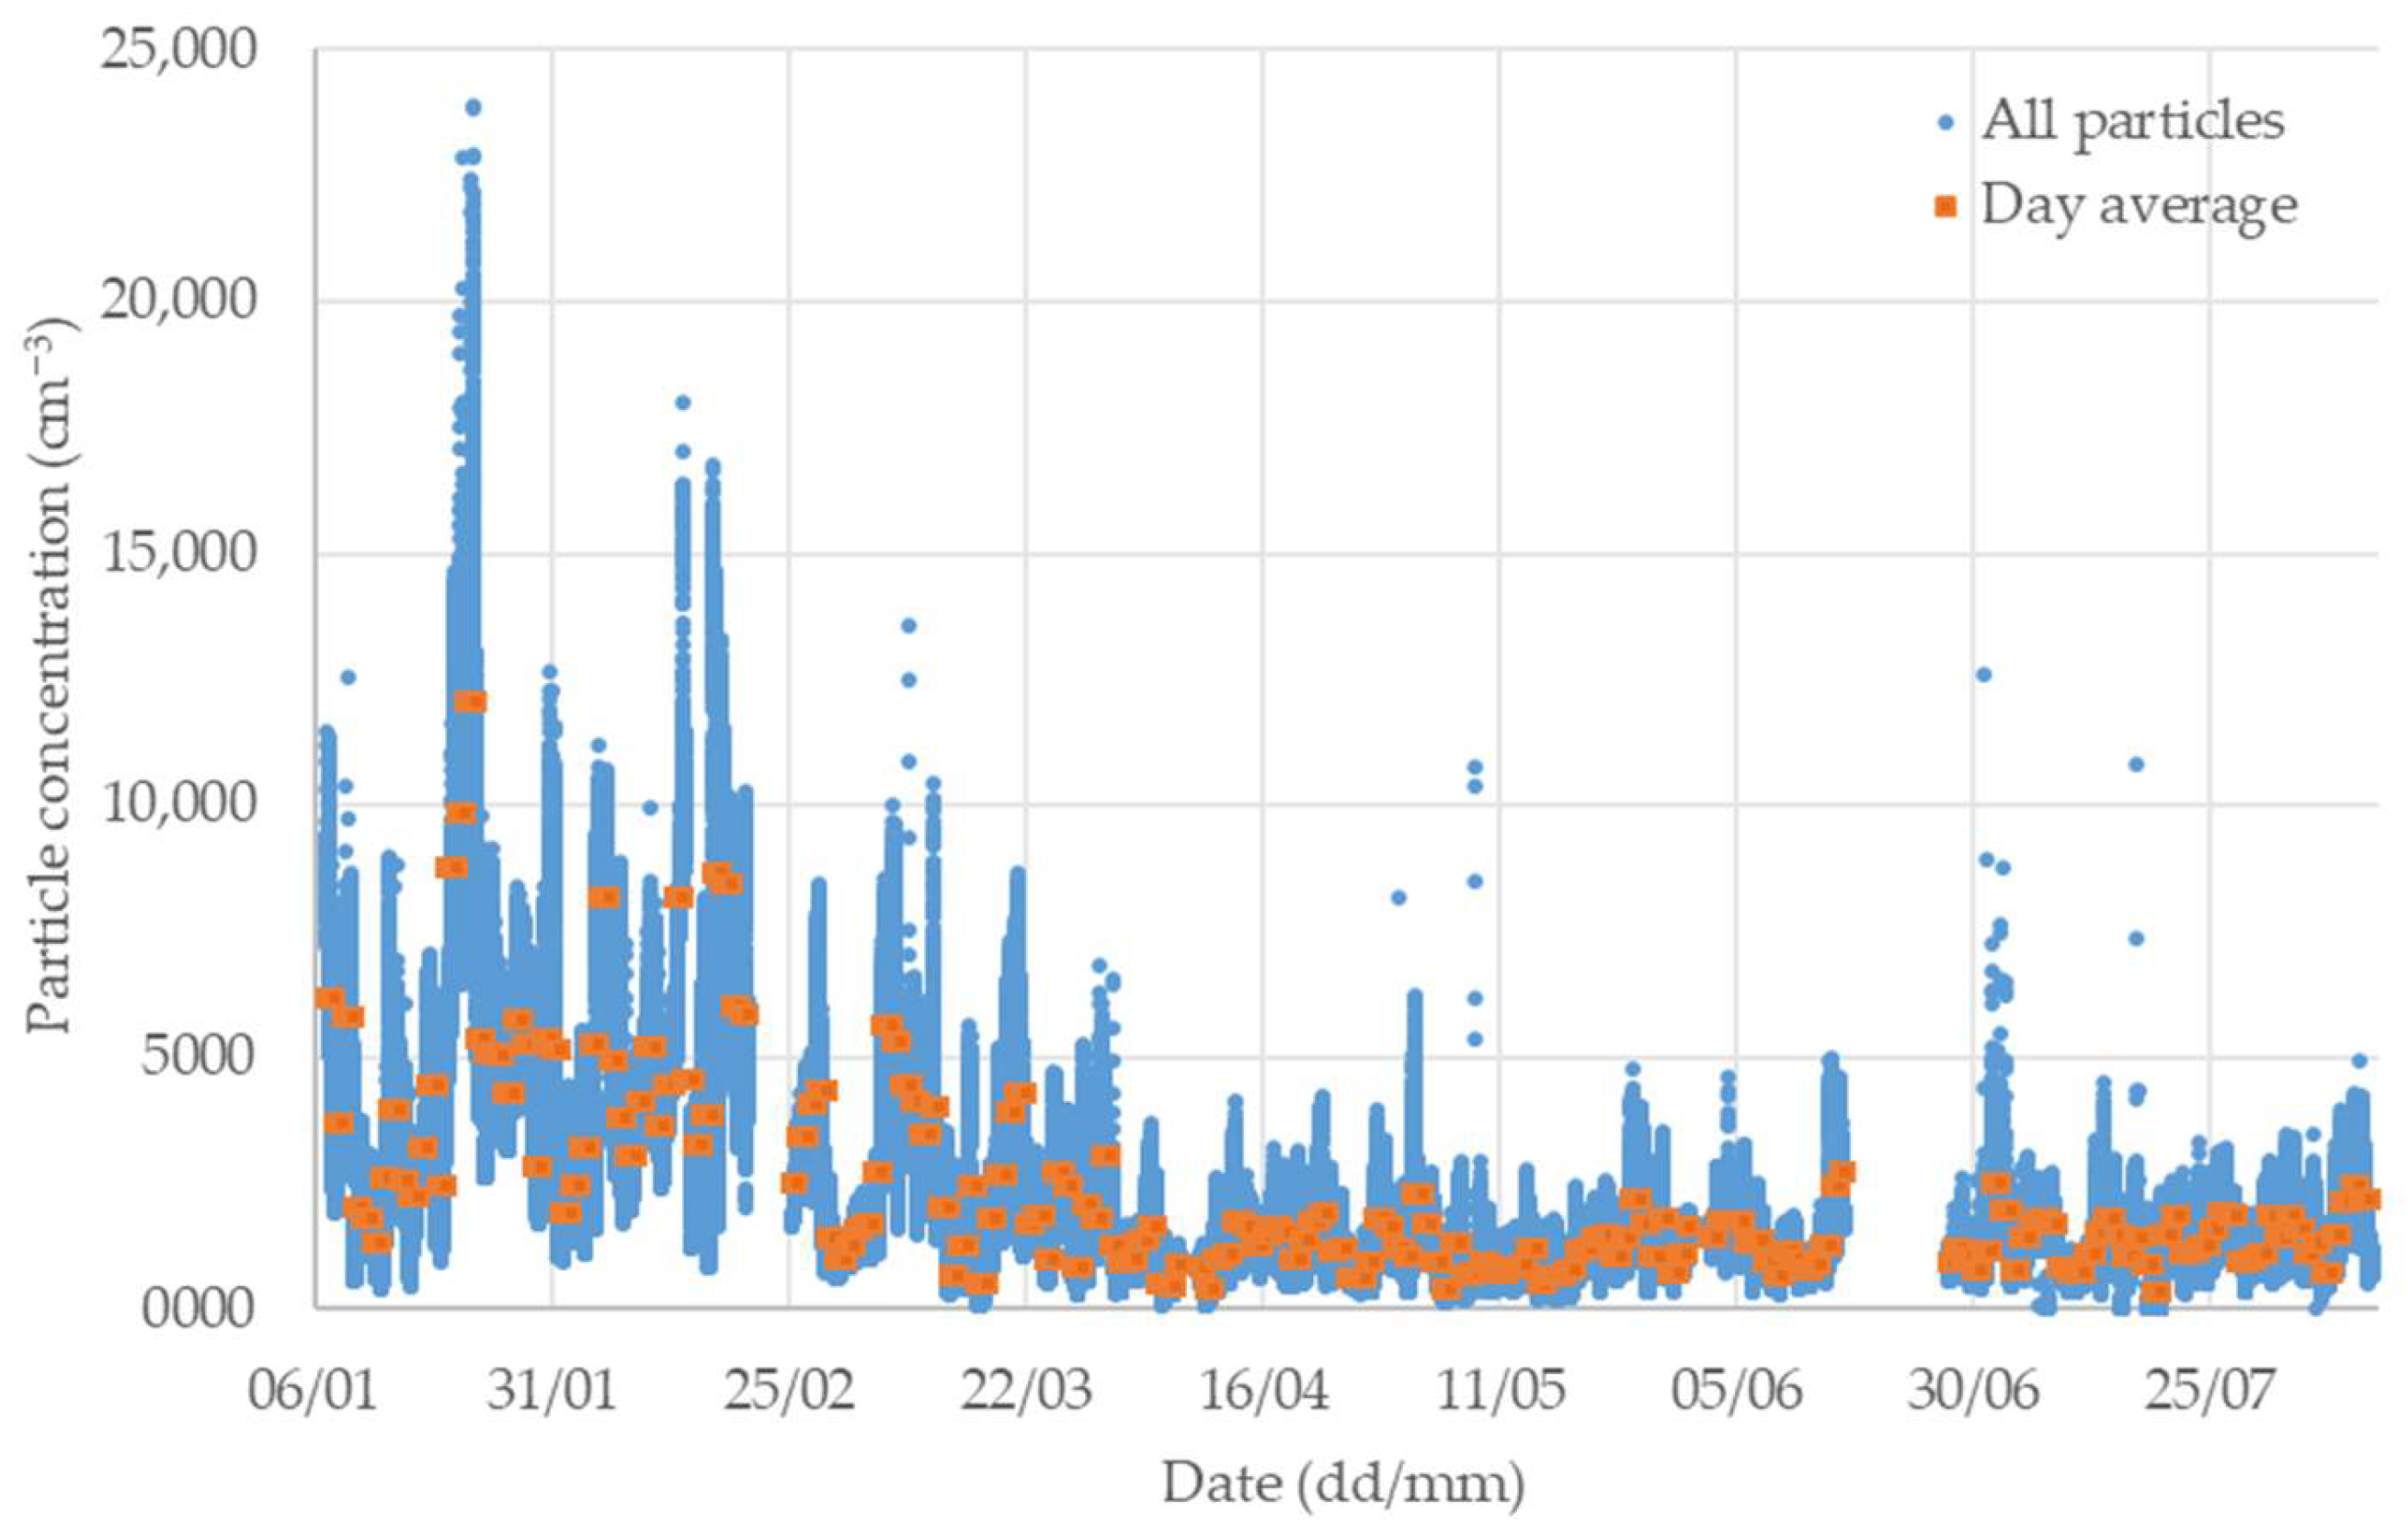
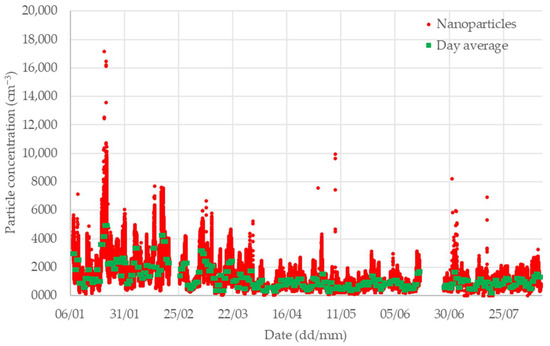
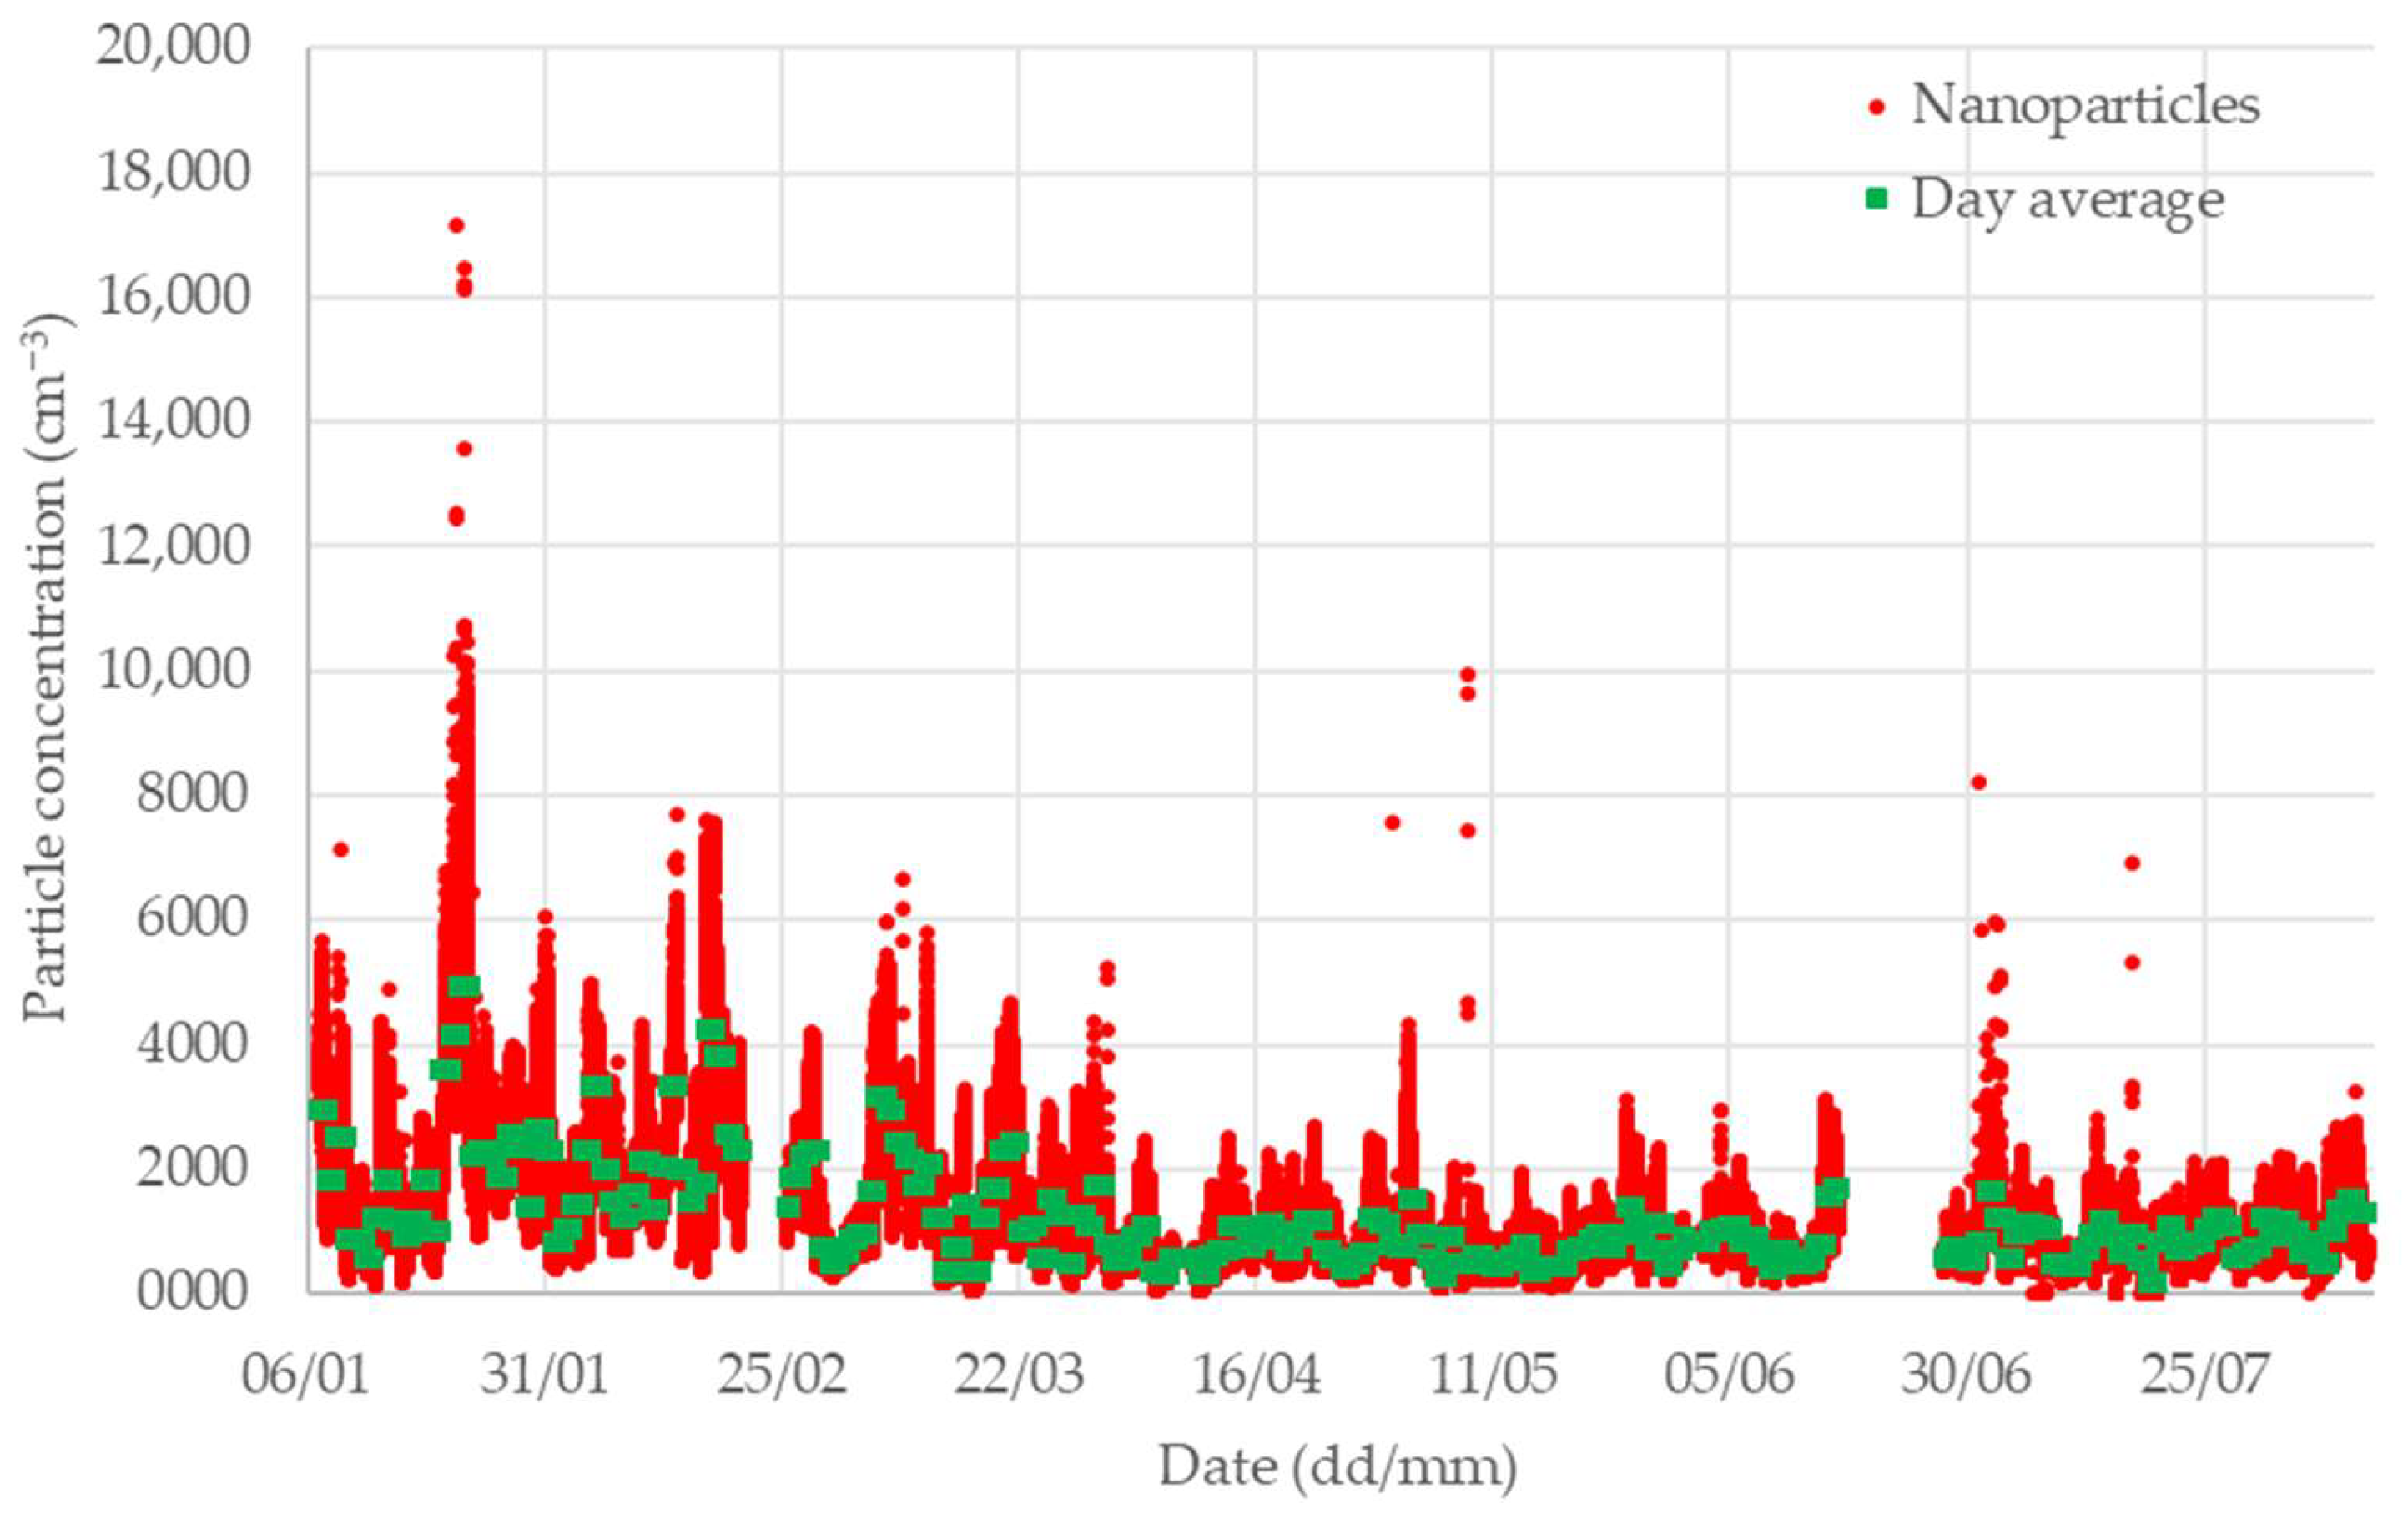
In Figure 3 and Figure 4, data is presented for all measured time periods, covering all analysed particle fractions, including nanoparticles (diameter < 100 nm). The charts clearly show that daily average concentrations varied significantly during the winter months, whereas the later periods exhibited much greater stability.
Figure 3.
Particle concentration from January to first half of August 2025.
Figure 4.
Nanoparticle concentration from January to first half of August 2025.
3.3. Particle Concentration Monthly Averages
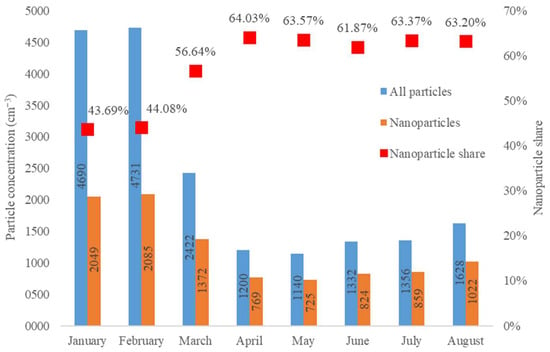
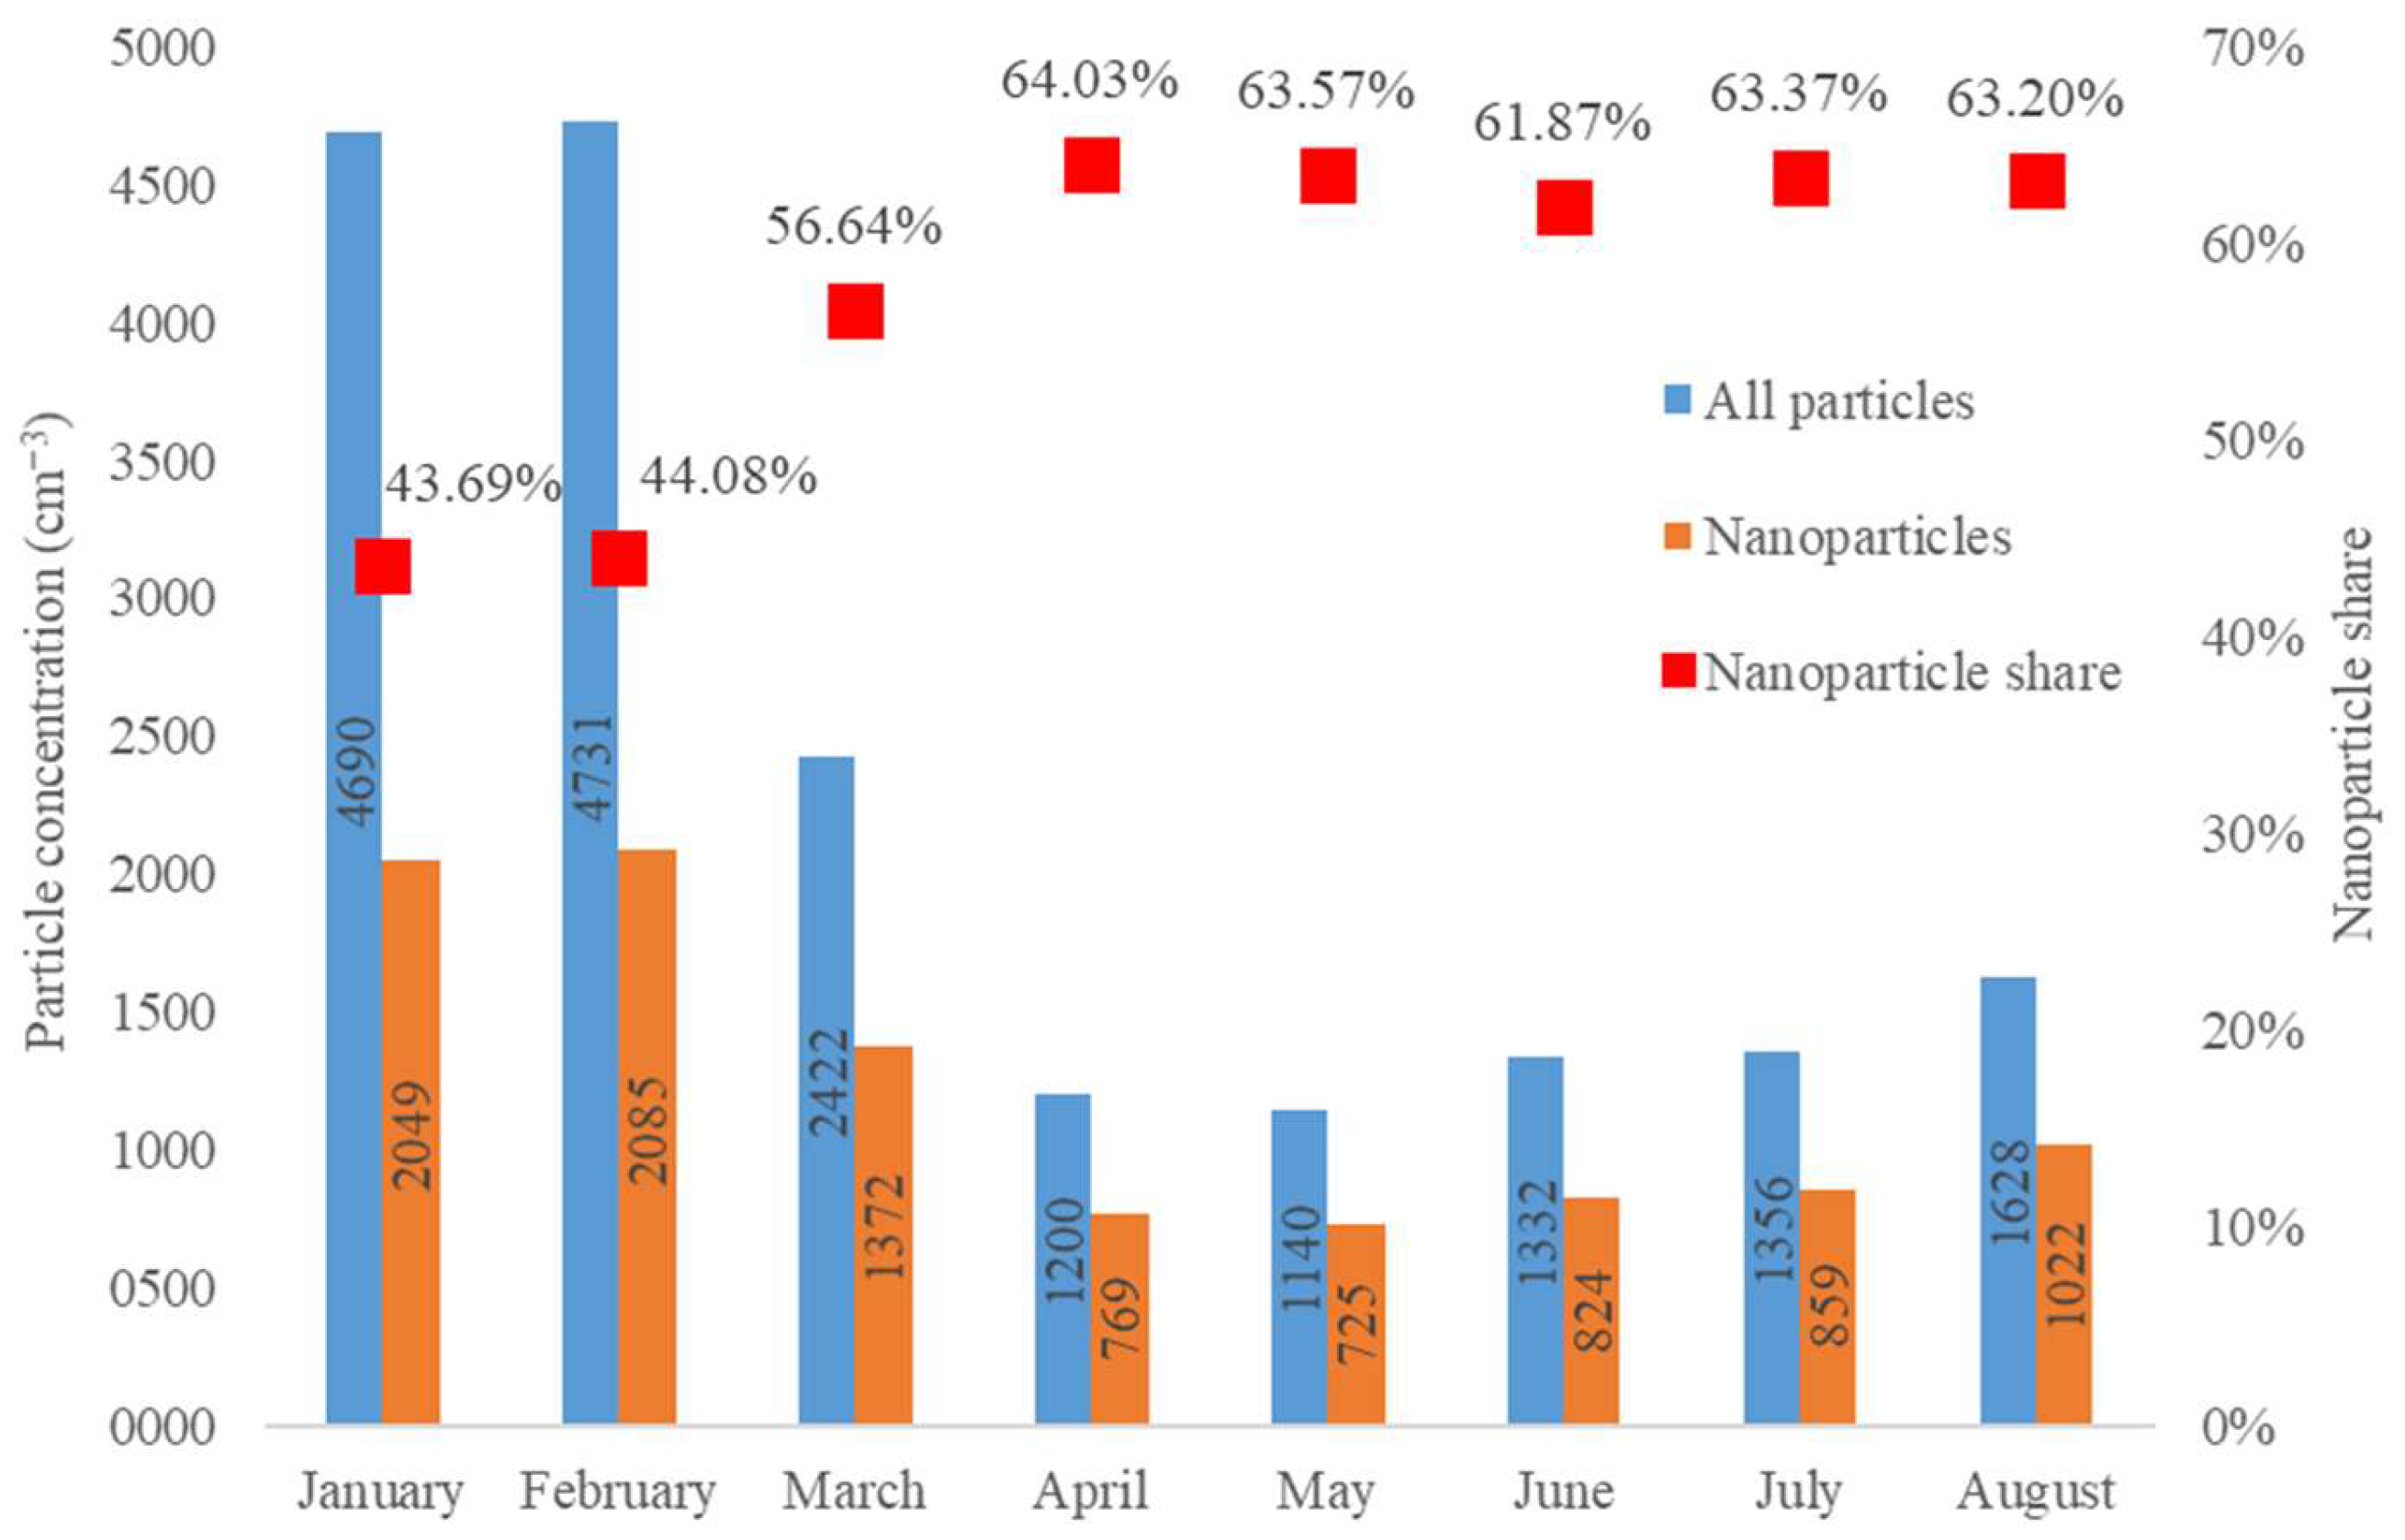
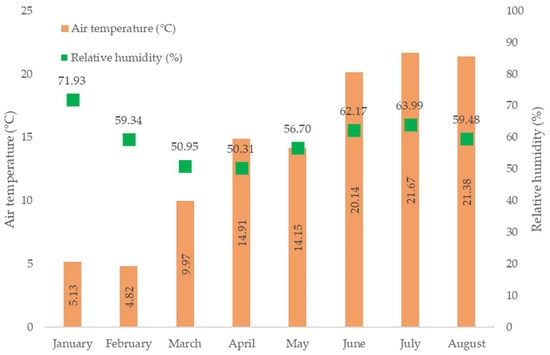
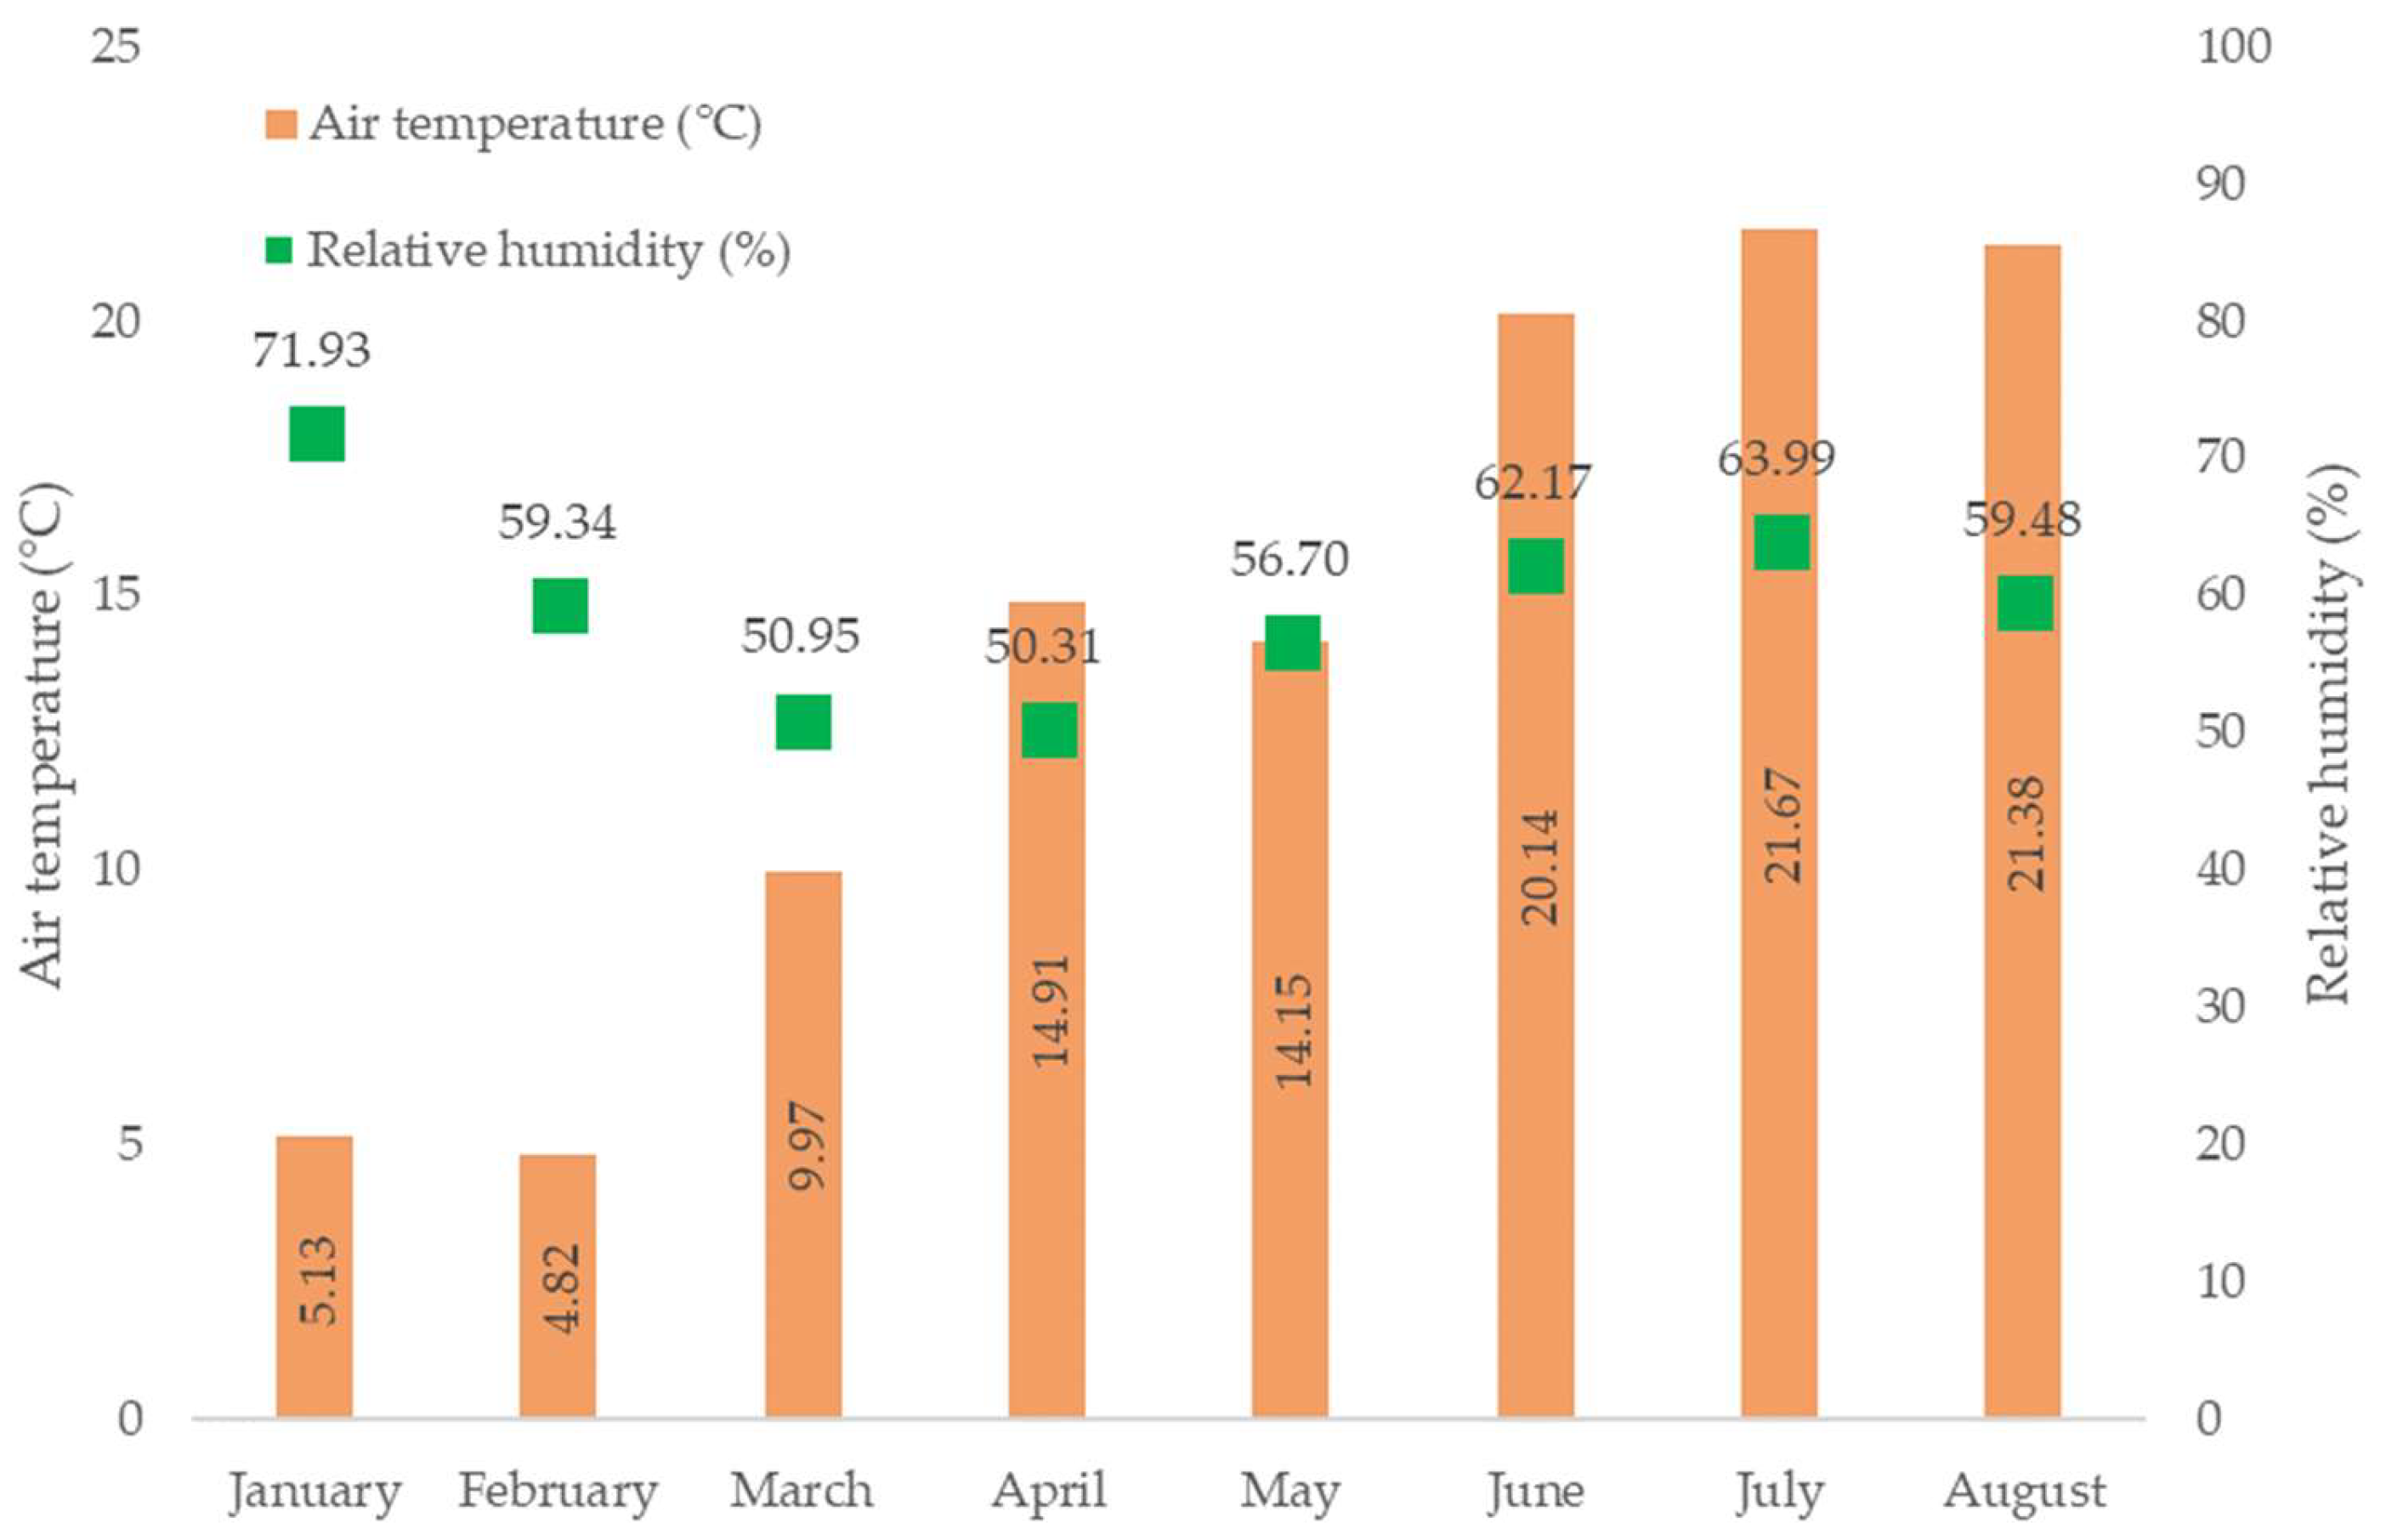
Figure 5 presents monthly mean values. Blue columns represent the average particle concentration for all measured particles, while orange columns show the corresponding values for nanoparticles only. Red squares depict the percentage share of nanoparticles relative to all measured particles. The highest overall concentration was recorded during winter months. In the transitional month of March, a 49% decrease was observed compared to the winter average. During spring and early summer, particle concentration was only about one-quarter of the winter levels. Additionally, the percentage share of nanoparticles was significantly lower in winter than in the subsequent periods. Figure 6 presents monthly averages of air temperature and its relative humidity. Comparing both charts, it can be seen that particle concentration is inversely proportional to temperature: while air temperature rises steadily from winter (~5 °C) to summer (~22 °C), particle concentration decreases. Relative humidity was highest in January (~72%) and decreases toward spring, then stabilises in summer (~59–64%).
Figure 5.
Monthly averages of particle concentration from January to first half of August 2025.
Figure 6.
Monthly climate parameters from January to first half of August 2025.
3.4. Comparison of PM2.5 and PM10 with Reference Air Quality Monitoring Stations
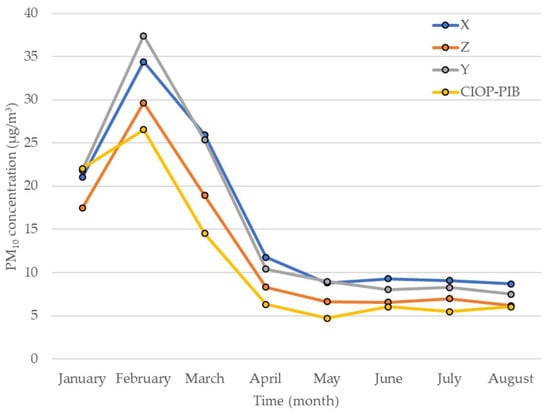
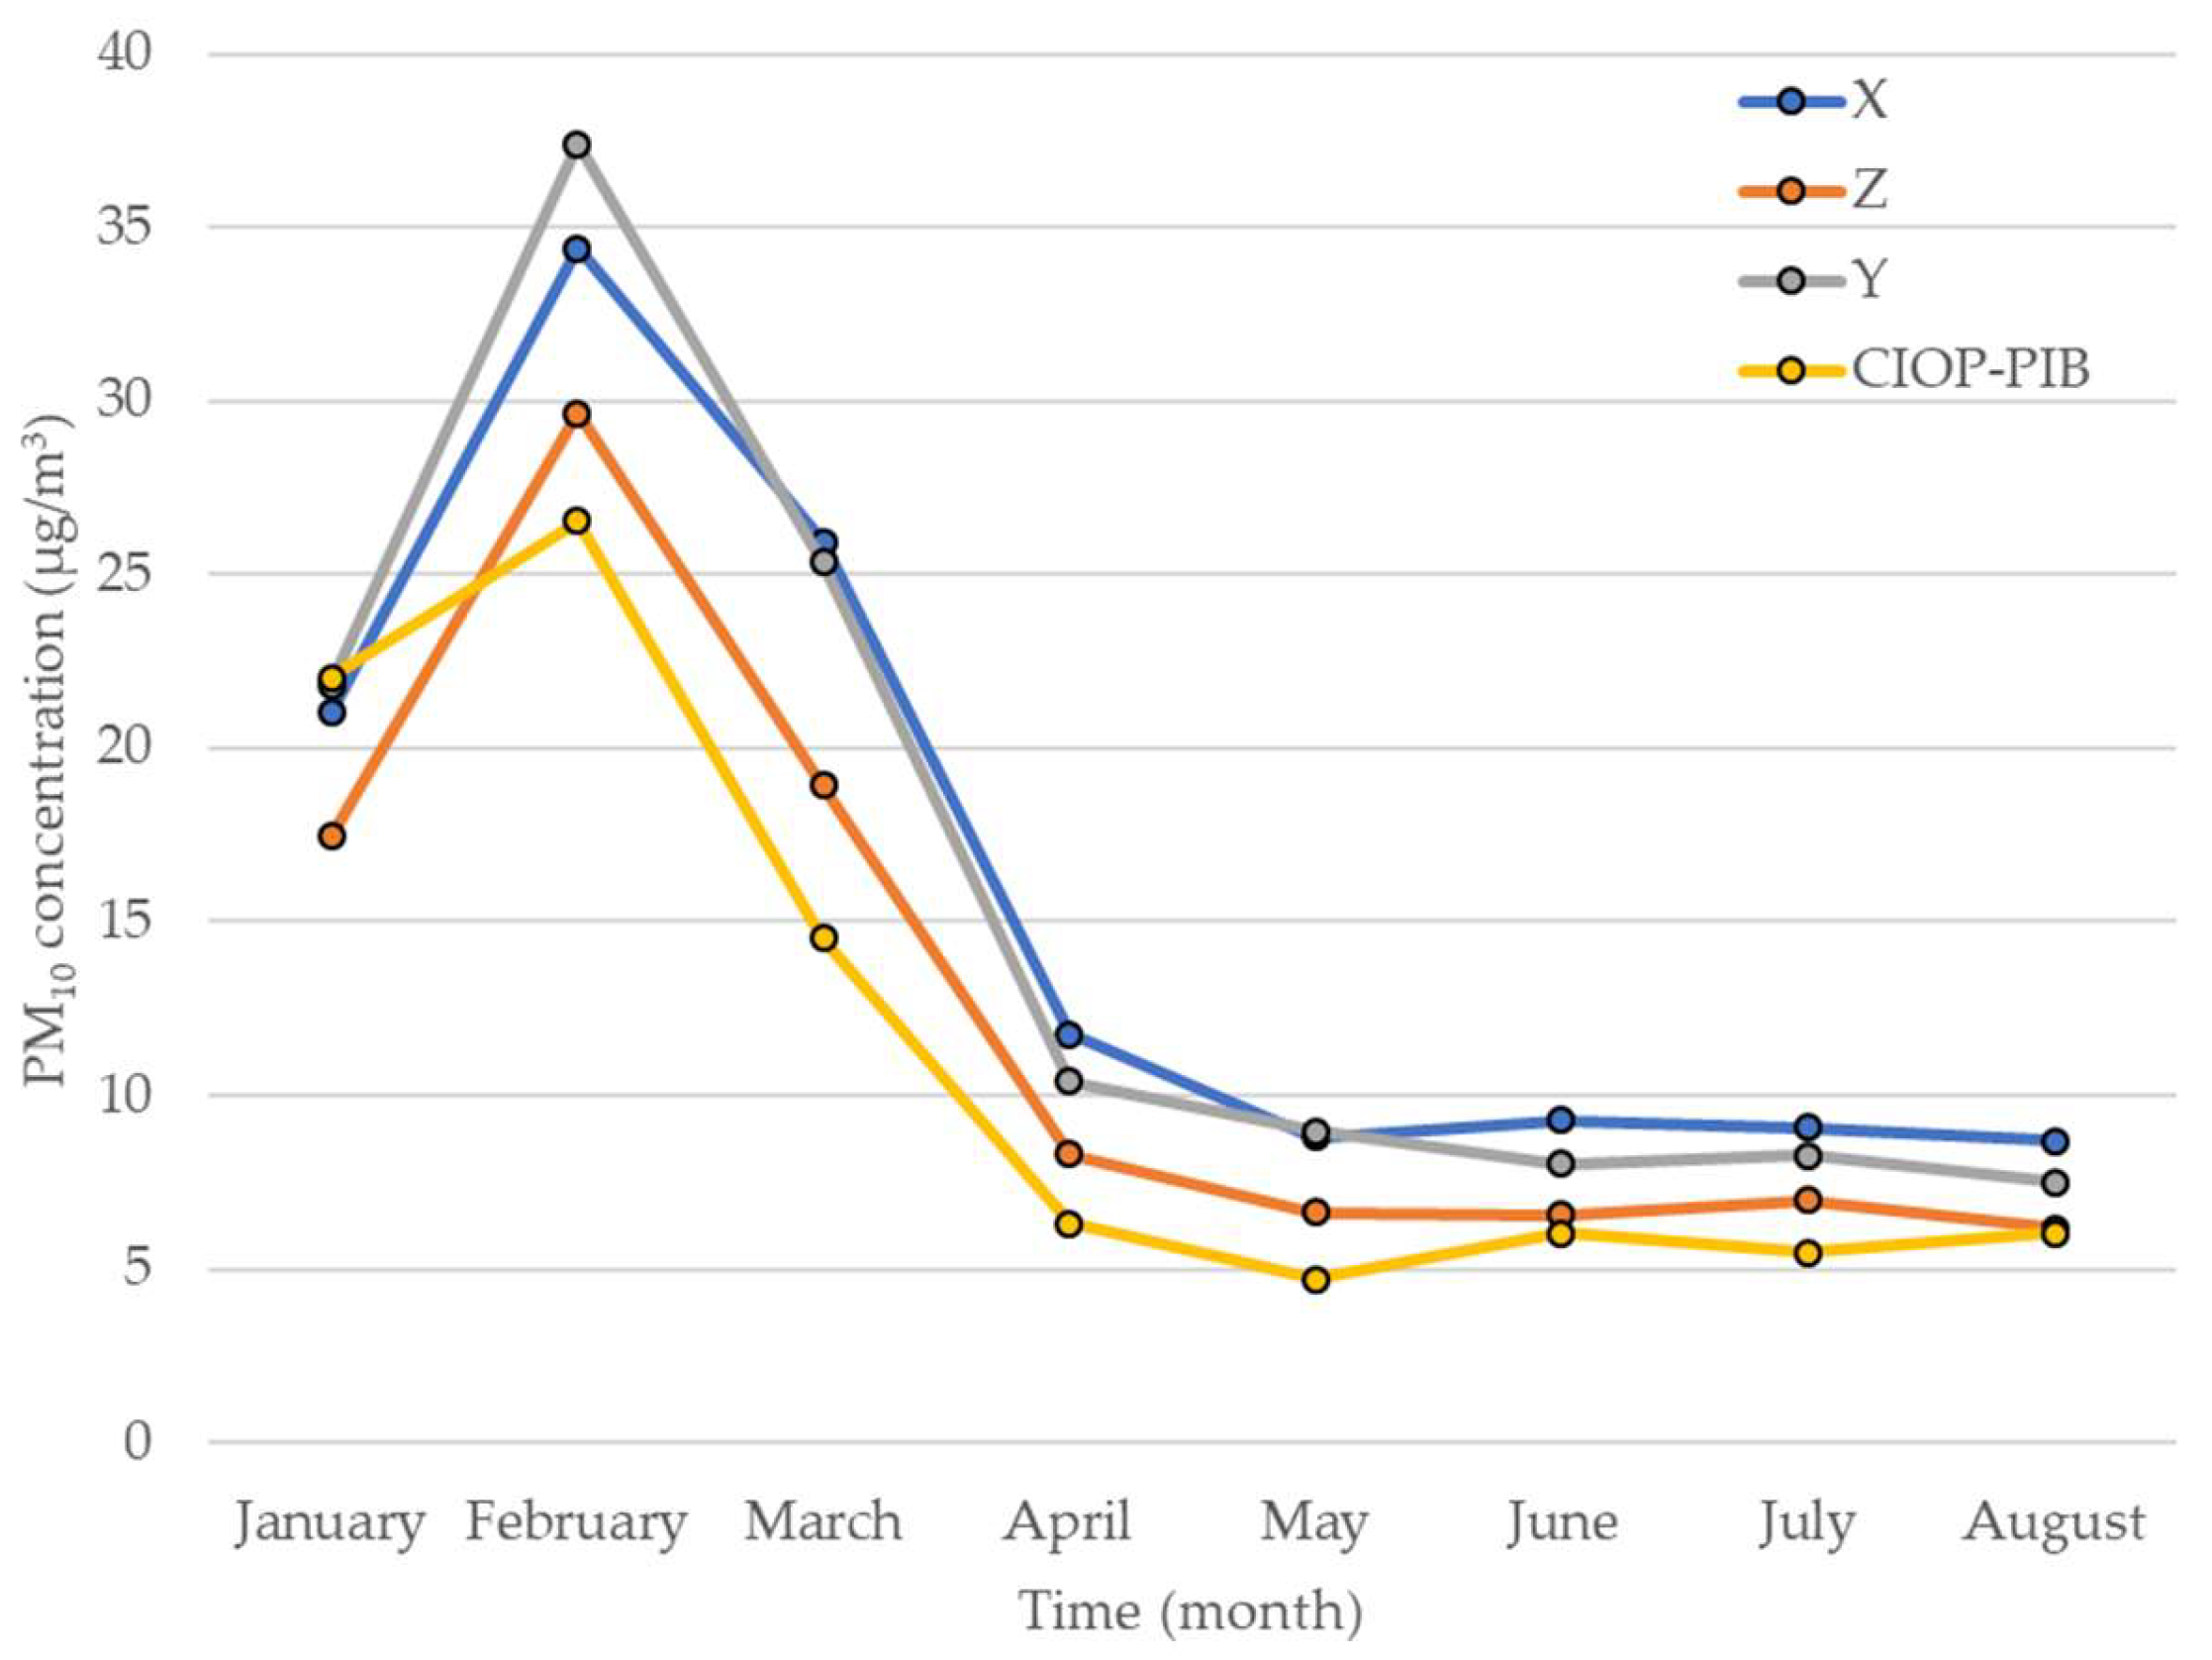
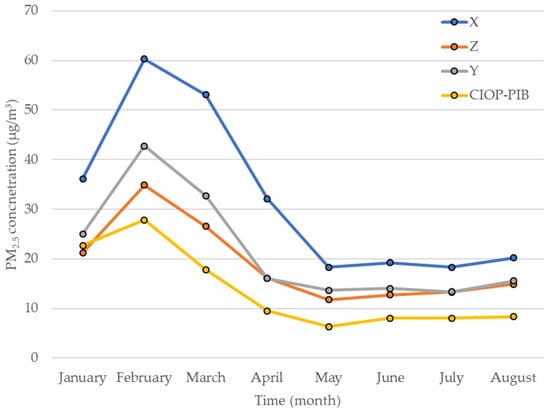
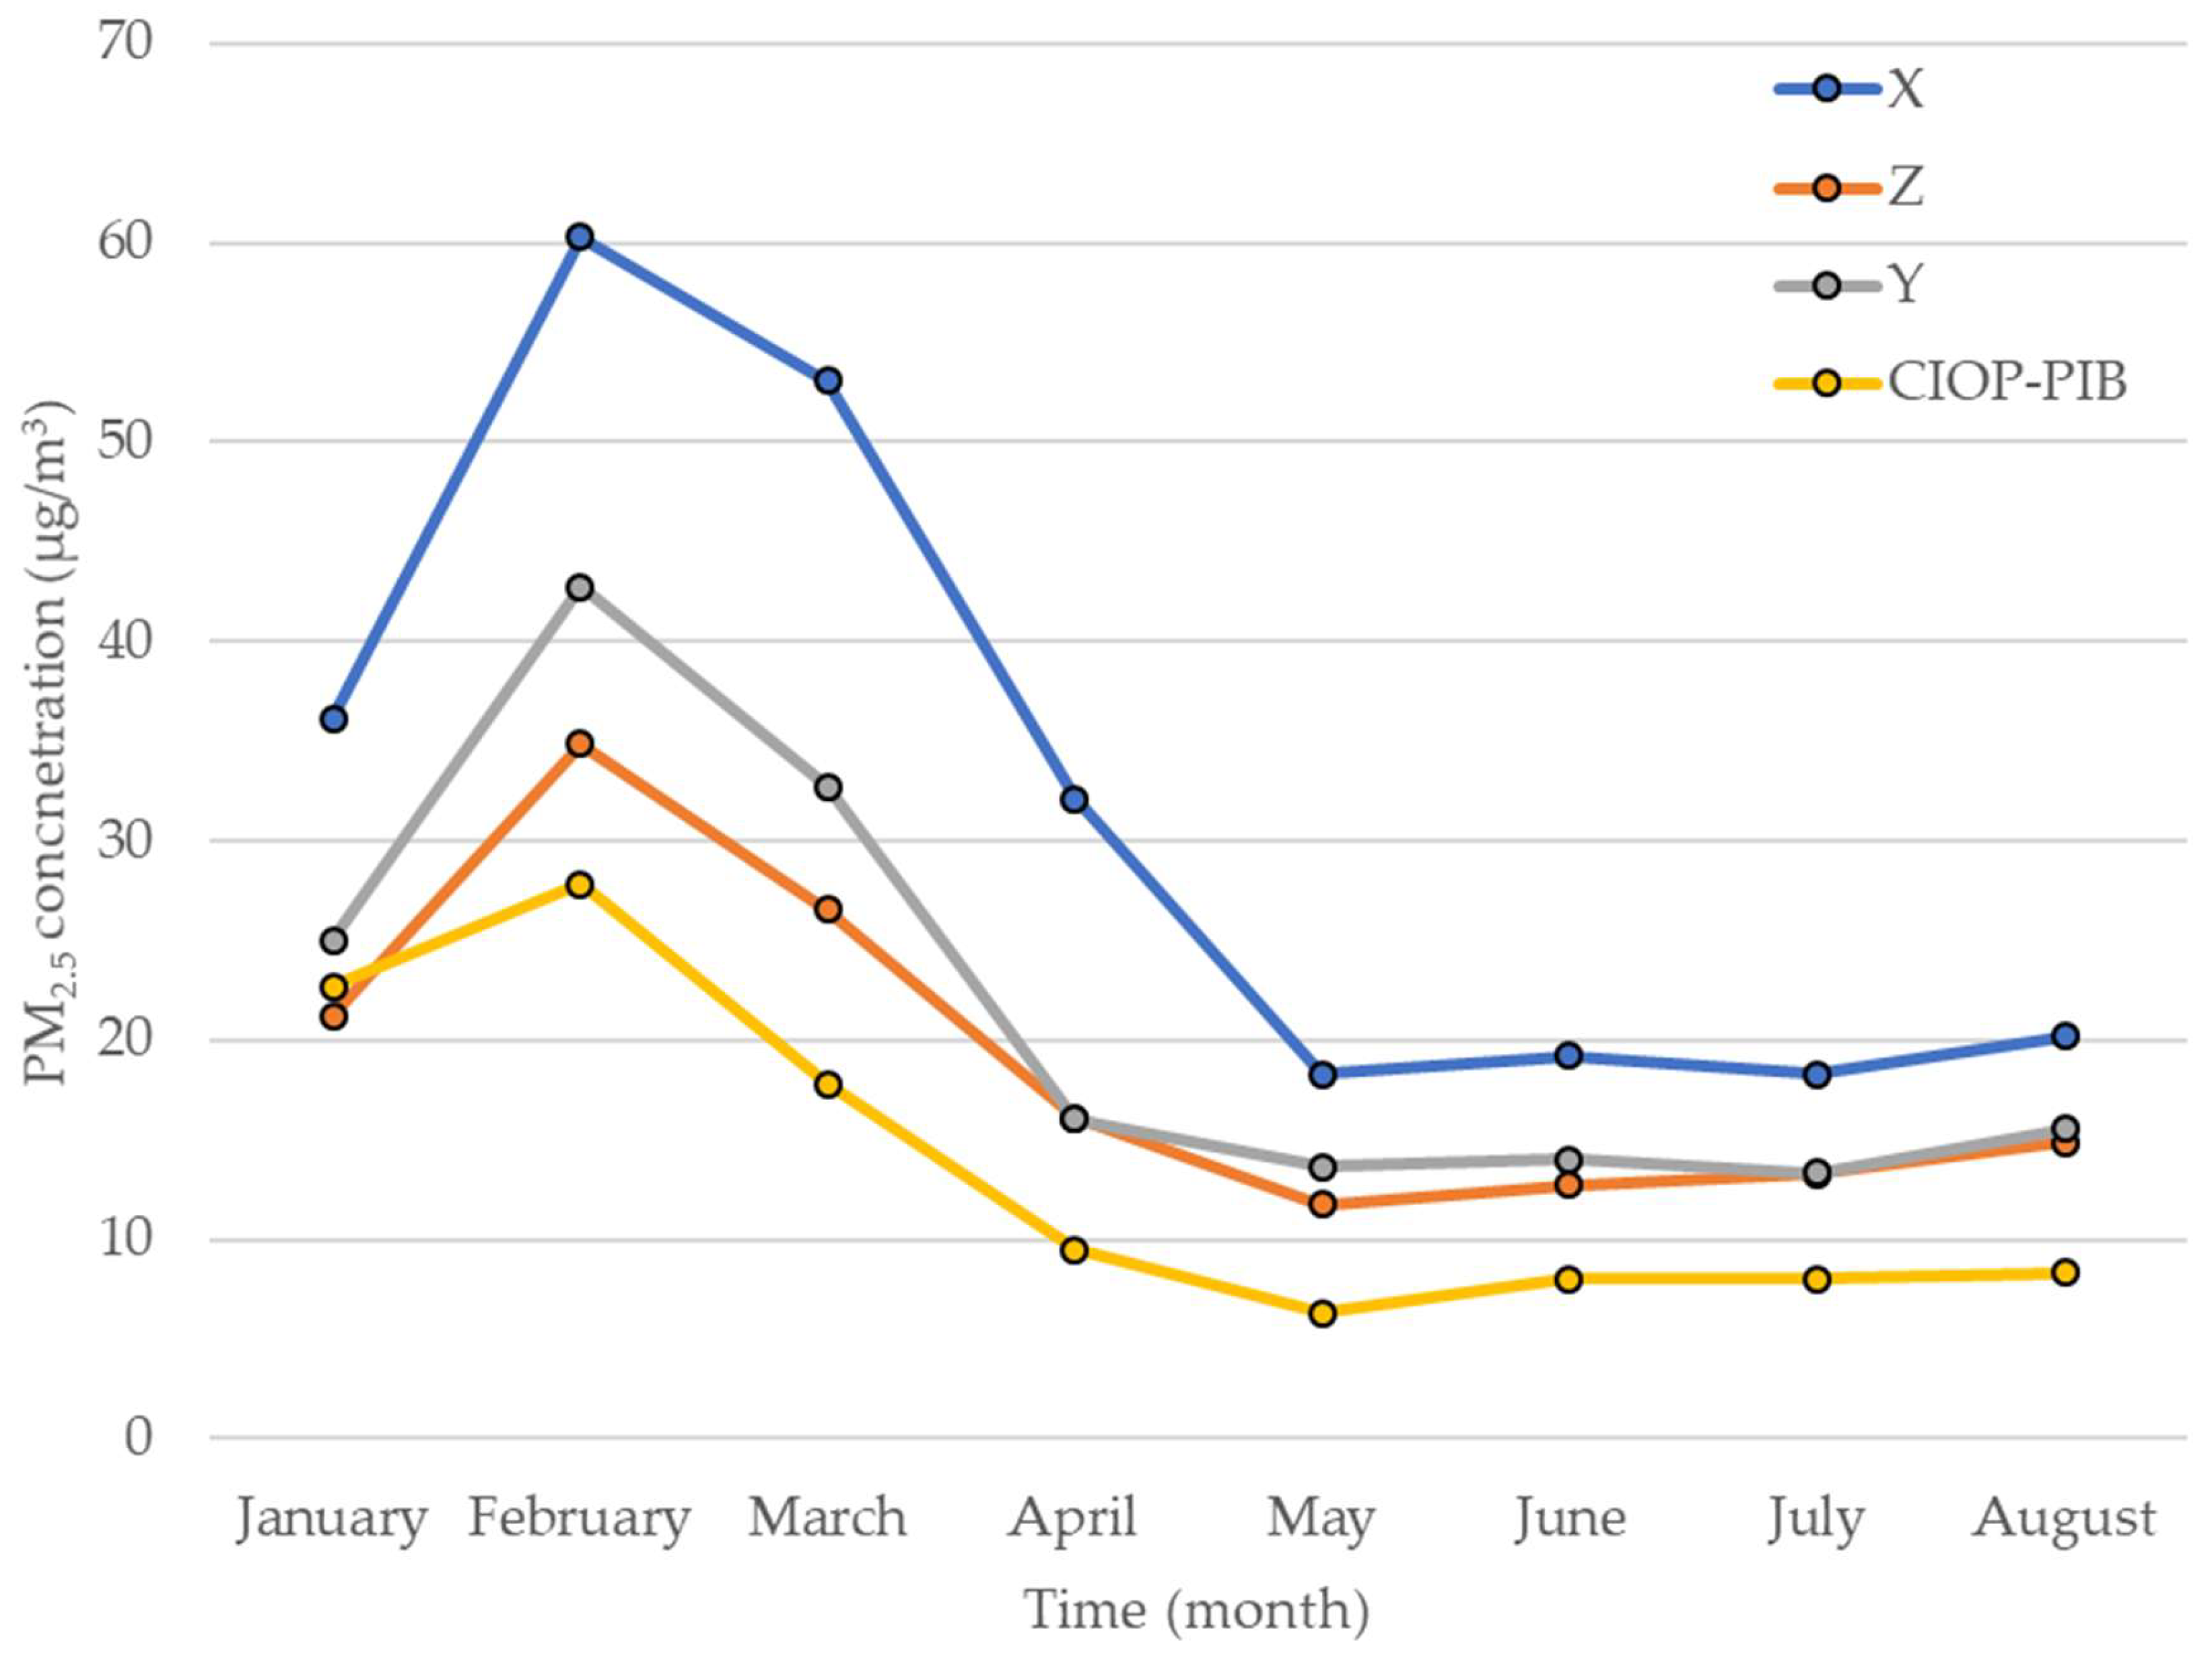
PM2.5 and PM10 mass concentrations calculated from the MINI-WRAS particle number data were compared with the measurements recorded at the three nearest GIOŚ air quality monitoring stations. The main objective of comparing the values of these two particle fractions was to examine trends in air pollution levels and to calculate the PM2.5/PM10 ratio. Figure 7 and Figure 8 show the changes in monthly average PM2.5 and PM10 concentrations over the 8-month period obtained with the MINI-WRAS at the CIOP-PIB rooftop site, together with the corresponding data from the three nearest GIOŚ air quality monitoring stations. Although absolute PM2.5 and PM10 values from the CIOP-PIB rooftop site and the GIOŚ stations cannot be expected to show 100% agreement due to differences in measurement methods, locations, and sampling heights, a clear seasonal variability in both particle fractions is evident at all measurement points: significantly higher concentrations were recorded during the winter months (January–March) compared to the warmer months (April–August).
Figure 7.
Monthly averages of PM10 parameter from January to first half of August 2025.
Figure 8.
Monthly averages of PM2.5 parameter from January to first half of August 2025.
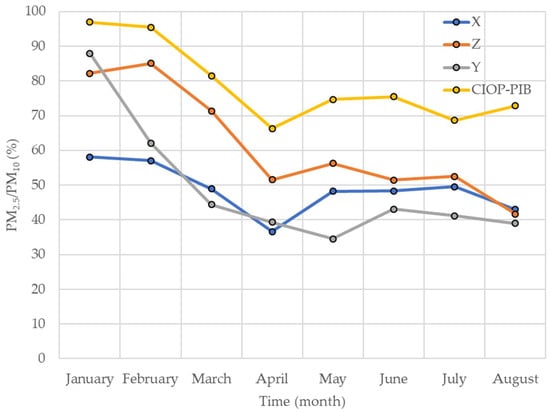
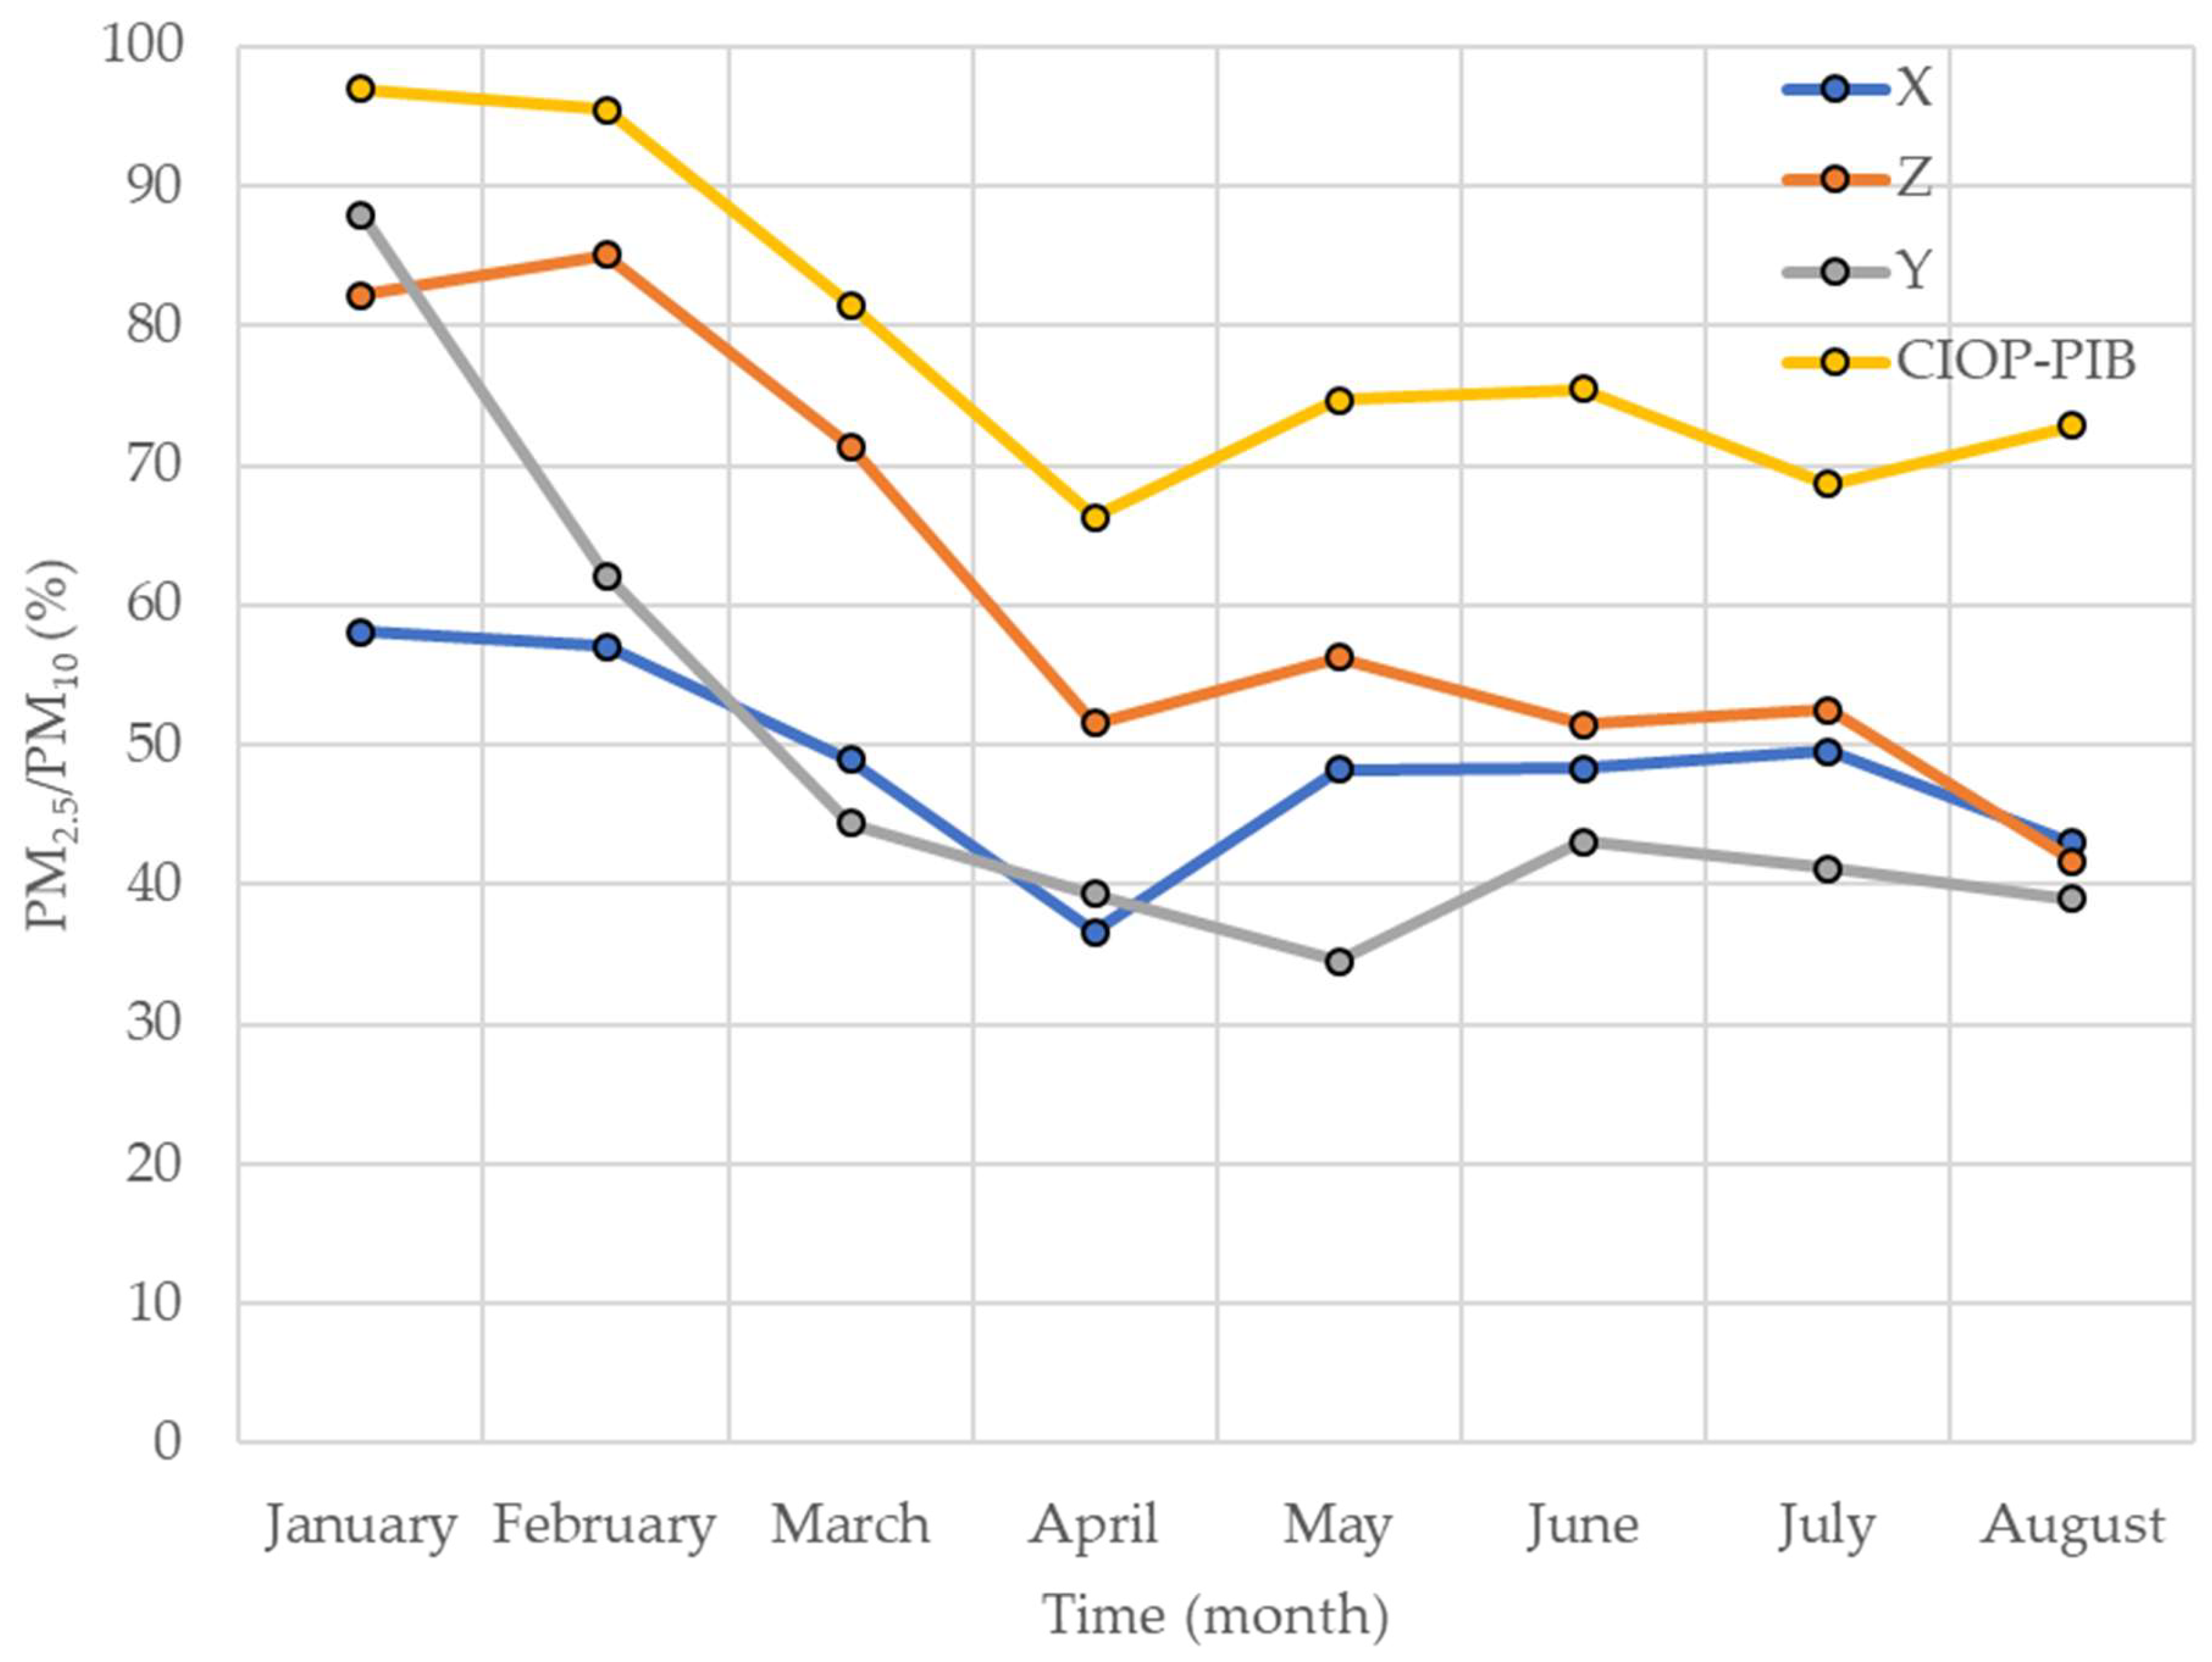
Calculating the PM2.5/PM10 ratio allows the elimination of discrepancies resulting from the different measurement techniques applied at the CIOP-PIB rooftop site and the GIOŚ reference stations; for instance, the default particle density used in the MINI-WRAS. The PM2.5/PM10 ratios (expressed as percentages) for the results obtained at the CIOP-PIB measurement site and the GIOŚ air quality monitoring stations are presented in Table 3 and Figure 9. Table 3 also includes the ratio between the PM2.5/PM10 ratio recorded at the CIOP-PIB rooftop site and the corresponding PM2.5/PM10 ratio from the GIOŚ monitoring stations. This enables evaluation of the impact of sampling height on the proportion of the individual particle fractions in ambient air pollution.
Table 3.
Results of the comparison between measuring points.
Figure 9.
Percentage of PM2.5 to PM10 from January to first half of August 2025.
The obtained data reveal that the PM2.5/PM10 ratio displayed similar seasonal patterns at all measurement points. The measurements performed at the CIOP-PIB rooftop site at a height of 25.5 m yielded the highest PM2.5/PM10 ratio, fluctuating in the range of 81.5–97% in the winter months, while 66.3–75.5% was recorded in the warmer months. At the GIOŚ urban traffic stations, the PM2.5/PM10 ratio ranged 48.9–58.1% during the winter months (January–March) and from 36.6 to 49.5% during the warmer months (April–May). For the urban background stations, the PM2.5/PM10 ratio range was 44.4–88% and 34.5–88%, respectively. In all cases analysed, the PM2.5/PM10 ratio at the CIOP-PIB site was higher than the corresponding ratio at the GIOŚ stations. For the urban traffic station, denoted as X, this ratio ranged 138.6–181.1%. For the urban background stations, denoted as Y and Z, the ratio ranged 110.2–216.5%.
4. Discussion
This study investigates various fractions of particulate matter, including nanoparticles, in the air in Warsaw, Poland, at a height of 25.5 m above ground level. It represents a novel contribution with respect to both the measurement location and the elevation. This study is distinguished by its extended duration of eight months, achieving an average data coverage of more than 80%. During three measurement months in 2025, the temporal data coverage exceeded 97%. Particle number concentrations were measured using the MINI-WRAS at a temporal resolution of 1 min. In total, the study yielded 280,298 individual records, each containing 41 values corresponding to different particle size channels.
To date, studies on particulate matter fractions in Warsaw have mainly focused on PM1 and larger fractions, while data on nanoparticle monitoring remain scarce and difficult to access.
The results obtained during the 8-month measurement campaign clearly demonstrate the seasonal variability of particle fraction concentrations. As shown in Figure 3, in the winter months with sub-zero air temperatures (January and February), the total particle number concentration measured by the MINI-WRAS reached its highest values. At the same time, the nanoparticle concentration was also the highest, despite nanoparticles having the lowest percentage share in the total particle number. In the warmer months, starting from April, the percentage share of nanoparticles was approximately 20% higher than the values recorded in January and February. During the measurements, a relationship between nanoparticle concentration and air temperature was observed. Air temperature does not directly influence particle concentration; rather, it affects several other factors, including road traffic intensity and emissions from residential heating. Relative humidity impact on particle concentration was not directly observed.
The observed increase in pollutant concentrations during the winter months is consistent with the results reported for PM2.5 and PM10 fractions in Warsaw [31]. Such seasonal variability, largely driven by the heating season, is also typical for other Polish cities, as reported, for example, in [18,32], as well as in other regions of the world [33,34].
Proximity to two high-capacity roads influenced the recorded concentration, which most likely contributed to a significant increase. In this work, thanks to data from air quality monitoring stations, we can see that values measured by the Niepodległości station, classified as urban traffic, were higher than the other two stations classified as urban background. Placement in the transport corridor is probably the main difference between that and other stations, which was a cause for the measured differences. However, quantifying influences is a complex topic. The first thing which comes to mind are products of engine combustion, highly dependent on the type of engine and with which standard car model it complies. Currently, Warsaw’s clear transport zone does not include the measurement area from this study, which allows all cars to use these roads (and even may attract rerouted drivers with older vehicles that do not comply with newer emission standards). Paradoxically, establishing a clear transport zone in the city centre may worsen air quality in districts farther away. Another source of PM is non-exhaust emissions such as tyre wear, road surface abrasions and brake wear, which is again highly dependent on materials used in car production and road constructions. Resuspension of dust is another factor influenced by road cleaning schedule and the previously mentioned factors. Intersection driving schedule influences how vehicles brake and stop, contributing to an increase in pollution when high rates of acceleration and braking are present.
The PM2.5 and PM10 concentrations obtained with the MINI-WRAS at a height of 25.5 m at the CIOP-PIB rooftop site were compared with the results from the nearest GIOŚ air quality monitoring stations (measured near ground level, accounting for a height difference of 21.5–24 m relative to the CIOP-PIB measurement point). The comparison revealed similar seasonal trends throughout the entire measurement campaign. Calculating the PM2.5/PM10 ratio enabled a direct comparison of the results regardless of the different measurement methods used. However, it is worth noting that the different measuring principles employed by the air quality monitoring stations and the CIOP-PIB measurement point may produce different values depending on the nature of the particles. Gravimetric methods have low sensitivity for detecting fine particles and usually exhibit a long response time. As shown in Table 3 and Figure 9, the PM2.5/PM10 ratio was consistently the highest for the CIOP-PIB measurements throughout the study period. This indicates that, with increasing height, smaller particles constitute a larger percentage share of the total particle number. The PM2.5/PM10 ratio closest to the CIOP-PIB values was recorded at station Z, an urban background station located 4.5 km away. It was observed that, despite the highest PM2.5 mass concentration being recorded at station X (classified as an urban traffic station), the PM2.5/PM10 ratio at this station was markedly lower than at station Z, especially during the winter months. These results demonstrate the impact of height on aerosol composition in terms of particle size distribution.
Constant advancements in measurement techniques may enable us to obtain even more information about rapidly changing aerosols in ambient air. To establish reliable correlations in the future, it is essential to collect as much data as possible at present. Even if the relationships between different variables are not yet clear, new data science models, increased computing power, and advanced computational methods may lead to the development of simulations that help prevent unnecessary health problems in the general population.
5. Conclusions
Nanoparticles represent an increasingly significant health risk in everyday life. Both short- and long-term exposure to them, as well as to particulate matter in general, can lead to serious health consequences. The measurement of nanoparticles in ambient air is primarily performed using particle counting methods, which were also employed in this study with the MINI-WRAS.
This article presents the results of an 8-month measurement campaign characterised by high temporal data coverage exceeding 80%. This study reports nanoparticle concentrations measured at an elevation of 25.5 m on the rooftop of the Central Institute for Labour Protection—National Research Institute (CIOP-PIB) in Warsaw. Furthermore, the calculated PM2.5 and PM10 mass concentrations were compared with publicly available data from the nearest Chief Inspectorate of Environmental Protection reference monitoring stations operating at ground level. In 2025, the urban air quality monitoring stations did not carry out any measurements of nanoparticle concentrations in ambient air. The obtained results demonstrate a distinct seasonal variability in both the particle number concentration (including nanoparticles) and the mass concentration of particulate matter. The highest particle concentrations were observed during the winter months. At the same time, the percentage share of nanoparticles in the total particle number was significantly lower in this period compared to the spring and summer months. Analysis of the PM2.5/PM10 ratio at an elevation of 25.5 m compared to ground-level measurements shows an increase in the contribution of smaller particles with height throughout the study period, but a clear tendency cannot be confirmed on this data alone. No inversion of particle concentration was observed, contrary to findings reported in some international studies.
The presented research aligns with the global and European trend aimed at improving air quality, including the study of nanoparticles, of which monitoring in European cities is gradually becoming mandatory.
Author Contributions
Conceptualization, S.K., T.J. and P.S.; methodology, S.K., T.J. and P.S.; investigation, S.K.; resources, T.J.; data curation, S.K.; writing—original draft preparation, S.K.; writing—review and editing, T.J. and P.S.; visualization, S.K. and P.S.; supervision, T.J. project administration, S.K.; funding acquisition, T.J. All authors have read and agreed to the published version of the manuscript.
Funding
This task was completed on the basis of results of research carried out within the scope of the 6th stage of the National Programme “Governmental Programme for Improvement of Safety and Working Conditions”, funded by state services of the Ministry of Family, Labour and Social Policy. Task no.: 3.ZS.06, entitled: Analysis of the content of nano fractions in aerosols of the work environment and the external environment. The Central Institute for Labour Protection—National Research Institute is the Programme’s main co-ordinator. The authors declare that no funds, grants or other support were received during preparation of this manuscript.
Institutional Review Board Statement
Not applicable.
Informed Consent Statement
Not applicable.
Data Availability Statement
The raw data supporting the conclusions of this article will be made available by the authors on request.
Conflicts of Interest
The authors declare no conflicts of interest.
Abbreviations
The following abbreviations are used in this manuscript:
| BAM | Beta attenuation monitoring |
| CIOP-PIB | Central institute for labour protection—National Research Institute |
| DNA | Deoxyribonucleic acid |
| EMA | Electrical mobility analyser |
| GIOŚ | Chief inspectorate of environmental protection |
| OPC | Optical particle counter |
| PAH | Polycyclic aromatic hydrocarbons |
| PM | Particulate matter |
| PN | Particle number |
| PNC | Particle number concentration |
| TEOM | Tapered element oscillating microbalance |
| UB | Urban background |
| UT | Urban traffic |
| WHO | World health organisation |
| WRAS | Wide-range aerosol spectrometer |
References
- Atkinson, R.W.; Fuller, G.W.; Anderson, H.R.; Harrison, R.M.; Armstrong, B. Urban Ambient Particle Metrics and Health: A Time-Series Analysis. Epidemiology 2010, 21, 501–511. [Google Scholar] [CrossRef] [Scilit]
- Maciejewska, K. Short-term impact of PM2.5, PM10, and PMc on mortality and morbidity in the agglomeration of Warsaw, Poland. Air Qual. Atmos. Health 2020, 13, 659–672. [Google Scholar] [CrossRef] [Scilit]
- World Health Organization. WHO Global Air Quality Guidelines: Particulate Matter (PM2.5 and PM10), Ozone, Nitrogen Dioxide, Sulfur Dioxide and Carbon Monoxide, 1st ed.; World Health Organization: Geneva, Switzerland, 2021; ISBN 978-92-4-003422-8. [Google Scholar]
- European Parliament. Directive (EU) 2024/2881 of the European Parliament and of the Council of 23 October 2024 on Ambient Air Quality and Cleaner Air for Europe; European Parliament and Council: Brussels, Belgium, 2024. [Google Scholar]
- Xu, M.; Niu, Z.; Shi, Z.; Zhang, Y.; Meng, M.; Yang, X.; Wang, M.; Ma, X.; Zhao, H.; Yang, Y. High-Resolution Characterization of Coal Combustion-Derived Metal-Containing Nanoparticles and Their Health-Related Implications. Environ. Sci. Technol. Lett. 2024, 11, 611–618. [Google Scholar] [CrossRef] [Scilit]
- Schraufnagel, D.E. The Health Effects of Ultrafine Particles. Exp. Mol. Med. 2020, 52, 311–317. [Google Scholar] [CrossRef] [Scilit]
- Akram Ghareeb, O.; Adnan Ali, Q. Pathological Disorders Caused by Atmospheric Nanoparticles: Review. Peerian J. 2024, 26, 44–51. [Google Scholar]
- Sharma, R.; Kurmi, O.P.; Hariprasad, P.; Tyagi, S.K. Health Implications Due to Exposure to Fine and Ultra-Fine Particulate Matters: A Short Review. Int. J. Ambient. Energy 2024, 45, 2314256. [Google Scholar] [CrossRef] [Scilit]
- Lloyd, M.; Olaniyan, T.; Ganji, A.; Xu, J.; Venuta, A.; Simon, L.; Zhang, M.; Saeedi, M.; Yamanouchi, S.; Wang, A.; et al. Airborne Nanoparticle Concentrations Are Associated with Increased Mortality Risk in Canada’s Two Largest Cities. Am. J. Respir. Crit. Care Med. 2024, 210, 1338–1347. [Google Scholar] [CrossRef] [Scilit] [PubMed]
- Rönkkö, T.; Timonen, H. Overview of Sources and Characteristics of Nanoparticles in Urban Traffic-Influenced Areas. J. Alzheimer’s Dis. 2019, 72, 15–28. [Google Scholar] [CrossRef] [Scilit]
- Wang, C.; Xiang, J.; Austin, E.; Larson, T.; Seto, E. Quantifying the Contributions of Road and Air Traffic to Ambient Ultrafine Particles in Two Urban Communities. Environ. Pollut. 2024, 348, 123892. [Google Scholar] [CrossRef] [Scilit]
- Muñoz, M.; Haag, R.; Honegger, P.; Zeyer, K.; Mohn, J.; Comte, P.; Czerwinski, J.; Heeb, N.V. Co-Formation and Co-Release of Genotoxic PAHs, Alkyl-PAHs and Soot Nanoparticles from Gasoline Direct Injection Vehicles. Atmos. Environ. 2018, 178, 242–254. [Google Scholar] [CrossRef] [Scilit]
- Zhou, X.; Zhou, X.; Wang, C.; Zhou, H. Environmental and Human Health Impacts of Volatile Organic Compounds: A Perspective Review. Chemosphere 2023, 313, 137489. [Google Scholar] [CrossRef] [Scilit]
- Mohan, V.; Kumar Soni, V.; Kumar Mishra, R. Analysing the Impact of Day-Night Road Traffic Variation on Ultrafine Particle Number Size Distribution and Concentration at an Urban Site in the Megacity Delhi. Atmos. Pollut. Res. 2024, 15, 102065. [Google Scholar] [CrossRef] [Scilit]
- Morawska, L.; Ristovski, Z.; Jayaratne, E.R.; Keogh, D.U.; Ling, X. Ambient Nano and Ultrafine Particles from Motor Vehicle Emissions: Characteristics, Ambient Processing and Implications on Human Exposure. Atmos. Environ. 2008, 42, 8113–8138. [Google Scholar] [CrossRef] [Scilit]
- Bihałowicz, J.; Rogula-Kozłowska, W.; Rogula-Kopiec, P.; Świsłowski, P.; Rajfur, M.; Olszowski, T. One-Year-Long, Comprehensive Analysis of PM Number and Mass Size Distributions in Warszawa (Poland). Ecol. Chem. Eng. 2024, 30, 541–556. [Google Scholar] [CrossRef] [Scilit]
- Majewski, G.; Rogula-Kozłowska, W.; Rozbicka, K.; Rogula-Kopiec, P.; Mathews, B.; Brandyk, A. Concentration, Chemical Composition and Origin of PM1: Results from the First Long-term Measurement Campaign in Warsaw (Poland). Aerosol Air Qual. Res. 2018, 18, 636–654. [Google Scholar] [CrossRef] [Scilit]
- Klejnowski, K.; Krasa, A.; Rogula-Kozłowska, W.; Błaszczak, B. Number Size Distribution of Ambient Particles in a Typical Urban Site: The First Polish Assessment Based on Long-Term (9 Months) Measurements. Sci. World J. 2013, 2013, 539568. [Google Scholar] [CrossRef] [Scilit]
- Rogula-Kozłowska, W.; Mach, T.; Rogula-Kopiec, P.; Rybak, J.; Nocoń, K. Concentration and Elemental Composition of Quasi-Ultrafine Particles in Upper Silesia. Environ. Prot. Eng. 2019, 45, 171–184. [Google Scholar] [CrossRef] [Scilit]
- Ahlawat, A.; Julaha, K.; Tiwari, P.; Deshmukh, S.; Atabakhsh, S.; Bran, S.H.; Baig, N.A.; Balyan, P.; Mandariya, A.K.; Ganguly, D.; et al. Drone Measurements Reveal High Near-Surface Urban Haze. npj Clean Air 2026, 2, 8. [Google Scholar] [CrossRef] [Scilit]
- Liu, F.; Zheng, X.; Qian, H. Comparison of Particle Concentration Vertical Profiles between Downtown and Urban Forest Park in Nanjing (China). Atmos. Pollut. Res. 2018, 9, 829–839. [Google Scholar] [CrossRef] [Scilit]
- Roostaei, V.; Abbasi, A.; Gharibzadeh, F.; Faridi, S.; Naddafi, K.; Yunesian, M.; Hassanvand, M.S. Vertical Distribution of Air Particulate Matter (PM1, PM2.5, and PM10) in Different Regions of Tehran. Aerosol Air Qual. Res. 2024, 24, 240036. [Google Scholar] [CrossRef] [Scilit]
- Quang, T.N.; He, C.; Morawska, L.; Knibbs, L.D.; Falk, M. Vertical Particle Concentration Profiles around Urban Office Buildings. Atmos. Chem. Phys. 2012, 12, 5017–5030. [Google Scholar] [CrossRef] [Scilit]
- Sekuła, P.; Bokwa, A.; Bartyzel, J.; Bochenek, B.; Chmura, Ł.; Gałkowski, M.; Zimnoch, M. Measurement report: Effect of wind shear on PM10 concentration vertical structure in the urban boundary layer in a complex terrain. Atmos. Chem. Phys. 2021, 21, 12113–12139. [Google Scholar] [CrossRef] [Scilit]
- Chiliński, M.; Broda, M.; Nurowska, K.; Markowicz, K. The Near-Surface Vertical Variability of Aerosol Single-Scattering Properties over Warsaw: Case Study. Aerosol Air Qual. Res. 2025, 25, 14. [Google Scholar] [CrossRef] [Scilit]
- Tobler, A.K.; Skiba, A.; Canonaco, F.; Močnik, G.; Rai, P.; Chen, G.; Bartyzel, J.; Zimnoch, M.; Styszko, K.; Nęcki, J.; et al. Characterization of non-refractory (NR) PM1 and source apportionment of organic aerosol in Kraków, Poland. Atmos. Chem. Phys. 2021, 21, 14893–14906. [Google Scholar] [CrossRef] [Scilit]
- Chief Inspectorate of Environmental Protection. Air Quality Portal. Available online: https://powietrze.gios.gov.pl/pjp/archives (accessed on 13 January 2026).
- Pitz, M.; Cyrys, J.; Karg, E.; Wiedensohler, A.; Wichmann, H.E.; Heinrich, J. Variability of apparent particle density of an urban aerosol. Environ. Sci. Technol. 2003, 37, 4336–4342. [Google Scholar] [CrossRef] [Scilit] [PubMed]
- Yuanyuan, W.; Zhengqiang, L.; Ying, Z.; Cheng, C.; Yisong, X.; Yang, L.; Dubovik, O. Derivation of PM10 mass concentration from advanced satellite retrieval products based on a semi-empirical physical approach. Remote Sens. Environ. 2021, 256, 112319. [Google Scholar] [CrossRef] [Scilit]
- Pokorná, P.; Zíková, N.; Vodička, P.; Lhotka, R.; Mbengue, S.; Holubová Šmejkalová, A.; Riffault, V.; Ondráček, J.; Schwarz, J.; Ždímal, V. Chemically speciated mass size distribution, particle density, shape and origin of non-refractory PM1 measured at a rural background site in central Europe. Atmos. Chem. Phys. 2022, 22, 5829–5858. [Google Scholar] [CrossRef] [Scilit]
- Starzomska, A.; Strużewska, J. Seasonal Variability and Trends of PM10 and PM2.5 Particulate Matter Pollution in Warsaw: A Multi-Year Analysis. Environ. Prot. Nat. Resour. 2024, 35, 26–40. [Google Scholar] [CrossRef] [Scilit]
- Kunecki, P.; Franus, W.; Wdowin, M. Statistical study and physicochemical characterization of particulate matter in the context of Kraków, Poland. Atmos. Pollut. Res. 2020, 11, 520–530. [Google Scholar] [CrossRef] [Scilit]
- Molozhnikova, Y.; Shikhovtsev, M.; Khodzher, T. Results of a Comprehensive Study on Atmospheric Pollution at the Tankhoi Observation Point (Southeastern Coast of Lake Baikal, Russia): Temporal Variability and Identification of Sources. Environments 2025, 12, 462–485. [Google Scholar] [CrossRef] [Scilit]
- Shikhovtsev, M.Y.; Makarov, M.M.; Aslamov, I.A.; Tyurnev, I.N.; Molozhnikova, Y.V. Application of Modern Low-Cost Sensors for Monitoring of Particle Matter in Temperate Latitudes: An Example from the Southern Baikal Region. Sustainability 2025, 17, 3585–3902. [Google Scholar] [CrossRef] [Scilit]

Disclaimer/Publisher’s Note: The statements, opinions and data contained in all publications are solely those of the individual author(s) and contributor(s) and not of MDPI and/or the editor(s). MDPI and/or the editor(s) disclaim responsibility for any injury to people or property resulting from any ideas, methods, instructions or products referred to in the content. |
© 2026 by the authors. Licensee MDPI, Basel, Switzerland. This article is an open access article distributed under the terms and conditions of the Creative Commons Attribution (CC BY) license.