


Abstract
This study assessed photovoltaic (PV) soiling losses at Alamogordo, New Mexico, USA, located within the Chihuahuan Desert and near the White Sands gypsum dune field, a region with frequent dust events. Soiling material collected from PV module surfaces showed seasonal variations in mineral composition, with quartz being the main component during the fall season and calcite predominating during the spring. All samples collected during the following spring season contained large amounts of gypsum, indicating transport from White Sands, supported by HYSPLIT back-trajectories and surface wind data. Soiling materials collected from PV module surfaces generally had a mineral composition similar to that of the surrounding local soils. The mean particle size of collected soiling material samples ranged from 8 to 21 µm, with ~90% of particles being dust (<50 µm) and ~10% of the soiling particles being sand (>50 µm). Despite Alamogordo experiencing 22 dust events during this study, soiling-related power losses were relatively low, about 2% to 3%, much lower than reported for Global Dust Belt locations. The prevailing south-to-southwest winds and their gusts acted as a passive cleaning mechanism, as they were aligned with the front of the PV modules and likely resuspended particles off panel surfaces. Additionally, relatively low rainfall (about 2.2 mm per hour) was effective in restoring PV performance. These findings suggest that, due to the relatively low soiling losses observed, frequent cleaning may not be necessary at this location, resulting in potential savings in maintenance costs over the long-term operation of the PV system.
1. Introduction
Between 2018 and 2050, global energy consumption is expected to increase by almost 50% [1], with an increase of up to 15% in the US from 2022 to 2025 [2]. Among all renewable energy technologies, solar energy is the fastest growing in residential, commercial, and industrial applications. For instance, in 2024, solar energy installations accounted for approximately 77% of the total global renewable energy capacity deployment [3]. The solar photovoltaic (PV) capacity in the United States has grown significantly, increasing from 2.90 GW in 2010 to 6.05 GW in 2019 [4].
However, a growing challenge in solar energy is the dirt that builds up on the surface of photovoltaic panels, primarily from atmospheric deposition. This buildup causes a series of problems, including reduced solar radiation transmission, increased surface temperature, and partial shading of PV modules [5]. This phenomenon is known as “soiling”, and it can shorten the lifespan of PV modules while significantly reducing their energy output, with losses of tens of percent in extreme cases [6]. It is caused by the deposition and subsequent accumulation of various materials, including, but not limited to, snow [7], pollen [8], biofilms (bacteria, fungi, and algae) [9,10], bird droppings [11], and/or atmospheric aerosols from engine exhaust, industrial emissions, and/or mineral dust [12,13,14,15].
Due to the optimal environmental conditions of the southwestern U.S., large solar energy facilities have been installed in the states of California, Arizona, New Mexico, and Texas. Together, these states accounted for approximately 58.44 billion kWh or 56% of the total solar electricity generation in the U.S. as of 2019 [1]. However, these desert regions are prone to significant episodes of blowing dust (airborne sediment particles < 50 μm in diameter) or sand (particles > 50 μm in diameter) [16], which may cause soiling that counteracts the benefits of the high irradiation in these areas. A soiling map of the United States from the National Renewable Energy Laboratory (NREL) shows a decline in energy production of up to 10% in some areas of southern California [17]. Nonetheless, soiling affects more than only the power generation of photovoltaic modules; on a broad scale, it has an economic impact that raises the risk for investors of large photovoltaic facilities. For instance, the cost of dust-related soiling was estimated to be $169 million as of 2017 in the USA [18]. Moreover, predicted soiling economic losses for 2023 were between ~$4.2 and 7.3 billion [19]. The volume of literature written on this subject in recent years [20,21,22,23] demonstrates a genuine interest in the consequences of soiling, given the quick rise in photovoltaic system installations since 2008 around the globe [24].
Field measurements of solar radiation transmittance losses due to soiling have been performed in many locations throughout the world for many decades. Early studies found performance degradation on the order of ~5% due to soiling on solar collectors [25,26]. However, those studies were conducted in locations with frequent precipitation episodes that naturally clean PV modules [27], making estimating soiling losses unfeasible [28]. More recently, soiling studies have been performed in regions with arid or semi-arid climates (typically areas with ideal photovoltaic potential, but also prone to increased dust loading), especially in the Middle East and North Africa, China, the United States, Chile, Spain, and India. These have been carried out (1) by measuring light transmission through glass or plastic plates and (2) by measuring the electrical properties of a clean panel and comparing them to those of a soiled panel. The first approach assessed light transmittance loss on glass/plastic plates at various tilt angles and locations, with reductions ranging from 7% to 69% due to airborne sediment over time [28,29,30,31]. However, this method can be misleading for evaluating soiling losses on PV modules due to uneven deposition. The second approach consists of comparing electrical properties measurements between a clean and a dirty PV module, including the short-circuit current, open-circuit voltage, and maximum power, to assess the soiling impact. Based on this method, soiling losses from 10% to 80% have been reported around the world [32,33,34], mainly influenced by dust accumulation and environmental factors. Anthropogenic activities such as construction can also contribute to soiling, impacting the performance of photovoltaic systems [7].
The objective of this study is to assess the impacts of soiling on photovoltaic modules at Alamogordo, New Mexico, USA. Alamogordo is an ideal location for evaluating soiling in a North American dryland environment, given its location in the northern Chihuahuan Desert, one of the dustiest regions of North America [35,36,37,38], and its position downwind of White Sands, one of the dust emission hotspots within the Chihuahuan Desert [35,37,38]. It is also the location of the United States Bureau of Reclamation’s Brackish Groundwater National Desalination Research Facility (BGNDRF), which includes a working photovoltaic array accessible to research studies. Soiling is a complex phenomenon that varies by location, and the most effective mitigation techniques are typically tailored to the specific soiling characteristics of each region. Therefore, the characterization of soiling effects at Alamogordo may be specific to the study area.
To assess the effects of soiling on monocrystalline silicon (m-Si) PV modules, six modules, connected in three series of two modules each, were used. These measurements are aimed at the following:
- Quantify the soiling losses of m-Si PV modules by measuring the power yield under both clean and dirty conditions.
- Correlate wind velocity and wind direction with the soiling losses of the PV modules.
- Characterize the material soiling the PV modules (dust and sand) in terms of particle size and chemical composition to consider their potential roles in soiling effects.
2. Experiment Site Description
The experiments were conducted at the BGNDRF, located in the southern Tularosa Basin of the northeast Chihuahuan Desert at Alamogordo, in south–central New Mexico, USA (32.87, −105.98, 1291 m.a.s.l) from 28 October 2022 to 23 November 2022, from 1 February 2023 to 12 April 2023, and from 5 April 2024 to 31 May 2024. The northern Chihuahuan Desert is considered a major dust emission “hot spot” in North America [16,37,38], with dust and sand deposition rates ranging between 56 and 111 g m−2 yr−1 [39], higher than those of other North American deserts [40]. Dust deposition rates at White Sands Missile Range, located ~23 km from the BGNDRF, were reported to be greatest during spring and winter [41], the region’s driest and windiest seasons. The Chihuahuan Desert is characterized by having frequent windblown dust events during the dry season from October to May, primarily generated by Pacific cold fronts moving eastward across the region [42].
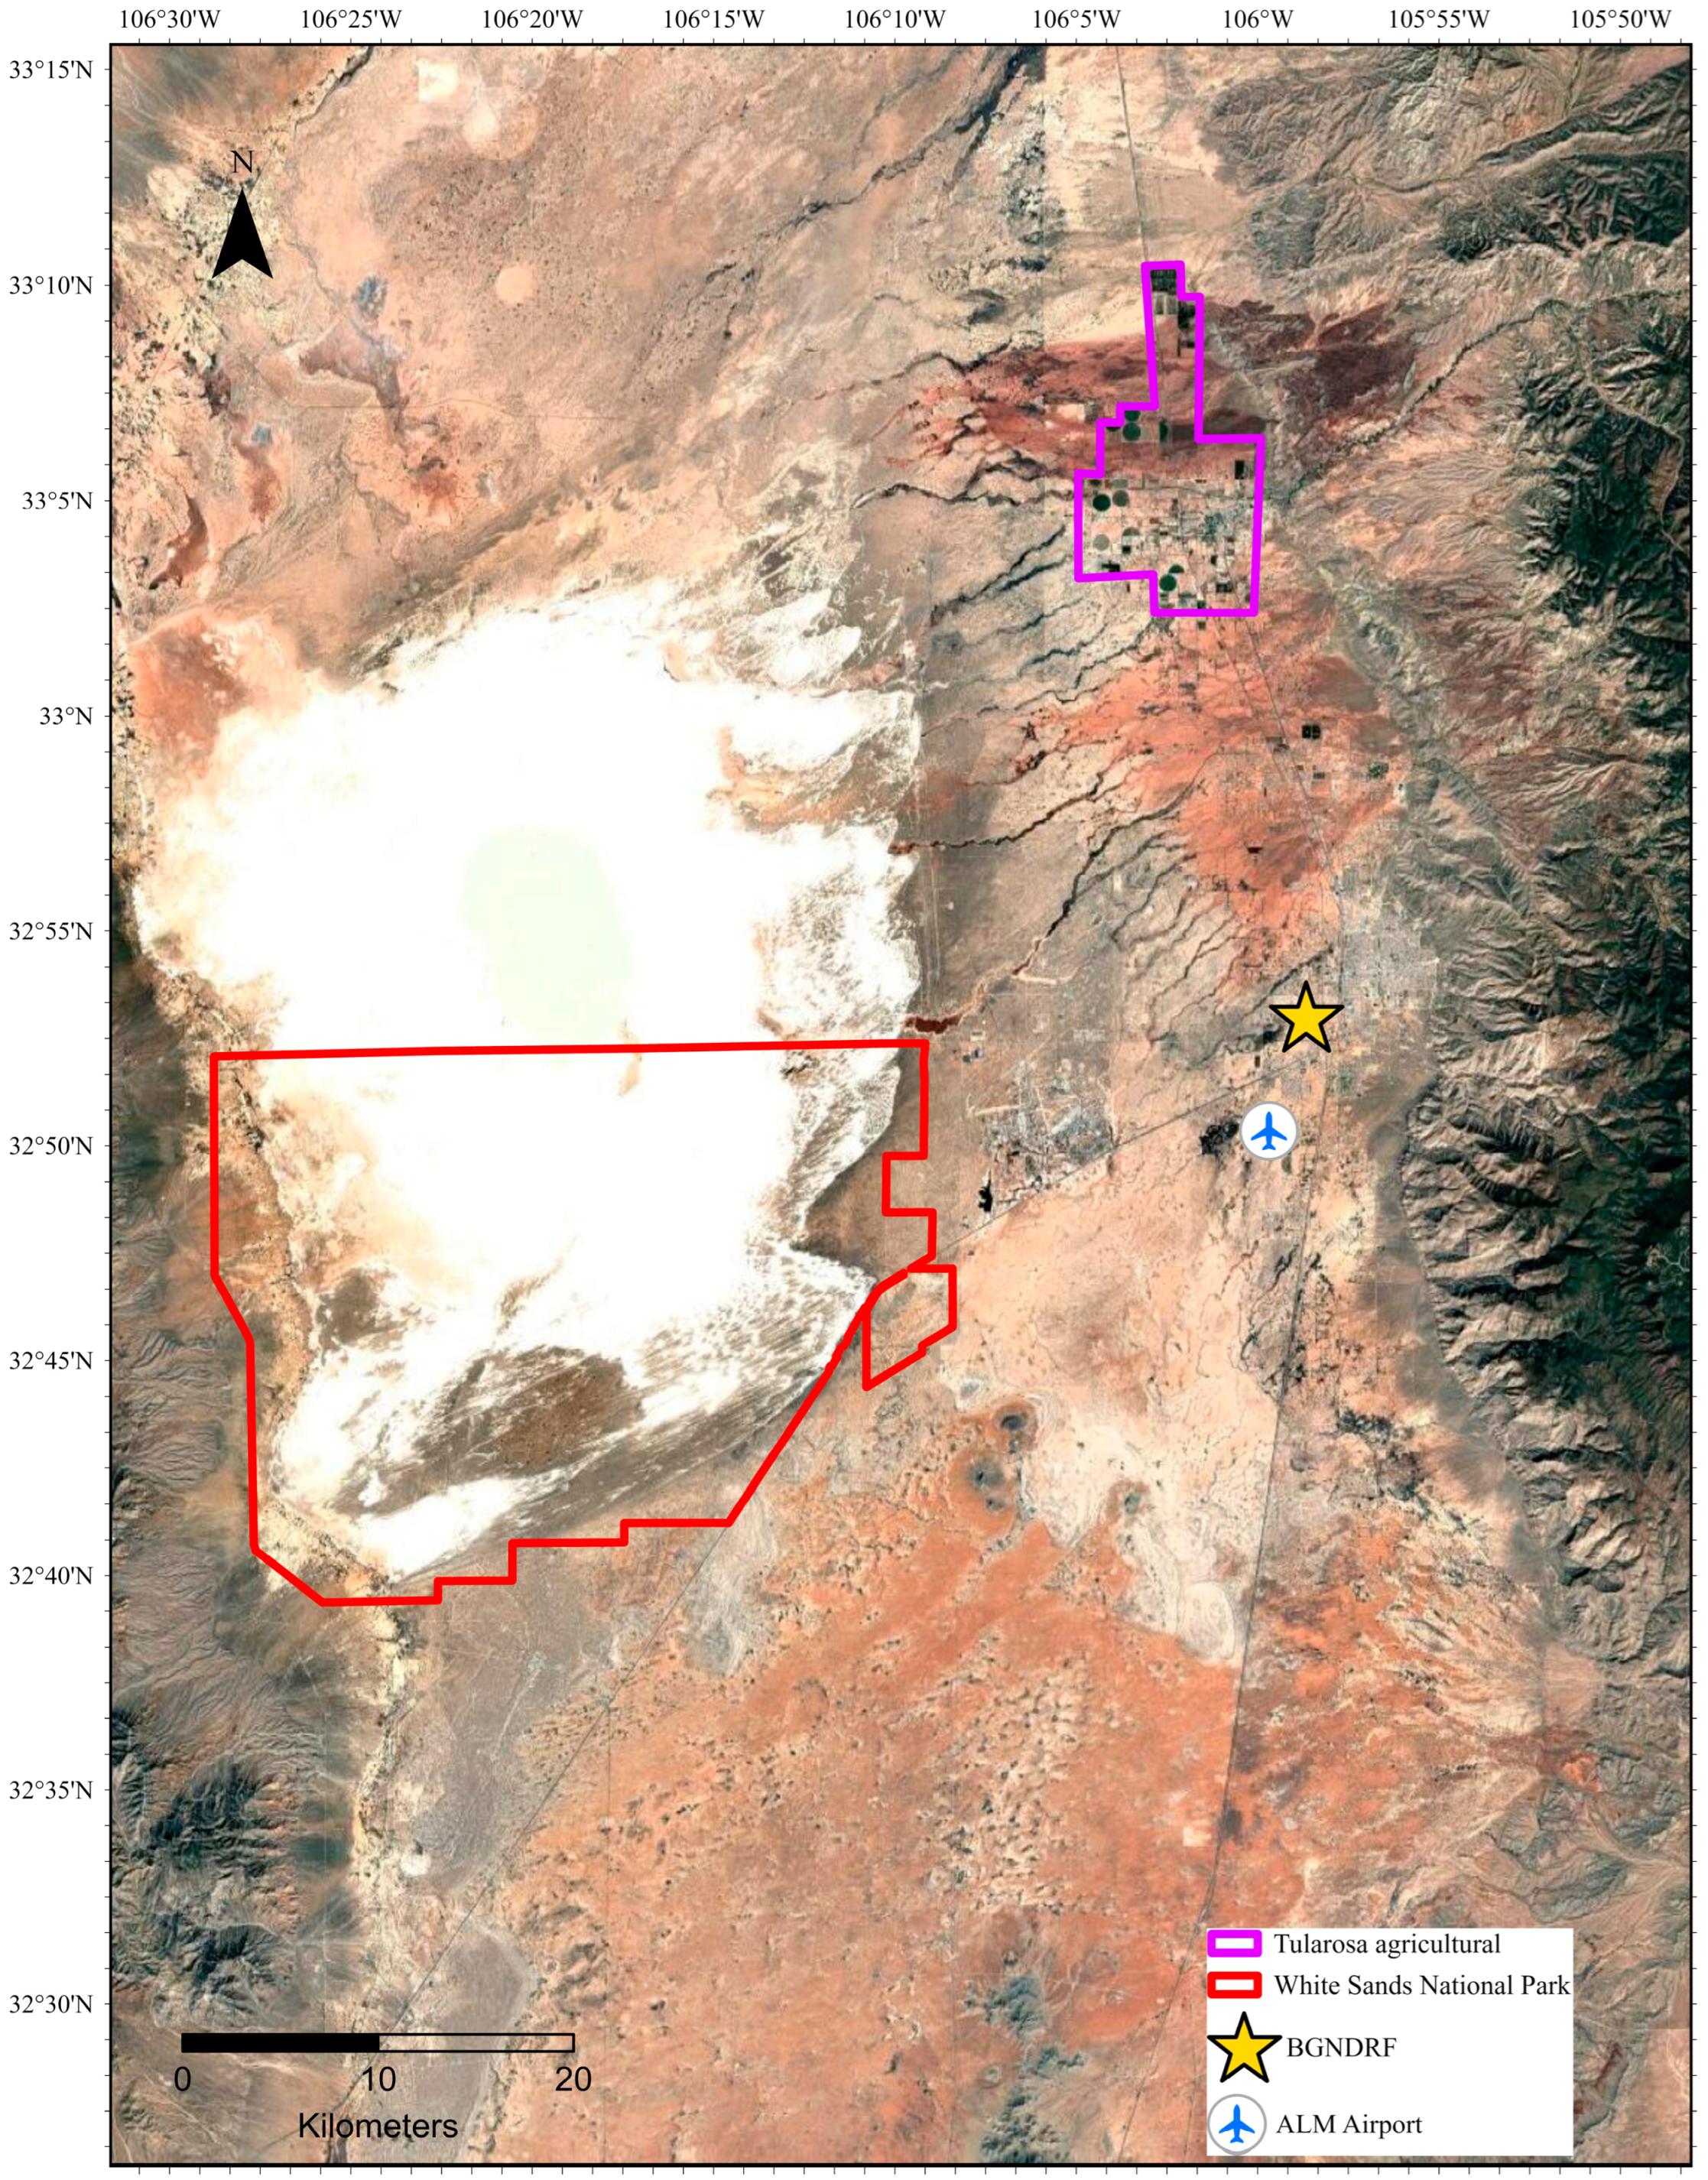
The geographical location of the BGNDRF site is close to two dust source areas shown in Figure 1. One of them is the quartz sand sheet in the northern Tularosa Basin [43] located ~20 km north of the site, which has been widely disturbed due to agricultural use and thus made more vulnerable to dust emission. In the Chihuahuan Desert, agricultural lands have been identified as recurrent dust-producing sites with more than 23% of the total dust sources [16]. The other dust source is the White Sands dune field in the southern Tularosa Basin [44], ~20 km south–southwest of the BGNDRF. The White Sands dune field, including the White Sands National Park, is the largest gypsum (CaSO4 ·2H2O) dunefield on Earth, with a surface area of 712 km2 [45]. It has been identified as a location of persistent dust emissions [46,47] and one of the sites of most enhanced dust activity in North America [48], with a frequency of elevated dust signals observed on more than 5% of the days [38]. White Sands dust is unique compositionally due to its gypsum content [46]. Therefore, this location (the BGNDRF in Alamogordo) provides a unique natural laboratory to investigate the effects of dust deposition, representing different dust sources with different compositions, including gypsum, with respect to the soiling of photovoltaic systems.
Figure 1.
Map (created with ArcGIS Pro 3.3 software) showing the BGNDRF measuring site at Alamogordo (marked with a yellow star), the White Sands dune field (white area on the left) including White Sands National Park (outlined in red), and the Tularosa agricultural area (outlined in purple), located approximately 20 km to the west–southwest and 20 km to the north of the BGNDRF site.
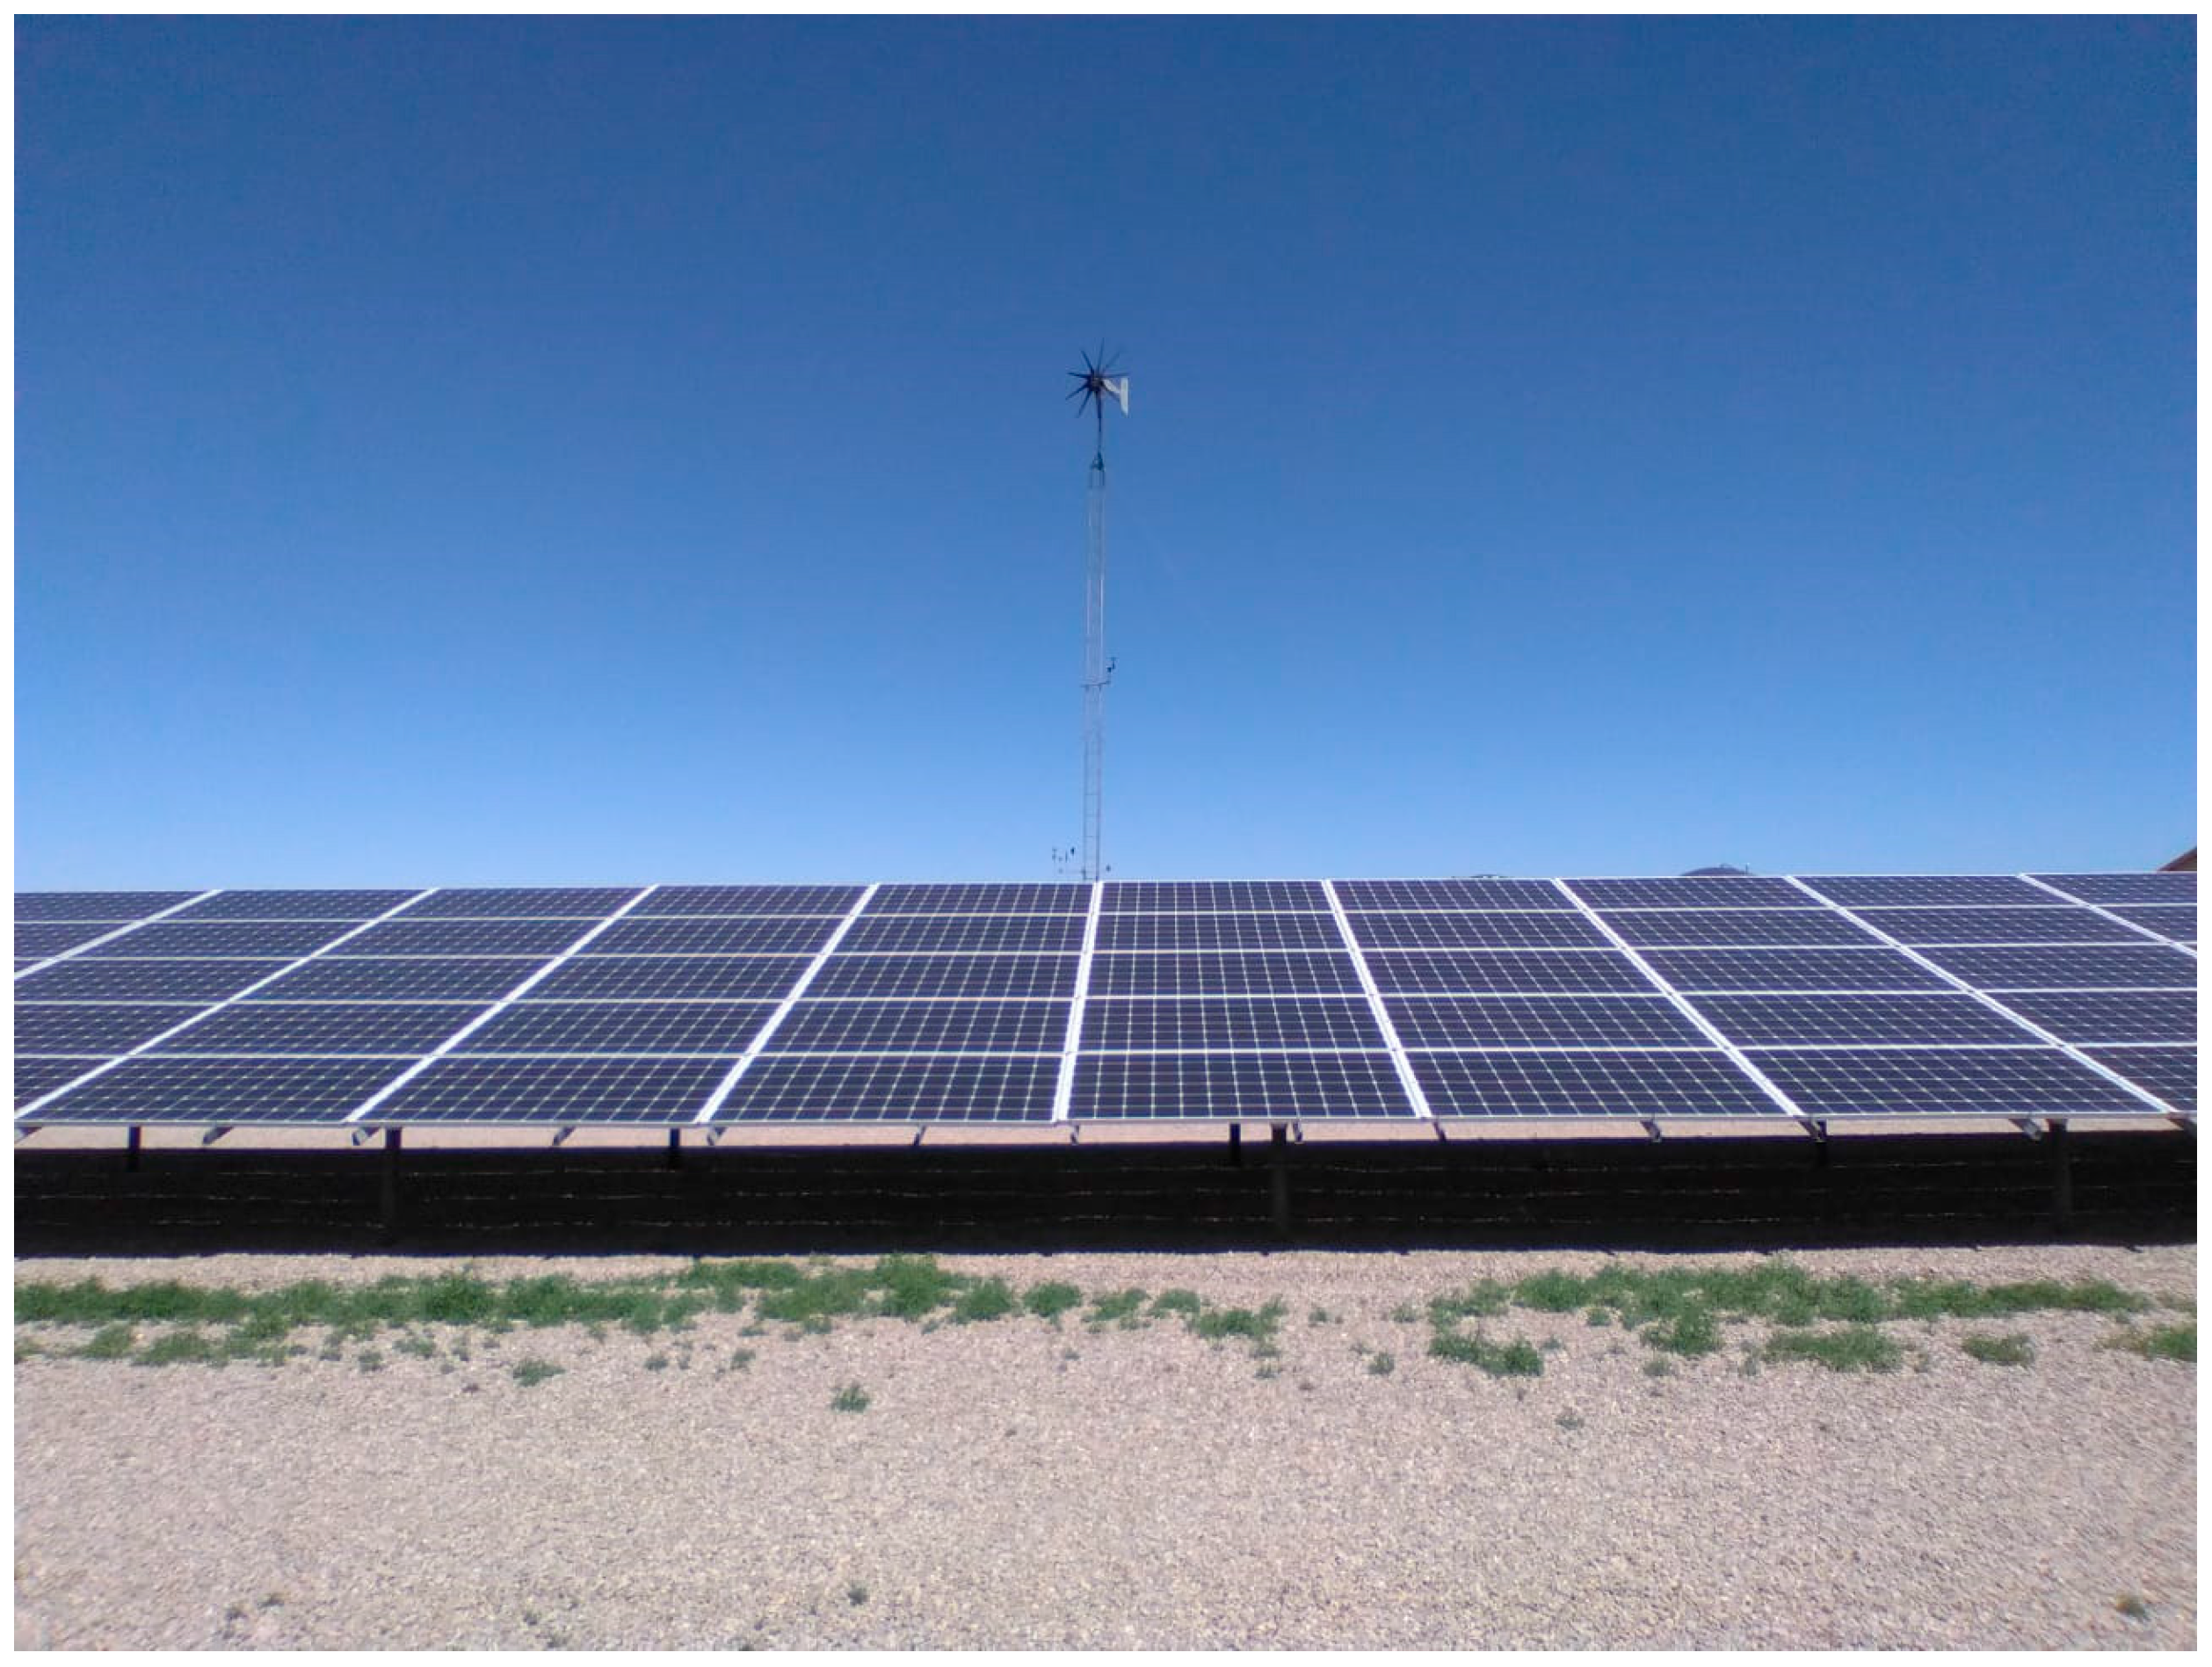
The BGNDRF site (Figure 2) gets up to ~80% of its energy from a rig of full-size (1993 mm × 1001 mm) 345 Wp monocrystalline Silicon photovoltaic modules (SW 345 XL mono from Solar World (Hillsboro, OR, USA)) with a peak efficiency of 17.3%. Table 1 summarizes the electrical specifications of the PV modules installed. Six of these panels (three series of two, named A-1, A-2, and A-3) were used for the experiment. These are positioned 0.35 m above ground level at an angle of facing due south.
Figure 2.
Front view of the Brackish Groundwater National Desalination Research Facility photovoltaic installation, approximately 13 m from left to right.
Table 1.
Specifications of the monocrystalline photovoltaic panels at standard test conditions (STC) (1000 W/m2, 25 °C, AM 1.5) according to the manufacturer (Solar World, Bonn, Germany).
3. Materials and Methods
3.1. Sampling of Soiling
Collection of soiling material (dust and sand) was carried out directly from the top surface of the PV modules, as multiple studies have indicated that the particle size distribution of material soiling PV panels differs from that of dust collected from the ground or airborne samples [49,50]. To obtain the samples, two methods (dry and wet) were employed: The wet approach involved cleaning the PV panel’s surface from top to bottom using a clean, soft, non-abrasive sponge soaked in distilled water. The sponge was re-immersed in distilled water, and the process was repeated until the panel appeared clean (Figure 3). After that, the soiled water was carefully collected and preserved in a clean plastic bag for analysis. The dry method consisted of the use of a squeegee and a brush to scrape the dust and sand into a plastic bag [51,52]. In addition to the wet and dry methods, two marble dust collectors (MDCOs) [14] for collecting ambient falling dust or sand were deployed close to the PV panels from 5 April 2024 to 31 May 2024, one at ground level and the other at a height of ~3.5 m. Also, two soil samples from the site (A and B) were obtained from the top 10 cm of the soil near the photovoltaic panels to determine if the composition of the materials soiling the panels was similar to that of the local topsoil.
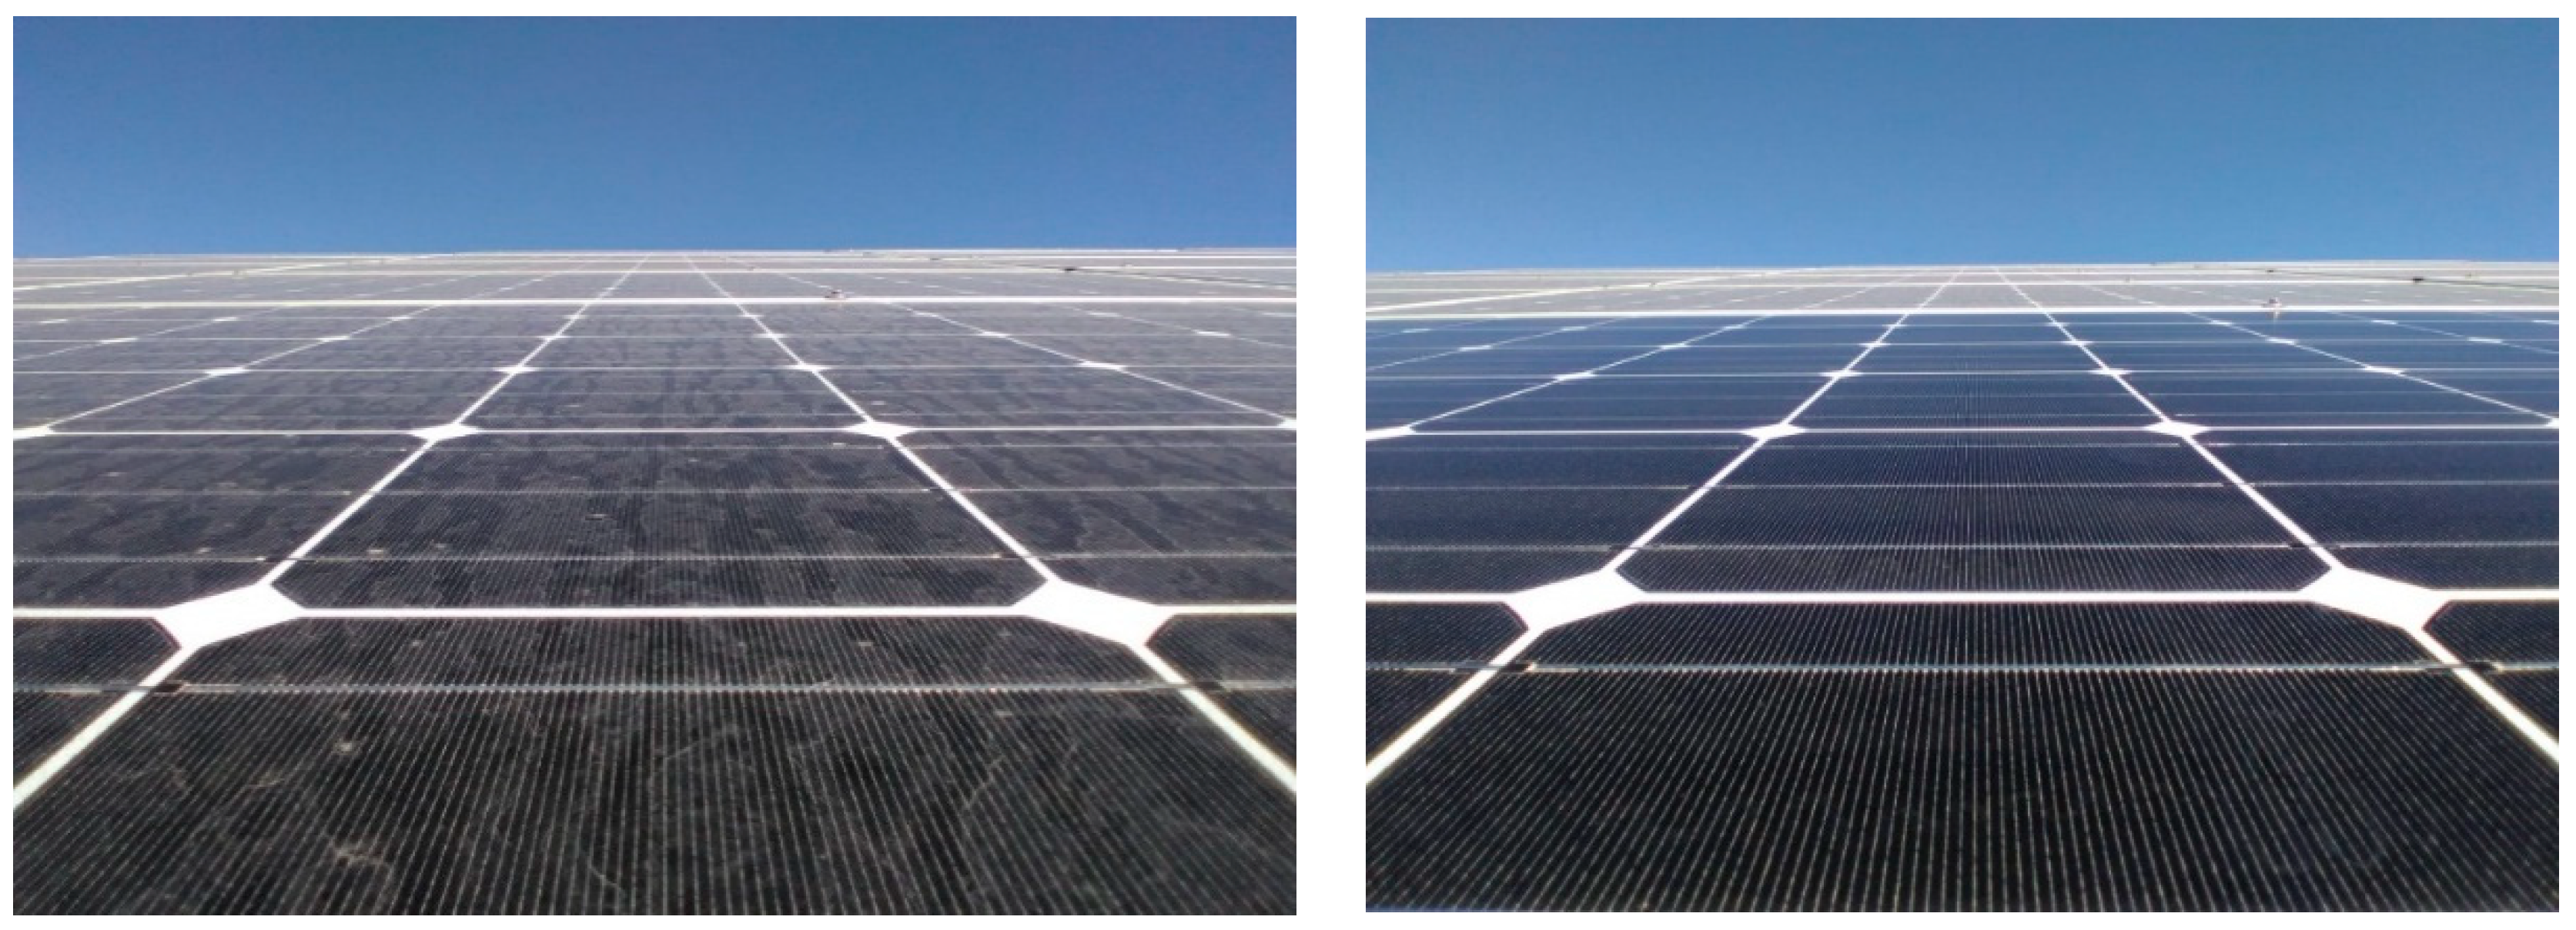
Figure 3.
Close view of a solar cell module (each cell is approximately 16 cm × 16 cm) prior to cleaning (left) and after cleaning (right).
The sampling of accumulated dust/sand on the PV modules using the wet method was focused on two periods: from 28 October to 23 November 2022 (fall) and from 1 February to 12 April 2023 (spring). The set of panels used as a reference (A-1) had soiling removed every two weeks; the second set of panels (A-2) had soiling removed every four weeks, and the last set of panels (A-3) was left uncleaned for the duration of each period. The samples obtained from the A-1 and A-2 PV modules during the same dates were combined into a single sample to ensure sufficient material for mineral and particle size analyses. Conversely, the dry samples were collected during the spring of 2024 (spring-dry) with sampling intervals of four weeks from 4 April 2024 to 31 May 2024. Four samples (AL-1, AL-2, AL-3, and AL-4) were collected from randomly picked PV modules. The main purpose of collecting soiling material during the spring-dry period was to compare the mineral composition and particle size distribution between the dry (spring-dry) and wet samples (fall and spring). The exact duration of soiling accumulation on the initial collection dates of each period was unknown. To make a rough estimate of how long dust/sand had accumulated, precipitation data for Alamogordo airport were analyzed. Days with rain accumulation > 2 mm were used as an estimate of the start of accumulation.
The plastic bags containing the soiled water were taken to the University of Texas at El Paso (UTEP) Arid Environments Laboratory, where a 1/8 HP Gast (Benton Harbor, MI, USA) DOA-P704 high-capacity vacuum pump was used to filter the soiled water through a 55 mm paper filter and to collect the material. After each sample was collected, it was then dehydrated, weighed using an Ohaus (Parsippany, NJ, USA) Pioneer precision electronic balance, and stored in a glass container for subsequent chemical analysis
3.2. Soiling Chemical and Physical Characterization
Dust and sand size and chemical composition play an important role in the soiling of and adhesion to the surface of photovoltaic modules [53]. The mineral composition was obtained by performing Powder X-Ray Diffraction (PXRD) analysis. The equipment utilized was an Empyrean 2 (Malvern Panalytical Ltd., Worcestershire, UK) x-ray diffractometer using Cu Kα radiation (λ = 1.54059 Å) at 45 kV and 40 mA. Before the analysis, the dried samples were pulverized using a synthetic corundum mortar and pestle to obtain a fine consistency. Then, the samples were treated with ethylene glycol following the recommendations of Poppe et al. [54] for clay mineral dispersion. For the analysis, samples were scanned using the continuous mode from 5 to 90° for 2θ (goniometer mode; both source and detector were moved the same amount each step simultaneously). Then, the collected patterns were processed, and phases were identified with the HighScore Plus software version 5.3a and the powder diffraction file (PDF-5+) database.
The particle sizing of the soiling samples was performed with a Malvern-Panalytical Mastersizer 3000 laser diffraction particle sizer (Malvern Panalytical Ltd., Worcestershire, UK) using the wet sample dispersion mode. To avoid particle clumping, we followed the recommendations of Sperazza et al. [55]. For this, before conducting the particle size analysis, the sediment samples were prepared with 20 mL of a 50 g/L sodium hexametaphosphate (Na6P6O18, “Calgon”) solution; approximately 0.1 g of the sample was used per analysis. Then, the samples were placed in a shaker overnight (more than 12 h), and ultrasonic waves were generated during the analysis to ensure better dispersion of individual particles [55]. Finally, the data was analyzed using the built-in software of the particle size analyzer.
3.3. Identification of Dust Events and Meteorological Parameters
Since there was no meteorological station at the BGNDRF, in order to identify dust events, we retrieved data from a nearby weather station from the Iowa Environmental Mesonet (https://mesonet.agron.iastate.edu/request/download.phtml (accessed on 6 August 2025)). Meteorological data were obtained from Meteorological Aerodrome Reports (METARs) at the Alamogordo White Sands Regional Airport (International Air Transport Association airport code ALM), situated approximately 6 km southwest of the BGNDRF site (Figure 1). The meteorological parameters obtained included wind speed, wind gust, wind direction, relative humidity, precipitation, temperature, dew point, cloud height, visibility, and “present weather codes” at 1 h resolution. We identified dust events based on the methodology of Kelley & Ardon-Dryer [56] and Robinson & Ardon-Dryer [57]; the METAR “present weather codes”, specifically BLDU (blowing dust), DU (widespread dust), DS (dust storm), HZ (haze), SS (sandstorm), and VCBLDU (vicinity blowing dust), were used, as these contain information regarding any phenomena that could indicate dust events. In addition, observations in which the HZ code appeared were filtered further, looking for wind speeds exceeding 6 m s−1 and visibility below 10 km [57].
In addition, to investigate the regional airflow patterns and potential source–receptor relationships during days with dust events, back-trajectory analysis was performed using the HYSPLIT model (version 5.1) developed by the NOAA Air Resources Laboratory [58], in combination with the SplitR V0.4.0.9000 package in R V4.3.2 [59]. Trajectories were run for 24 h, with endpoint set at a height of 100 m above ground level, and they were initiated at the BGNDRF measuring site, with meteorological input data from the NCAR/NCEP global reanalysis dataset.
3.4. Calculations of Soiling Electrical Losses
To evaluate the electrical losses due to soiling, the performance of three PV modules, namely A-1 (reference module cleaned biweekly), A-2 (reference module cleaned monthly), and A-3 (soiled module), was assessed by recording their mean power output delivered between 11 AM and 1 PM (peak energy output). The reason for using the mean values during the aforementioned time window was to minimize the interference of unexpected weather conditions, such as passing clouds. Data recorded on days when cloud coverage exceeded 50% (METAR indicators of cloud coverage: BRK: broken clouds; OVC: overcast) were not considered for soiling loss calculations. No electrical data was gathered during the spring-dry period. The power soiling loss was calculated by comparing the values of the soiled module with respect to the cleaned modules according to the following equation [60]:
where Pclean is the power output of a regularly cleaned module, Psoiled is the power output of a soiled module, and soiling loss is the power attributed to dust and sand deposition. As demonstrated in previous studies, when comparing the power yield between a soiled and a clean reference panel exposed to identical weather conditions, the main factor impacting its performance is dust accumulation [32,60].
4. Results and Discussion
4.1. Sampling of PV Soiling
Table 2 outlines the amount of dust/sand collected and the corresponding dates for the fall, spring, and spring-dry periods. The fall period consisted of three sampling dates, the spring period included six sampling dates, and the spring-dry period included five sampling dates. A total of 1.3 g of material was collected during the fall period, while 2.3 g was collected during the spring sampling period, and 2.8 g was collected during the spring-dry period. The lesser amount collected during spring 2023 compared to the spring-dry period (2024) was attributed to multiple days of precipitation during 2023, such as the sampling date 15 February 2023, which received a combination of rain and sleet throughout the day, and hardly any dust was gathered during that sampling date. Rainfall on PV modules generally has a cleaning effect, which can lead to increased power generation compared to the day prior to the precipitation [61]. Still, more material was collected during the spring 2023 period than during fall 2022, most probably due to six dust events that occurred in the Alamogordo area in March 2023. Samples from the spring-dry period were collected on five sampling dates in spring 2024 using the dry method. During the five sampling dates of the period, additional PV modules were used for collection. As a result, these samples were used for characterizing the physical and chemical properties of the soiling material rather than for determining dust/sand deposition rate values and/or soiling losses. Finally, the sample named “AL-2” was collected on 25 April 2024 after a dust event impacted the BGNDRF site.
Table 2.
Mass of soiling material in grams of dust/sand sampled during multiple dates. Note that the samples collected during the fall and spring periods were obtained using the “wet” method, while the samples collected during the spring-dry period were obtained using the “dry” method.
4.2. Meteorology
4.2.1. Dust Event Occurrence and Trajectories
During the measurement periods, 22 dust events were observed at the BGNDRF site, according to the procedure described in Section 3.3. Of these, three occurred during the fall period, nine during spring, and ten during the spring-dry period. All dust events were associated with local surface winds from the southwest to south, consistent with the prevailing local path of windblown sediment emissions from White Sands [46], with wind speeds ranging from 6 m s−1 to 20 m s−1 (averaging ~12 m s−1) and with a maximum wind gust of 26.2 m s−1. During these events, visibility ranged from 1.2 to 9.6 km; therefore, the events observed in this study all would be classified as “blowing dust,” not “dust storm” (defined as having minimum visibility less than 1 km) [57].
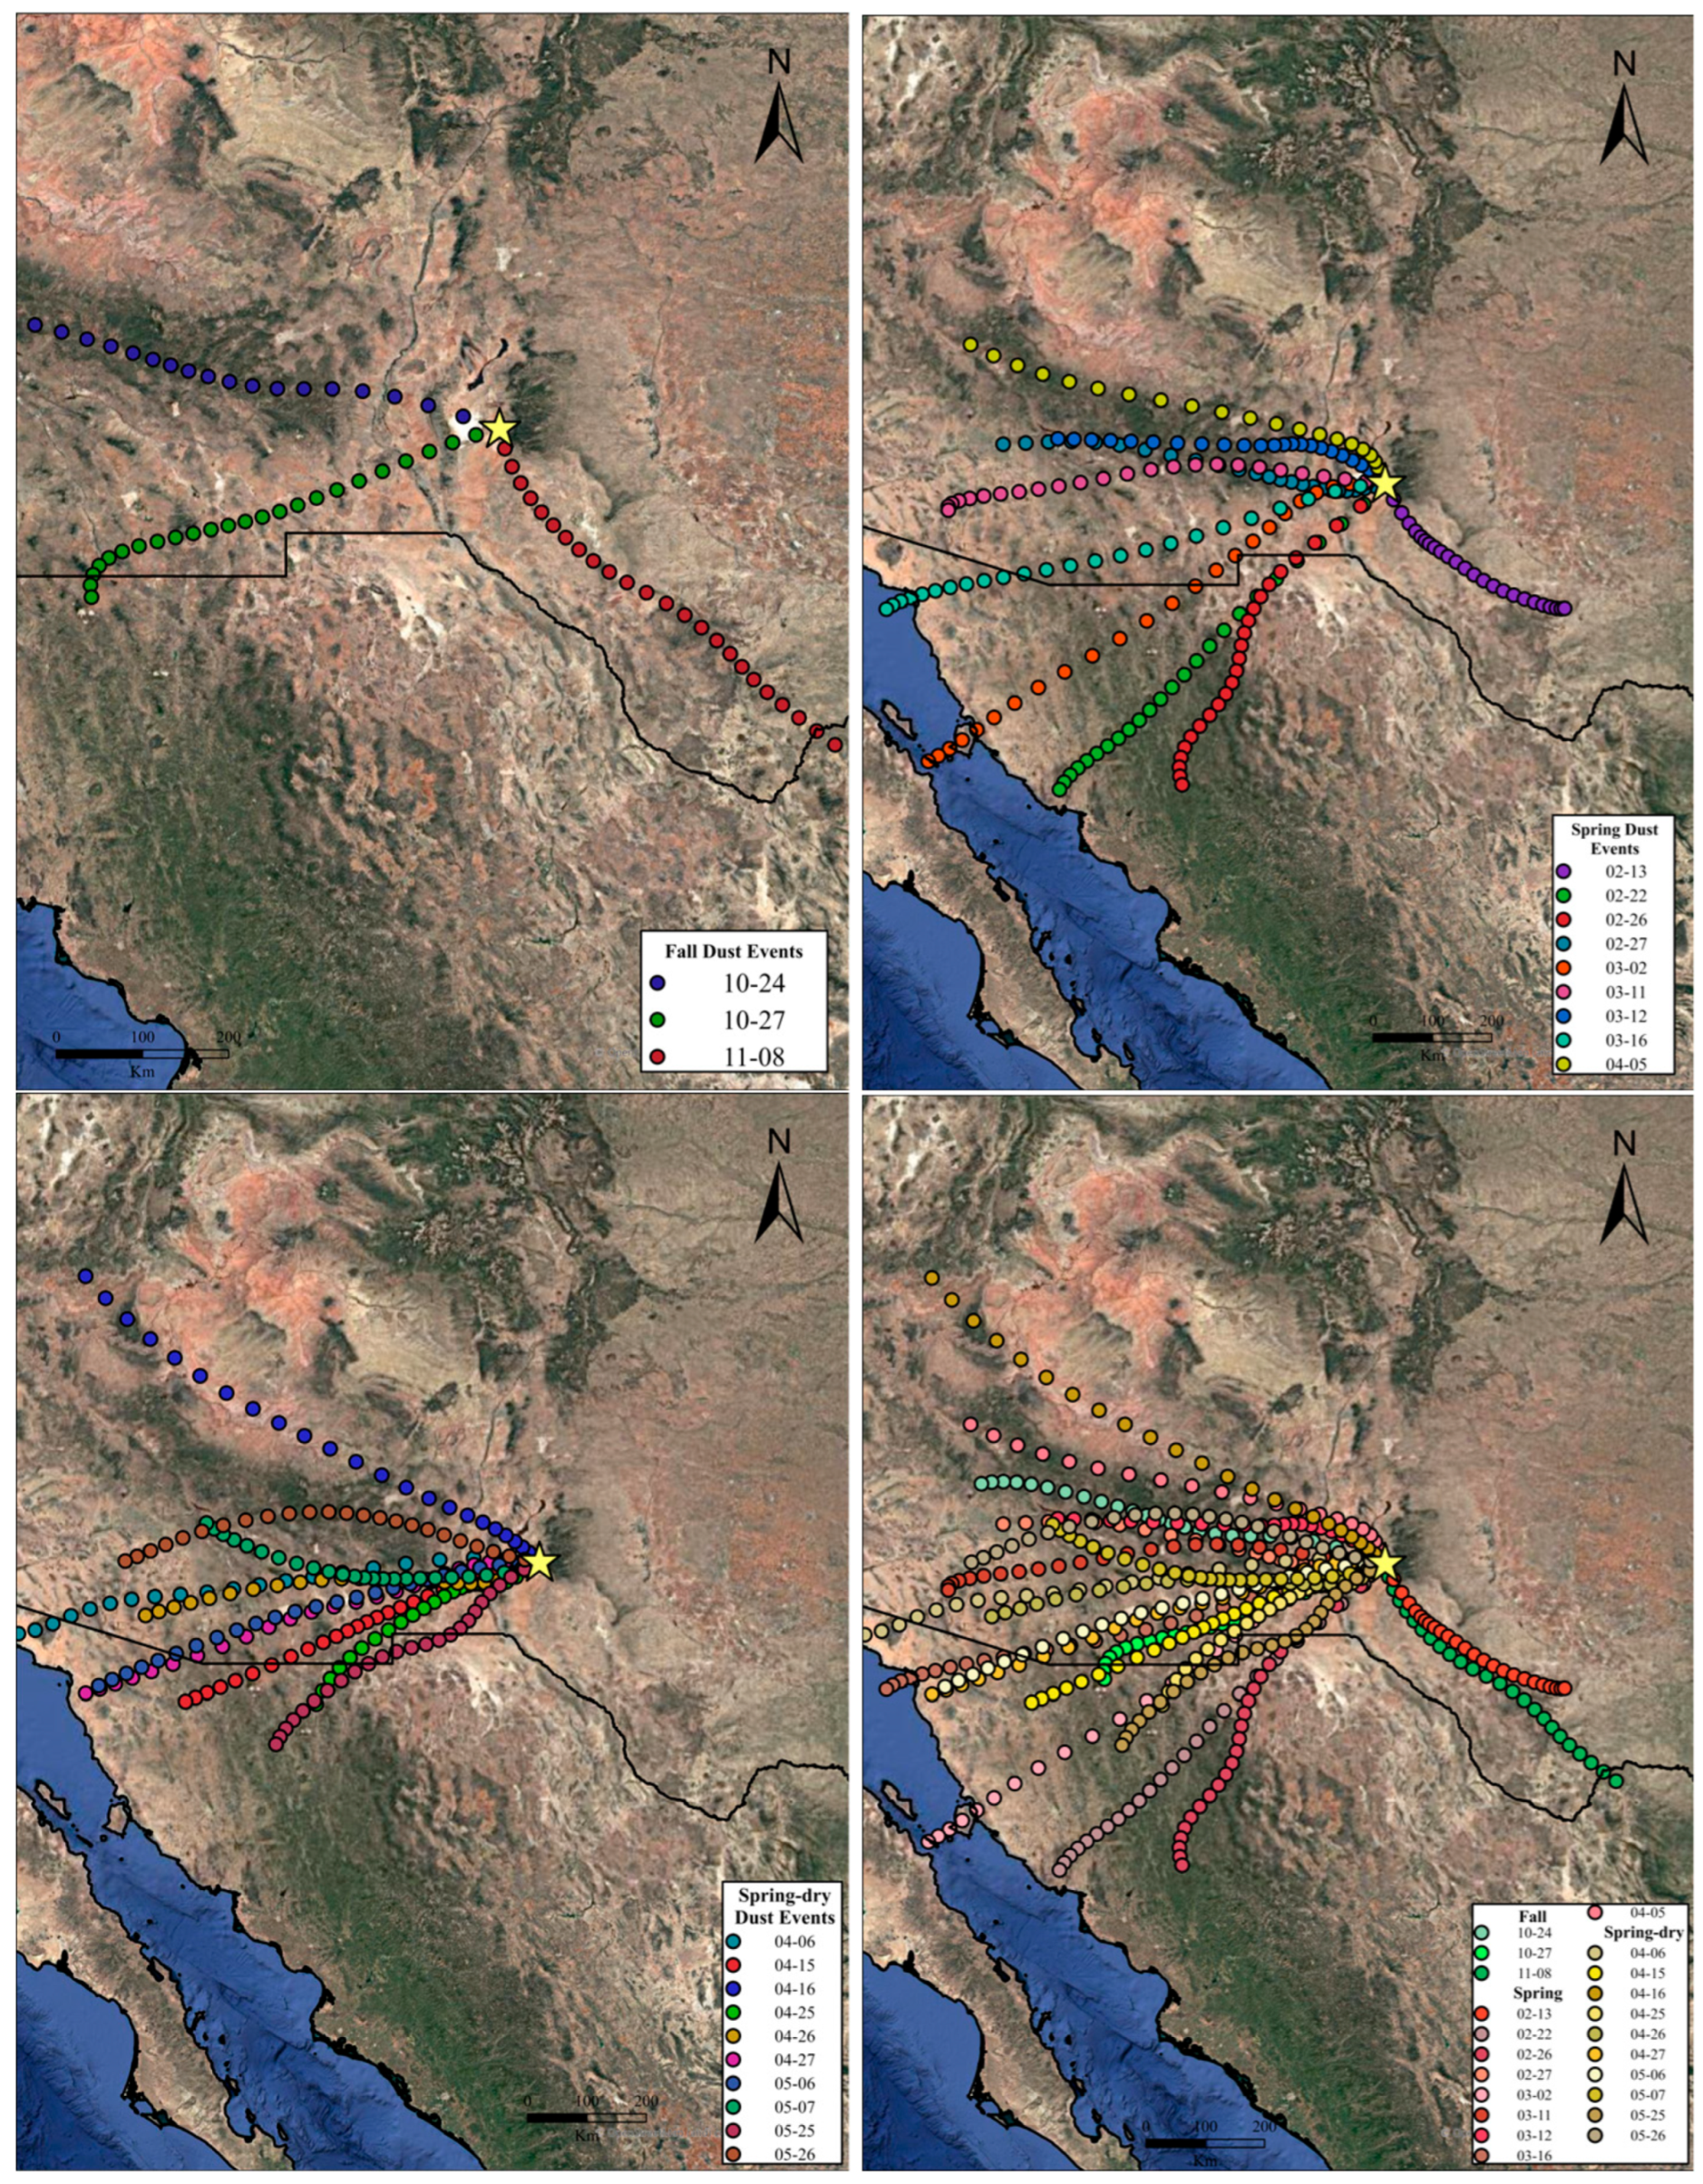
Figure 4 presents the HYSPLIT regional back-trajectories corresponding to the dates during which dust events were identified during each sampling period. Most events captured during this study were associated with regional airflow pathways originating from the west to southwest, which is the typical wind direction for dust events in the northern Chihuahuan Desert [16,35], including White Sands [46], and the back-trajectories are consistent with those of previous studies [40,62].
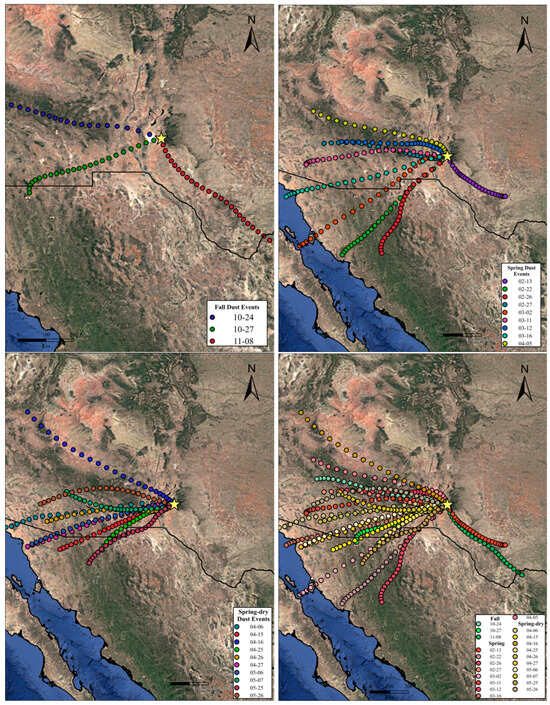
Figure 4.
HYSPLIT back-trajectories for dust event dates during the fall (upper left), spring (upper right), spring-dry (bottom left), and all three periods combined (bottom right), ending at 100 m above ground level at BGNDRF.
4.2.2. Wind Speed and Direction and Its Effect on Dust Accumulation
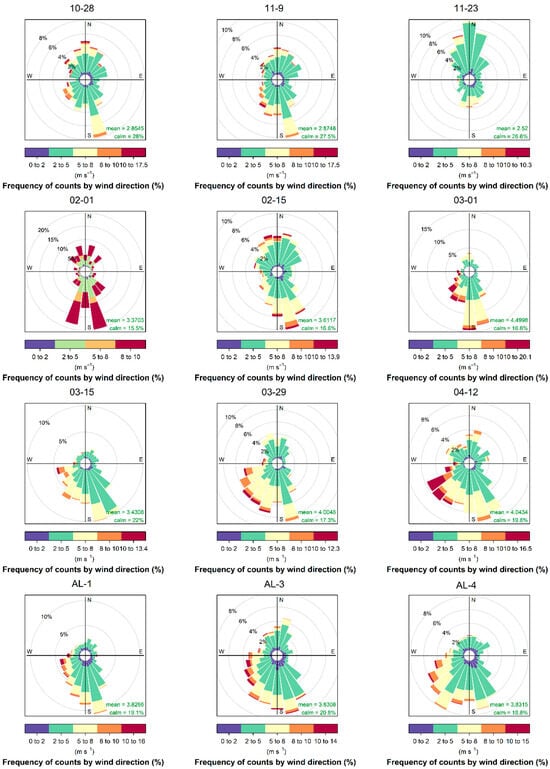
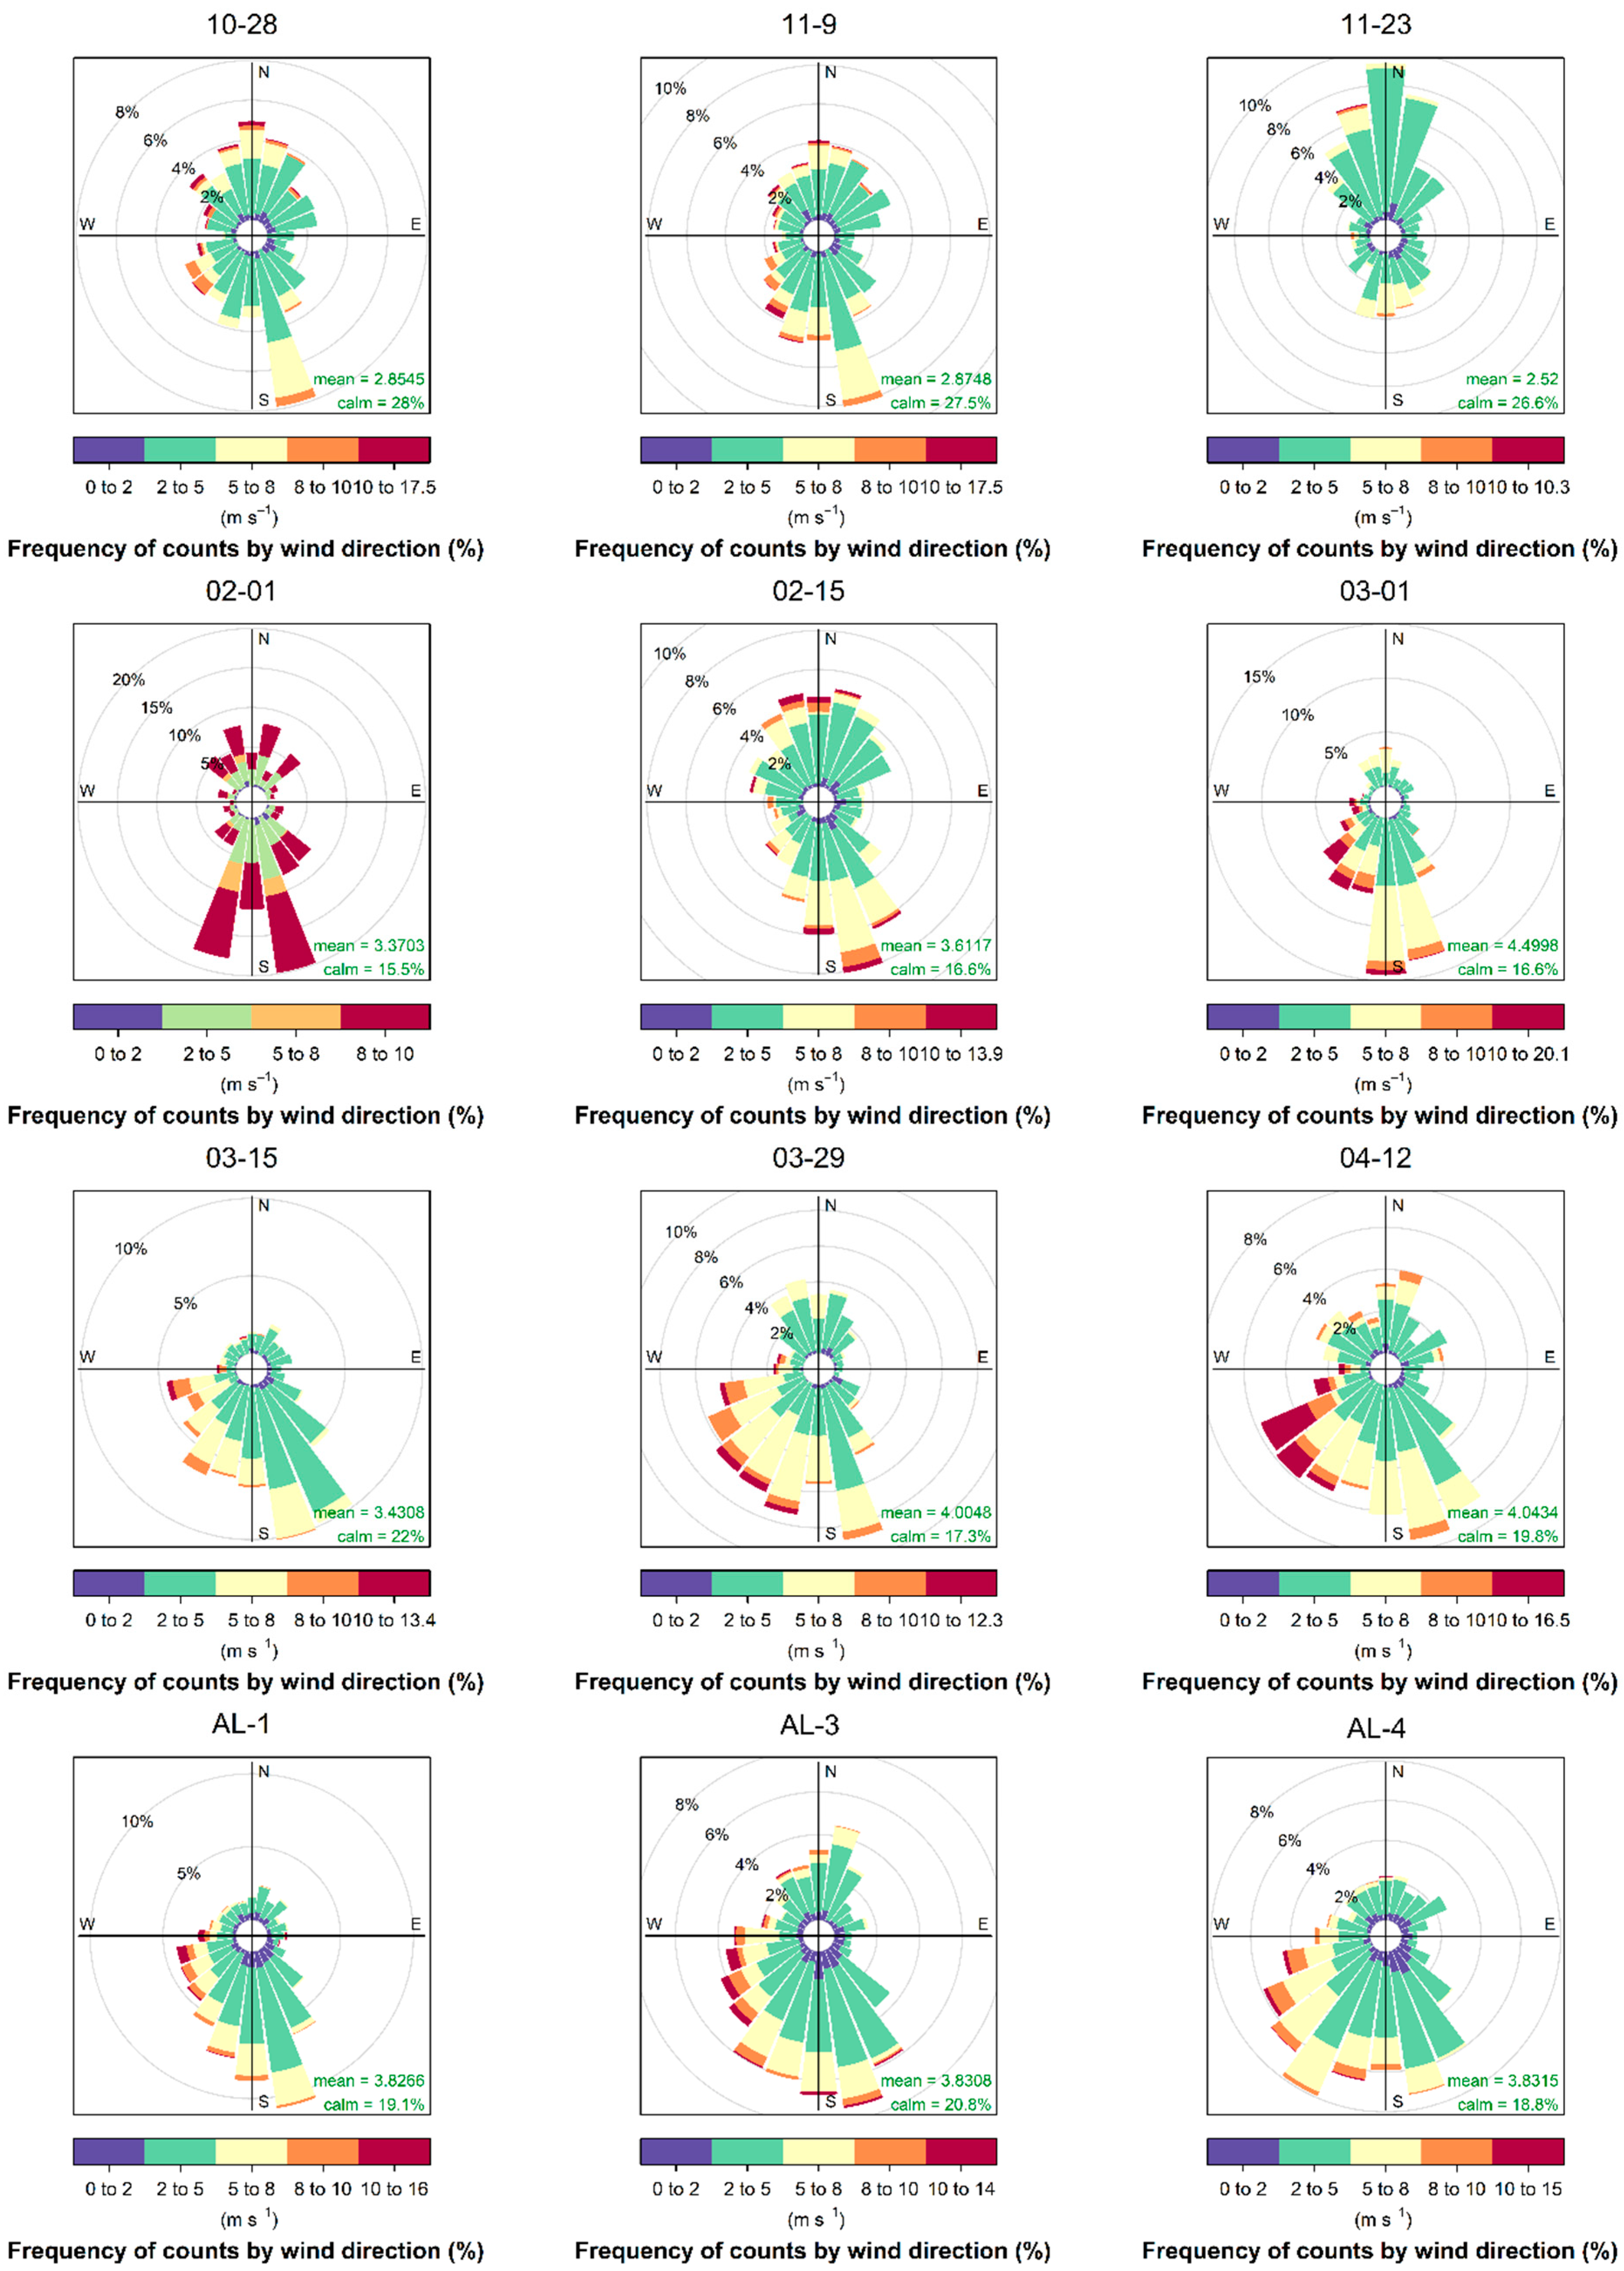
At the surface over each of the full sampling periods, wind showed seasonal prevailing directions for the Tularosa Basin (Figure 5), presenting a bimodal north and south pattern in fall and winter. In spring, winds predominantly blew from the south, with the strongest winds from the southwest.
Figure 5.
Wind rose plots for each sampling date during the fall, spring, and spring-dry periods.
Previous studies have demonstrated that wind direction (panels facing into the oncoming wind) and wind speed have a significant influence on the accumulation of soiling material [63,64]. For example, wind speeds below 4 ms−1 have been found to promote dust deposition on glass surfaces tilted between 20° and 40° [64], while wind speeds exceeding that threshold tend to increase dust removal and resuspension [63]. Moreover, wind gust has a stronger correlation with dust emission than wind speed [65]. Therefore, wind gusts may act as a cleaning agent by removing dust from the surface of the PV modules. Wind speed, wind gust, and wind direction probably contributed to the rates of dust/sand accumulation observed on the PV modules at this location. The dust/sand accumulation rate (DAR) was calculated based on the samples collected biweekly. During the fall period, DAR was 11.5 mg m−2 day−1, which was ~20% smaller than during the spring period (14.3 mg m−2 day−1). A clear difference in wind speed was observed between the fall and spring periods, with higher average wind speeds during the spring (3.9 m s−1) compared to fall (2.9 m s−1). The spring period encompasses the peak of the dust and wind event season in the Chihuahuan Desert [66,67]. During the spring period, higher overall dust accumulation rates were observed in comparison to the fall, likely due to a greater number of dust events (nine vs. three) and the higher average wind speed.
During days when dust events occurred, the prevailing wind direction was predominantly from the south to southwest (Figure 5). Although winds arriving at the study site would have crossed the White Sands dust source, that orientation (between south and southwest) also would allow the wind to hit the front surface of the panels directly, promoting the removal and resuspension of accumulated soiling material. Several studies have reported reduced dust accumulations when the wind direction faces the front of the PV modules [64,68]. The higher average wind speeds and frequent strong winds facing into the modules during the spring period may have removed more of the deposited material than during the less windy fall period, even though the DAR remained higher in spring.
The DAR values on the PV modules of 11.5 mg m−2 day−1 for the fall period and 14.3 mg m−2 day−1 for the spring period are relatively low when compared with values of dust accumulation on PV panels in other global locations, which can be at least an order of magnitude higher [49]. At Alamogordo, the orientation of the PV modules with respect to the prevailing wind direction and relatively high wind speeds and gusts during dust events may have reduced the effective amounts of soiling. However, additional studies are necessary at this location, as this study concluded before the end of the dry windy season, missing dust events from April to May and also missing dust events during the North American monsoon season from June to September [42], which have been characterized as having higher particulate matter (PM) concentrations within events rather than dust events during the dust peak season [62]. For instance, during the spring-dry period, which covered April and May of 2024, for which DARs were not recorded, a total of 11 dust events occurred.
4.3. Dust Properties
4.3.1. Mineral Composition
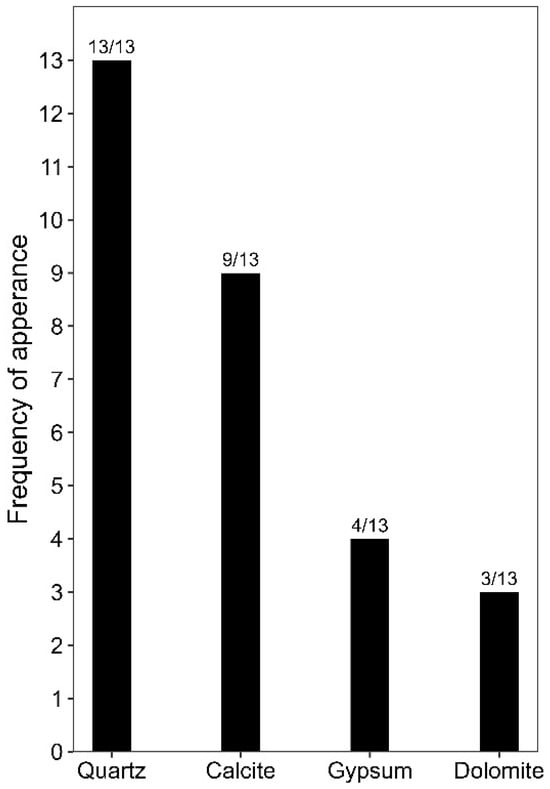
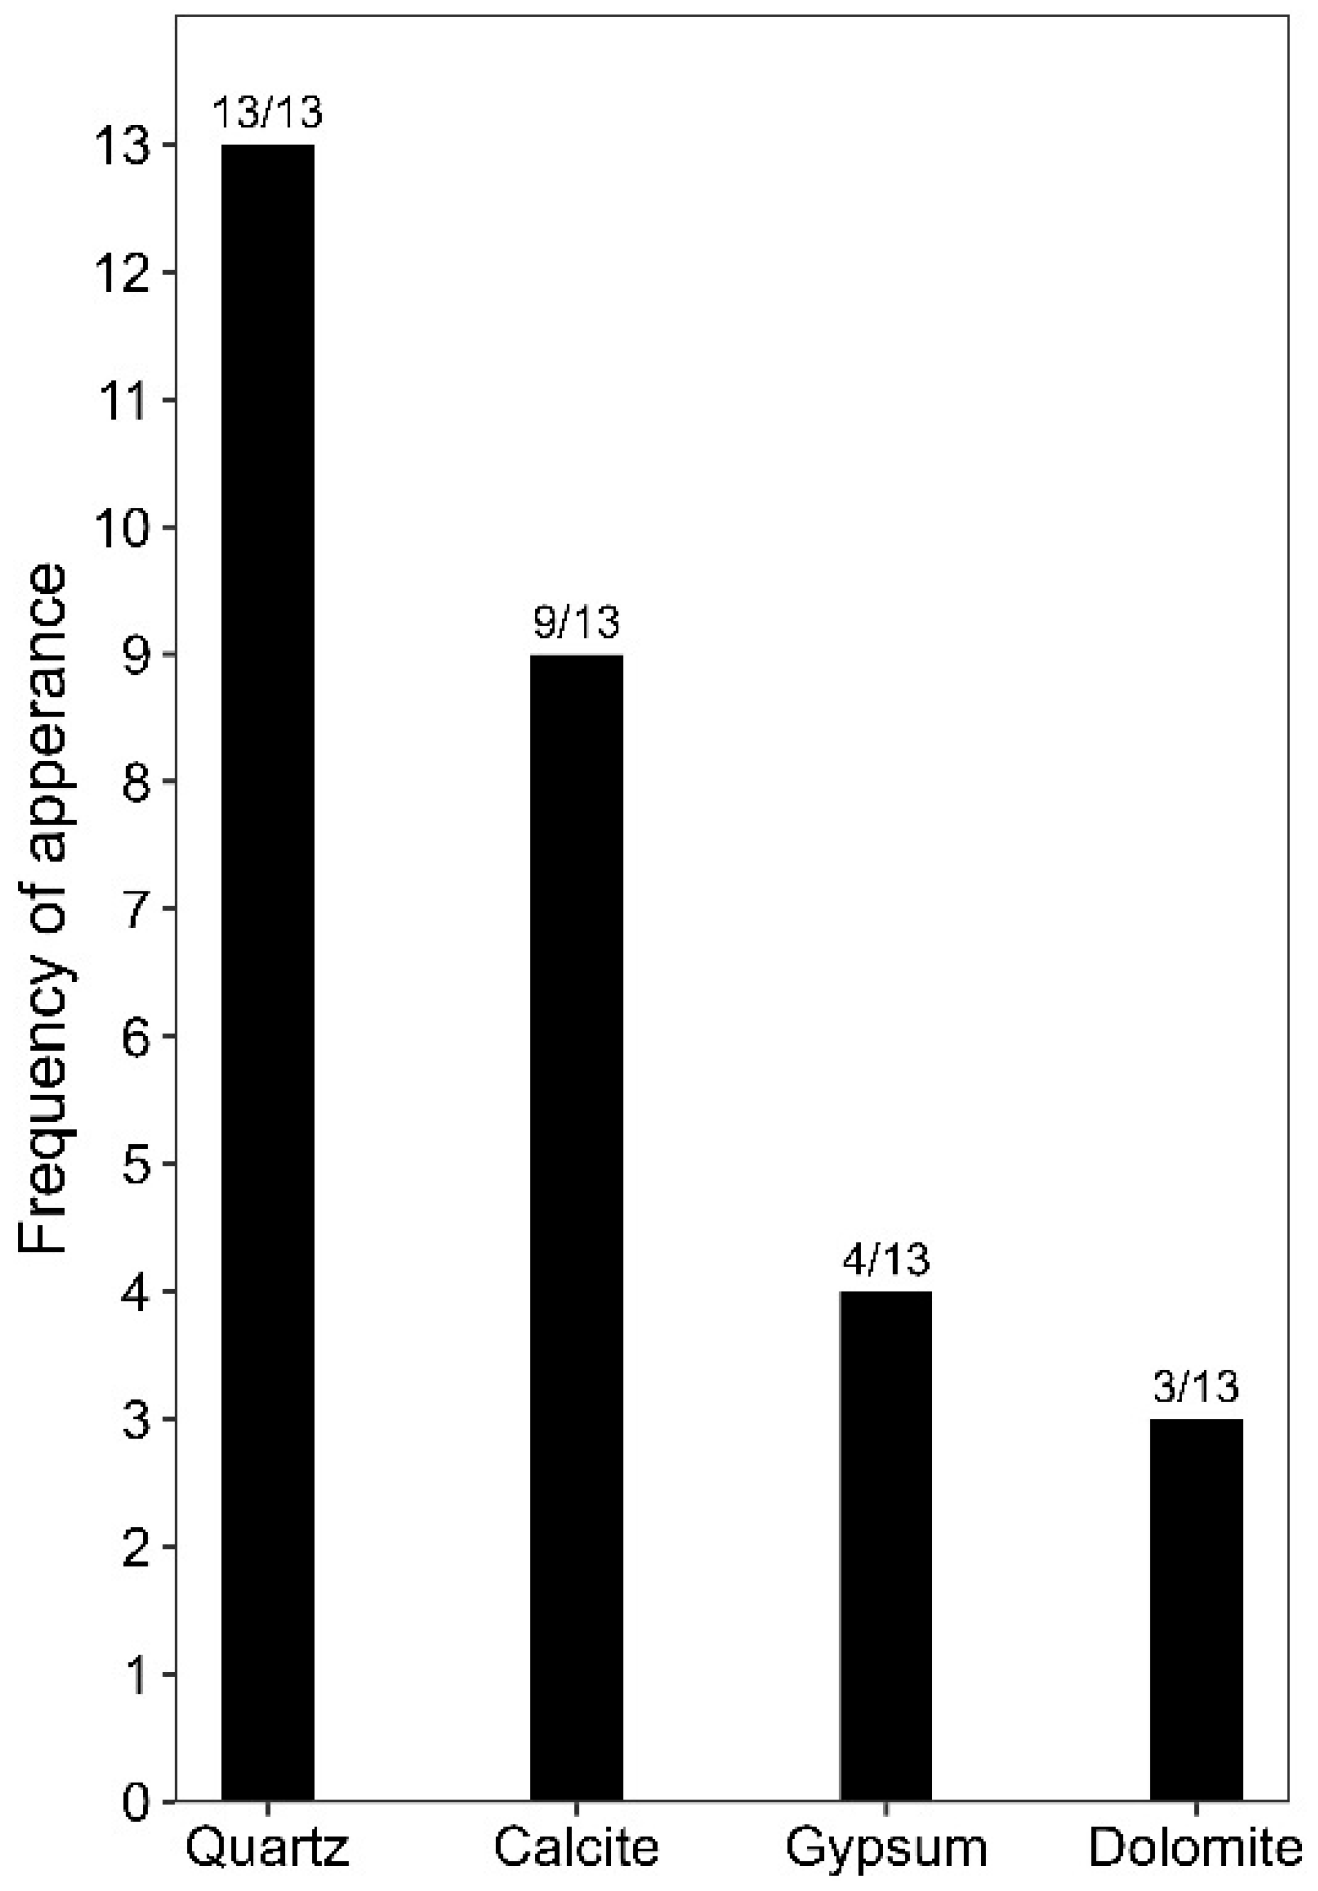
The results from the PXRD analysis on 13 samples indicated that quartz (SiO2) and calcite (CaCO3) were the dominant minerals in most of the material accumulated on the PV modules, comprising more than 80% of the mineral mass. Three of these samples also contained dolomite (CaMg(CO3)2), and four contained gypsum (CaSO4·2H2O) (see Figure 6). Analyses of local soil samples A and B (collected adjacent to the PV installation) revealed approximately 48.5% quartz, 39% calcite, and 12% dolomite. Despite using a standard procedure for the identification of clay minerals, no clay minerals were detected in any of the samples analyzed. Quartz and calcite are typical constituents of Chihuahuan Desert windblown dust and sand and their source soils [40,69]. Dolomite in the soil and dust is likely derived from weathering of exposed rocks on the western escarpment of the Sacramento Mountains [70] and in the San Andres formation [71] east and west of the BGNDRF and/or from wind-transported sediments of some parts of the White Sands to the northwest [72,73]. However, in previous studies of deposited dust and sand at UTEP, El Paso, Texas, 144 km south of the BGNDRF site, dolomite was not found, gypsum was rare [39,40], and calcite appeared ~3.5 times more in the samples collected from the PV panels at Alamogordo than it was reported at El Paso [40]. These data suggest that the mineral composition of aeolian-deposited dust or sand, and thus the composition of soiling on PV modules at the BGNDRF, is different from that at other sites in the Chihuahuan Desert. The presence of gypsum in some of the samples at BGNDRF was expected due to the proximity of the White Sands, which is well known for being a source of blowing gypsum dust [35,46,72]. Nevertheless, gypsum was only present in the samples that were obtained using the dry method, suggesting that the wet method employed during the collection over the fall and spring periods caused the dissolution and subsequent loss of this mineral due to its partial solubility in water. Therefore, we caution the reader that the methodological difference, specifically the resulting dissolution of gypsum, confounds the interpretation of actual seasonal variations, and the mineral composition data from Fall 2022/Spring 2023 are not directly comparable with those from Spring 2024 for seasonal analysis.
Figure 6.
Mineral composition of 13 dust samples collected from the PV panels during the fall, spring, and spring-dry periods expressed according to their frequency of appearance in all samples.
Thus, similarly to the findings of Javed et al. in Qatar [49], the soiling accumulated on photovoltaic panels in Alamogordo appears to have been primarily derived from local soils. Minerals in the soiling collected from PV modules at the BGNRF site have some similarities (dominated by quartz) and some differences (presence of gypsum and dolomite) compared to the typical mineral composition of locally generated dust worldwide [74]. Windblown sediment at the BGNRF is particularly influenced by the nearby White Sands, as indicated by the high gypsum content in samples collected using the dry method, ranging from 23% to 49% (Table 3). This differentiates them from the typical mineral composition of other dust deposition samples in the Chihuahuan Desert, which mainly contain quartz, feldspars, and calcite [40]. Moreover, Rodriguez Ortiz et al. [62] reported that gypsum dust from White Sands has lower light absorption and higher scattering properties compared to dust from other sources within the Chihuahuan Desert. This may suggest that dust with high concentrations of gypsum, such as at Alamogordo and other sites downwind of gypsum deposits, could have a reduced impact on PV performance due to its optical properties.
Table 3.
Mineral composition of soiling material samples collected during periods S1 to S3, along with the average wind speed, wind direction, and soiling ratio (1—soiling loss), and maximum wind gusts over the two weeks prior to each sampling date.
An interesting trend is observed in Table 3. During the fall period, quartz was the dominant mineral found in the soiling material with concentrations above 76%. An exception was observed on sampling date 10–28, which had similar concentrations of quartz and calcite and additionally contained dolomite. A possible reason is that it was the first sampling date conducted at the beginning of the period, representing materials deposited from multiple prior events; thus, we are uncertain how long the soiling remained settled on the surface of the PV modules before sampling. Following the procedure described in Section 3.1, the 10–28 sample is suggested to have accumulated for about 19 days. Moreover, four days prior to collection and the day before (24 October 2022 and 27 October 2022), two short-duration (less than an hour) dust events were recorded with surface winds blowing from the north–northwest (330° and 350° direction). This could suggest that the quartz deposited during the fall period (fall season) may have originated from the agricultural sands to the north in the Tularosa Basin. Nevertheless, HYSPLIT back-trajectories (Figure 4) indicated that the air masses on those dates originated from the west and southwest, suggesting the White Sands dunes as a potential source. Thus, the source influence on the composition of the samples collected during the fall period is not clear.
On the other hand, during the spring season of 2023, calcite was the most dominant mineral found in the samples, with concentrations as high as 62%. This may be explained by the shift in direction of strong, dust-raising winds. For instance, the sample from 02–01 contained almost equal proportions of quartz and calcite. In the days prior to sampling, a high frequency of winds blowing from the north (the quartz-dominated part of the Tularosa Basin) with speeds of >8 m s−1 was recorded. Then, as the proportion of calcite increases in later samples, a shift in wind directions was observed, with stronger winds blowing more frequently between the southeast and the southwest. During spring 2024, when the samples were collected using the dry method, gypsum was found in all dry samples collected directly from the surface of the panels, with concentrations ranging between 23% and 49%. This may be attributed to the high number (11) of wind events recorded during the spring-dry period (peak dust season). All dust events during the spring-dry period, including the one on sampling date 25 April 2024, originated from the southwest, which is the direction of the White Sands dune field. Furthermore, even on days without dust events, wind directions prevailed between the southeast and the southwest. In contrast, the sample collected from the MDCOs was mostly composed of quartz with about 17% identified as ardealite, which is an indicator of guano: this probably represented contamination of the sample by excreta from birds roosting on the MDCOs, which is a known issue [75].
Similarly to sample 10–28, the sample on 25 April 2024 was collected immediately following a dust event. Mineral composition analysis of this sample showed roughly equivalent concentrations (~30%) of quartz, calcite, and gypsum. These observations reinforce the hypothesis that PV modules at Alamogordo are frequently soiled with dust containing relatively high concentrations of gypsum derived from the White Sands. The observations also indicate that the mineral composition of soiling may have seasonal variations driven by dust events originating from different source areas: A similar mineralogical pattern was found in dust at Holloman Air Force Base, approximately midway between White Sands and the BGNDRF, with more quartz in summer and more calcium sulfate in spring [76]. Seasonal changes in dust composition at a receptor site such as the BGNDRF could also reflect seasonal cycles in the geochemistry and sedimentology of geologically dynamic dust source areas, such as the White Sands [77].
4.3.2. Particle Size Distribution
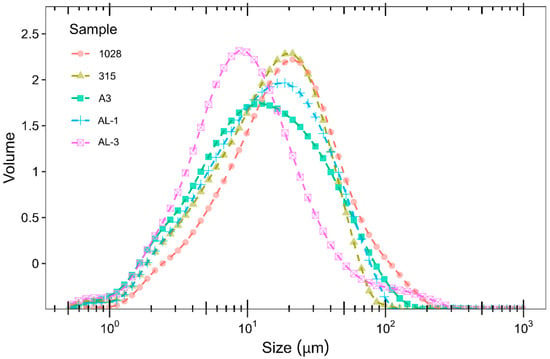
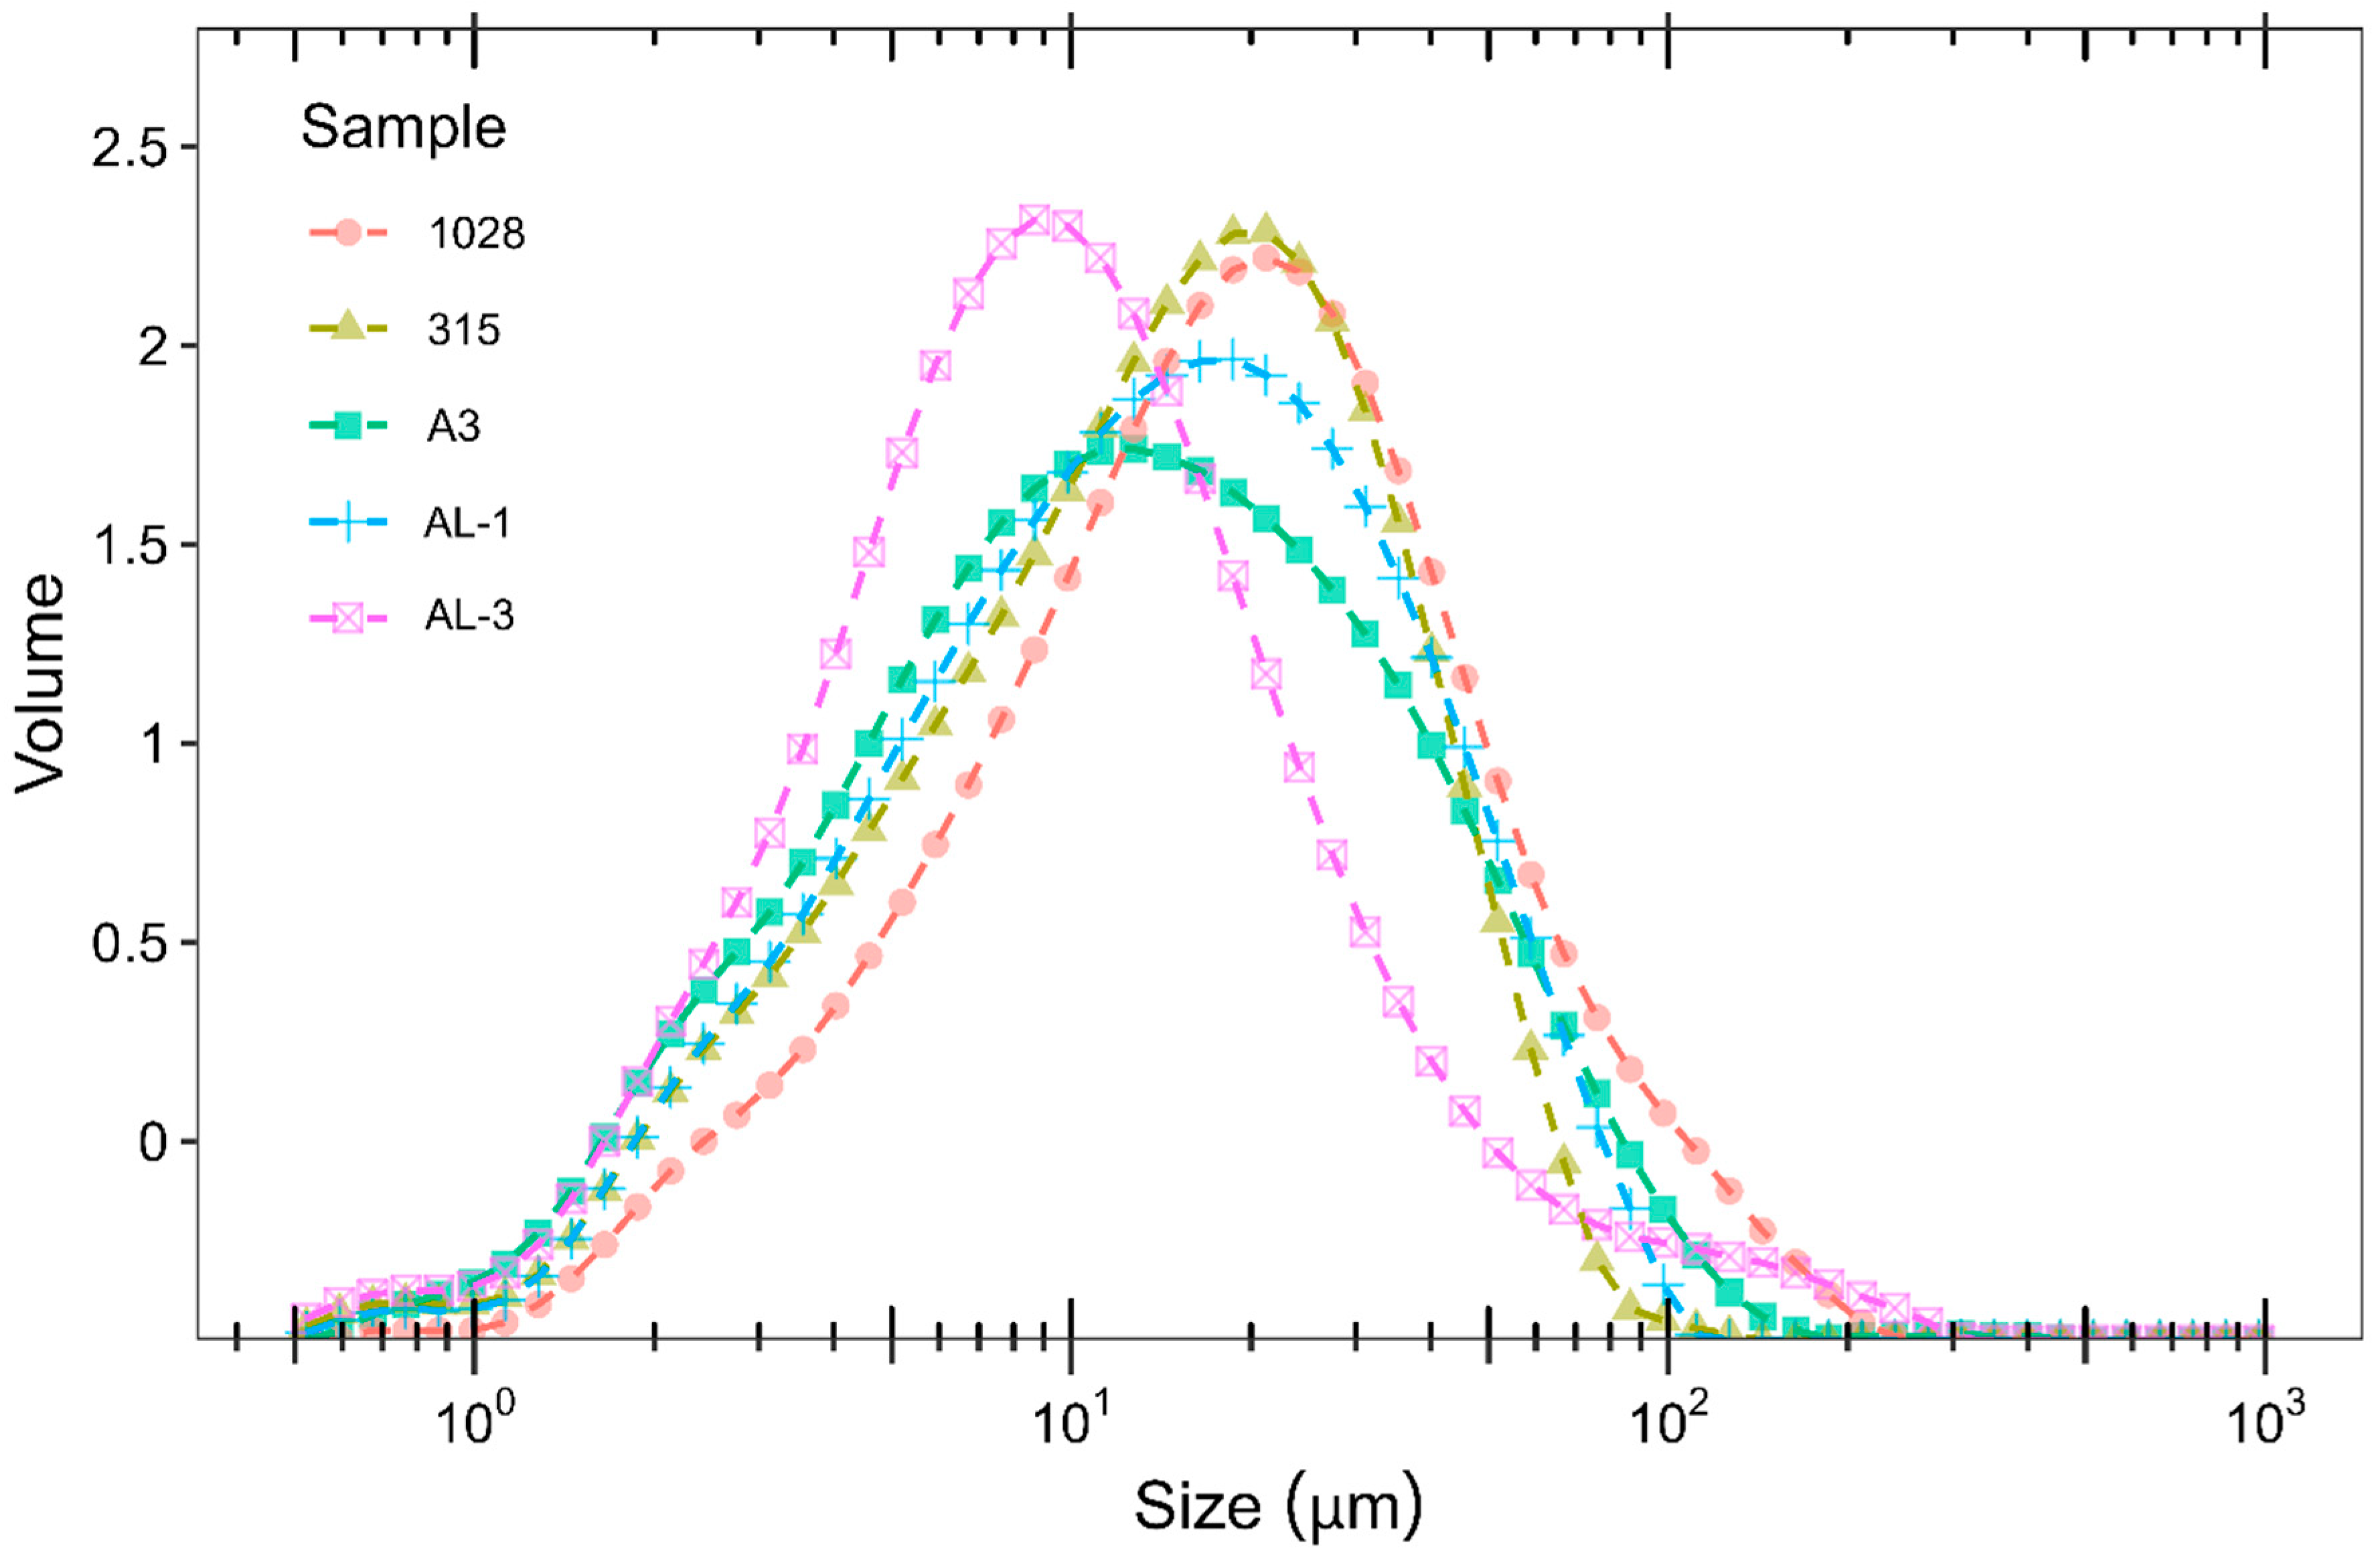
Particle size analysis of the materials soiling the PV panels was performed when sufficient samples remained after the PXRD analysis, following the method outlined in Section 3.2. Figure 7 shows the mean particle size distributions of two two-week samples—one for fall (10–28) and one for spring (3–15)—and two spring-dry samples—AL-1 and AL-3. Due to the dissolution of gypsum in the wet samples, a direct comparison between the particle size of the 10–28 and 3–15 samples and the spring-dry samples should be avoided. The mean particle size distribution for the samples obtained on 10–28 and 3–15 using the wet method was very similar: 21 and 18 µm, respectively. In contrast, the samples obtained by the dry method exhibited substantially different mean particle size distributions. The mean particle size of the AL-1 sample was 18 µm, whereas the AL-3 sample had a mean particle size of 8 µm. The lower mean particle size of the AL-3 sample may be explained by the inverse correlation between particle size and exposure time, where smaller particles are more likely to remain on the surface of the module for extended periods, whereas larger particles typically are more rapidly removed from the module by environmental influences like wind or rainfall [49]. The AL-3 sample was collected after about 62 days without significant precipitation (>2 mm), while the AL-1 sample was collected after 36 days without rain, according to the procedure described in Section 3.1. The A3 sample refers to standardized Arizona road test dust (A3, medium; Powder Technology, Inc.), which served as a reference, with a mean particle size of approximately 12 µm. In these soiling samples (without considering A3), between 89% (on 10–28) and 97% (on 3–15) of the particles were classified as dust (smaller than 50 µm), and only 3% to 11% were sand-sized (larger than 50 µm), as indicated by Table 4. In contrast, wind-deposited sediment samples collected using MDCOs (which incorporate a design prohibiting wind scouring or resuspension of settled particles) in El Paso, Texas [40], were predominantly sand, with a proportion of dust ~4.5 times lower than that found on the PV modules in this study.
Figure 7.
Particle size distribution of accumulated soiling material. Note that samples 10–28 and 3–15 were obtained using the “wet” method, whereas AL-1 and AL-3 were collected using the “dry” method.
Table 4.
Volume percentages of clay, silt, dust (clay + silt = dust component), and sand particle size distributions of the same samples are presented in Figure 5.
The particle size distributions of dust/sand found in this study differed from previously published data for Chihuahuan Desert windblown dust/sand obtained with MDCO sediment traps. For example, the mean particle size in MDCO samples in El Paso, Texas, was 107.8 µm; in Hueco Tanks (El Paso County, Texas), it was between 100 and 112 µm; and it was between 178 and 200 µm in the White Sands Missile Range (WSMR) to the west and northwest of the BGNDRF [39,40]. However, the mean particle size distributions observed here align with findings from other PV soiling studies, which reported mean particle sizes ranging from 1 to 50 µm [49,78]. This can be attributed to the fact that particles larger than 50 µm (i.e., sand) deposited on PV modules (which are tilted and otherwise not protected from wind scouring) are typically removed by wind, while particles smaller than 50 µm (i.e., dust) require stream velocities of up to 50 m s−1 to be removed due to their strong adhesion forces [6]. Moreover, studies have highlighted the inverse correlation between particle size distributions of the accumulated sediment on PV modules and the exposure time of these to the external environmental conditions [49].
4.4. Soiling Loss Characterization
4.4.1. Power Yields and Soiling Accumulation Rates
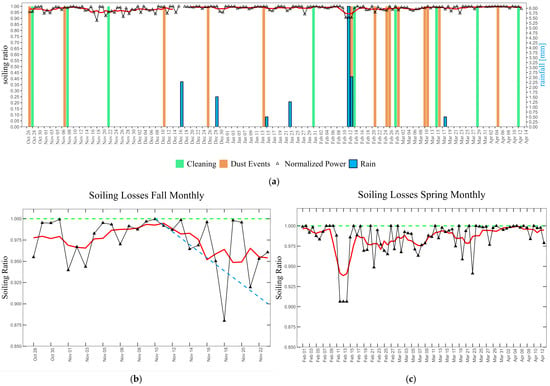
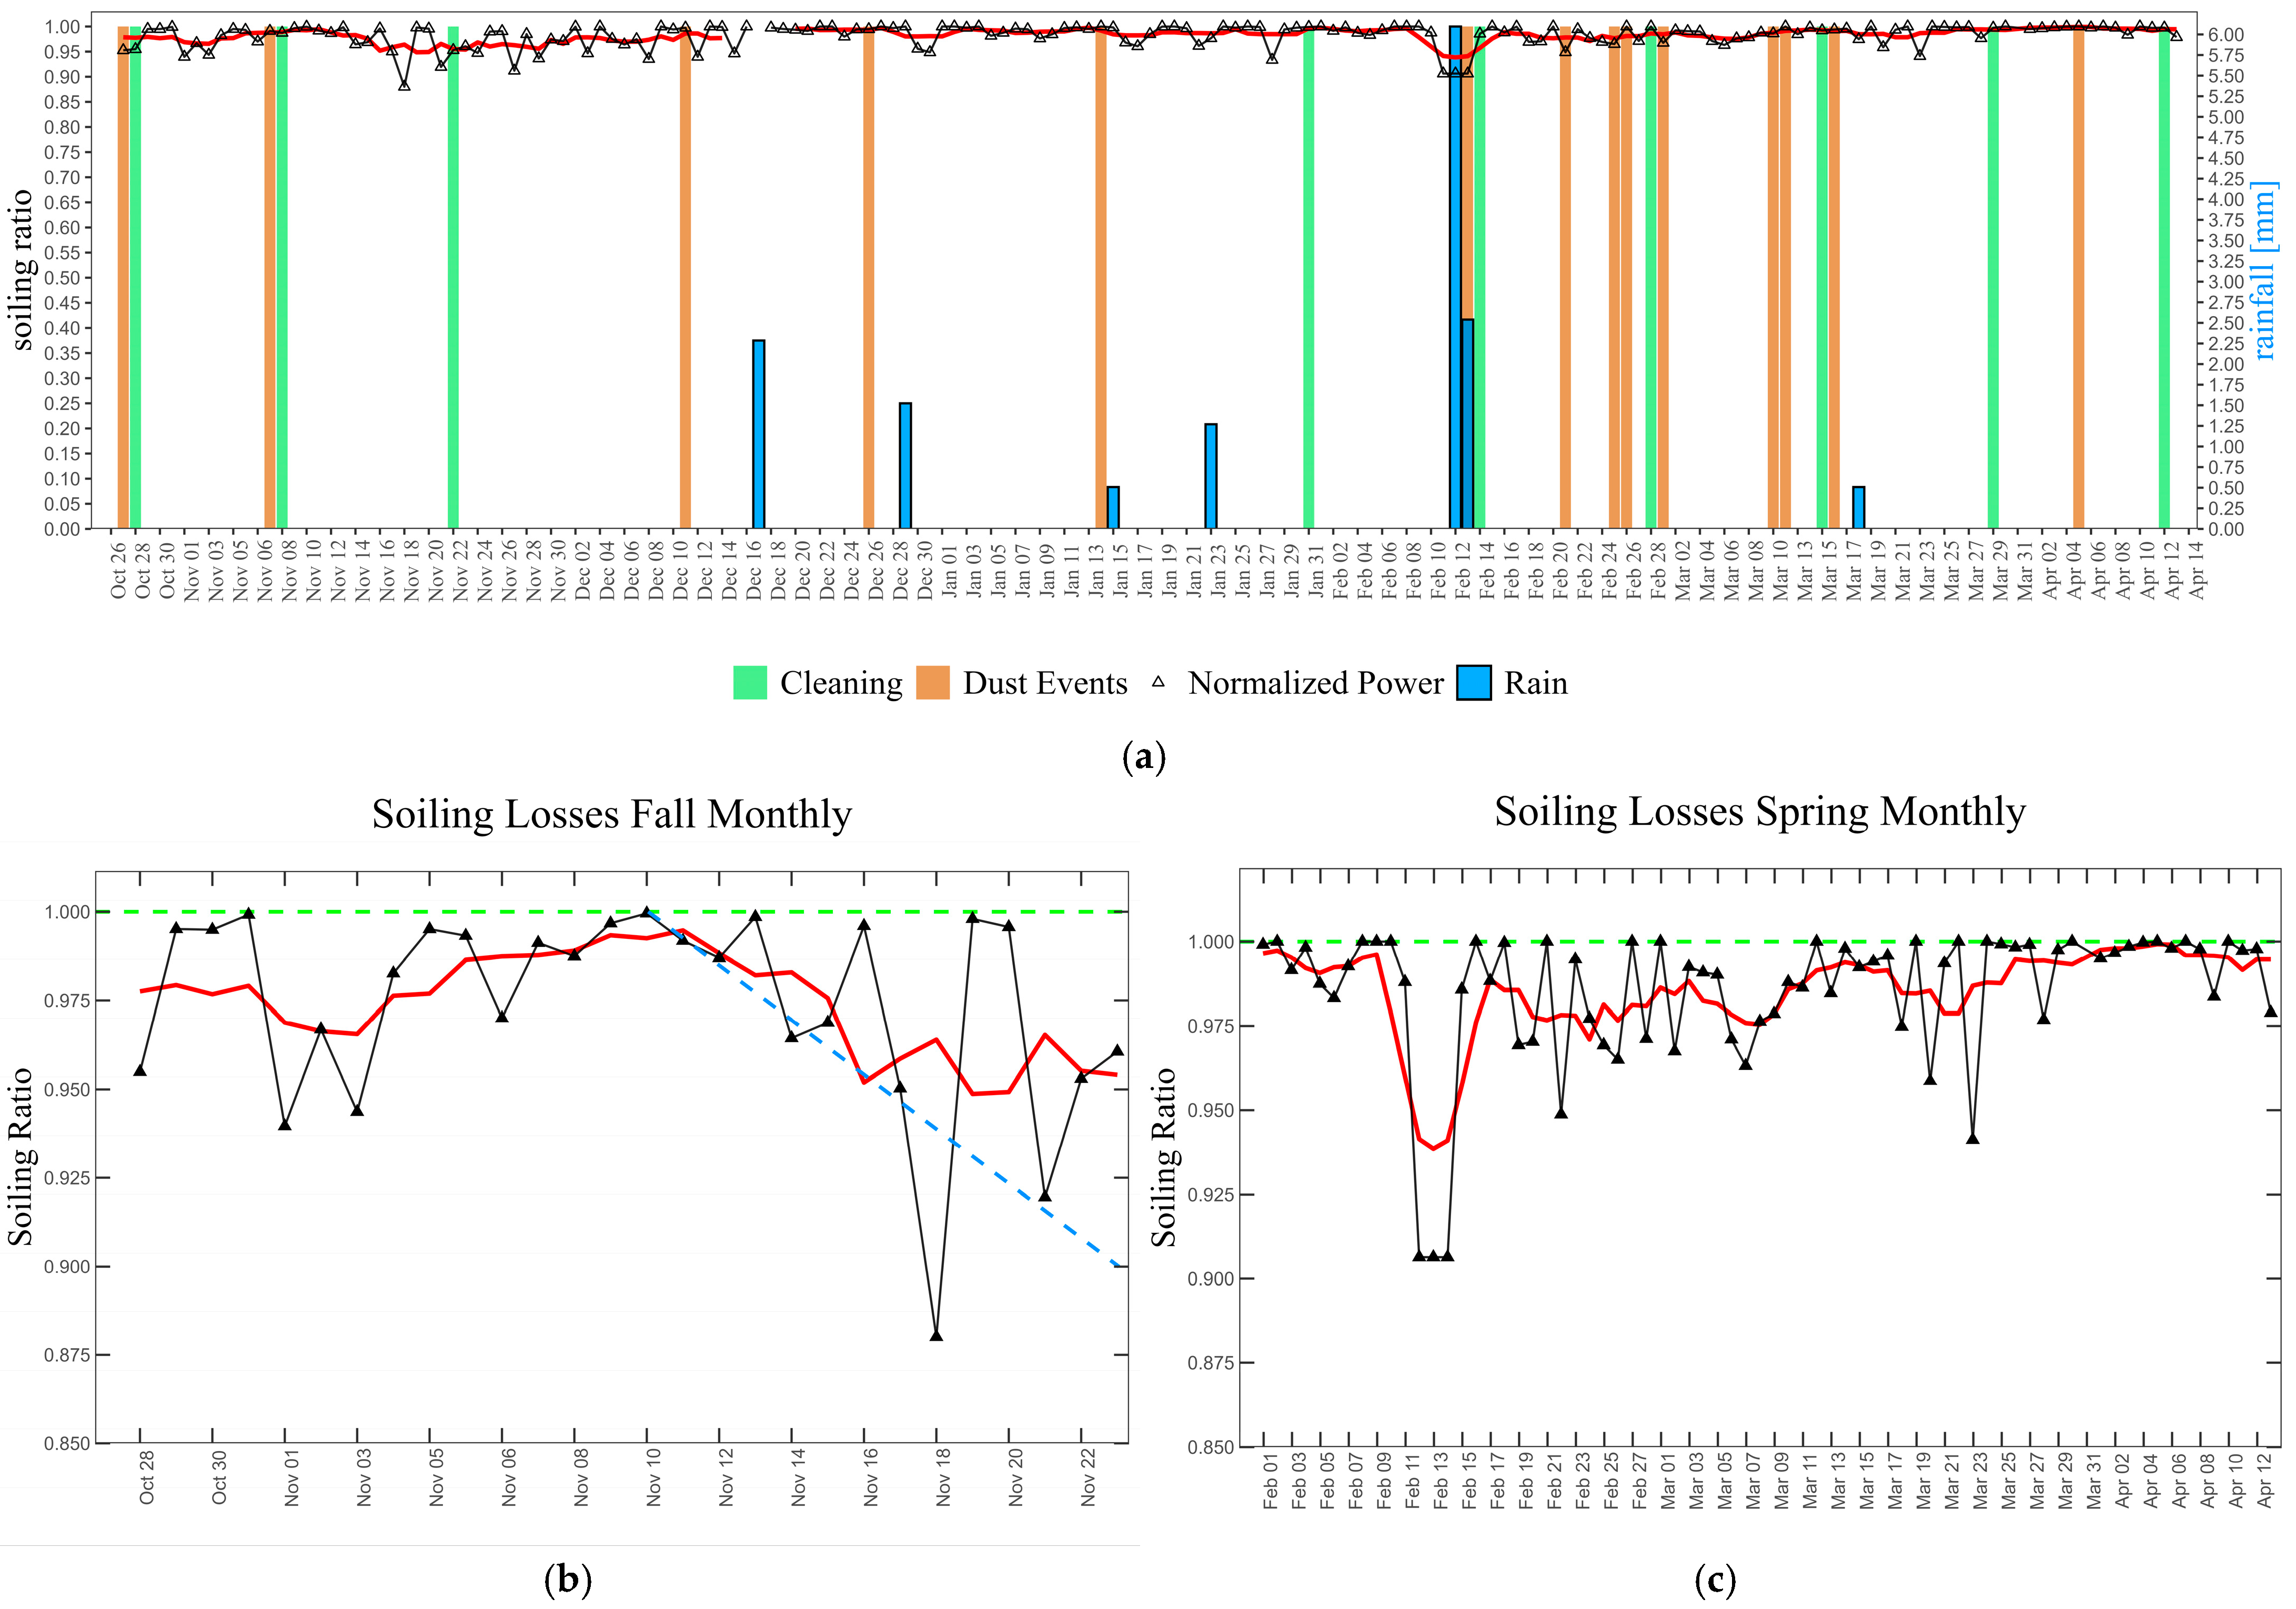
Figure 8 illustrates the daily average soiling losses in electrical power observed during the experiment, along with dates of cleanings, precipitation events, and dust events. A Welch’s t-test analysis showed a statistically significant difference (p = 0.0052) in soiling losses between the biweekly cleaned reference module (A-1) and the monthly cleaned reference module (A-2). In other words, cleaning the panels every two weeks or every four weeks resulted in a difference in soiling-associated power losses at this location. Interestingly, PV modules cleaned monthly showed less soiling than those cleaned biweekly. The mean soiling ratio during the fall monitoring period for the biweekly cleaned modules was approximately 0.974, with the lowest value recorded being 0.880. Similarly, mean soiling ratios for the monthly cleaned modules were 0.981 and a minimum of 0.892. On the other hand, during the spring period, the mean soiling ratio for the biweekly cleaned modules was 0.985, with the lowest value being 0.906, and for the monthly cleaned modules, the mean soiling ratio was 0.992, with the lowest being 0.939. This counterintuitive finding merits further investigation.
Figure 8.
Soiling ratio during the duration of the experiment, fall, and spring periods for the monthly cleaned PV modules: “(a)”, “(b)”, and “(c)”, respectively. (a) shows the cleaning dates (green bars), dust events (brown bars), rainfall events (blue bars), and the soiling losses during the entire period. (b,c) shows the soiling ratio (black line with triangles), the moving average (red line), and the no soiling (green line) for the fall and spring periods, respectively, for the monthly cleaned module.
In this study, the maximum accumulation was 0.3 g of soiling in a two-week period, which is equivalent to ~0.075 g m−2; in comparison, other dustier locations can receive up to 1.22 g m−2 in the same period [32], approximately 16 times greater than what was measured in this study at the BGNDRF. This might be attributed to the relatively low intensity and short duration of dust events at Alamogordo, as they were all classified as blowing dust, not dust storms, and all but one event (5 April 2023) lasted one hour or less.
During the fall period, soiling losses of 0.0071 (0.71%/day) were observed over seven days in November 2022. In comparison, soiling losses in other locations of the southwestern U.S. were reported to range between 0.1 and 0.3%/day, with the upper end of this range associated with desert environments [79,80]. Therefore, values observed in Alamogordo during those seven days were approximately two to four times higher than those reported in some previous studies for the southwestern U.S. On the other hand, during the spring period, which experienced nine dust events, soiling power losses were somewhat lower, most probably due to non-uniform soiling, with dust and sand accumulating at the bottom sections of the module; the cleaning effect of more frequent, stronger winds during spring; and potentially the mineral composition. For instance, Gostein et al. [81] reported that non-uniform soiling covering ~0.5% of the total area of the modules could translate into a ~9% power loss. Overall, soiling losses at Alamogordo, New Mexico, are lower than those reported in Global Dust Belt locations such as the United Arab Emirates (UAE) [60], Iran [32], and China [82]. However, the soiling losses observed during fall and spring are within the values reported by the National Renewable Energy Laboratory (NREL, https://www.nrel.gov/pv/soiling#pvsoiling-activelocation-wrapper (accessed on 6 August 2025)) for the southwestern United States, particularly in certain counties of Arizona and California.
4.4.2. Rainfall Effects on Soiling
As shown in Figure 8a, two days in February 2023 recorded precipitation: one event of light precipitation of 2.2 mm per hour and another with moderate rainfall of 6.1 mm per hour. These rainfall events were sufficient for removing accumulated dust and restoring PV module performance to its original conditions. However, this might not necessarily be valid elsewhere, as other studies have indicated that light rain might enhance power losses by redistributing and accumulating the material at the bottom sections of the panels [7]. For example, a global estimate [83] indicated that rainfall greater than 5 mm per hour is necessary to effectively remove all aerosols from the surface of PV panels. However, in India, the minimum threshold for effective cleaning was set to 8 mm per hour [84], and in northern California, multiple rainfall events of 5 mm failed to clean the panels; only 20 mm was enough to recover the efficiency of the panels [79]. The ability of light rain to clean the panels could be due to factors such as rainfall intensity, raindrop size, raindrop fall velocity, etc. [85]. The rain being sufficient to clean the panels in this location could also be due to the amount and type of dust soiling on the panel being lower and/or less adhesive compared to dust in other locations. In addition, the surface of the PV modules at the BGNDRF was treated with an anti-reflective coating (ARC), according to the manufacturer. The main purpose of ARCs is to reduce reflection, increasing absorption of sunlight by the PV modules; however, an additional benefit of ARCs is their potential to reduce soiling in some cases because of their hydrophilic or hydrophobic nature [86]. The anti-reflective coating may have also helped make the rain more effective at cleaning the panels.
5. Conclusions
This study assessed the PV soiling losses at the Brackish Groundwater National Desalination Research Facility in Alamogordo, New Mexico, USA, located in the Chihuahuan Desert, a region prone to atmospheric deposition from frequent dust events. The site is of particular interest due to its high irradiation and its proximity to the White Sands dune field, a significant source of gypsum sand/dust that can be transported by wind and subsequently deposited on the PV modules at the measurement site. Our study represents the first quantitative measurements of PV soiling in a receptor site for gypsum dust.
The mean particle size distributions observed in the soiling material were between 8 µm and 21 µm, with approximately 90 percent of the particles classified as “dust” (i.e., particles smaller than 50 µm in diameter). Although precipitation was sparse during the study period, a light rain event appeared sufficient to clean the panels. Mineral composition of the soiling material showed seasonal variation: During the fall season, quartz was the main component mineral with concentrations of about 76%, while calcite was the principal component of samples obtained throughout the spring season, with concentrations between 48% and 60%. All dry-collected soiling samples contained high concentrations of gypsum (between 23% and 49%), indicating transport from the White Sands (consistent with HYSPLIT back-trajectories and airport wind data), representing a compositional difference from dust in other Chihuahuan Desert basins. Dolomite, likely derived from the nearby Sacramento Mountains and/or the White Sands, was observed in ~23% of all samples with concentrations around 10%. During the spring period, nine dust events were observed, yet soiling losses were lower, and the dust accumulation rate was only about 20% higher than in the fall period, which had only three dust events.
The distinct mineralogy, including gypsum and dolomite, distinguishes the dust from Alamogordo from the dust elsewhere in the Chihuahuan Desert and from global dust generally, indicating that the dust deposited on the solar panels at the BGNDRF originated from local soils. Since gypsum appears to have lower light absorption effects than other common dust minerals, it may be less effective at soiling. The fineness of the soiling material and lower soiling losses during spring, with more wind/dust events than fall, suggest that the wind, especially during the windier spring season, acted as a passive cleaning mechanism for large particles; gusts scour away sand-sized grains, which dominate local soils from the surface of the PV panels facing the prevailing wind. Power losses due to soiling at the BGNDRF in Alamogordo were generally within the range of soiling losses reported in other locations in the southwestern United States but much lower than reported in Global Dust Belt locations (UAE, Iran, and China), which experience higher levels of dust deposition.
These findings place Alamogordo and the southern Tularosa Basin of New Mexico as a favorable location for the installation of solar facilities due to its high solar irradiance, relatively low soiling losses, and relatively low maintenance. However, longer-term measurements are recommended to monitor seasonal and annual variations in soiling properties, dust accumulation rates, and their effect on soiling-related power loss. For instance, during the summer monsoon season, the prevailing wind direction may vary, activating other dust source areas within the region, which could have a greater impact on soiling, and the rainfall rates may be higher, having a different cleaning effect on modules. Also, further investigation into the optimal cleaning cycles is needed, as it was found unexpectedly that PV modules cleaned monthly showed lower levels of soiling than those cleaned biweekly. Furthermore, it is important to analyze the potential impacts of other variables, such as temperature and humidity, on soiling losses and to develop methods and materials that could suppress the soiling of photovoltaic panels in the first place.
Author Contributions
Conceptualization, T.E.G. and G.R.O.; investigation, G.R.O., J.A.H.-V., A.J.M.-M., M.C. and T.E.G.; methodology, G.R.O., J.A.H.-V., A.J.M.-M. and T.E.G.; visualization, G.R.O.; resources, M.C., J.A.H.-V., A.J.M.-M. and T.E.G.; data curation, G.R.O. and T.E.G.; writing—original draft, G.R.O.; writing—reviewing and editing, G.R.O. and T.E.G.; supervision, T.E.G. and M.C.; project administration, T.E.G. All authors have read and agreed to the published version of the manuscript.
Funding
This research received no external funding.
Institutional Review Board Statement
Not applicable.
Informed Consent Statement
Not applicable.
Data Availability Statement
X-ray diffraction and particle size data are available in [87]. Other data can be made available upon request.
Acknowledgments
This article is based on research originally conducted as a part of the first author’s dissertation at the University of Texas at El Paso [88]. We thank the United States Bureau of Reclamation Brackish Groundwater National Desalination Research Facility for hosting the field experiment and providing access to site resources. We acknowledge Richard Langford from the University of Texas at El Paso for laboratory assistance; Nicholas Spada of the University of California, Davis, for technical input; and Mark Sweeney of the University of South Dakota for valuable insights on White Sands dust processes.
Conflicts of Interest
The authors declare no conflicts of interest.
References
- U.S. Energy Information Administration. Annual Energy Outlook 2021; U.S. Energy Information Administration: Washington, DC, USA, 2021. Available online: https://www.eia.gov/outlooks/aeo/pdf/AEO_Narrative_2021.pdf (accessed on 21 April 2026).
- U.S. Energy Information Administration. Annual Energy Outlook 2023; U.S. Energy Information Administration: Washington, DC, USA, 2023. Available online: https://www.eia.gov/outlooks/aeo/pdf/aeo2023_narrative.pdf (accessed on 21 April 2026).
- International Renewable Energy Agency (IRENA). Renewable Capacity Statistics 2025; International Renewable Energy Agency (IRENA): Abu Dhabi, United Arab Emirates, 2025; Available online: https://www.irena.org/Publications/2025/Mar/Renewable-capacity-statistics-2025 (accessed on 6 August 2025).
- International Renewable Energy Agency (IRENA). Renewable Energy Statistics 2020; International Renewable Energy Agency (IRENA): Abu Dhabi, United Arab Emirates, 2020; Available online: https://www.irena.org/Publications/2020/Jul/Renewable-energy-statistics-2020 (accessed on 6 August 2025).
- Shi, L.; Zhang, J.; Yao, F.; Zhang, D.; Guo, H. Drivers to dust emissions over dust belt from 1980 to 2018 and their variation in two global warming phases. Sci. Total Environ. 2021, 767, 144860. [Google Scholar] [CrossRef] [Scilit] [PubMed]
- Sayyah, A.; Horenstein, M.N.; Mazumder, M.K. Energy yield loss caused by dust deposition on photovoltaic panels. Sol. Energy 2014, 107, 576–604. [Google Scholar] [CrossRef] [Scilit]
- Schill, C.; Brachmann, S.; Koehl, M. Impact of soiling on IV-curves and efficiency of PV-modules. Sol. Energy 2015, 112, 259–262. [Google Scholar] [CrossRef] [Scilit]
- Conceição, R.; Silva, H.G.; Mirão, J.; Collares-Pereira, M. Organic soiling: The role of pollen in PV module performance degradation. Energies 2018, 11, 294. [Google Scholar] [CrossRef] [Scilit]
- Martin-Sanchez, P.M.; Gebhardt, C.; Toepel, J.; Barry, J.; Munzke, N.; Günster, J.; Gorbushina, A.A. Monitoring microbial soiling in photovoltaic systems: A qPCR-based approach. Int. Biodeter. Biodegr. 2018, 129, 13–22. [Google Scholar] [CrossRef] [Scilit]
- Shirakawa, M.A.; Zilles, R.; Mocelin, A.; Gaylarde, C.C.; Gorbushina, A.; Heidrich, G.; Giudice, M.C.; Del Negro, G.M.B.; John, V.M. Microbial colonization affects the efficiency of photovoltaic panels in a tropical environment. J. Environ. Manag. 2015, 157, 160–167. [Google Scholar] [CrossRef] [Scilit]
- Sisodia, A.K.; Mathur, R.K. Impact of bird dropping deposition on solar photovoltaic module performance: A systematic study in western Rajasthan. Environ. Sci. Pollut. Res. 2019, 26, 31119–31132. [Google Scholar] [CrossRef] [Scilit]
- Aïssa, B.; Isaifan, R.J.; Madhavan, V.E.; Abdallah, A.A. Structural and physical properties of the dust particles in Qatar and their influence on the PV panel performance. Sci. Rep. 2016, 6, 31467. [Google Scholar] [CrossRef] [Scilit]
- Chanchangi, Y.N.; Ghosh, A.; Sundaram, S.; Mallick, T.K. Dust and PV performance in Nigeria: A review. Renew. Sustain. Energy Rev. 2020, 121, 109704. [Google Scholar] [CrossRef] [Scilit]
- Goossens, D.; Offer, Z.Y. Wind tunnel and field calibration of six aeolian dust samplers. Atmos. Environ. 2000, 34, 1043–1057. [Google Scholar] [CrossRef] [Scilit]
- Qasem, H.; Betts, T.; Mullejans, H.; AlBusairi, H.; Gottschalg, R. Dust effect on PV modules. In Proceedings of the 7th Photovoltaic Science Application and Technology Conference (PVSAT-7), Edinburgh, UK, 6–8 April 2011; pp. 105–108. Available online: https://hdl.handle.net/2134/8459 (accessed on 6 August 2025).
- Rivera Rivera, N.I.; Gill, T.E.; Bleiweiss, M.P.; Hand, J.L. Source characteristics of hazardous Chihuahuan Desert dust outbreaks. Atmos. Environ. 2010, 44, 2457–2468. [Google Scholar] [CrossRef] [Scilit]
- National Renewable Energy Laboratory Photovoltaic Module Soiling Map. 2025. Available online: https://www2.nrel.gov/pv/soiling (accessed on 6 May 2025).
- Feng, I.Y.; Gill, T.E.; Van Pelt, R.S.; Webb, N.P.; Tong, D.Q. Economic costs of wind erosion in the United States. Nat. Sustain. 2025, 8, 307–314. [Google Scholar] [CrossRef] [Scilit]
- Ilse, K.; Micheli, L.; Figgis, B.W.; Lange, K.; Daßler, D.; Hanifi, H.; Wolfertstetter, F.; Naumann, V.; Hagendorf, C.; Gottschalg, R.; et al. Techno-economic assessment of soiling losses and mitigation strategies for solar power generation. Joule 2019, 3, 2303–2321. [Google Scholar] [CrossRef] [Scilit]
- Adekanbi, M.L.; Alaba, E.S.; John, T.J.; Tundealao, T.D.; Banji, T.I. Soiling loss in solar systems: A review of its effect on solar energy efficiency and mitigation techniques. Clean. Energy Syst. 2024, 7, 100094. [Google Scholar] [CrossRef] [Scilit]
- Agbogla, J.; Sekyere, C.K.K.; Forson, F.K.; Opoku, R.; Baah, B. Soiling estimation methods in solar photovoltaic systems: Review, challenges and future directions. Results Eng. 2025, 26, 104810. [Google Scholar] [CrossRef] [Scilit]
- Liu, Y.; Li, H.; Li, L.; Yin, X.; Wu, X.; Su, Z.; Gao, F.; Cai, B.; Tang, L.; Zhou, S. Solar photovoltaic panel soiling accumulation and removal methods: A review. IET Renew. Power Gener. 2024, 18, 4097–4118. [Google Scholar] [CrossRef] [Scilit]
- Shahzad, N.; Hussain, N.; Umar, S.; Azam, M.F.; Yousaf, T.; Waqas, A. Impacts of soiling on solar panel performance and state-of-the-art effective cleaning methods: A recent review. J. Clean. Prod. 2025, 497, 145119. [Google Scholar] [CrossRef] [Scilit]
- Costa, S.C.; Diniz, A.S.A.; Kazmerski, L.L. Dust and soiling issues and impacts relating to solar energy systems: Literature review update for 2012–2015. Renew. Sustain. Energy Rev. 2016, 63, 33–61. [Google Scholar] [CrossRef] [Scilit]
- Hottel, H.; Woertz, B. Performance of flat plate solar heat collectors. Trans. ASME 1942, 64, 91–104. [Google Scholar] [CrossRef] [Scilit]
- Dietz, A.G. Diathermanous materials and properties of surfaces. In Introduction to the Utilization of Solar Energy; Zarem, A.M., Erway, D., Eds.; McGraw-Hill: New York, NY, USA, 1963; pp. 59–86. [Google Scholar]
- Conceicao, R.; Vazquez, I.; Fialho, L.; Garcia, D. Soiling and rainfall effect on PV technology in rural Southern Europe. Renew. Energy 2020, 156, 743–747. [Google Scholar] [CrossRef] [Scilit]
- Boyle, L.; Flinchpaugh, H.; Hannigan, M. Natural soiling of photovoltaic cover plates and the mpact on transmission. Renew. Energy 2015, 77, 166–173. [Google Scholar] [CrossRef] [Scilit]
- Hegazy, A.A. Effect of dust accumulation on solar transmittance through glass covers of plate-type collectors. Renew. Energy 2001, 22, 525–540. [Google Scholar] [CrossRef] [Scilit]
- Al Shehri, A.; Parrott, B.; Carrasco, P.; Al Saiari, H.; Taie, I. Impact of dust deposition and brush-based dry cleaning on glass transmittance for PV modules applications. Sol. Energy 2016, 135, 317–324. [Google Scholar] [CrossRef] [Scilit]
- Paudyal, B.R.; Shakya, S.R.; Paudyal, D.P.; Das Mulmi, D. Soiling-induced transmittance losses in solar PV modules installed in Kathmandu Valley. Renew. Wind Water Sol. 2017, 4, 5. [Google Scholar] [CrossRef] [Scilit]
- Gholami, A.; Khazaee, I.; Eslami, S.; Zandi, M.; Akrami, E. Experimental investigation of dust deposition effects on photo-voltaic output performance. Sol. Energy 2018, 159, 346–352. [Google Scholar] [CrossRef] [Scilit]
- Al Badi, H.; Boland, J.; Bruce, D.; Albadi, M. Dust event impact on photovoltaic systems: Role of humidity in soiling and self-cleaning. In 2018 IEEE International Conference on Smart Energy Grid Engineering (SEGE); IEEE: New York, NY, USA, 2018; pp. 342–345. [Google Scholar]
- Memiche, M.; Bouzian, C.; Benzahia, A.; Moussi, A. Effects of dust, soiling, aging, and weather conditions on photovoltaic system performances in a Saharan environment—Case study in Algeria. Glob. Energy Interconnect. 2020, 3, 60–67. [Google Scholar] [CrossRef] [Scilit]
- Baddock, M.C.; Gill, T.E.; Bullard, J.E.; Dominguez Acosta, M.; Rivera Rivera, N.I. Geomorphology of the Chihuahuan Desert based on potential dust emissions. J. Maps 2011, 7, 249–259. [Google Scholar] [CrossRef] [Scilit]
- Kandakji, T.; Gill, T.E.; Lee, J.A. Drought and land use/land cover impact on dust sources in the Southern Great Plains and Chihuahuan Desert of the US: Inferring anthropogenic effect. Sci. Total Environ. 2021, 755, 142461. [Google Scholar] [CrossRef] [Scilit]
- Prospero, J.M.; Ginoux, P.; Torres, O.; Nicholson, S.E.; Gill, T.E. Environmental characterization of global sources of atmospheric soil dust identified with the Nimbus 7 total ozone mapping spectrometer (TOMS) absorbing aerosol product. Rev. Geophys. 2002, 40, 1002. [Google Scholar] [CrossRef] [Scilit]
- Baddock, M.C.; Ginoux, P.; Bullard, J.E.; Gill, T.E. Do MODIS-defined dust sources have a geomorphological signature? Geophys. Res. Lett. 2016, 43, 2606–2613. [Google Scholar] [CrossRef] [Scilit]
- Rivas, J.A., Jr. Dust Storms and the Dispersal of Aquatic Invertebrates in the Chihuahuan Desert Ecoregion. Ph.D. Thesis, The University of Texas at El Paso, El Paso, TX, USA, 2019. [Google Scholar]
- Gill, T.E.; Rivas, J.A.; Walsh, E.J. Aeolian sediment in El Paso, Texas: Elevated desert sand deposition rates and dust concentrations, enhanced by drought and urban sources. Atmos. Environ. 2025, 344, 121029. [Google Scholar] [CrossRef] [Scilit]
- Velarde, R. Evaluating Suspended Dust Particulate Matter from Anthropogenically-Altered Lands. Ph.D. Thesis, The University of Texas at El Paso, El Paso, TX, USA, 2011. [Google Scholar]
- Novlan, D.J.; Hardiman, M.; Gill, T. A synoptic climatology of blowing dust events in El Paso, Texas from 1932–2005. In Preprints, 16th Conference on Applied Climatology; J3.12; American Meteorological Society: Boston, MA, USA, 2007; Available online: https://ams.confex.com/ams/87ANNUAL/techprogram/paper_115842.htm (accessed on 6 August 2025).
- Holliday, V.T.; Harvey, A.; Cuba, M.T.; Weber, A.M. Paleoindians, paleolakes and paleoplayas: Landscape geoarchaeology of the Tularosa Basin, New Mexico. Geomorphology 2019, 331, 92–106. [Google Scholar] [CrossRef] [Scilit]
- Wheeler, R.J.; LeCroy, S.R.; Whitlock, C.H.; Purgold, G.C.; Swanson, J.S. Surface characteristics for the alkali flats and dunes regions at White Sands Missile Range, New Mexico. Remote Sens. Environ. 1994, 48, 181–190. [Google Scholar] [CrossRef] [Scilit]
- McKee, E.D. Structures of dunes at White Sands National Monument, New Mexico (and a comparison with structures of dunes from other selected areas). Sedimentology 1966, 7, 3–69. [Google Scholar] [CrossRef] [Scilit]
- White, W.H.; Hyslop, N.P.; Trzepla, K.; Yatkin, S.; Rarig, R.S., Jr.; Gill, T.E.; Jin, L. Regional transport of a chemically distinctive dust: Gypsum from White Sands, New Mexico (USA). Aeolian Res. 2015, 16, 1–10. [Google Scholar] [CrossRef] [Scilit]
- Sweeney, M.R.; Forman, S.L.; McDonald, E.V. Contemporary and future dust sources and emission fluxes from gypsum-and quartz-dominated eolian systems, New Mexico and Texas, USA. Geology 2022, 50, 356–360. [Google Scholar] [CrossRef] [Scilit]
- Line, W.E.; Turner, J.D.; Bleiweiss, M.P.; Hillger, D. GOES-Based Trends in Blowing Dust Initiation across Southwestern North America, 2001–20. J. Appl. Meteorol. Climatol. 2025, 64, 1833–1850. [Google Scholar] [CrossRef] [Scilit]
- Javed, W.; Wubulikasimu, Y.; Figgis, B.; Guo, B. Characterization of dust accumulated on photovoltaic panels in Doha, Qatar. Sol. Energy 2017, 142, 123–135. [Google Scholar] [CrossRef] [Scilit]
- John, J.J.; Warade, S.; Tamizhmani, G.; Kottantharayil, A. Study of soiling loss on photovoltaic modules with artificially deposited dust of different gravimetric densities and compositions collected from different locations in India. IEEE J. Photovolt. 2015, 6, 236–243. [Google Scholar] [CrossRef] [Scilit]
- Choudhary, D. Characterizations of Soil Layers Artificially Deposited on Glass and Photovoltaic Coupons. Master’s Thesis, Arizona State University, Tempe, AZ, USA, 2016. [Google Scholar]
- Mantha, S. Development of Uniform Artificial Soil Deposition Techniques on Glass and Photovoltaic Coupons. Master’s Thesis, Arizona State University, Tempe, AZ, USA, 2016. [Google Scholar]
- Ravi, P.; Muller, M.; Simpson, L.J.; Choudhary, D.; Mantha, S.; Subramanian, S.; Virkar, S.; Curtis, T.; Tamizhmani, G. Indoor soil deposition chamber: Evaluating effectiveness of antisoiling coatings. IEEE J. Photovolt. 2018, 9, 227–232. [Google Scholar] [CrossRef] [Scilit]
- Poppe, L.J.; Paskevich, V.F.; Hathaway, J.C.; Blackwood, D.S. A Laboratory Manual for X-Ray Powder Diffraction; U.S. Geological Survey Open-File Report 2001-41; U.S. Geological Survey: Reston, VA, USA, 2001. [CrossRef] [Scilit]
- Sperazza, M.; Moore, J.N.; Hendrix, M.S. High-resolution particle size analysis of naturally occurring very fine-grained sediment through laser diffractometry. J. Sediment. Res. 2004, 74, 736–743. [Google Scholar] [CrossRef] [Scilit]
- Kelley, M.C.; Ardon-Dryer, K. Analyzing two decades of dust events on the Southern Great Plains region of West Texas. Atmos. Pollut. Res. 2021, 12, 101091. [Google Scholar] [CrossRef] [Scilit]
- Robinson, M.; Ardon-Dryer, K. Characterization of 21 years of dust events across four west Texas regions. Aeolian Res. 2024, 67, 100930. [Google Scholar] [CrossRef] [Scilit]
- Stein, A.F.; Draxler, R.R.; Rolph, G.D.; Stunder, B.J.B.; Cohen, M.D.; Ngan, F. NOAA’s HYSPLIT atmospheric transport and dispersion modeling system. Bull. Amer. Meteorol. Soc. 2015, 96, 2059–2077. [Google Scholar] [CrossRef] [Scilit]
- Iannone, R. SplitR, version 0.4; Zenodo: Geneva, Switzerland, 2016. [CrossRef] [Scilit]
- Hachicha, A.A.; Al-Sawafta, I.; Said, Z. Impact of dust on the performance of solar photovoltaic (PV) systems under United Arab Emirates weather conditions. Renew. Energy 2019, 141, 287–297. [Google Scholar] [CrossRef] [Scilit]
- Jo, W.; Ham, N.; Kim, J.; Kim, J. The cleaning effect of photovoltaic modules according to precipitation in the operation stage of a large-scale solar power plant. Energies 2023, 16, 6180. [Google Scholar] [CrossRef] [Scilit]
- Rodriguez Ortiz, G.; Mehra, M.; Ramirez, M.; Shrestha, S.; Usenko, S.; Flynn, J.; Sheesley, R.J.; Gill, T.E. Optical and particulate properties of dust aerosols in El Paso, Texas. Atmos. Res. 2025, 322, 108127. [Google Scholar] [CrossRef] [Scilit]
- Figgis, B.; Ennaoui, A.; Ahzi, S.; Rémond, Y. Review of PV soiling particle mechanics in desert environments. Renew. Sustain. Energy Rev. 2017, 76, 872–881. [Google Scholar] [CrossRef] [Scilit]
- Figgis, B.; Goossens, D.; Guo, B.; Ilse, K. Effect of tilt angle on soiling in perpendicular wind. Sol. Energy 2019, 194, 294–301. [Google Scholar] [CrossRef] [Scilit]
- Engelstaedter, S.; Washington, R. Temporal controls on global dust emissions: The role of surface gustiness. Geophys. Res. Lett. 2007, 34, L15805. [Google Scholar] [CrossRef] [Scilit]
- Rivera Rivera, N.I.; Gill, T.E.; Gebhart, K.A.; Hand, J.L.; Bleiweiss, M.P.; Fitzgerald, R.M. Wind modeling of Chihuahuan Desert dust outbreaks. Atmos. Environ. 2009, 43, 347–354. [Google Scholar] [CrossRef] [Scilit]
- Hand, J.L.; White, W.H.; Gebhart, K.A.; Hyslop, N.P.; Gill, T.E.; Schichtel, B.A. Earlier onset of the spring fine dust season in the southwestern United States. Geophys. Res. Lett. 2016, 43, 4001–4009. [Google Scholar] [CrossRef] [Scilit]
- Elminir, H.K.; Ghitas, A.E.; Hamid, R.H.; El-Hussainy, F.; Beheary, M.M.; Abdel-Moneim, K.M. Effect of dust on the transparent cover of solar collectors. Energy Convers. Manag. 2006, 47, 3192–3203. [Google Scholar] [CrossRef] [Scilit]
- Peinado, P.; Gill, T.E. Geochemical and physical properties of dust source sediments in the Chihuahuan Desert and Southern High Plains. Geol. Soc. Am. Abst. Prog. 2014, 46, 36. [Google Scholar]
- Huff, G.; Leuth, V.; Giles, K.; Lucas, S.; Kues, B.; Myers, R.; Ulmer-Scholle, D. Apparent age of ground water near the southeastern margin of the Tularosa Basin, Otero County, New Mexico. In Geology of White Sands: New Mexico Geological Society Guidebook; New Mexico Bureau of Mines and Mineral Resources: Socorro, NM, USA, 2002; Volume 53, pp. 303–307. [Google Scholar]
- Pitt, W.D.; Scott, G.L. Porosity Zones of Lower Part of San Andres Formation, East Central New Mexico; New Mexico Bureau of Mines and Mineral Resources: Socorro, NM, USA, 1981; Circular 179; 20p.
- Fenton, L.K.; Bishop, J.L.; King, S.; Lafuente, B.; Horgan, B.; Bustos, D.; Sarrazin, P. Sedimentary differentiation of aeolian grains at the White Sands National Monument, New Mexico, USA. Aeolian Res. 2017, 26, 117–136. [Google Scholar] [CrossRef] [Scilit]
- Rea, P.; Ma, L.; Gill, T.E.; Gardea-Torresdey, J.; Tamez, C.; Jin, L. Tracing gypsiferous White Sands aerosols in the shallow critical zone in the northern Sacramento Mountains, New Mexico using Sr/Ca and 87Sr/86Sr ratios. Geoderma 2020, 372, 114387. [Google Scholar] [CrossRef] [Scilit]
- Lawrence, C.R.; Neff, J.C. The contemporary physical and chemical flux of aeolian dust: A synthesis of direct measurements of dust deposition. Chem. Geol. 2009, 267, 46–63. [Google Scholar] [CrossRef] [Scilit]
- Drees, L.R.; Manu, A. Bird urate contamination of atmospheric dust traps. Catena 1996, 27, 287–294. [Google Scholar] [CrossRef] [Scilit]
- Mangum, A.L.; Carling, G.T.; Bickmore, B.R.; Webb, N.; Leifi, D.L.; Brahney, J.; Fernandez, D.P.; Rey, K.A.; Nelson, S.T.; Burgener, L.; et al. Characterizing variability in geochemistry and mineralogy of western US dust sources. Aeolian Res. 2024, 70, 100941. [Google Scholar] [CrossRef]
- Sweeney, M.; Bustos, D.; Martinez, P.; Harsha, G.; Chadima, S.; Hand, J.; Gill, T. The Role of Efflorescent Sulfate Salts in Dust Production at White Sands National Park, New Mexico. Geol. Soc. Am. Abst. Prog. 2023, 55, 393365. [Google Scholar]
- Weber, B.; Quiñones, A.; Almanza, R.; Duran, M.D. Performance reduction of PV systems by dust deposition. Energy Proced. 2014, 57, 99–108. [Google Scholar] [CrossRef] [Scilit]
- Kimber, A.; Mitchell, L.; Nogradi, S.; Wenger, H. The effect of soiling on large grid-connected photovoltaic systems in California and the southwest region of the United States. In 2006 IEEE 4th World Conference on Photovoltaic Energy Conference; IEEE: New York, NY, USA, 2006; Volume 2, pp. 2391–2395. [Google Scholar]
- Micheli, L.; Deceglie, M.G.; Muller, M. Predicting photovoltaic soiling losses using environmental parameters: An update. Prog. Photovoltaics 2019, 27, 210–219. [Google Scholar] [CrossRef] [Scilit]
- Gostein, M.; Düster, T.; Thuman, C. Accurately measuring PV soiling losses with soiling station employing module power measurements. In 2015 IEEE 42nd Photovoltaic Specialist Conference (PVSC); IEEE: New York, NY, USA, 2015; pp. 1–4. [Google Scholar]
- Yao, W.; Han, X.; Huang, Y.; Zheng, Z.; Wang, Y.; Wang, X. Analysis of the influencing factors of the dust on the surface of photovoltaic panels and its weakening law to solar radiation—A case study of Tianjin. Energy 2022, 256, 124669. [Google Scholar] [CrossRef] [Scilit]
- Li, X.; Mauzerall, D.L.; Bergin, M.H. Global reduction of solar power generation efficiency due to aerosols and panel soiling. Nat. Sustain. 2020, 3, 720–727. [Google Scholar] [CrossRef] [Scilit]
- Valerino, M.; Bergin, M.; Ghoroi, C.; Ratnaparkhi, A.; Smestad, G.P. Low-cost solar PV soiling sensor validation and size resolved soiling impacts: A comprehensive field study in western India. Sol. Energy 2020, 204, 307–315. [Google Scholar] [CrossRef] [Scilit]
- Bhaduri, S.; Bajhal, R.; Farkade, M.; Mallick, S.; Shiradkar, N.; Kottantharayil, A. Understanding multiple stressors which degrade antisoiling coatings: Combined effect of rain, abrasion, and UV radiation. IEEE J. Photovolt. 2023, 13, 603–609. [Google Scholar] [CrossRef] [Scilit]
- Grammatico, M.A.; Littmann, B.W. Quantifying the anti-soiling benefits of anti-reflective coatings on first solar cadmium telluride PV modules. In 2016 IEEE 43rd Photovoltaic Specialists Conference (PVSC); IEEE: New York, NY, USA, 2016; pp. 1697–1701. [Google Scholar]
- Rodriguez Ortiz, G. Datasets For Experimental Investigation of Photovoltaic Soiling from White Sands Dust in Alamogordo, New Mexico, USA. Mendeley Data V1 2026. [Google Scholar] [CrossRef]
- Rodriguez Ortiz, G. Experimental Investigation of Photovoltaic Soiling Losses and Aerosol Absorption and Scattering Related to Dust in the Chihuahuan Desert Region. Ph.D. Thesis, University of Texas at El Paso, El Paso, TX, USA, 2025. Available online: https://scholarworks.utep.edu/open_etd/4456 (accessed on 21 April 2026).

Disclaimer/Publisher’s Note: The statements, opinions and data contained in all publications are solely those of the individual author(s) and contributor(s) and not of MDPI and/or the editor(s). MDPI and/or the editor(s) disclaim responsibility for any injury to people or property resulting from any ideas, methods, instructions or products referred to in the content. |
© 2026 by the authors. Licensee MDPI, Basel, Switzerland. This article is an open access article distributed under the terms and conditions of the Creative Commons Attribution (CC BY) license.