


Abstract
Based on hourly reanalysis data during 2010–2020, the Self-Organizing Map method is used to objectively classify convective precipitation events in the Chengdu terminal area. Combined with circulation background characteristics, the results are further grouped into three typical synoptic types. Among these three types, Type 1, characterized by a pattern with strong high pressure and abundant water vapor, yields the most intense precipitation. Type 2, a pattern with moderately strong high pressure and water vapor convergence, produces the second-highest precipitation. Type 3, associated with a low trough and weak water vapor conditions, has the weakest precipitation. Two indicators of the Weather Severity Index (WSI) and Node Coverage Index (NCI), respectively describing the coverage extent of heavy precipitation over the terminal area and over key arrival and departure nodes, are established and calculated based on heavy precipitation samples. The results show that Type 1 exhibits the highest WSI and NCI values, indicating the greatest potential impact. Type 2 displays a lower WSI than Type 1 but retains a relatively higher NCI, suggesting a more directionally biased impact, whereas Type 3 records the lowest values for both indicators, indicating a relatively weak impact. The integration of synoptic weather classification and spatial impact indicators offers a reference for weather-impact identification and scenario-based operational assessment in terminal areas. However, some limitations remain in the current study. The weather classification is primarily based on reanalysis data, and the correspondence between the WSI/NCI and actual airport operational constraints requires further validation.
1. Introduction
The aviation terminal area serves as a core airspace hub where flights complete takeoff, landing, approach and departure procedures [1], connecting the en-route airspace and the airport runway system. Its operational safety and organizational efficiency directly affect the overall performance of regional and even national air transportation networks [2,3]. According to statistics from the Civil Aviation Administration of China, approximately 58.31% of aviation operational disruptions nationwide are related to weather factors. As a result, meteorological conditions have been a prominent external constraint imposed on aviation operational efficiency and safety [4]. Compared with en-route airspace, the terminal area is more confined, with higher traffic density and a faster operational tempo, making it highly sensitive to weather disturbances. Generally, severe weather often markedly impacts terminal area operations by restricting arrival and departure procedures and reducing available operational airspace.
Convective precipitation (CP) is a prominent manifestation of severe convective weather, often accompanied by phenomena such as thunderstorms, short-duration heavy rainfall and gusts. It is characterized by strong locality, small spatio-temporal scales and rapid evolution. During terminal area operations, it can easily induce risks related to low visibility, restricted runway conditions and wind shear, thereby triggering operational measures such as increased takeoff and landing intervals and adjustments to arrival and departure procedures, eventually increasing operational complexity [5,6,7]. For instance, short-duration heavy rainfall can reduce visibility at the airport and in the approach areas, increasing the uncertainty during approach and landing [8]; heavy precipitation causes waterlogging and slippery surfaces on runways, adversely affecting takeoff and landing performance as well as operational safety [9]; and thunderstorms accompanied by abrupt changes in low-level wind fields are prone to inducing wind shears, posing a threat to aircraft safety during arrival and departure procedures [10]. As a result, it is of great significance to characterize the typical patterns and impact features of CP for supporting operations over the terminal area.
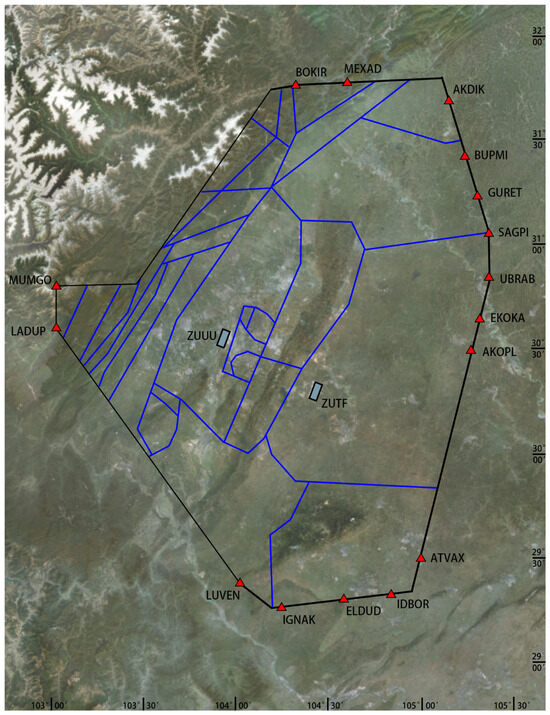
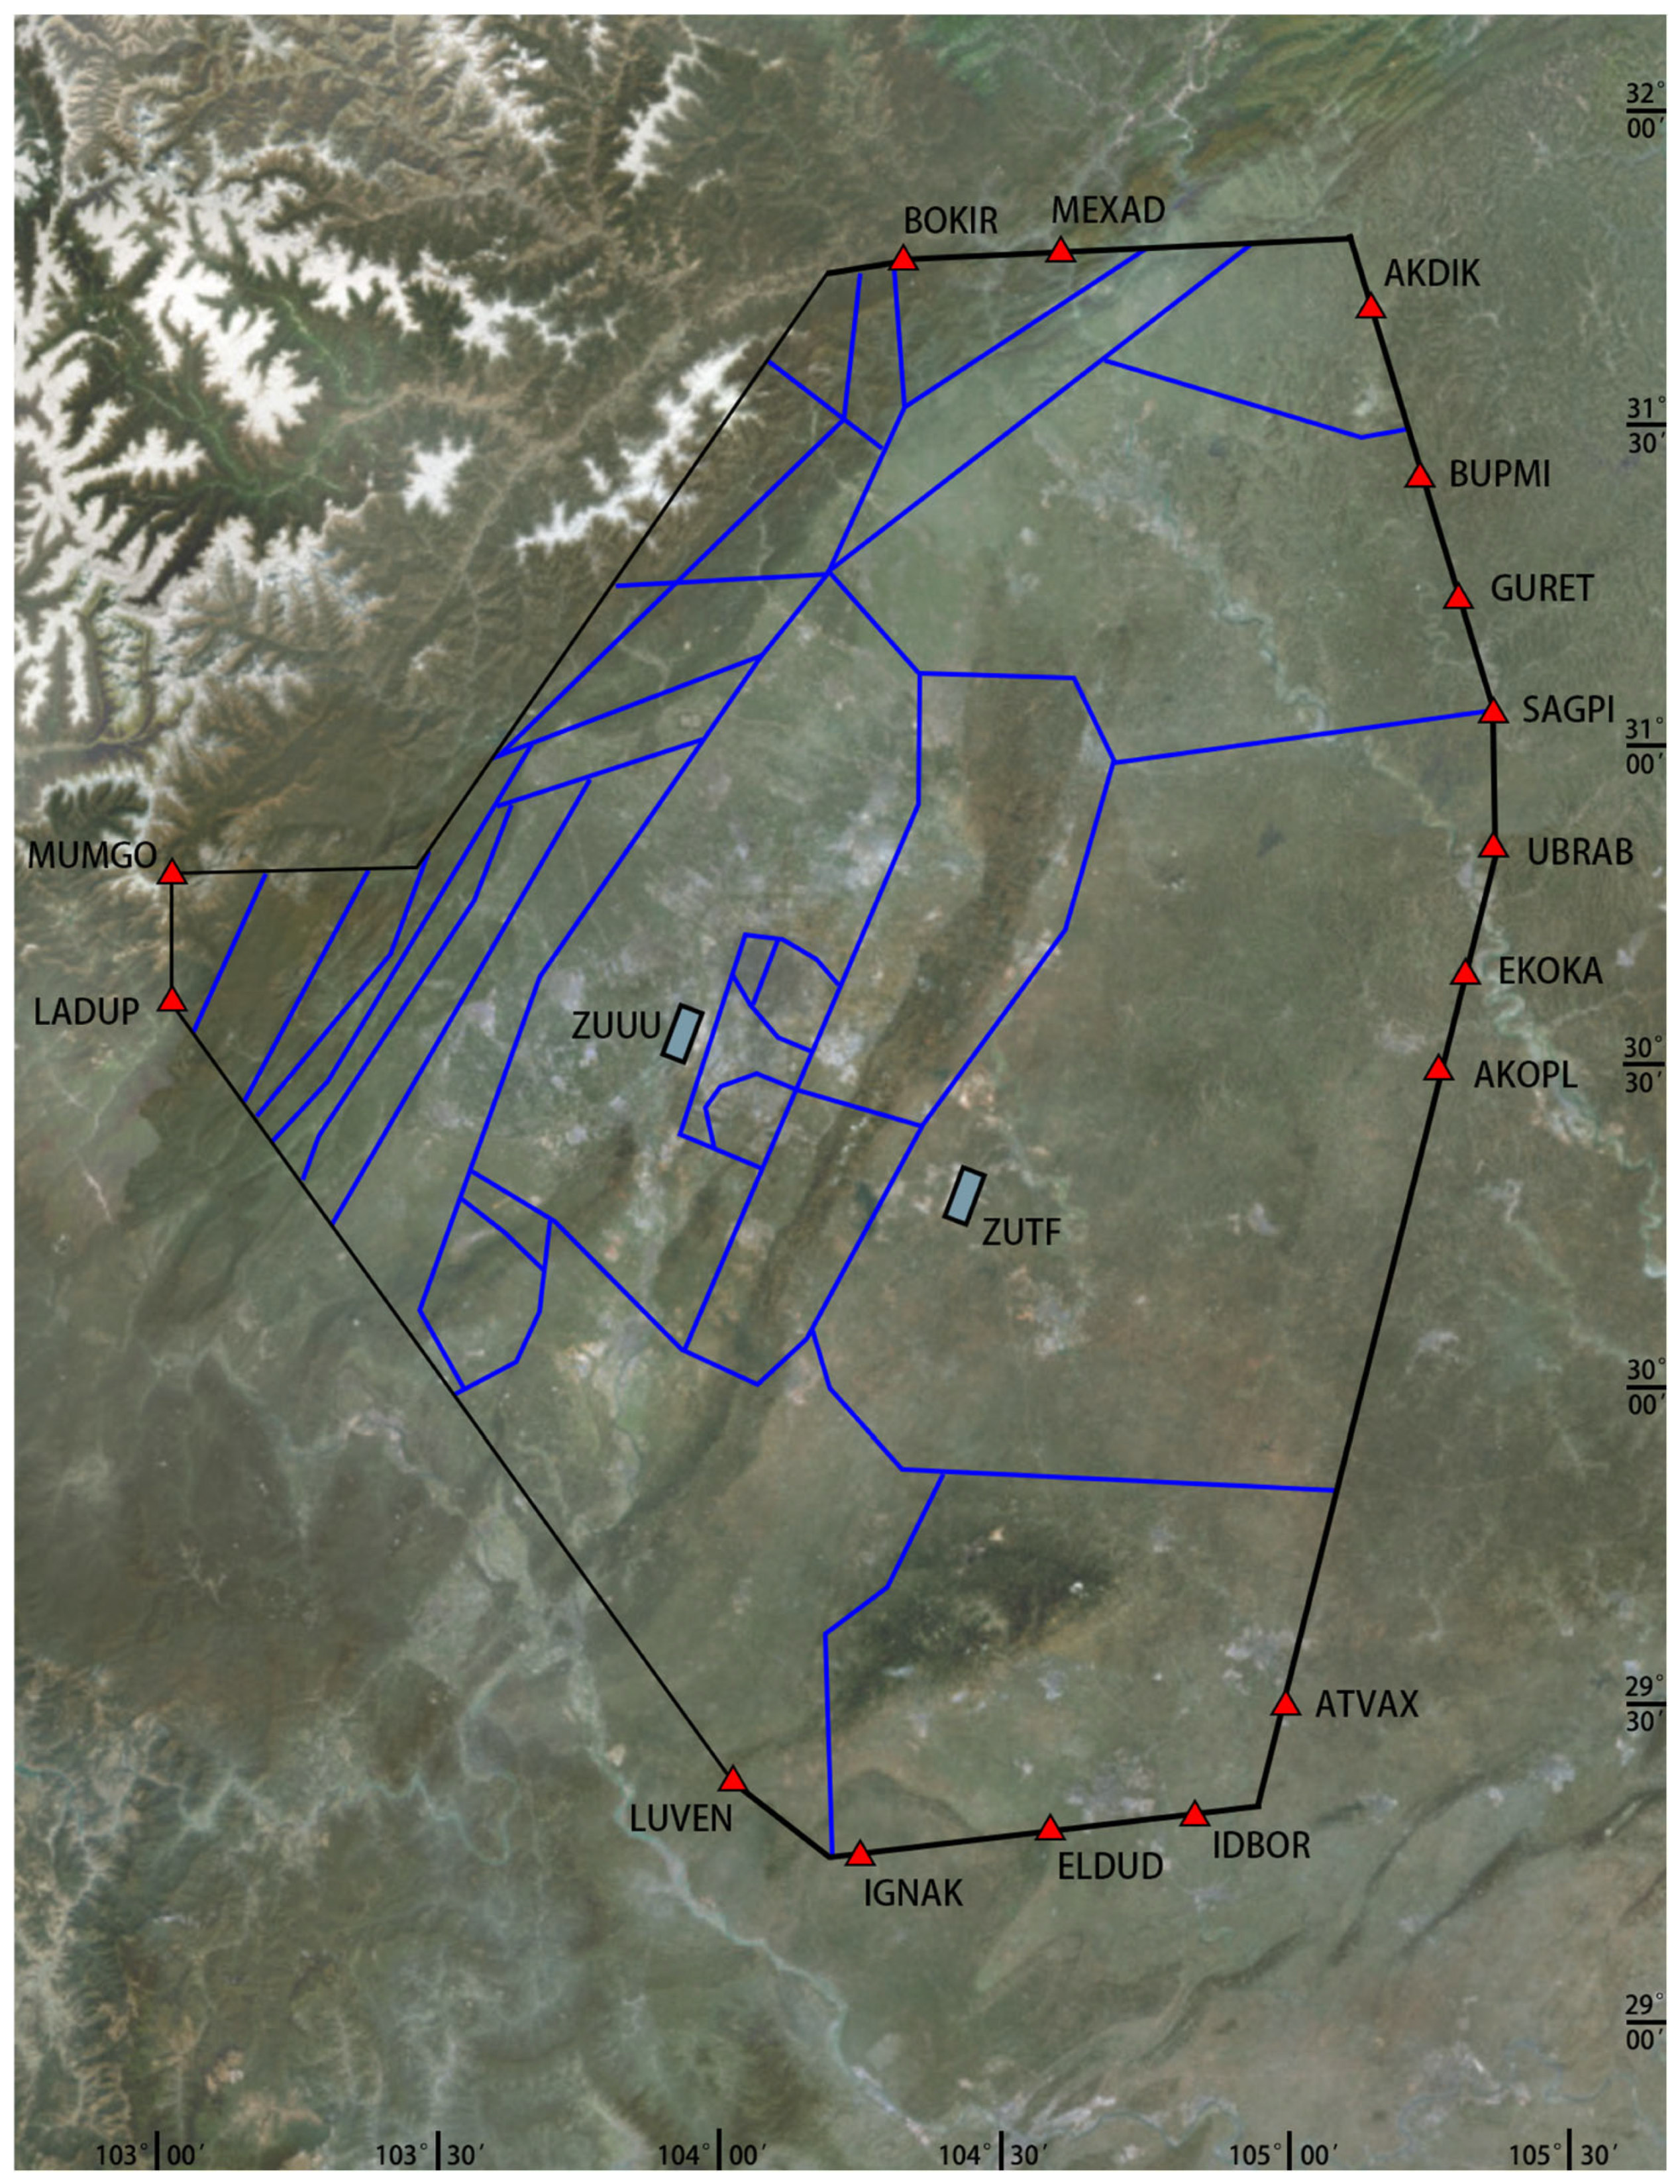
Serving as one of the busiest aviation hubs in western China, the Chengdu terminal area encompasses both Chengdu Shuangliu and Chengdu Tianfu airports. In 2025, the passenger throughput of the two airports reached 90.206 million, ranking among the top in China [11]. Consequently, the operational safety and efficiency of the Chengdu terminal area markedly influence the regional air transportation system [12,13]. Previous studies have indicated that CP and short-duration heavy rainfall frequently occur over the region where the Chengdu terminal area is located [10]. As shown in Figure 1, extreme weather covering key arrival and departure nodes can readily affect the airspace organization and operational support within the terminal area [14]. Meanwhile, CP in this region varies significantly among different cases in their formation backgrounds and mechanisms. Such precipitation can develop under conditions of continuous warm-moist moisture transport [15] or be triggered by local thermal forcing or middle-low level disturbances under weak large-scale backgrounds [16], demonstrating both diversity and complexity. Consequently, it is necessary to classify CP events in the Chengdu terminal area using objective methods.
Figure 1.
Boundaries and sectorization of the Chengdu terminal area. The light blue rectangles on the right and on the left indicate the locations of Chengdu Tianfu Airport (ZUTF) and Chengdu Shuangliu Airport (ZUUU), respectively; the red triangles represent the arrival and departure nodes of the Chengdu terminal area; the blue solid lines indicate the sector boundaries; the black solid lines mark the outer boundary of the terminal area.
Objective classification allows the classification of complex severe convective processes into typical synoptic patterns, which help to identify the key controlling factors for the initiation and maintenance of CP events under different patterns, ultimately enhancing the targeting and scenario-based early warning capabilities of aviation meteorological services [17,18,19,20]. In recent years, as machine learning has been widely applied in atmospheric science, clustering algorithms have emerged as important tools for synoptic pattern classification [21]. Methods such as Simulated Annealing and Diversified Randomization Algorithm and K-means have been employed for classification of hourly heavy precipitation or regional extreme precipitation events [22,23]. However, traditional methods still have limitations in compressing high-dimensional features and representing the similarity and evolutionary relationships among different synoptic patterns [24,25]. The Self-Organizing Map (SOM) method, offering the advantages of visualizing dimensionality reduction and topology preservation, can objectively extract typical patterns from complex meteorological fields and characterize their similarities and evolutionary relationships [26,27]. Yang et al. [28] used SOM to classify the large-scale circulations associated with persistent heavy precipitation events in the Yangtze River basin during summer into four typical circulation patterns. Luo et al. [29] compared SOM with EOF in classifying summer precipitation patterns in eastern China. Furthermore, SOM has also been utilized for synoptic pattern clustering of severe convection [30] and to airport weather classification [31].
Although existing studies have made some progress in the classification of convective weather patterns and their impact on aviation operations, most work has focused on synoptic pattern identification or capacity impact assessment [32,33]. Few studies have systematically characterized the spatial coverage features of heavy precipitation under different synoptic patterns and their impacts on key operational nodes in the terminal area from the perspective of the operational environment of the terminal area [34,35]. Therefore, taking the Chengdu terminal area as the study region, this study employs SOM on CP events in this region and classifies the associated weather situation into typical synoptic patterns combined with multi-level circulation structures. Furthermore, spatial coverage-related indicators for the terminal area and key nodes are introduced to quantify the impact of severe precipitation on the available operational airspace and the operations at key nodes in the terminal area, thereby constructing an assessment system oriented toward terminal area operations [36].
2. Data and Methods
2.1. Data and Study Area
This study utilizes the fifth-generation hourly reanalysis data provided by the European Centre for Medium-Range Weather Forecasts spanning from 2010 to 2020, with a spatial resolution of 0.25° × 0.25°. The specific data used encompasses the following variables: CP, geopotential height, horizontal wind fields and vertically integrated water vapor flux. The study area covers the Chengdu terminal area (28.5° N–32.5° N, 102.5° E–106° E), covering the primary arrival and departure routes and approach sectors in the terminal area. Reanalysis data have demonstrated good applicability in characterizing the spatio-temporal evolution of CP processes and representing large-scale circulation configurations. They can satisfy the requirements for objective classification of synoptic patterns and impact analysis of regional-scale precipitation [28], thereby providing a reliable data foundation for classifying CP-related synoptic patterns in the terminal area and exploring their impacts on aircraft operations.
2.2. Self-Organizing Map-Based Synoptic Pattern Classification and Composite Analysis
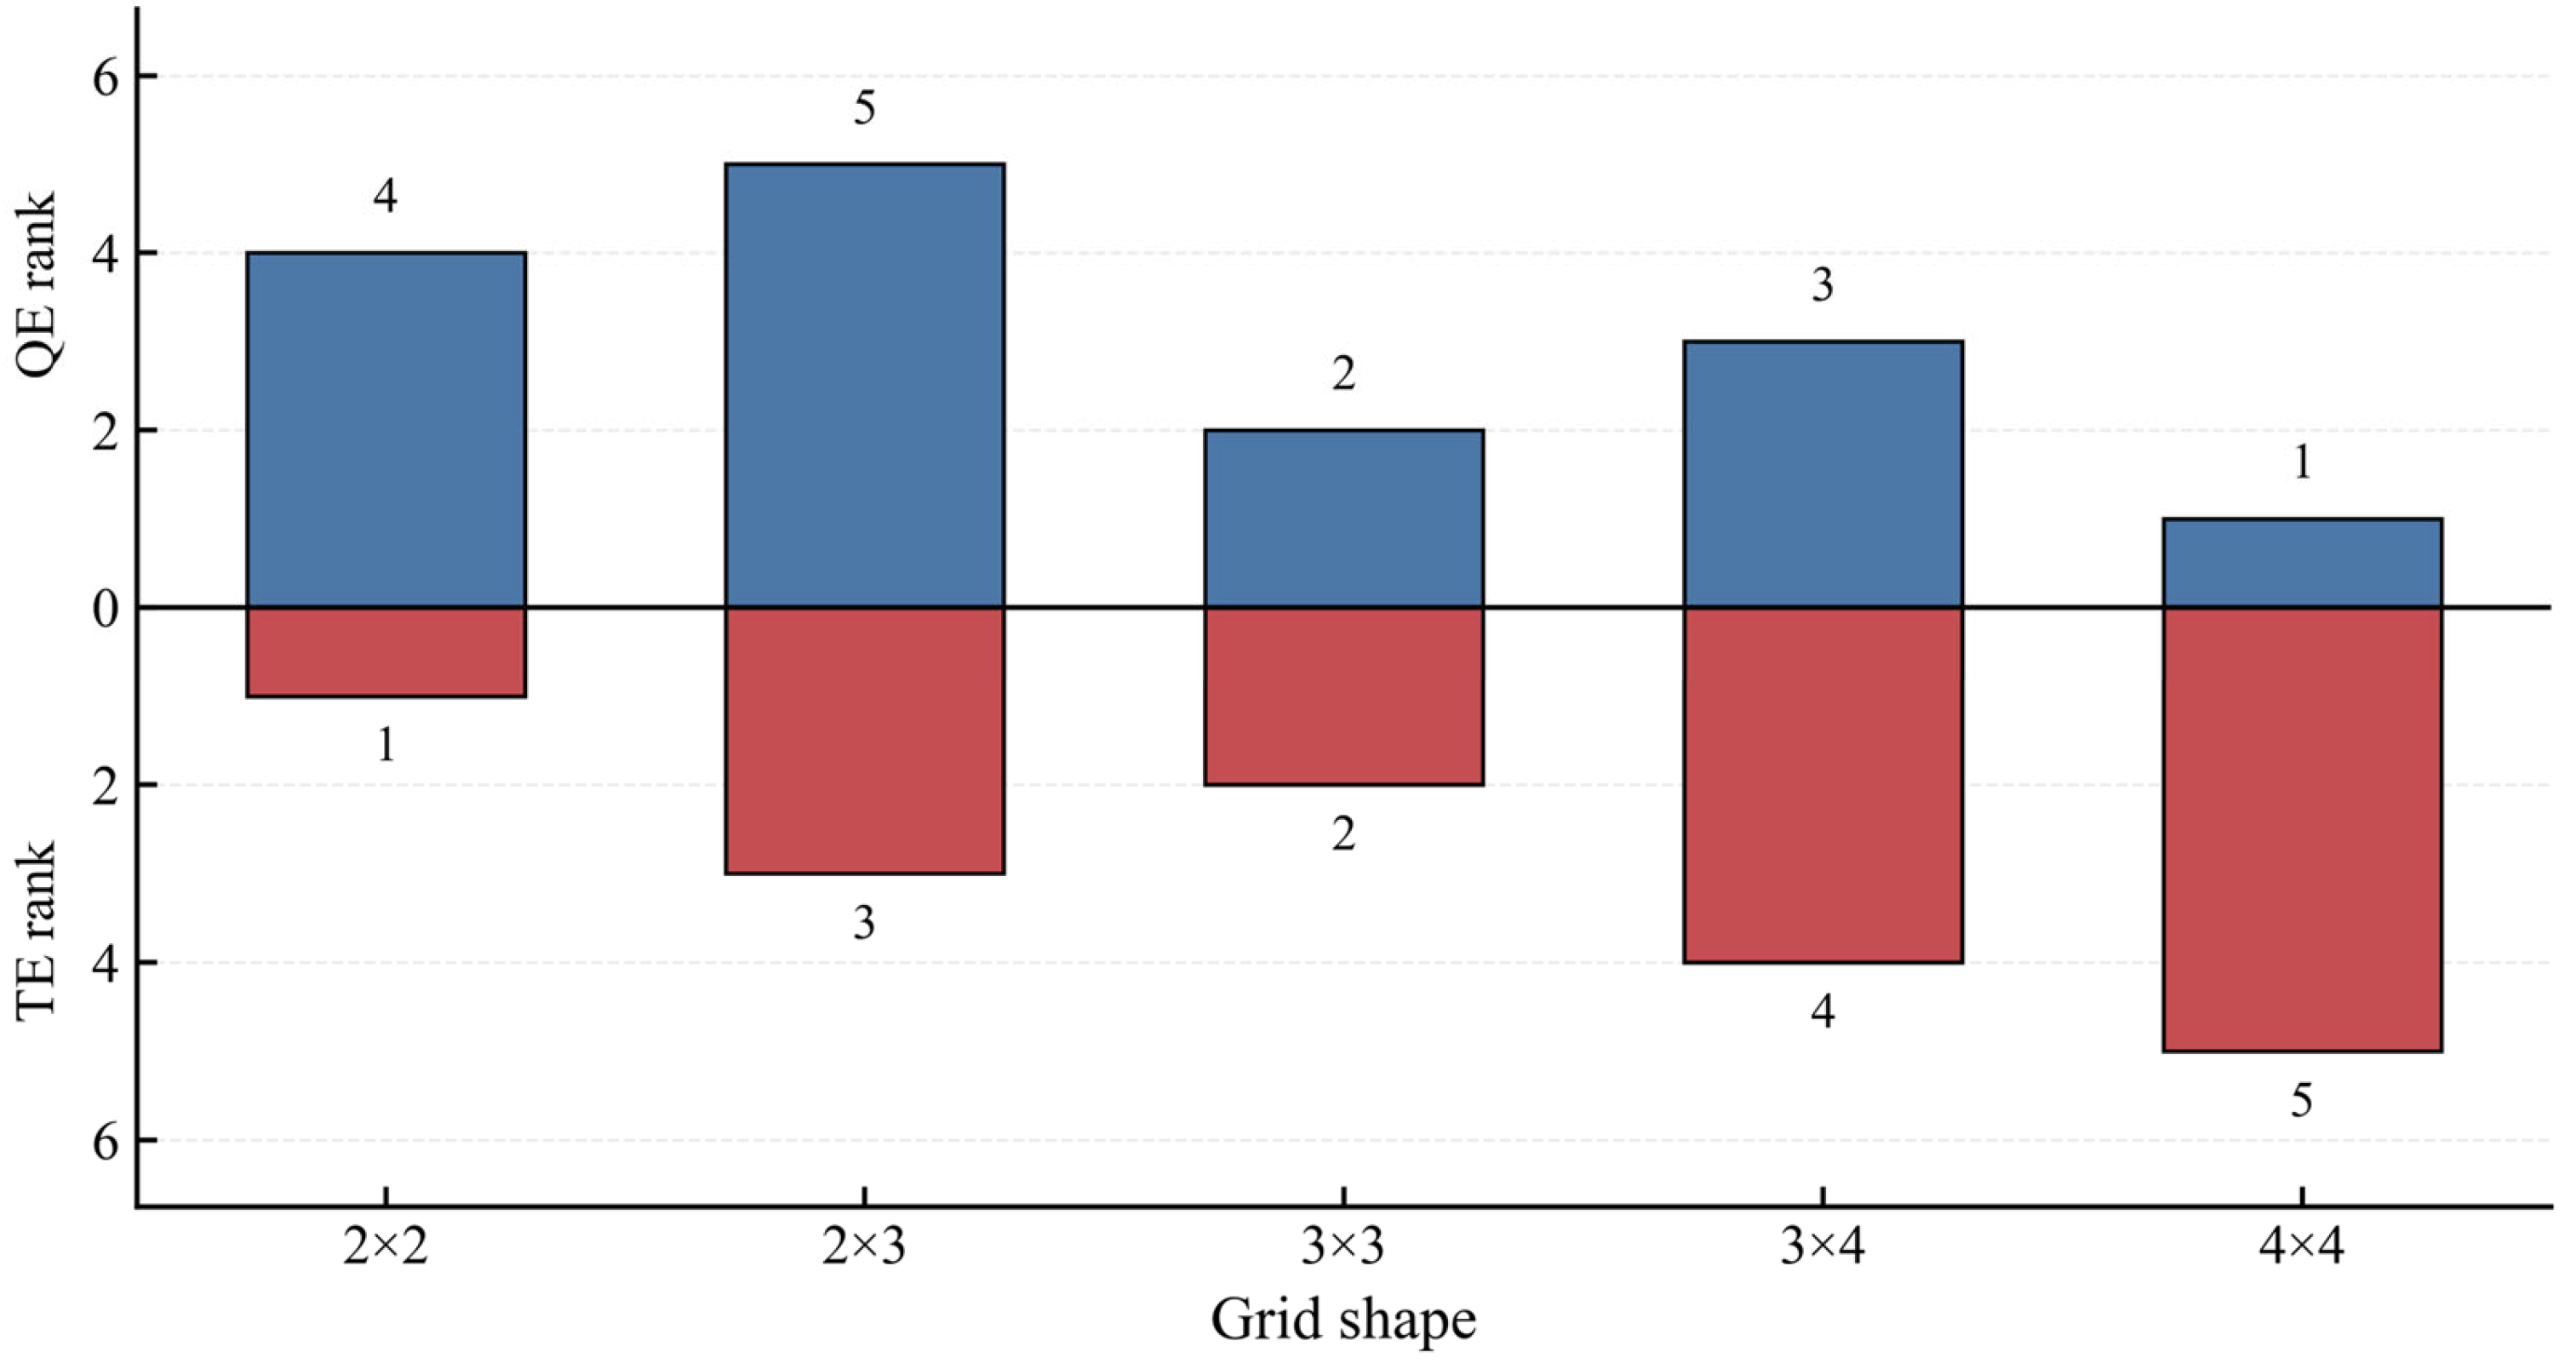
The hourly precipitation fields with non-zero CP in the study area from 2010 to 2020 are selected to form two-dimensional gridded CP fields, which are then flattened into one-dimensional vectors to serve as input samples for SOM training. The SOM employs a two-dimensional grid structure. In this training, five candidate grid sizes are set, and the quantization error (QE) and topological error (TE) are calculated respectively for each. The grid yielding the minimum sum of QE rank and TE rank is considered the optimal grid [37,38,39]. After determining the optimal grid, the Gaussian neighborhood function is applied to achieve convergence through batch training. Upon completion of the training, the best matching unit is calculated for each hourly precipitation sample, and the unit number is assigned as the weather-pattern label for that corresponding hour.
To reveal the differences in atmospheric circulation characteristics associated with different synoptic patterns and provide a basis for subsequent categorizing and quantitative validation of typical weather patterns, composite analyses are performed on geopotential height and horizontal wind fields at 200 hPa, 500 hPa, 700 hPa and 850 hPa based on hourly samples corresponding to each pattern. Furthermore, the t-test is employed as a significance test of the composite results.
3. Synoptic Pattern Classification of Convective Precipitation in the Terminal Area
3.1. Results of Objective Classification Using Self-Organizing Map
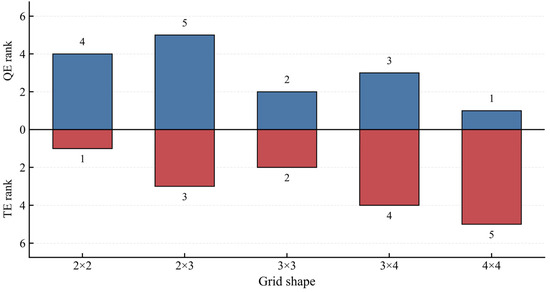
For candidate grid sizes, the corresponding rankings of QE and TE are determined (Figure 2). The results show that the 3 × 3 grid yields the smallest sum of rankings and is thereby selected as the grid size for SOM classification.
Figure 2.
Rankings of quantization error (QE) and topological error (TE) for different Self-Organizing Map (SOM) grid configurations. The horizontal axis represents grid size, and the vertical axis represents ranking; the upper blue bars indicate the QE rankings, and the lower red bars indicate the TE rankings; the numbers atop the bars represent the rankings for corresponding metrics.
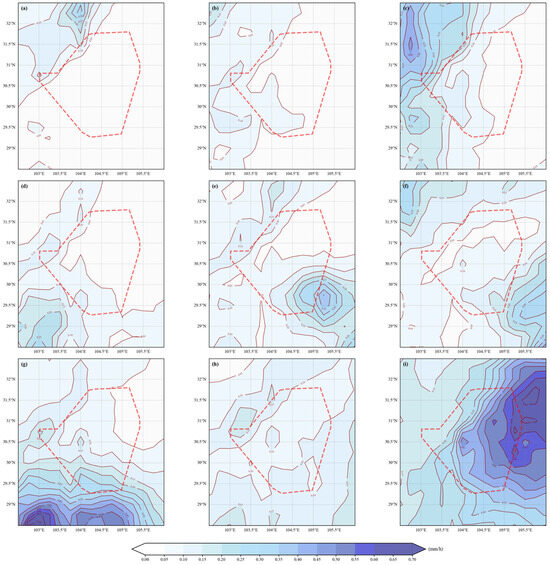
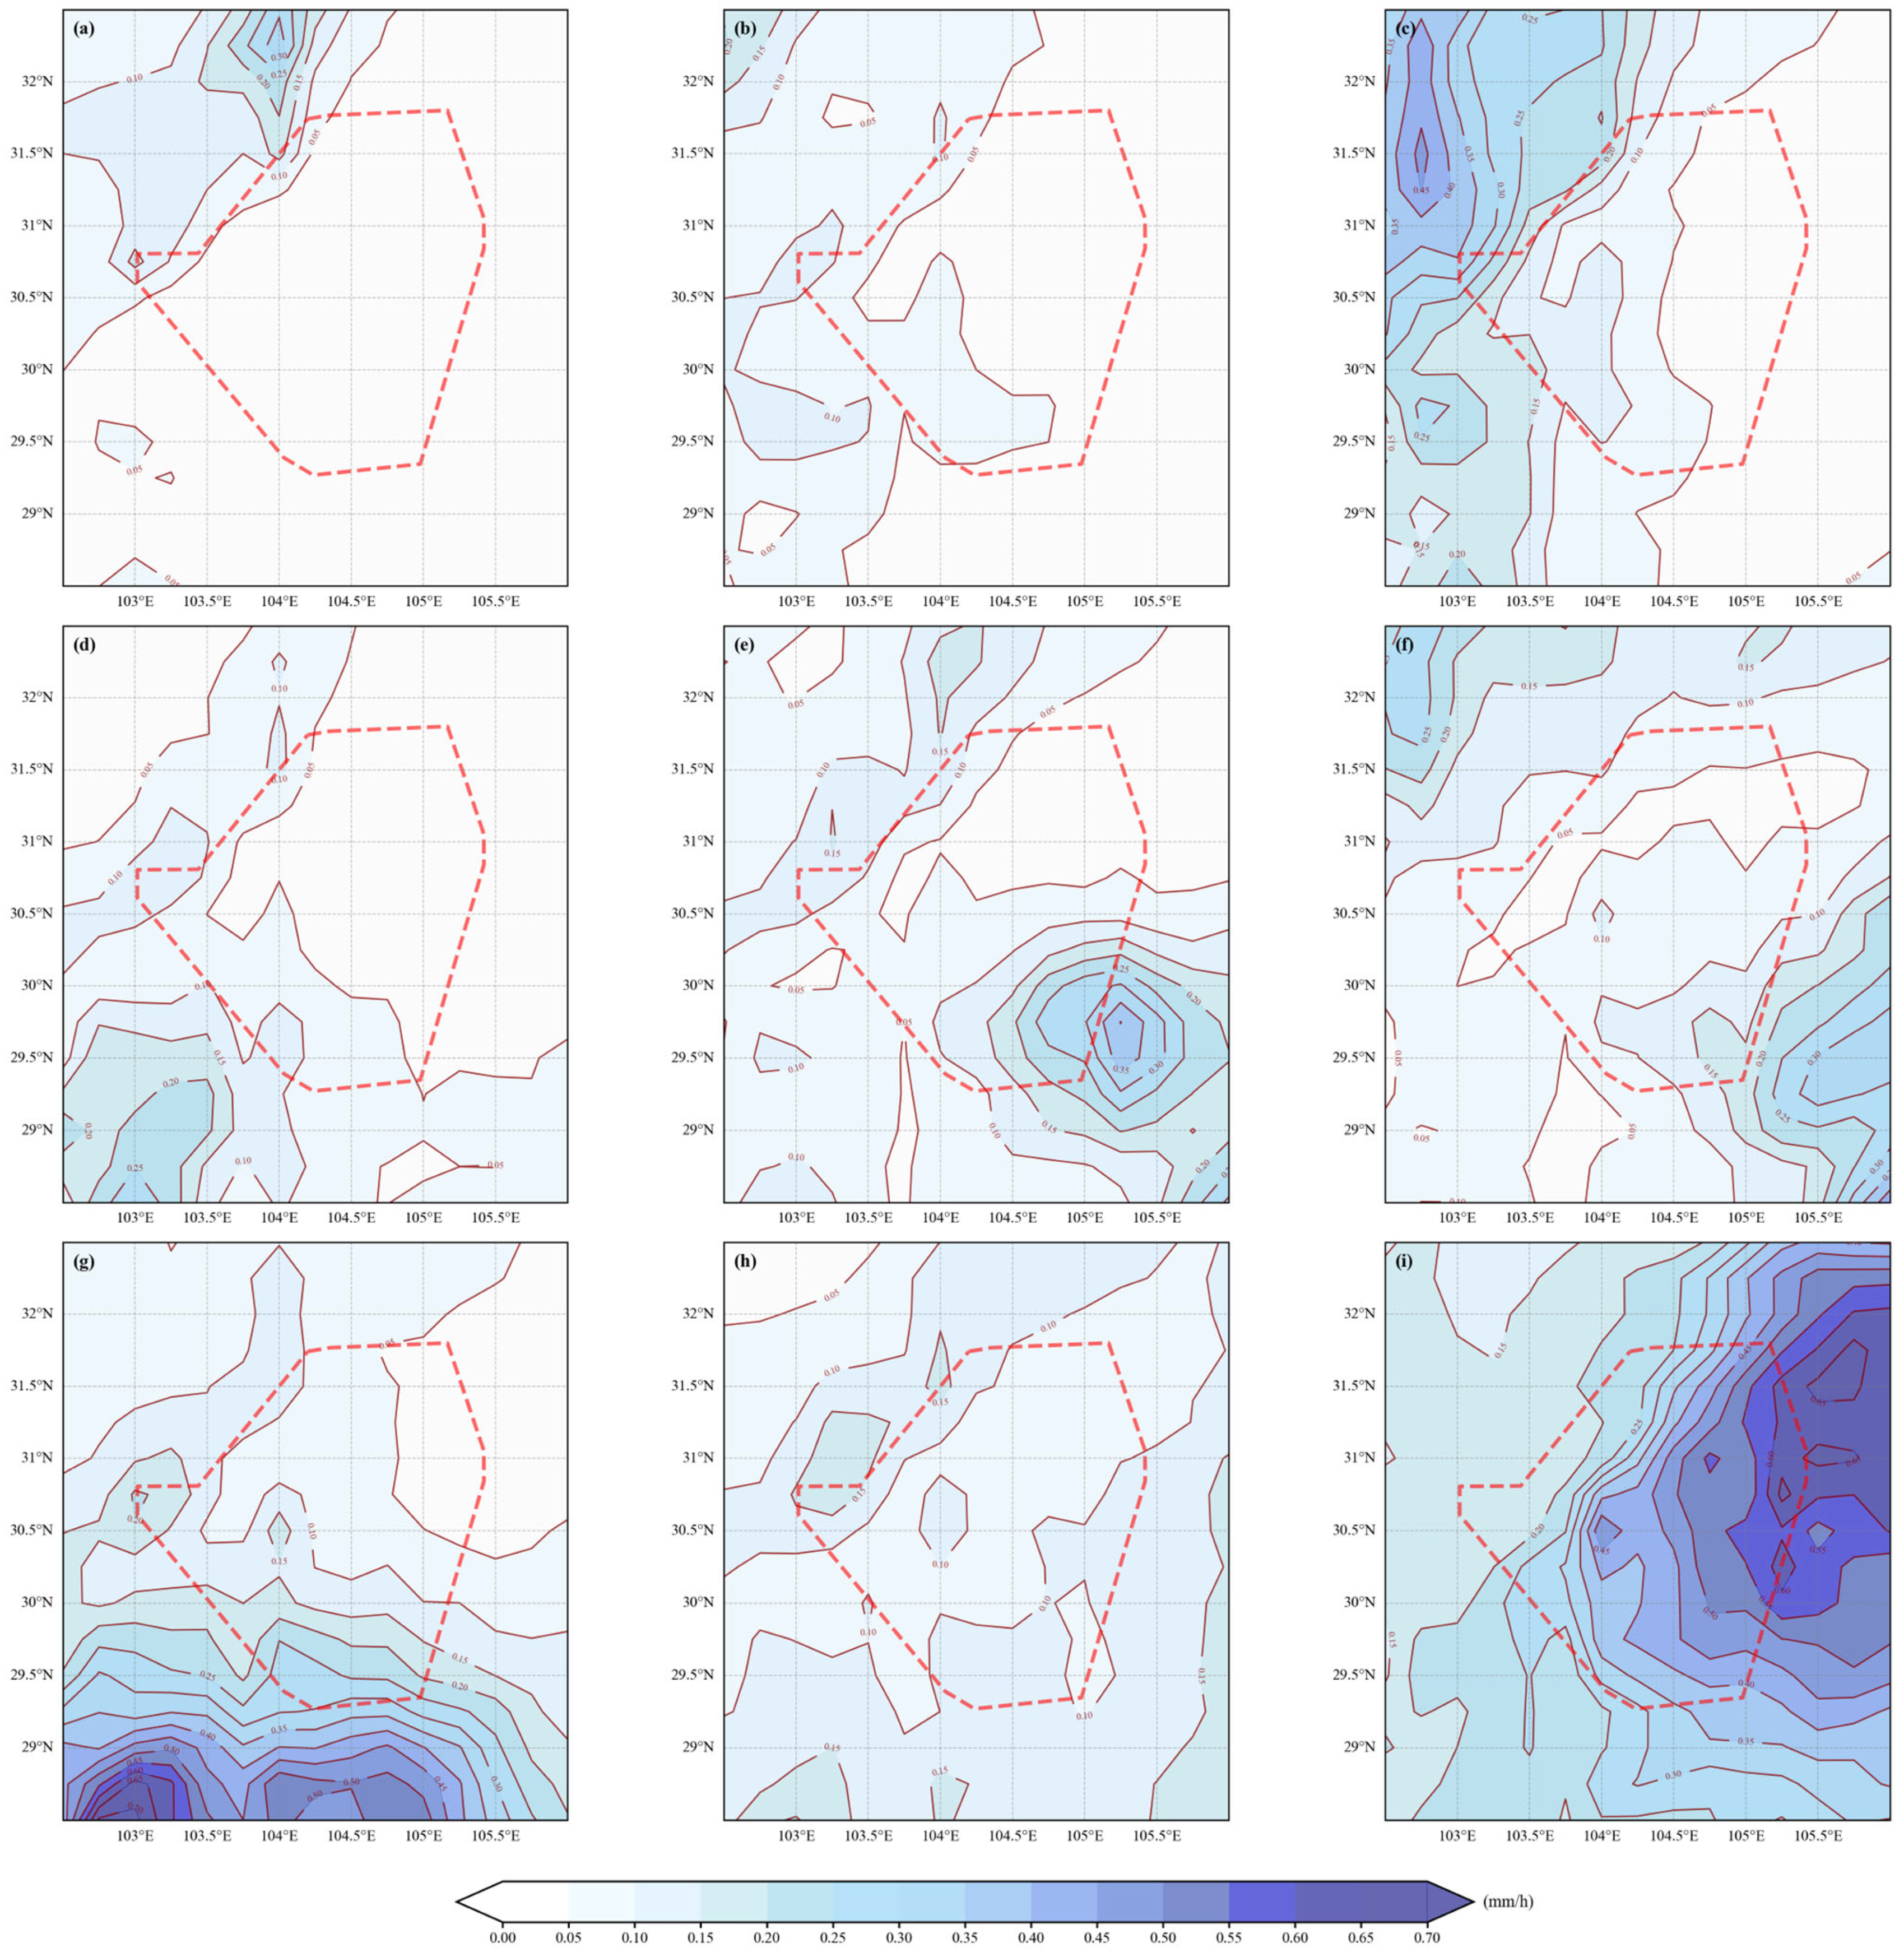
Under this configuration (grid size: 3 × 3), an objective classification is performed on the hourly CP fields over the Chengdu terminal area and its surroundings. Figure 3 shows the spatial distribution of each precipitation pattern and the corresponding frequency. Generally, the frequency ranges from 3.1% to 23.8%, with Pattern i (Figure 3i) accounting for the highest (23.8%) and Pattern e (Figure 3e) the lowest (3.1%). Additionally, to examine the sensitivity of the classification results to the sample period, a test was performed on an extended data period following the same data processing procedure. The findings reveal that the main spatial patterns of convective precipitation during 2010–2020 are generally robust, though the occurrence frequencies of individual types might be subject to interannual climatic anomalies.
Figure 3.
Composite mean fields for SOM-based classification results of regional convective precipitation (CP) in the terminal area (unit: mm·h−1). Panels (a–i) show the spatial distributions of Pattern a–i, respectively, with corresponding occurrence frequencies of 12.5%, 7.2%, 19.8%, 8.0%, 3.1%, 5.9%, 14.1%, 5.5%, and 23.8%. The red dashed line indicates the simplified outline of the terminal area.
3.2. Typical Synoptic Patterns of Convective Precipitation in the Chengdu Terminal Area
The characteristics of general atmospheric circulations associated with each precipitation pattern are further analyzed. Based on similarities in circulation patterns in the middle and upper levels and moisture transport, the objective classification results are then categorized into typical synoptic patterns for CP in the terminal area.
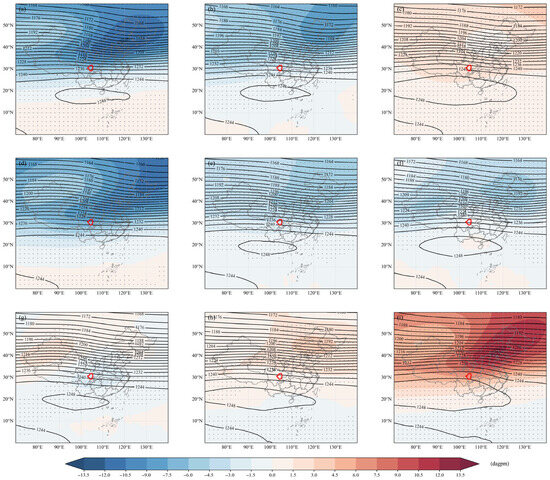
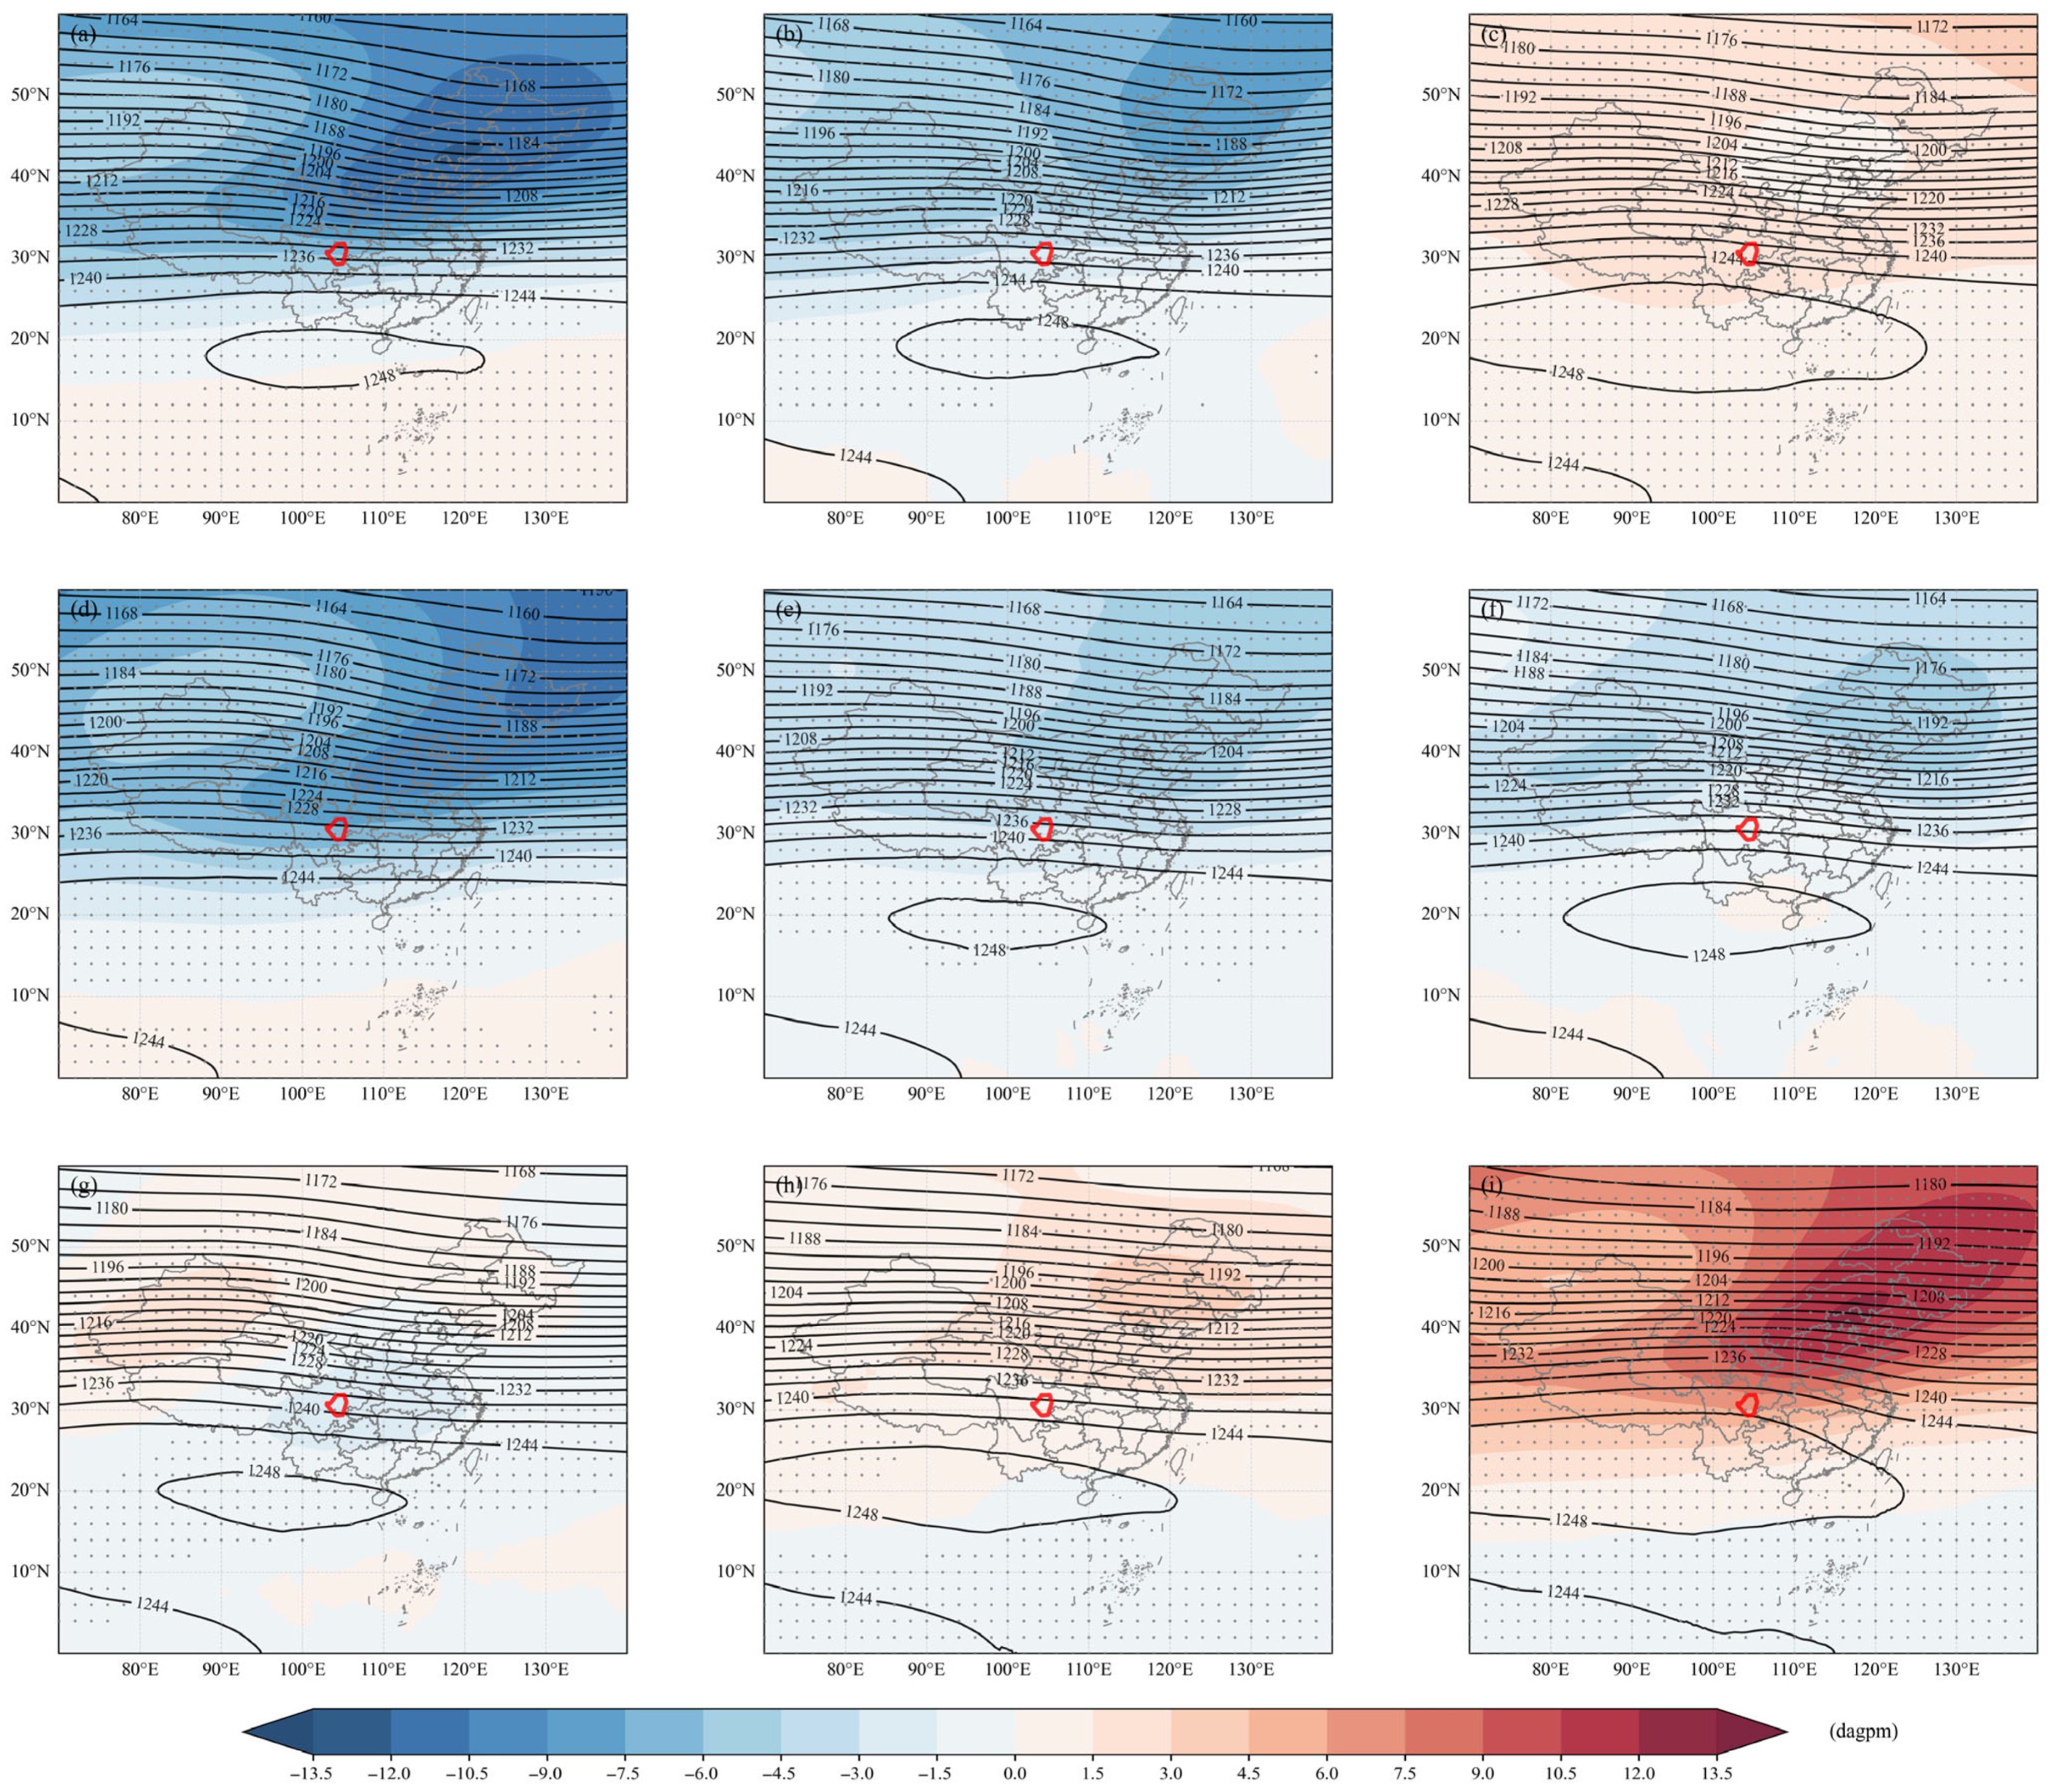
Figure 4 illustrates the distributions of 200-hPa geopotential height anomalies corresponding to the nine patterns of CP. Overall, the Chengdu terminal area is mostly situated within the influence range east or northeast of the South Asian high (SAH). However, the upper-level circulation backgrounds vary significantly across different patterns. For Patterns a, b, d, e and f (Figure 4a,b,d–f), the mid-latitude region of East Asia is dominated by negative geopotential height anomalies, with more pronounced negative anomalies in the east. Correspondingly, the main body of the SAH is confined to the southern Tibetan Plateau, with markedly weakened eastward extension, reduced intensity and a more southerly ridge line. This indicates that the upper-level circulation provides relatively limited support for convective development and the maintenance of upward motion over the terminal area. The Chengdu terminal area is mostly located within or on the edge of negative-anomaly areas, where the upper-level circulation conditions are relatively unfavorable. For Patterns c, g, h and i (Figure 4c,g–i), positive geopotential height anomalies prevail over the mid-latitude region of East Asia and its adjacent high-latitude regions. This corresponds to a stronger SAH with a more northerly ridge line. In this case, the upper-level circulation configuration is more favorable for the development of CP over the Chengdu terminal area. Specifically, Pattern i exhibits the strongest SAH, with the farthest north position and the most pronounced eastward extension among these four patterns, while Patterns c, g and h are characterized by an SAH of lesser intensity and a ridge line with a similarly northerly position but slightly weaker eastward extension than that of Pattern i. The Chengdu terminal area is located on the southern side or on the edge of the positive-anomaly areas, indicating stronger support from the upper-level circulation conditions for precipitation development.
Figure 4.
Geopotential height anomaly and mean fields at 200 hPa for nine objective synoptic patterns of CP, shown in panels (a–i) for Patterns a–i, respectively. Shaded areas indicate geopotential height anomaly, and dotted areas indicate the values statistically significant at the 99% confidence level. Contours represent the mean geopotential height fields (unit: dagpm). The red closed polygon indicates the Chengdu terminal area.
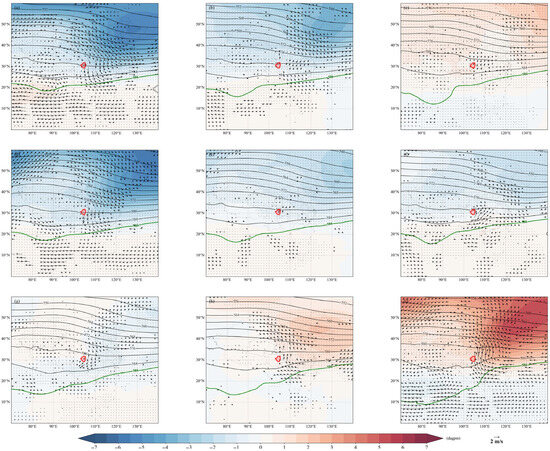
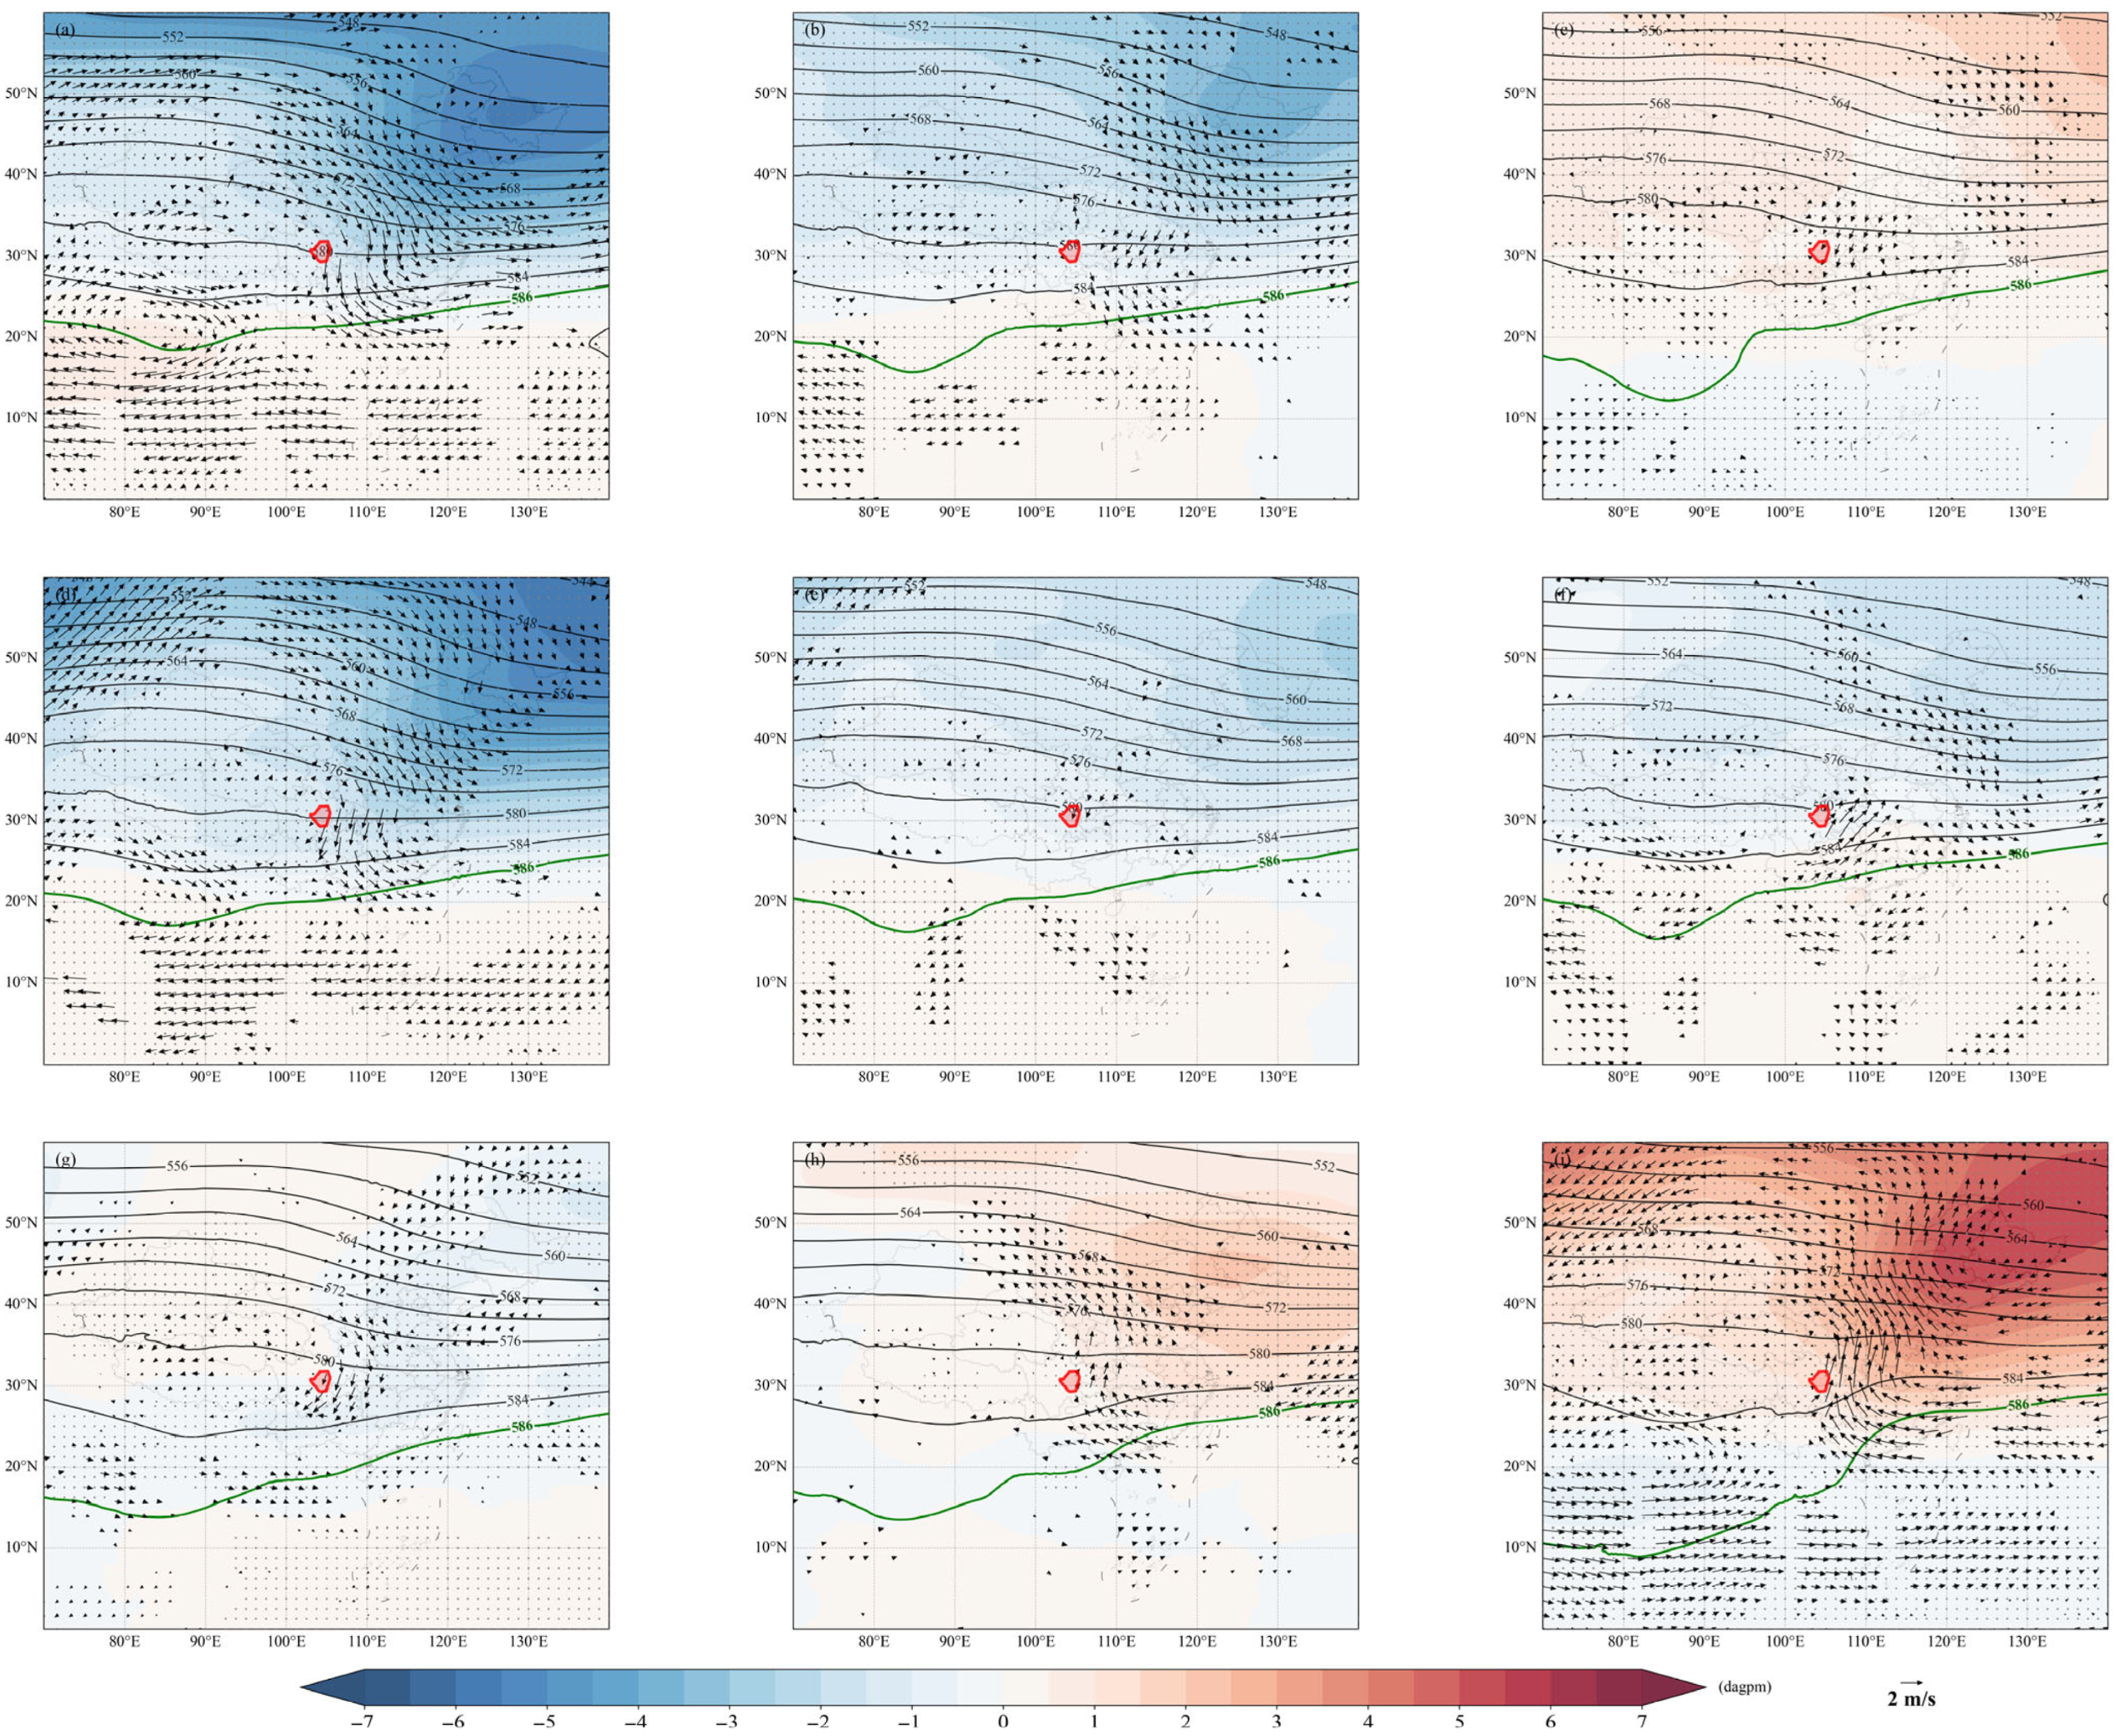
Figure 5 shows the composite anomalies of the 500-hPa geopotential height and 700-hPa wind fields for each pattern. Overall, all nine patterns exhibit trough-ridge activity over the mid-high latitudes of East Asia, with the Chengdu terminal area located near the northwestern periphery of the western Pacific subtropical high (WPSH). The configurations between mid-high latitude circulation patterns and WPSH jointly influence the convergence between cold and warm air and the moisture conditions over the terminal area.
Figure 5.
500-hPa geopotential height anomaly and mean fields, and 700-hPa horizontal wind anomaly fields for nine objective patterns of CP, with panels (a–i) corresponding to Patterns a–i, respectively. Shaded areas indicate a 500-hPa geopotential height anomaly, and dotted areas indicate the values are statistically significant at the 99% confidence level. Black contours represent the 500-hPa mean geopotential height, and green lines indicate the 586-dagpm contour (unit: dagpm). Vectors represent those 700-hPa horizontal wind anomalies that have passed the significance test at the 95% confidence level (unit: m·s−1). The red closed polygon indicates the Chengdu terminal area.
For Patterns a, b, d, e and f (Figure 5a,b,d–f), negative geopotential height anomalies prevail over the mid-high latitudes, characterized by a “lower in the east and higher in the west” pattern, corresponding to a trough from the Lake Baikal to the west of the Sea of Okhotsk. The terminal area is located at the rear of the trough, where cold air intrudes into the terminal area southward from high latitudes. On the 700-hPa wind fields, Patterns a, b, d and e all display cold air from high latitudes. Specifically, Patterns a and d feature relatively stronger northerly winds that directly converge with warm-moist air from low latitudes, which are more favorable for precipitation formation. In contrast, for Patterns b and e, the high-latitude cold air is relatively weaker, or its influence is less distinct. Under Patterns c and g (Figure 5c,g), the geopotential height in mid-high latitudes exhibits positive anomalies, presenting a distribution pattern of “low in the west and high in the east”. Although the associated trough is weakened, the cold air can still move southward from high latitudes under the guidance of the northerly airflow behind the trough. Under Patterns h and i (Figure 5h,i), the geopotential height in mid-high latitudes also exhibits a distribution of “low in the west and high in the east”. However, the positive geopotential height anomaly on the eastern side is evidently stronger than that under Patterns c and g, indicating a further weakening of the trough.
According to the position of the 586-dagpm contour line, the Chengdu terminal area is generally located near the northwestern periphery of the WPSH under the nine patterns. However, there are distinct differences in the intensity, position and westward extension of the WPSH across different patterns. Under Patterns a, b, d, e and f, the WPSH is relatively weak, with a farther south position, and shows no evident westward extension. Under Patterns c and g, the WPSH is moderately strong and located slightly farther north, with moderate westward extension. Under Patterns h and i, the WPSH is the strongest and positioned farthest north, with the most pronounced westward extension.
The upper- and lower-level circulation configurations of 200-hPa SAH and 500-hPa WPSH are further analyzed. It can be seen that under Patterns a, b, d, e and f, both SAH and WPSH are relatively weaker and located farther south, while the troughs in mid-high latitudes are relatively stronger. In this case, the terminal area is largely influenced by the northerly airflow from the rear of the trough, while the warm-moist moisture transport conditions are poor, resulting in relatively weak precipitation. Under Patterns c and g, both SAH and WPSH are moderately strong and positioned slightly farther north, and the WPSH exhibits a certain degree of westward extension. The coupling effect between the upper- and lower-level circulations is secondary, corresponding to moderate precipitation intensity. Under Patterns h and i, both SAH and WPSH are strong and generally located farther north, with the WPSH presenting the most pronounced westward extension and northward shift. The coupling between the upper-level SAH and the mid-level WPSH is more favorable for moisture transport and upward motion near the terminal area, thereby causing the strongest precipitation.
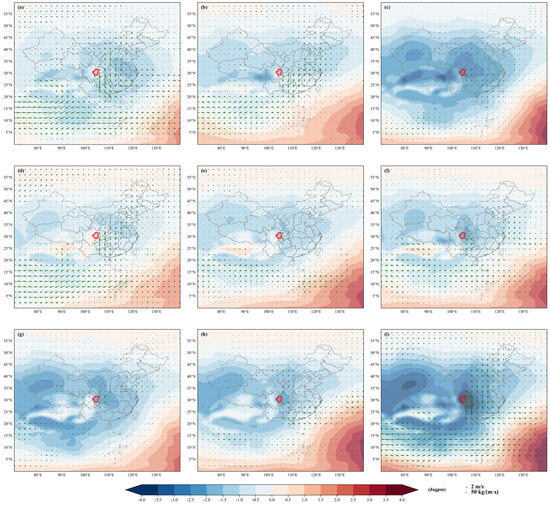
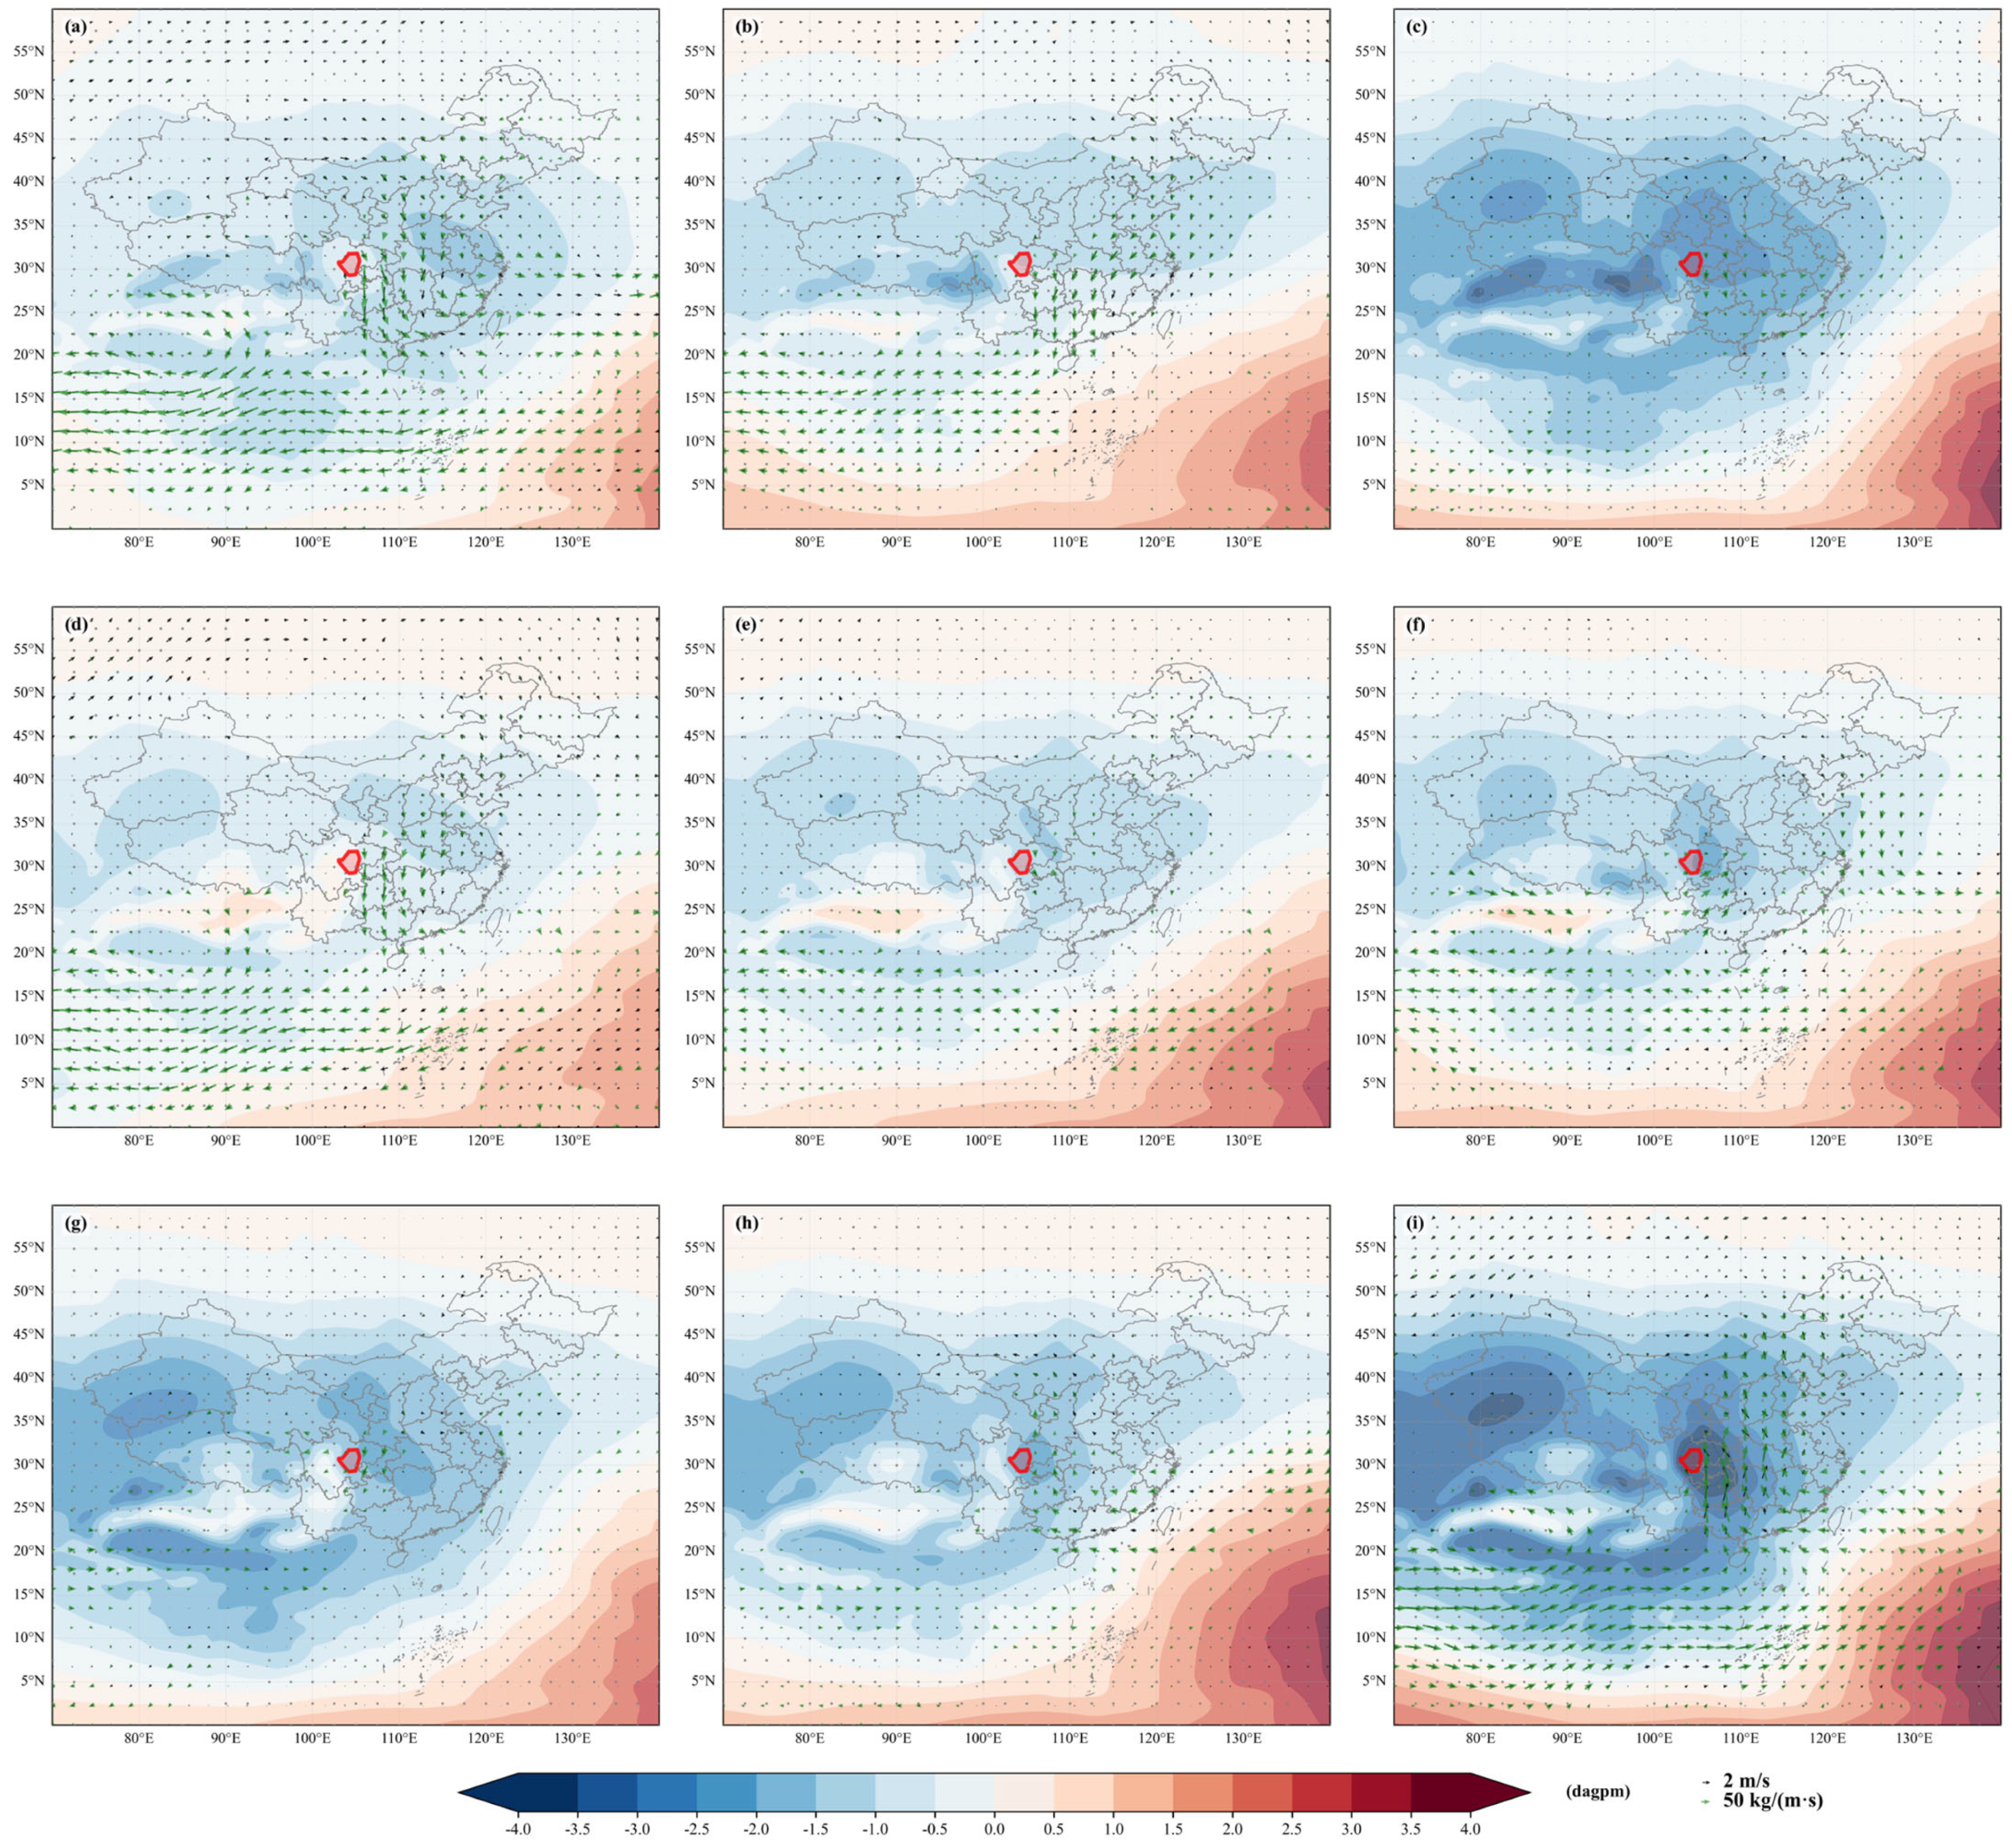
Figure 6 illustrates the distributions of anomaly fields of 850-hPa wind, 850-hPa geopotential height and integrated water vapor flux for each pattern. Overall, the terminal area is generally located within regions with negative or slightly negative geopotential height anomalies. However, there are distinct differences in low-level disturbance intensity and moisture transport conditions among these patterns. Under Patterns a, b, d, e and f (Figure 6a,b,d–f), the terminal area is located in regions with weak negative or near-neutral geopotential height anomalies, and correspondingly, the low-level circulation disturbances are relatively weak. Meanwhile, the water vapor flux transported from low-latitude tropical oceans to the vicinity of 30° N exhibits a southwest-northeast orientation, providing a basic moisture condition for the Chengdu terminal area. However, the water vapor flux anomalies under these patterns are generally weak, primarily dominated by weak transport from the western Pacific warm pool, while the transport from the Bay of Bengal is relatively weakened. Additionally, there is an anticyclonic anomaly of moisture transport east of the terminal area, suggesting relatively poor conditions for moisture convergence. Under Patterns c and g (Figure 6c,g), the terminal area is located within an area with relatively evident negative geopotential height anomalies, which corresponds to stronger low-level disturbances that are more favorable for precipitation development near the terminal area. Regarding water vapor transport, it is dominated by transport from the Bay of Bengal and the South China Sea, accompanied by supplementary water vapor from the western Pacific warm pool. Moisture convergence near the terminal area is relatively pronounced, thereby providing abundant water vapor conditions for precipitation formation. Under Patterns h and i (Figure 6h,i), the terminal area is also located near the center of pronounced negative geopotential height anomalies, where low-level disturbances are more favorable for precipitation development. As for water vapor, the terminal area is jointly influenced by three moisture transport channels—the Bay of Bengal, the South China Sea and the western Pacific warm pool. The intensity of water vapor flux anomalies is markedly stronger than that under other patterns, resulting in the most prominent moisture convergence near the terminal area and offering the most abundant water vapor for severe CP.
Figure 6.
Anomaly fields of 850-hPa geopotential height, 850-hPa horizontal wind and vertically integrated water vapor flux for nine objective patterns of CP, with panels (a–i) corresponding to Patterns a–i, respectively. Shaded areas indicate the 850-hPa geopotential height anomaly, and dotted areas indicate those values that are statistically significant at the 95% confidence level (unit: dagpm). Black vectors represent the 850-hPa horizontal wind anomaly (unit: m·s−1). Green vectors represent the vertically integrated water vapor flux anomaly, and those vectors shown indicate the values that are statistically significant at the 95% confidence level (unit: kg·m−1·s−1). The red closed polygon indicates the Chengdu terminal area.
Considering the similarities in multi-level circulation configurations and water vapor transport features, this study merges the nine objective patterns into three typical synoptic types, as summarized in Table 1. Hierarchical clustering analysis indicates that the quantitative clustering results are generally consistent with the grouping scheme in this study, confirming the rationality of the classification results of typical synoptic patterns.
Table 1.
Correspondence between typical synoptic patterns and objective patterns.
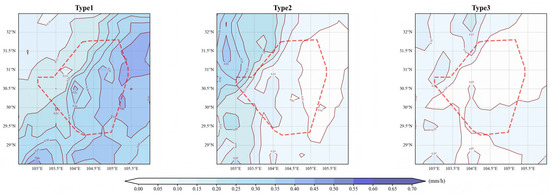
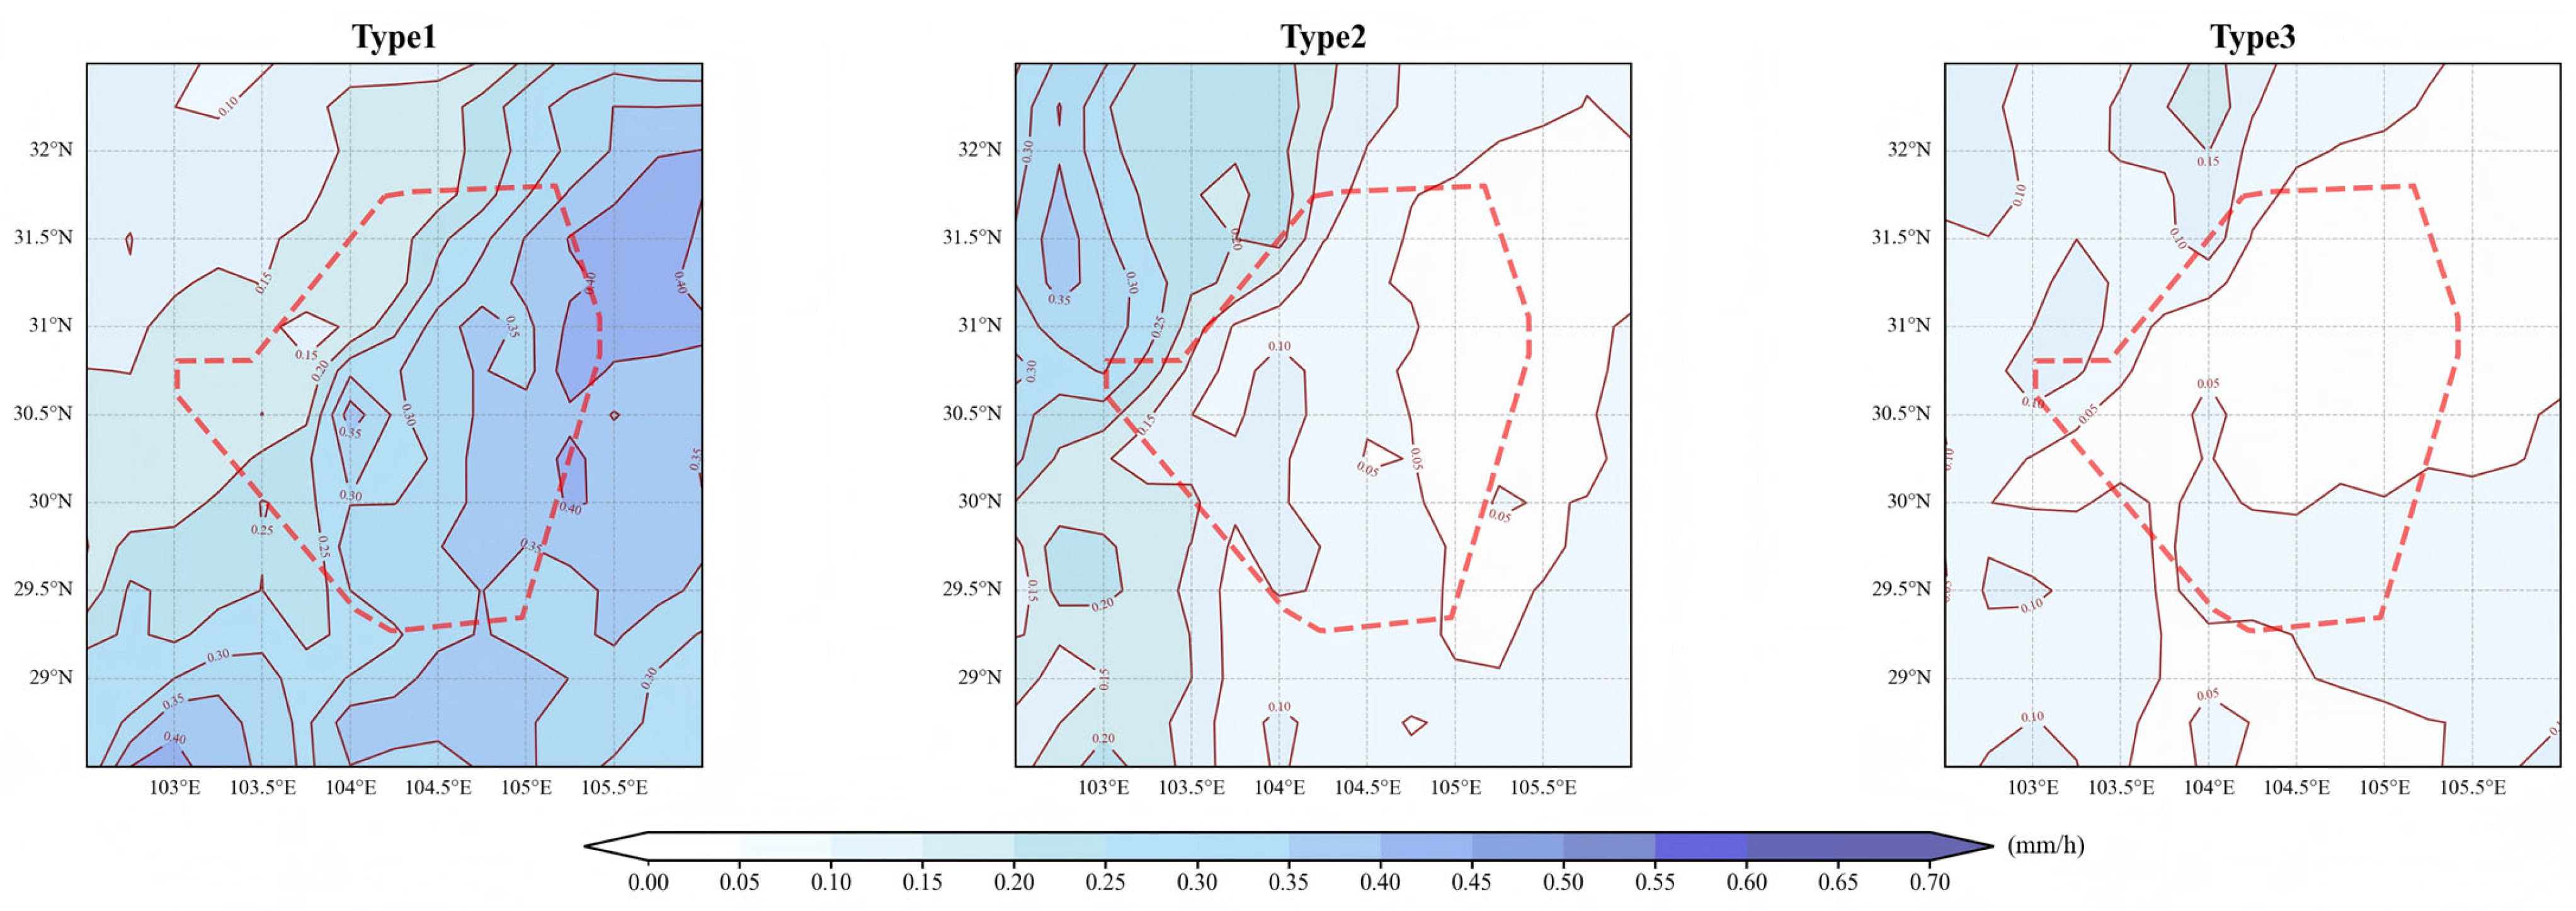
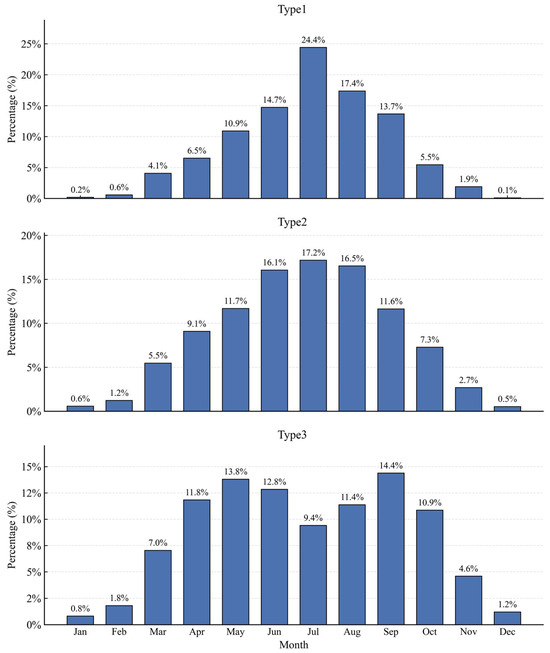
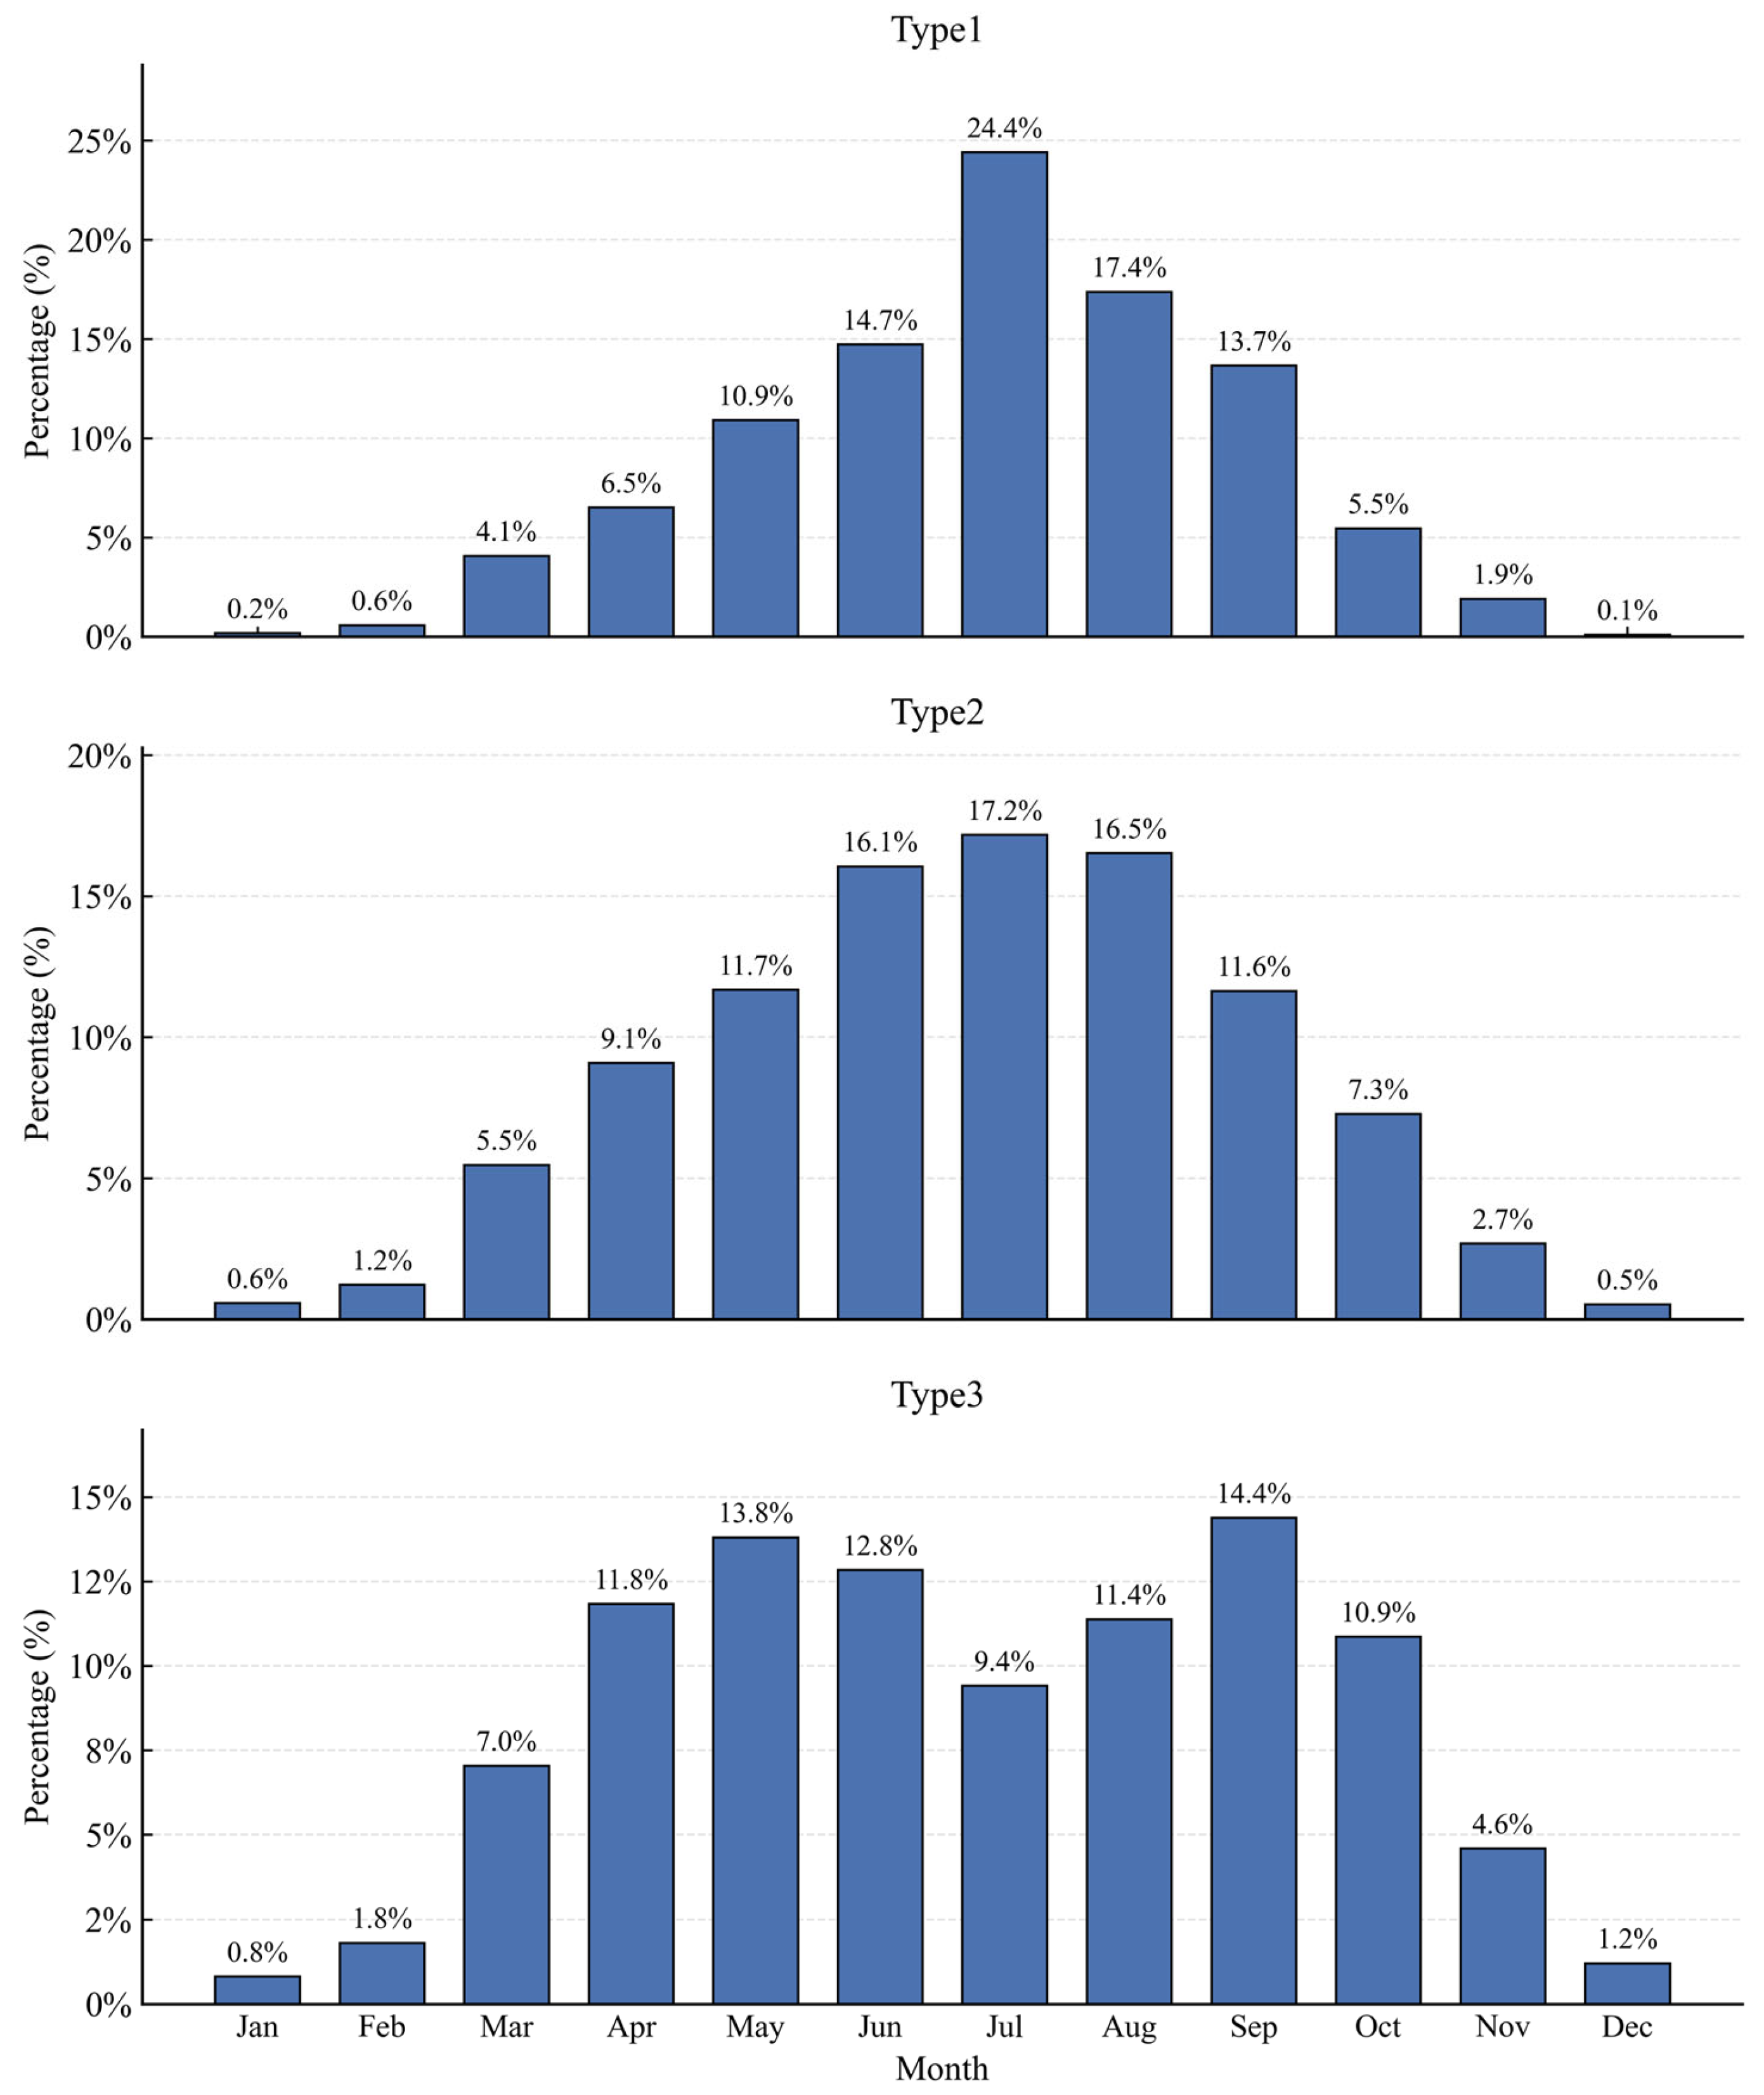
The distributions of CP for the three typical synoptic types are shown in Figure 7. Distinct differences are observed among different synoptic types in terms of precipitation intensity, spatial coverage and monthly distribution characteristics. Specifically, Type 1 exhibits the strongest precipitation, with extensive areas of high value primarily located in the central-eastern and northeastern parts of the terminal area. The relatively dense contours indicate the most severe convective activity. As shown in Figure 8, Type 1 mainly appears from June to September, with the highest proportion in July (24.4%), followed by August (17.4%) and September (13.7%), demonstrating an evident concentration in mid-summer. For Type 2, the precipitation exhibits an even distribution, with high-value areas mainly concentrated on the western and northwestern sides of the terminal area, gradually weakening eastward and presenting a distinct pattern of “strong in the west and weak in the east”. In terms of monthly variation, Type 2 primarily occurs from May to August, with July accounting for the highest proportion (17.2%), followed by June (16.1%) and August (16.5%), indicating that this type is mainly active from early summer to mid-summer. Type 3 exhibits relatively weak precipitation, with only scattered high-value centers at local edges. The relatively sparse contours imply limited influence of convective systems. The temporal variation of Type 3 is relatively more dispersed, spanning from April to October. The proportion peaks in September (14.4%) and reaches 13.8% and 12.8% in May and June, respectively, suggesting that this type may occur from late spring to early autumn to a certain extent.
Figure 7.
Composite mean fields for CP under the three synoptic types (unit: mm·h−1). The red dashed line indicates the simplified outline of the terminal area.
Figure 8.
Monthly probability distributions of samples for the three synoptic types.
4. Impacts of Precipitation on Terminal Area Operations Under Different Synoptic Types
4.1. Distribution Characteristics of Heavy Precipitation Under Different Synoptic Types
Terminal area operations are highly sensitive to short-duration heavy rainfall. To highlight the most sensitive precipitation scenarios that exert a more substantial impact on operations, this study further selects hourly precipitation events with an intensity ≥ 8.0 mm·h−1 as heavy precipitation samples [40]. This threshold is determined according to the precipitation intensity classification criteria defined in Specifications for Surface Meteorological Observation in Civil Aviation.
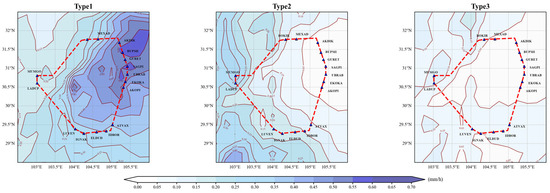
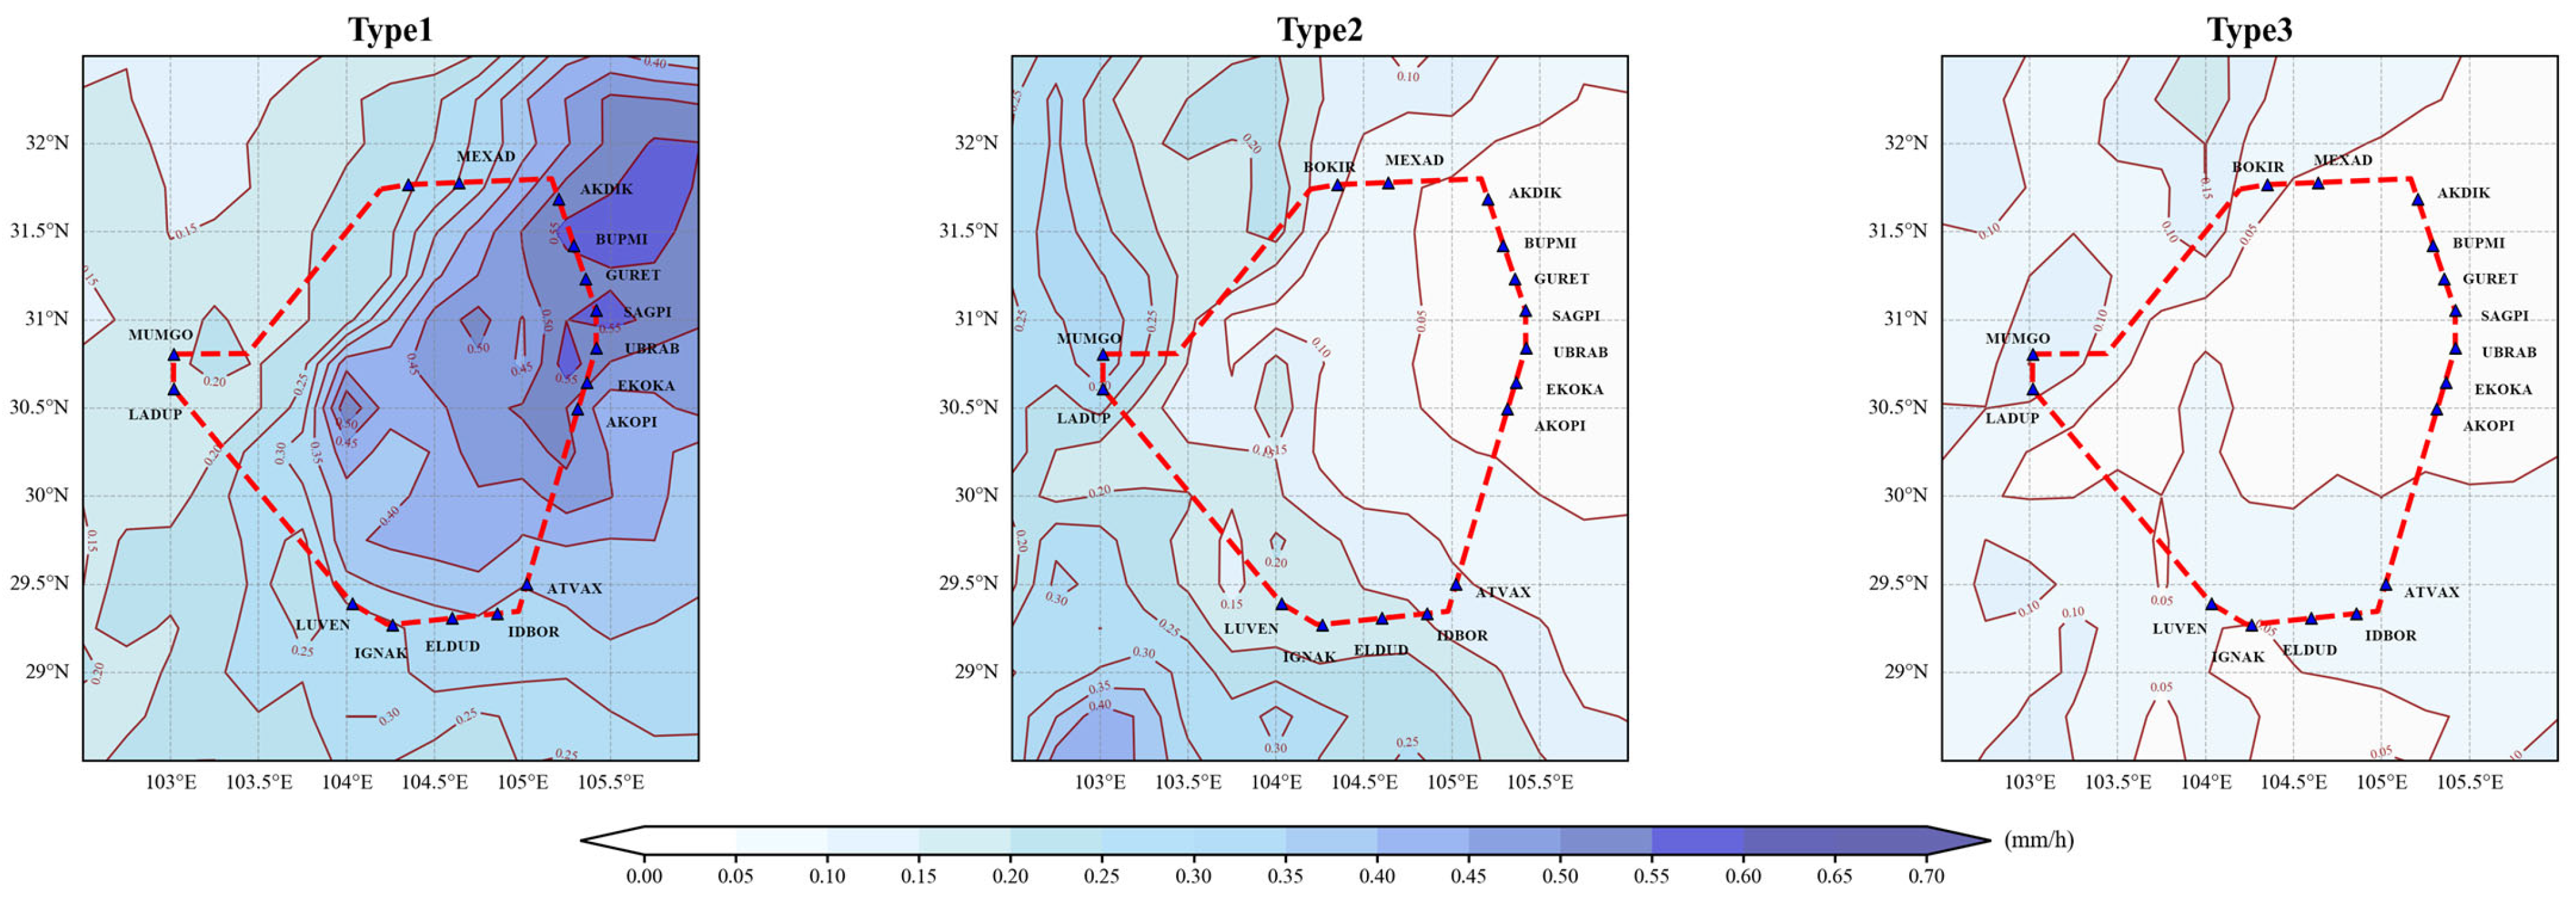
As shown in Figure 9, there are distinct differences in the spatial distributions of CP during heavy precipitation events among the three synoptic types. Type 1 exhibits the strongest CP, mainly concentrated within the terminal area and on its northeastern side, primarily covering the main arrival and departure nodes on the eastern side, such as BUPMI, GURET and SAGPI. The precipitation generally shows a relatively extensive distribution of high values, indicating that this type is most conducive to the development of severe CP. For Type 2, the precipitation exhibits the second-strongest intensity, with high values mainly located in the western and southwestern parts of the terminal area, primarily covering the arrival and departure nodes on the western side, such as MUMGO and LADUP. The precipitation area is smaller than that under Type 1. In contrast, Type 3 exhibits the weakest CP, with only scattered weak precipitation distributed in and around the terminal area, exhibiting no distinct high-value centers. This indicates that this type provides relatively weak support for precipitation.
Figure 9.
Composite mean fields for heavy precipitation samples of the three synoptic types (mm·h−1). The red dashed line indicates the simplified outline of the terminal area. The blue triangles represent the arrival and departure nodes of the Chengdu terminal area.
4.2. Characteristics of Impact Indicators on Terminal Area Operations Under Different Synoptic Types
In this study, a regional-scale spatial coverage indicator Weather Severity Index (WSI), and a coverage indicator for key operational nodes, Node Coverage Index (NCI), are constructed. Based on the identification of heavy precipitation events, WSI is used to characterize the coverage proportion of heavy precipitation within the terminal area, while NCI is used to characterize the proportion of arrival and departure nodes covered by heavy precipitation in the terminal area. At a given time, if the convective precipitation intensity at a certain grid point within the terminal area reaches the heavy precipitation threshold (provided the intensity data are not missing), this grid point is considered to be covered by heavy precipitation. For critical arrival and departure nodes, the identification depends on whether the precipitation intensity at the nearest neighboring grid point meets the same threshold.
Based on the gridded method for assessing weather-impacted airspace capacity and operations [33], this study constructs the WSI specifically for the terminal area, which is defined as follows:
where represents the set of hourly times corresponding to the k-th synoptic type and is the total number of samples for this type. denotes the area of the terminal airspace covered by heavy precipitation for this type. represents the total area of the terminal airspace. A larger WSI value indicates a broader spatial coverage of heavy precipitation in the terminal area, which suggests that heavy precipitation is more likely to affect multiple arrival and departure routes and a larger area of the terminal airspace simultaneously.
Based on the method from existing studies that matches the spatial extent of precipitation clouds with traffic operation elements in the terminal airspace [34], we construct the NCI for key operational nodes in the terminal area.
where denotes the number of key operational nodes identified as being covered by heavy precipitation at time . represents the total number of key arrival and departure nodes in the terminal area (given that the number of arrival and departure nodes in the Chengdu terminal area is 16, the value of is fixed at 16). A larger NCI value suggests greater impact of heavy precipitation on these key operational nodes for that particular synoptic type.
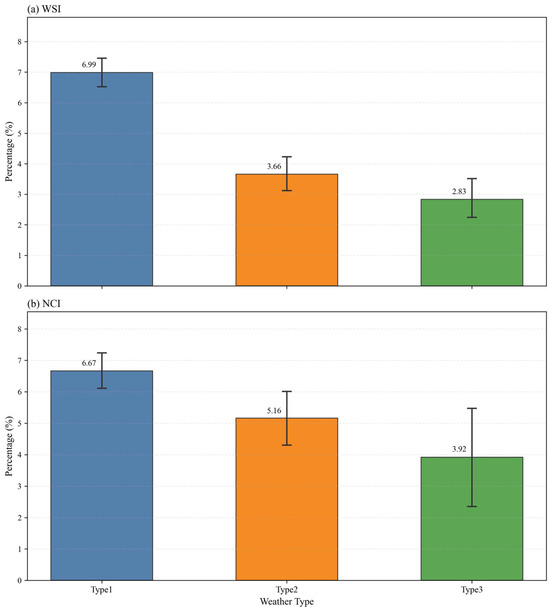
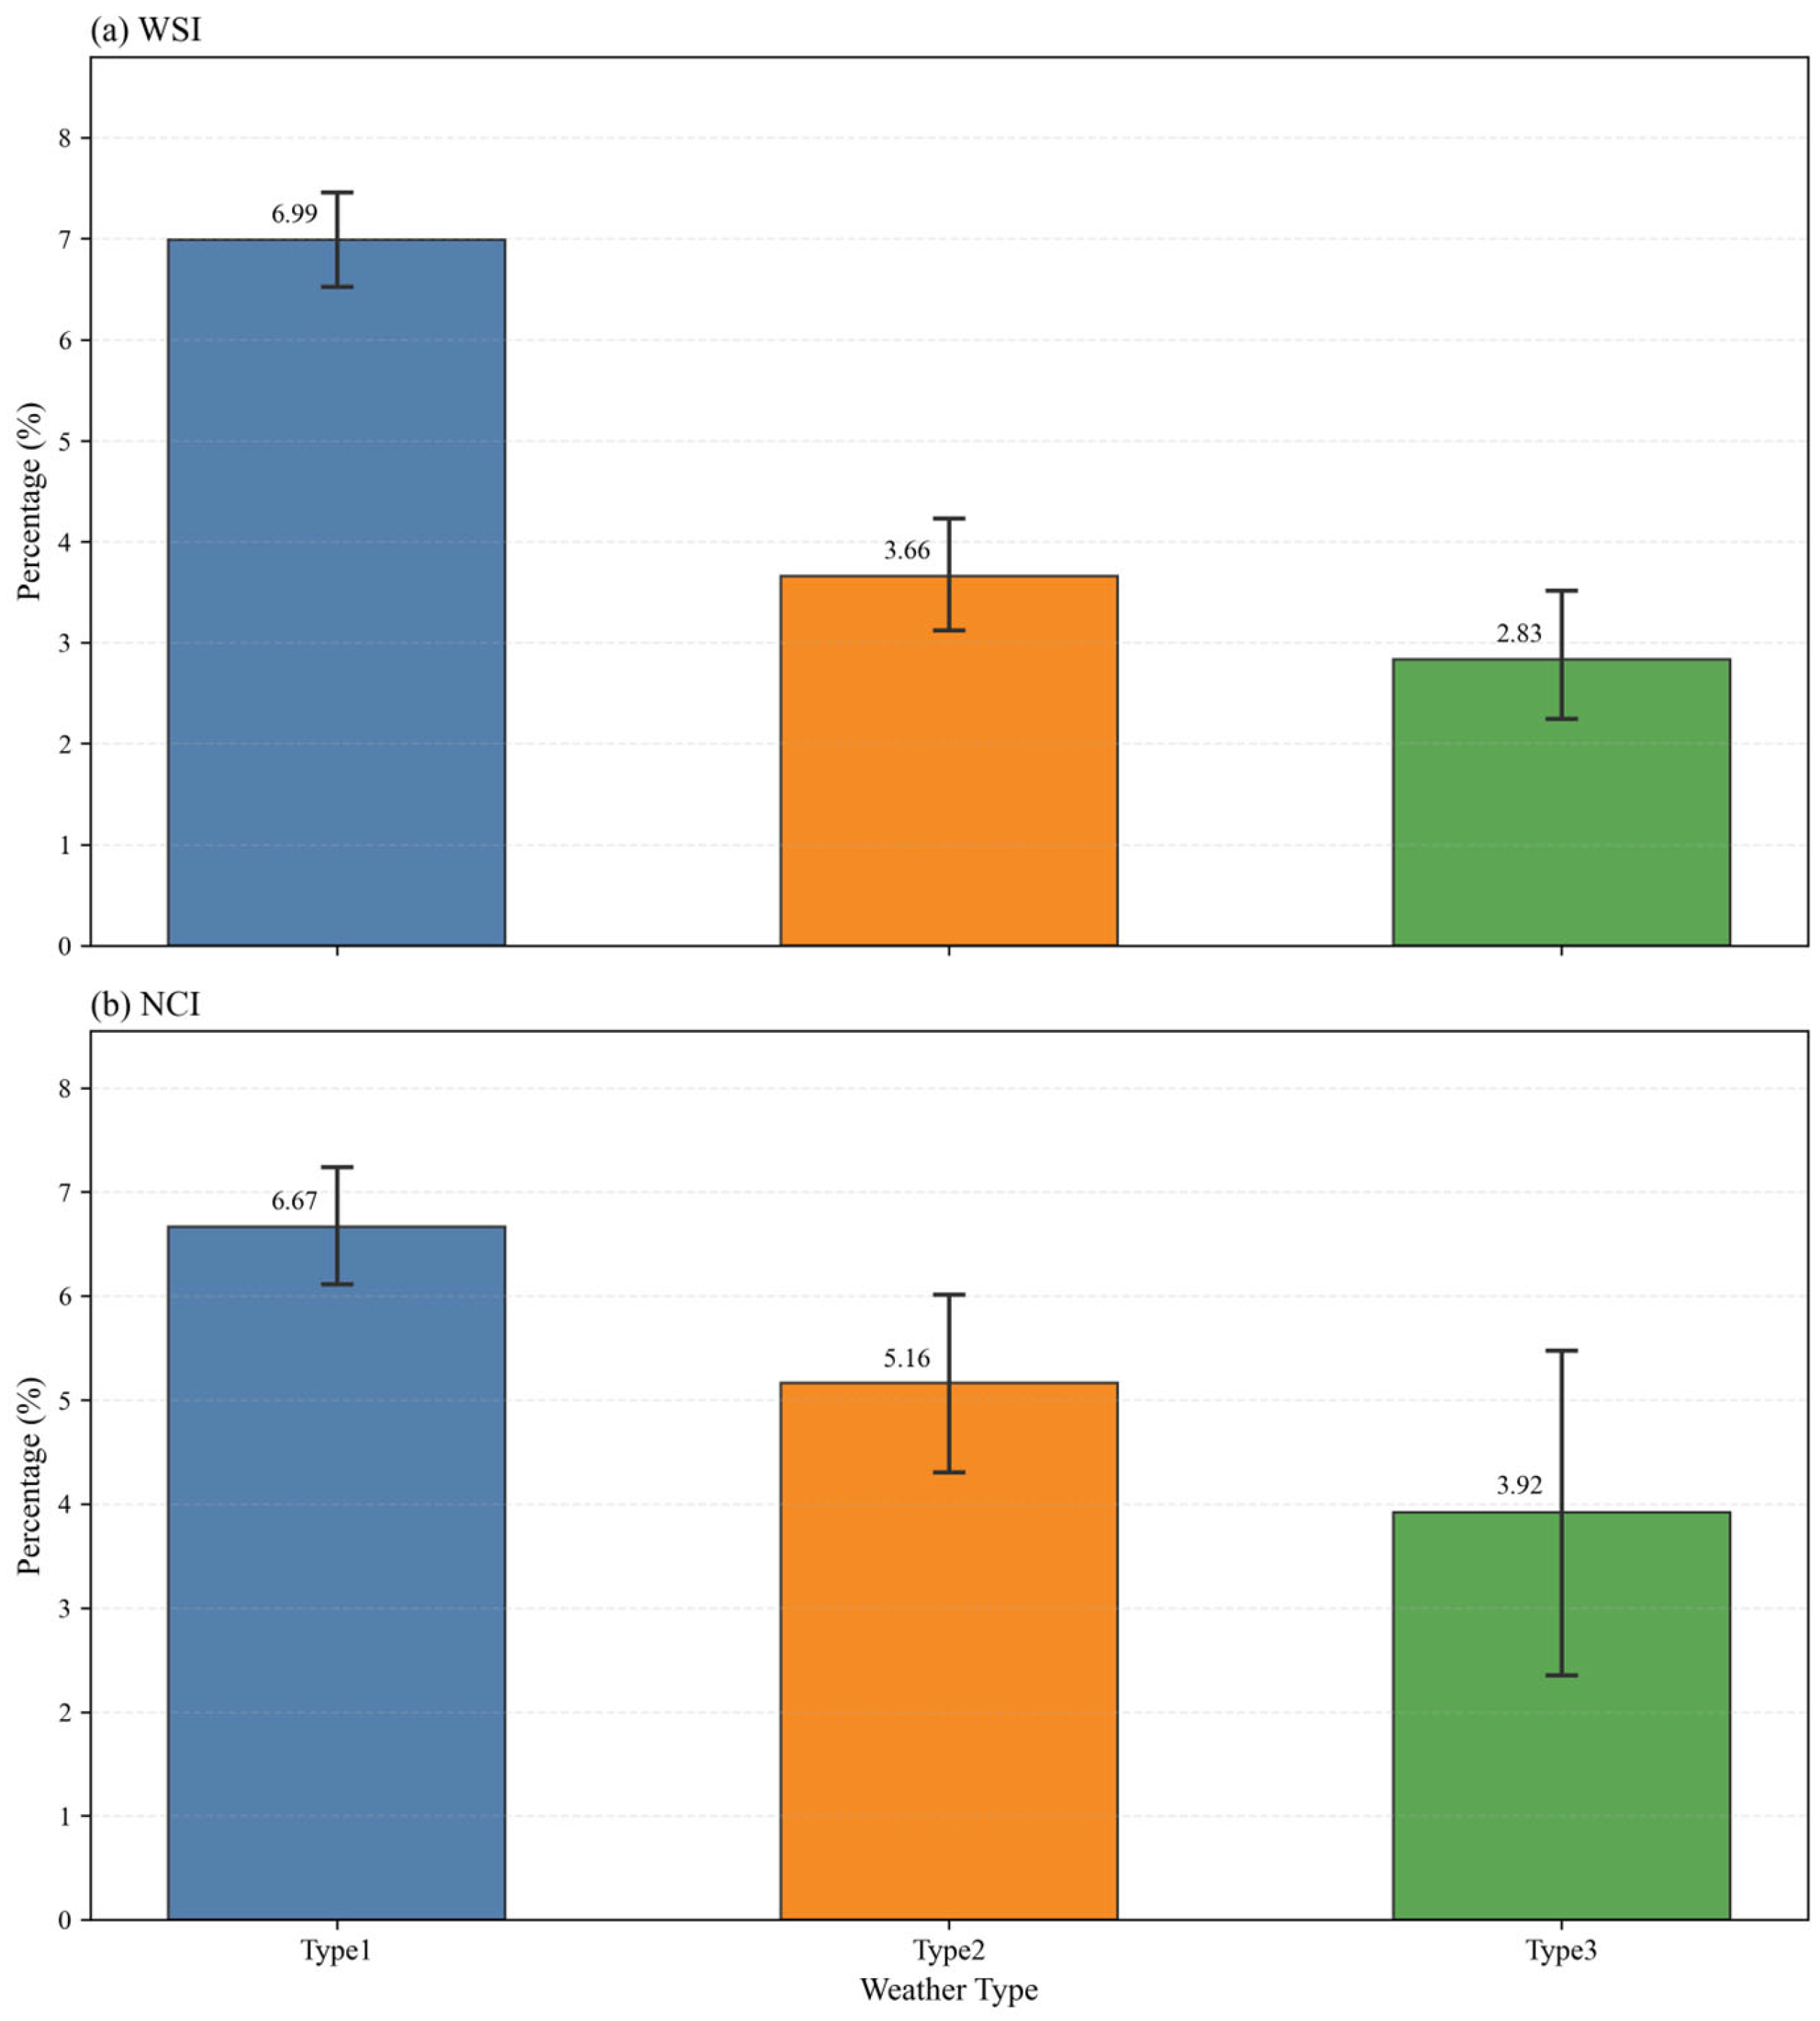
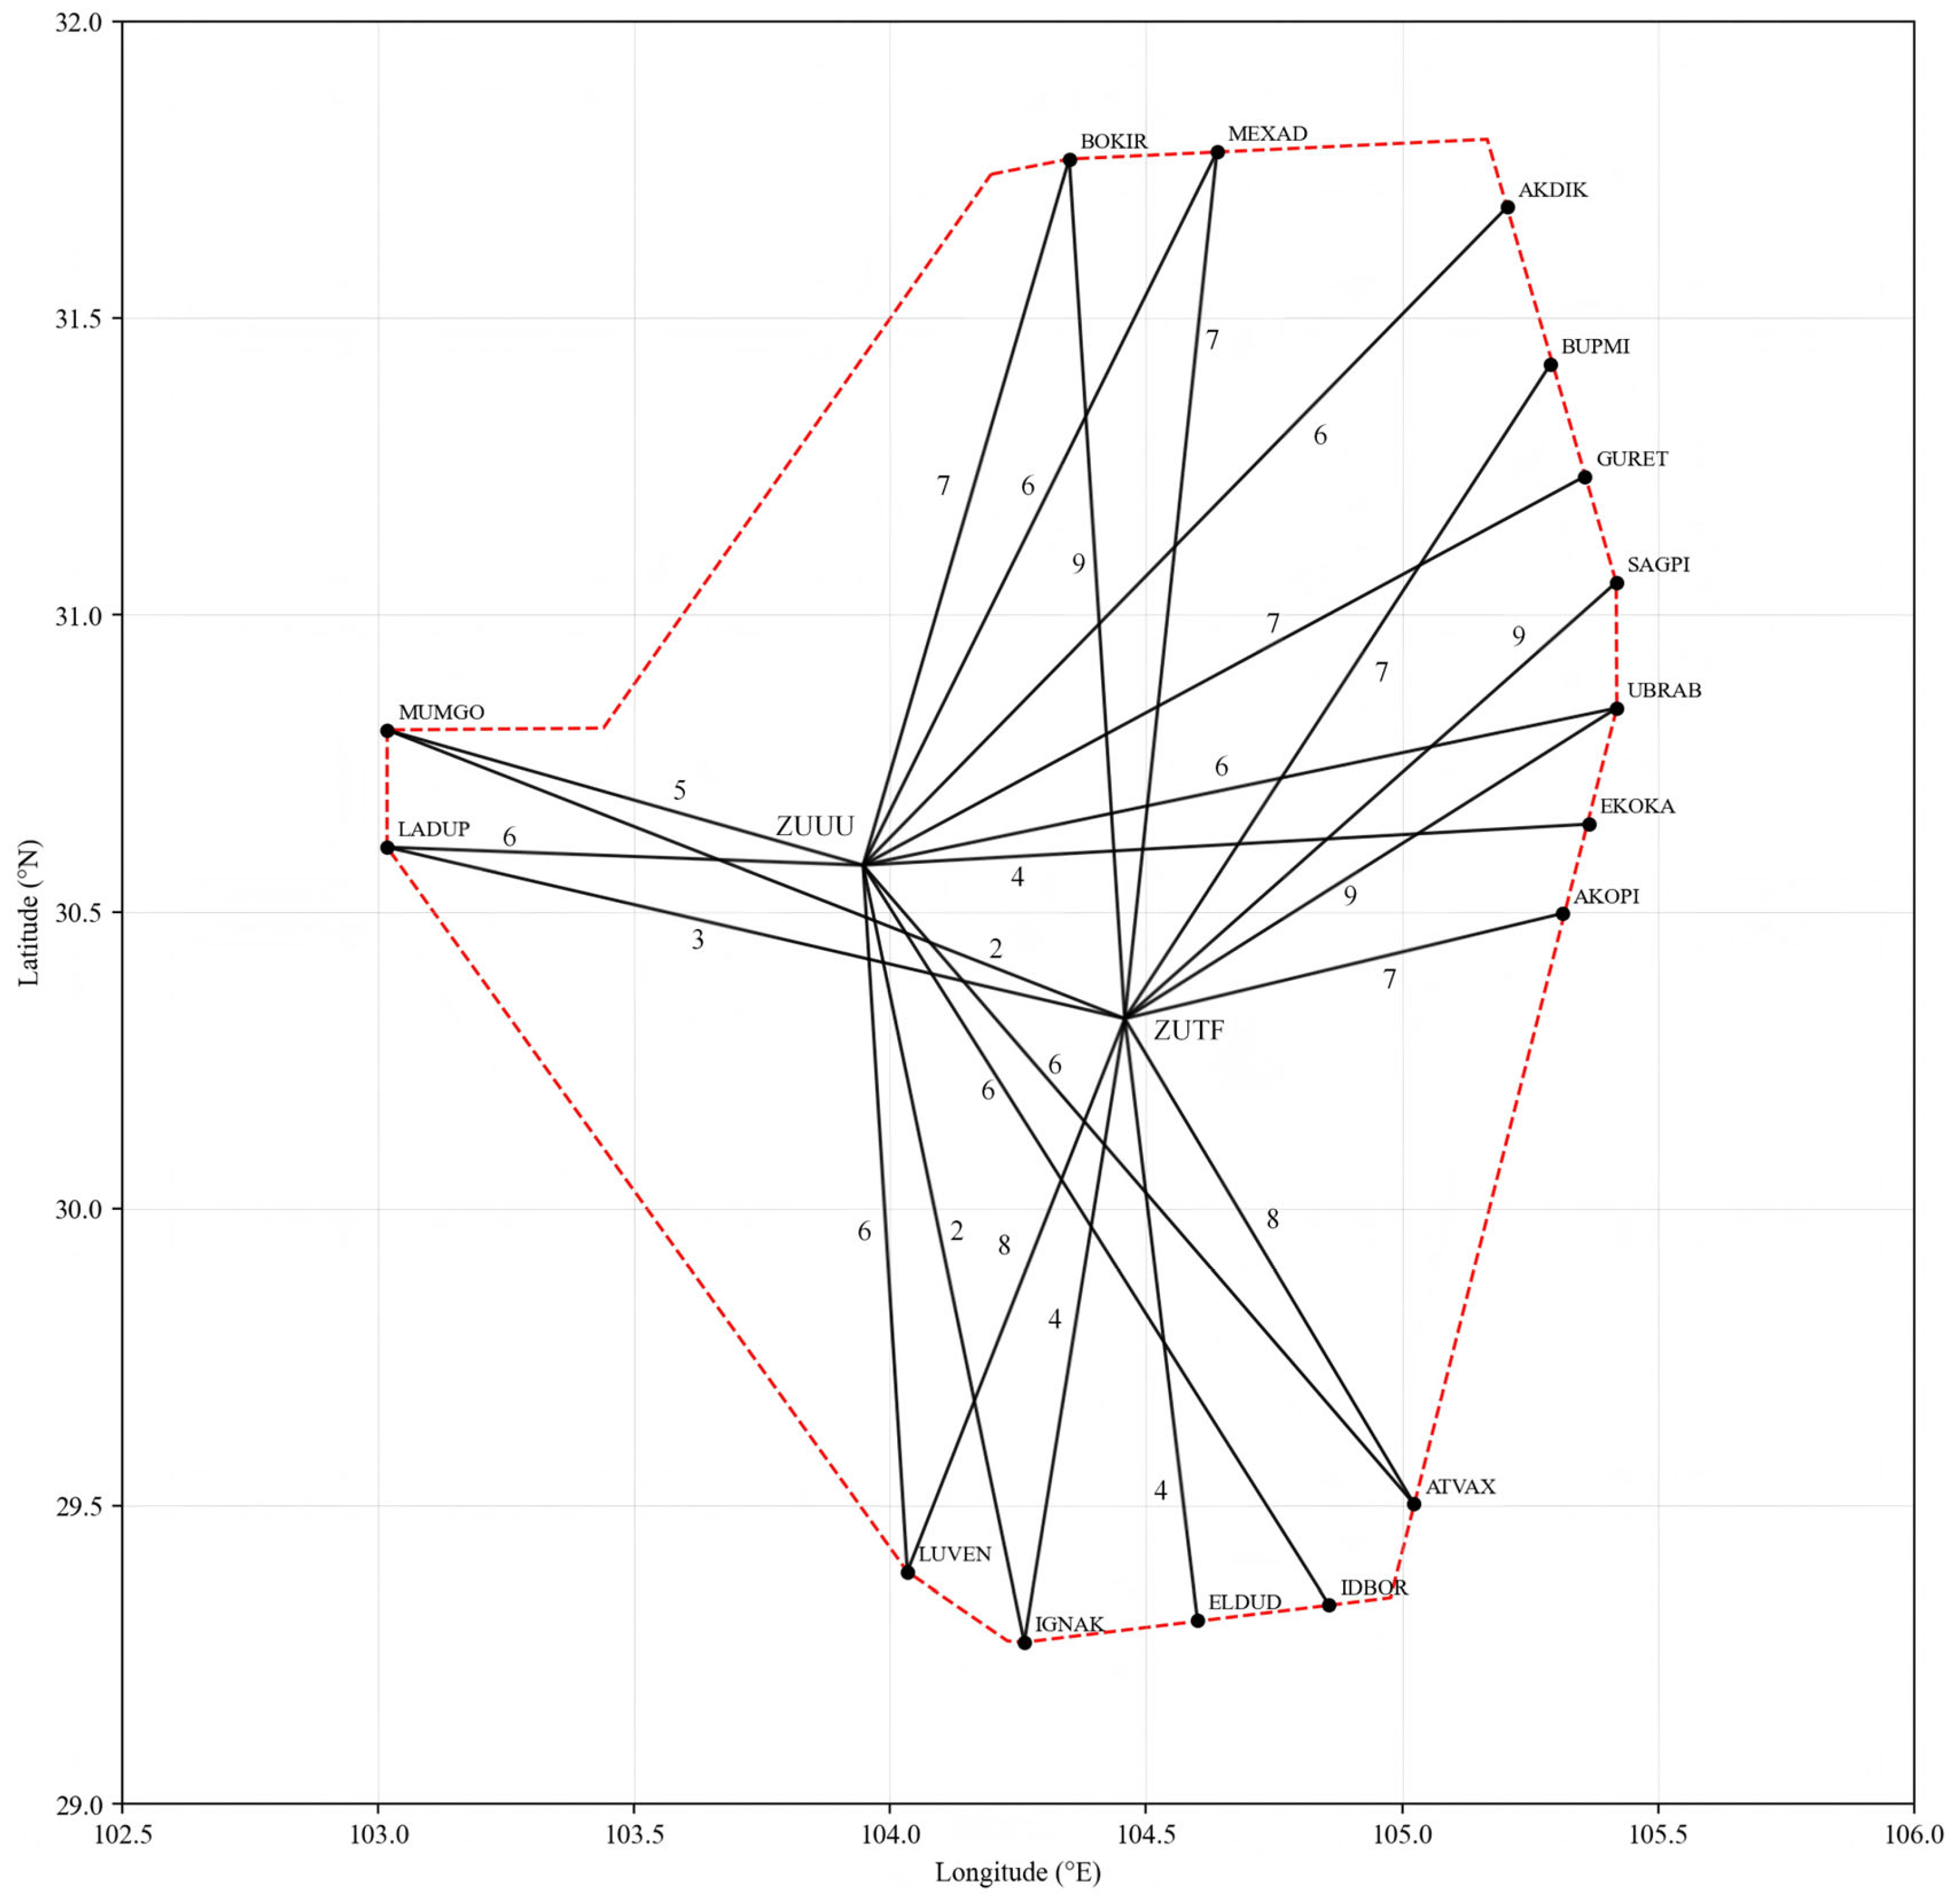
Figure 10 illustrates the statistical results of WSI and NCI under different synoptic types. Error bars in the figure indicate 95% confidence intervals, which are estimated using the bootstrap method based on hourly heavy precipitation samples. Type 1 exhibits the largest WSI and NCI values, indicating that for this synoptic type, heavy precipitation covers the most extensive area and exerts the greatest impact on the overall operational airspace and key operational nodes of the terminal area. Regarding the spatial distribution of heavy precipitation in the terminal area, Type 1 associated precipitation is mainly concentrated within the terminal area and on its eastern and northeastern sides, with the heavy precipitation center located in the vicinity of BUPMI and GURET. As shown in Figure 11, the arrival and departure procedures on the eastern and northeastern sides of the terminal area have a high degree of sharing, serving as key passages for terminal area operations. The heavy precipitation area in Type 1 highly overlaps with these frequently shared route segments and busy arrival/departure nodes, markedly reducing the overall available operational airspace in the terminal area. This tends to affect multiple important arrival and departure procedures simultaneously, and as a result, both WSI and NCI reach their maximum values in Type 1.
Figure 10.
Statistical results of Weather Severity Index and Node Coverage Index under different synoptic types. Error bars denote 95% confidence intervals. (a) WSI under different synoptic types, reflecting the spatial coverage of heavy precipitation over the terminal area; (b) NCI under different synoptic types, reflecting the influence of heavy precipitation on key operational nodes.
Figure 11.
Distribution of routes in the Chengdu terminal area. Black dots indicate the arrival and departure nodes of the terminal area. Black lines represent the simplified routes within the terminal area from the airport to the arrival and departure nodes. The numbers marked alongside the routes indicate the number of standard arrival and departure procedures passing through this route. The red dashed line outlines the simplified boundary of the Chengdu terminal area.
Type 2 exhibits a WSI value 3.33% smaller than that of Type 1, indicating a marked reduction in the precipitation coverage area. Moreover, the precipitation under this type is mainly concentrated in the southwestern and southern parts of the terminal area, causing relatively limited impacts on the interior and the busy eastern part of the terminal area. However, the corresponding NCI still reaches 5.16%, suggesting that although Type 2 has a smaller overall spatial coverage, it can still affect key operational nodes such as MUMGO and LADUP. Combined with Figure 11, it is evident that these nodes and the associated connecting passages demonstrate high importance in terminal area operations. Therefore, Type 2 associated precipitation impacts the terminal area operations primarily by restricting key operational nodes and important local passages. Type 3 shows the lowest WSI and NCI values, with the precipitation being the weakest and most sparsely distributed, indicating a low degree of overlapping between precipitation areas and the key route segments and key nodes, as shown in Figure 11. Consequently, Type 3 associated precipitation exerts a relatively limited impact on the operational airspace and key nodes of the terminal area.
The above results partially demonstrate the differences in weather-impact scenarios within the terminal area across three synoptic types, providing a reference for subsequent validation using statistical results of operational data. Nevertheless, the specific relationships between weather impact and actual airport delays, capacity reduction, or flow management measures remain to be further investigated.
5. Conclusions and Discussion
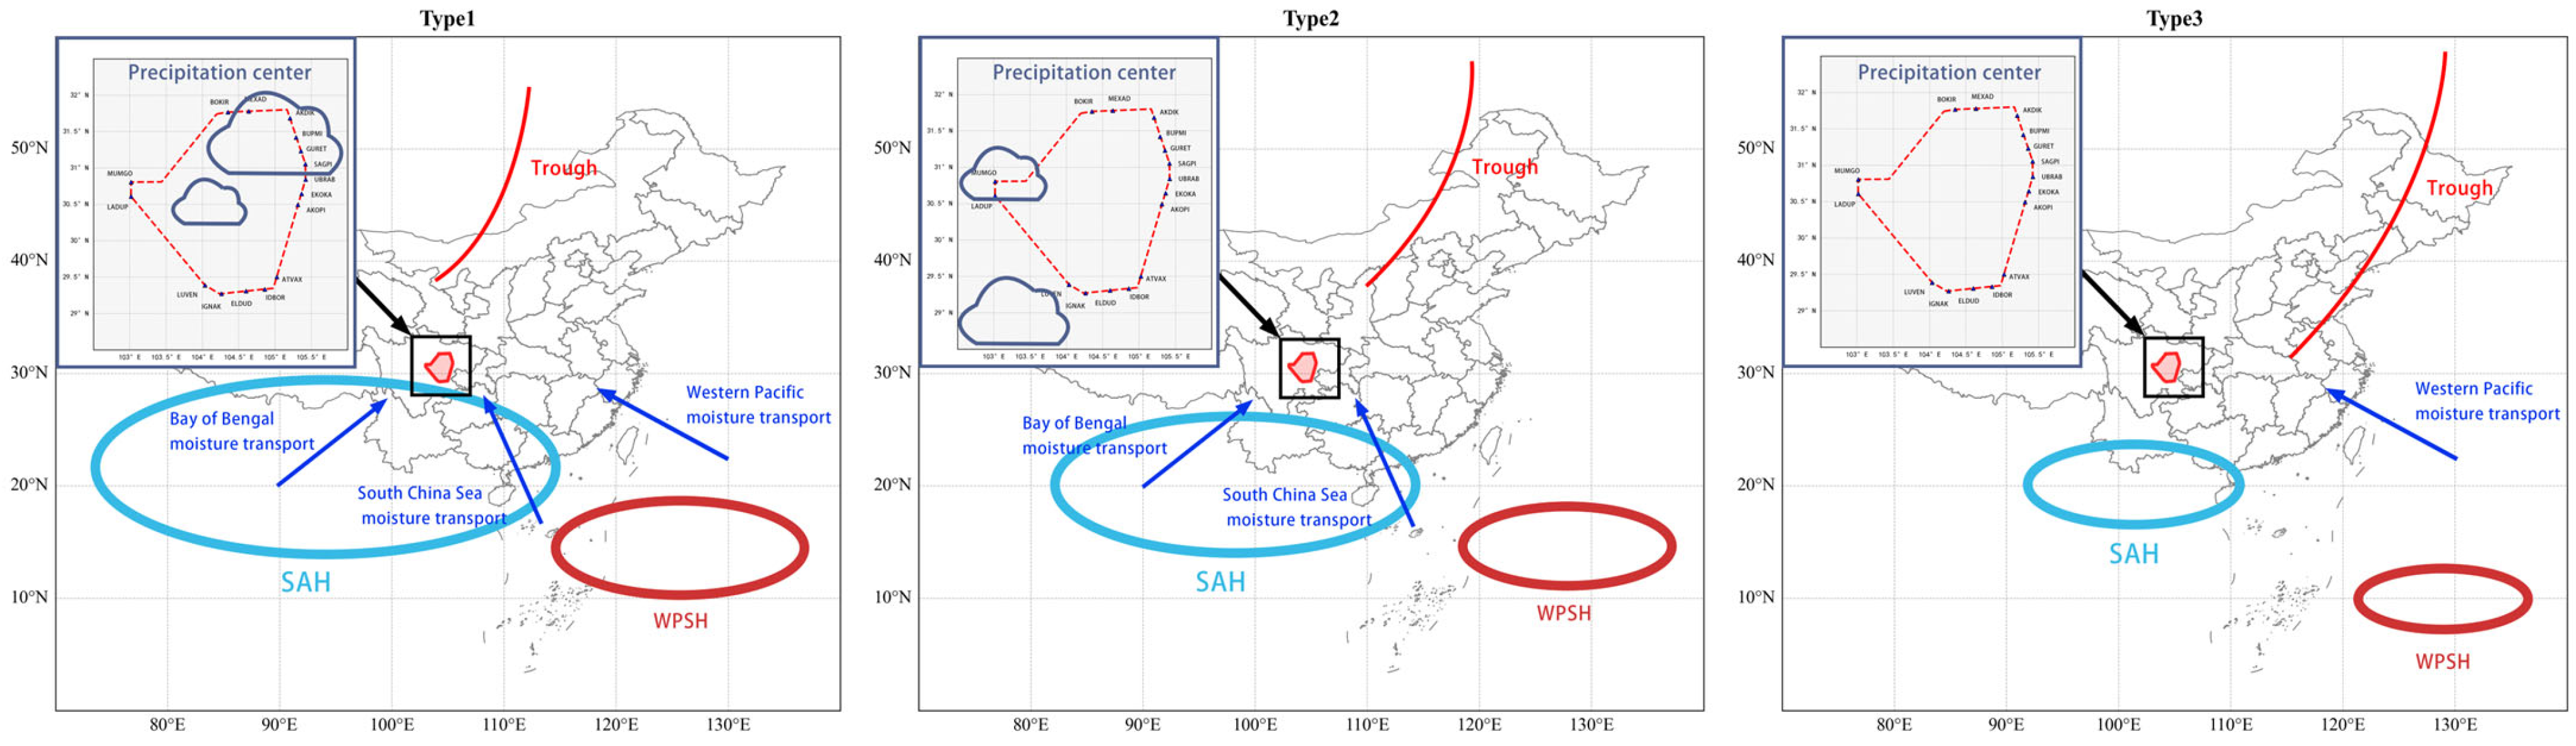
Based on the fifth-generation reanalysis data of hourly CP during 2010–2020, this study employs the SOM method to objectively classify the spatial patterns of CP in the Chengdu terminal area and further categorizes the formation backgrounds associated with the nine objective patterns into three typical synoptic types (Figure 12) according to the circulation patterns and water vapor transport characteristics. Hourly precipitation events with an intensity ≥ 8.0 mm·h−1 are further selected as heavy precipitation samples. On this basis, two types of indicators—WSI and NCI—are constructed to assess the impact of heavy precipitation on terminal area operations. WSI and NCI respectively describe the impact of heavy precipitation on the operational airspace of the terminal area and its direct impact on key arrival and departure nodes, thereby quantifying the impacts of different synoptic types on terminal area operations.
Figure 12.
Schematic diagram of precipitation centers and circulation configuration in the terminal area under the three synoptic types. The cloud patterns in the inset represent the precipitation centers in the terminal area. Blue arrows indicate water vapor transport channels. Red ellipses denote the approximate locations of the WPSH. Red solid line indicates the troughs. Red closed polygons represent the location of the Chengdu terminal area.
Regarding circulation characteristics, the objective classification results of CP can be categorized into three typical synoptic patterns. In Type 1, the mid-high-latitude circulation pattern exhibits a trough with the weakest intensity among the three types, along with relatively stronger WPSH and stronger-than-normal SAH. Strong warm-moist airflow is transported from the Bay of Bengal, the South China Sea and the western Pacific toward the terminal area, resulting in the most favorable moisture conditions. In Type 2, precipitation is mainly distributed in the northwestern part of the terminal area. Similarly, there is a weak trough in mid-high latitudes, and the WPSH and SAH are relatively stronger. Cold air moves southward and converges with warm-moist airflow from the Bay of Bengal and the South China Sea in the terminal area. In Type 3, trough activities with the strongest intensity prevail in mid-high latitudes, with pronounced negative geopotential height anomalies on the northern side of the terminal area, which imply relatively strong cold air activity. However, the WPSH and SAH are generally weaker, which inhibits the transport of warm-moist southwesterly airflow to some extent, resulting in relatively weak conditions for precipitation formation.
It is evident that there are substantial differences in the impact of heavy precipitation on terminal area operations across different synoptic types. Type 1 exhibits the highest WSI and NCI, indicating that heavy precipitation under this type displays the most extensive coverage and exerts the strongest potential impact on the operational airspace and key nodes in the terminal area. Type 2 demonstrates a lower WSI than Type 1 but maintains a relatively higher NCI, suggesting a more directionally biased impact, primarily by restrictions on local key nodes and important local passages. Type 3 records the lowest WSI and NCI, indicating the weakest and most scattered precipitation distribution, with less overlap between precipitation areas and key route segments and nodes. The above results illustrate that beyond the overall spatial coverage of heavy precipitation, the extent to which key nodes are affected can help reveal the differences in weather-impact scenarios across varied synoptic types.
These findings can serve as a reference for weather-impact identification and scenario-based operational assessment within the terminal area, facilitating the detection of highly susceptible core areas and important passages under various weather conditions. However, it should be noted that the current classification is mainly based on ERA5 reanalysis data, which are more suitable for long-term statistical analysis and large-scale environmental characterization but remain limited in their ability to represent local fine-scale convective structures. In addition, the proposed indicators of WSI and NCI have yet to be directly validated against actual delays, capacity reductions, and flow-management measures. Therefore, future work should incorporate satellite precipitation data, typical cases, and actual operational data to further verify the relationship between synoptic type identification and operational impact assessment within the terminal area.
Author Contributions
Conceptualization, H.L. (Haotian Li) and R.L.; methodology, H.L. (Haotian Li) and R.L.; software, H.L. (Haotian Li); validation, H.L. (Haotian Li), H.L. (Haoya Liu) and R.L.; formal analysis, H.L. (Haotian Li); writing—original draft preparation, H.L. (Haotian Li); writing—review and editing, H.L. (Haotian Li), H.L. (Haoya Liu), L.D., Y.Z. and X.H. All authors have read and agreed to the published version of the manuscript.
Funding
This work was jointly supported by the Grant Number Open Foundation of China Meteorological Administration Key Laboratory for Aviation Meteorology (No. HKQXM-2024018) and the Fundamental Research Funds for the Central Universities (No. J2023-034).
Institutional Review Board Statement
Not applicable.
Informed Consent Statement
Not applicable.
Data Availability Statement
The data used in this paper can be provided by H.L. (liuhy@cafuc.edu.cn) upon request.
Conflicts of Interest
The authors declare no conflicts of interest.
References
- Chandra, A.; Verma, A.; Sooraj, K.P.; Parayam Kunnathu, N.; Padhi, R. Understanding the terminal area traffic flow characteristics using flight record data. Transp. Dev. Econ. 2022, 8, 21. [Google Scholar] [CrossRef] [Scilit]
- Rodríguez-Sanz, Á.; Cano, J.; Rubio Fernández, B. Impact of weather conditions on airport arrival delay and throughput. Aircr. Eng. Aerosp. Technol. 2022, 94, 60–78. [Google Scholar] [CrossRef] [Scilit]
- Granberg, T.A.; Polishchuk, T.; Polishchuk, V.; Schmidt, C. A framework for integrated terminal airspace design. Aeronaut. J. 2019, 123, 567–585. [Google Scholar] [CrossRef] [Scilit]
- Civil Aviation Administration of China. 2024 Statistical Bulletin on the Development of the Civil Aviation Industry. 2025. Available online: https://www.caac.gov.cn/XXGK/XXGK/TJSJ/202505/t20250515_227513.html (accessed on 15 February 2026).
- Wang, S.; Yang, B.; Duan, R.; Li, J. Predicting the airspace capacity of terminal area under convective weather using machine learning. Aerospace 2023, 10, 288. [Google Scholar] [CrossRef] [Scilit]
- Jones, J.C.; Reis, T.; Tolley, B. Airport and terminal airspace capacity planning during convective weather events. In AIAA AVIATION Forum and ASCEND 2025; American Institute of Aeronautics and Astronautics: Reston, VA, USA, 2025; p. 3816. [Google Scholar] [CrossRef] [Scilit]
- Serhan, D.; Yoon, S.W.; Chung, S.H. Dynamic reconfiguration of terminal airspace during convective weather: Robust optimization and conditional value-at-risk approaches. Comput. Ind. Eng. 2019, 132, 333–347. [Google Scholar] [CrossRef] [Scilit]
- Shankar, A.; Sahana, B.C. Efficient prediction of runway visual range by using a hybrid CNN-LSTM network architecture for aviation services. Theor. Appl. Climatol. 2024, 155, 2215–2232. [Google Scholar] [CrossRef] [Scilit]
- Klein-Paste, A. Airplane braking friction on dry snow, wet snow or slush contaminated runways. Cold Reg. Sci. Technol. 2018, 150, 70–74. [Google Scholar] [CrossRef] [Scilit]
- Lin, C.; Zhang, K.; Chen, X.; Liang, S.; Wu, J.; Zhang, W. Overview of low-level wind shear characteristics over Chinese mainland. Atmosphere 2021, 12, 628. [Google Scholar] [CrossRef] [Scilit]
- Chengdu Municipal People’s Government. Chengdu International Aviation Hub Sees Record Highs in Both Passenger and Cargo Throughput in 2025. 2026. Available online: https://www.chengdu.gov.cn/cdsrmzf/c169603/2026-01/12/content_4805e324f93a48fba25c35a6cc5fadd6.shtml (accessed on 15 February 2026).
- Chen, R. Weather characteristics and impacts on traffic capacity for flight support in the Chengdu control area under severe convective weather. Plateau Mt. Meteorol. Res. 2025, 45, 135–141. (In Chinese) [Google Scholar] [CrossRef]
- Liu, X.; Li, L.; Liu, X.; Zhang, T.; Rong, X.; Yang, L.; Xiong, D. Field investigation on characteristics of passenger flow in a Chinese hub airport terminal. Build. Environ. 2018, 133, 51–61. [Google Scholar] [CrossRef] [Scilit]
- Michalek, D.; Balakrishnan, H. Dynamic reconfiguration of terminal airspace during convective weather. In Proceedings of the 49th IEEE Conference on Decision and Control (CDC 2010), Atlanta, GA, USA, 15–17 December 2010; pp. 4875–4881. [Google Scholar] [CrossRef] [Scilit]
- Huang, Y.; Cui, X. Moisture sources of torrential rainfall events in the Sichuan Basin of China during summers of 2009–13. J. Hydrometeorol. 2015, 16, 1906–1917. [Google Scholar] [CrossRef] [Scilit]
- Xia, R.; Luo, Y.; Zhang, D.-L.; Li, M.; Bao, X.; Sun, J. On the diurnal cycle of heavy rainfall over the Sichuan Basin during 10–18 August 2020. Adv. Atmos. Sci. 2021, 38, 2183–2200. [Google Scholar] [CrossRef] [Scilit]
- Jiang, N. A new objective procedure for classifying New Zealand synoptic weather types during 1958–2008. Int. J. Climatol. 2011, 31, 863–879. [Google Scholar] [CrossRef] [Scilit]
- Osipova, O.P.; Osipov, E.Y. Objective classification of weather types for the Eastern Siberia over the 1970–2020 period using the Jenkinson and Collison method. Atmos. Res. 2022, 277, 106291. [Google Scholar] [CrossRef] [Scilit]
- Tien, S.-L.; Taylor, C.P.; Wanke, C.R. Identifying representative weather-impact scenarios for flow contingency management. In Proceedings of the 2013 Aviation Technology, Integration, and Operations Conference, Los Angeles, CA, USA, 12–14 August 2013; AIAA: Reston, VA, USA, 2013; p. 4216. [Google Scholar] [CrossRef] [Scilit]
- Doan, Q.V.; Kusaka, H.; Sato, T.; Chen, F. S-SOM v1.0: A structural self-organizing map algorithm for weather typing. Geosci. Model Dev. 2021, 14, 2097–2111. [Google Scholar] [CrossRef] [Scilit]
- Xu, A.; Sun, J.; Xu, D.; Wan, X.; Guo, Y. Classification of synoptic patterns and basic environmental configuration characteristics of severe convective weather in central and eastern China. Meteorol. Mon. 2014, 40, 400–411. (In Chinese) [Google Scholar] [CrossRef]
- Li, H.; Cui, X.; Li, Q.; Wu, F. Classification of disturbance circulation patterns associated with hourly heavy rainfall in Beijing using the SANDRA method. Clim. Environ. Res. 2019, 24, 445–454. (In Chinese) [Google Scholar] [CrossRef]
- Manco, I.; Feitosa, O.M.; Raffa, M.; Schiano, P.; Rianna, G.; Mercogliano, P. Identifying recurring patterns of extreme daily precipitation using K-means algorithm: Uncovering spatial shift driven by climate change over the Italian Peninsula. Weather. Clim. Extrem. 2026, 51, 100849. [Google Scholar] [CrossRef] [Scilit]
- Gavrikov, A.; Stepanenko, V. Regional climate modelling: Methods of obtaining the mesoscale from high-resolution data. IOP Conf. Ser. Earth Environ. Sci. 2019, 231, 012018. [Google Scholar] [CrossRef] [Scilit]
- von Luxburg, U. A tutorial on spectral clustering. Stat. Comput. 2007, 17, 395–416. [Google Scholar] [CrossRef] [Scilit]
- Gao, M.; Yang, Y.; Shi, H.; Gao, Z. SOM-based synoptic analysis of atmospheric circulation patterns and temperature anomalies in China. Atmos. Res. 2019, 220, 46–56. [Google Scholar] [CrossRef] [Scilit]
- Liu, Y.; Weisberg, R.H. A review of self-organizing map applications in meteorology and oceanography. In Self Organizing Maps: Applications and Novel Algorithm Design; Mwasiagi, J.I., Ed.; IntechOpen: London, UK, 2011; pp. 253–272. [Google Scholar] [CrossRef] [Scilit]
- Yang, Y.; Zhai, P.; Zhou, B. Objective classification of typical circulation patterns for persistent heavy precipitation processes in the Yangtze River Basin based on SOM. Acta Meteorol. Sin. 2024, 82, 632–644. (In Chinese) [Google Scholar] [CrossRef]
- Luo, W.; Qian, W.; Jiang, N.; Liang, Z. Application of the self-organizing map method to summer precipitation classification in eastern China. Acta Sci. Nat. Univ. Pekin. 2018, 54, 5. (In Chinese) [Google Scholar] [CrossRef]
- Min, J.; Deng, C.; Cao, X.; Liu, H.; Wang, S. Synoptic circulation pattern clustering analysis of severe convective weather based on self-organizing maps (SOM). Meteorol. Sci. Technol. 2015, 43, 244–249. [Google Scholar] [CrossRef]
- Jiang, N.; Betts, A.; Riley, M. Summarising climate and air quality (ozone) data on self-organising maps: A Sydney case study. Environ. Monit. Assess. 2016, 188, 103. [Google Scholar] [CrossRef] [Scilit]
- Kicinger, R.; Chen, J.-T.; Steiner, M.; Pinto, J. Airport Capacity Prediction with Explicit Consideration of Weather Forecast Uncertainty. J. Air Transp. 2016, 24, 18–28. [Google Scholar] [CrossRef] [Scilit]
- Jones, J.C.; Ellenbogen, Z.; Glina, Y. Recommending Strategic Air Traffic Management Initiatives in Convective Weather. J. Air Transp. 2023, 31, 45–56. [Google Scholar] [CrossRef] [Scilit]
- Sidiropoulos, S.; Majumdar, A.; Han, K. A Framework for the Optimization of Terminal Airspace Operations in Multi-Airport Systems. Transp. Res. Part B Methodol. 2018, 110, 160–187. [Google Scholar] [CrossRef] [Scilit]
- Nazeri, Z.; Zhang, J. Mining aviation data to understand impacts of severe weather on airspace system performance. In Proceedings of the International Conference on Information Technology: Coding and Computing, Las Vegas, NV, USA, 8–10 April 2002. [Google Scholar] [CrossRef] [Scilit]
- Klein, A.; Craun, C.; Lee, R.S. Airport delay prediction using weather-impacted traffic index (WITI) model. In Proceedings of the 29th Digital Avionics Systems Conference, Salt Lake City, UT, USA, 3–7 October 2010; IEEE: Piscataway, NJ, USA, 2010. [Google Scholar] [CrossRef] [Scilit]
- Kohonen, T. Self-organized formation of topologically correct feature maps. Biol. Cybern. 1982, 43, 59–69. [Google Scholar] [CrossRef] [Scilit]
- Hewitson, B.C.; Crane, R.G. Self-organizing maps: Applications to synoptic climatology. Clim. Res. 2002, 22, 13–26. [Google Scholar] [CrossRef] [Scilit]
- Lin, G.F.; Chen, L.H. Identification of homogeneous regions for regional frequency analysis using the self-organizing map. J. Hydrol. 2006, 324, 1–9. [Google Scholar] [CrossRef] [Scilit]
- Civil Aviation Administration of China. Civil Aviation Meteorological Surface Observation Specifications. Available online: https://www.caac.gov.cn/XXGK/XXGK/GFXWJ/202112/P020220209588831109510.pdf (accessed on 8 April 2026). (In Chinese)

Disclaimer/Publisher’s Note: The statements, opinions and data contained in all publications are solely those of the individual author(s) and contributor(s) and not of MDPI and/or the editor(s). MDPI and/or the editor(s) disclaim responsibility for any injury to people or property resulting from any ideas, methods, instructions or products referred to in the content. |
© 2026 by the authors. Licensee MDPI, Basel, Switzerland. This article is an open access article distributed under the terms and conditions of the Creative Commons Attribution (CC BY) license.