Article

Lower Direct N2O Emission Factors in Chinese Croplands than IPCC Defaults: A Systematic Meta-Analysis


1
School of Human Settlements and Civil Engineering, Xi’an Jiaotong University, Xi’an 710049, China
2
College of Hydrology and Water Resources, Hohai University, Nanjing 210098, China
*
Author to whom correspondence should be addressed.
Atmosphere 2026, 17(4), 422; https://doi.org/10.3390/atmos17040422
Submission received: 19 March 2026 / Revised: 19 April 2026 / Accepted: 20 April 2026 / Published: 21 April 2026

Abstract

Nitrous oxide (N2O) is a major agricultural greenhouse gas. Its direct emission factor (EF) is a key parameter for greenhouse gas inventories and developing mitigation strategies. However, the Intergovernmental Panel on Climate Change (IPCC) default EF may not reflect actual emissions from Chinese croplands. This study compiled extensive field observations from key agricultural regions in China. A systematic meta-analysis was conducted to evaluate annual N2O emissions and nitrogen fertilizer-induced direct emission factors. Subgroup analyses revealed that fertilizer type, land use, soil texture, and climate zone all significantly influence EF. Univariate meta-regression indicated that EF is positively correlated with nitrogen (N) application rate and mean annual temperature but negatively correlated with soil pH, highlighting these factors as key drivers of N2O emissions. The mean EF in Chinese croplands was about 0.68%, much lower than the 1% global default recommended by the IPCC. The combined effects of optimized agricultural management, cropping systems, and local environmental conditions help explain these lower emission factors. These findings provide a scientific basis for developing region-specific emission factors, improving cropland mitigation strategies, and enhancing the accuracy of greenhouse gas inventories.

1. Introduction

Nitrous oxide (N2O) is a potent greenhouse gas with a global warming potential approximately 298 times that of carbon dioxide [1]. It is a key contributor to stratospheric ozone depletion [2]. Agricultural soils are the main source of anthropogenic N2O emissions [3,4], producing roughly 60% of total emissions [5]. The intensification of global agriculture, coupled with increasing synthetic nitrogen fertilizer use, has increased the agricultural share of global greenhouse gas emissions [6,7]. Accurate quantification of N2O emissions from croplands and identification of the main drivers are therefore essential for developing mitigation strategies and promoting sustainable agricultural practices.
Soil N2O emissions from croplands are influenced by both natural factors and agricultural management practices, including nitrogen fertilizer application rate, fertilizer type, land use, soil properties, and climate conditions [8,9]. Among these, nitrogen (N) application rate is usually seen as the most important driver of emissions. Higher nitrogen inputs enhance the availability of mineral N in soils, stimulating microbial processes such as nitrification and denitrification, and ultimately increasing N2O emissions [10]. Fertilizer type, soil texture, and soil pH can also regulate N2O production and emission by affecting soil aeration and microbial activity [4,11]. Climate conditions also matter: temperature and precipitation alter soil moisture and microbial metabolism, further controlling N2O production and emissions. Different agricultural ecosystems have varying crop types, cultivation systems, and water management. These differences create substantial variability in soil N2O emissions across croplands in China [12,13]. Although some studies have investigated these factors, conclusions vary due to differences in locations, experimental conditions, and measurement methods.
China ranks among the world’s largest consumers of synthetic nitrogen fertilizers [14]. High-intensity N inputs are vital for crop yields, but they also raise the risk of N2O emissions from soil N cycling. Field studies show that Chinese croplands emit significant amounts of N2O [15,16,17], but levels vary markedly by regions, management practices, and soil environmental conditions [18,19]. The Intergovernmental Panel on Climate Change (IPCC) introduced the concept of the direct emission factor (EF) for nitrogen fertilizer to quantify fertilizer-induced N2O emissions, recommending a global average value of 1% [20]. However, a growing number of studies report that EF values for Chinese croplands are often below this default, revealing potential regional uncertainties in the IPCC parameters [18,21]. Consequently, a systematic synthesis of the existing data is needed to fully assess N2O emissions and direct emission factors in Chinese agricultural soils.
Meta-analysis, as a quantitative approach for synthesizing results from multiple studies, provides an effective means to integrate diverse datasets, thereby revealing overarching patterns and identifying key driving factors [22]. In recent years, meta-analytic methods have been increasingly applied to investigate greenhouse gas emissions in agricultural ecosystems [23,24,25]; however, systematic syntheses specifically targeting N2O emissions from Chinese croplands remain limited. In particular, comprehensive assessments of direct emission factors and their underlying drivers are still lacking. Therefore, a systematic meta-analysis based on existing field experimental data is warranted to enhance our understanding of N2O emission characteristics and controlling factors in Chinese agricultural soils.
In this context, this study systematically compiled field observations of N2O emissions from Chinese croplands and employed a meta-analytic approach to evaluate both annual N2O emissions and fertilizer-induced direct emission factors. The study also examined the effects of N application rate, fertilizer type, land use, soil texture, climate, mean annual temperature, and soil pH on emissions. The findings aim to provide a scientific basis for more accurate assessments of agricultural N2O emissions in China and to inform regional greenhouse gas inventories and agricultural mitigation strategies.

2. Materials and Methods

2.1. Data Source

In this study, relevant literature published between 10 January 2010 and 10 January 2026 was systematically retrieved from two major databases, Web of Science and China National Knowledge Infrastructure (CNKI), using the keywords “nitrous oxide,” “Chinese croplands,” “greenhouse gases,” “nitrogen fertilizer” and “N2O”. In the studies included in this meta-analysis, soil N2O fluxes were primarily measured using the static chamber-gas chromatography method. Literature was screened according to the following criteria: (1) the study was conducted within China; (2) experiments were field-based; (3) both a nitrogen-free control (CK) and nitrogen treatment (N) were included; (4) cumulative N2O emission data were reported or could be calculated, along with corresponding sample sizes; and (5) each treatment included at least three replicates. For studies containing multiple independent experimental sites or data from different years, each site or year was treated as an independent observation. Following this screening process, a total of 80 (Table S1) publications covering 81 experimental sites (Figure 1) were selected for calculating direct emission factors and conducting random-effects meta-analysis and subgroup analyses.

2.2. Data Acquisition

The extracted variables from the selected studies included the mean, standard deviation (SD), and sample size (n) of cumulative N2O emissions, with reported values covering at least one full crop growth period. For studies reporting only the standard error (SE), SD was calculated using the formula S D = S E × n . For data lacking reported SD and for which SD could not be derived from other statistical information, following established meta-analytic approaches [26], SD was estimated as 10% of the reported mean.
Key factors potentially influencing N2O emissions were also extracted, including N application rate, fertilizer type, soil texture, soil pH, and climatic conditions, for subsequent subgroup and moderator analyses. Climatic zones were classified according to the Chinese climate classification system proposed by Zheng et al. [27,28]. Considering agricultural production practices, the study regions were grouped into the mid-temperate, warm-temperate, and subtropical zones. Details of other factor groupings are provided in Table 1.
All data were either directly extracted from text and tables in the publications or digitized from figures using Origin 2021 software, with all entries cross-checked by two researchers to minimize errors. In total, 446 independent observations were obtained for the meta-analysis.

2.3. Data Analysis

EF was used as the effect size in the meta-analysis [29]. EF represents the proportion of applied N emitted as N2O-N and is a key parameter in greenhouse gas inventories and scenario-based modeling [30]. The currently widely used international greenhouse gas inventories typically adopt the IPCC-recommended default EF, usually set at 1%. EF is calculated using the following formula:
E F = N 2 O - N t N 2 O - N c N × 100 % ,
where N2O-Nt and N2O-Nc represent the mean annual N2O-N emissions (kg hm−2 a−1) from the fertilized and unfertilized treatments, respectively, and N denotes the mean N application rate in the cropland.
The variance was calculated as follows:
v = S D t 2 n t N 2 + S D c 2 n c N 2
where nt and nc denote the sample sizes of the treatment and control groups, respectively, while SDt and SDc represent the standard deviations of the treatment and control groups.

2.4. Analysis of Publication Bias

Rosenberg’s fail-safe number was used to assess potential publication bias [31], where a fail-safe number greater than (5n + 10) indicates the absence of publication bias. The results showed that the fail-safe number for the N2O EF analysis in Chinese croplands was 58,422.52, far exceeding the number of studies included in this dataset. This suggests that the results of this study are not affected by publication bias, and the estimated effect sizes are regarded as reliable.

3. Results and Analysis

3.1. Annual Total Emissions and Direct Emission Factors of N2O from Cropland Soils

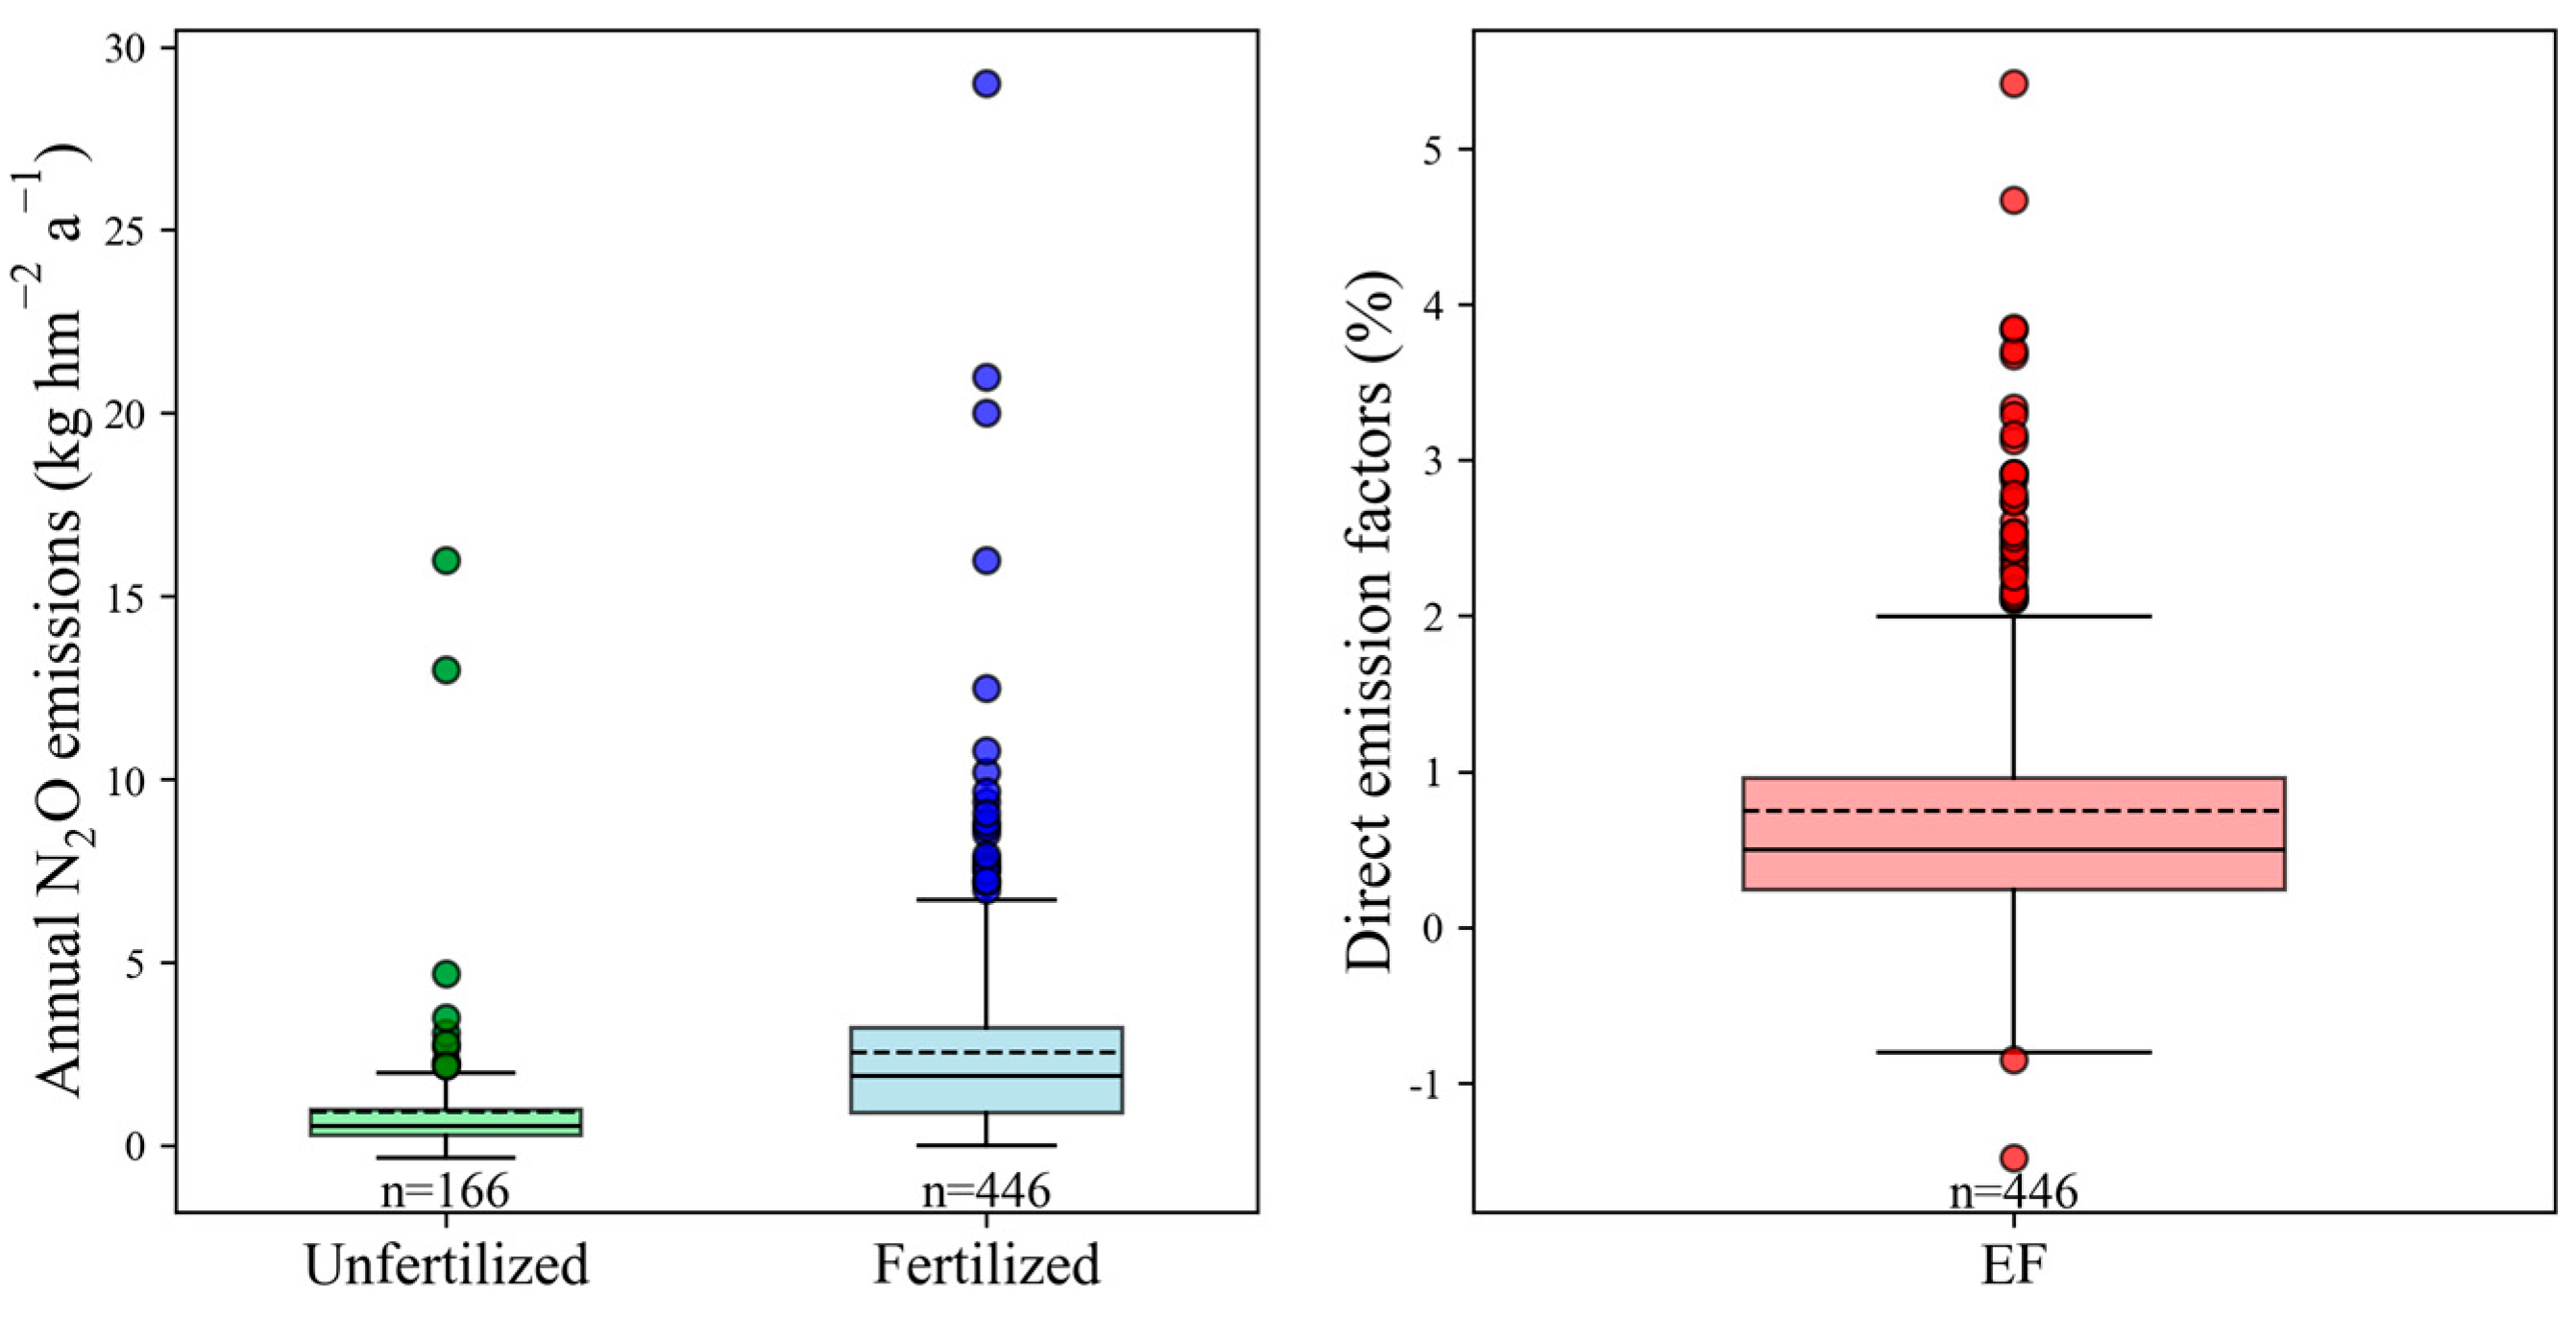
Based on annual N2O emission data from Chinese croplands, we analyzed 166 unfertilized (control) and 446 fertilized treatments to evaluate annual N2O-N emissions and direct emission factors (Figure 2). The mean and median annual N2O-N emissions from unfertilized soils were 0.92 and 0.54 kg hm−2 a−1, respectively, whereas fertilized soils exhibited mean and median emissions of 2.55 and 1.90 kg hm−2 a−1, respectively. Calculating the difference between fertilized and unfertilized treatments per unit of applied N, the mean and median direct emission factors in Chinese croplands were 0.75% and 0.50%, respectively. The overall effect size of EF was 0.68%, which is below the IPCC default value of 1%, with a 95% confidence interval of 0.62–0.73%.

3.2. Factors Affecting N2O Emissions from Cropland Soils

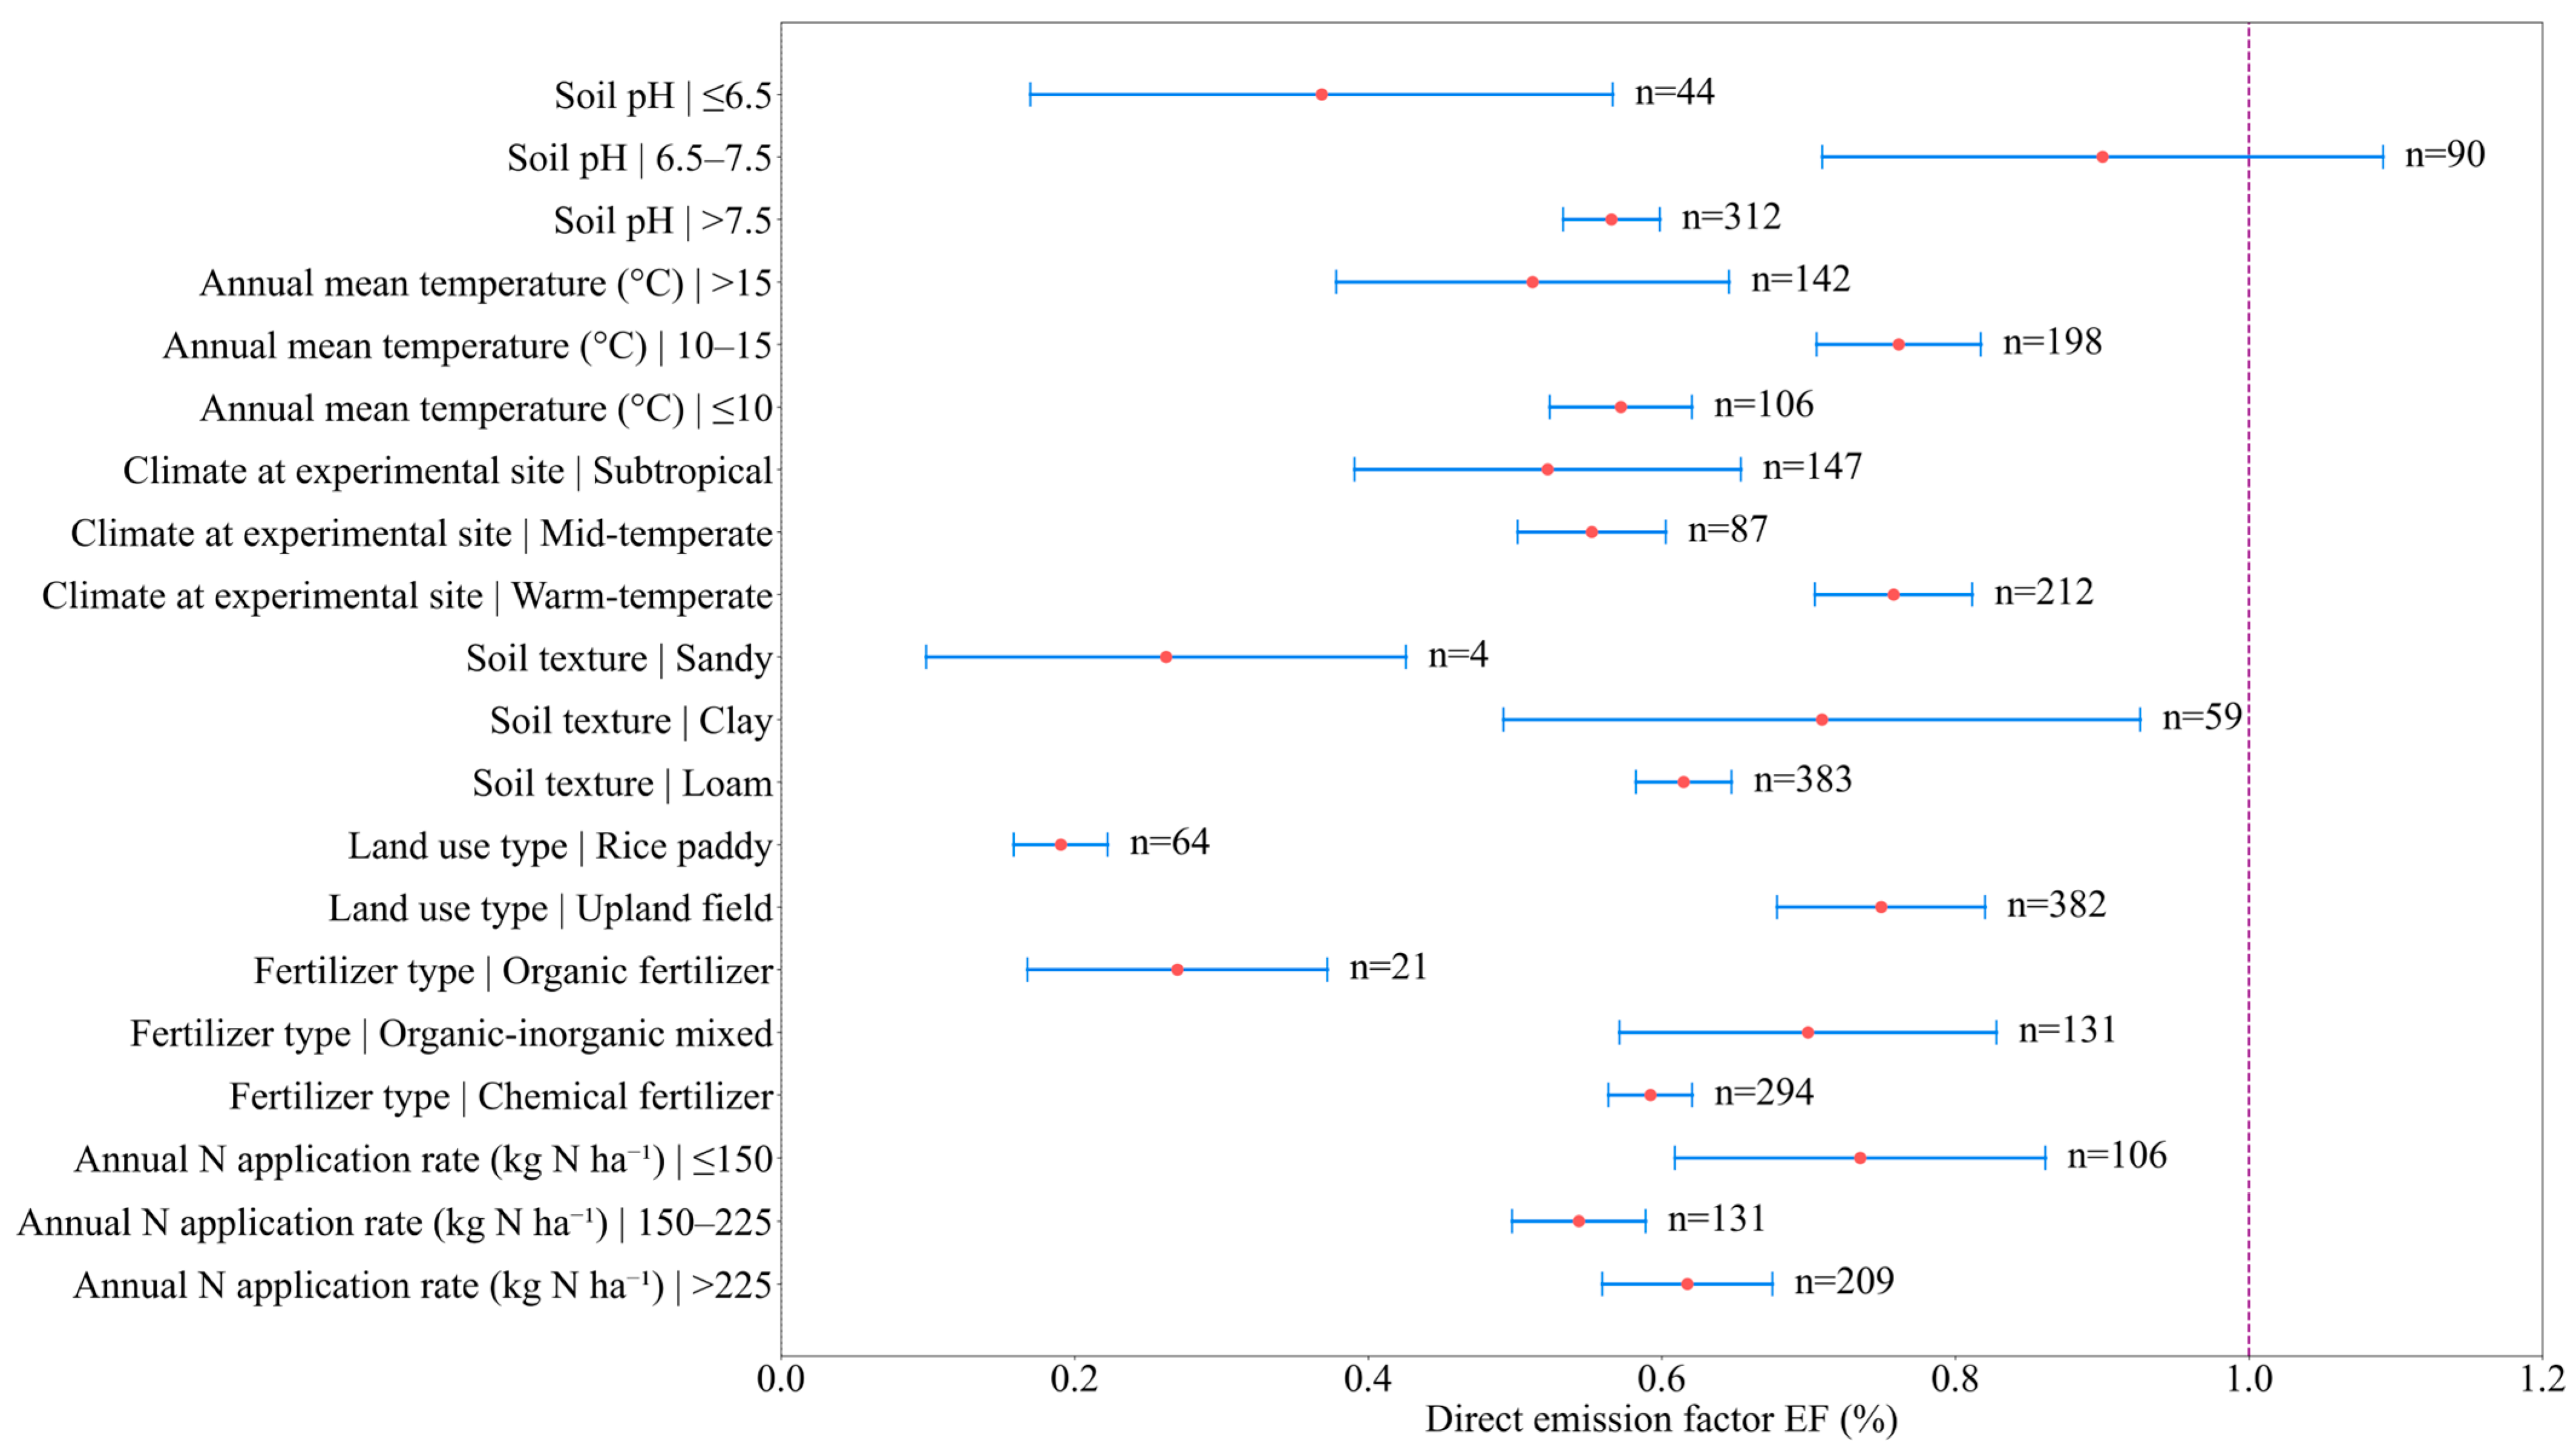
To examine the effects of environmental and management factors on the direct N2O EF from Chinese cropland soils, subgroup analyses were conducted based on N application rate, fertilizer type, land-use type, soil texture, climatic zone, mean annual temperature, and soil pH (Figure 3). Overall, the pooled EF values across all subgroups were lower than the IPCC default EF of 1%. In addition, the 95% confidence intervals (CIs) of most subgroups did not include 1%, except for the pH 6.5–7.5 category, indicating that the EF of Chinese cropland soils is generally lower than the global default value.
Across N application rates, EF values remained below the IPCC default value. The pooled EF was 0.74% (95% CI: 0.61–0.86%, n = 106) at ≤150 kg hm−2 a−1, 0.54% (95% CI: 0.50–0.59%, n = 131) at 150–225 kg hm−2 a−1, and 0.62% (95% CI: 0.56–0.68%, n = 209) at >225 kg hm−2 a−1. The lowest EF was observed under the intermediate N application rate (150–225 kg hm−2 a−1).
EF also varied among fertilizer types. The combined application of organic and inorganic fertilizers showed the highest EF (0.70%, 95% CI: 0.57–0.83%, n = 131), followed by chemical fertilizer alone (0.59%, 95% CI: 0.56–0.62%, n = 294) and organic fertilizer alone (0.27%, 95% CI: 0.17–0.37%, n = 21). Despite these differences, all fertilization types exhibited EF values below the IPCC default.
Land-use type showed a pronounced influence on EF. The pooled EF for upland croplands was 0.75% (95% CI: 0.68–0.82%, n = 382), which was substantially higher than that for paddy fields (0.19%, 95% CI: 0.16–0.22%, n = 64). The EF in paddy systems accounted for only about 19% of the IPCC default value, indicating much lower N2O emissions compared with upland systems.
With respect to soil texture, EF values for clay and loam soils were 0.71% (95% CI: 0.49–0.93%, n = 59) and 0.61% (95% CI: 0.58–0.65%, n = 383), respectively, both higher than that for sandy soils (0.26%, 95% CI: 0.10–0.43%, n = 4). Although the number of observations for sandy soils was limited, the results suggest substantially lower EF values in coarse-textured soils.
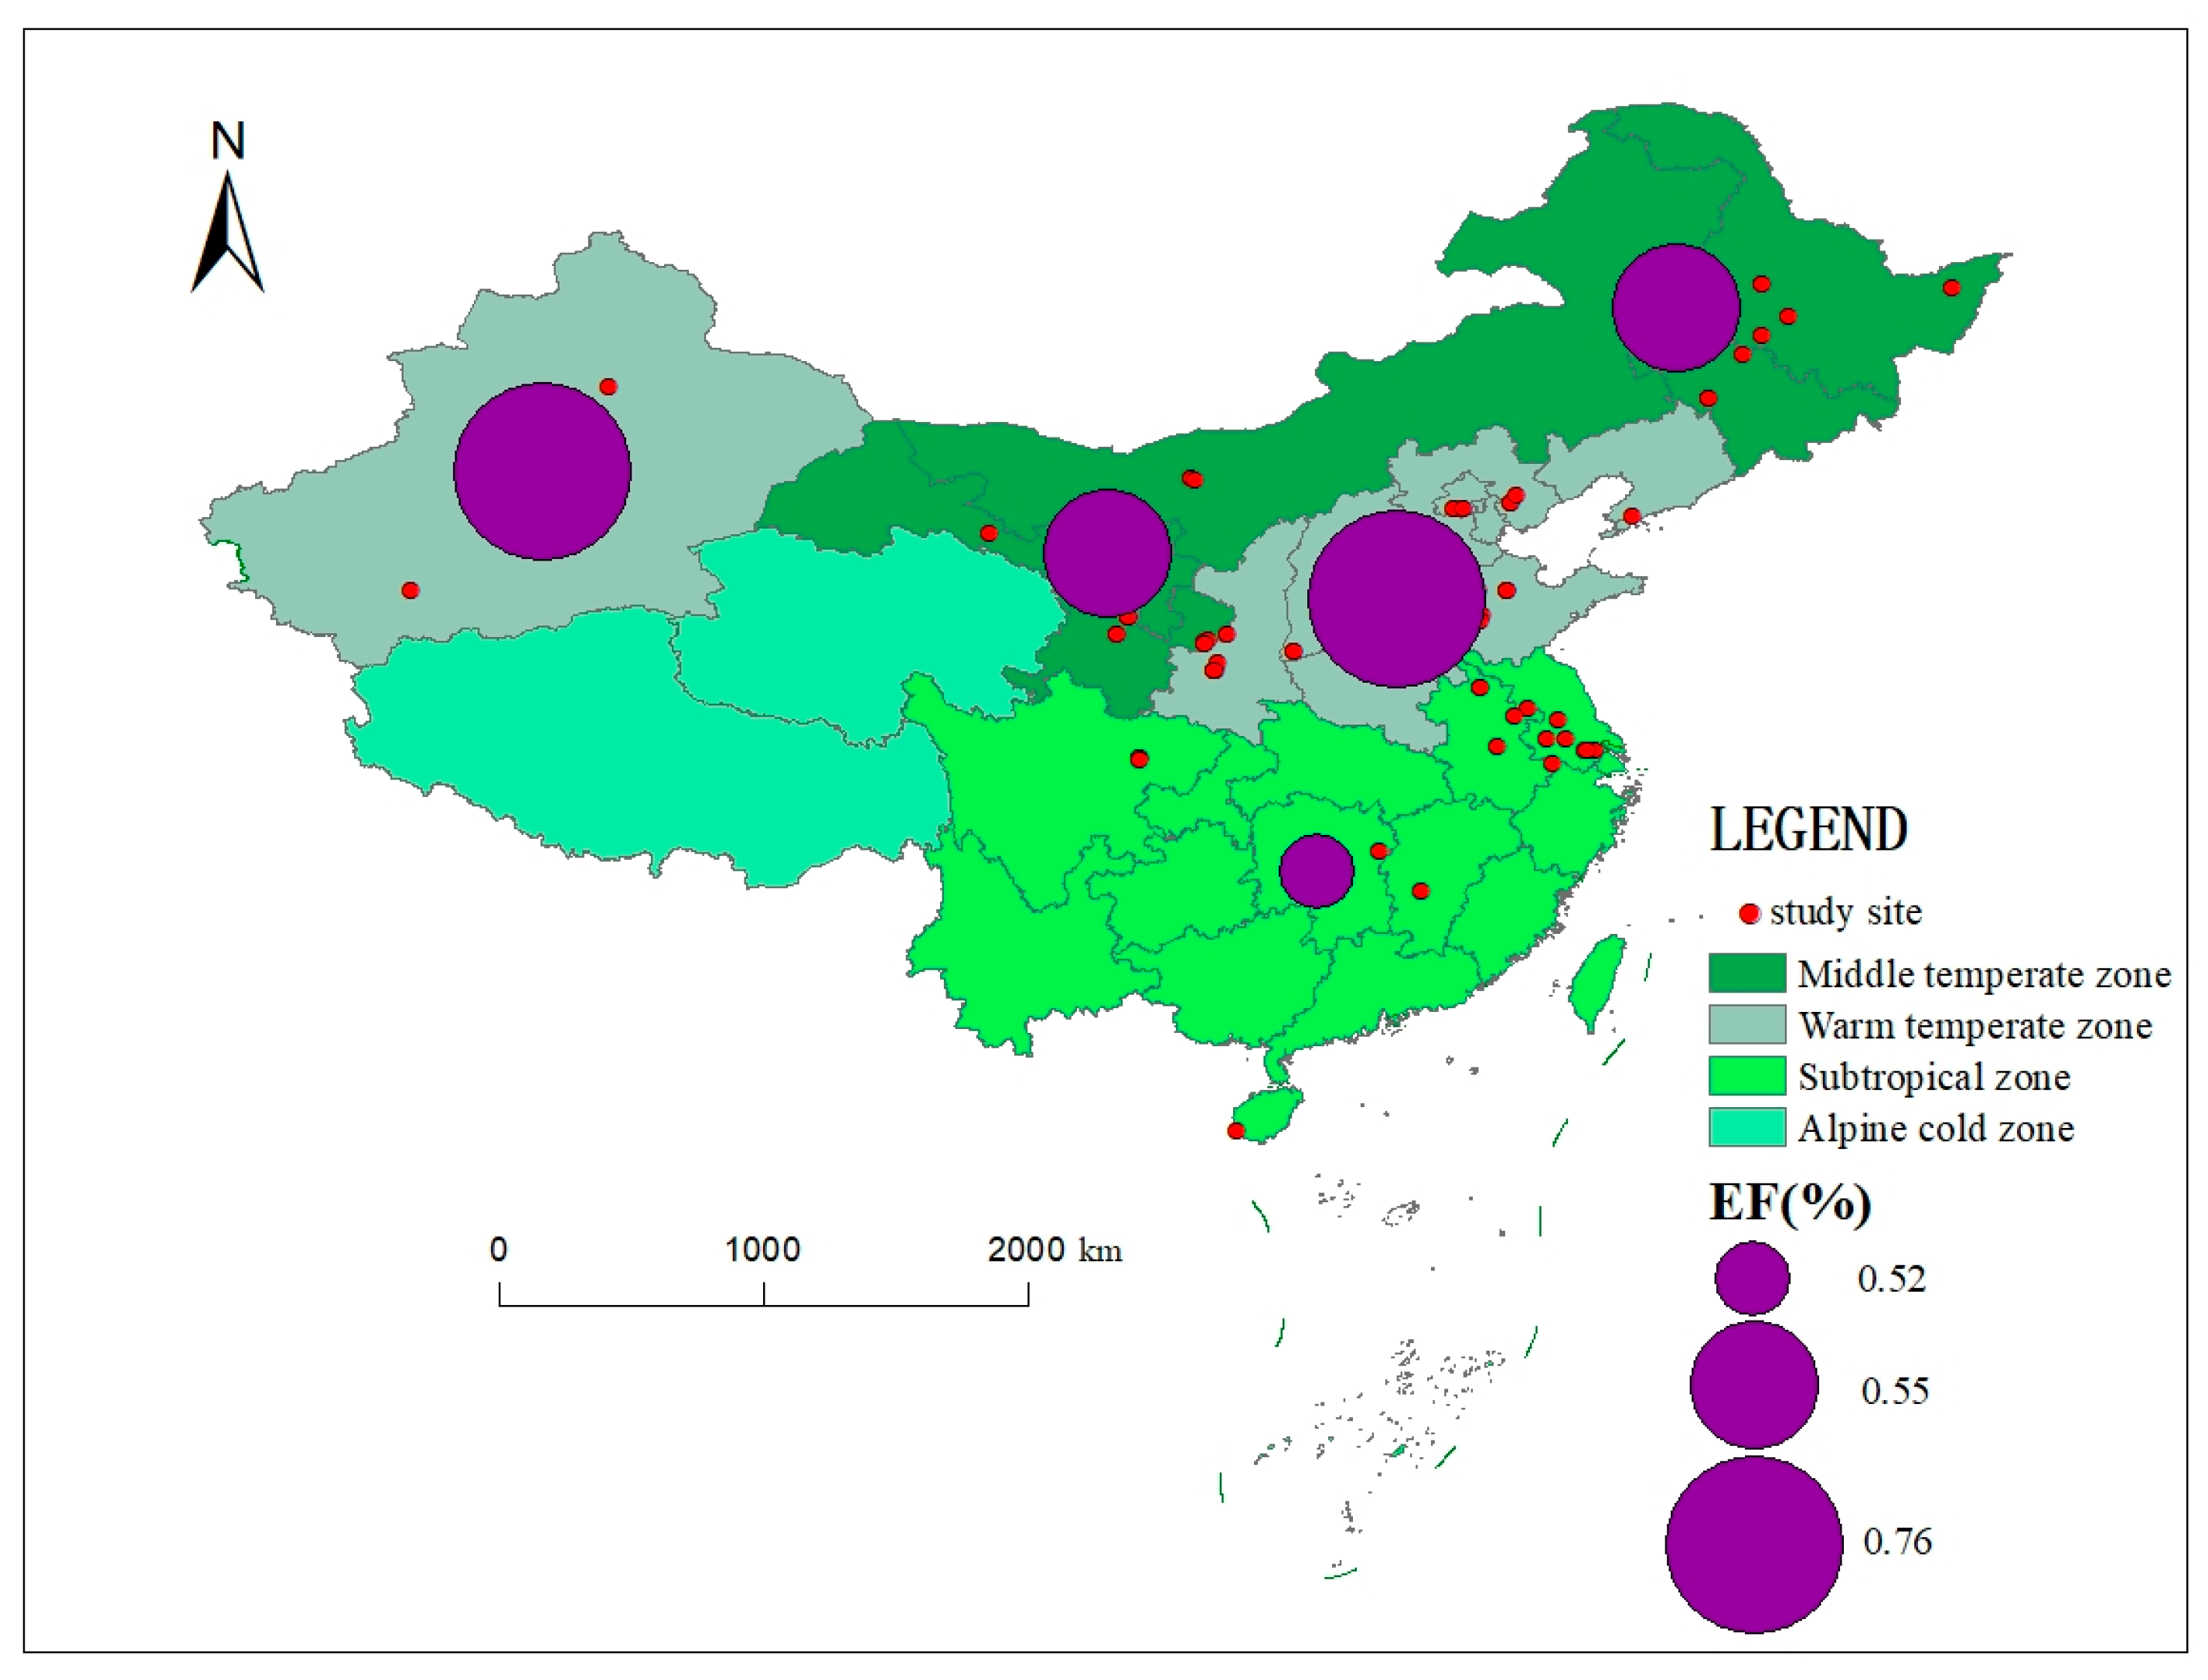
Across climatic zones, the highest EF was observed in the warm temperate zone (0.76%, 95% CI: 0.70–0.81%, n = 212), followed by the middle temperate (0.55%, 95% CI: 0.50–0.60%, n = 87) and subtropical zones (0.52%, 95% CI: 0.39–0.65%, n = 147).
For mean annual temperature, EF reached its highest value at 10–15 °C (0.76%, 95% CI: 0.71–0.82%, n = 198), whereas lower values were observed at ≤10 °C (0.57%, 95% CI: 0.52–0.62%, n = 106) and >15 °C (0.51%, 95% CI: 0.38–0.65%, n = 142).
Regarding soil pH, the EF under pH 6.5–7.5 was 0.90% (95% CI: 0.71–1.09%, n = 90), with the 95% CI including the IPCC default value. In contrast, EF values under acidic (≤6.5) and alkaline (>7.5) conditions were 0.37% (95% CI: 0.17–0.57%, n = 44) and 0.57% (95% CI: 0.53–0.60%, n = 312), respectively.
Overall, EF tended to be higher in upland systems, neutral soils, and regions with mean annual temperatures of 10–15 °C. Substantial between-study heterogeneity was observed across all subgroup analyses, with I2 values generally exceeding 97%, indicating considerable variability among studies in terms of climatic conditions, agricultural management practices, and measurement approaches.

3.3. Meta-Regression on Influencing Factors of Direct N2O Emission Factors from Farmland Soils

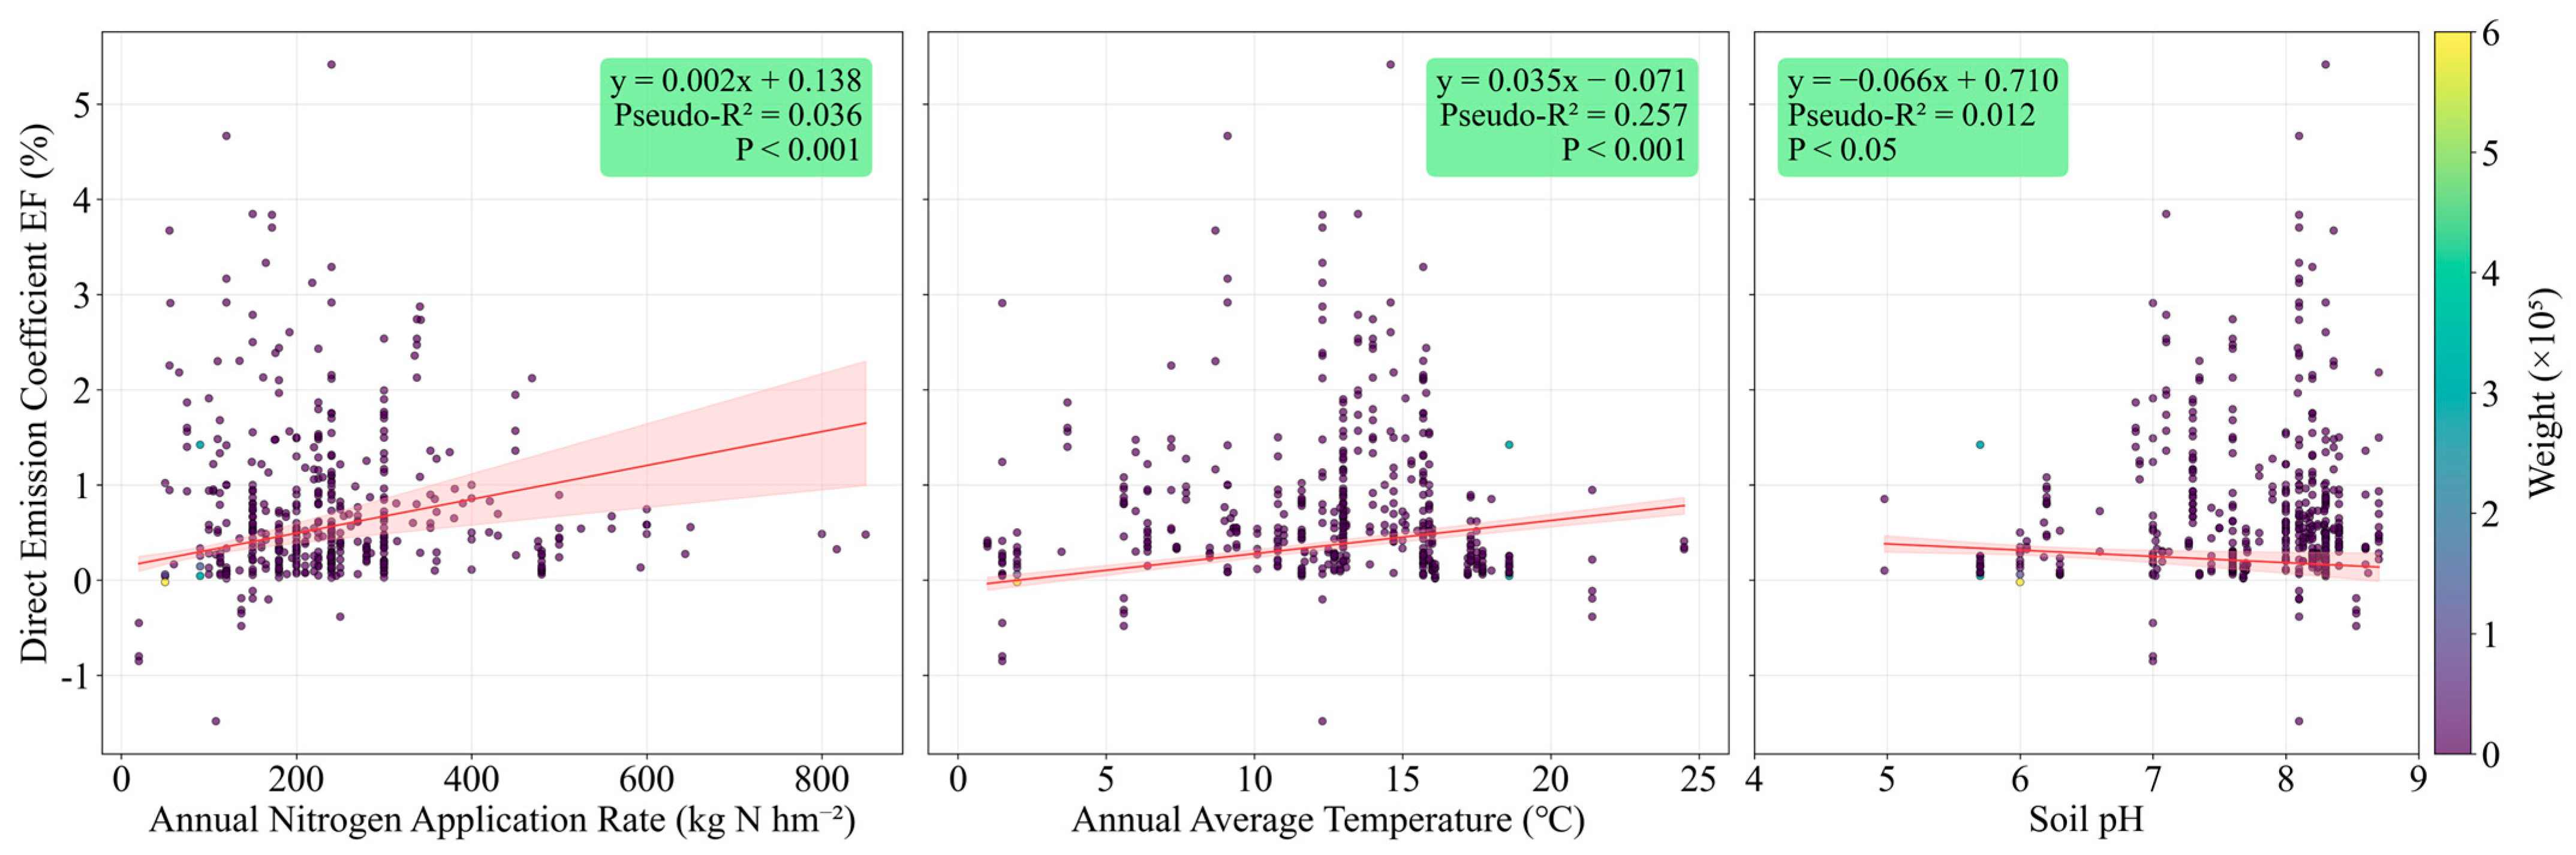
To further investigate the effects of key environmental and management factors on direct N2O EF in Chinese croplands, univariate meta-regression analyses were conducted for N application rate, mean annual temperature, and soil pH (Figure 4). The results indicated a significant positive relationship between N application rate and EF (β = 0.001778, p = 0.0001), suggesting that EF increases with higher N inputs. Mean annual temperature was also significantly positively correlated with EF (β = 0.034866, p < 0.001) and exhibited relatively high explanatory power (Pseudo-R2 = 0.2574), indicating that elevated temperatures may enhance N2O emissions. In contrast, soil pH was significantly negatively associated with EF (β = −0.06576, p = 0.023), suggesting that higher pH conditions tend to reduce N2O emission factors.
Overall, the above variables all had significant effects on EF; however, their ability to explain between-study heterogeneity was relatively limited (Pseudo-R2 = 0.0116–0.2574), indicating that N2O emissions from Chinese croplands are still influenced by a combination of multiple environmental conditions and management practices.

3.4. Sensitivity Analysis After Excluding Negative EF Results

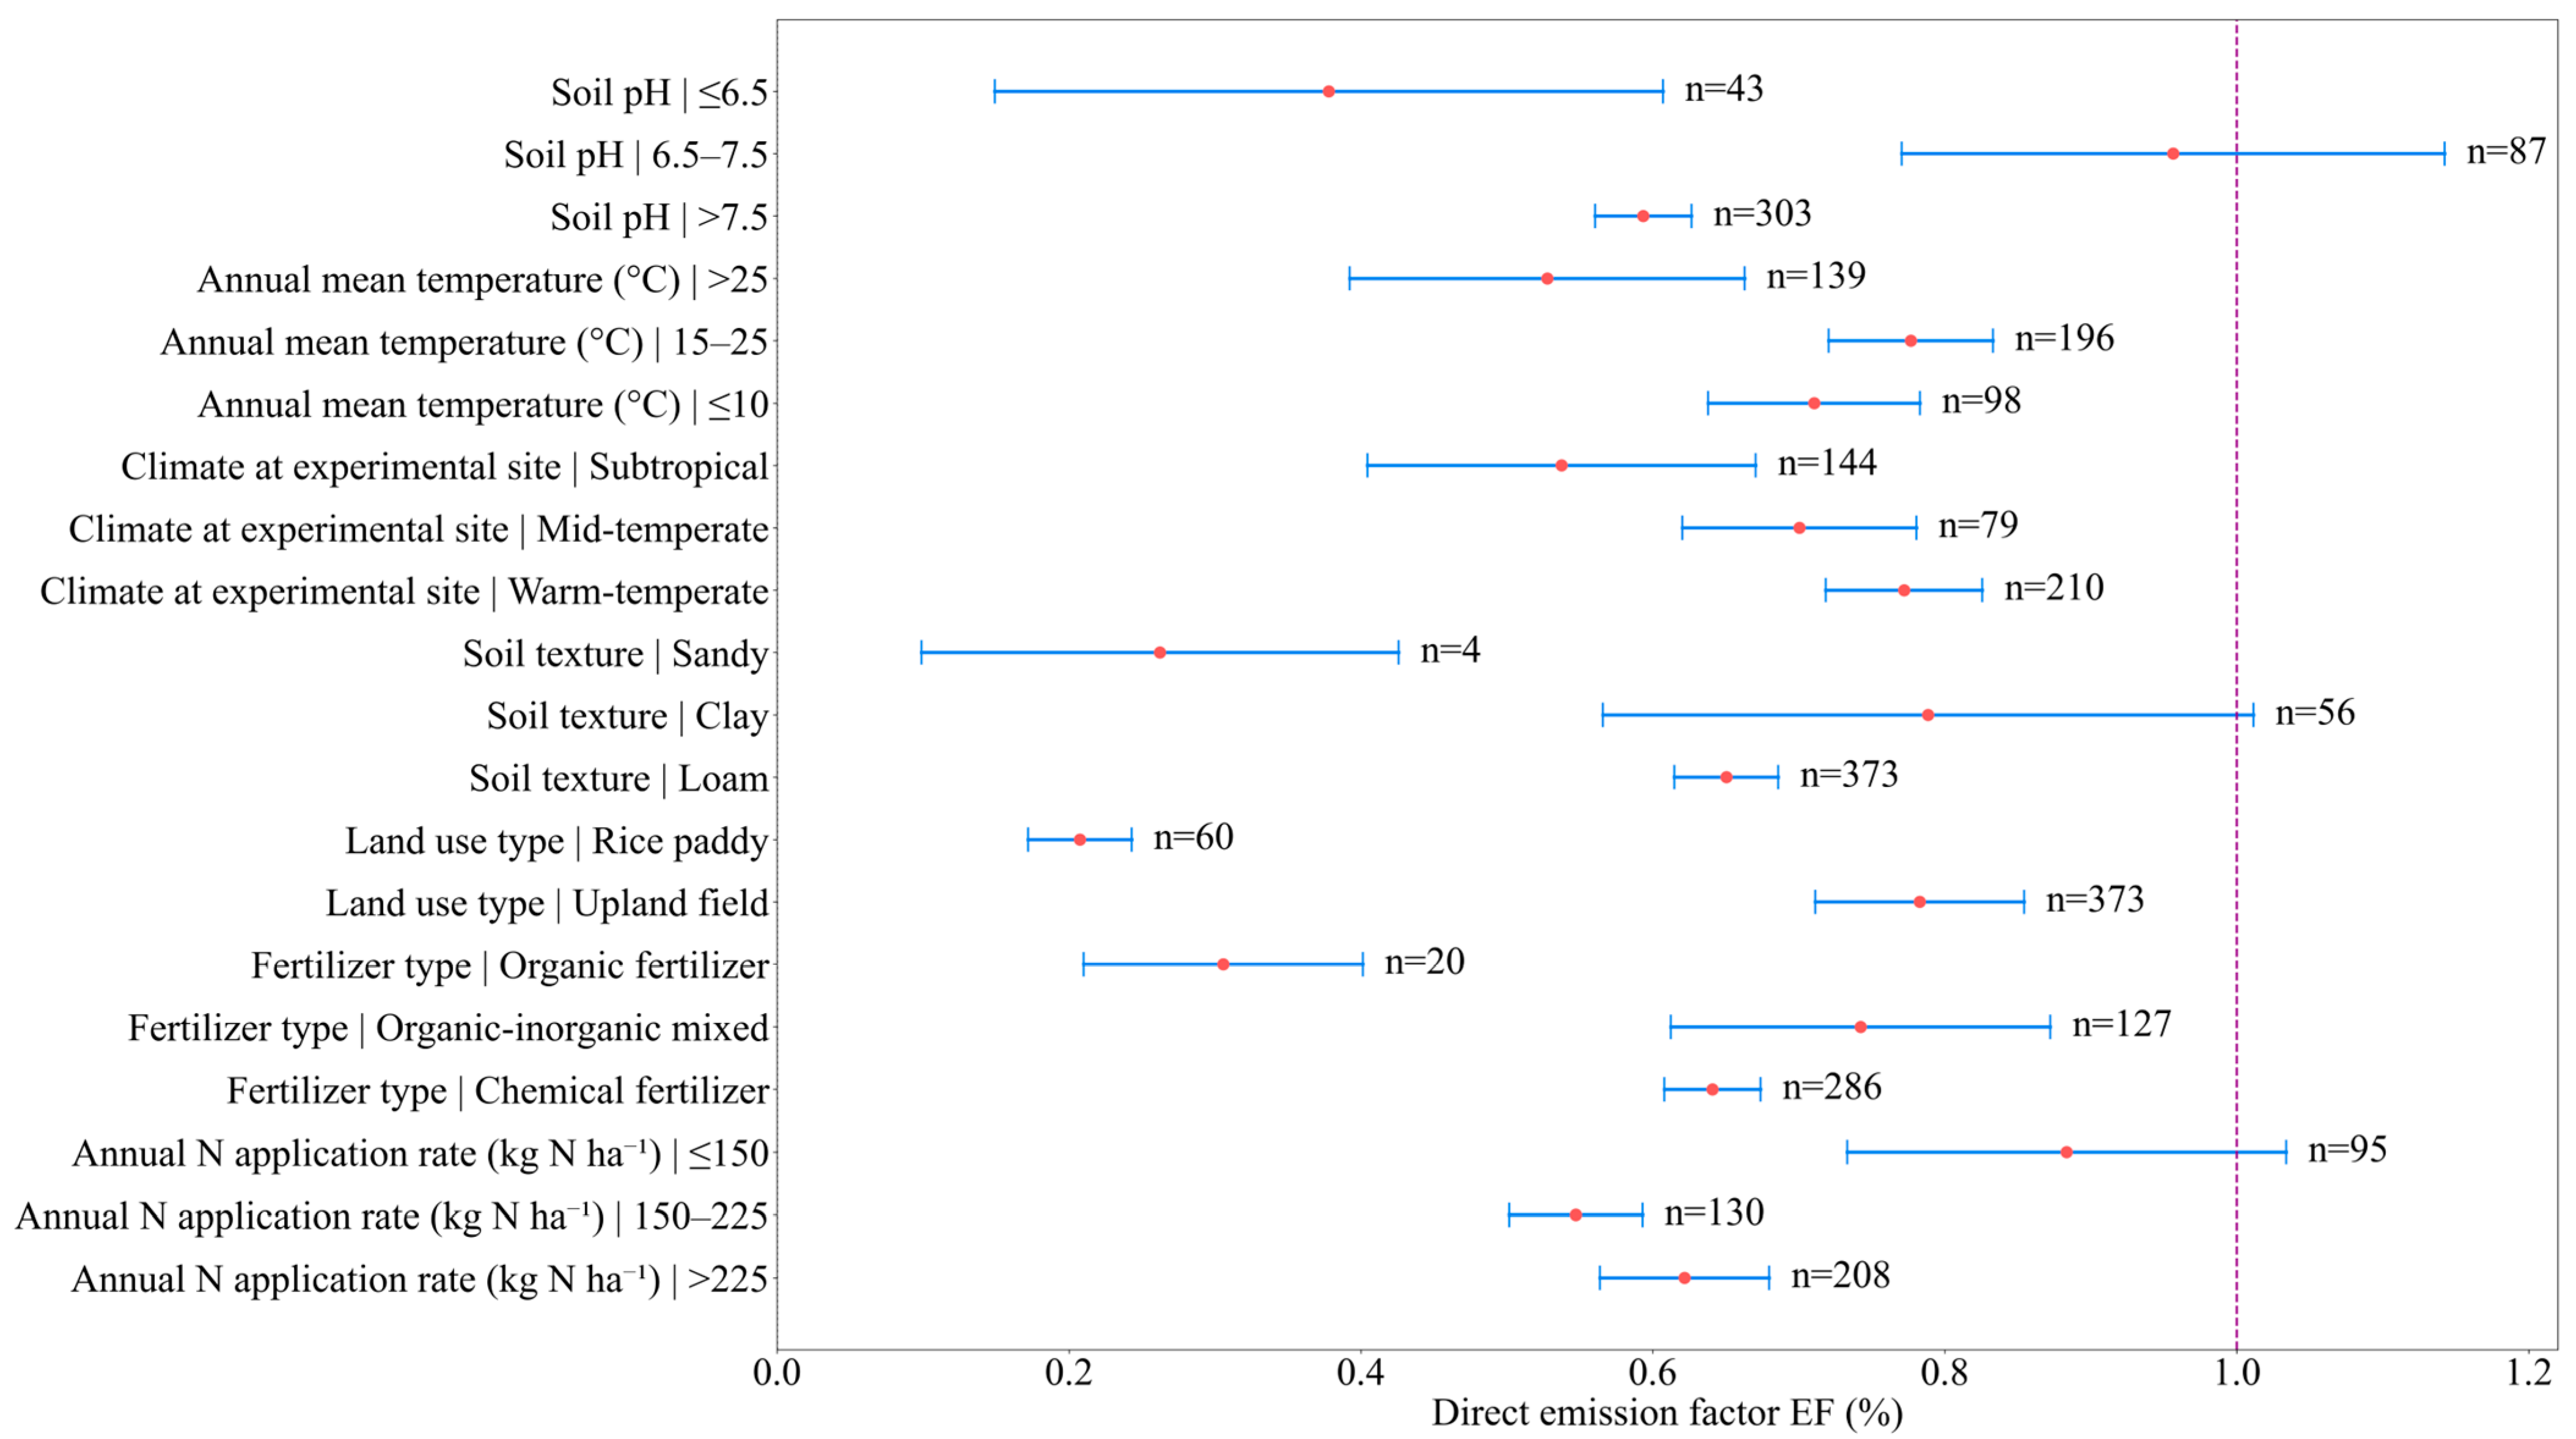
To assess the robustness of the results, studies reporting negative direct EF were excluded, and the overall and subgroup analyses were re-conducted (Figure 5). The overall EF was 0.72% (95% CI: 0.66–0.78%), slightly higher than the original overall EF of 0.68%, but the general trend remained unchanged and still significantly below the IPCC-recommended default of 1%. Subgroup analysis results were largely consistent with the original analyses, with minor increases in EF observed in a few subgroups—for example, the low N application subgroup (≤150 kg hm−2 a−1) increased from 0.735% to 0.883%, and the pH 6.5–7.5 subgroup increased from 0.900% to 0.956%-while the overall trend and direction of differences were maintained. Heterogeneity remained high (I2 mostly approaching 99%), indicating substantial between-study variability. Combined with Rosenberg’s fail-safe N test, the fail-safe number was 58,422.52, far exceeding the number of studies in the dataset, further suggesting that the results are not affected by publication bias. Overall, the sensitivity analysis indicates that excluding studies with negative EF values did not alter the overall or subgroup conclusions, and the estimated effect sizes are robust and reliable.

4. Discussion

4.1. Influencing Factors of N2O Emissions from Cropland Soils in China

N2O emissions from agricultural soils are influenced by a combination of management practices and environmental factors [32,33,34]. The subgroup and meta-regression analyses in this study indicate that N application rate is a key driver of cropland N2O emission factors. Following nitrogen fertilization, soil NH4+ and NO3- concentrations increase, providing substrates for microbial nitrification and denitrification processes, thereby promoting N2O production and emissions [4,35]. As N inputs increase, the availability of soil N rises and microbial metabolic activity is enhanced, resulting in a higher potential for N2O emissions. Therefore, elevated N application generally leads to increased N2O emissions from cropland soils [36,37]. Rational management of nitrogen fertilizer application is considered one of the most effective strategies for mitigating N2O emissions from agricultural soils.
Fertilizer type also influences N2O emissions from cropland soils. Some studies have reported that chemical fertilizer treatments release more N2O than organic fertilizer treatments [38,39], which is consistent with the results of the present meta-analysis. Conversely, other studies have indicated that organic fertilizers can enhance soil N2O emissions [40,41]. The application of organic fertilizer not only increases the N supply but also provides abundant labile carbon, serving as an energy source for denitrifying microorganisms and thereby stimulating denitrification and N2O production. In contrast, substitutive or optimized fertilization practices can mitigate N2O emissions by regulating the rate of soil N release and microbial activity [42]. Therefore, the appropriate selection of fertilizer type and application method can help improve N use efficiency while simultaneously reducing greenhouse gas emissions from croplands.
Land use type also significantly influences N2O emissions from cropland soils. In this study, direct emission factors were substantially higher in upland soils than in paddy fields, consistent with the findings of Aliyu et al. [18,43]. This difference is likely related to the long-term flooded conditions in paddy fields, which create anaerobic soil environments that promote complete denitrification, allowing a portion of N2O to be further reduced to N2, thereby decreasing N2O emissions [44,45]. In addition, limited oxygen diffusion in paddy soils can suppress nitrification, further lowering N2O emissions compared to upland systems.
Climatic conditions are also important determinants of N2O emissions from cropland soils. Temperature changes directly influence soil temperature [46], and within certain ranges, higher soil temperatures can enhance microbial activity, thereby stimulating nitrification and denitrification processes and increasing N2O emission rates [47]. The optimal temperature ranges for nitrification and denitrification are generally considered to be 25–35 °C and 30–67 °C, respectively [48]. Low temperatures can substantially reduce soil nitrification rates, although denitrification is less affected [49]. Differences in thermal and moisture regimes across climate zones further drive spatial heterogeneity in cropland N2O emissions (Figure 6). Our meta-regression results reveal a significant impact of mean annual temperature on the N2O emission factors, underscoring the importance of climate in modulating agricultural greenhouse gas emissions. Nonetheless, interactions between temperature and other drivers need to be incorporated.
Soil properties also play a critical role in regulating N2O emissions. Soil pH affects microbial community composition and metabolic activity, thereby modulating nitrification and denitrification processes [50]. Higher soil pH generally favors complete denitrification, as low pH can inhibit the activity of N2O reductase, impeding the reduction of N2O to N2, whereas neutral to slightly alkaline conditions enhance enzyme activity, facilitating the complete reduction of N2O and thereby lowering emissions [51,52]. In addition, soil texture influences microbial activity and N transformation by affecting soil porosity, moisture, and aeration. Fine-textured soils, compared with coarse-textured soils, have lower air-filled porosity and higher resistance to oxygen diffusion, resulting in lower redox potential and greater potential for N2O production [53]. Loam and clay soils typically exhibit higher water-holding capacity and lower aeration, which promote denitrification, whereas sandy soils, with greater aeration, may display different N2O emission characteristics [54,55]. Therefore, N2O emissions from cropland soils are the result of complex interactions among multiple management practices and environmental factors.

4.2. Causes of Lower N2O Emission Factors in Chinese Croplands Relative to IPCC Default Values

The results of this study indicate that direct N2O emission factors in Chinese croplands are generally lower than the IPCC-recommended global default value of 1%. This finding suggests that the use of a universal default EF may overestimate N2O emissions from Chinese croplands, and that the observed discrepancy arises from the combined effects of agricultural management practices, cropping systems, regional environmental conditions, and soil properties.
Optimization of agricultural management practices is a key factor influencing N2O emissions. In recent years, technologies such as soil testing-based fertilization, controlled-release fertilizers, and reduced N application have been gradually promoted in Chinese agriculture [56,57]. These measures not only improve N use efficiency but also mitigate the stimulatory effect of excessive N application on N2O emissions [58,59]. By optimizing fertilization management, the accumulation of excess N in soils can be reduced, thereby lowering N2O production during nitrification and denitrification processes [60]. Meanwhile, widely implemented practices in Chinese croplands, such as returning crop residues to the field and partially substituting chemical fertilizers with organic amendments, slow the mineralization rate of organic N, reduce instantaneous N accumulation in the soil, and decrease N losses through synchronized nitrification-denitrification, further reducing N2O emission intensity [61,62,63].
The unique cropping systems in Chinese croplands also significantly affect N2O emission factors. Rice paddies occupy a substantial proportion of the arable land [64], and the long-term flooded conditions in paddy fields create anaerobic environments that facilitate complete denitrification, allowing a portion of N2O to be further reduced to N2 and thereby lowering net N2O emissions [44,45]. Moreover, high N use efficiency in Chinese croplands [65] enables crops to effectively uptake N, reducing the pool of soil N available for gaseous losses. Additionally, prevalent cropping patterns such as multiple cropping and rice-upland rotation better synchronize crop growth cycles with N uptake, minimizing the ineffective transformation and loss of soil N during fallow periods [66,67]. Compared with long-term fallow or monoculture systems common in Europe and North America, these practices are more conducive to reducing N2O emissions.
Differences in soil properties and regional environmental conditions further accentuate these discrepancies. Croplands in China are dominated by acidic soils such as red soils, paddy soils, and upland clay soils [68], which differ substantially from the neutral to alkaline soils primarily represented in the IPCC default dataset [69]. Acidic soil environments can suppress the activity of nitrifying microorganisms and alter the proportions of denitrification products, resulting in relatively lower N2O production potential [70]. The IPCC default EF is derived from the global average of numerous studies across different regions and does not fully capture the substantial variability in climate, precipitation, and temperature among regions [20,30]. In China, the coincident timing of rainfall and high temperatures accelerates crop N uptake, while the spatial and temporal distribution of precipitation affects soil moisture conditions, further regulating N2O production and leading to actual emission factors that differ significantly from the global average [71].
The emission factors obtained in this study are based on extensive in situ observations across major agricultural regions and representative cropping systems in China. Compared with the IPCC default emission factor of 1% reported in the IPCC Guidelines [20], which were derived from relatively limited datasets, these results more accurately reflect the actual N cycling characteristics of Chinese croplands, better capturing regional conditions. Consequently, they provide more reliable parameters for developing regional-scale greenhouse gas inventories.

4.3. Limitations of the Study and Recommendations for Future Research

Despite the integration of extensive observational data and the systematic analysis of N2O emission factors in Chinese croplands, this study has certain limitations. First, the data were derived from studies conducted across different regions using varying methodologies. Differences in observation periods, sampling frequency, and emission calculation approaches among studies may introduce additional uncertainty and contribute to high heterogeneity in the results. Second, the sample sizes for some subgroups were relatively small; for instance, studies on certain soil texture types were limited, which may affect the representativeness and statistical robustness of the associated findings. Therefore, these results should be interpreted with caution.
Future research should prioritize long-term, site-specific observations and expand data collection across croplands in diverse climate zones and soil types. Efforts should also be made to standardize observation methodologies and data processing protocols to enhance comparability across studies. In addition, future investigations on greenhouse gas emissions could integrate climate change scenarios and variations in agricultural management practices to assess potential trends in N2O emissions from croplands. Such approaches would provide more robust scientific evidence to support the development of effective mitigation strategies and the compilation of accurate greenhouse gas inventories.

5. Conclusions

Based on extensive in situ observations conducted across Chinese croplands, this study demonstrated that annual N2O emissions are generally low, with a mean EF of approximately 0.68%—substantially lower than the 1% global default value recommended by the IPCC. Subgroup analyses and meta-regression analyses revealed that annual N application rate, fertilizer type, land use type, soil texture, climate zone, mean annual temperature, and soil pH all exert significant effects on soil N2O emissions, with N application rate and soil pH identified as the primary driving factors. Collectively, the combined impacts of agricultural management practices, cropping systems, regional environmental conditions, and soil properties contribute to the consistently lower EF observed in Chinese croplands compared to the IPCC default value. These findings suggest that the IPCC default EF may overestimate N2O emissions from Chinese cropland soils, underscore the necessity of region-specific emission factors for national greenhouse gas inventories, and provide a robust scientific basis for the development of region-specific greenhouse gas emission factors as well as the formulation of targeted agricultural mitigation strategies to mitigate N2O emissions. However, considering the limitations of the available literature, future research should prioritize improving data representativeness across regions and enhancing methodological consistency to reduce uncertainty in N2O emission estimates.

Supplementary Materials

The following supporting information can be downloaded at https://www.mdpi.com/article/10.3390/atmos17040422/s1, Table S1: Details of studies included in the meta-analysis.

Author Contributions

K.X.: Writing—original draft. D.X. and P.J.: Visualization, Data curation. C.Q.: Writing—Review & Editing, Conceptualization and Project administration. All authors have read and agreed to the published version of the manuscript.

Funding

This research was funded by the Natural Science Basic Research Program of Shaanxi (grant number 2025JC-QYCX-032), National Natural Science Foundation of China (grant number 42577250), Fundamental Research Funds for the Central Universities (grant number xxj032025028), and National Training Program of Innovation and Entrepreneurship for Undergraduates (grant number S202510698553).

Institutional Review Board Statement

Not applicable.

Informed Consent Statement

Not applicable.

Data Availability Statement

The data used in this study are available from the corresponding author upon reasonable request. The original datasets were generated from publicly available literature sources.

Acknowledgments

The authors acknowledge the researchers of the original field studies whose data on nitrogen fertilizer-induced N2O emissions were utilized in this meta-analysis. We are especially grateful to the Editor, Associate Editor, and anonymous reviewers for their helpful comments and suggestions, which have improved the quality of the manuscript.

Conflicts of Interest

The authors declare no conflicts of interest.

Abbreviations

N2Onitrous oxide
EFdirect emission factor
IPCCthe Intergovernmental Panel on Climate Change
Nnitrogen

References

  1. Solomon, S.; Qin, D.; Manning, M.; Chen, Z.; Marquis, M.; Averyt, K.B.; Tignor, M.; Miller, H.L. (Eds.) Climate Change 2007: The Physical Science Basis; Cambridge University Press: Cambridge, UK, 2007. [Google Scholar] [CrossRef]
  2. Ravishankara, A.R.; Daniel, J.S.; Portmann, R.W. Nitrous oxide (N2O): The dominant ozone-depleting substance emitted in the 21st century. Science 2009, 326, 123–125. [Google Scholar] [CrossRef]
  3. Davidson, E.A.; Kanter, D. Inventories and scenarios of nitrous oxide emissions. Environ. Res. Lett. 2014, 9, 105012. [Google Scholar] [CrossRef]
  4. Butterbach-Bahl, K.; Baggs, E.M.; Dannenmann, M.; Kiese, R.; Zechmeister-Boltenstern, S. Nitrous oxide emissions from soils: How well do we understand the processes and their controls? Philos. Trans. R. Soc. B Biol. Sci. 2013, 368, 20130122. [Google Scholar] [CrossRef]
  5. Stocker, T.F.; Qin, D.; Plattner, G.-K.; Tignor, M.; Allen, S.K.; Boschung, J.; Nauels, A.; Xia, Y.; Bex, V.; Midgley, P.M. (Eds.) Climate Change 2013: The Physical Science Basis; Cambridge University Press: Cambridge, UK, 2013. [Google Scholar] [CrossRef]
  6. Triches, N.Y.; Engel, J.; Bolek, A.; Vesala, T.; Marushchak, M.E.; Virkkala, A.M.; Heimann, M.; Göeckede, M. Practical guidelines for reproducible N2O flux chamber measurements in nutrient-poor ecosystems. Atmos. Meas. Tech. 2025, 18, 3407–3424. [Google Scholar] [CrossRef]
  7. Wei, Y.; Yang, X.; Jia, Y.; Han, H.; Tang, C. Study of atmospheric CH4, CO2 and N2O at Waliguan WMO/GAW global station: Time series trend, seasonal variation, and attribution analysis association with meteorological factors. Atmos. Environ. 2025, 343, 120994. [Google Scholar] [CrossRef]
  8. Abbasi, N.A.; Madramootoo, C.A.; Zhang, T.; Tan, C.S. Nitrous oxide emissions as affected by fertilizer and water table management under a corn-soybean rotation. Geoderma 2020, 375, 114473. [Google Scholar] [CrossRef]
  9. Manco, A.; Giaccone, M.; Zenone, T.; Onofri, A.; Tei, F.; Farneselli, M.; Gabbrielli, M.; Allegrezza, M.; Perego, A.; Magliulo, V.; et al. An overview of N2O emissions from cropping systems and current strategies to improve nitrogen use efficiency. Horticulturae 2024, 10, 754. [Google Scholar] [CrossRef]
  10. Snyder, C.S.; Bruulsema, T.W.; Jensen, T.L.; Fixen, P.E. Review of greenhouse gas emissions from crop production systems and fertilizer management effects. Agric. Ecosyst. Environ. 2009, 133, 247–266. [Google Scholar] [CrossRef]
  11. Sedghi, N.; Cavigelli, M.; Weil, R.R. Soil texture, fertilization, cover crop species and management affect nitrous oxide emissions from no-till cropland. Sci. Total Environ. 2024, 914, 169991. [Google Scholar] [CrossRef]
  12. Liu, C.; Wen, Z.; Wang, J.; Liu, X. High-resolution estimation of cropland N2O emissions in China based on machine learning algorithms. Atmosphere 2025, 16, 1092. [Google Scholar] [CrossRef]
  13. Abdalla, M.; Shang, Z.; Espenberg, M.; Cui, X.; Mander, Ü.; Smith, P. Impacts of crop type, management and soil quality indicators on background nitrous oxide emissions (BNE) from Chinese croplands: A quantitative review and analysis. Environ. Sci. Atmos. 2022, 2, 563–573. [Google Scholar] [CrossRef]
  14. Yu, Z.; Liu, J.; Kattel, G. Historical nitrogen fertilizer use in China from 1952 to 2018. Earth Syst. Sci. Data 2022, 14, 5179–5194. [Google Scholar] [CrossRef]
  15. Yang, Y.; Tong, Y.; Gao, P.; Htun, Y.; Feng, T. Evaluation of N2O emission from rainfed wheat field in northwest agricultural land in China. Environ. Sci. Pollut. Res. 2020, 27, 43466–43479. [Google Scholar] [CrossRef]
  16. Ma, Y.; Qiao, Y.; Tang, Y.; Wu, Y.; Miao, S. Estimation of N2O and CH4 emissions in field study and DNDC model under optimal nitrogen level in rice-wheat rotation system. Sci. Total Environ. 2025, 974, 179168. [Google Scholar] [CrossRef]
  17. Li, C.; Zhu, J.; Li, X.; Deng, J.; Yang, W.; Zhou, Y.; Li, S.; Yi, L.; Liu, Z.; Zhu, B. CH4 and N2O emission and grain yield performance of three main rice-farming patterns in central China. Agronomy 2023, 13, 1460. [Google Scholar] [CrossRef]
  18. Aliyu, G.; Luo, J.; Di, H.J.; Lindsey, S.; Liu, D.; Yuan, J.; Chen, Z.; Lin, Y.; He, T.; Zaman, M.; et al. Nitrous oxide emissions from China’s croplands based on regional and crop-specific emission factors deviate from IPCC 2006 estimates. Sci. Total Environ. 2019, 669, 547–558. [Google Scholar] [CrossRef] [PubMed]
  19. Xu, Y.; Guo, L.; Xie, L.; Yun, A.; Li, Y.; Zhang, X.; Zhao, X.; Diao, T. Background emissions and emission factor characteristics of N2O from major upland croplands in China. Sci. Agric. Sin. 2016, 49, 1729–1743. [Google Scholar]
  20. Eggleston, H.S.; Buendia, L.; Miwa, K.; Ngara, T.; Tanabe, K. (Eds.) 2006 IPCC Guidelines for National Greenhouse Gas Inventories, Volume 4: Agriculture, Forestry and Other Land Use; Institute for Global Environmental Strategies: Hayama, Japan, 2006. [Google Scholar]
  21. Shepherd, A.; Yan, X.; Nayak, D.; Newbold, J.; Moran, D.; Dhanoa, M.S.; Goulding, K.; Smith, P.; Cardenas, L.M. Disaggregated N2O emission factors in China based on cropping parameters create a robust approach to the IPCC Tier 2 methodology. Atmos. Environ. 2015, 122, 272–281. [Google Scholar] [CrossRef]
  22. Paul, J.; Barari, M. Meta-analysis and traditional systematic literature reviews—What, why, when, where, and how? Psychol. Mark. 2022, 39, 1099–1115. [Google Scholar] [CrossRef]
  23. Wang, S.; Wei, X.; Luan, X.; Li, J.; Yang, Y.; Pang, J.; Gao, F. Meta-analysis of the effects of different farming measures on greenhouse gas emissions from farmland in China. Land 2025, 14, 413. [Google Scholar] [CrossRef]
  24. Hui, D.; Ray, A.; Kasrija, L.; Christian, J. Impacts of climate change and agricultural practices on nitrogen processes, genes, and soil nitrous oxide emissions: A quantitative review of meta-analyses. Agriculture 2024, 14, 240. [Google Scholar] [CrossRef]
  25. Xing, Z.; Zhang, W.; Wang, W.; Liu, L. Promising water-saving strategies for mitigating greenhouse gas emissions while ensuring rice yield in paddy fields: Evidences from a global meta-analysis. Agric. Water Manag. 2025, 321, 109949. [Google Scholar] [CrossRef]
  26. Wng, X.; Zhang, L.; Liao, K.; Zhu, Q.; Lai, X. Effects of no-tillage on soil organic carbon content and greenhouse gas emissions from farmlands across different climate zones in China: A Meta-analysis. Chin. J. Ecol. 2026, 46, 3296–3308. [Google Scholar] [CrossRef]
  27. Zheng, J.; Bian, J.; Ge, Q.; Hao, C.; Wu, S.; Yin, Y. The climate regionalization in China for 1981–2010. Chin. Sci. Bull. 2013, 58, 3088–3099. [Google Scholar]
  28. Zheng, J.; Yin, Y.; Li, B. New scheme of climate regionalization in China. Acta Geogr. Sin. 2010, 65, 3–12. [Google Scholar]
  29. Wang, X.; Zou, C.; Gao, X.; Guan, X.; Zhang, W.; Zhang, Y.; Shi, X.; Chen, X. Nitrous oxide emissions in Chinese vegetable systems: A meta-analysis. Environ. Pollut. 2018, 239, 375–383. [Google Scholar] [CrossRef]
  30. Stehfest, E.; Bouwman, L. N2O and NO emission from agricultural fields and soils under natural vegetation: Summarizing available measurement data and modeling of global annual emissions. Nutr. Cycl. Agroecosyst. 2006, 74, 207–228. [Google Scholar] [CrossRef]
  31. Xiang, Y.; Deng, Q.; Duan, H.; Guo, Y. Effects of biochar application on root traits: A meta-analysis. Glob. Change Biol. Bioenergy 2017, 9, 1563–1572. [Google Scholar] [CrossRef]
  32. Ludwig, J.; Meixner, F.X.; Vogel, B.; Förstner, J. Soil-air exchange of nitric oxide: An overview of processes, environmental factors, and modeling studies. Biogeochemistry 2001, 52, 225–257. [Google Scholar] [CrossRef]
  33. Barnard, R.; Leadley, P.W.; Hungate, B.A. Global change, nitrification, and denitrification: A review. Glob. Biogeochem. Cycles 2005, 19, Gb1007. [Google Scholar] [CrossRef]
  34. Rochette, P. No-till only increases N2O emissions in poorly-aerated soils. Soil Tillage Res. 2008, 101, 97–100. [Google Scholar] [CrossRef]
  35. Skiba, U.; Smith, K.A.; Fowler, D. Nitrification and denitrification as sources of nitric oxide and nitrous oxide in a sandy loam soil. Soil Biol. Biochem. 1993, 25, 1527–1536. [Google Scholar] [CrossRef]
  36. Bouwman, A.F.; Boumans, L.J.M.; Batjes, N.H. Emissions of N2O and NO from fertilized fields: Summary of available measurement data. Glob. Biogeochem. Cycles 2002, 16, 6-1–6-13. [Google Scholar] [CrossRef]
  37. Hansen, S.; Mæhlum, J.E.; Bakken, L.R. N2O and CH4 fluxes in soil influenced by fertilization and tractor traffic. Soil Biol. Biochem. 1993, 25, 621–630. [Google Scholar] [CrossRef]
  38. Dick, J.; Kaya, B.; Soutoura, M.; Skiba, U.; Smith, R.; Niang, A.; Tabo, R. The contribution of agricultural practices to nitrous oxide emissions in semi-arid Mali. Soil Use Manag. 2008, 24, 292–301. [Google Scholar] [CrossRef]
  39. Lin, W.; Ding, J.; Li, Y.; Xu, C.; Li, Q.; Zheng, Q.; Zhuang, S. Effects of organic and inorganic fertilizers on emission and sources of N2O in vegetable soils. Chin. J. Appl. Ecol. 2018, 29, 1470–1478. [Google Scholar] [CrossRef]
  40. Hayakawa, A.; Akiyama, H.; Sudo, S.; Yagi, K. N2O and NO emissions from an Andisol field as influenced by pelleted poultry manure. Soil Biol. Biochem. 2009, 41, 521–529. [Google Scholar] [CrossRef]
  41. Akiyama, H.; Tsuruta, H. Nitrous oxide, nitric oxide, and nitrogen dioxide fluxes from soils after manure and urea application. J. Environ. Qual. 2003, 32, 423–431. [Google Scholar] [CrossRef]
  42. You, L.; Ros, G.H.; Chen, Y.; Zhang, F.; de Vries, W. Optimized agricultural management reduces global cropland nitrogen losses to air and water. Nat. Food 2024, 5, 995–1004. [Google Scholar] [CrossRef]
  43. Wang, Q.; Zhou, F.; Shang, Z.; Ciais, P.; Winiwarter, W.; Jackson, R.B.; Tubiello, F.N.; Janssens-Maenhout, G.; Tian, H.; Cui, X.; et al. Data-driven estimates of global nitrous oxide emissions from croplands. Natl. Sci. Rev. 2020, 7, 441–452. [Google Scholar] [CrossRef]
  44. Yoo, J.; Woo, S.-H.; Park, K.-D.; Chung, K.-Y. Effect of no-tillage and conventional tillage practices on the nitrous oxide (N2O) emissions in an upland soil: Soil N2O emission as affected by the fertilizer applications. Appl. Biol. Chem. 2016, 59, 787–797. [Google Scholar] [CrossRef]
  45. Islam, S.M.M.; Gaihre, Y.K.; Biswas, J.C.; Singh, U.; Ahmed, M.N.; Sanabria, J.; Saleque, M.A. Nitrous oxide and nitric oxide emissions from lowland rice cultivation with urea deep placement and alternate wetting and drying irrigation. Sci. Rep. 2018, 8, 17623. [Google Scholar] [CrossRef]
  46. Cai, Y.; Ding, W.; Xiang, J. Influencing factors and their mechanisms of N2O and NO emissions from farmland soil. Soils 2012, 44, 881–887. [Google Scholar] [CrossRef]
  47. Yang, Y.; Huang, M.; Liu, H.; Liu, H. Research advances in temperature sensitivity and adaptability of soil respiration. J. Nat. Resour. 2011, 26, 1811–1820. [Google Scholar]
  48. Granli, T.; Bockman, O.C. Nitrous oxide from agriculture. Nor. J. Agric. Sci. Suppl. 1994, 12, 1–128. [Google Scholar]
  49. Malhi, S.S.; McGill, W.B.; Nyborg, M. Nitrate losses in soils—Effect of temperature, moisture and substrate concentration. Soil Biol. Biochem. 1990, 22, 733–737. [Google Scholar] [CrossRef]
  50. Van den Heuvel, R.N.; Bakker, S.E.; Jetten, M.S.M.; Hefting, M.M. Decreased N2O reduction by low soil pH causes high N2O emissions in a riparian ecosystem. Geobiology 2011, 9, 294–300. [Google Scholar] [CrossRef]
  51. Zhang, B.; Zhou, M.; Zhu, B.; Kemmann, B.; Pfülb, L.; Burkart, S.; Liu, H.; Butterbach-Bahl, K.; Well, R. Threshold-like effect of soil NO3 concentrations on denitrification product N2O/(N2O + N2) ratio is mediated by soil pH. Soil Biol. Biochem. 2023, 187, 109213. [Google Scholar] [CrossRef]
  52. Qiu, Y.; Zhang, Y.; Zhang, K.; Xu, X.; Zhao, Y.; Bai, T.; Zhao, Y.; Wang, H.; Sheng, X.; Bloszies, S.; et al. Intermediate soil acidification induces highest nitrous oxide emissions. Nat. Commun. 2024, 15, 2695. [Google Scholar] [CrossRef]
  53. Rochette, P.; Angers, D.A.; Chantigny, M.H.; Gagnon, B.; Bertrand, N. N2O fluxes in soils of contrasting textures fertilized with liquid and solid dairy cattle manures. Can. J. Soil Sci. 2008, 88, 175–187. [Google Scholar] [CrossRef]
  54. Oertel, C.; Matschullat, J.; Zurba, K.; Zimmermann, F.; Erasmi, S. Greenhouse gas emissions from soils—A review. Chem. Erde Geochem. 2016, 76, 327–352. [Google Scholar] [CrossRef]
  55. Wang, C.; Amon, B.; Schulz, K.; Mehdi, B. Factors that influence nitrous oxide emissions from agricultural soils as well as their representation in simulation models: A review. Agronomy 2021, 11, 770. [Google Scholar] [CrossRef]
  56. Sun, J.; Zhan, J.; Chen, Z. Agricultural insurance and selection of soil testing and formula fertilization technology—An empirical study based on the main rice-producing areas in China. Sustainability 2024, 16, 9222. [Google Scholar] [CrossRef]
  57. Liu, Y.; Hao, X.; Meng, X.; Wu, W.; Zhao, S. Realizing the efficiency of the 4R fertilization principle by using controlled release and stable nitrogen fertilizers in soybean production in Northeast China. J. Plant Nutr. Fertil. 2025, 31, 1892–1900. [Google Scholar]
  58. Akhtar, M.; Wu, L.; Chen, J.; Su, Y.; Zheng, Y.; Lu, Y.; Zheng, S.; Deng, A.; Song, Z.; Zheng, C.; et al. One-time double-layer placement of controlled-release urea enhances wheat yield, nitrogen use efficiency and mitigates N2O emissions. Front. Plant Sci. 2025, 16, 1634174. [Google Scholar] [CrossRef]
  59. Zhang, X.; Geng, X.; Liu, Y.; Zhu, J.; Jiang, Y.; Chen, Y.; Gao, P.; Wei, H.; Dai, Q. Two-time application of controlled-release fertilizer: Effects on wheat yield, nitrogen use efficiency, and N2O emissions in coastal saline-alkaline soils. J. Agric. Food Res. 2025, 24, 102493. [Google Scholar] [CrossRef]
  60. Ferland, D.; Wagner-Riddle, C.; Brown, S.E.; Bourgault, M.; Helgason, W.; Farrell, R.E.; Congreves, K.A. Improved nitrogen fertilizer management reduces nitrous oxide emissions in a northern Prairie cropland. Sci. Total Environ. 2024, 956, 177211. [Google Scholar] [CrossRef]
  61. Sun, Q.; Cheng, Y.; Yin, S.; Sun, X.; Song, X.; Song, X.; Shen, W.; Meng, B.; Wang, X.; Lv, X.; et al. Substitution of 25% of chemical fertilizer nitrogen with organic amendments nitrogen reduces N2O emissions from tea plantation soils in subtropical China. Front. Microbiol. 2025, 16, 1715814. [Google Scholar] [CrossRef]
  62. Han, Z.; Leng, Y.; Sun, Z.; Li, Z.; Xu, P.; Wu, S.; Liu, S.; Li, S.; Wang, J.; Zou, J. Substitution of organic and bio-organic fertilizers for mineral fertilizers to suppress nitrous oxide emissions from intensive vegetable fields. J. Environ. Manag. 2024, 349, 119390. [Google Scholar] [CrossRef]
  63. Xie, L.; Li, L.; Xie, J.; Wang, J.; Anwar, S.; Du, C.; Zhou, Y. Substituting inorganic fertilizers with organic amendment reduced nitrous oxide emissions by affecting nitrifiers’ microbial community. Land 2022, 11, 1702. [Google Scholar] [CrossRef]
  64. Mokhtar, A.; He, H.; Nabil, M.; Kouadri, S.; Salem, A.; Elbeltagi, A. Securing China’s rice harvest: Unveiling dominant factors in production using multi-source data and hybrid machine learning models. Sci. Rep. 2024, 14, 14699. [Google Scholar] [CrossRef]
  65. Luo, B.; Liu, L.; Yung, D.H.Y.; Yuan, T.; Zhang, J.; Ng, L.T.H.; Tai, A.P.K. Effects of enhancing nitrogen use efficiency in cropland and livestock systems on agricultural ammonia emissions and particulate matter air quality in China. Atmos. Chem. Phys. 2025, 25, 10089–10108. [Google Scholar] [CrossRef]
  66. Chen, S.; Liu, S.; Zheng, X.; Yin, M.; Chu, G.; Xu, C.; Yan, J.; Chen, L.; Wang, D.; Zhang, X. Effect of various crop rotations on rice yield and nitrogen use efficiency in paddy-upland systems in southeastern China. Crop J. 2018, 6, 576–588. [Google Scholar] [CrossRef]
  67. Al-Musawi, Z.K.; Vona, V.; Kulmány, I.M. Utilizing different crop rotation systems for agricultural and environmental sustainability: A review. Agronomy 2025, 15, 1966. [Google Scholar] [CrossRef]
  68. Zhang, Z.; Yu, D.; Wang, X.; Pan, Y.; Zhang, G.; Shi, X. Influence of the selection of interpolation method on revealing soil organic carbon variability in the red soil region, China. Sustainability 2018, 10, 2290. [Google Scholar] [CrossRef]
  69. Hergoualc’h, K.; Mueller, N.; Bernoux, M.; Kasimir, Ä.; van der Weerden, T.J.; Ogle, S.M. Improved accuracy and reduced uncertainty in greenhouse gas inventories by refining the IPCC emission factor for direct N2O emissions from nitrogen inputs to managed soils. Glob. Change Biol. 2021, 27, 6536–6550. [Google Scholar] [CrossRef] [PubMed]
  70. Meng, C.; Xing, Y.; Ding, Y.; Zhang, Q.; Di, H.; Tang, C.; Xu, J.; Li, Y. Soil acidification induced variation of nitrifiers and denitrifies modulates N2O emissions in paddy fields. Sci. Total Environ. 2023, 882, 163623. [Google Scholar] [CrossRef] [PubMed]
  71. Xia, Y.; Fu, C.; Liao, A.; Wu, H.; Wu, H.; Zhang, H. Effects of extreme weather events on nitrous oxide emissions from rice-wheat rotation croplands. Plants 2024, 13, 25. [Google Scholar] [CrossRef] [PubMed]
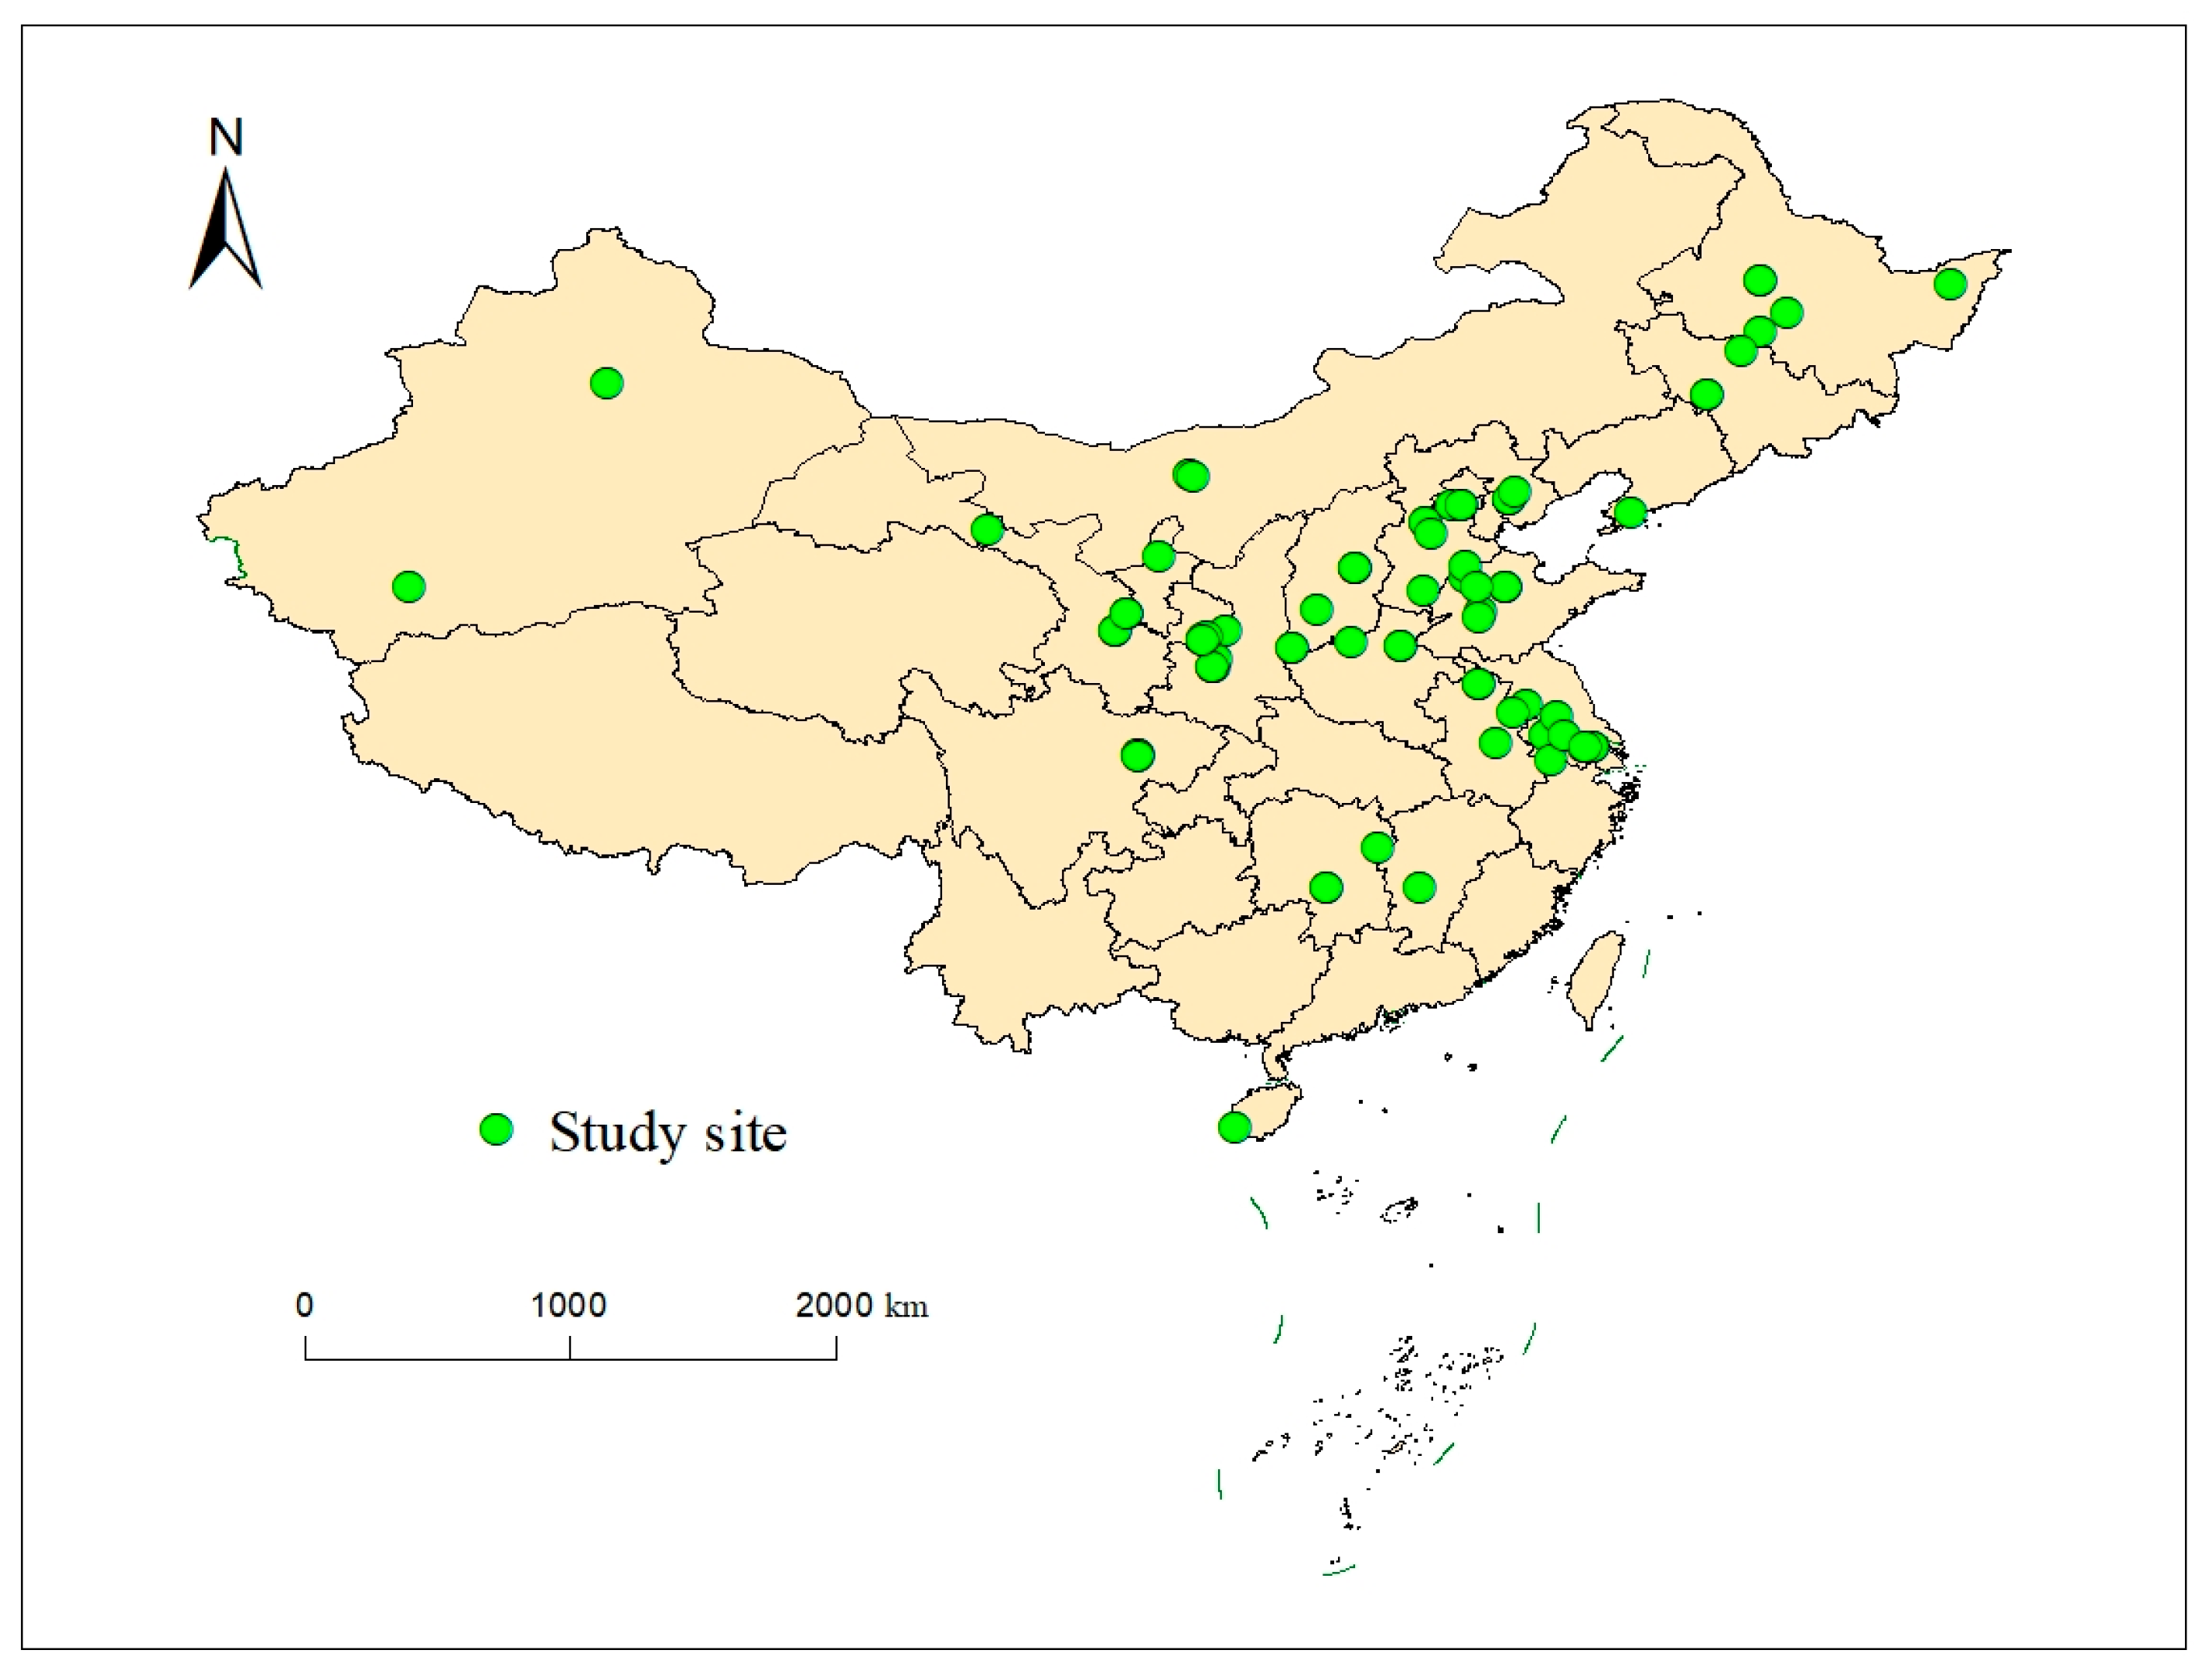
Figure 1. Overview map of the study area.
Atmosphere 17 00422 g001
Figure 2. Annual N2O emissions and direct emission factors of the unfertilized and fertilized croplands. n refers to the sample size. The horizontal solid line inside the box represents the median, and the dashed line denotes the mean. The upper and lower boundaries of the box correspond to the 75th percentile (Q3) and 25th percentile (Q1), respectively. The whiskers extend to the minimum value within the range of Q1-1.5 × IQR and the maximum value within the range of Q3 + 1.5 × IQR.
Atmosphere 17 00422 g002
Figure 3. Subgroup analysis of influencing factors on N2O emissions from farmland soils. The red circle, horizontal line, and dashed line in the figure represent the mean value, 95% confidence interval, and the IPCC default EF of 1%, respectively; n denotes the number of samples.
Atmosphere 17 00422 g003
Figure 4. Meta-regression analysis of the effects of N application rate, mean annual temperature and soil pH on N2O emission factors.
Atmosphere 17 00422 g004
Figure 5. Subgroup analysis of influencing factors on N2O emissions from farmland soils (EF > 0). The red circle, horizontal line, and dashed line in the figure represent the mean value, 95% confidence interval, and the IPCC default EF of 1%, respectively; n denotes the number of samples.
Atmosphere 17 00422 g005
Figure 6. Spatial distribution of N2O emission factors across different climatic zones in China.
Atmosphere 17 00422 g006
Table 1. Classification Table of Influencing Factors for N2O Emissions.
Categorical VariablesSub-Groups
Mean annual temperature (°C)≤10, 10–15, >15
Soil pH≤6.5, 6.5–7.5, >7.5
Soil textureclay, loam, sand
Land use typeupland, paddy field
N fertilization rates (kg N/hm2)≤150, 150–225, >225
climatic zonesubtropical zone, middle temperate zone, warm temperate zone
fertilizer typechemical fertilizer, organic fertilizer,
organic-inorganic compound fertilizer
Disclaimer/Publisher’s Note: The statements, opinions and data contained in all publications are solely those of the individual author(s) and contributor(s) and not of MDPI and/or the editor(s). MDPI and/or the editor(s) disclaim responsibility for any injury to people or property resulting from any ideas, methods, instructions or products referred to in the content.