


Abstract
Soil CO2 emissions are critical for predicting terrestrial ecosystem feedbacks to climate change, yet significant knowledge gaps persist regarding carbon flux dynamics within the deep vadose zone and during freeze–thaw processes. In this study, the Mu Us Sandy Land, a representative seasonally frozen and semi-arid region in Northwestern China, was selected as the research site. Based on in situ observation data and the XGBoost algorithm, the spatiotemporal variations of soil carbon flux and its environmental drivers were investigated. Results revealed distinct depth-dependent patterns, where carbon release reached its maximum flux in the 100–200 cm layer and carbon sequestration dominated the soil layers below 200 cm. Soil temperature and moisture were the primary controlling factors, but their impacts exhibited significant depth and seasonal heterogeneity. Notably, in the 20–50 cm soil layer, soil water content provided the highest explanatory power, reaching 55.3% and 47.8% in winter and summer, respectively. Furthermore, carbon fluxes exhibited distinct response thresholds to environmental factors, and their spatiotemporal variations were fundamentally regulated by an atmosphere-driven coupled water–vapor–heat–carbon process. These findings elucidate the complex relationship between soil carbon fluxes and the environment at different depths, providing theoretical support for deepening the understanding of regional carbon cycling.
1. Introduction
The spatial and temporal variability of arid lands profoundly influences the interannual variability of global carbon and water cycles. The rate of warming in drylands exceeds the global average, and the large interannual variations in the atmospheric CO2 growth rate are predominantly driven by the variability in carbon sequestration by terrestrial ecosystems [1,2]. Carbon balance in arid and semi-arid ecosystems is closely linked to precipitation and temperature variations. Soil drying reduces CO2 emissions by inhibiting soil organic carbon (SOC) decomposition and soil inorganic carbon (SIC) dissolution [3]. Atmospheric CO2, the most significant greenhouse gas, has experienced a sustained increase in recent decades. This increase is primarily attributed to human activities, such as the combustion of fossil fuels [4]. The process by which soil emits CO2 into the atmosphere is known as soil respiration (SR). It represents the second largest terrestrial source of CO2 and constitutes a fundamental process within ecosystems [5,6]. Although the increase in SR is relatively small, it exerts a significant impact on atmospheric CO2 concentrations, thereby influencing regional and even global climate patterns [7].
There is widespread concern among researchers that rising global temperatures will destabilize the dynamic equilibrium of soil carbon, thereby enhancing the soil–atmosphere CO2 flux [8,9]. Soil carbon is highly sensitive to temperature changes and exhibits significant positive feedback to climate change, resulting in increased soil CO2 emissions. Rising atmospheric CO2 levels have driven an increase in global carbon uptake by terrestrial ecosystems, a phenomenon known as the CO2 fertilization effect. Higher CO2 concentrations enhance photosynthetic efficiency and resource use efficiency (i.e., water and light), while warming and elevated atmospheric CO2 concentrations increase vegetation-derived soil organic carbon [10,11]. However, SR is influenced by numerous controlling factors, such as soil temperature (ST), soil water content (SWC), and porosity [12,13], as well as land use type, microbial activity, photosynthesis, and vegetation growth conditions [14,15,16]. Sun et al. [6] investigated the relationship between soil carbon flux and temperature/moisture content within 1 m depth under diurnal patterns, revealing an exponential relationship between temperature and SR, with carbon release being the predominant process. Li et al. [17] highlighted the importance of estimating the diurnal patterns of SR, noting the differential temperature responses and humidity effects observed in diurnal respiration. Although numerous studies have focused on soil carbon turnover within the top soil layer and measured factors influencing carbon emissions, research on carbon sequestration and release from the atmosphere to groundwater in typical deep vadose zone of arid regions remains scarce.
Regarding the controlling factors of SR, numerous hypotheses exist ranging from upper-bound climate conditions to soil factors. Climate variables may cause varying degrees of change in carbon and water fluxes within terrestrial ecosystems [18]. Climate variables such as vapor pressure deficit (VPD), air temperature (Ta), precipitation, and radiation interact to influence water and carbon exchange in ecosystems [19,20,21]. Zhang et al. [22] experimentally demonstrated the diurnal lag phenomenon in SR with respect to ST and CO2 concentration. Near-surface soil carbon fluxes are strongly influenced by soil moisture content, exhibiting significant variations with increases in near-surface moisture content, particularly during summer [23]. Soil pH, soil organic carbon (SOC), soil nitrogen content, and microbial activity influence soil CO2 emissions affected by soil texture [24,25]. In contrast, while the factors influencing carbon emissions vary across different ecosystems, the primary controlling factors remain ST and SWC. Concurrently, vegetation increases soil CO2 emissions under high temperatures, which stems from enhanced root activity boosting CO2 production rates [26,27]. Under freeze–thaw disturbance in arid regions, the coupling relationship between deep soil moisture content and temperature shifts from nonlinear to linear. This layered pattern is inseparable from the movement of the freeze front [28]. Due to climatic influences, freeze–thaw cycles and snowfall are crucial for soil carbon emissions [13,28,29]. Soil freezing processes weaken organic matter decomposition and CO2 transport, and the phase changes between liquid water and ice play a crucial role in regulating permafrost temperature [30,31]. In drylands with deep vadose zones, the transport patterns of soil carbon fluxes at various depths during freeze–thaw processes, as well as their regulatory mechanisms, remain poorly characterized [32].
To address the above-mentioned concerns, a deep soil layer of the vadose zone in the Mu Us Sandy Land, a typical seasonally frozen and semi-arid region in Northwestern China, was selected as the research object, and the soil carbon flux at various depths of the soil profile were investigated. The primary research objectives of this study were: (i) to investigate the seasonal variation characteristics of soil carbon flux at different depths; (ii) to examine the relationship between soil carbon flux and soil hydrothermal properties; and (iii) to explore the potential regulatory mechanisms of environmental factors on soil carbon flux during the freeze–thaw process.
2. Materials and Methods
2.1. Overview of the Study Area
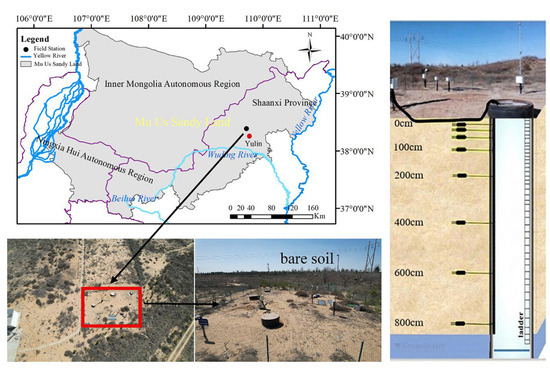
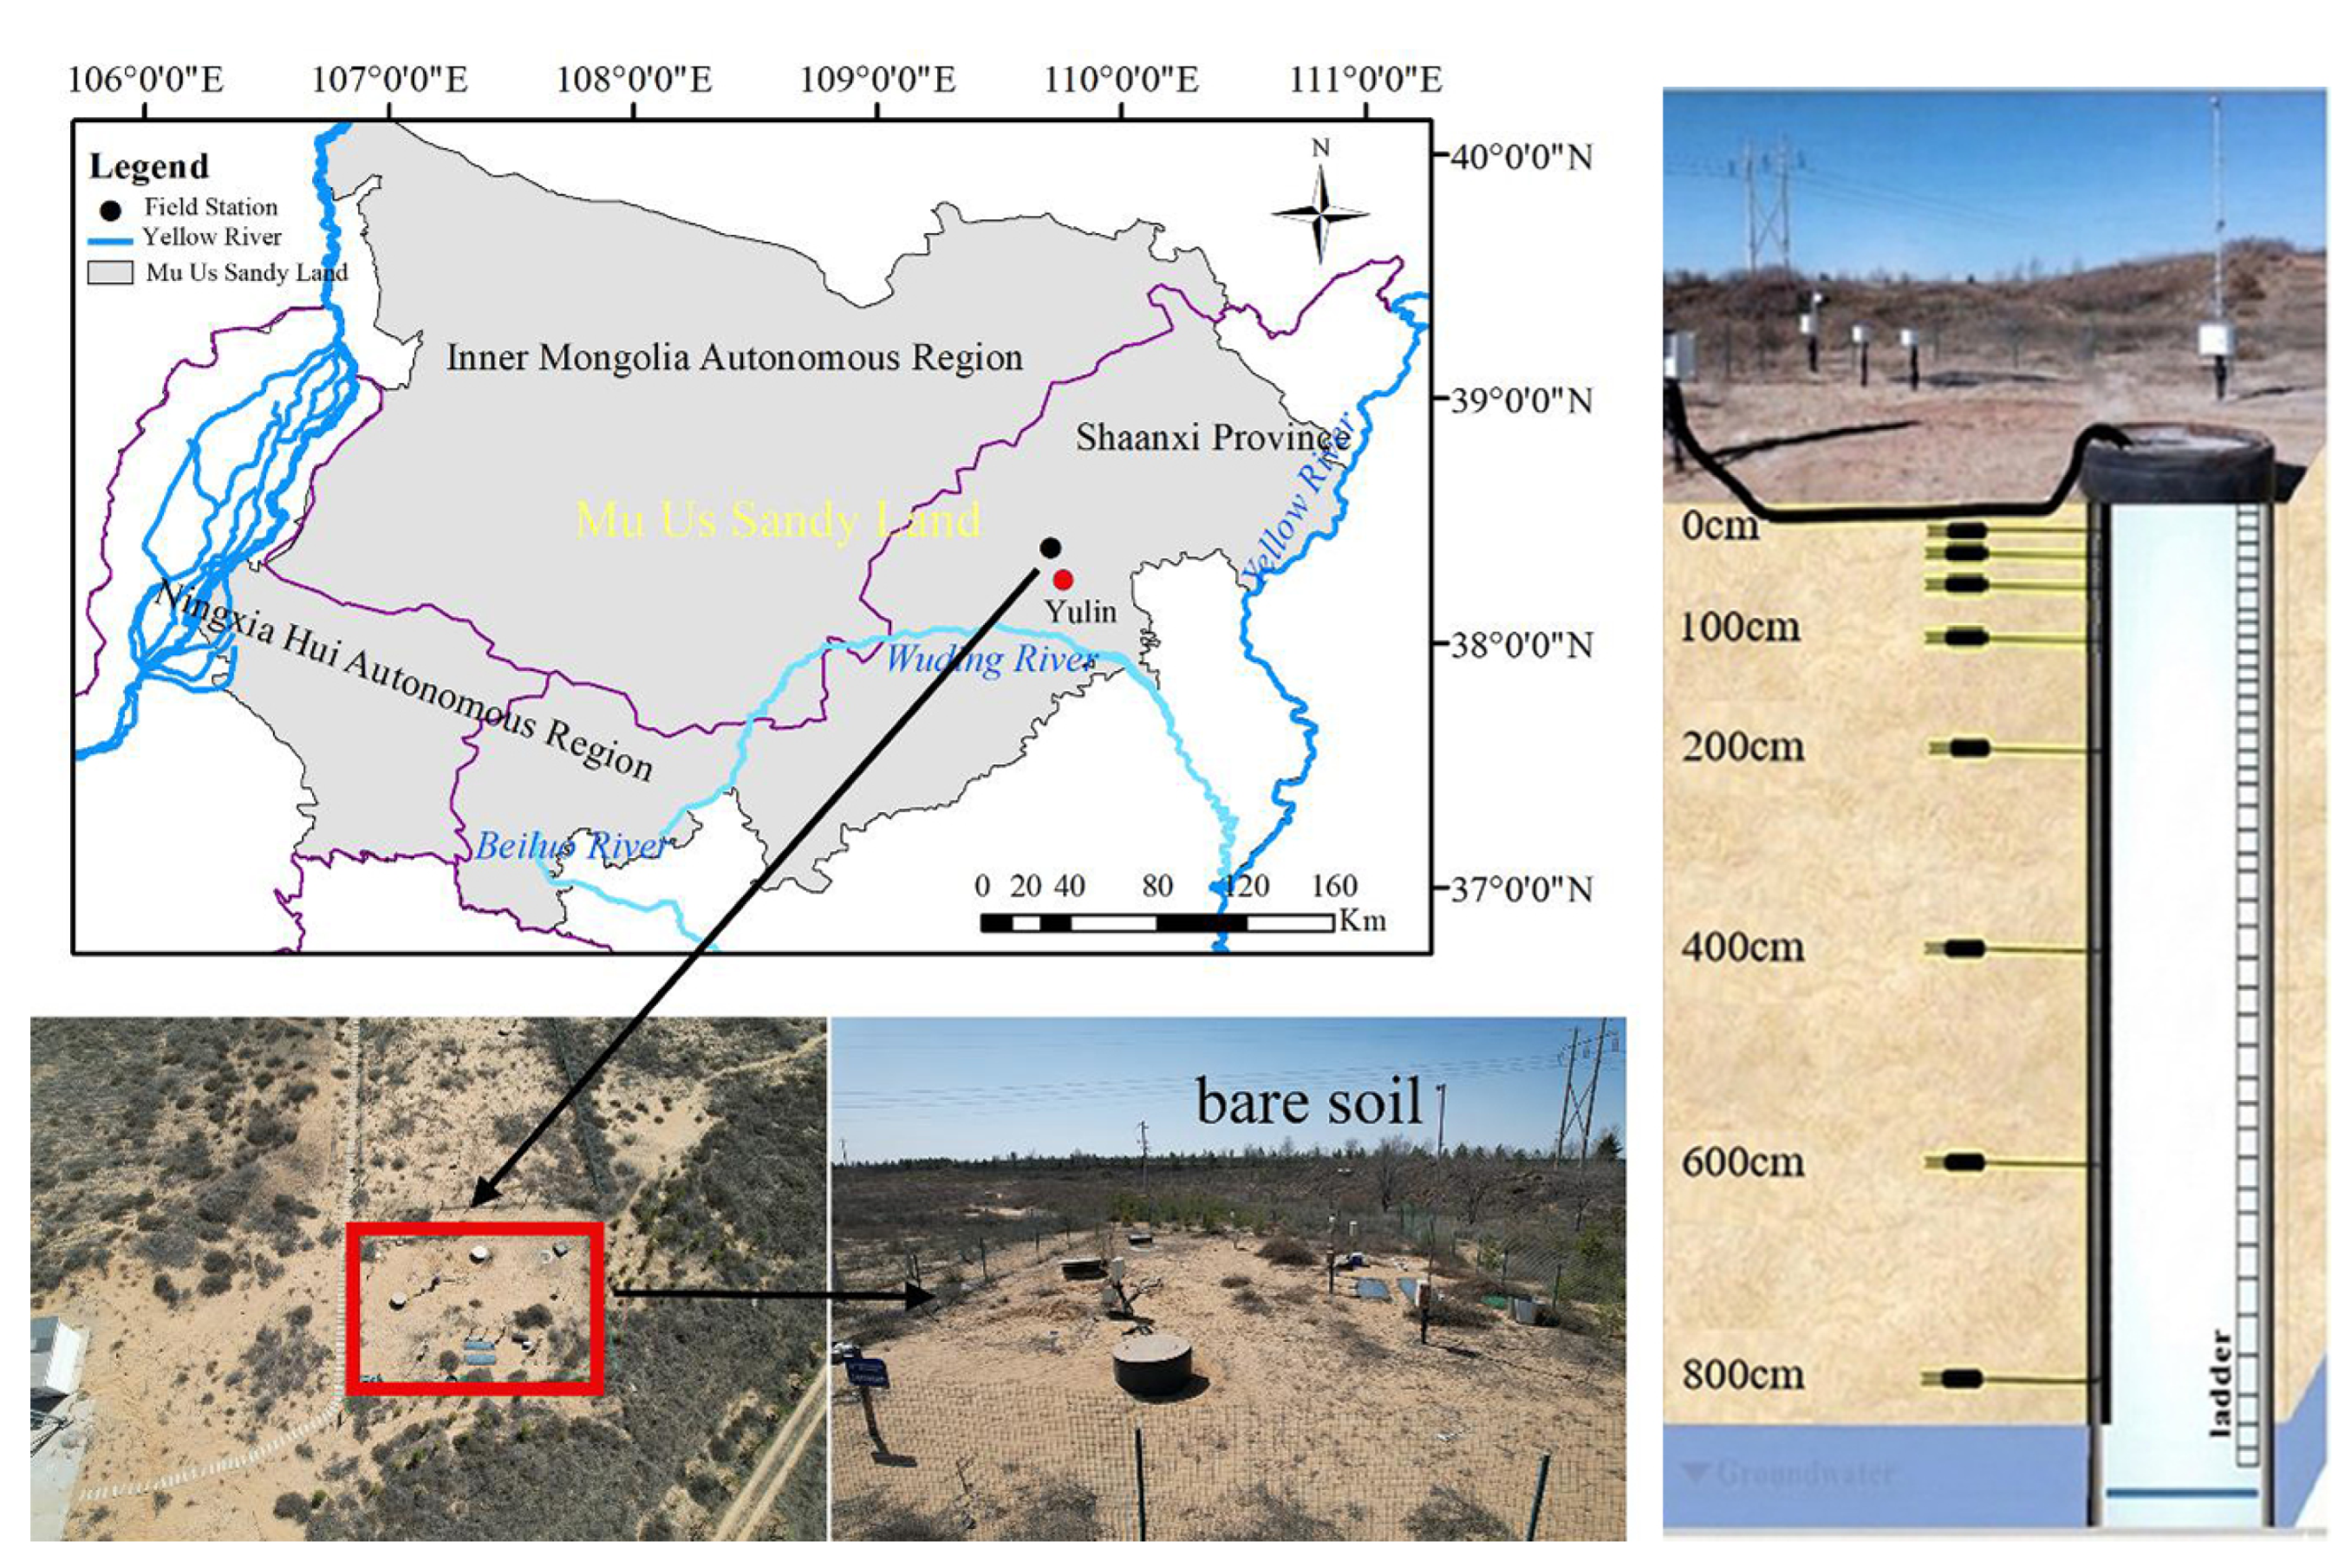
The in situ experimental site for this study was selected in the wind-blown sand dunes of Yulin region within the Mu Us Sandy Land (groundwater depth: 9 m). Located at the Yulin Desert Ecology Station of the National Forestry and Grassland Administration in Yulin City, Shaanxi Province (109°41′44″ N, 38°21′45″ E), this area represents a typical semi-arid zone with seasonally freezing conditions. Based on multi-year meteorological records, the study area has a long-term average temperature of 9.1 °C and an average annual precipitation of 420 mm. The geographical location, surrounding environment, and specific layout of the in situ monitoring station are shown in Figure 1. Precipitation distribution is uneven throughout the year, with the majority occurring between June and September. Potential evapotranspiration reaches approximately 2300 mm [13,28,29].
Figure 1.
Location of the study area and schematic of the experimental setup.
At the study site, Hydra Probe II sensors (Stevens Water Monitoring Systems, Portland, OR, USA) were installed at depths of 10 cm, 20 cm, 50 cm, 100 cm, 200 cm, 400 cm, and 800 cm below the soil surface to conduct automated monitoring of SWC and ST. To measure CO2 concentrations in the soil, the GMP252 sensors (Vaisala, Vantaa, Finland), based on non-dispersive infrared technology, were also placed in the soil at depths of 0, 20, 50, 100, 200, 400, and 800 cm. The CO2 sensors were placed in radiation shields to accurately monitor the carbon concentrations in near-surface air. These sensors operate at temperatures ranging from −40 to 60 °C and can measure CO2 concentrations from 0 to 10,000 ppm. All monitoring data were collected using a CR1000 data logger (Campbell Scientific Inc., Logan, UT, USA) with a monitoring interval of 1 min, recording the average data point every 10 min. Simultaneously, meteorological variables including rainfall, Ta, relative humidity (RH), and wind speed (WS) were also monitored. Rainfall was monitored using the ECRN-100 (Decagon Devices, Pullman, WA, USA), while Ta and RH were measured by the VP-3 (Decagon Devices, Pullman, WA, USA). WS was recorded by the Davis Cup Anemometer (Davis Instruments, Hayward, CA, USA). In this study, the observation data of the entire year of 2024 were collected for analysis.
2.2. Soil Carbon Flux Calculation
To quantitatively characterize CO2 migration processes and flux characteristics at different depths within soil profiles, this study employed a soil carbon transport model for carbon flux calculations. Based on the gas diffusion law and incorporating soil pore characteristics with CO2 diffusion properties, this model accurately reflects the vertical diffusion patterns of CO2 in the soil gas phase. It stands as one of the classic models for analyzing carbon migration processes in the vadose zone, and can be calculated as follows:
where SR is the CO2 flux at a specific soil depth (μmol·m−2·s−1) [6,22], z is the vertical distance (m), with downward as the positive direction, and represents the CO2 diffusion rate in the soil gas phase (m2·s−1):
where is the CO2 diffusion coefficient at 20 °C, is the empirical coefficient [33], is the soil temperature (°C), is the air-filled porosity, and can be calculated using the following model:
where is the soil porosity (cm3/cm3) and θ is the soil water content (cm3/cm3) [34].
2.3. Statistical Analysis Methods
2.3.1. XGBoost Algorithm
XGBoost excels at handling nonlinear relationships and high-dimensional data. Compared to other machine learning algorithms, it offers advantages such as fast training speed, high model accuracy, support for parallel computing, and built-in mechanisms to prevent overfitting. It also performs exceptionally well when dealing with missing values and imbalanced datasets [35]. The calculation formula is as follows:
where is the predicted value for the kth sample (i.e., CO2 flux, expressed in μmol·m−2·s−1), is the vector composed of the driving factors for the kth sample, is the pth regression decision tree, and F is the space of all possible decision trees.
The model training process is achieved by minimizing the objective function:
where L is the objective function value of the entire model, is the loss function measuring the deviation between the predicted value and the target value, is the target value for the kth sample (μmol·m−2·s−1), and is the regularization term, used to control model complexity and prevent overfitting.
2.3.2. SHAP Method
As a core interpretive framework, the SHAP model holds broad application prospects in analyzing the decision-making mechanisms of machine learning algorithms. It accurately measures the specific impact of each feature variable on prediction outcomes by calculating its average marginal contribution [36]. The SHAP value Φj corresponding to the jth driver can be computed using the following formula:
where N denotes the set of all driving factors, S represents a feature subset excluding the jth driving factor, |S| indicates the number of features in set S, measures the impact of set S on the model prediction outcomes, and quantifies the contribution of set to the model predictions after incorporating the jth driving factor.
3. Results
3.1. Variations of Environmental Variables
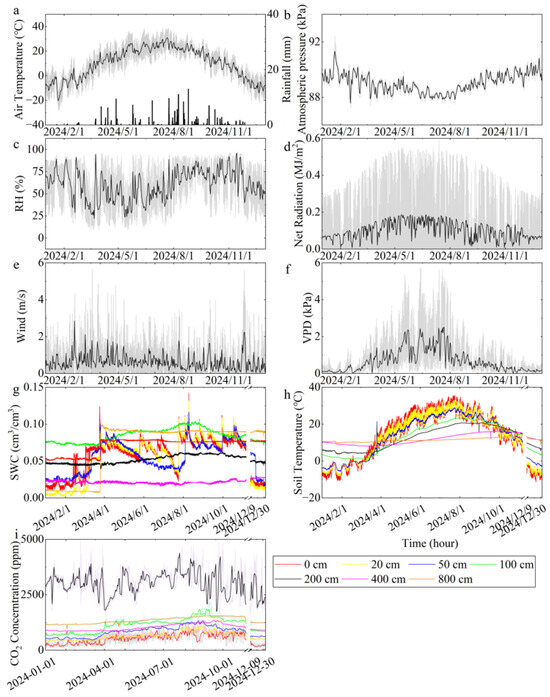
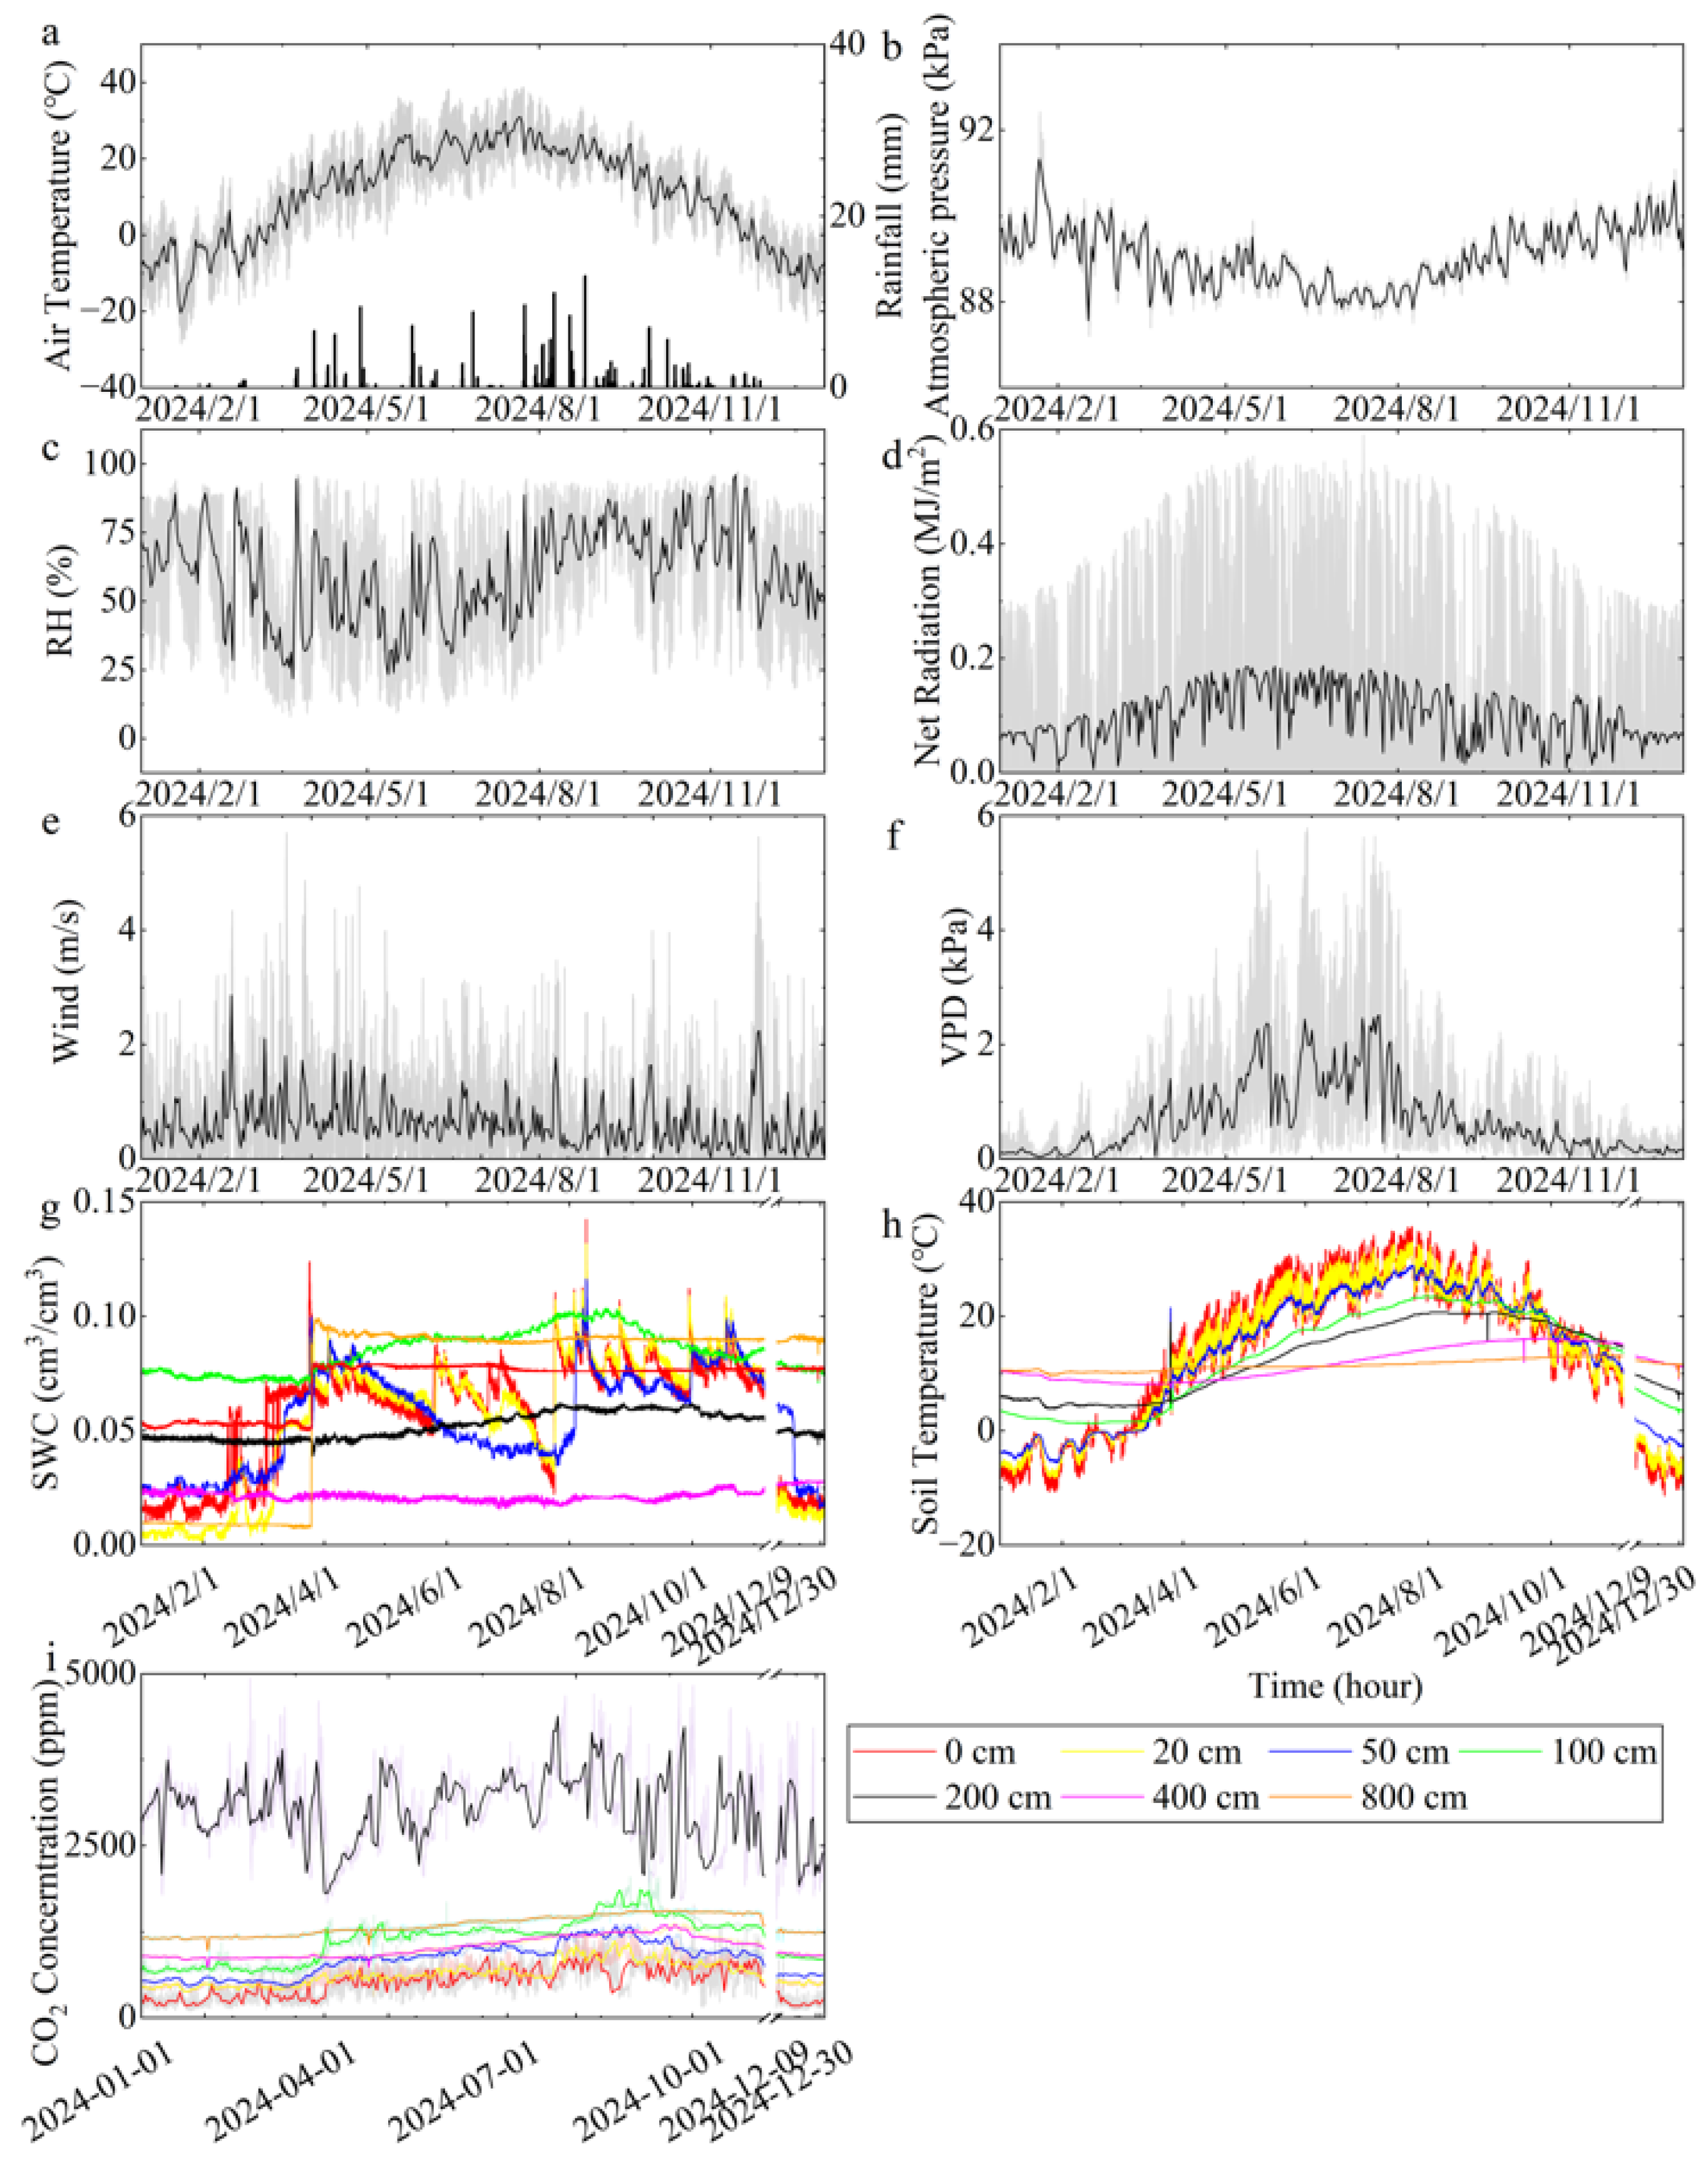
Based on hourly observation data during the analyzed period, the variations of environmental factors, including rainfall, net radiation, Ta, RH, WS, VPD, SWC, ST, and CO2 concentration, are shown in Figure 2. It can be seen that higher temperatures primarily occur during summer, with maximum values approaching 40 °C, while negative temperatures mainly appear from late November to early April of the following year. Rainfall occurs primarily from April to October, with August experiencing more frequent precipitation (Figure 2b). Atmospheric RH is higher during summer and autumn, with daily RH peaking at 86% (Figure 2c). Net radiation follows the same trend as Ta (Figure 2d). Hourly WS values exhibit significant fluctuations, with daily average WS generally below 2 m/s (Figure 2e). VPD trends broadly align with temperature patterns, with maximum hourly VPD values approaching 6 kPa and daily average VPD values ranging between 0–3 kPa (Figure 2f). SWC exhibited pronounced spatial variability. The highest water content across the entire profile occurred at 100 cm. Below 100 cm, freeze–thaw cycles caused a significant decline in volumetric water content. Shallow depths at 10, 20, and 50 cm showed pronounced fluctuations driven by rainfall and evaporation. Specifically, SWC at 10 cm and 20 cm reached peak values of 0.14 cm3/cm3 influenced by rainfall, and the SWC reached the minimum value throughout the profile during winter when soil was frozen (Figure 2g). At 800 cm, near the groundwater table, SWC is significantly higher than in intermediate layers, remaining largely stable at 0.08. ST exhibits a spatial warming trend from shallow to deep layers during winter. The freezing period in this region spans December to March. Within the top 50 cm, ST remains below 0 °C throughout the freezing period. Outside the freezing period, temperatures generally decrease with depth from the surface. Surface temperatures can reach up to 35 °C, while temperatures below 100 cm remain relatively stable with smaller fluctuations (Figure 2h). CO2 concentrations exhibit spatially consistent trends with SWC. Within the top 200 cm, concentrations increase gradually with depth, reaching a peak at 200 cm (mean 3020.37 ppm). Specifically, within the top 100 cm, seasonal carbon concentrations rise from April to October alongside increasing rainfall, while winter concentrations remain the lowest throughout the entire period. Furthermore, to capture the baseline atmospheric conditions and respond to the gradient exchange of carbon, the CO2 concentration in the near-surface air was continuously monitored. As shown in Figure 2i, the near-surface air CO2 concentration fluctuated with seasonal changes but remained significantly lower than the soil CO2 levels. The average carbon concentrations for the near-surface air (0 cm) and the soil layers at 20 cm, 50 cm, and 100 cm were 513.79 ppm, 643.18 ppm, 848.15 ppm, and 1138.16 ppm, respectively. Carbon concentrations at depths of 200–800 cm showed an initial increase trend followed by a decrease. The minimum value within this range occurred at 400 cm, with an average value of 1027.11 ppm (Figure 2i).
Figure 2.
Daily variation characteristics of environmental factors. (a) Air temperature (°C) and rainfall (mm); (b) Atmospheric pressure (kPa); (c) Relative humidity (RH, %); (d) Net radiation (MJ/m2); (e) Wind speed (m/s); (f) Vapor pressure deficit (VPD, kPa); (g) Soil water content (SWC, cm3/cm3) at depths ranging from 0 to 800 cm; (h) Soil temperature (°C) at depths from 0 to 800 cm; (i) Soil CO2 concentration (ppm) at depths from 0 to 800 cm.
3.2. Seasonal Characteristics of Soil Carbon Flux
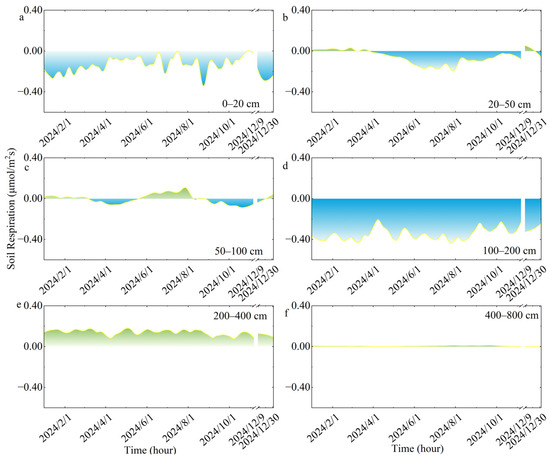
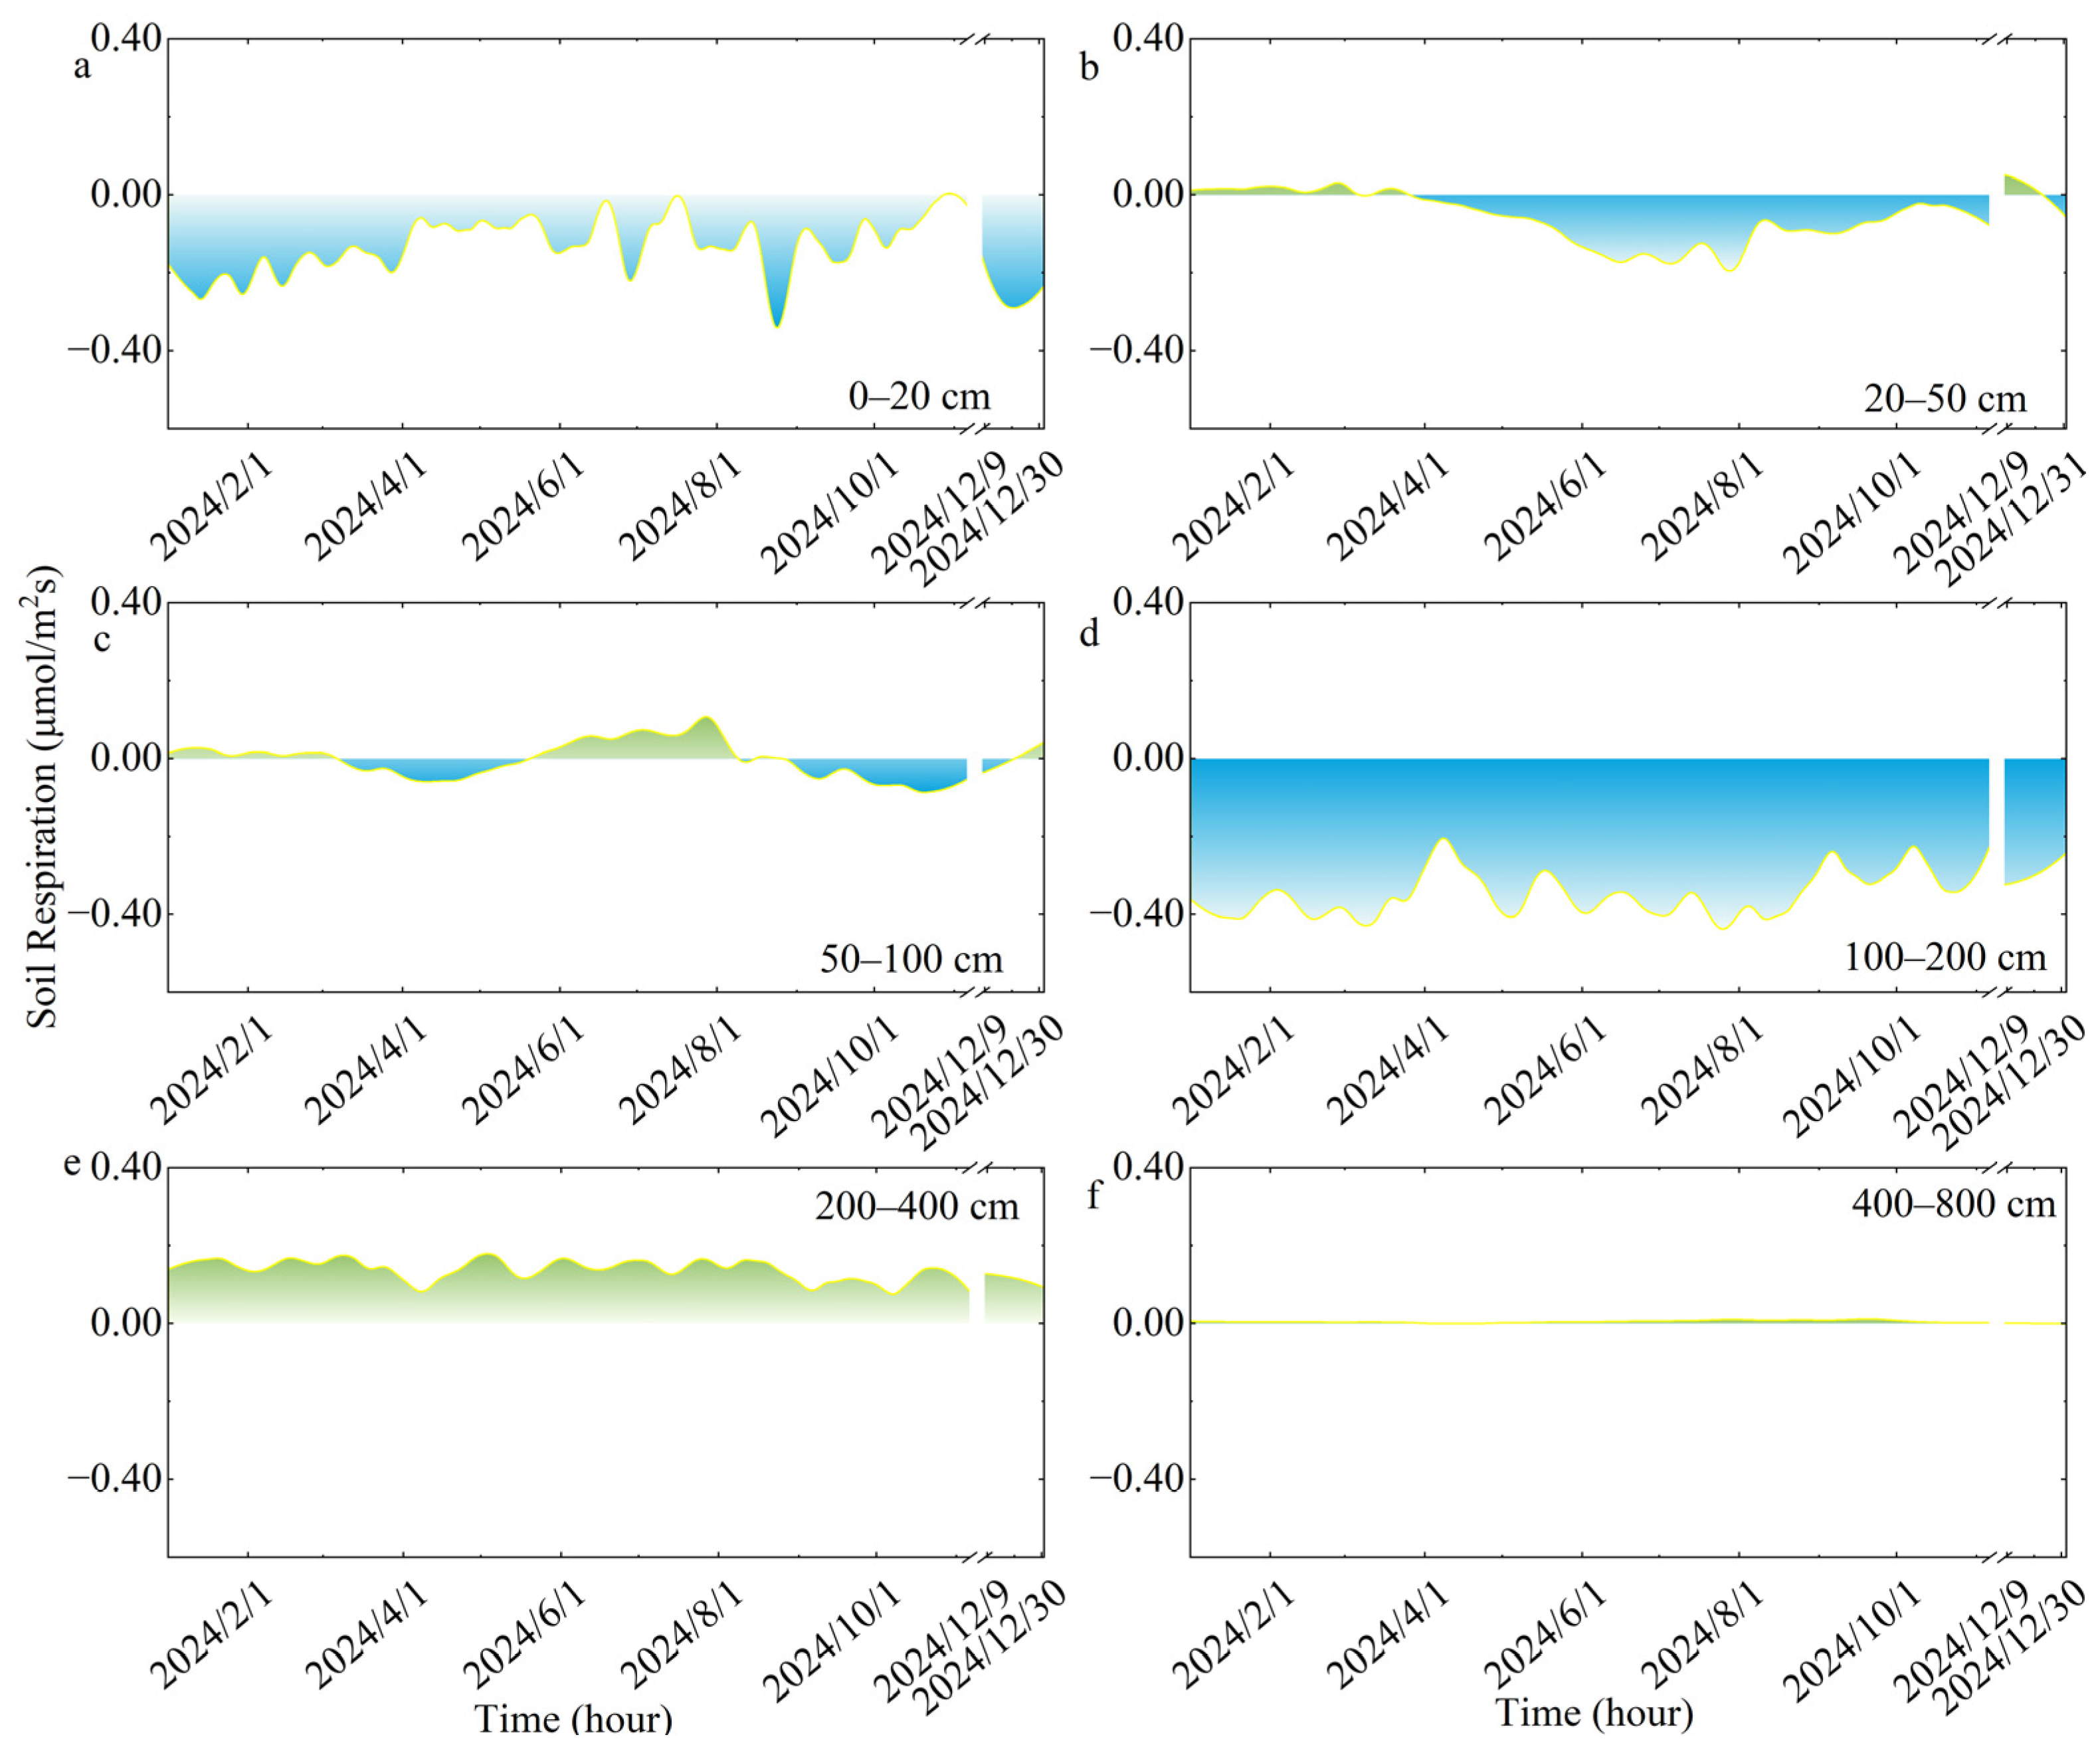
As shown in Figure 3, soil carbon fluxes in the study site exhibited significant variations at different depths, with CO2 flux gradually decreasing with depth within the top 100 cm soil layer. The 0–20 cm near-surface layer exhibited overall carbon release (migrating from 20 cm toward the surface). Average CO2 flux values from spring to winter were 0.19, 0.11, 0.15, and 0.20 μmol·m−2·s−1, respectively. The average value was significantly higher in winter than in summer, with the peak annual carbon flux occurring on August 24 (0.34 μmol·m−2·s−1). The CO2 flux at 20–50 cm depth showed a downward migration trend in winter, migrating toward the surface in spring, summer, and autumn. The average CO2 flux values from spring to winter were 0.02, 0.08, 0.09, and 0.02 μmol·m−2·s−1, respectively, with higher average values in summer and autumn than in winter and spring. The upward migration of CO2 flux at the 50–100 cm depth primarily occurred in winter and summer, while in spring and autumn, it migrated from 50 to 100 cm depth. The CO2 flux values were 0.019, 0.04, 0.05, and 0.02 μmol·m−2·s−1 for each season, respectively, with values in summer and autumn significantly higher than that in winter and spring.
Figure 3.
Dynamic characteristics of CO2 flux at different depths. (a) 0–20 cm; (b) 20–50 cm; (c) 50–100 cm; (d) 100–200 cm; (e) 200–400 cm; (f) 400–800 cm.
Compared to the layer within 100 cm, the magnitude of carbon flux in the 100–800 cm soil layer gradually decreased with increasing depth. Within the 100–200 cm zone, the flux primarily migrated from 100 cm to 200 cm. Given that the CO2 flux values from spring to winter were 0.39, 0.32, 0.33, and 0.38 μmol·m−2·s−1 respectively, CO2 flux remained at its maximum throughout the profile. Unlike the overall carbon release above 200 cm, the deeper layers exhibited a distinct state of carbon sequestration. This depth corresponds to a divergent plane, indicating CO2 flux below 200 cm primarily migrating toward the deep layer. Within the 200–400 cm soil layer, the CO2 flux values were 0.16, 0.14, 0.13, and 0.15 μmol·m−2·s−1 for each season, respectively. The CO2 flux between 400 and 800 cm was the lowest throughout the entire profile, with an average value less than 0.01 μmol·m−2·s−1.
3.3. Relationship Between Carbon Flux and Soil Hydrothermal Dynamics
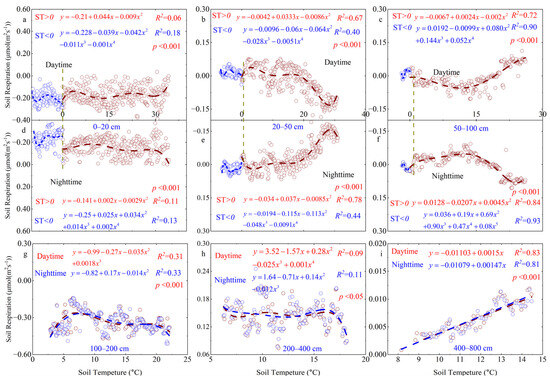
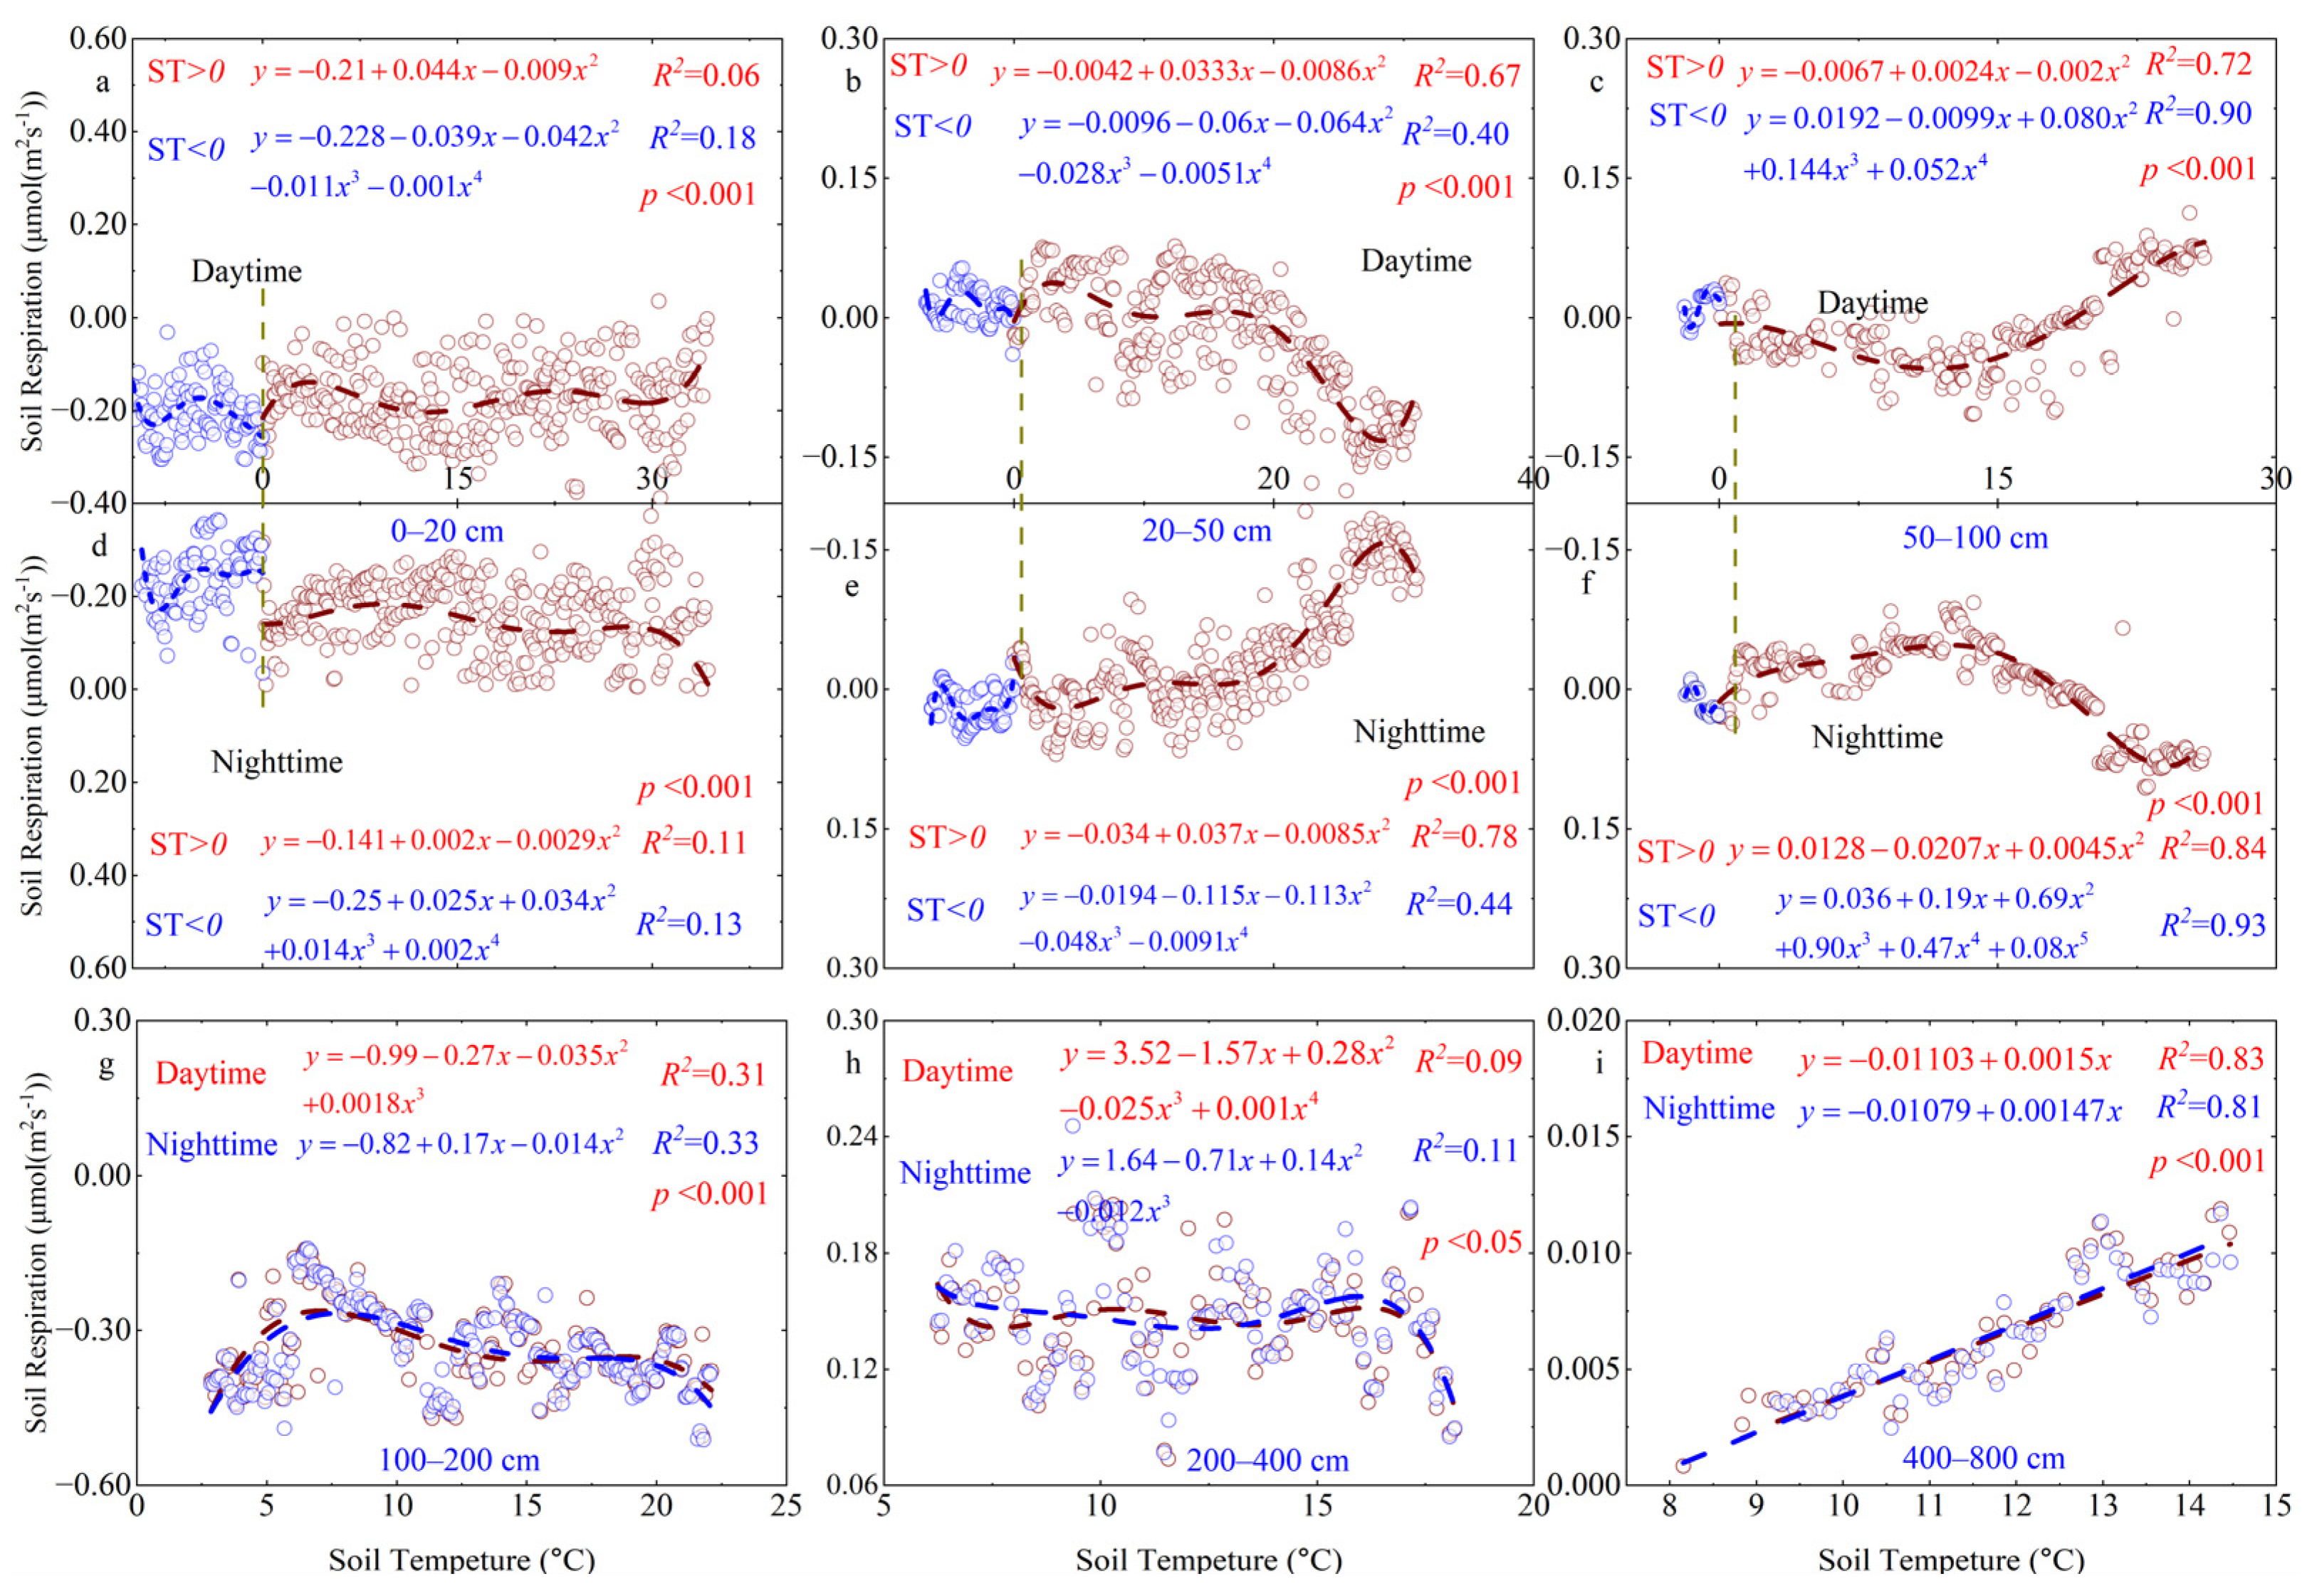
To investigate the diurnal variation of carbon flux influenced by ST, the relationship between diurnal carbon flux and ST at different depths were statistically analyzed (Figure 4). At the 0–20 cm soil layer, CO2 flux exhibited a positive correlation with ST, with lower ST resulting in higher CO2 flux. Beyond 30 °C, CO2 flux values approached zero. Additionally, the response of CO2 flux to diurnal ST fluctuations near the surface was weak. However, at the 20–100 cm layer, the relationship between CO2 flux and ST strengthened with depth, showing a significant increase in R2. For instance, the relationship (R2) between daytime ST (ST < 0) and CO2 flux in the 50–100 cm soil layer reached 0.90, and the value was 0.93 for the condition of nighttime ST (ST < 0). During the ST > 0 conditions, carbon flux progressively increased with rising ST, indicating greater release toward the surface. The maximum CO2 flux occurred at an ST of 28 °C, reaching 0.13 μmol·m−2·s−1. For the ST < 0 phase, the minimum CO2 flux values during both day and night were recorded at −6 °C and near 0 °C, respectively. Within this temperature range, CO2 flux initially increased with rising ST before decreasing. Compared to the 20–50 cm layer, the correlation between ST < 0 and CO2 flux (R2 exceeding 0.90) in the 50–100 cm layer was significantly stronger than that in the ST > 0 layer. For ST > 0, within the 0–12 °C range, CO2 flux increased as ST rose, with carbon release gradually shifting toward shallow layers. When ST exceeded 12 °C, upward carbon release gradually decreased while deep-seated carbon storage increased. Within the 100–400 cm range, the relationship between CO2 flux and ST was weaker (R2 ≤ 0.35). Specifically, CO2 flux values gradually decreased with increasing ST within the 200–400 cm soil layer, indicating reduced deep-seated carbon storage as ST rose. At depths of 400–800 cm, carbon sequestration gradually increased with rising ST. The relationship between ST and CO2 flux indicates that temperature exerts a certain control over CO2 flux, which may also be an indirect factor influencing CO2 flux variations at depths of 20–100 cm.
Figure 4.
Relationship between CO2 flux and soil temperature at different depths. (a) Daytime at 0–20 cm depth; (b) Daytime at 20–50 cm depth; (c) Daytime at 50–100 cm depth; (d) Nighttime at 0–20 cm depth; (e) Nighttime at 20–50 cm depth; (f) Nighttime at 50–100 cm depth; (g) Combined daytime and nighttime at 100–200 cm depth; (h) Combined daytime and nighttime at 200–400 cm depth; (i) Combined daytime and nighttime at 400–800 cm depth.
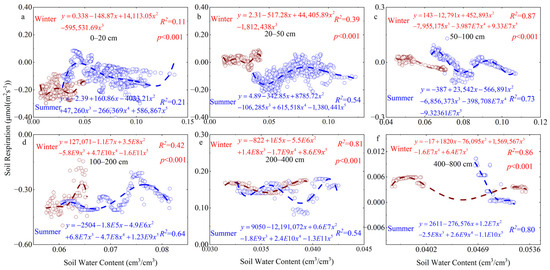
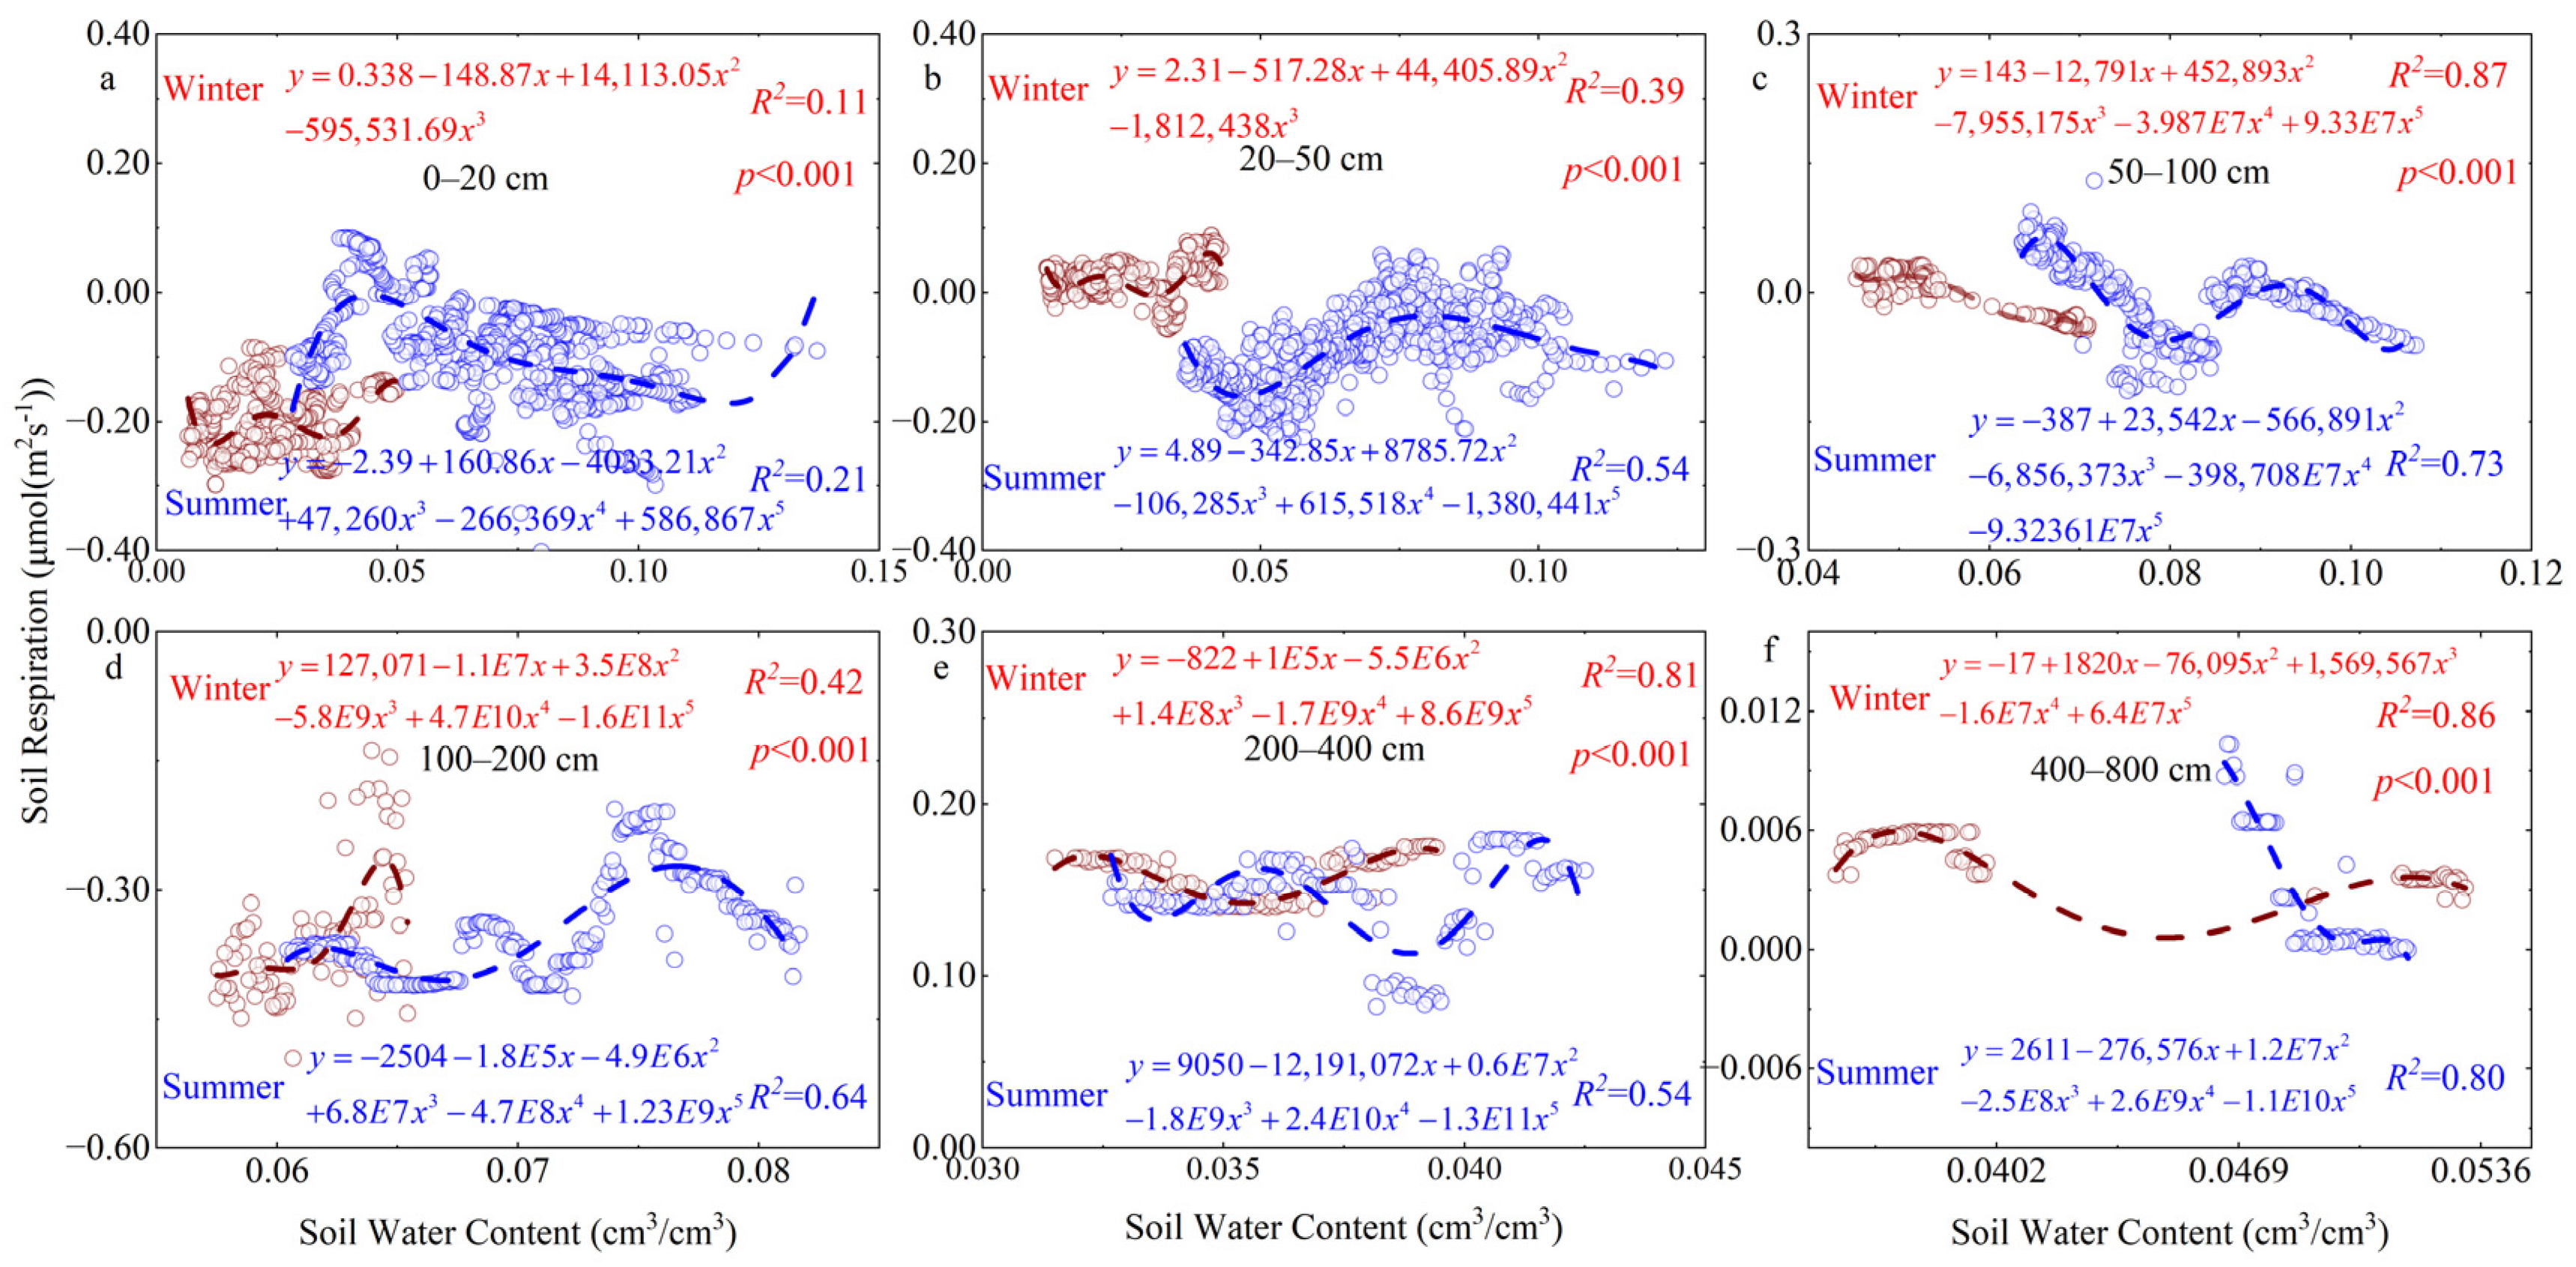
As shown in Figure 5, SWC generally exhibits a higher response to CO2 flux in deeper layers than in shallow layers. This response is higher in summer than in winter for shallow layers, while deeper layers show higher responses in winter than in summer. When the SWC at 0–20 cm depth in summer is greater than 0.05 cm3/cm3, the CO2 flux value gradually shifts from negative to positive and shows a tendency to be sequestered downward. This SWC value corresponds to the maximum CO2 flux release in the 20–50 cm layer. When SWC approaches 0.08 cm3/cm3, summer CO2 flux in this layer tends toward its minimum value. Furthermore, compared to summer, winter moisture content below 0.05 cm3/cm3 in the 20–50 cm layer shows a CO2 flux trend toward carbon sequestration. Compared to shallow layers, CO2 flux in the 50–100 cm layer gradually decreases with increasing SWC during winter, exhibiting carbon sequestration. Summer carbon flux peaks in this layer occurred at SWC values of 0.065 cm3/cm3 (maximum downward CO2 flux) and 0.08 cm3/cm3 (maximum upward CO2 flux). At the 100–200 cm depth, winter CO2 flux released to shallow layers decreased with increasing SWC. In summer, CO2 flux first decreased with increasing SWC (minimum at SWC 0.075 cm3/cm3) before increasing. Compared to the carbon release zone above 200 cm, the primary carbon sequestration zone lies below 200 cm. When the SWC reaches 0.038 cm3/cm3, summer CO2 flux in the 200–400 cm layer reaches its minimum. When the SWC reaches 0.047 cm3/cm3, the 400–800 cm layer shows maximum summer CO2 flux. Overall, SWC’s influence on soil carbon intensifies with depth. This relationship is stronger in summer than in winter for carbon release zones, and stronger in winter than in summer for carbon sequestration zones.
Figure 5.
Relationship between CO2 flux and soil water content at different depths. (a) 0–20 cm; (b) 20–50 cm; (c) 50–100 cm; (d) 100–200 cm; (e) 200–400 cm; and (f) 400–800 cm.
3.4. Influence of Environmental Factors on Carbon Flux
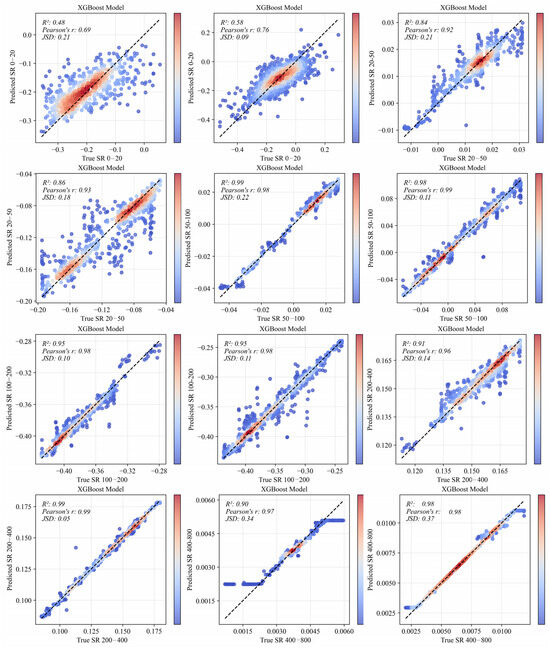
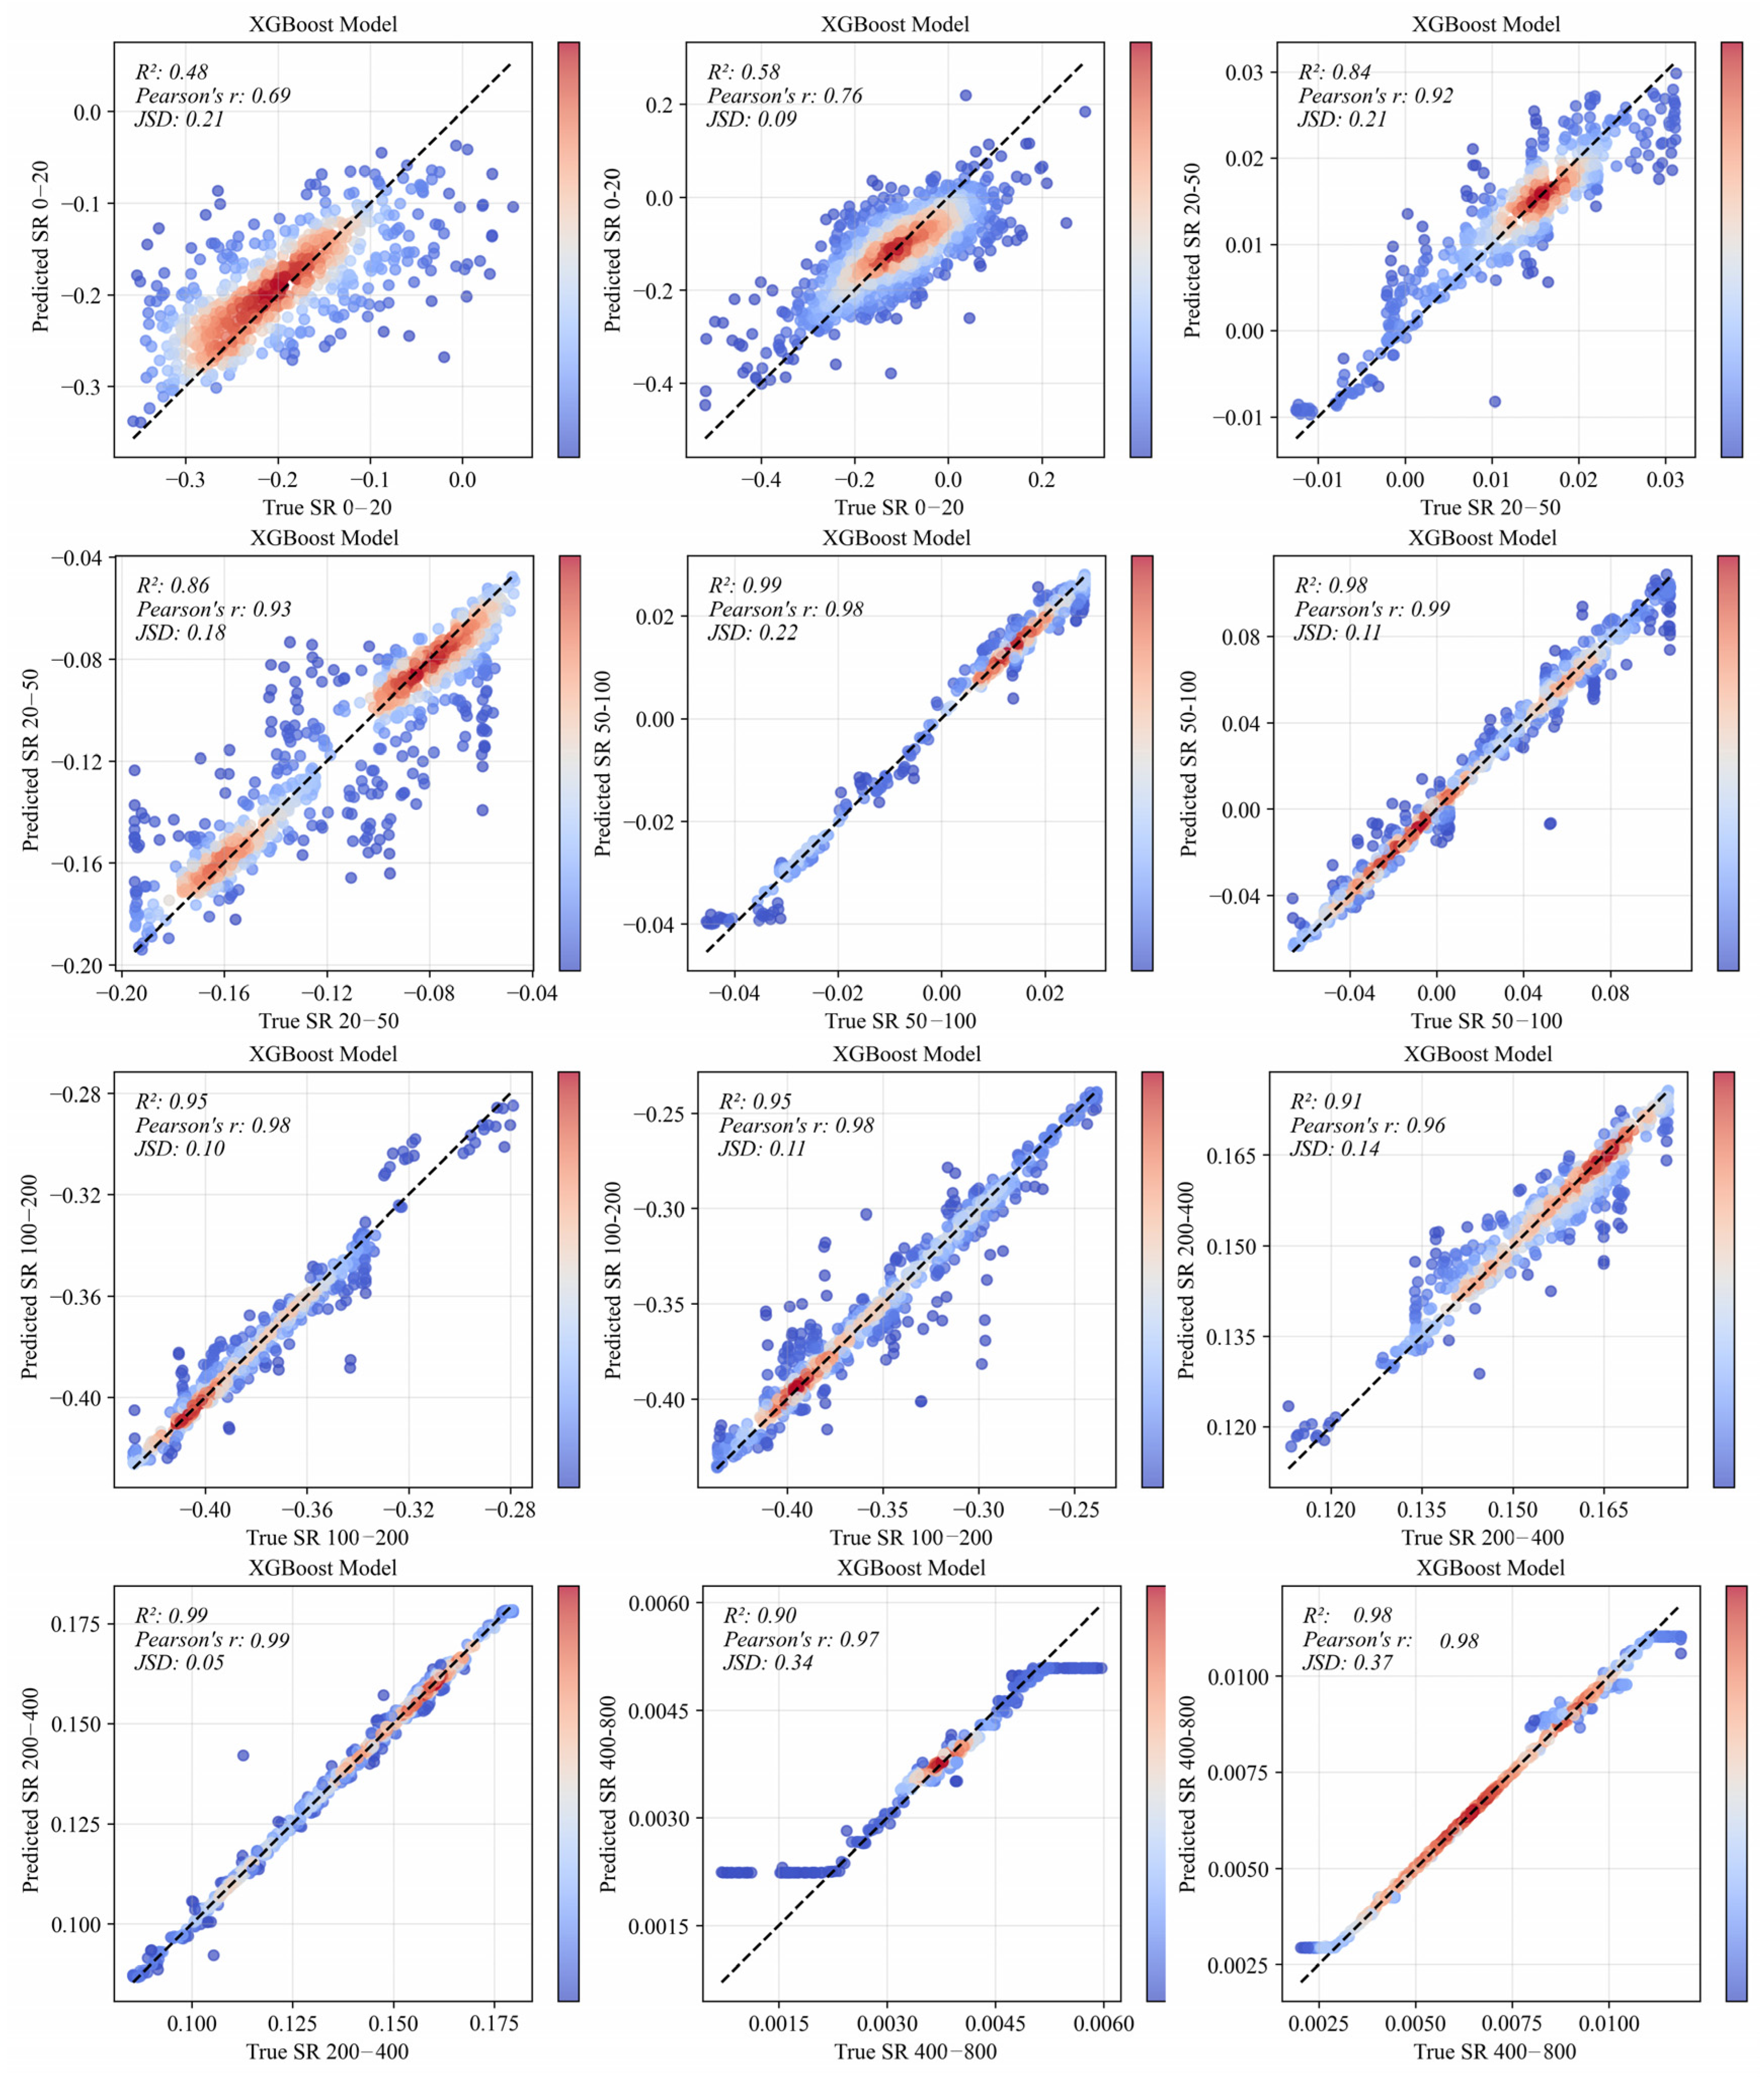
To identify the key drivers of spatiotemporal variations in carbon flux across soil profiles, a total of ten key factors were selected, and various XGBoost models were constructed for specific depths ranging from 0 to 800 cm (Figure 6). The models exhibited high predictive accuracy and successfully captured the complexity and diversity inherent in the feature set. The R2 for the carbon flux models exceeded 0.80 at most depths except for the 0–20 cm layer. This finding supports our hypothesis and demonstrates the strong adaptability of the models for this research area.
Figure 6.
XGBoost fitting plot of CO2 flux at different depths.
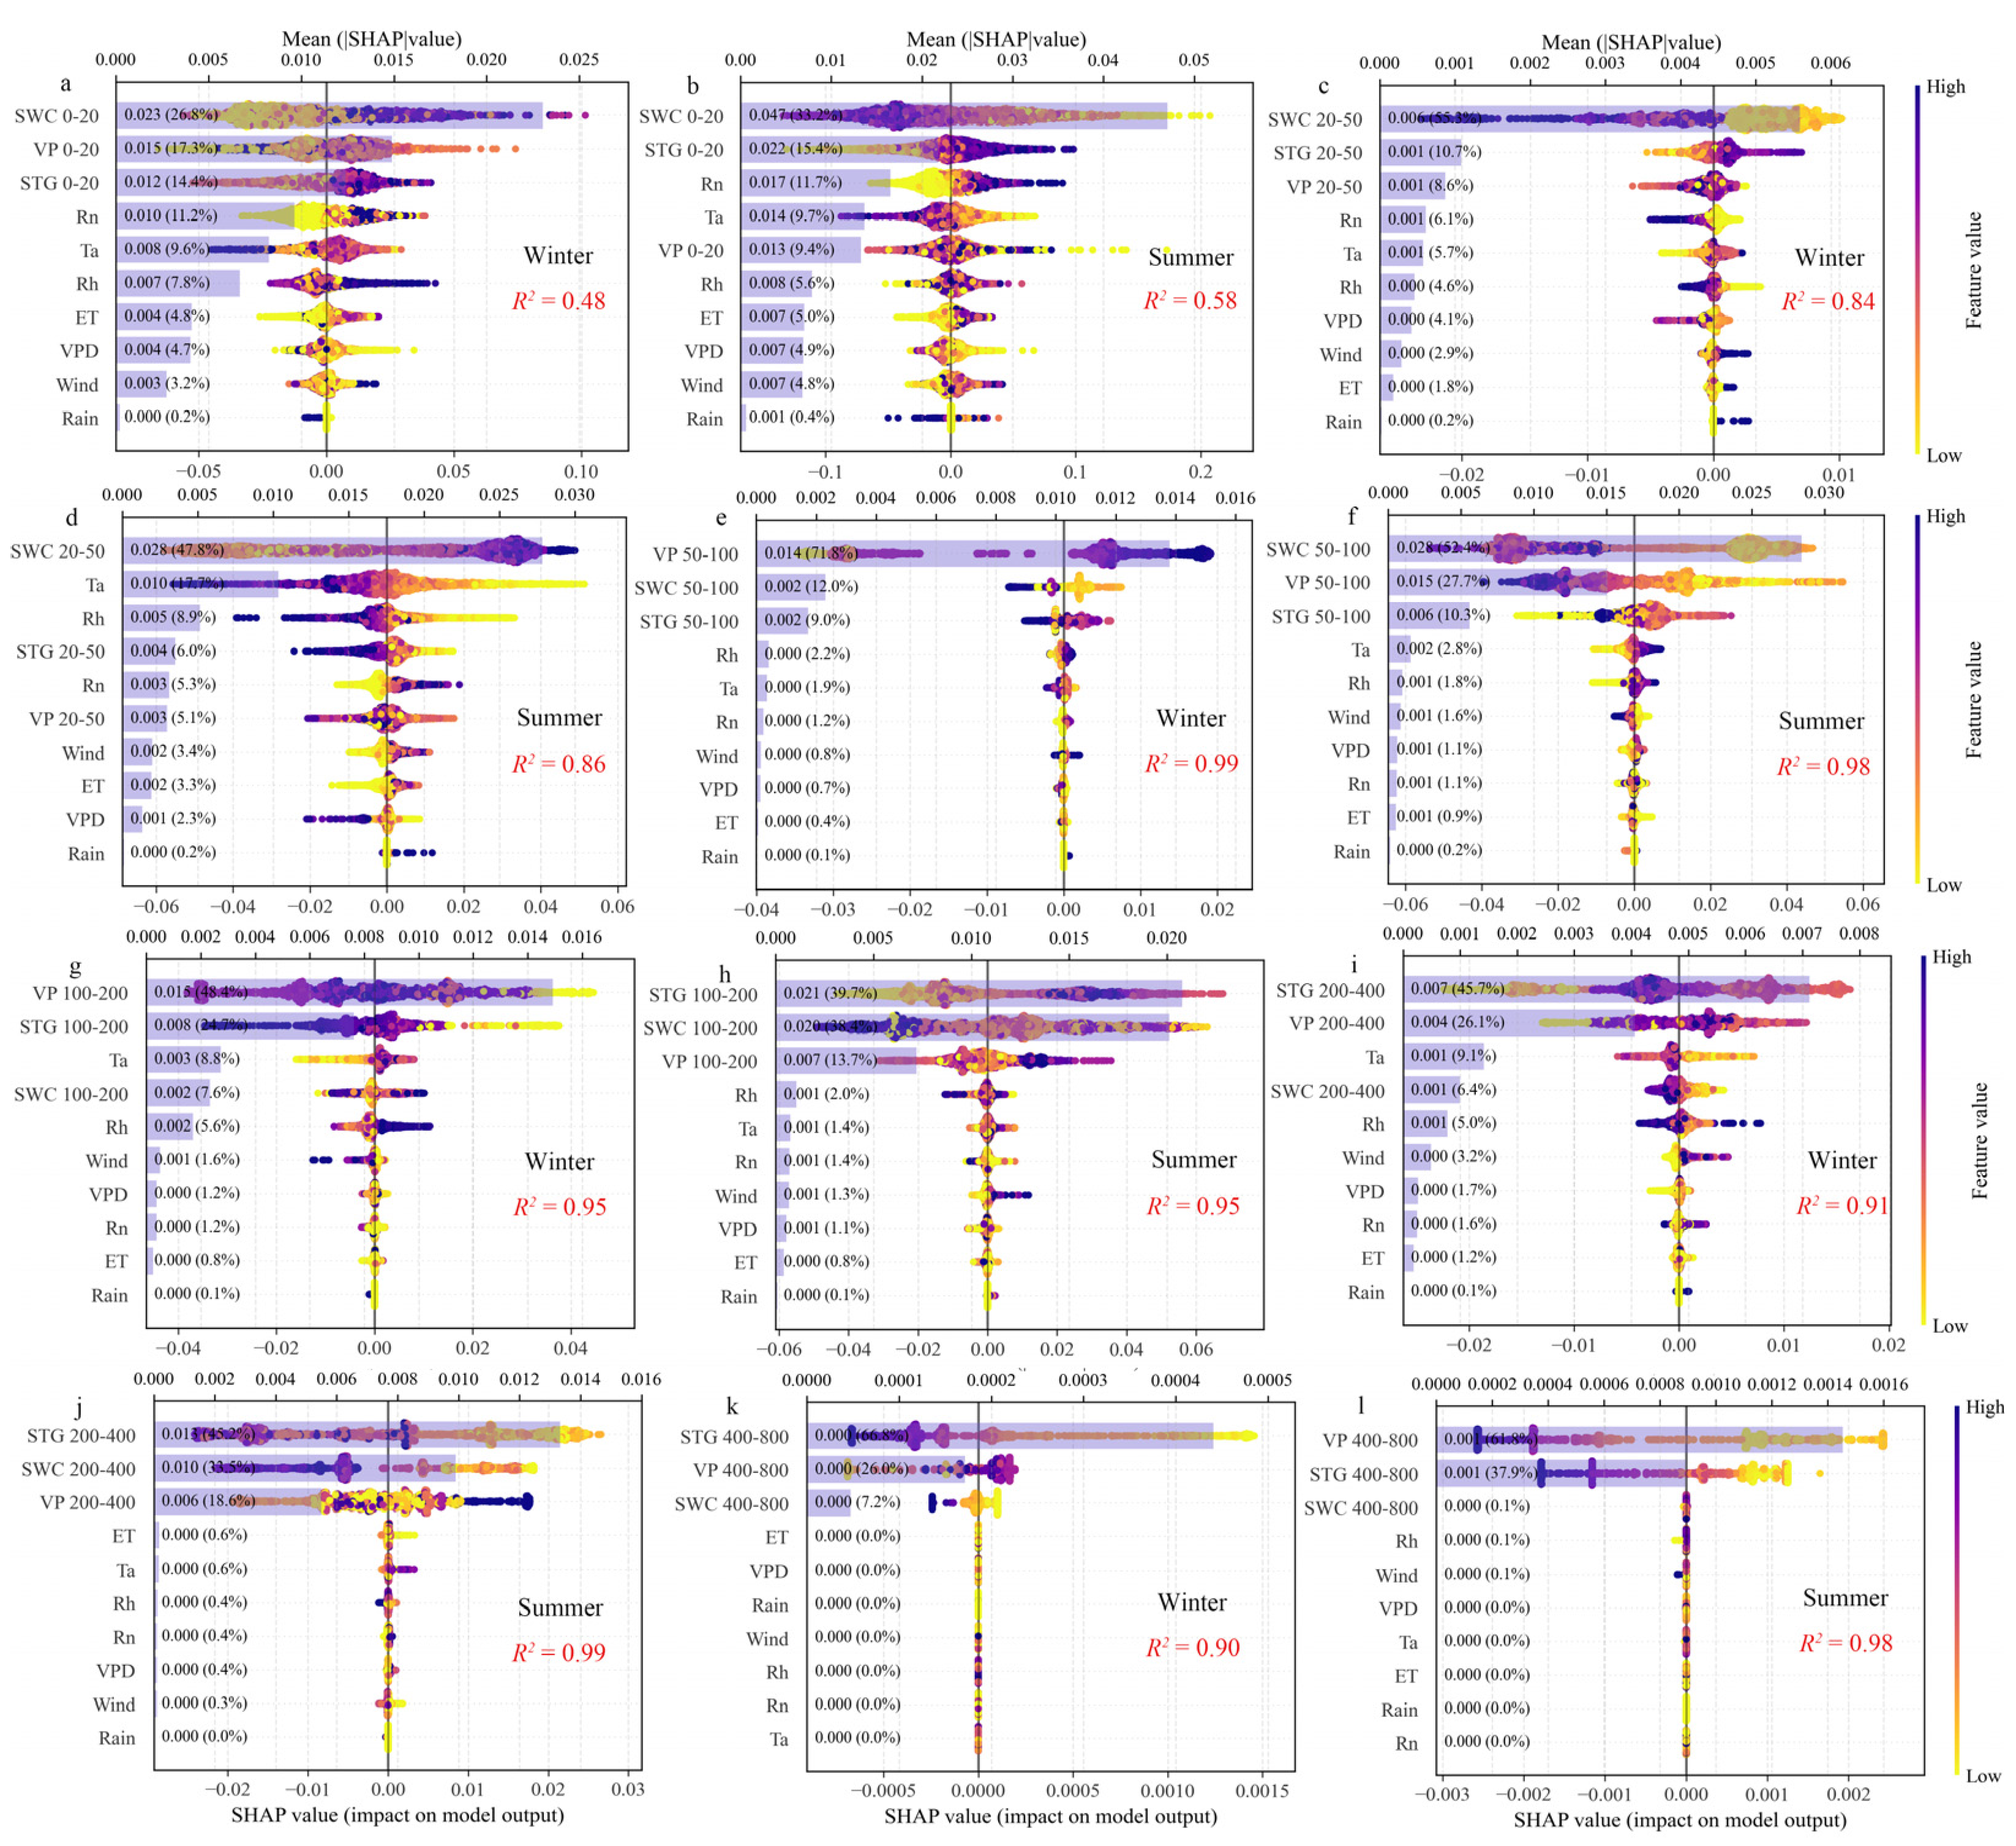
Using the SHAP method, the importance of environmental factors on carbon flux were quantitatively analyzed, as shown in Figure 7. For bare sandy land, results indicated that the SWC, VP, STG, Ta, and Rn were identified as the primary driving factors of CO2 flux. The order and magnitude of influence varied across different layers, with model explanatory power higher in summer than winter for all layers, which clearly elucidated the interrelationships between carbon fluxes and environmental factors across various layers of bare sandy land.
Figure 7.
SHAP contribution plot of CO2 flux at different depths. (a) 0–20 cm in winter; (b) 0–20 cm in summer; (c) 20–50 cm in winter; (d) 20–50 cm in summer; (e) 50–100 cm in winter; (f) 50–100 cm in summer; (g) 100–200 cm in winter; (h) 100–200 cm in summer; (i) 200–400 cm in winter; (j) 200–400 cm in summer; (k) 400–800 cm in winter; and (l) 400–800 cm in summer.
Specifically, within the shallow layer above the 50 cm depth, SWC exerts the highest influence on carbon flux, with its impact increasing with depth. SWC explains 26.8% and 33.2% of carbon flux variation in the 0–20 cm layer for winter and summer, respectively; whereas in the 20–50 cm layer, this explanatory power rises to 55.3% and 47.8%. Except for SWC, the shallow layer is primarily influenced by STG and VP in winter, with atmospheric environmental factors showing significantly reduced influence. Conversely, Rn influences 11.7% at 0–20 cm in summer, while Ta influences 17.7% and Rh influences 8.9% at 20–50 cm. Below the 50 cm depth, the influence of atmospheric environmental factors gradually decreases with depth, with SWC, STG, and VP progressively becoming dominant. During winter, the influence of VP at the 50–100 cm and 100–200 cm soil layers were 71.8% and 48.4%, respectively. This indicates that the impact of VP on carbon flux at this depth cannot be ignored. Conversely, it was most influenced by SWC (52.4%) and STG (39.7%) during summer. For the primary carbon sequestration zone (200–800 cm), atmospheric environmental factors exerted almost negligible influence. Throughout the analyzed period, STG and VP significantly influenced carbon transfer in this layer. STG influence exceeded 45% in both summer and winter for the 200–400 cm layer. The influence of VP on carbon flux was particularly pronounced in the 400–800 cm layer (26.0% in winter and 61.8% in summer), while SWC influence significantly decreased in this layer.
3.5. Response Thresholds of Carbon Flux to Environmental Factors
To further elucidate the nonlinear relationships identified by the XGBoost model, SHAP dependence plots were analyzed to determine the specific thresholds at which environmental factors alter carbon flux direction and magnitude. As shown in Table 1, SR is highly sensitive to changes in SWC, with these thresholds varying significantly across different depths and seasons. In the shallow soil layers (0–50 cm), carbon flux is generally promoted by specific moisture conditions, such as winter SWC > 0.035 cm3/cm3 and summer SWC < 0.070 cm3/cm3 at the surface level. In the intermediate layers (50–200 cm), SR exhibits complex nonlinear responses, often characterized by specific optimal ranges or dual thresholds in summer, such as when the summer SWC is less than 0.073 cm3/cm3 or greater than 0.100 cm3/cm3 at the 50–100 cm depth. Conversely, in the deeper profiles (200–800 cm), drier conditions generally favor CO2 flux, with critical thresholds consistently dropping below 0.037 cm3/cm3 regardless of the specific depth or season. Similarly, STG, VP, Rh, and Ta exhibit distinct phase thresholds that undergo strategic shifts with varying depths. For STG, the 0–50 cm layer typically requires positive or near-zero gradients to enhance CO2 fluxes. In contrast, the 200–800 cm profile demonstrates pronounced seasonal divergence; for instance, carbon flux in these deeper zones is favored by significantly higher winter gradients (>3.0 °C) and lower summer gradients (<−1.0 °C). VP thresholds are highly stratified, with winter thresholds generally remaining positive within the upper 100 cm, whereas summer thresholds frequently shift into negative ranges deeper in the profile. Furthermore, the model identified specific constraints for other meteorological factors at certain depths. For example, a summer Rh < 54% at 20–50 cm, along with extreme Ta conditions (<−8.0 °C or >20.0 °C) within the primary carbon sequestration zone (200–400 cm), can further facilitate carbon flux generation.
Table 1.
Response thresholds of key environmental factors on CO2 flux across different soil depths and seasons.
4. Discussion
4.1. Driving Mechanisms of Environmental Factors on Carbon Flux
Existing machine learning models excel at identifying complex linear and nonlinear relationships between variables. By quantifying the marginal contribution of factors to the outcome variable through SHAP values, they reveal these relationships. However, such correlations do not equate to causality, making it challenging to unravel indirect interactions among variables. For example, SHAP emphasizes SWC and STG as primary controllers of SR, yet it cannot explain their direct or indirect regulatory roles in SR. Thus, structural equation modeling (SEM) serves as an effective complement to machine learning, building upon SHAP analysis to further clarify causal pathways.
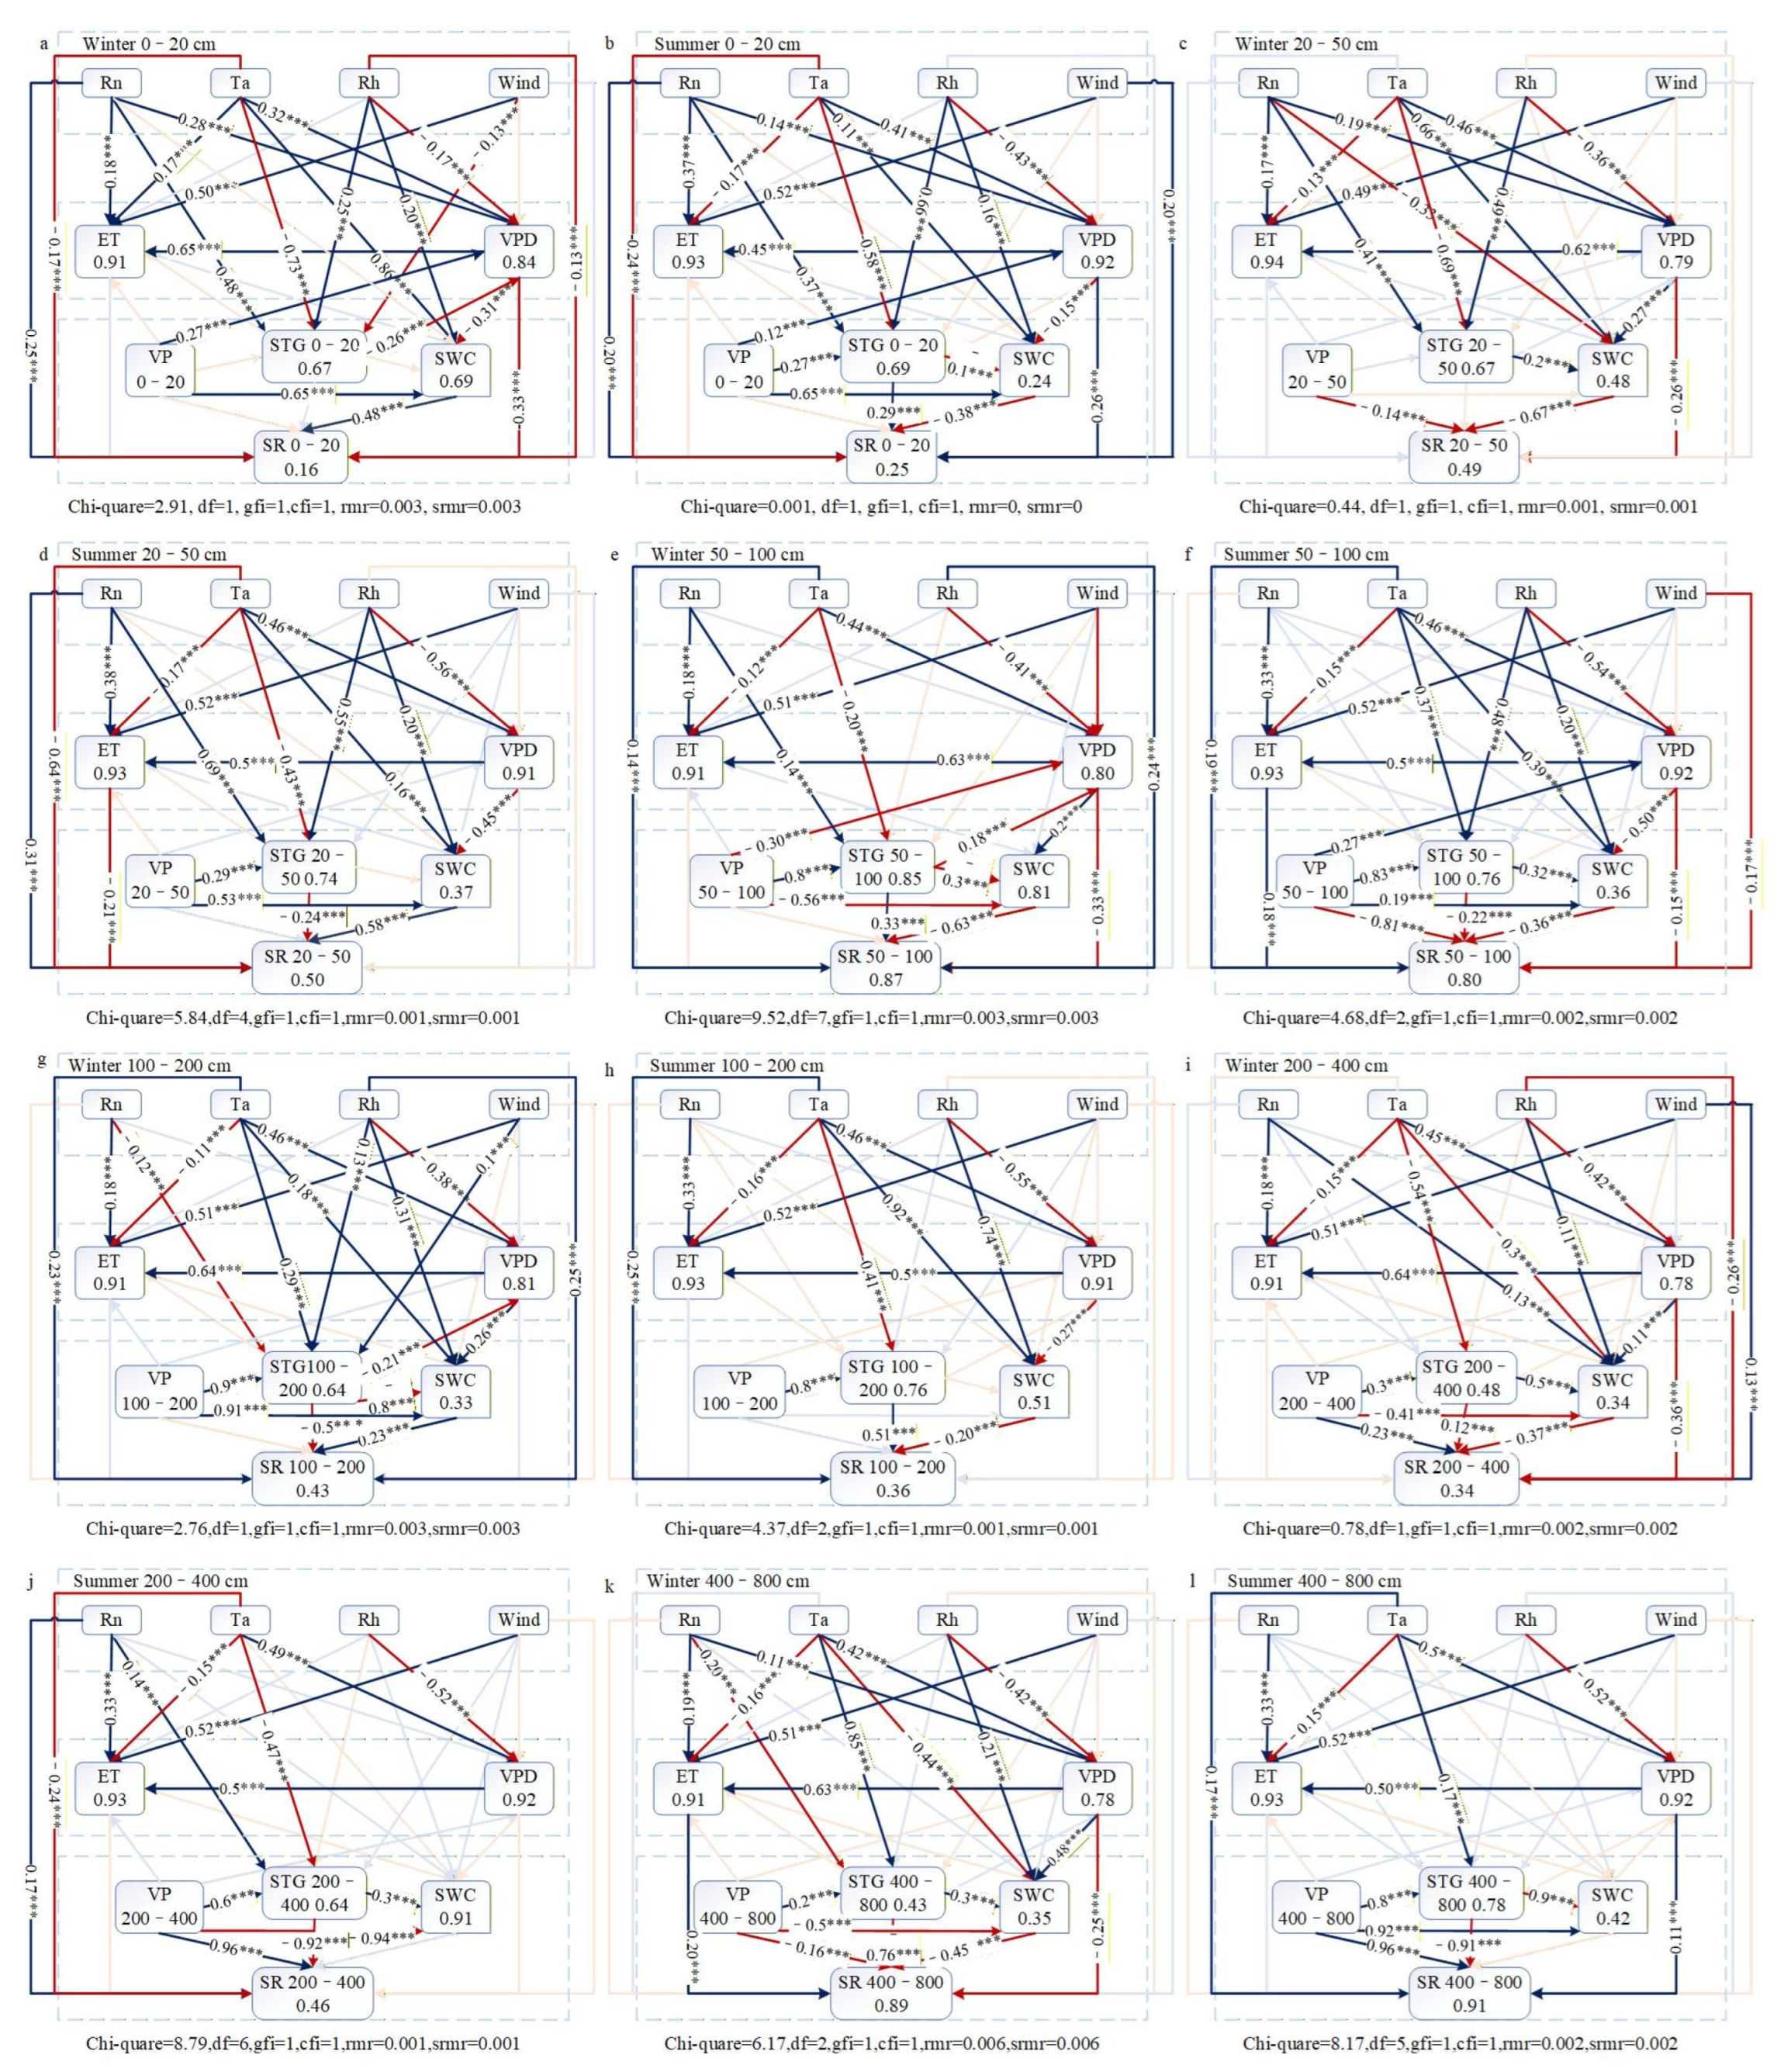
In this study, the influence and pathways of atmospheric boundary conditions and soil physicochemical properties on SR were quantified at different depths (0–8 m) through SHAP value analysis combined with SEM modeling. The results indicate that atmospheric factors (Rn, Ta, Wind, Rh) directly or indirectly affect SR’s spatiotemporal variation by influencing soil factors (soil temperature gradient (STG), SWC, VP, ET, VPD) (Figure 8). Zhang et al. [27] found that water availability plays a key limiting role in water and carbon fluxes within arid ecosystems. However, causal analysis confirmed that water conditions are the primary limiting factor for both carbon and water fluxes in these ecosystems [37]. The exchange rate of CO2 between soil and atmosphere is influenced by ST, SWC, soil organic carbon (SOC), and pH, among other factors, with SWC and ST having a significant impact [38]. Within the shallow soil layer of 0–100 cm, the influence of SWC on carbon flux consistently exceeded 0.35. However, within the same soil layer, no strong correlation was observed between STG and carbon flux. Below 100 cm, the influence of STG on carbon flux gradually increased with depth. The correlation between STG and SR was highest in the 200–800 cm layer during summer, with a correlation coefficient exceeding 0.90. Conversely, the correlation between SWC and SR gradually decreased with increasing soil depth (Figure 8). Meanwhile, the direct influence of meteorological factors on soil factors diminishes with increasing depth. It was noted that the correlation between Ta and SR does not weaken with depth increase. ST exhibits a delayed response to SR, which is more pronounced near the surface and diminishes as soil moisture increases. Deep layer CO2 production responds more strongly to warming than surface soil does [22,39]. Surface CO2 flux is strongly influenced by soil moisture content, with increases in moisture content determining the difference between the two. Furthermore, deep CO2 flux exhibits greater sensitivity to temperature and moisture content than shallow CO2 flux [40]. Daytime temperatures exceed nighttime values, and the ground continuously exchanges heat with the atmosphere through conduction and radiation. Heat transfer from the surface to deeper layers creates a temperature lag [22]. Higher temperatures promote microbial decomposition of organic matter, increasing the intensity of SR at night [41]. Additionally, soil pores contribute to CO2 emissions [42].
Figure 8.
Impact mechanism plot of CO2 flux. (a) Winter at 0–20 cm; (b) Summer at 0–20 cm; (c) Winter at 20–50 cm; (d) Summer at 20–50 cm; (e) Winter at 50–100 cm; (f) Summer at 50–100 cm; (g) Winter at 100–200 cm; (h) Summer at 100–200 cm; (i) Winter at 200–400 cm; (j) Summer at 200–400 cm; (k) Winter at 400–800 cm; and (l) Summer at 400–800 cm. The asterisks indicate the significance levels of these paths (*** p < 0.001).
Soil in arid regions are usually coarse-textured with low moisture content, resulting in lower CO2 concentrations in the topsoil compared to deeper layers. Extreme rainfall events amplify these differences [43,44]. Dune vegetation is dominated by small shrubs and deep-rooted herbaceous plants, which exhibit strong drought adaptation. Their stomatal conductance changes slowly, and flux responses are more influenced by temperature and radiation. Even under identical climatic conditions, ecosystem structural and functional characteristics lead to differing responses of carbon and water fluxes to environmental factors [27]. The mechanisms underlying CO2 changes are relatively complex. Reduced soil moisture decreases the carbon utilization efficiency of soil microorganisms, thereby lowering soil CO2 flux, while reduced rainfall enhances soil CO2 responsiveness [45]. Soil CO2 emissions are primarily controlled by texture and pH, and carbon sequestration responds less strongly to warming than SR [46]. SR rates are influenced by soil texture, SWC, ST, and other factors, and are higher during the rainy season than the dry season [47]. In particular, canopy development during the early and late growing seasons, along with moisture and radiation conditions during the mid-growing season, play a crucial role in controlling the water–carbon relationship [48]. Elevated CO2 creates wetter conditions in the root zone relative to the ambient environment, while warming reduces soil moisture [49]. All biochar treatments increased soil carbon storage while further adsorbing CO2 to achieve greater carbon sequestration [50].
SWC and VPD exerted positive effects on soil carbon flux [51]. For vegetated areas, SWC and VPD played relatively minor effects on carbon and water fluxes, as plant water uptake controls stomatal conductance, while atmospheric water further constrains CO2 demand for photosynthesis [52]. The interaction between ET and VPD remained largely unchanged, and the model failed to capture the spatial response of ET to SR (Figure 8). SWC regulation of CO2 production during soil freeze–thaw processes is more sensitive than ST. The release of stored CO2 during the thawing period causes elevated CO2 fluxes [30]. CO2 diffusion in soil differs between winter and summer. Higher ST during the warm season result in greater CO2 diffusion compared to the cold season. Thawing of frozen soil triggers extensive microbial decomposition of frozen organic carbon, releasing greenhouse gases such as CO2 [31]. Snow depth and duration exert complex effects on water and carbon cycling processes. Initial snowfall increases soil CO2 flux, while snow accumulation during freeze–thaw cycles also influences soil thermodynamics [53]. In terms of depth, soil moisture exhibits a stronger response to SR in the shallow layer than in the deep layer, whereas STG and VP show a stronger response to SR in the deep layer than in the shallow layer. The spatial regulation of SR by soil moisture and temperature reflects the coupled effects of complex internal heat conduction and water transport processes on the carbon cycle. Further validation through SEM analysis confirms that this spatial regulation effect arises not from the independent action of a single factor, but rather from the coupled response of the water–vapor–heat cycle and the carbon cycle. This also explains the significant spatial heterogeneity observed in the marginal contributions of moisture and temperature to SR in the SHAP analysis.
4.2. Effects of Soil Hydrothermal Factors on Carbon Flux
Soil moisture acts as the primary driver of SR in arid and semi-arid ecosystems, where moisture and temperature typically co-limit CO2 emissions [54,55]. Specifically in dune environments, soil and air temperatures emerge as the dominant regulators of SR [56]. The depth-dependent SWC thresholds identified in Section 3.5 reflect both the physiological constraints on microbial communities and the physical limitations of gas diffusion. For instance, when SWC falls below 0.048 cm3/cm3, microbial activity declines, thereby suppressing respiration; conversely, respiration intensifies as SWC increases [57]. Moisture directly governs SR by modulating root and microbial activities while indirectly influencing it by altering the physicochemical soil properties [58]. In near-surface desert soils with a moisture content exceeding 0.05 cm3/cm3, rainfall pulses stimulate biological activity; interestingly, periods of reduced rainfall can also promote CO2 release from the desert soil matrix [59]. Furthermore, the pronounced seasonal discrepancies in these thresholds underscore the significant regulatory impact of freeze–thaw cycles. During winter, soil freezing drastically reduces liquid water availability, causing extensive microbial mortality and subsequently suppressing the microbial contribution to SR [60,61,62]. As demonstrated by our threshold analysis, exceeding specific SWC limits under frozen winter conditions inhibits CO2 diffusion rates, whereas surpassing the corresponding thresholds during summer enhances SR.
While spatial fluctuations in moisture dictate biological activity, soil temperature fundamentally controls the physical expansion and contraction of soil CO2 [59]. Generally, CO2 emissions scale linearly with soil moisture, and an exponential relationship characterizes the coupling between soil temperature and carbon flux at temperatures above 0 °C [63]. However, this study did not observe a clear exponential relationship. This discrepancy likely arises because integrating temperature into the CO2 diffusion model yields a non-exponential trajectory for carbon flux, exhibiting instead an alternating positive-negative polynomial relationship (as reflected in Figure 4). Consistent with this complex dynamic, Xie et al. [57] found that SR peaked at approximately 18.95 °C. Under adequate moisture conditions, elevated temperatures stimulated microbial metabolic activity, accelerating carbon release. Our results corroborated this, demonstrating that within the 0–50 cm shallow layer, a positive soil temperature gradient (where lower-layer temperatures exceed upper-layer temperatures) significantly enhanced CO2 fluxes. Previous research indicates that hot and dry conditions during the vegetation growing season can increase soil CO2 efflux by 14%, with soil temperatures (up to 20 °C) and SWC (up to 23–25%) exerting strong positive effects on emissions [26]. The impacts of altered precipitation patterns and rising temperatures on CO2 fluxes are largely mediated through their dual regulation of soil gas diffusion rates and microbial activity, suggesting a feedback loop where CO2 production actively regulates in situ CO2 concentrations [64]. Ultimately, the carbon sink function of bare sandy land is contingent upon precise precipitation timing and suitable thermal conditions, rendering these fragile ecosystems highly susceptible to extreme climate disturbances [27].
5. Conclusions
Based on monitoring data from a typical sandy soil profile in the Mu Us Sandy Land, this study analyzed the spatiotemporal variation characteristics of soil CO2 flux and investigated the driving mechanisms of carbon flux influenced by environmental factors. The main conclusions are as follows:
(1) Soil carbon flux exhibits distinct depth-dependent patterns in the deep vadose zone. Carbon release is primarily concentrated above 200 cm, with the maximum seasonal flux value of 0.39 μmol·m−2·s−1 observed in spring of the 100–200 cm layer, while the soil depth below 200 cm serves as a carbon sink.
(2) Soil carbon fluxes display nonlinear responses and threshold effects in relation to environmental drivers, characterized by significant depth and seasonal heterogeneity. Within the shallow layer, soil water content provided the highest explanatory power, reaching 55.3% and 47.8% in winter and summer at 20–50 cm soil layer, respectively.
(3) Soil water content, vapor pressure gradient, and soil temperature gradient serve as core driving factors influencing carbon flux. During freeze–thaw cycles, soil moisture, rather than temperature, emerges as the dominant factor limiting CO2 production by regulating microbial activity and gas diffusion.
Overall, these findings elucidate the dynamics of carbon flux and its controlling factors during both freezing and non-freezing periods, revealing strong linkages among soil water, heat, carbon, and atmospheric variables in cold regions. On this basis, developing a numerical model to elucidate these coupled mechanisms could advance our understanding of regional eco-hydrological interactions and will be a central focus of subsequent research.
Author Contributions
H.Z.: Writing-original draft, Investigation; Y.G.: Methodology, Data curation; Writing—review and editing; C.Z.: Supervision, Writing—review and editing, Funding acquisition. All authors have read and agreed to the published version of the manuscript.
Funding
This research was funded by the National Natural Science Foundation of China (Grant No. 42202279), and the Science and Technology Innovation Foundation of Comprehensive Survey & Command Center for Natural Resources (Grant No. KC20240015).
Institutional Review Board Statement
Not applicable.
Informed Consent Statement
Not applicable.
Data Availability Statement
The data are available from the corresponding author on reasonable request.
Conflicts of Interest
The authors declare that they have no known competing financial interests or personal relationships that could have appeared to influence the work reported in this paper.
Abbreviations
| CO2 | Carbon dioxide |
| ET | Evapotranspiration |
| Rn | Net radiation |
| RH | Relative humidity |
| SEM | Structural equation modeling |
| SHAP | SHapley Additive exPlanations |
| SIC | Soil inorganic carbon |
| SOC | Soil organic carbon |
| SR | Soil respiration |
| ST | Soil temperature |
| STG | Soil temperature gradient |
| SWC | Soil water content |
| Ta | Air temperature |
| VP | Vapor Pressure |
| VPD | Vapor pressure deficit |
| WS | Wind speed |
| XGBoost | eXtreme Gradient Boosting |
References
- Ahlström, A.; Raupach, M.R.; Schurgers, G.; Smith, B.; Arneth, A.; Jung, M.; Reichstein, M.; Canadell, J.G.; Friedlingstein, P.; Jain, A.K.; et al. The dominant role of semi-arid ecosystems in the trend and variability of the land CO2 sink. Science 2015, 348, 895–899. [Google Scholar] [CrossRef] [Scilit]
- Kannenberg, S.A.; Anderegg, W.R.L.; Barnes, M.L.; Dannenberg, M.P.; Knapp, A.K. Dominant role of soil moisture in mediating carbon and water fluxes in dryland ecosystems. Nat. Geosci. 2024, 17, 38–43. [Google Scholar] [CrossRef] [Scilit]
- Li, J.; Pei, J.; Fang, C.; Li, B.; Nie, M. Drought may exacerbate dryland soil inorganic carbon loss under warming climate conditions. Nat. Commun. 2024, 15, 617. [Google Scholar] [CrossRef] [Scilit] [PubMed]
- Jin, J.; Zhang, Q.; Wei, C.; Gu, Q.; Huang, Y. Wildfire CO2 Emissions in the Conterminous United States from 2015 to 2018 as Estimated by the WRF-Chem Assimilation System from OCO-2 XCO2 Retrievals. Atmosphere 2024, 15, 186. [Google Scholar] [CrossRef] [Scilit]
- Raich, J.W.; Potter, C.S.; Bhagawati, D. Interannual variability in global soil respiration, 1980–94. Glob. Change Biol. 2002, 8, 800–812. [Google Scholar] [CrossRef] [Scilit]
- Sun, Y.; Lu, S.; Chen, Y. Variations and controlling factors of soil CO2 release at daytime and nighttime scales in the loess hilly regions of China. Geoderma 2025, 454, 117167. [Google Scholar] [CrossRef] [Scilit]
- Nottingham, A.T.; Meir, P.; Velasquez, E.; Turner, B.L. Soil carbon loss by experimental warming in a tropical forest. Nature 2020, 584, 234–237. [Google Scholar] [CrossRef] [Scilit]
- Hicks Pries, C.E.; Castanha, C.; Porras, R.C.; Torn, M.S. The whole-soil carbon flux in response to warming. Science 2017, 355, 1420–1423. [Google Scholar] [CrossRef] [Scilit] [PubMed]
- Melillo, J.M.; Frey, S.D.; DeAngelis, K.M.; Werner, W.J.; Bernard, M.J.; Bowles, F.P.; Pold, G.; Knorr, M.A.; Grandy, A.S. Long-term pattern and magnitude of soil carbon feedback to the climate system in a warming world. Science 2017, 358, 101–105. [Google Scholar] [CrossRef] [Scilit] [PubMed]
- Bastos, A.; Fleischer, K. Fungi are key to CO2 response of soil. Nature 2021, 259, 532–534. [Google Scholar] [CrossRef] [Scilit]
- Ofiti, N.O.E.; Schmidt, M.W.I.; Abiven, S.; Hanson, P.J.; Iversen, C.M.; Wilson, R.M.; Kostka, J.E.; Wiesenberg, G.L.B.; Malhotra, A. Climate warming and elevated CO2 alter peatland soil carbon sources and stability. Nat. Commun. 2023, 14, 7533. [Google Scholar] [CrossRef] [Scilit] [PubMed]
- Cruz-Paredes, C.; Tájmel, D.; Rousk, J. Can moisture affect temperature dependences of microbial growth and respiration? Soil Biol. Biochem. 2021, 156, 108223. [Google Scholar] [CrossRef] [Scilit]
- Wang, C.; Han, Y.; Chen, J.; Wang, X.; Zhang, Q.; Bond-Lamberty, B. Seasonality of soil CO2 efflux in a temperate forest: Biophysical effects of snowpack and spring freeze-thaw cycles. Agric. For. Meteorol. 2013, 177, 83–92. [Google Scholar] [CrossRef] [Scilit]
- Apostolakis, A.; Schöning, I.; Michalzik, B.; Klaus, V.H.; Boeddinghaus, R.S.; Kandeler, E.; Marhan, S.; Bolliger, R.; Fischer, M.; Prati, D.; et al. Drivers of soil respiration across a management intensity gradient in temperate grasslands under drought. Nutr. Cycl. Agroecosyst. 2022, 124, 101–116. [Google Scholar] [CrossRef] [Scilit]
- Chen, P.; Yuan, X.-L.; Li, L.-Y.; Li, J.-Y.; Zhang, R.-Q.; Li, Z.-G.; Liu, Y. Aggregational differentiation of soil-respired CO2 and its δ13C variation across land-use types. Geoderma 2023, 432, 116384. [Google Scholar] [CrossRef] [Scilit]
- Yue, P.; Zhang, Q.; Zhang, L.; Yang, Y.; Wei, W.; Yang, Z.; Li, H.; Wang, S.; Sun, X. Biometeorological effects on carbon dioxide and water-use efficiency within a semiarid grassland in the Chinese Loess Plateau. J. Hydrol. 2020, 590, 125520. [Google Scholar] [CrossRef] [Scilit]
- Li, N.; Shao, J.; Zhou, G.; Zhou, L.; Du, Z.; Zhou, X. Improving estimations of ecosystem respiration with asymmetric daytime and nighttime temperature sensitivity and relative humidity. Agric. For. Meteorol. 2022, 312, 108709. [Google Scholar] [CrossRef] [Scilit]
- Li, Y.; Xu, Y.; Zhang, W.; Zhuang, Q.; Zhang, Y.; Cai, P. Carbon and water fluxes are more sensitive to drought than heat in terrestrial ecosystems in China. J. Hydrol. 2021, 603, 127177. [Google Scholar] [CrossRef] [Scilit]
- Delpierre, N.; Soudani, K.; François, C.; Le Maire, G.; Bernhofer, C.; Kutsch, W.; Misson, L.; Rambal, S.; Vesala, T.; Dufrêne, E. Quantifying the influence of climate and biological drivers on the interannual variability of carbon exchanges in European forests through process-based modelling. Agric. For. Meteorol. 2012, 154–155, 99–112. [Google Scholar] [CrossRef] [Scilit]
- Lei, H.; Gong, T.; Zhang, Y.; Yang, D. Biological factors dominate the interannual variability of evapotranspiration in an irrigated cropland in the North China Plain. Agric. For. Meteorol. 2018, 250–251, 262–276. [Google Scholar] [CrossRef] [Scilit]
- Zhang, T.; Zhang, Y.; Xu, M.; Zhu, J.; Chen, N.; Jiang, Y.; Huang, K.; Zu, J.; Liu, Y.; Yu, G. Water availability is more important than temperature in driving the carbon fluxes of an alpine meadow on the Tibetan Plateau. Agric. For. Meteorol. 2018, 256–257, 22–31. [Google Scholar] [CrossRef] [Scilit]
- Zhang, Q.; Katul, G.G.; Oren, R.; Daly, E.; Manzoni, S.; Yang, D. The hysteresis response of soil CO2 concentration and soil respiration to soil temperature. J. Geophys. Res. Biogeosci. 2015, 120, 1605–1618. [Google Scholar] [CrossRef] [Scilit]
- Laskar, A.H.; Sarkar, A.; Mohanty, R.K.; Agrawal, R.K.; Kumar, S.; Shivam, A. CO2 flux and carbon dynamics in soil and respired CO2 in a semi-arid region of western India. Soil Sci. Soc. Am. J. 2025, 89, e70026. [Google Scholar] [CrossRef] [Scilit]
- Fan, L.C.; Han, W.Y. Soil respiration in Chinese tea gardens: Autotrophic and heterotrophic respiration. Eur. J. Soil Sci. 2018, 69, 675–684. [Google Scholar] [CrossRef] [Scilit]
- Heger, A.; Becker, J.N.; Vásconez, L.K.; Holl, D.; Eschenbach, A. Soil texture and pH affect soil CO2 efflux in hardwood floodplain forests of the lower middle Elbe River. Eur. J. Soil Sci. 2023, 74, e13331. [Google Scholar] [CrossRef] [Scilit]
- Kochiieru, M.; Veršulienė, A.; Feiza, V.; Feizienė, D. Trend for Soil CO2 Efflux in Grassland and Forest Land in Relation with Meteorological Conditions and Root Parameters. Sustainability 2023, 15, 7193. [Google Scholar] [CrossRef] [Scilit]
- Zhang, S.; Duan, L.; Hao, L.; Bao, Y.; Tong, X.; Singh, V.P.; Liu, T. Carbon and water fluxes characteristics and differential regulation mechanisms in dryland ecosystems. J. Hydrol. 2025, 661, 133735. [Google Scholar] [CrossRef] [Scilit]
- Chen, Y.; Liu, X.; Liu, Z.; Zheng, C.; Guo, X.; He, J.; Gao, Y.; Hao, L.; Shi, C.; Cao, Q. Scale effects and driving factors of soil hydrothermal processes in the deep vadose zone under seasonal freeze-thaw action. Geoderma 2025, 464, 117625. [Google Scholar] [CrossRef] [Scilit]
- Zheng, C.; Chen, Y.; Gao, W.; Liang, X.; Šimůnek, J.; Liu, X. Water transfer mechanisms and vapor flow effects in seasonally frozen soils. J. Hydrol. 2023, 627, 130401. [Google Scholar] [CrossRef] [Scilit]
- Wang, P.; Ouyang, W.; Zhu, W.; Cui, X.; Wang, J.; Lin, C. Dissolved organic matter movements from forests influence downstream soil CO2 flux during thawing. Catena 2023, 233, 107497. [Google Scholar] [CrossRef] [Scilit]
- Wei, H.; Liu, E.; He, C.; Song, B.; Wang, D.; Kang, J.; Chen, L.; Li, Q. Numerical analysis of thermo-water-vapor-carbon coupling in a permafrost region: A case study in the Beiluhe region of the Qingzang Plateau, China. Pedosphere 2025, 35, 1039–1053. [Google Scholar] [CrossRef] [Scilit]
- Sun, X.; Wang, H.; Song, C.; Jin, X.; Richardson, C.J.; Cai, T. Response of Methane and Nitrous Oxide Emissions from Peatlands to Permafrost Thawing in Xiaoxing’an Mountains, Northeast China. Atmosphere 2021, 12, 222. [Google Scholar] [CrossRef] [Scilit]
- Suwa, M.; Katul, G.G.; Oren, R.; Andrews, J.; Pippen, J.; Mace, A.; Schlesinger, W.H. Impact of elevated atmospheric CO2 on forest floor respiration in a temperate pine forest. Glob. Biogeochem. Cycles 2004, 18, 2003GB002182. [Google Scholar] [CrossRef] [Scilit]
- Moldrup, P.; Olesen, T.; Gamst, J.; Schjønning, P.; Yamaguchi, T.; Rolston, D.E. Predicting the Gas Diffusion Coefficient in Repacked Soil Water-Induced Linear Reduction Model. Soil Sci. Soc. Am. J. 2000, 64, 1588–1594. [Google Scholar] [CrossRef] [Scilit]
- Zhao, K.; Li, C.; Liu, H.; Hua, X.; Duan, B.; Li, M.; Chen, W.; Jin, C. Characteristics and Driving Mechanisms of Net Ecosystem Productivity in a Subtropical Moso Bamboo Forest Based on XGBoost. Atmosphere 2026, 17, 158. [Google Scholar] [CrossRef] [Scilit]
- Radić, N.; Perišić, M.; Jovanović, G.; Bezdan, T.; Stanišić, S.; Stanić, N.; Stojić, A. An AI-Based Framework for Characterizing the Atmospheric Fate of Air Pollutants Within Diverse Environmental Settings. Atmosphere 2025, 16, 231. [Google Scholar] [CrossRef] [Scilit]
- Hao, L.; Liu, X.; Šimůnek, J.; Zheng, C.; Shi, C. The dynamic processes of CO2 migration as influenced by moisture and temperature in the arid sandy shrubland vadose zone. J. Hydrol. 2025, 662, 133972. [Google Scholar] [CrossRef] [Scilit]
- Nan, Y.; Huang, L.; Yang, Y.; Yang, G.; Wang, Z. Evaluation of soil CO2 efflux and its influence factors in a revegetated area in Tengger Desert, NW China. Environ. Earth Sci. 2023, 82, 472. [Google Scholar] [CrossRef] [Scilit]
- Khan, M.Z.; Chabbi, A.; Hicks Pries, C.E.; Torn, M.S.; Rumpel, C. Management impacts on whole soil warming responses of CO2 production and efflux in temperate climate. Geoderma 2023, 440, 116725. [Google Scholar] [CrossRef] [Scilit]
- Hao, W.; Xia, B.; Li, J.; Xu, M. Deep soil CO2 flux with strong temperature dependence contributes considerably to soil-atmosphere carbon flux. Ecol. Inform. 2023, 74, 101957. [Google Scholar] [CrossRef] [Scilit]
- Ford, C.R.; McGee, J.; Scandellari, F.; Hobbie, E.A.; Mitchell, R.J. Long- and short-term precipitation effects on soil CO2 efflux and total belowground carbon allocation. Agric. For. Meteorol. 2012, 156, 54–64. [Google Scholar] [CrossRef] [Scilit]
- Galic, M.; Percin, A.; Bogunovic, I. Soil C-CO2 Emissions Across Different Land Uses in a Peri-Urban Area of Central Croatia. Land 2025, 14, 1876. [Google Scholar] [CrossRef] [Scilit]
- Liu, F.; Zhang, G.-L.; Song, X.; Li, D.; Zhao, Y.; Yang, J.; Wu, H.; Yang, F. High-resolution and three-dimensional mapping of soil texture of China. Geoderma 2020, 361, 114061. [Google Scholar] [CrossRef] [Scilit]
- Kim, G.S.; Kim, A.R.; Lim, B.S.; Seol, J.; An, J.H.; Lim, C.H.; Joo, S.J.; Lee, C.S. Assessment of the Carbon Budget of Local Governments in South Korea. Atmosphere 2022, 13, 342. [Google Scholar] [CrossRef] [Scilit]
- Manzoni, S.; Katul, G.G. Invariant soil water potential at zero microbial respiration explained by hydrological discontinuity in dry soils. Geophys. Res. Lett. 2014, 41, 7151–7158. [Google Scholar] [CrossRef] [Scilit]
- Akinyede, R.; Taubert, M.; Schrumpf, M.; Trumbore, S.; Küsel, K. Temperature sensitivity of dark CO2 fixation in temperate forest soils. Biogeosciences 2022, 19, 4011–4028. [Google Scholar] [CrossRef] [Scilit]
- Owusu-Prempeh, N.; Amekudzi, L.K.; Kyereh, B. Assessment of soil carbon dioxide efflux from contrasting land uses in a semi-arid savannah ecosystem, northeastern Ghana (West Africa). Sci. Afr. 2024, 26, e02420. [Google Scholar] [CrossRef] [Scilit]
- Gao, L.; Kang, S.; Bai, X.; Li, S.; Niu, J.; Ding, R. Water-carbon relationships and variations from the canopy to ecosystem scale in a sparse vineyard in the northwest China. J. Hydrol. 2021, 600, 126469. [Google Scholar] [CrossRef] [Scilit]
- Radolinski, J.; Vremec, M.; Wachter, H.; Birk, S.; Brüggemann, N.; Herndl, M.; Kahmen, A.; Nelson, D.B.; Kübert, A.; Schaumberger, A.; et al. Drought in a warmer, CO2-rich climate restricts grassland water use and soil water mixing. Science 2025, 387, 290–296. [Google Scholar] [CrossRef] [Scilit]
- Gui, X.; Xu, X.; Zhang, Z.; Hu, L.; Huang, W.; Zhao, L.; Cao, X. Biochar-amended soil can further sorb atmospheric CO2 for more carbon sequestration. Commun. Earth Environ. 2025, 6, 5. [Google Scholar] [CrossRef] [Scilit]
- Wang, Y.; Xiao, J.; Ma, Y.; Luo, Y.; Hu, Z.; Li, F.; Li, Y.; Gu, L.; Li, Z.; Yuan, L. Carbon fluxes and environmental controls across different alpine grassland types on the Tibetan Plateau. Agric. For. Meteorol. 2021, 311, 108694. [Google Scholar] [CrossRef] [Scilit]
- Pei, Y.; Dong, J.; Zhang, Y.; Yang, J.; Wu, S.; Gay, B.A.; He, B.; Xiao, X. Sensitivity of dryland plant water availability to changes in carbon and water fluxes. J. Hydrol. 2025, 662, 133966. [Google Scholar] [CrossRef] [Scilit]
- Yang, X.; Hou, R.; Fu, Q.; Li, T.; Li, M.; Cui, S.; Li, Q. Effects of coupled biochar and snow cover on soil carbon components and CO2 emissions in seasonally frozen soil areas under climate change conditions. Catena 2024, 243, 108203. [Google Scholar] [CrossRef] [Scilit]
- Kang, X.; Liu, T.; Hao, L.; Duan, L.; Wang, G.; Singh, V.P.; Zhang, M.; Wu, R.; Ma, K. Carbon dynamics of the plant-soil system during vegetation succession in dune-meadow cascade ecosystems in Horqin Sandy Land, China. Ecol. Indic. 2023, 155, 110916. [Google Scholar] [CrossRef] [Scilit]
- Yu, Y.; Zhao, C.; Jia, H.; Niu, B.; Sheng, Y.; Shi, F. Effects of nitrogen fertilizer, soil temperature and moisture on the soil-surface CO2 efflux and production in an oasis cotton field in arid northwestern China. Geoderma 2017, 308, 93–103. [Google Scholar] [CrossRef] [Scilit]
- Poulter, B.; Frank, D.; Ciais, P.; Myneni, R.B.; Andela, N.; Bi, J.; Broquet, G.; Canadell, J.G.; Chevallier, F.; Liu, Y.Y.; et al. Contribution of semi-arid ecosystems to interannual variability of the global carbon cycle. Nature 2014, 509, 600–603. [Google Scholar] [CrossRef] [Scilit]
- Xie, S.; Mo, X.; Liu, S.; Hu, S. Plant Hydraulics Improves Predictions of ET and GPP Responses to Drought. Water Resour. Res. 2023, 59, e2022WR033402. [Google Scholar] [CrossRef] [Scilit]
- Chu, X.; Han, G.; Wei, S.; Xing, Q.; He, W.; Sun, B.; Li, X.; Hui, D.; Wu, H.; Wang, X.; et al. Seasonal not annual precipitation drives 8-year variability of interannual net CO2 exchange in a salt marsh. Agric. For. Meteorol. 2021, 308–309, 108557. [Google Scholar] [CrossRef] [Scilit]
- Yang, F.; Huang, J.; Zhou, C.; Yang, X.; Mamtimin, A.; Zheng, X.; Huo, W.; Ji, F.; Han, D.; Meng, L.; et al. Desert Abiotic Carbon Sequestration Weakening by Precipitation. Environ. Sci. Technol. 2023, 57, 7174–7184. [Google Scholar] [CrossRef] [Scilit] [PubMed]
- Barron-Gafford, G.A.; Cable, J.M.; Bentley, L.P.; Scott, R.L.; Huxman, T.E.; Jenerette, G.D.; Ogle, K. Quantifying the timescales over which exogenous and endogenous conditions affect soil respiration. New Phytol. 2014, 202, 442–454. [Google Scholar] [CrossRef] [Scilit]
- Fontes, M.L.S.; Tonetta, D.; Dalpaz, L.; Antônio, R.V.; Petrucio, M.M. Dynamics of Planktonic Prokaryotes and Dissolved Carbon in a Subtropical Coastal Lake. Front. Microbiol. 2013, 4, 71. [Google Scholar] [CrossRef] [Scilit] [PubMed]
- Yang, K.; Peng, C.; Peñuelas, J.; Kardol, P.; Li, Z.; Zhang, L.; Ni, X.; Yue, K.; Tan, B.; Yin, R.; et al. Immediate and carry-over effects of increased soil frost on soil respiration and microbial activity in a spruce forest. Soil Biol. Biochem. 2019, 135, 51–59. [Google Scholar] [CrossRef] [Scilit]
- Gao, H.; Xia, X.; Zhang, Z.; Chen, J.; Liu, S. Temperature response of soil respiration decreases with latitude and elevation in abandoned croplands. Agric. Ecosyst. Environ. 2024, 363, 108862. [Google Scholar] [CrossRef] [Scilit]
- Min, K.; Berhe, A.A.; Khoi, C.M.; Van Asperen, H.; Gillabel, J.; Six, J. Differential effects of wetting and drying on soil CO2 concentration and flux in near-surface vs. deep soil layers. Biogeochemistry 2020, 148, 255–269. [Google Scholar] [CrossRef] [Scilit]

Disclaimer/Publisher’s Note: The statements, opinions and data contained in all publications are solely those of the individual author(s) and contributor(s) and not of MDPI and/or the editor(s). MDPI and/or the editor(s) disclaim responsibility for any injury to people or property resulting from any ideas, methods, instructions or products referred to in the content. |
© 2026 by the authors. Licensee MDPI, Basel, Switzerland. This article is an open access article distributed under the terms and conditions of the Creative Commons Attribution (CC BY) license.