


Abstract
In recent years, more and more studies have been published on the impact of air pollution on the increase in the incidence of type 1 diabetes mellitus (T1DM) in children and adolescents. To confirm this, we attempted to show whether there are differences between the impact of air pollution in 2017–2018 compared to the impact of air pollution during the lockdown period, i.e., 2020–2021, and its potential relationship with the incidence rates of new cases of T1DM. Methods: We obtained the number of new cases of T1DM in 2017–2018 and 2020–2021 in the Lublin Voivodeship. Data on the annual average concentrations of nitrogen dioxide (NO2), nitric oxides (NOx), sulphur dioxide (SO2) and particulate matter (PM10 and PM2.5) were obtained from Annual Air Quality Assessment reports from 2017–2018 and 2020–2021, made available by the Provincial Inspectorate of Environmental Protection (WIOS) in Lublin. Results: In 2017–2018, air pollution in the entire Lublin Voivodeship was higher than during the lockdown period, i.e., 2020–2021. Moreover, in 2017 and 2018 in the Lublin Voivodeship, strong statistically significant positive correlations were found between NO2 and PM2.5 concentrations and the occurrence of T1DM in children. Conclusions: The research results indicate that air pollution is one of the factors that may suggest a potential association with the development of T1DM. Therefore, every effort should be made to minimize air pollution, which will reduce the risk of developing T1DM and other diseases.
1. Introduction
Type 1 diabetes (T1DM) is an autoimmune disease with an increasing number of cases [1,2,3,4]. In 2022, about 8.75 million people worldwide suffered from T1DM, of which 17% were younger than 20 years old [5]. The pathogenesis of this disease is based on the destruction of pancreatic β cells by T lymphocytes, which results in impaired insulin synthesis [5,6,7,8]. Insulin is an anabolic hormone necessary for the proper metabolism of glucose, lipids, minerals and proteins. This hormone, by binding to the insulin receptor, participates in the process of transporting glucose to muscle or adipose cells and storing glucose in the liver. In addition, it stimulates the synthesis of fatty acids and reduces the breakdown of fat in adipose tissue. Insulin is also involved in regulating the concentration of electrolytes in the blood by actuating the uptake of potassium into the cells [9]. With such a severe defect in insulin synthesis, resulting in deficiency or lack of insulin in the body, patients rely on insulin therapy for life [10].
Diabetes treatment is currently based on the use of regular blood glucose measurements and the administration of exogenous insulin using pens. Increasingly, patients are also replacing pens with insulin pumps, which continuously monitor glucose levels and enable the administration of short-term insulin. An additional convenience for patients is a sensor that they can wear for a few days and measure blood glucose using an application on their phones [11]. All these methods are only ways of treating and counteracting the complications of diabetes, and they cannot cure the disease, which ultimately affects the patient for life. Additionally, type 1 diabetes is associated with complications, the number and intensity of which increase with the duration of the disease. The most frequently mentioned complications of diabetes in its early stage include ketoacidosis and hypoglycemia, which threaten the patient’s life [12]. Subsequently, chronic complications such as diabetic retinopathy, diabetic nephropathy, diabetic neuropathy, vascular diseases and others may appear [13,14,15].
Both our team and other researchers have demonstrated possible risk factors for chronic vascular complications in type 1 diabetes in children and adolescents [13,16,17].
Researchers are increasingly trying to find an effective drug that would free patients from this disease. There are reports that studies are underway regarding pancreatic islet transplantation, exogenous administration of brain-derived neurotrophic factor (BDNF) and Treg cell therapy. This is because an association has been noticed between changes in BDNF and Treg levels in patients and the occurrence of T1DM [9,13].
All these innovative methods give hope for a better future, but the basis of the fight against type 1 diabetes is understanding the pathogenesis of the disease and finding the factors that cause it in order to reduce the risk of developing the disease to a minimum.
There are many factors that can cause T1DM, but so far, no strategy has been developed to reduce the risk of type 1 diabetes in children. For example, among the risk factors mentioned are genetic predisposition, infectious—especially viral—diseases, low vitamin D levels under 1 year of age, overweight and stress, which are considered to initiate a cascade of events resulting in the disease [1,14,18]. In addition, one of important factors influencing the incidence of type 1 diabetes is the length of breastfeeding during infancy and the dietary habits of mother and child [1,2].
However, more and more people are also finding a relationship between air pollution and the increasing incidence of type 1 diabetes [1,4,8,14,18,19,20]. It is known that exposure to polluted air can result in eye disorders, cardiovascular diseases, respiratory diseases or lung cancer [6,18,21,22]. So far, the question of whether air pollution can cause or predispose to type 1 diabetes has not been answered conclusively, but there is increasing evidence to suggest such a conclusion [1,18].
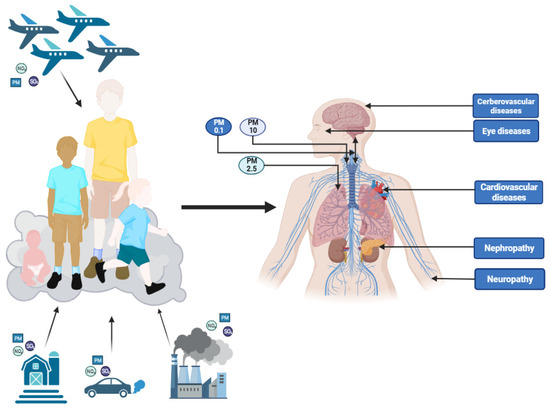
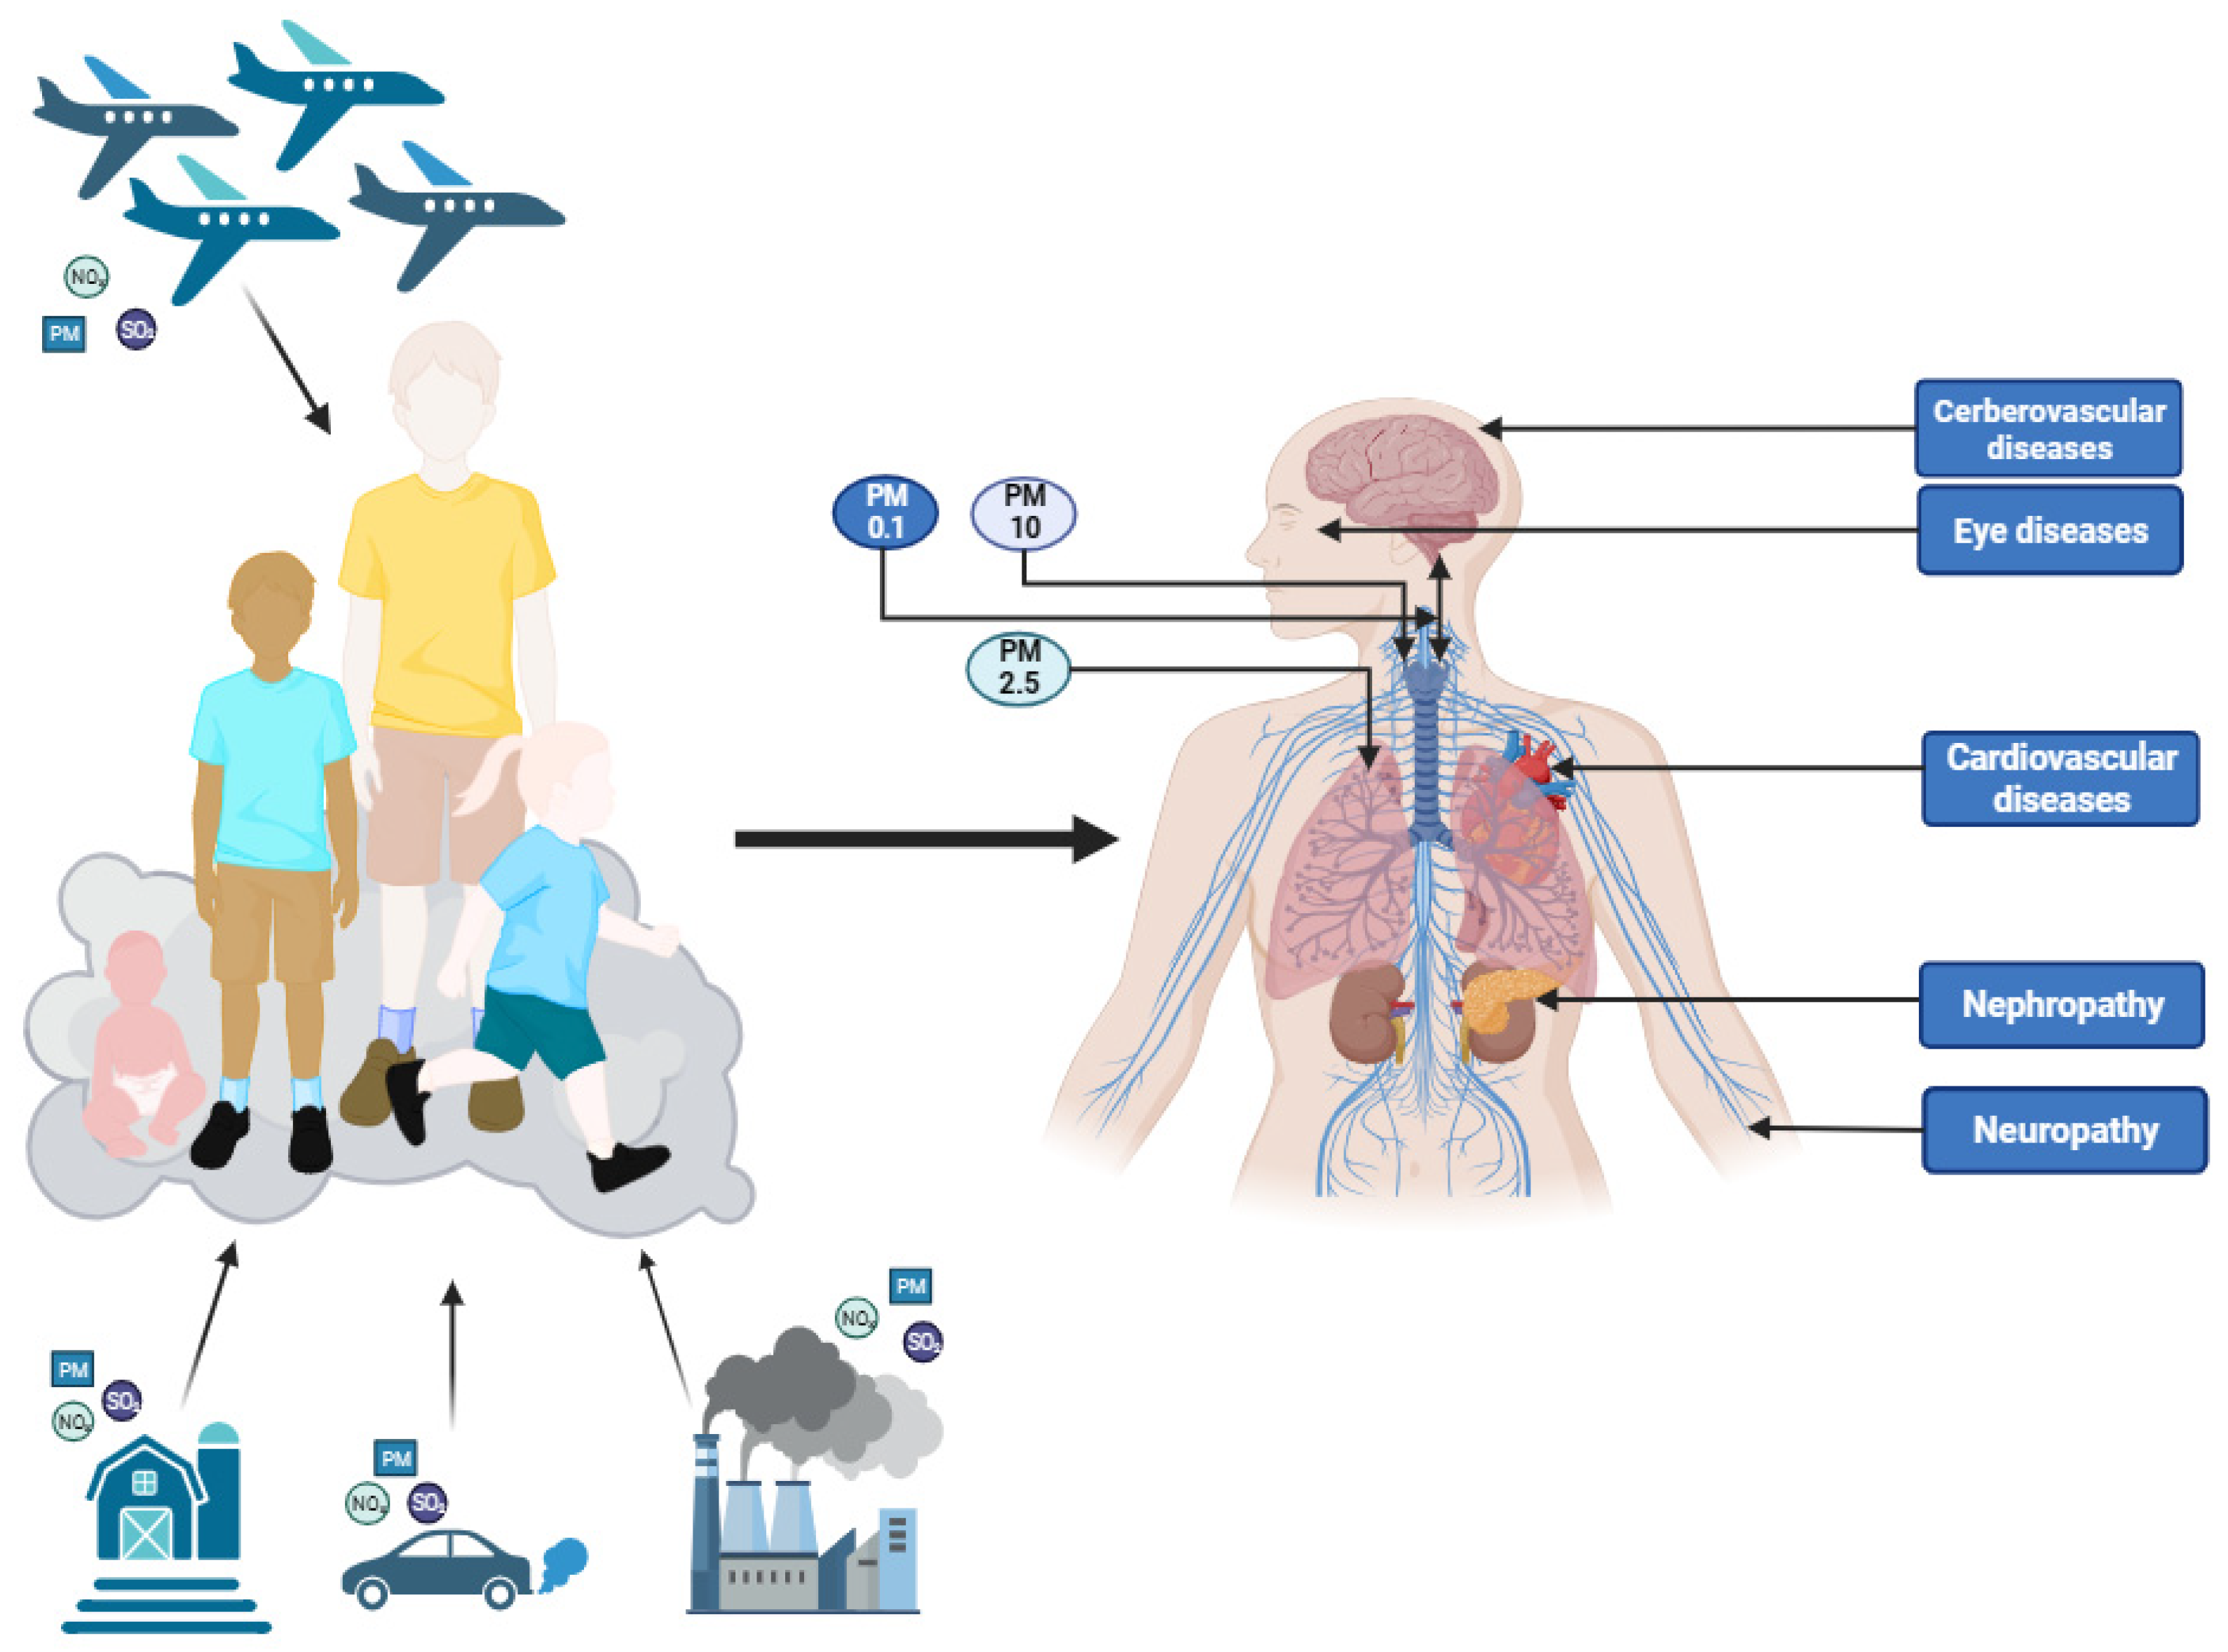
Progressive air pollution is a very serious global health threat [18,23,24]. According to the Global Burden of Diseases, Injuries and Risk Factors Study (GBD) 2019, the number of deaths from this cause has increased by about 66% over the past 20 years, and about 6.7 million people worldwide died prematurely due to air pollution only in 2019 [24]. Air pollution includes particulate matter (PM), which among others consists of carbon oxides, metals, polycyclic aromatic hydrocarbons, nitrates and sulfates [14,18,25,26]. The severity of the negative effects of air pollutants on human health depends on their ability to penetrate the respiratory system and settle there as well as the body’s ability to remove them from the respiratory tract. This is determined by the size and shape of the particulate matter—for example, PM > 10 μm forms deposits in the upper respiratory tract, causing hay fever, and PM5 can penetrate into the alveoli, resulting in asthma or allergic pneumonia [4,25]. Oxidative stress is the major contributing factor by which air pollution leads to diabetes. Air pollutants containing harmful reactive oxygen species can induce oxidative stress and systemic inflammation in the body [26]. Oxidative stress is thus the mechanism behind T1DM that is frequently suggested by researchers and involves, among other factors, the excess of reactive oxygen species (ROS) triggering dysregulation in beta-cell function [14,22,23]. Additionally, experimental animal data suggest upstream mechanistic pathways linking air pollution (especially traffic-related pollution) exposure to systemic inflammation, insulin resistance and β-cell dysfunction, as well as adipose tissue inflammation [27]. However, to date, these pathways have not been adequately studied in children and during pregnancy [8,27]. Examples of sources of air pollution, routes of penetration into the human body and possible effects are presented in Figure 1.
Figure 1.
Examples of sources of air pollution, routes of penetration into the human body and possible effects. Proposed pathomechanism based on references [1,14,15,19]. Created in BioRender. Jung, J. (2024) https://app.biorender.com/illustrations/69a5762b9ed00cdd7ffc1a47.
The main aim of this study is to investigate the potential relationship between selected air pollutants, in particular the concentrations of PM10, PM2.5, NO2, NOx and SO2, and the incidence of type 1 diabetes (T1DM) in children in the Lublin Voivodeship, Poland, during the years 2017–2018 and 2020–2021, taking into account changes in pollution levels caused by COVID-19 restrictions. Furthermore, the aim is to contribute to a better understanding of the complex relationship between air pollution and the risk of T1DM, and consequently the obtained results may contribute to further air-pollution-related restrictions.
2. Results
2.1. The Measurement Results for Particular Air Pollutants in the Lublin Voivodeship in 2017–2018 and 2020–2021 (Table 1)
Table 1 summarizes the annual average concentrations of major air pollutants in the Lubelskie Voivodeship during the pre-pandemic (2017–2018) and pandemic (2020–2021) periods, providing context for subsequent correlation analyses below.
Table 1.
Comparison of the average concentration of air pollution in the years 2017–2018 and 2020–2021 in the Lubelskie Voivodeship, Poland, with the criteria used by the Europen Union and WHO [28,29].
2.1.1. The Average Annual PM2.5 Concentration in the Lubelskie Voivodeship in the Years 2017–2018 and 2020–2021
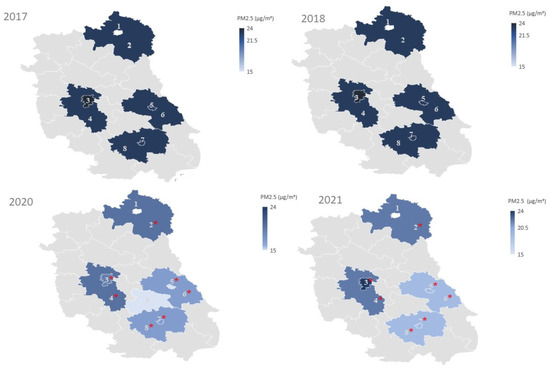
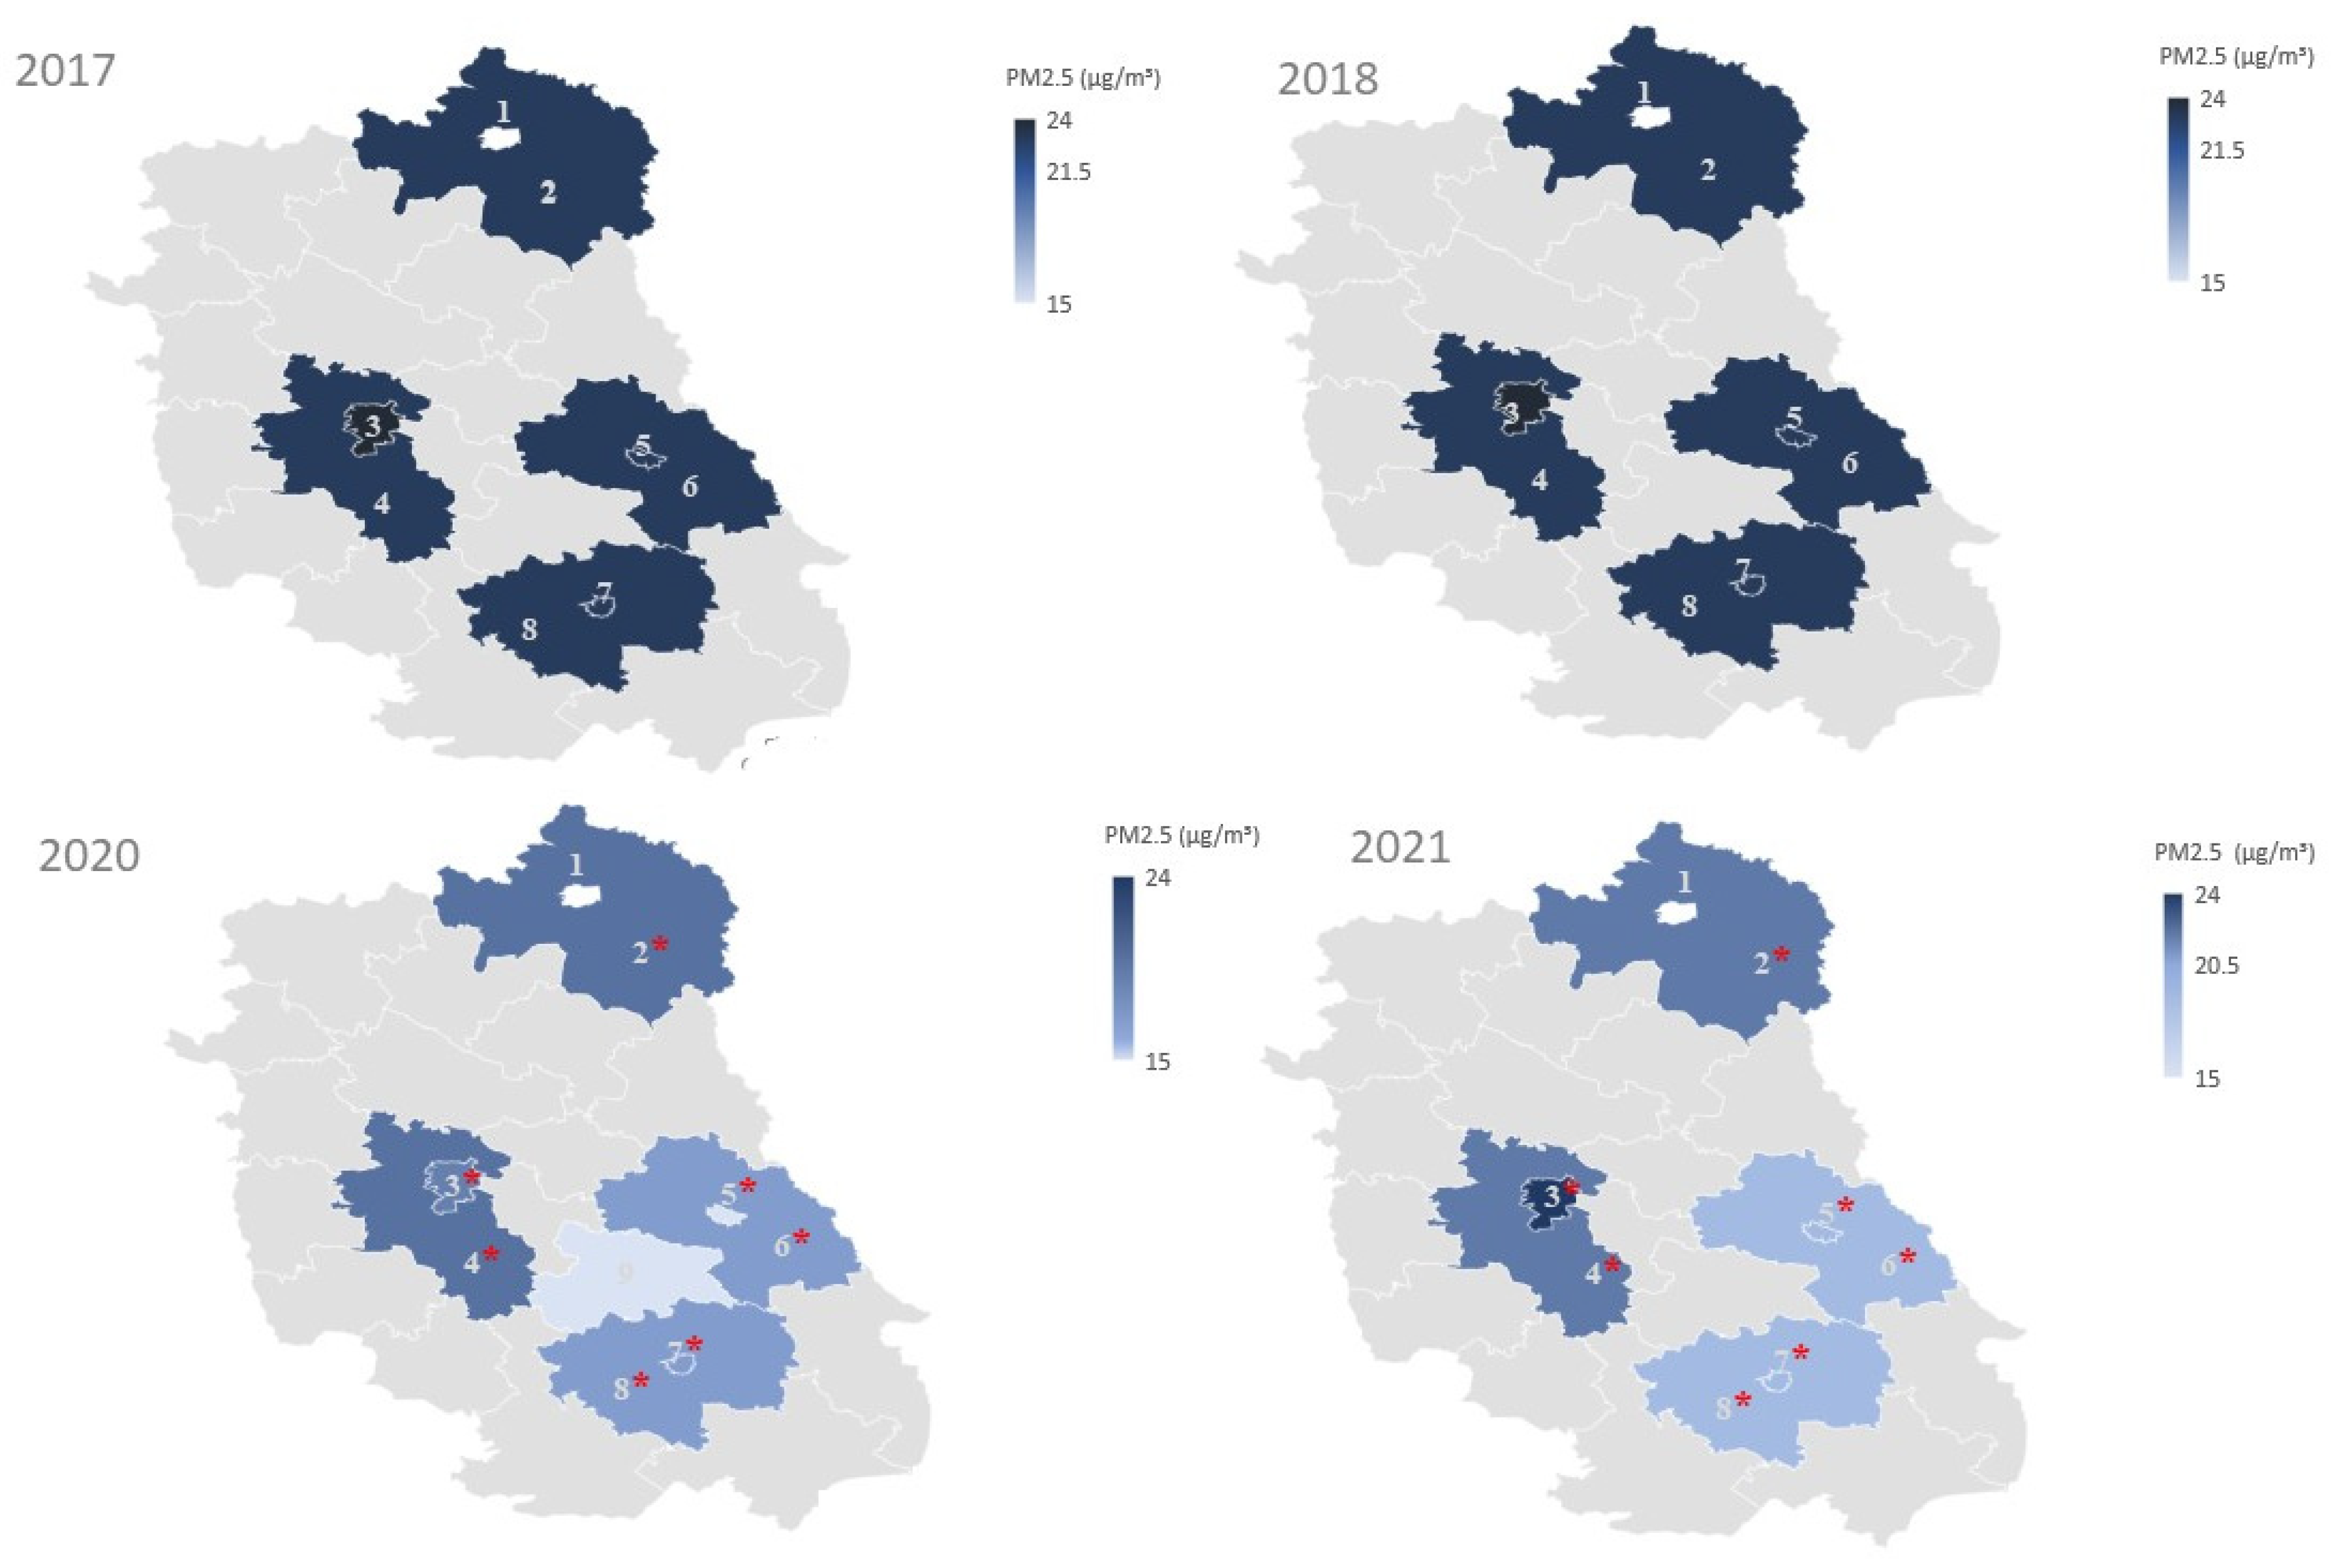
In 2017–2018, the average annual concentration of PM2.5 recorded in daily measurements remained around 22 µg/m3 in the Lubelskie Voivodeship. This concentration suggests over a four-fold excess compared to current WHO safety guidelines, but remains within the norm compared to current European Union (EU) guidelines (Table 1). The highest average annual concentration of PM2.5 was recorded in 2018 at each measurement point—approximately 22–23 µg/m3. In 2020–2021, the concentration of PM2.5 decreased significantly (p < 0.05) (Figure 2) in almost all areas compared to 2017–2018, reaching the lowest level of approximately 15 µg/m3 in 2020 in area 3. It is worth adding that this concentration is still thrice higher than the current safe WHO guidelines, but is lower than the standard adopted by the EU in 2020 for this pollutant (Table 1). The exception to decreasing PM2.5 levels in 2020–2021 was region 3 in 2021, where the concentration returned to around 24 µg/m3 (Figure 2). Additionally, the concentration exceeded the standard for this type of pollution set by WHO guidelines every year, and in 2020–2021 it also exceeded European standards (Table 1).
Figure 2.
Changes in 24 h average PM2.5 concentration in Lubelskie Voivodeship, Poland, between 2017–2018 and 2020–2021 [1—Biała Podlaska, 2—Biala County, 3—Lublin City, 4—Lublin County, 5—Chełm City, 6—Chełm County, 7—Zamość City, 8—Zamość County]. The “*” symbolizes a statistically significant change compared to the previous year, established by one-way ANOVA with post hoc Tukey test (p < 0.05).
2.1.2. The Average Annual SO2 Concentration in the Lubelskie Voivodeship in the Years 2017–2018 and 2020–2021
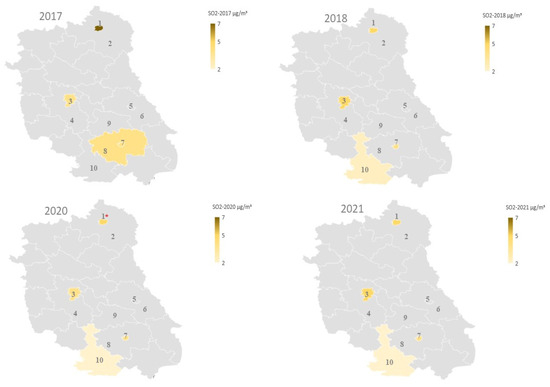
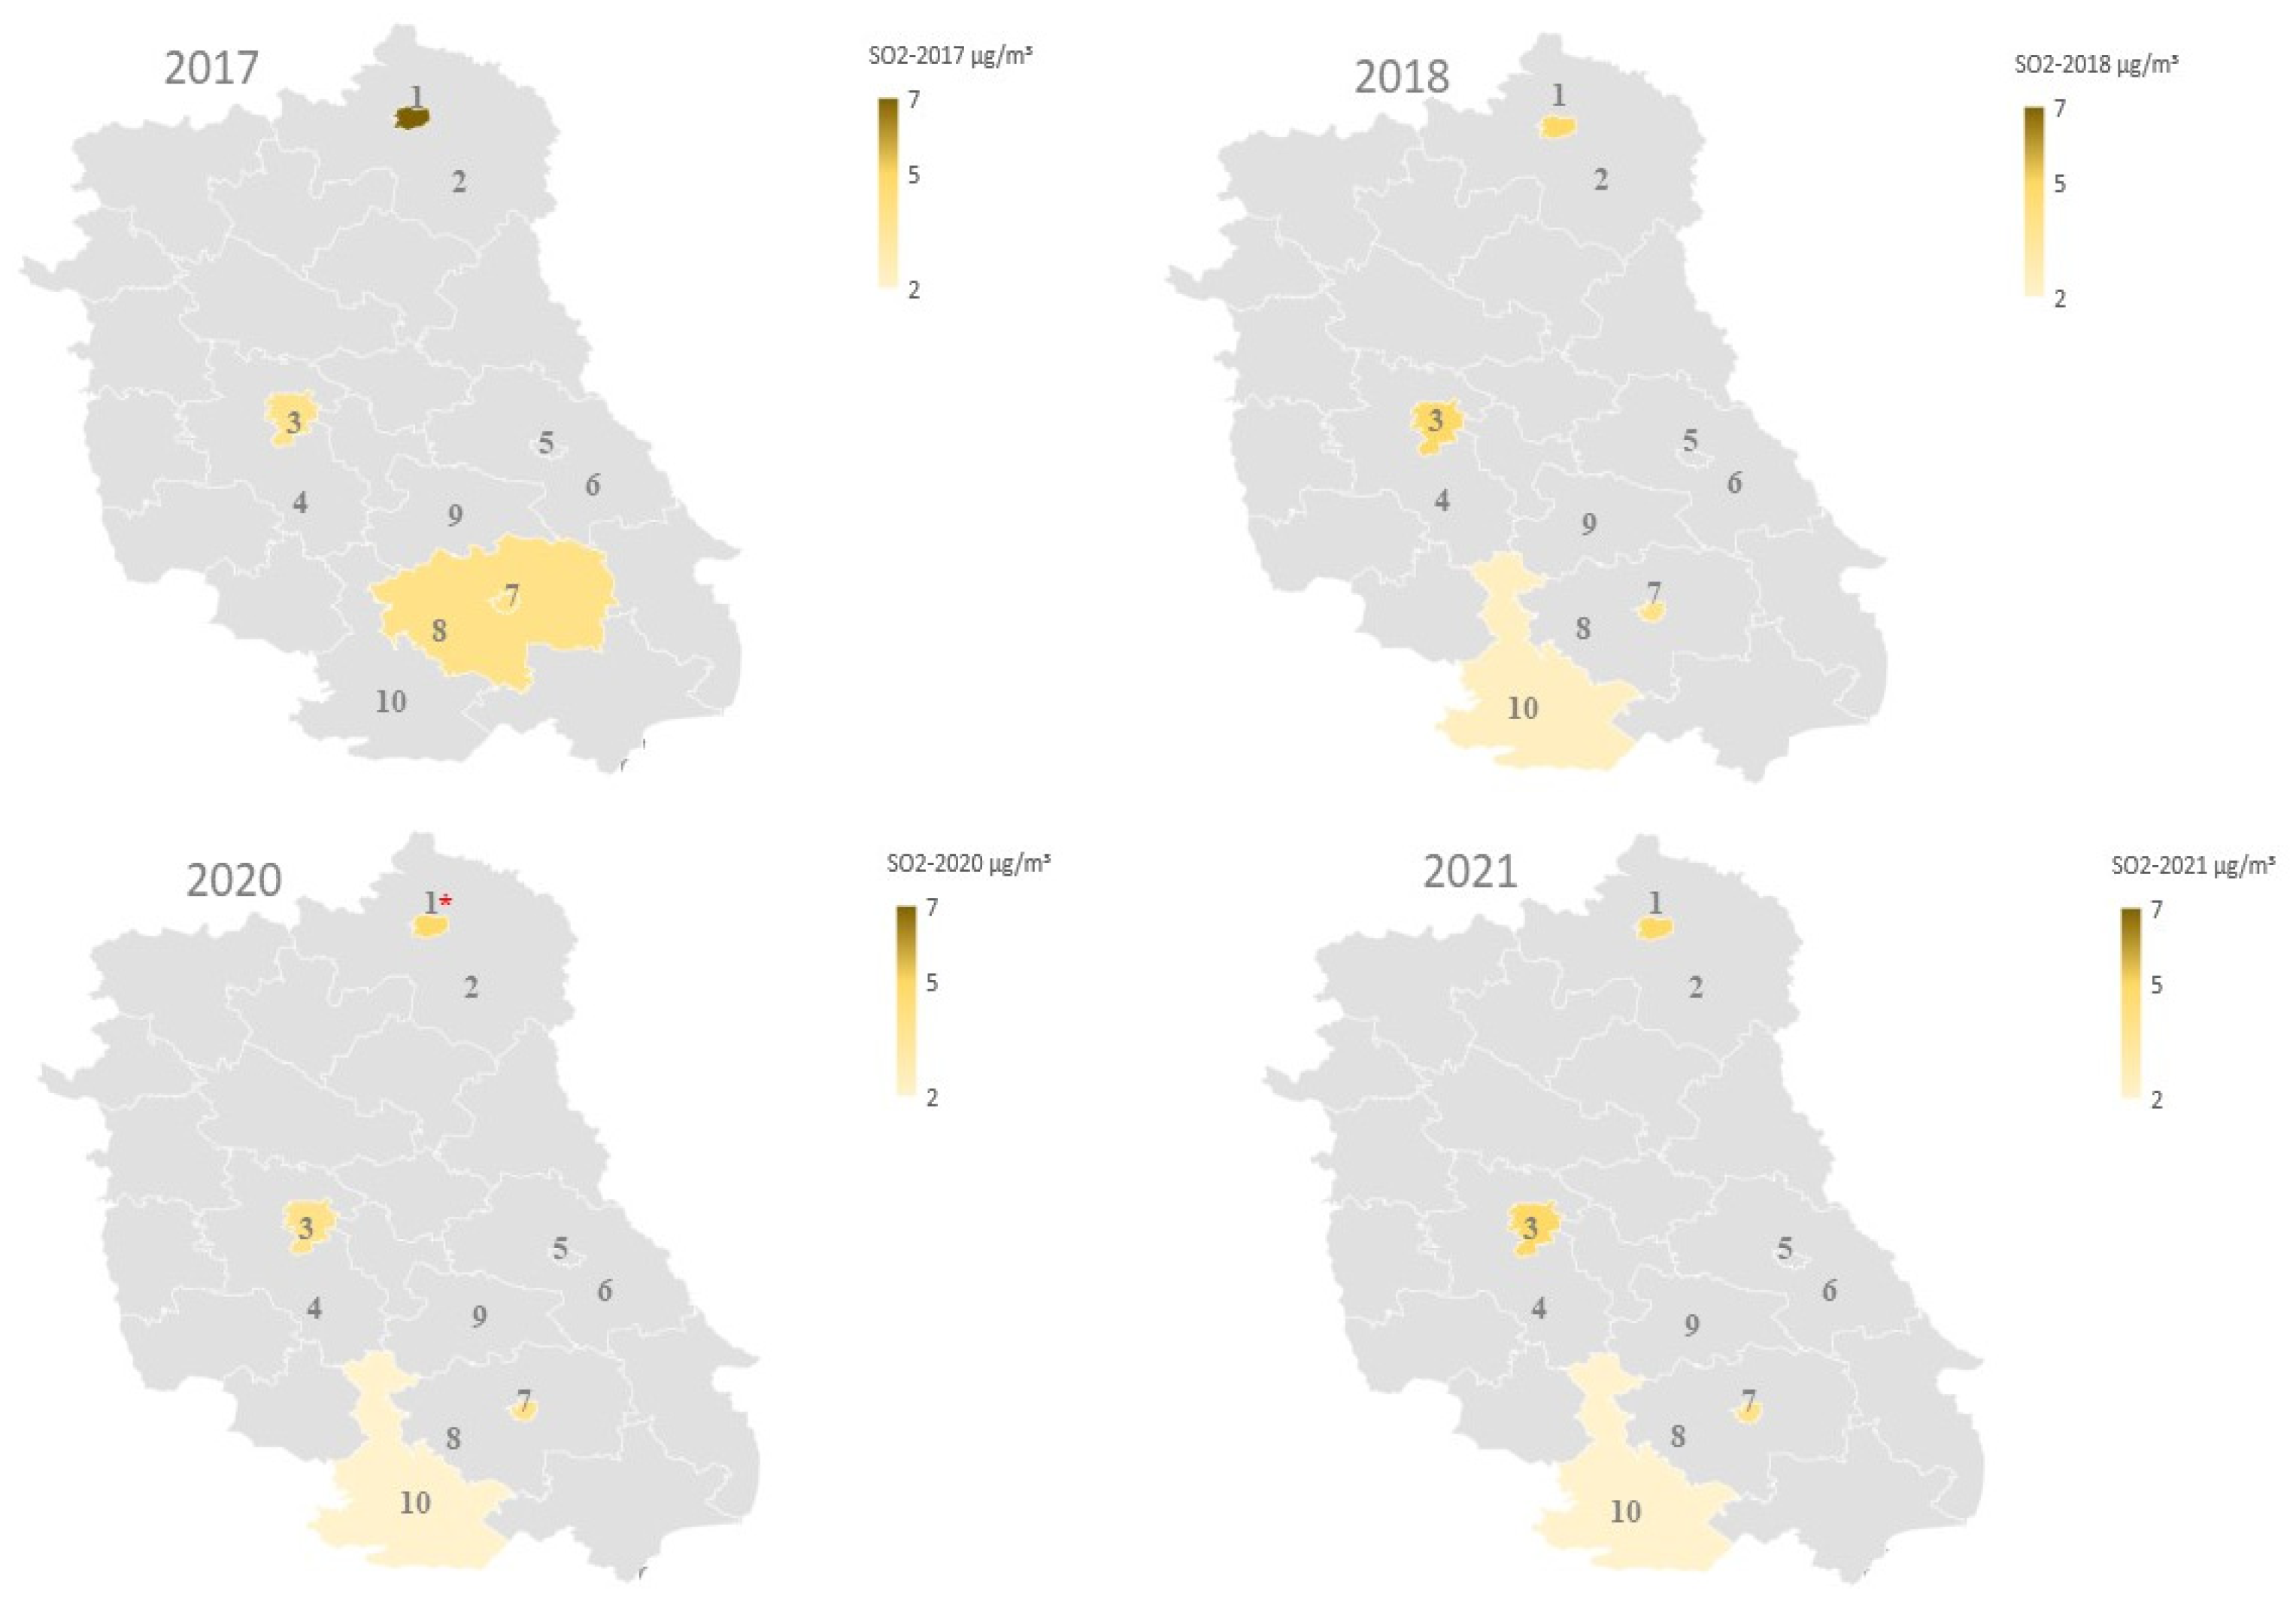
In the years 2017–2018 and 2020–2021, the average annual SO2 concentration was recorded at a level below 10 µg/m3 in measurement points located in areas 1, 3, 7 and 8 (in 2018, the location of the measurement point was changed to area 10) of the Lublin Voivodeship. Apart from area 1, no significant changes (p > 0.05) in average annual SO2 concentrations were recorded in the years 2017–2018 and 2020–2021 at the measurement points indicated above (Figure 3). Comparing the above data with WHO recommendations in 2017–2018 and 2020–2021, SO2 standards were not exceeded in any area (Table 1).
Figure 3.
Changes in average SO2 concentration in Lubelskie Voivodeship, Poland, between 2017–2018 and 2020–2021 [1—Biała Podlaska, 2—Biała County, 3—Lublin City, 4—Lublin County, 5—Chełm City, 6—Chełm County, 7—Zamość City, 8—Zamość County, 9—Krasnystaw County, 10—Białgoraj County]. The “*” symbolizes a statistically significant change compared to the previous year, established by one-way ANOVA with post hoc Tukey test (p < 0.05).
2.1.3. The Average Annual NOx Concentration in the Lubelskie Voivodeship in the Years 2017–2018 and 2020–2021
Due to the lack of availability of all standards for NOx concentration in given years and due to the fact that the largest group of NOx is NO2, the results below are compared to the WHO and EU standards for NO2 (Table 1).
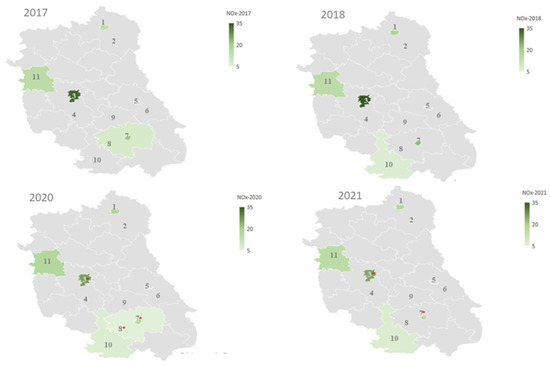
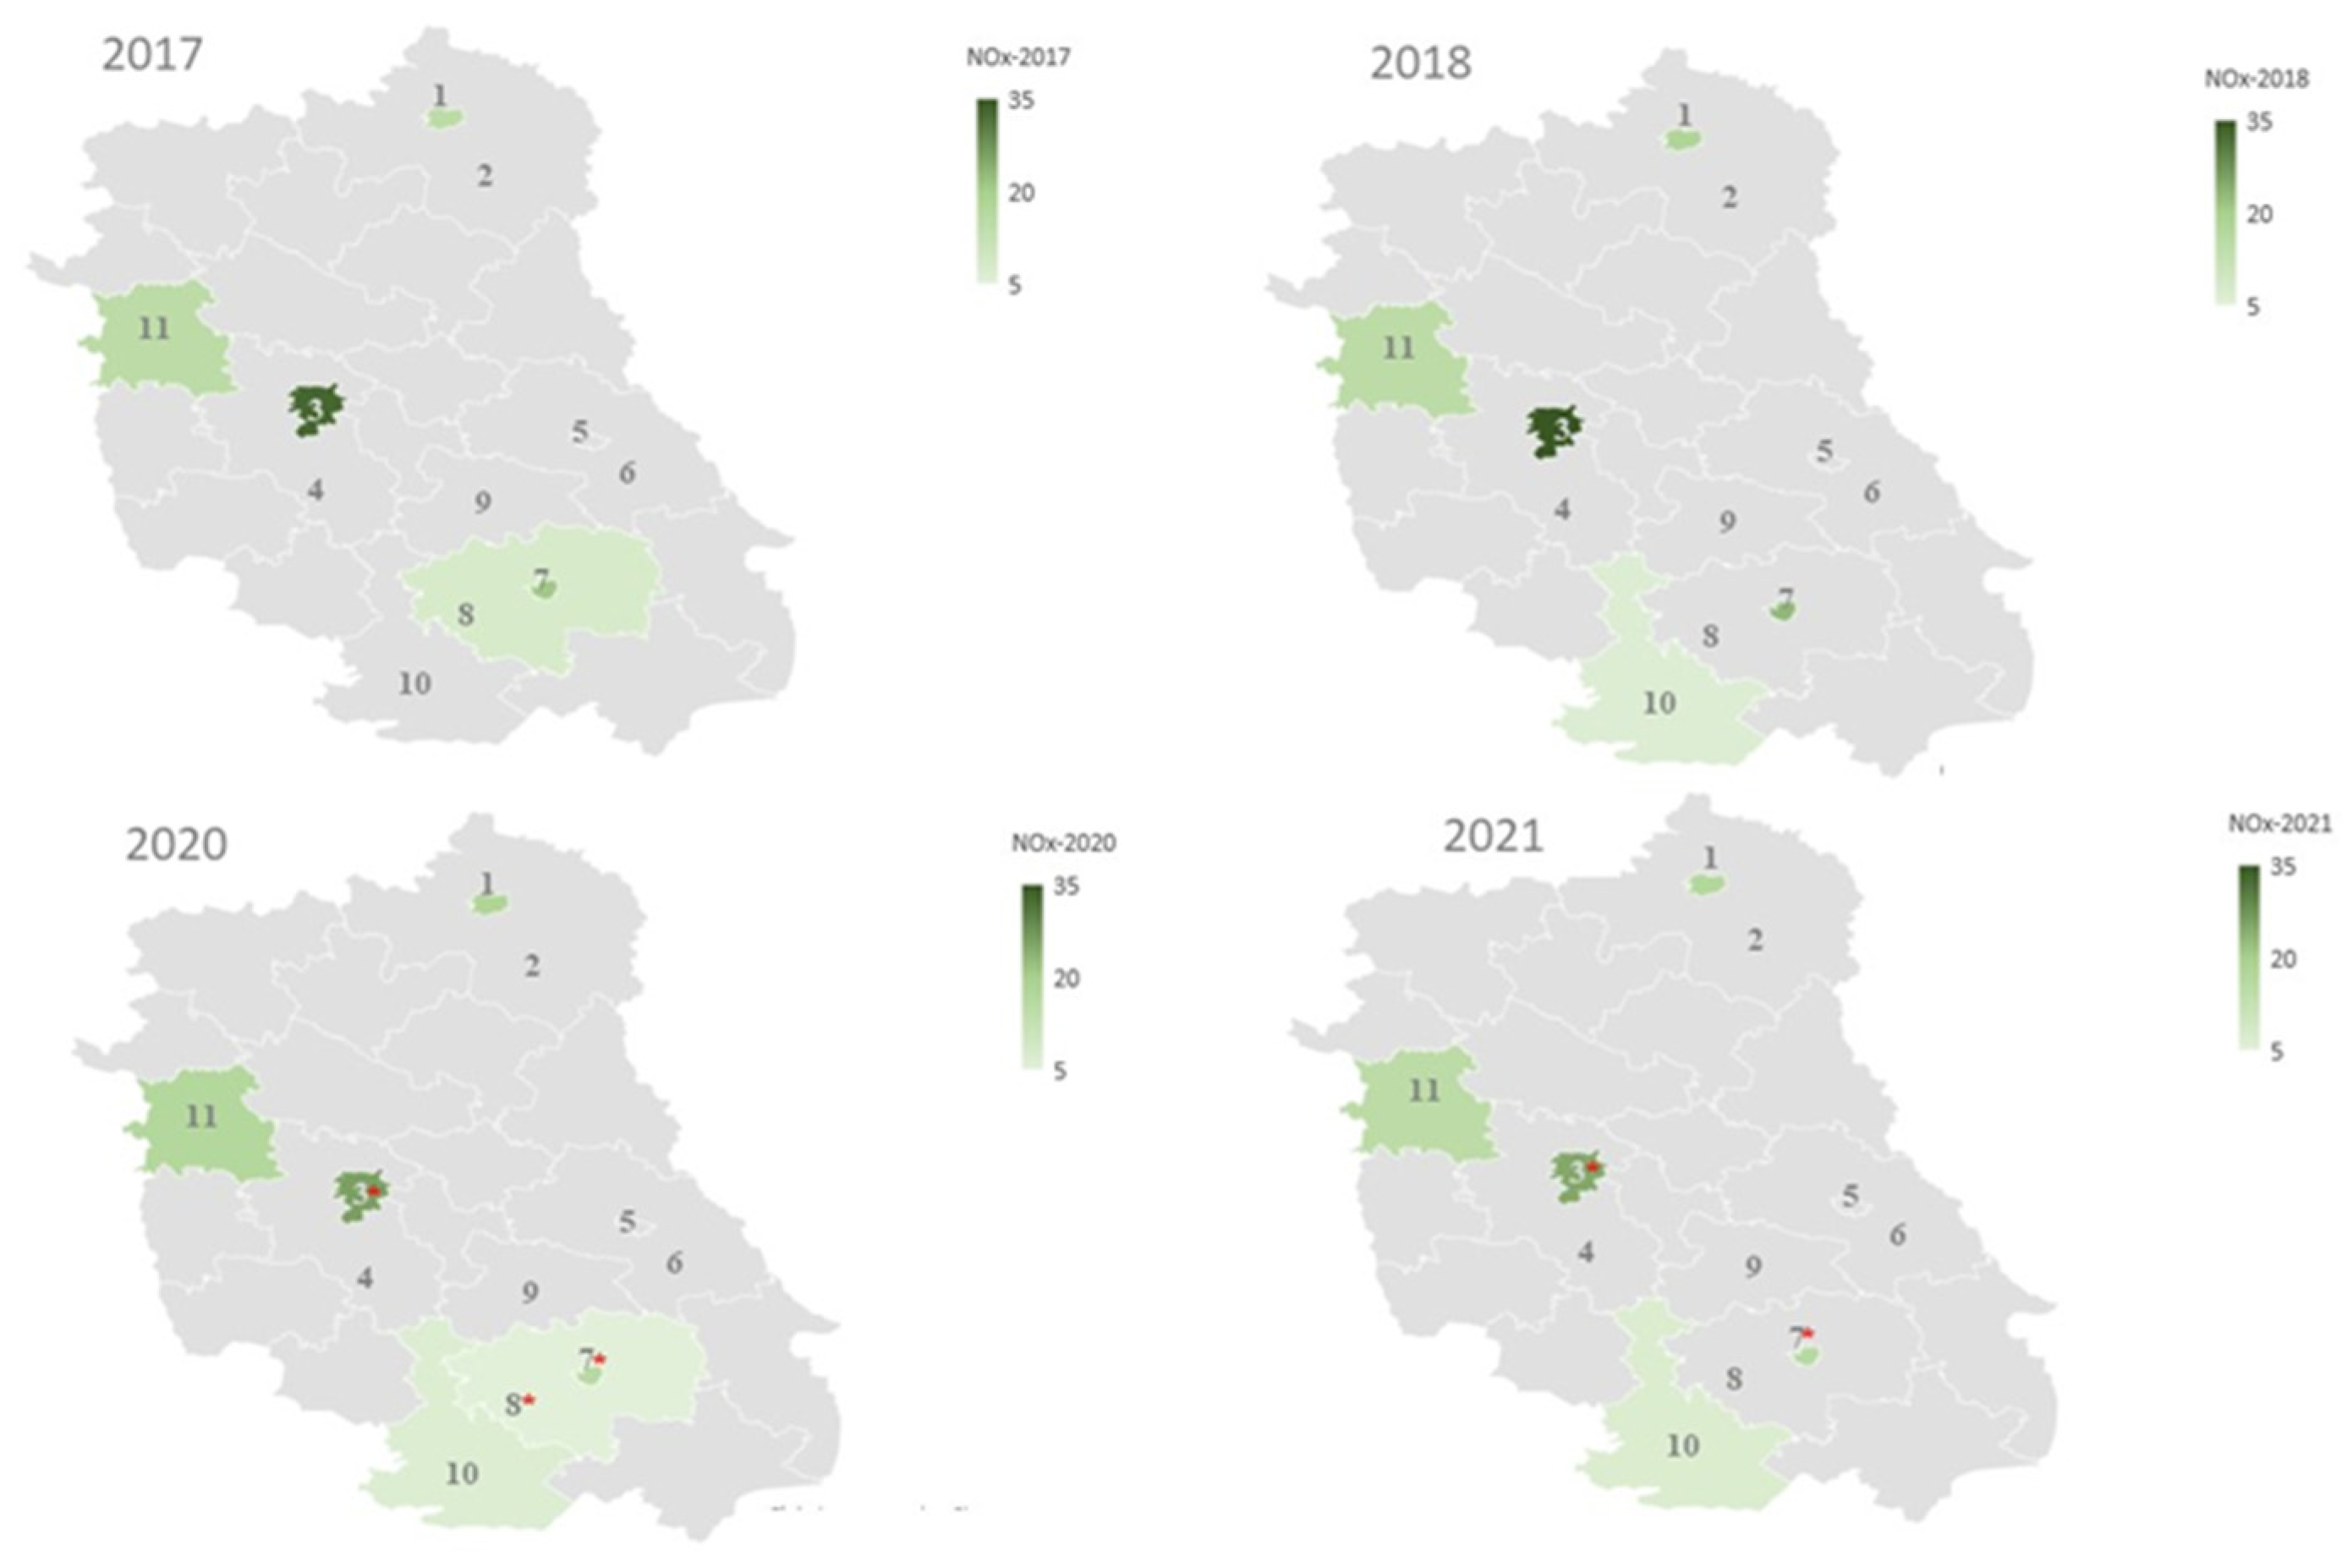
In 2017–2018 and 2020–2021, average annual NOx concentrations of approximately 20 µg/m3 were recorded at measurement points located in areas 1, 3, 7 and 11, which exceeded WHO guidelines, but remained within the norm in relation to the EU guidelines (Table 1). Additionally, in 2017 and 2020 in area 8 and in 2018, 2020 and 2021 in area 10, the average year-round NOx concentration was approximately 5 µg/m3 and was therefore at a much lower level than in other areas of the voivodeship. The highest average annual NOx concentration was recorded in area 3 in 2017–2018, when it was approximately 35 µg/m3, which is 3.5 times the current WHO guidelines, also exceededing the standards set by the EU (Table 1). In this area, the average annual NOx concentration statistically significantly decreased in 2020–2021 to approximately 20 µg/m3 (Figure 4).
Figure 4.
Changes in average NOx concentration in Lubelskie Voivodeship, Poland, between 2017–2018 and 2020–2021 [1—Biała Podlaska, 2—Biała County, 3—Lublin City, 4—Lublin County, 5—Chełm City, 6—Chełm County, 7—Zamość City, 8—Zamość County, 9—Krasnystaw County, 10—Biłgoraj County, 11—Puławski County]. The “*” symbolizes a statistically significant change compared to the previous year, established by one-way ANOVA with post hoc Tukey test (p < 0.05).
2.1.4. The Average Annual PM10 Concentration in the Lubelskie Voivodeship in the Years 2017–2018 and 2020–2021
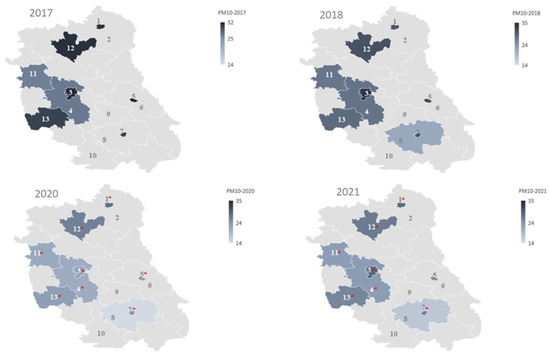
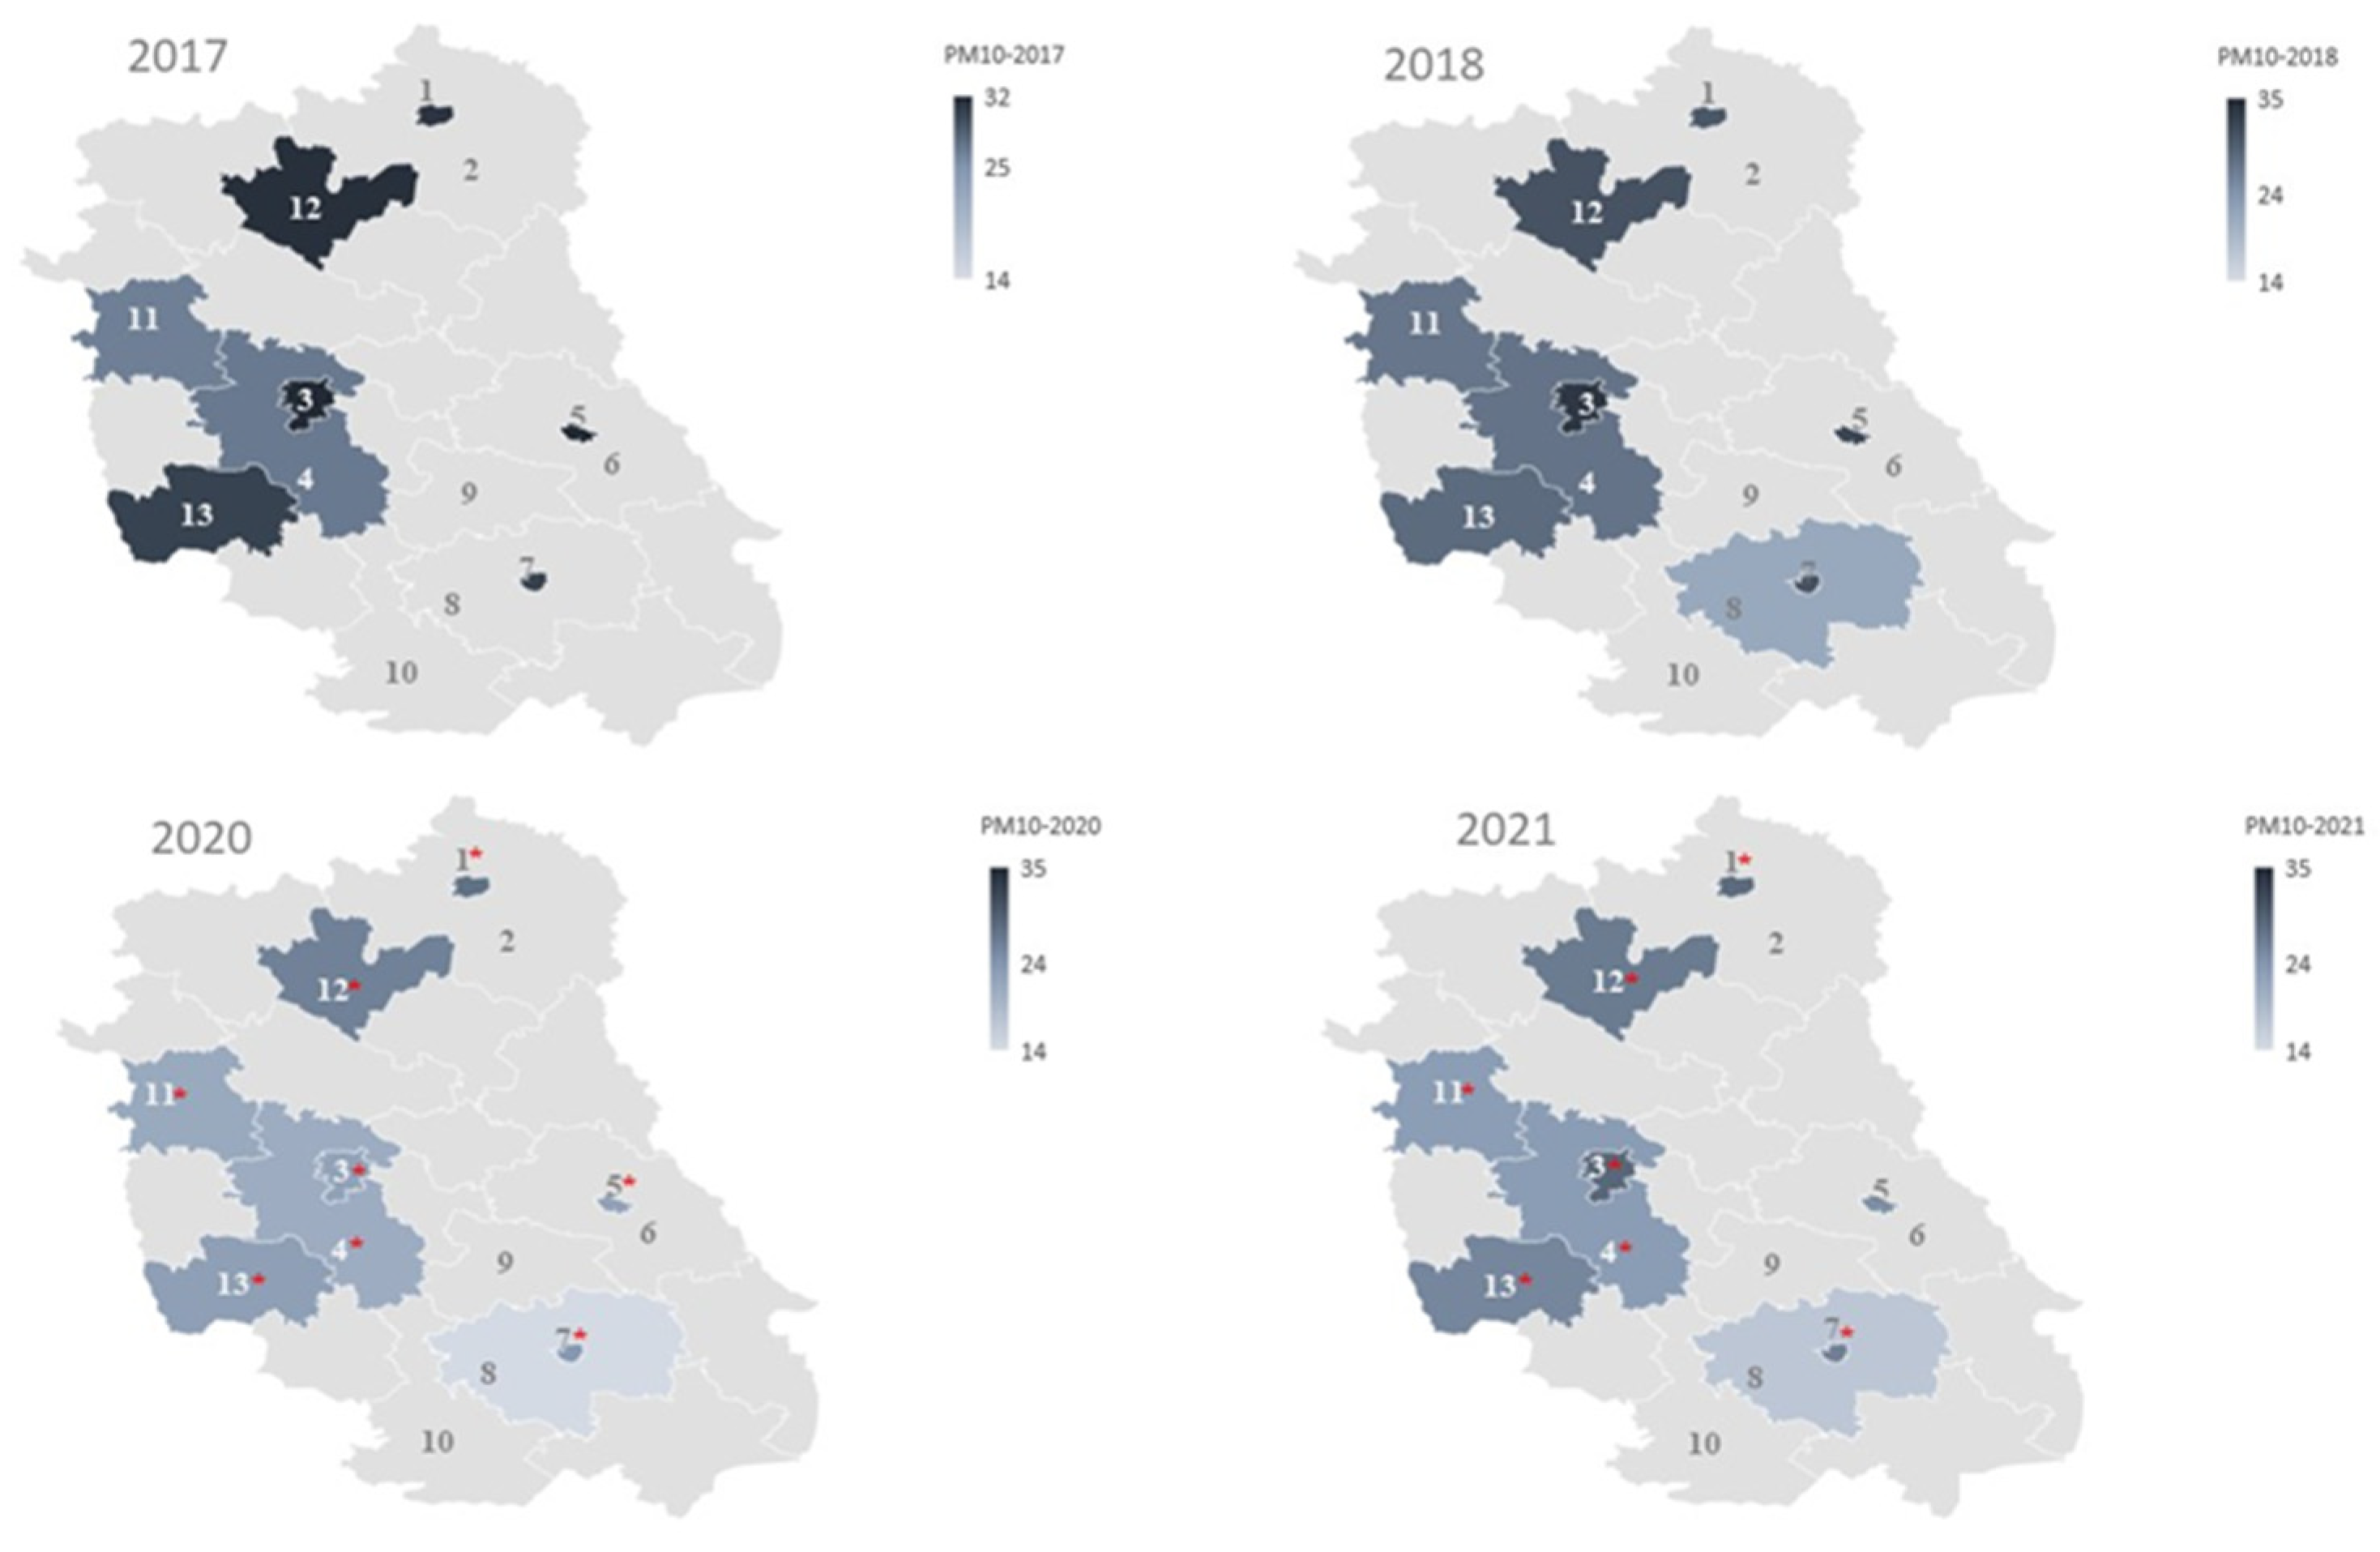
In the years 2017–2018 and 2020–2021, the average annual concentration of PM10 in areas 1, 3, 4, 5, 7, 11, 12 and 13 was around 24–35 µg/m3. These values significantly exceed the permissible standards for the maximum average annual concentration of PM10 recommended by the WHO, but remain within the norm in relation to EU guidelines (Table 1). The exception is area 8, where the measurement point was launched in 2018 and where in 2020 an average annual low-emission PM10 concentration of approximately 14 µg/m3 was recorded. Therefore, in area 8, the PM10 level remained below the standards set by the WHO and EU (Table 1). Additionally, there was a statistically significant (p < 0.05) decrease in the average annual PM10 concentration in areas 1, 3, 4, 5, 7, 11, 12 and 13 in 2020–2021 compared to 2017–2018 (Figure 5).
Figure 5.
Changes in average PM10 concentration in Lubelskie Voivodeship, Poland, between 2017–2018 and 2020–2021 [1—Biała Podlaska, 2—Biała County, 3—Lublin City, 4—Lublin County, 5—Chełm City, 6—Chełm County, 7—Zamość City, 8—Zamość County, 9—Krasnystaw County, 10—Biłgoraj County, 11—Puławy County, 12—Radzyń County, 13—Krasńik County]. The “*” symbolizes a statistically significant change compared to the previous year, established by one-way ANOVA with post hoc Tukey test (p < 0.05).
2.2. The Incidence Rate of Type 1 Diabetes in Children in the Lublin Voivodeship in 2017–2018 and 2020–2021 and Its Relationship with Contaminants
2.2.1. The Incidence Rate of Type 1 Diabetes in Children in the Lublin Voivodeship in 2017–2018 and 2020–2021
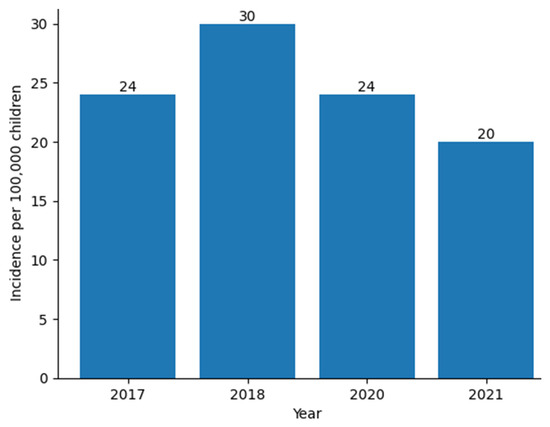
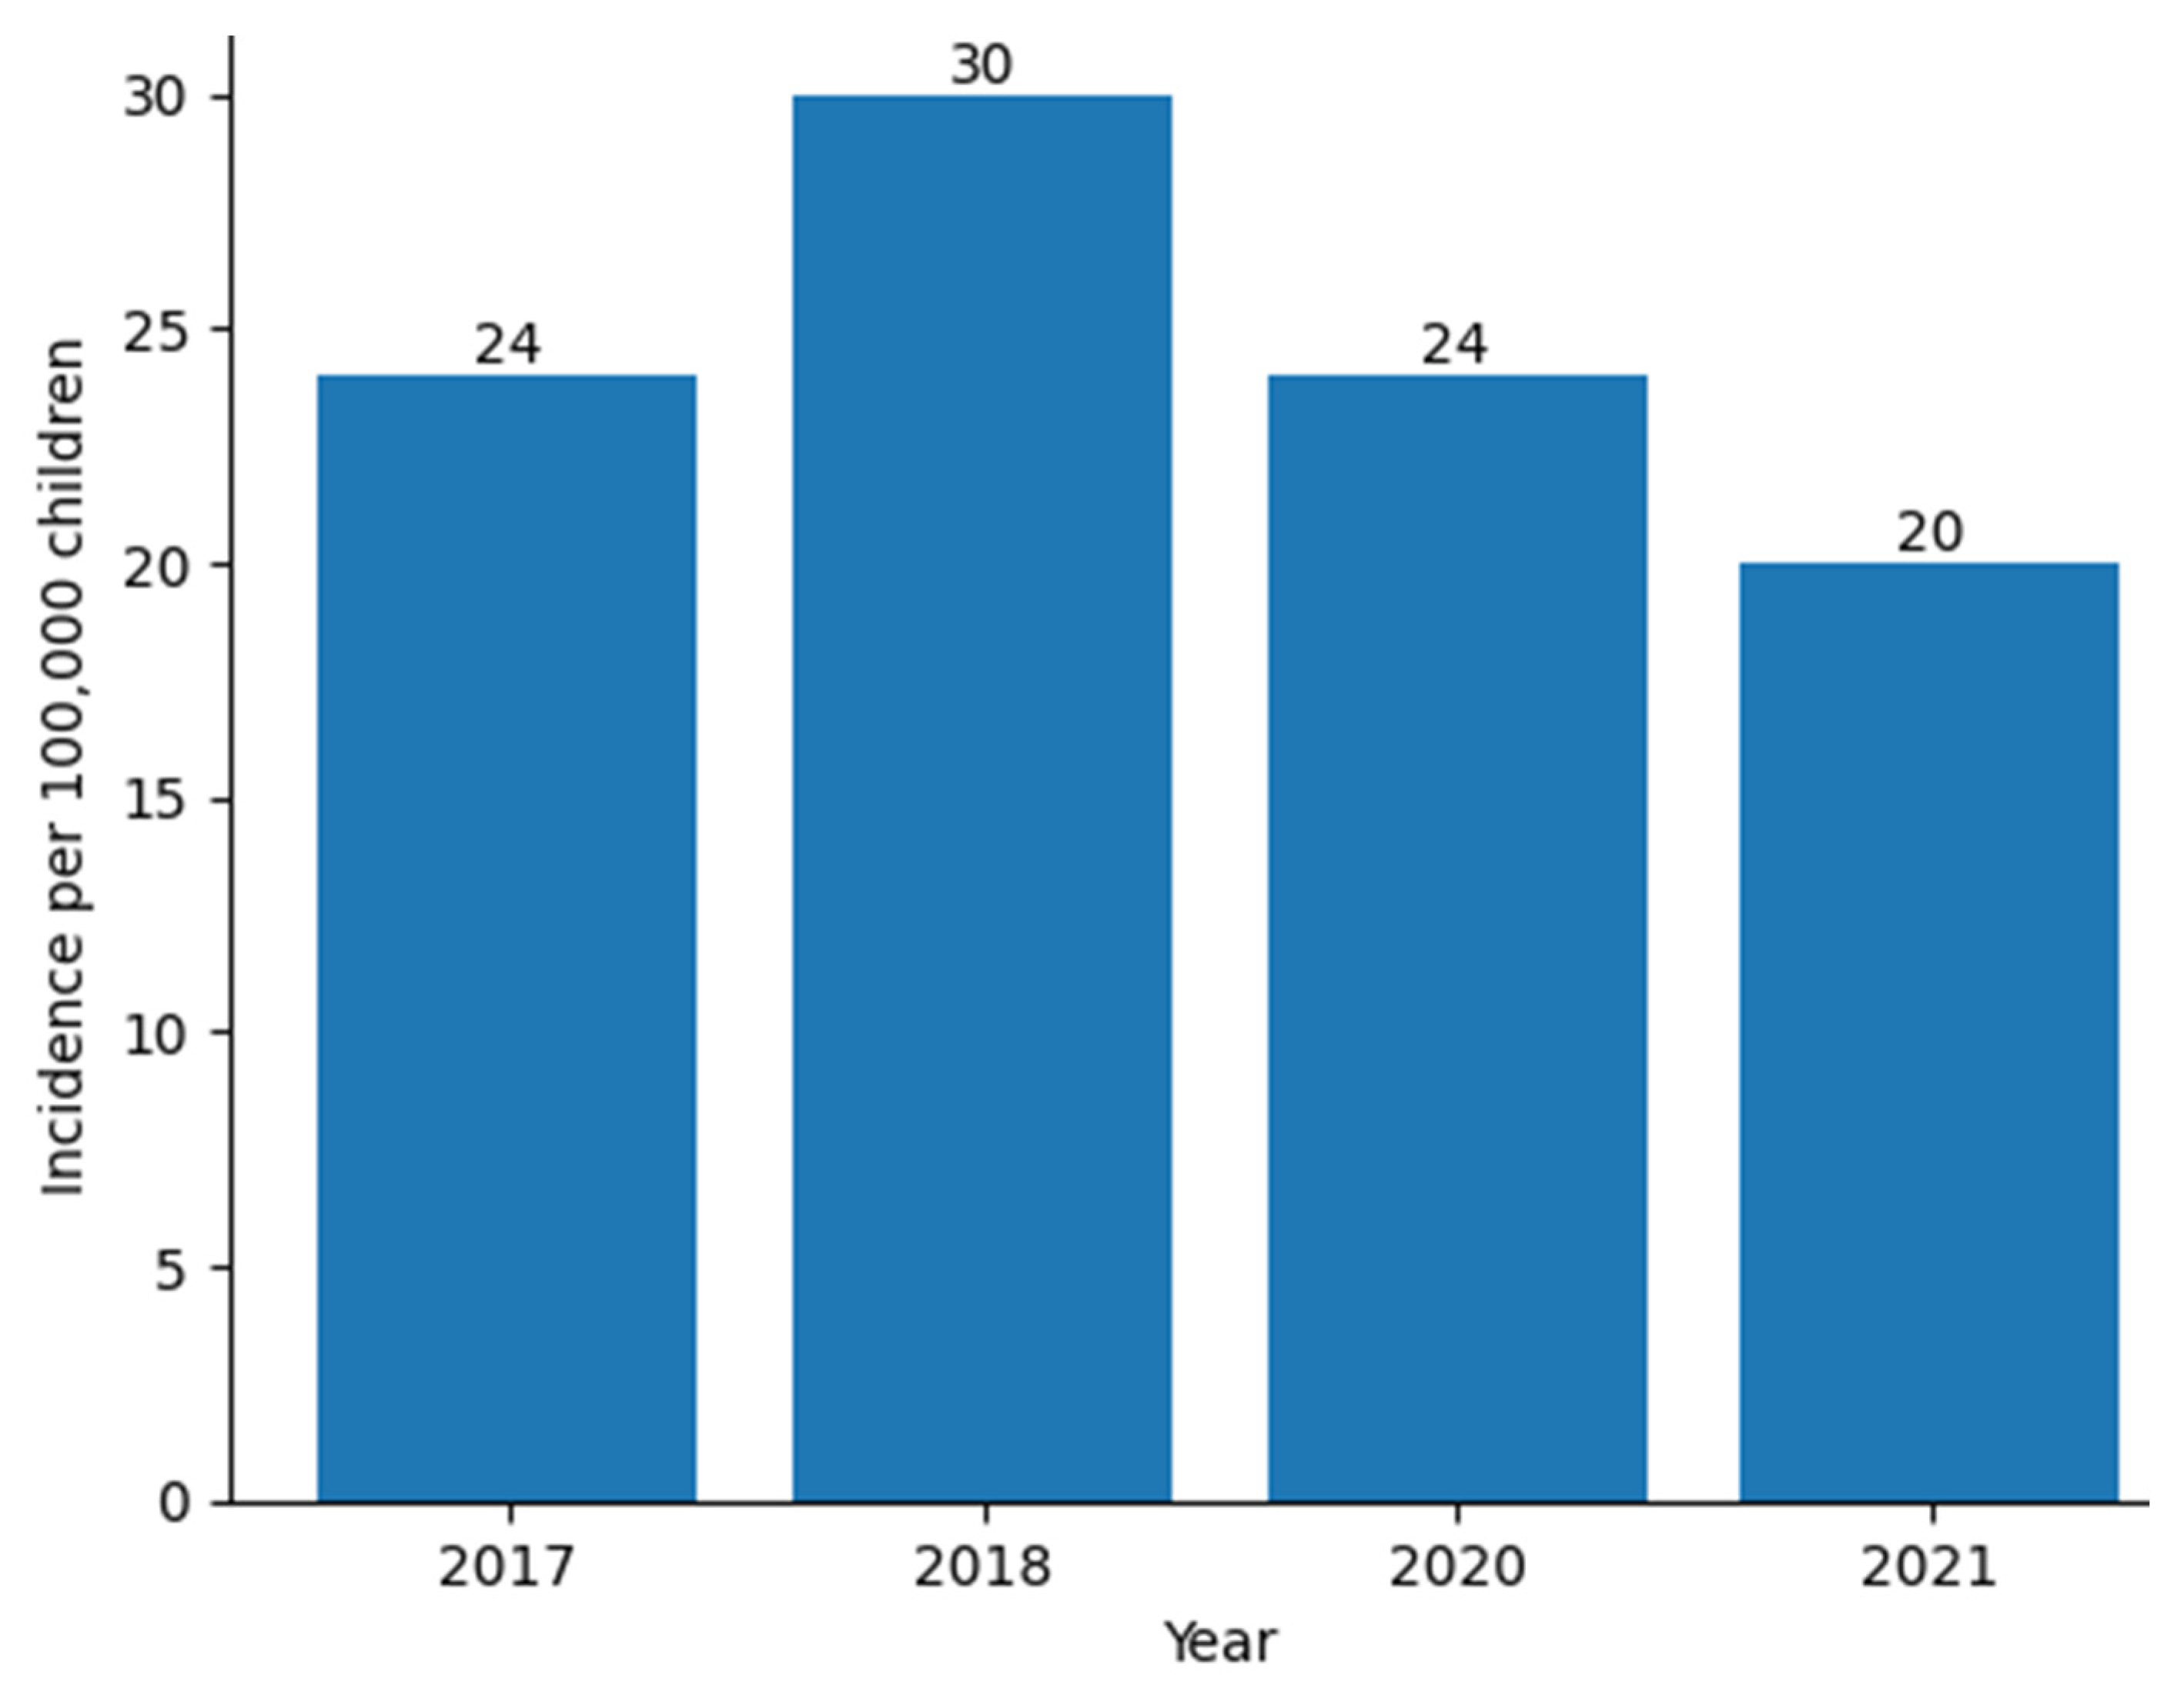
Figure 6 presents the incidence rate of type 1 diabetes in 2017 (24/100,000), 2018 (30/100,000), 2020 (24/100,000), and 2021 (20/100,000 children). The lowest incidence rate per 100,000 children of type 1 diabetes in the Lublin Voivodeship was recorded in 2021, and the highest value in 2018. However, the difference between the incidence rate in individual years, as well as pre-pandemic vs. post-pandemic years, were not statistically significant (p = 0.323 and p = 0.173, respectively).
Figure 6.
The incidence rate per 100,000 children of type 1 diabetes in the Lublin Voivodeship in 2017–2018 and 2020–2021.
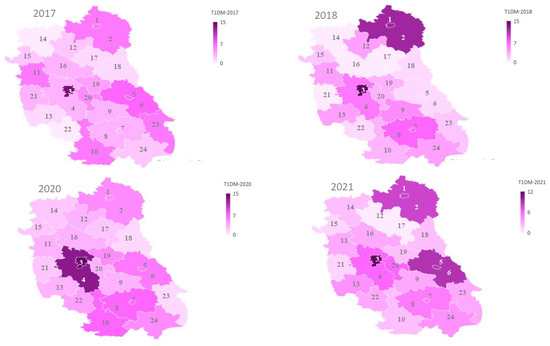
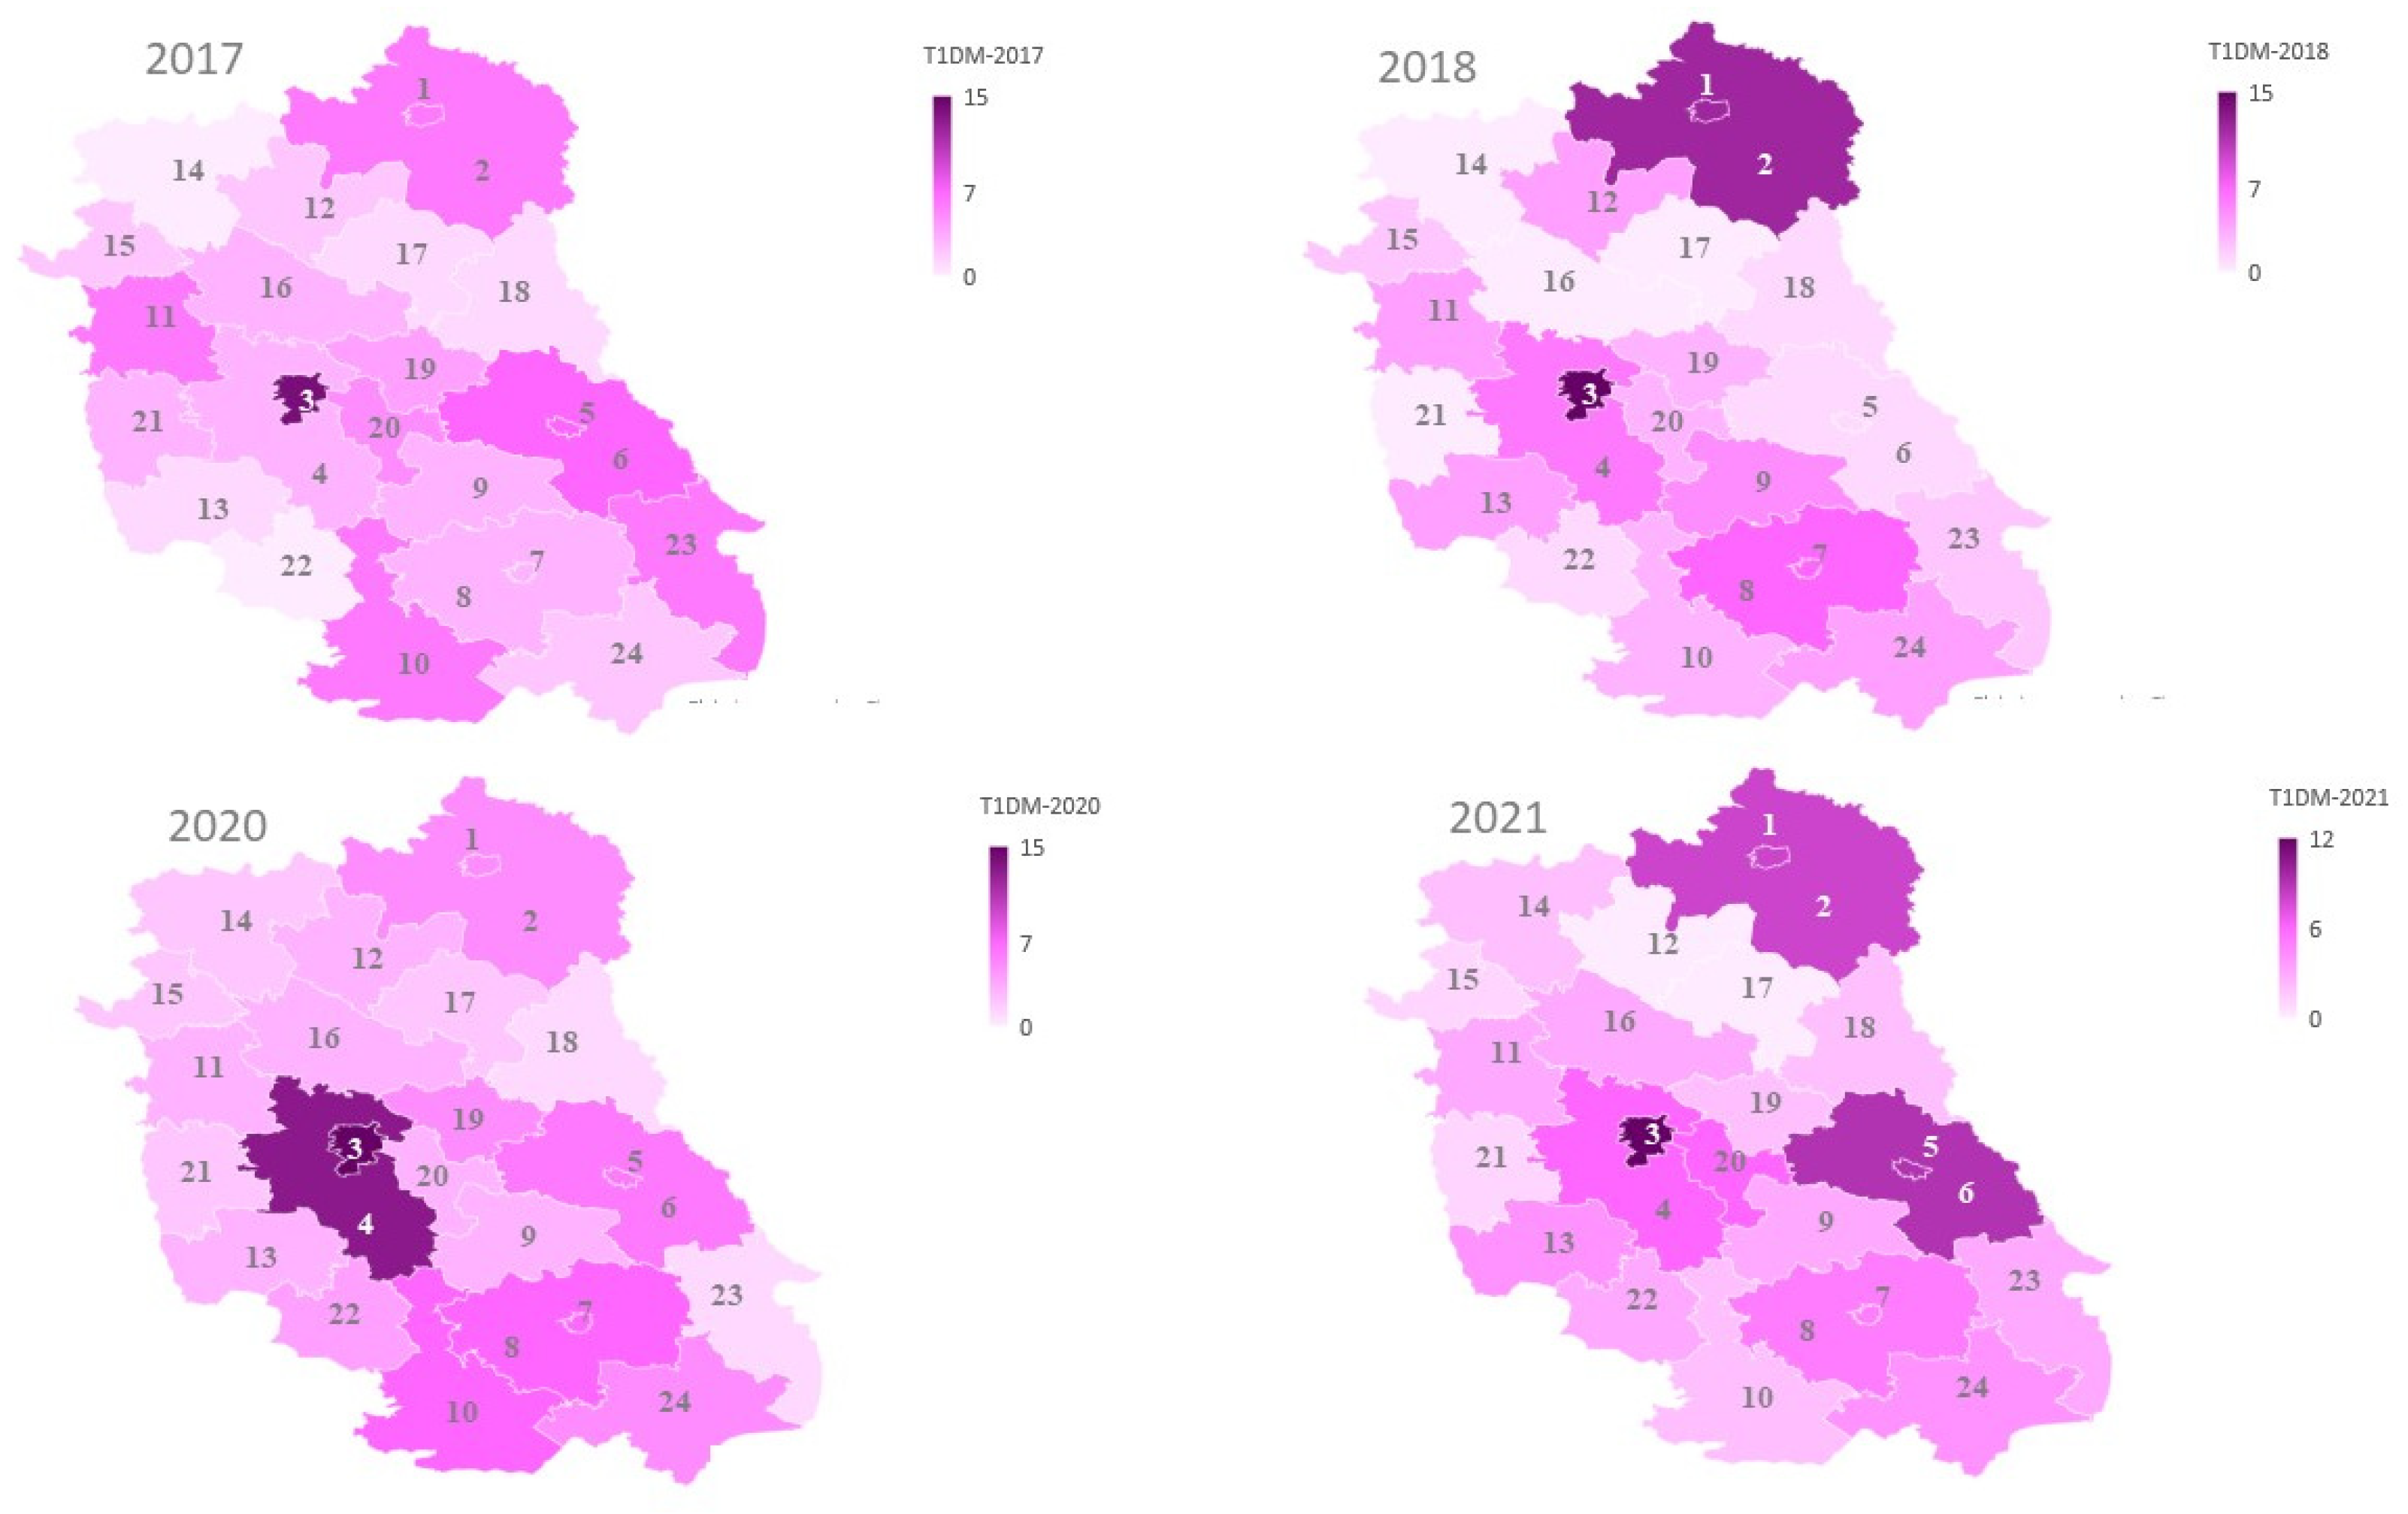
Higher numbers of newly diagnosed T1DM children were primarily recorded in more urbanized regions, particularly in the Lublin agglomeration, which may be associated with greater population density as well as increased exposure to environmental risk factors (Figure 7). In contrast, lower case numbers were observed in predominantly rural counties, suggesting possible geographic disparities in either environmental exposure or infection patterns and lifestyle differences. Overall, the spatial pattern shown in Figure 7 supports the presence of regional differences in pediatric T1DM occurrence, especially in urbanized areas, which justifies further analysis exploring potential associations with air quality indicators.
Figure 7.
The incidence rate (per 100,000 children) of type 1 diabetes in children in the Lublin Voivodeship in 2017–2021 [1—Biała Podlaska, 2—Biała County, 3—Lublin City, 4—Lublin County, 5—Chełm City, 6—Chełm County, 7—Zamość City, 8—Zamość County, 9—Krasnystaw County, 10—Biłgoraj County, 11—Puławy County, 12—Radzyń County, 13—Krasńik County, 14—Łuków County, 15—Ryki County, 16—Lubartów County, 17—Parczew County, 18—Włodawa County, 19—Łęczna County, 20—Świdnik County, 21—Opole County, 22—Janów County, 23—Hrubieszów County, 24—Tomaszów County]. The “*” symbolizes a statistically significant change compared to the previous year, established by one-way ANOVA with post hoc Tukey test (p < 0.05).
2.2.2. Relationship Between Different Contaminants and Incidence Rates of Children Diagnosed in 2017 (Table 2)
NO2 (1 h) in 2017: There is a strong positive correlation (correlation coefficient value 0.875) between the NO2 level in 2017 and the incidence rate of children diagnosed with type 1 diabetes in the same year. The p-value (p < 0.05) indicates that this correlation is statistically significant. This suggests that higher NO2 levels in 2017 were associated with more children diagnosed with type 1 diabetes that year. Overall, the analysis indicates a strong positive correlation between NO2 and the incidence rates of children diagnosed with type 1 diabetes, which suggests that higher NO2 levels may be associated with an increased incidence of this disease.
PM2.5 in 2017: There is a strong positive correlation (correlation coefficient value 0.816) between the PM2.5 level in 2017 and the incidence rates of children diagnosed with T1DM in the same year. The p-value (p < 0.05) indicates that this correlation is statistically significant. This suggests that higher PM2.5 levels in 2017 were associated with more children diagnosed with type 1 diabetes that year. Overall, the analysis shows a strong positive correlation between PM2.5 and the incidence rate of children diagnosed with diabetes type 1, suggesting that higher levels of PM2.5 may be associated with an increased incidence of this disease.
Table 2.
Relationship between different contaminants and incidence rate of children diagnosed in 2017.
2.2.3. Relationship Between Different Contaminants and Incidence Rate of Children Diagnosed in 2018 (Table 3)
NO2 (1 h) in 2018: There is a very strong positive correlation (correlation coefficient of 0.878) between NO2 (nitrogen dioxide) levels and the incidence rate of children diagnosed with type 1 diabetes (T1DM). Additionally, the p-value (p < 0.05) indicates that this correlation is statistically significant. This means that in 2018, higher levels of NO2 were associated with a higher incidence rate of children being diagnosed with type 1 diabetes. The statistically significant correlation suggests that the relationship between NO2 exposure and the incidence of type 1 diabetes in children is unlikely to be due to chance and is worthy of further investigation.
PM2.5 in 2018: There is a very strong positive correlation (correlation coefficient of 0.571) between the PM2.5 level and the incidence rate of children diagnosed with T1DM. Additionally, the p-value (p < 0.05) indicates that this correlation is statistically significant. This means that in 2018, higher PM2.5 levels were associated with more children diagnosed with type 1 diabetes.
Table 3.
Relationship between different contaminants and incidence rate of children diagnosed in 2018 (Table 3).
2.2.4. Relationship Between Different Contaminants and Incidence Rates of Children Diagnosed in 2020 (Table 4)
NO2 (1 h) in 2020: The p-value is greater than 0.05, which indicates that the correlation between NO2 level and the incidence rate of children diagnosed with type 1 diabetes is not statistically significant. This means that as NO2 air pollution decreased, there was no longer a relationship between the occurrence of NO2 and the incidence rate of T1DM.
PM2.5 in 2020: The p-value is greater than 0.05, which indicates that the correlation between the PM2.5 level and the incidence rate of children diagnosed with type 1 diabetes is not statistically significant. This means that as PM2.5 air pollution decreased, there was no longer a relationship between the occurrence of PM2.5 and the incidence rate of T1DM.
Table 4.
Relationship between different contaminants and incidence rate of children diagnosed in 2020.
2.2.5. Relationship Between Different Contaminants and Incidence Rates of Children Diagnosed in 2021 (Table 5)
NO2 (1 h) in 2021: The p-value is greater than 0.05, which indicates that the correlation between the NO2 level and the incidence rate of children diagnosed with type 1 diabetes (T1DM) is not statistically significant.
PM2.5 (1 h) in 2021: The p-value is greater than 0.05, which indicates that the correlation between the PM2.5 level and the incidence rate of children diagnosed with type 1 diabetes (T1DM) is not statistically significant.
Table 5.
Relationship between different contaminants and incidence rates of children diagnosed in 2021.
2.2.6. General Comparison of Data Before and After the Introduction of COVID-19 Restrictions
Before the introduction of COVID-19 restrictions, there were strong and statistically significant positive correlations between NO2 levels and the incidence rate of children diagnosed with T1DM both in 2017 and 2018 (Table 2 and Table 3). After the introduction of COVID-19 restrictions (2020 and 2021), correlations between NO2 levels and the occurrence of type 1 diabetes weakened and were not statistically significant (Table 4 and Table 5).
Weaker correlations in 2020–2021 suggest that the association between NO2 and PM2.5 exposure and type 1 diabetes in children may have changed or become less apparent during the pandemic years.
3. Discussion
The key result of our research is the detection of a statistically significant positive correlation between NO2 and PM2.5 concentrations and the occurrence of type 1 diabetes in children in the Lublin Voivodeship in 2017 and 2018. Interestingly, no such statistically significant correlation was found between NO2 and PM2.5 and the occurrence of type 1 diabetes in children in 2020 and 2021. The particulate matter fractions (PM2.5 and PM10) frequently originate from similar sources; however, we believe that the shift is due to the substantial changes in emission patterns that have occurred in Poland in recent years. Beginning in 2018, the nationwide air quality improvement program “Czyste Powietrze” (“Clean Air”)—https://czystepowietrze.gov.pl/ (accessed on 15 November 2023)—introduced large-scale financial support for the replacement of outdated coal-fired residential heating systems and for building thermal modernization. Depending on household income, subsidies covered approximately 40% to 100% of eligible costs, supporting the installation of cleaner heat sources such as heat pumps, gas condensing boilers, and pellet boilers, as well as insulation improvements. Because residential solid-fuel combustion is a major contributor to fine particulate matter, these interventions likely reduced PM2.5 concentrations independently of nitrogen oxide levels [19,26,30]. Nitrogen oxides (NOx), in contrast, are more strongly associated with traffic emissions [22,31,32,33]. Furthermore, during 2020–2021 the COVID-19 pandemic substantially altered mobility patterns, industrial activity, and energy demand. Temporary reductions in road traffic, together with fluctuations in sectors such as mining, smelting, and cement production, may have modified the relative contributions of major emission sources [34,35,36,37,38,39]. Therefore, the relationship identified in 2017 should be interpreted as reflecting an evolving emission profile rather than a data inconsistency. The obtained results partially support our previous research [30], which showed that there is a correlation between the average annual PM2.5 concentration and the T1DM incidence rate in children in the Lublin Voivodeship but in the years 2015–2016. Moreover, Mozafarian et al., in a 2022 meta-analysis, also showed a relationship between exposure to PM2.5 and the incidence of T1DM [18]. Thus, we confirm the hypothesis that selected chemical compounds present in polluted air may contribute to the risk of developing type 1 diabetes.
Oxidative stress is identified as a key factor in both metabolic dysfunction and the effects of air pollution exposure, especially from fossil fuel combustion products, providing a plausible mechanism for air pollution–T1DM associations [31]. A single study done in Sweden found that maternal exposure to NOx during the third trimester of pregnancy and to O3 during the second trimester were associated with offspring risk of developing T1DM, after controlling for genetic predisposition [32]. Additionally, in Belgium, exposure to particulate matter air pollution, but not NO2, during pregnancy was associated with increased levels of cord plasma insulin at birth among 590 newborns, suggesting that prenatal exposure could increase the risk of cardiometabolic dysfunction later in life [33].
In the years 2017–2018 and 2020–2021, the average annual SO2 concentration was recorded at a level below 10 µg/m3 in the Lublin Voivodeship. Comparing the above data with WHO recommendations in 2017–2018 and 2020–2021, SO2 standards were not exceeded in any area. Moreover, our study did not demonstrate a significant correlation between SO2 concentration and the incidence rates of new cases of T1DM among children and adolescents of the Lublin Voivodeship.
This is consistent with the work of Mozafarian et al. in 2022, who also pointed out the probable lack of influence of SO2 on the incidence of type 1 diabetes [18]. However, this contradicts the results of a study done in the Pomeranian Voivodeship in 2016, which showed a possible influence of SO2 on the development of T1DM, with a similar average annual concentration of SO2 in the air. In these studies, the regression coefficient of the average annual SO2 concentration and the incidence rate of new cases of T1DM was 2.294 and was statistically significant (p < 0.05) [28]. It can be suggested that in Poland, SO2 air pollution is decreasing every year, which is why in the years 2017–2028 and 2020–2021, no relationship was detected between SO2 and the incidence rate of new cases of type 1 diabetes among children and adolescents. Additionally, several factors may explain these discrepancies between studies. Regional differences in emission sources and overall pollutant mixtures may influence biological responses, as SO2 rarely occurs in isolation but rather as part of complex exposure profiles. Second, the relatively low SO2 concentrations observed in the Lubelskie Voivodeship may have fallen below a threshold necessary to produce measurable health effects. Also, methodological differences—including exposure assessment strategies, spatial resolution of monitoring data, and the extent of confounder control—may contribute to variability across studies. Lastly, statistical power should be considered. Ecological analyses conducted in regions with lower pollutant variability may be less likely to detect significant associations. Therefore, the absence of a relationship in our study should be interpreted cautiously and does not exclude a potential effect under different environmental conditions.
In the available literature the attention is drawn to a decrease in the level of air pollution as a result of the introduction of pandemic restrictions [34,35,36,37,38]. During the lockdown phases, significant reductions in air pollution were observed, including decreases in PM2.5 by up to 93%, PM10 by 83%, and NO2 levels, which contributed to improved air quality and potentially mitigated COVID-19 mortality rates [34]. In 2020, Manchester saw a 44% decrease in PM10 and a 60% decrease in NO2 compared to 2018/2019 [35]. In 30 European countries, such as France, Italy, Spain and the UK, air pollution decreased; for example, SOx decreased by 7%, PM2.5 decreased by 7%, and NOx decreased by 33% [33]. The decrease in NOx resulted in a significant reduction in NO2 levels of 20–50% not only in Europe but also in Asia, including China [34,35,36,37]. In the study of Skiriené et al. in 2021 the summarized results of changes in air quality during the COVID-19 pandemic in the United Kingdom, Spain, Sweden, Italy and France showed that transport and industry restrictions related to the lockdown resulted in a level reductions of approximately 20–40% of NO2, PM2.5 and PM10 [36].
Our research results confirm the above data. Interestingly, our study did not demonstrate a statistically significant correlation between NO2 and PM2.5 concentrations and the occurrence of type 1 diabetes in children in 2020 and 2021, i.e., during the period of restrictions related to the SARS-CoV-2 pandemic, compared to 2017–2018. Our study is consistent with these data, because at the time when pandemic restrictions were introduced, a decrease in NO2, PM2.5 and PM10 pollution was observed at most measurement points in the Lublin Voivodeship. The level of PM particles decreased to a lesser extent, as it was influenced by the changing meteorological situation, agricultural activities and reduced emissions related to road transport and especially aviation [38,39].
So far, it has not been possible to determine the exact pathomechanism of how air pollution contributes to the development of numerous diseases. During in vivo and in vitro studies, it was noticed that even short-term exposure to air pollution may trigger an inflammatory reaction in the human body. Chemical substances contained in air pollution have the ability to enter the circulatory system [14]. Moreover, it has been shown that macrophages capture pollutant particles and present them to T lymphocytes, thus triggering an immune response in organs distant from the respiratory system, which is the main route of entry of air pollutants into the human body [40,41]. It is also known that patients with T1DM experience low-grade inflammation, which escalates over time and contributes to the development of chronic complications of T1DM [40,41,42,43]. Given the long latency and complex autoimmune mechanisms underlying T1DM, temporality should be carefully considered when interpreting associations between environmental exposures and disease onset.
The study of Pan et al. [15] in 2020 showed that the increase in the risk of diabetic retinopathy (DR) is statistically significantly correlated with each 10 µg/m3 increase in PM2.5 and PM10 concentration. It was estimated that in patients with diabetes and high exposure to the indicated air pollutants, the risk of DR increases by approximately 30% [15].
So far, research on the impact of air pollution on type 1 diabetes is limited; however, currently available results confirm our hypothesis that pollution can be one of the factors influencing the development of T1DM.
In some countries, an impact of increased air pollution on the increase in the incidence of T1DM among children has been noticed. The reason indicated was disruption of the functioning of the endocrine system by toxic substances present in the inhaled air [43,44].
Howard, in his study in 2018, indicates that the problem is that not only the exposure of the child in postnatal life but also the exposure of the child in prenatal life and its mother to air pollution have a significant impact on the subsequent development of T1DM, obesity and T2DM. Inhaled air pollutants may enter the bloodstream and enter the fetal bloodstream through the placenta, which may be delivered, for example, to the pancreas of the unborn child [43].
Our study examined the correlation between air pollutants such as NO2, PM2.5, SO2 and PM10 and the occurrence of new cases of T1DM. The selection of the assessed types of pollutants depended on the number of results available from measurement points in the Lublin Voivodeship in the years covered by the study. Based on the results obtained, it was concluded that exposure to PM2.5 and NOx may be a risk factor for T1DM in children. It is in the case of these particles that the strongest correlation with the occurrence of new cases of T1DM in the Lublin Voivodeship was observed. Overall, the present study identified a statistically significant positive association between PM2.5 concentrations and T1DM incidence in the pre-pandemic years, supporting the growing body of evidence linking fine-particulate-matter exposure to autoimmune and metabolic disorders. This observation is consistent with our previous regional analysis as well as with the meta-analysis by Mozafarian et al., both of which reported an increased risk of type 1 diabetes associated with higher PM2.5 exposure [18]. The convergence of findings across studies strengthens the plausibility of this relationship, particularly given the well-documented biological mechanisms through which fine particulate matter may influence immune regulation [40,41,42,43].
However, further research covering a larger area is needed to confirm our conclusions. Other authors have shown that air pollution may be a significant modifiable risk factor for respiratory disease exacerbations in the Lublin Voivodeship [45,46,47]. Therefore, the voivodeship government and the community should make every effort to reduce air pollution.
Nevertheless, some variability in reported effect sizes across studies should be expected. Differences in pollutant composition, urbanization levels, exposure assessment methods, and the degree of adjustment for socioeconomic or environmental confounders may influence the magnitude of observed associations. Additionally, ecological designs, including the present study, capture population-level exposure rather than individual risk, which may attenuate detectable relationships.
Interestingly, the absence of a significant association during the pandemic period may reflect the combined effects of reduced emissions, altered mobility patterns, and broader behavioral changes rather than a true disappearance of the underlying environmental risk. Consequently, the observed temporal variation should be interpreted cautiously. Overall, our findings contribute to accumulating evidence suggesting that PM2.5 exposure may represent a modifiable environmental factor involved in the complex etiology of type 1 diabetes, although causal inference requires confirmation in longitudinal studies with individual-level exposure assessment.
An important question arising from our findings is why significant associations were observed for PM2.5 and NO2, whereas no relationship was detected for SO2 unlike previous studies [18]. One possible explanation relates to differences in toxicological properties and biological activity among pollutants. Fine particulate matter and nitrogen dioxide are strongly linked to traffic-related emissions and urban combustion processes, which generate complex pollutant mixtures rich in reactive components capable of inducing oxidative stress and systemic inflammation. These processes have been implicated in immune dysregulation and may contribute to pancreatic β-cell vulnerability.
In contrast, the relatively low SO2 concentrations recorded in the study region may have been insufficient to trigger measurable systemic effects. Moreover, SO2 is often considered a marker of specific industrial sources rather than a component of multipollutant urban exposure, potentially limiting its utility as an indicator of biologically relevant pollutant mixtures in this population. Therefore, the absence of an association in our study does not necessarily imply a lack of biological effect but may instead reflect differences in exposure intensity and pollutant composition.
The attenuation of associations during the pandemic period also warrants consideration. Reductions in traffic volume and industrial activity likely altered not only pollutant concentrations but also the chemical composition of airborne particles [37,38,39]. Additionally, behavioral shifts, reduced healthcare utilization, and changes in infection patterns during the restriction period may have influenced both exposure profiles and disease detection. Together, these factors suggest that the temporal variability observed in our study should be interpreted within the broader context of complex environmental and societal changes.
Future studies should employ designs that enable more control of confounding variables. Prospective cohort studies or well-designed case–control investigations incorporating individual-level exposure assessment, genetic susceptibility, socioeconomic indicators, early-life factors, and healthcare access would provide stronger evidence regarding the relationship between air pollution and type 1 diabetes.
4. Limitations
The development of type 1 diabetes is influenced by a complex interplay of genetic susceptibility and environmental exposures [20,48,49]. Several important variables that may be associated with both air pollution levels and T1DM incidence were not accessible to be accounted for in this ecological analysis. These include genetic predisposition, frequency of viral infections, socioeconomic status, vitamin D levels, early-life nutrition, and other environmental exposures [2,7,27,50,51].
For example, urbanized areas may exhibit higher air pollution while also differing in infection patterns and lifestyle characteristics compared to less polluted regions [52]. Such factors could partially explain the observed associations. Consequently, residual confounding cannot be excluded, and the results should be interpreted with caution.
The researchers working on this study are also aware that during the pandemic, the incidence of T1DM may have been influenced not only by air pollution, but also by greater exposure to COVID-19 infection. As is known, viral infections are one of the most important factors triggering changes in the human body leading to T1DM [53,54,55,56]. However, the results of studies on the impact of the pandemic and the COVID-19 virus on the incidence of T1DM remain unclear. There are studies highlighting the increase in the incidence of type 1 among children during the COVID-19 pandemic [12,57]. The biggest change was noticed around February and March 2020, i.e., the first wave of COVID-19 in Poland, and around October at the beginning of the second wave of COVID-19 in Poland [12]. Moreover, the same study noted that during the COVID-19 pandemic there was an increase in cases of more severe type 1 diabetes and a more frequent occurrence of severe complications of this disease in the form of ketoacidosis [12]. Due to its ecological design, the analysis was based on aggregated data rather than individual exposure histories. Consequently, the results are subject to ecological fallacy, meaning that associations observed at the population level cannot be assumed to reflect causal relationships at the individual level. Further individual-level studies are required to confirm these associations.
Another important limitation relates to the exposure assessment. The study used annual average pollutant concentrations at the county level as a proxy for exposure, which does not capture spatial heterogeneity within counties. Air pollution levels may differ considerably between urban centers and rural areas, as well as in proximity to major roads or industrial sources. Furthermore, individual exposure can vary depending on residential location, daily mobility, school environment, and time spent indoors versus outdoors. Consequently, the use of aggregated regional data may have resulted in exposure misclassification. Future research should incorporate higher-resolution exposure assessment methods, such as spatial modeling or geocoded residential data, to provide more accurate estimates of individual exposure. Additionally, a serious problem in the Lublin Voivodeship is exposure to benzoapyrene suspended in the air; however, due to the insufficient number of measurement stations and data regarding this substance, benzoapyrene was excluded from this study. T1DM develops over an extended period, and environmental factors may exert their greatest influence during sensitive developmental stages, including the prenatal period, infancy, and early childhood. In the present study, exposure was estimated using annual average pollutant concentrations in the years closest to diagnosis, which may not adequately represent earlier exposures that could have contributed to disease initiation. Previous studies have suggested that prenatal exposure to air pollution may influence the risk of developing T1DM, underscoring the importance of temporality when evaluating environmental determinants of the disease [32,33]. Future research should incorporate longitudinal designs with time-specific exposure assessment to better identify etiologically relevant windows of susceptibility.
5. Materials and Methods
5.1. Geographical Location of the Lubelskie Voivodeship
Lubelskie Voivodeship (51°15′00″ N, 22°34′00″ E) is located in the east of Poland, between the Vistula and Bug rivers. It borders Ukraine and Belarus to the east, the Podkarpackie Voivodeship to the south, the Świętokrzyskie and Mazowieckie Voivodeships to the west, and the Mazowieckie and Podlaskie Voivodeships to the north. In the territory of the voivodeship there are 4 cities with county rights and 20 counties (Table 6), of which there are 4 statistical sub-regions (according to the Central Statistical Office, Poland) in accordance with the NUTS standard of the European Union: the Lublin sub-region, the Biala sub-region, the Chelmsko-Zamojski sub-region and the Pulawy sub-region. The Lubelskie Voivodeship is mostly an agricultural region, and therefore the cultivation of cereals, sugar beets, potatoes, tobacco and hops dominates there. In addition, the region is known for its dairy industry and fruit and vegetable processing. Hard coal is mined in the Lublin region, which plays an important role in its economy, and raw materials such as chalk, limestone and clay are also available the. In the Lubelskie Voivodeship there are also industrial plants producing nitrogenous fertilizers and enterprises producing components for transport and construction machinery. There is a combined heat and power plant in the Lublin area, which is the largest generator of electricity and heat in the region [58,59,60,61,62].
Table 6.
Division of the territory of the Lubelskie Voivodeship, designation of individual counties on the map and lists of individual pollutants analyzed in each county.
5.2. Exposure Assessment
Annual average data on the concentrations of nitrogen dioxide (NO2), nitrogen oxides, (NOx), sulfur dioxide (SO2), particulate matter, and particles with a diameter of 10 μm or less (PM10), as well as the average 24 h PM2.5 concentration, were obtained from the Annual Air Quality Assessment 2017–2018 and 2020–2021, a report provided by the Office for Annual Air Quality Assessment for 2017–2018 and 2020–2021, made available by the Voivodship Inspectorate for Environmental Protection (WIOS) in Lublin [58,59,60,61]. Measurements of concentrations of atmospheric air pollutants in the Lubelskie Voivodeship were performed using automatic and manual methods. In order to create baseline values, PM10 absorbance and NOx concentrations were measured at measurement points for a total of 4 years, in the periods from 1 January 2017 to 31 December 2018 and from 1 January 2020 to 31 December 2021. The years taken for this study was chosen due to the goal of providing a comparison between “normal” fluctuations in 2017–2018 and reduced levels of air pollution caused by the COVID-19-induced lockdowns in 2020 and 2021. A list of counties with pollutants that were measured in their area is presented in Table 6.
5.3. The Incidence of Type 1 Diabetes in 2017–2018 and 2020–2021 in Lubelskie Voivodeship
The number of new T1DM cases was obtained from the Department of Pediatric Endocrinology and Diabetology with the Endocrinology–Metabolic Laboratory at the University Children’s Hospital in Lublin, Medical University of Lublin, Poland. Diabetes was diagnosed according to the guidelines of the Polish Diabetes Association, which are in accordance with WHO guidelines. Written and informed consent was obtained from all children and adolescents participating in the study or from their parent or legal guardian. The number of children aged 0–18 in the Lubelskie Voivodeship was obtained from the Statistical Yearbook, published by the Polish Central Statistical Office [62], and consent was not required. The incidence rate of type 1 diabetes mellitus (T1DM) was calculated for each county and year as the number of newly diagnosed cases among children aged 0–18 years divided by the corresponding pediatric population, multiplied by 100,000. This standardized measure allows for comparisons across regions with different population sizes and represents the annual risk of developing T1DM within the studied population.
The study was conducted in accordance with the Declaration of Helsinki and approved by the Ethics Committee of Medical University of Lublin (KE0254/153/2012, 2012, and protocol code KE-0254/25/2020, 2020).
5.4. Statistical Analysis
The study employed an ecological design using aggregated data at the county and regional levels rather than individual exposure and health information. While ecological studies are useful for identifying population-level patterns and generating hypotheses, they do not permit causal inference at the individual level. T1DM incidence rates (per 100,000 children) were calculated to account for regional differences in pediatric population size and were used in all correlation analyses. The relationships between annual mean concentrations of air pollutants (PM2.5, PM10, NO2, NOx, and SO2) and T1DM incidence rates were evaluated using Pearson’s correlation coefficient (r) together with corresponding p-values. Differences in mean annual pollutant concentrations across the study years (2017, 2018, 2020, and 2021) were assessed using one-way analysis of variance (ANOVA) followed by Tukey’s post hoc test to allow pairwise comparisons while controlling for multiple testing.
To evaluate whether the incidence of T1DM differed between the pre-pandemic (2017–2018) and pandemic (2020–2021) periods, an independent-samples t-test was performed. When the assumptions of normality were not satisfied, the Mann–Whitney U test was applied. All tests were two-tailed, and statistical significance was defined as α = 0.05.
All statistical analyses were conducted using RStudio (R programming language, version 2023) and OriginPro software (version 2023b).
6. Conclusions
The presented ecological study showed that in 2017–2018 air pollution in the entire Lublin Voivodeship was much higher than in 2020–2021. Moreover, in 2017 and 2018 in the Lublin Voivodeship, strong and statistically significant positive correlations were found between NO2 and PM2.5 concentrations and the occurrence of type 1 diabetes in children. This means that air pollutants NO2 and PM2.5 may suggest a potential association with the development of type 1 diabetes in children exposed to these pollutants. It should be noted that restrictions related to the COVID-19 pandemic resulted in a reduction in air pollution, which may have contributed to a reduction in the statistical significance of the correlation of NO2 and PM2.5 with type 1 diabetes. The decrease in the incidence of type 1 diabetes in 2020–2021 may be due to the reduction in air pollution during this period, but its negligible nature may indicate that air pollution may be only one of many factors influencing the development of type 1 diabetes. Reducing exposure to air pollution may not be enough to prevent type 1 diabetes if there is still high exposure to viral infections, which are considered the main factor causing T1DM. Overall, findings may suggest a potential association between selected air pollutants and T1DM; however, causal relationships cannot be inferred from aggregated data. Further research based on individual-level exposure assessment is necessary to better understand the nature of this relationship.
Author Contributions
A.S.: conceptualization, methodology, validation, formal analysis, research, resources, data verification, writing—preparation of the original project; M.J.: conceptualization, methodology, validation, formal analysis, research, resources, data verification, writing—preparation of the original project, editing; Ż.T.: formal analysis, data selection; S.K.: formal analysis, resources, data selection; R.P.: formal analysis, resources, data selection; I.B.-S.: formal analysis, resources, data selection; K.Z.: conceptualization, validation, formal analysis, research, resources, data verification, writing—preparation of the original project, supervision, review and editing, visualization, obtaining financing, supervision. All authors have read and agreed to the published version of the manuscript.
Funding
The authors declare that they received financial support for the publication of this article. This manuscript was supported and co-funded by grant 01-30025 from the Medical University of Gdańsk.
Institutional Review Board Statement
The study was conducted in accordance with the Declaration of Helsinki and approved by the Ethics Committee of Medical University of Lublin (protocol code KE0254/153/2012, 2012, and KE-0254/25/2020, 2020).
Informed Consent Statement
Informed consent was obtained from all subjects involved in the study.
Data Availability Statement
The data presented in this study are available on request from the co-author of this manuscript and head of the Dept. of Pediatric Endocrinology and Diabetology, Medical University of Lublin, Prof. Iwona Beń-Skowronek, PhD, MD (email: iwona.ben-skowronek@umlub.pl).
Acknowledgments
The authors would like to thank Małgorzata Michalska from the Medical University of Gdańsk for help in collecting air pollution data in the Lublin Voivodeship. Thanks are also given to Julia Jung from the Medical University of Gdańsk for help in preparing figures for the publication.
Conflicts of Interest
The authors declare no potential competing interests with respect to the research, authorship and/or publication of this article.
References
- Ogrotis, I.; Koufakis, T.; Kotsa, K. Changes in the Global Epidemiology of Type 1 Diabetes in an Evolving Landscape of Environmental Factors: Causes, Challenges, and Opportunities. Medicina 2023, 59, 668. [Google Scholar] [CrossRef] [Scilit] [PubMed]
- Lund-Blix, N.A.; Stene, L.C.; Rasmussen, T.; Torjesen, P.A.; Andersen, L.F.; Rønningen, K.S. Infant Feeding in Relation to Islet Autoimmunity and Type 1 Diabetes in Genetically Susceptible Children: The MIDIA Study. Diabetes Care 2015, 38, 257–263. [Google Scholar] [CrossRef] [Scilit] [PubMed]
- Zorena, K.; Jaskulak, M.; Michalska, M.; Mrugacz, M.; Vandenbulcke, F. Air Pollution, Oxidative Stress, and the Risk of Development of Type 1 Diabetes. Antioxidants 2022, 11, 1908. [Google Scholar] [CrossRef] [Scilit]
- Michalska, M.; Wąż, P.; Zorena, K.; Bartoszewicz, M.; Korzeniowska, K.; Krawczyk, S.; Beń-Skowronek, I.; Myśliwiec, M. Potential Effects of Microbial Air Quality on the Number of New Cases of Diabetes Type 1 in Children in Two Regions of Poland: A Pilot Study. Infect. Drug Resist. 2019, 12, 2323–2334. [Google Scholar] [CrossRef] [Scilit] [PubMed]
- Gregory, G.A.; Robinson, T.I.G.; Linklater, S.E.; Wang, F.; Colagiuri, S.; de Beaufort, C.; Donaghue, K.C.; International Diabetes Federation Diabetes Atlas Type 1 Diabetes in Adults Special Interest Group; Magliano, D.J.; Maniam, J.; et al. Global incidence, prevalence, and mortality of type 1 diabetes in 2021 with projection to 2040: A modelling study. Lancet Diabetes Endocrinol. 2022, 10, 741–760. [Google Scholar] [CrossRef] [Scilit] [PubMed]
- Zeng, Z.; Yoshida, Y.; Wang, D.; Fujii, Y.; Shen, M.; Mimura, T.; Tanaka, Y. Inflammatory Cytokines and Chemokines Are Synergistically Induced in a ROS-Dependent Manner by a Co-Culture of Corneal Epithelial Cells and Neutrophil-like Cells in the Presence of Particulate Matter. Antioxidants 2024, 13, 467. [Google Scholar] [CrossRef] [Scilit] [PubMed]
- Giwa, A.M.; Ahmed, R.; Omidian, Z.; Majety, N.; Karakus, K.E.; Omer, S.M.; Donner, T.; Hamad, A.R.A. Current Understandings of the Pathogenesis of Type 1 Diabetes: Genetics to Environment. World J. Diabetes 2020, 11, 13–25. [Google Scholar] [CrossRef] [Scilit] [PubMed]
- Taha-Khalde, A.; Haim, A.; Karakis, I.; Shashar, S.; Biederko, R.; Shtein, A.; Hershkowits, E.; Novack, L. Air Pollution and Meteorological Conditions during Gestation and Type 1 Diabetes in Offspring. Environ. Int. 2021, 154, 106546. [Google Scholar] [CrossRef] [Scilit]
- Ben-Skowronek, I.; Sieniawska, J.; Pach, E.; Wrobel, W.; Skowronek, A.; Tomczyk, Z.; Rosolowska, I. Potential Therapeutic Application of Regulatory T Cells in Diabetes Mellitus Type 1. Int. J. Mol. Sci. 2022, 23, 390. [Google Scholar] [CrossRef] [Scilit] [PubMed]
- Zhan, S.; Xu, D.; Ling, C.; Xia, Y. Screening of Key Pathogenic Genes of Type 1 Diabetes in Children. Transl. Pediatr. 2023, 12, 709–718. [Google Scholar] [CrossRef] [Scilit]
- Bahia, L.; Mello, K.F.; Lemos, L.L.P.; Costa, N.L.; Mulinari, E.; Malerbi, D.A. Cost-Effectiveness of Continuous Glucose Monitoring with FreeStyle Libre® in Brazilian Insulin-Treated Patients with Types 1 and 2 Diabetes Mellitus. Diabetol. Metab. Syndr. 2023, 15, 242. [Google Scholar] [CrossRef] [Scilit]
- Pietrzak, I.; Michalak, A.; Seget, S.; Bednarska, M.; Beń-Skowronek, I.; Bossowski, A.; Chobot, A.; Dżygało, K.; Głowińska-Olszewska, B.; Górnicka, M.; et al. Diabetic Ketoacidosis Incidence among Children with New-Onset Type 1 Diabetes in Poland and Its Association with COVID-19 Outbreak—Two-Year Cross-Sectional National Observation by PolPeDiab Study Group. Pediatr. Diabetes 2022, 23, 944–955. [Google Scholar] [CrossRef] [Scilit] [PubMed]
- Honda, T.; Henry, T.; VanDerslice, J.; Porucznik, C.A.; Corlin, L.; Gilani, O.; Kirwa, K.; Lazaro-Guevara, J.M.; Pezzolesi, M.G. Ambient particulate air pollution is associated with higher risk of microvascular complications and diabetic ketoacidosis among persons with type 1 diabetes mellitus in an observational survival study. Diabetes Res. Clin. Pract. 2025, 230, 112983. [Google Scholar] [CrossRef] [Scilit] [PubMed]
- Mahler, B.; Băiceanu, D.; Panciu, T.C.; Florea, R.M.; Iorga, A.L.; Gnat, M.; German, C.F.; Pârvu, S.; Paraschiv, D.; Manea, D.; et al. Air Pollutants and Their Impact on Chronic Diseases—A Retrospective Study in Bucharest, Romania. Atmosphere 2023, 14, 867. [Google Scholar] [CrossRef] [Scilit]
- Pan, S.C.; Huang, C.C.; Chin, W.S.; Chen, B.Y.; Chan, C.C.; Guo, Y.L. Association between Air Pollution Exposure and Diabetic Retinopathy among Diabetics. Environ. Res. 2020, 181, 108960. [Google Scholar] [CrossRef] [Scilit] [PubMed]
- Zorena, K.; Myśliwska, J.; Myśliwiec, M.; Rybarczyk-Kapturska, K.; Malinowska, E.; Wiśniewski, P.; Raczyńska, K. Association between Vascular Endothelial Growth Factor and Hypertension in Children and Adolescents Type I Diabetes Mellitus. J. Hum. Hypertens. 2010, 24, 755–762. [Google Scholar] [CrossRef] [Scilit] [PubMed]
- Zorena, K.; Kula, M.; Malinowska, E.; Raczyńska, D.; Myśliwiec, M.; Raczyńska, K. Threshold Serum Concentrations of Tumour Necrosis Factor Alpha (TNFα) as a Potential Marker of the Presence of Microangiopathy in Children and Adolescents with Type 1 Diabetes Mellitus (T1DM). Hum. Immunol. 2013, 74, 75–81. [Google Scholar] [CrossRef] [Scilit]
- Mozafarian, N.; Hashemipour, M.; Yazdi, M.; Hani Tabaei Zavareh, M.; Hovsepian, S.; Heidarpour, M.; Taheri, E. The Association between Exposure to Air Pollution and Type 1 Diabetes Mellitus: A Systematic Review and Meta-Analysis. Adv. Biomed. Res. 2022, 11, 103. [Google Scholar] [CrossRef] [Scilit]
- Michalska, M.; Bartoszewicz, M.; Wąz, P.; Kozaczuk, S.; Beń-Skowronek, I.; Zorena, K. PM10 Concentration and Microbiological Assessment of Air in Relation to the Number of Acute Cases of Type 1 Diabetes Mellitus in the Lubelskie Voivodeship. Preliminary Report. Pediatr. Endocrinol. Diabetes Metab. 2017, 23, 70–76. [Google Scholar] [CrossRef] [Scilit] [PubMed]
- Zorena, K.; Michalska, M.; Kurpas, M.; Jaskulak, M.; Murawska, A.; Rostami, S. Environmental Factors and the Risk of Developing Type 1 Diabetes-Old Disease and New Data. Biology 2022, 11, 608. [Google Scholar] [CrossRef] [Scilit] [PubMed]
- Chilian-Herrera, O.L.; Tamayo-Ortiz, M.; Texcalac-Sangrador, J.L.; Rothenberg, S.J.; López-Ridaura, R.; Romero-Martínez, M.; Wright, R.O.; Just, A.C.; Kloog, I.; Bautista-Arredondo, L.F.; et al. PM2.5 Exposure as a Risk Factor for Type 2 Diabetes Mellitus in the Mexico City Metropolitan Area. BMC Public Health 2021, 21, 2087. [Google Scholar] [CrossRef] [Scilit] [PubMed]
- Gruzieva, O.; Merid, S.K.; Gref, A.; Gajulapuri, A.; Lemonnier, N.; Ballereau, S.; Gigante, B.; Kere, J.; Auffray, C.; Melén, E.; et al. Exposure to Traffic-Related Air Pollution and Serum Inflammatory Cytokines in Children. Environ. Health Perspect. 2017, 125, 67007. [Google Scholar] [CrossRef] [Scilit]
- Catalano, S.; Moyer, J.; Weaver, A.; Di, Q.; Schwartz, J.D.; Catalano, M.; Ward-Caviness, C.K. Associations between Long-Term Fine Particulate Matter Exposure and Hospital Procedures in Heart Failure Patients. PLoS ONE 2023, 18, e0283759. [Google Scholar] [CrossRef] [Scilit] [PubMed]
- Fuller, R.; Landrigan, P.J.; Balakrishnan, K.; Bathan, G.; Bose-O’Reilly, S.; Brauer, M.; Caravanos, J.; Chiles, T.; Cohen, A.; Corra, L.; et al. Pollution and Health: A Progress Update. Lancet Planet. Health 2022, 6, e535–e547. [Google Scholar] [CrossRef] [Scilit]
- Wu, I.P.; Liao, S.L.; Lai, S.H.; Wong, K.S. The Respiratory Impacts of Air Pollution in Children: Global and Domestic (Taiwan) Situation. Biomed. J. 2022, 45, 88–94. [Google Scholar] [CrossRef] [Scilit] [PubMed]
- Kuye, A.; Kumar, P. Particulate matter exposure from different heating stoves and fuels in UK homes. Sci. Rep. 2025, 15, 21394. [Google Scholar] [CrossRef] [Scilit] [PubMed] [PubMed Central]
- Inshaw, J.R.J.; Cutler, A.J.; Crouch, D.J.M.; Wicker, L.S.; Todd, J.A. Genetic Variants Predisposing Most Strongly to Type 1 Diabetes Diagnosed Under Age 7 Years Lie Near Candidate Genes that Function in the Immune System and in Pancreatic β-Cells. Diabetes Care 2020, 43, 169–177. [Google Scholar] [CrossRef] [Scilit] [PubMed]
- Organización Mundial de la Salud (OMS). WHO Global Air Quality Guidelines. Particulate Matter (PM2.5 and PM10), Ozone, Nitrogen Dioxide, Sulfur Dioxide and Carbon Monoxide; OMS: Ginebra, Switzerland, 2021; pp. 1–360. [Google Scholar]
- Directive 2008/50/EC of the European Parliament and of the Council of 21 May 2008 on Ambient Air Quality and Cleaner Air for Europe. Available online: https://www.europeansources.info/record/directive-2008-50-ec-of-the-european-parliament-and-of-the-council-of-21-may-2008-on-ambient-air-quality-and-cleaner-air-for-europe (accessed on 20 November 2023).
- Michalska, M.; Zorena, K.; Wąż, P.; Bartoszewicz, M.; Brandt-Varma, A.; Ślȩzak, D.; Robakowska, M.; He, F. Gaseous Pollutants and Particulate Matter (PM) in Ambient Air and the Number of New Cases of Type 1 Diabetes in Children and Adolescents in the Pomeranian Voivodeship, Poland. Biomed Res. Int. 2020, 2020, 1648264. [Google Scholar] [CrossRef] [Scilit]
- Beltran, A.J.; Wu, J.; Laurent, O. Associations of Meteorology with Adverse Pregnancy Outcomes: A Systematic Review of Preeclampsia, Preterm Birth, and Birth Weight. Int. J. Environ. Res. Public Health 2013, 11, 91–172. [Google Scholar] [CrossRef] [Scilit] [PubMed]
- Malmqvist, E.; Larsson, H.E.; Jönsson, I.; Rignell-Hydbom, A.; Ivarsson, S.A.; Tinnerberg, H.; Stroh, E.; Rittner, R.; Jakobsson, K.; Swietlicki, E.; et al. Maternal Exposure to Air Pollution and Type 1 Diabetes—Accounting for Genetic Factors. Environ. Res. 2015, 140, 268–274. [Google Scholar] [CrossRef] [Scilit] [PubMed]
- Madhloum, N.; Janssen, B.G.; Martens, D.S.; Saenen, N.D.; Bijnens, E.; Gyselaers, W.; Penders, J.; Vanpoucke, C.; Lefebvre, W.; Plusquin, M.; et al. Cord Plasma Insulin and in Utero Exposure to Ambient Air Pollution. Environ. Int. 2017, 105, 126–132. [Google Scholar] [CrossRef] [Scilit]
- Singh, B.P. Analyzing the Interplay of Air Pollution and COVID-19: A Review on Health Implications. Ecohealth 2025, 22, 486–499. [Google Scholar] [CrossRef] [Scilit]
- Robey, R.C.; Crozier, O.; Frame, A.; Martin, K.; Ashcroft, P.; Iqbal, N.; Barry, P.J.; Jones, A.; Ahmad, S.; Horsley, A. The Benefits of COVID Lockdowns on Respiratory Health: What Factors May Have Contributed to the Decline in Hospital Admissions for Cystic Fibrosis? Respir. Med. Res. 2023, 84, 101061. [Google Scholar] [CrossRef] [Scilit] [PubMed]
- Skirienė, A.F.; Stasiškienė, Ž. COVID-19 and Air Pollution: Measuring Pandemic Impact to Air Quality in Five European Countries. Atmosphere 2021, 12, 290. [Google Scholar] [CrossRef] [Scilit]
- Belis, C.A.; Djatkov, D.; Toceva, M.; Knezevic, J.; Djukanovic, G.; Stefanovska, A.; Golubov, N.; Jovic, B.; Gavros, A. Analysis of COVID-19 Lockdown to Understand Air Pollution Processes and Their Impacts on Health: A Case Study in the Western Balkans. Atmosphere 2025, 16, 90. [Google Scholar] [CrossRef] [Scilit]
- Guevara, M.; Jorba, O.; Soret, A.; Petetin, H.; Bowdalo, D.; Serradell, K.; Tena, C.; Van Der Gon, H.D.; Kuenen, J.; Peuch, V.H.; et al. Time-Resolved Emission Reductions for Atmospheric Chemistry Modelling in Europe during the COVID-19 Lockdowns. Atmos. Chem. Phys. 2021, 21, 773–797. [Google Scholar] [CrossRef] [Scilit]
- Barré, J.; Petetin, H.; Colette, A.; Guevara, M.; Peuch, V.H.; Rouil, L.; Engelen, R.; Inness, A.; Flemming, J.; Pérez García-Pando, C.; et al. Estimating Lockdown-Induced European NO2 changes Using Satellite and Surface Observations and Air Quality Models. Atmos. Chem. Phys. 2021, 21, 7373–7394. [Google Scholar] [CrossRef] [Scilit]
- Mirowsky, J.E.; Carraway, M.S.; Dhingra, R.; Tong, H.; Neas, L.; Diaz-Sanchez, D.; Cascio, W.; Case, M.; Crooks, J.; Hauser, E.R.; et al. Ozone Exposure Is Associated with Acute Changes in Inflammation, Fibrinolysis, and Endothelial Cell Function in Coronary Artery Disease Patients. Environ. Health 2017, 16, 126. [Google Scholar] [CrossRef] [Scilit]
- Pilz, V.; Wolf, K.; Breitner, S.; Rückerl, R.; Koenig, W.; Rathmann, W.; Cyrys, J.; Peters, A.; Schneider, A. C-Reactive Protein (CRP) and Long-Term Air Pollution with a Focus on Ultrafine Particles. Int. J. Hyg. Environ. Health 2018, 221, 510–518. [Google Scholar] [CrossRef] [Scilit]
- Bodin, J.; Stene, L.C.; Nygaard, U.C. Can Exposure to Environmental Chemicals Increase the Risk of Diabetes Type 1 Development? Biomed Res. Int. 2015, 2015, 208947. [Google Scholar] [CrossRef] [Scilit] [PubMed]
- Howard, S.G. Developmental Exposure to Endocrine Disrupting Chemicals and Type 1 Diabetes Mellitus. Front. Endocrinol. 2018, 9, 513. [Google Scholar] [CrossRef] [Scilit] [PubMed]
- Butalia, S.; Kaplan, G.G.; Khokhar, B.; Rabi, D.M. Environmental Risk Factors and Type 1 Diabetes: Past, Present, and Future. Can. J. Diabetes 2016, 40, 586–593. [Google Scholar] [CrossRef] [Scilit]
- Wawryk-Gawda, E.; Miga-Orczykowska, N.; Matusiak, J.; Mańdziuk, D.; Giżewska, K.; Opoka-Winiarska, V. Air pollution exposure and the burden of pediatric upper respiratory tract infections in emergency departments: A retrospective time-series study. Eur. J. Pediatr. 2025, 184, 753. [Google Scholar] [CrossRef] [Scilit]
- Kujawska, J.; Wojtaś, E.; Zaburko, J.; Kamińska, I.; Czerpak, J.; Jamka, K.; Babko, R.; Łagód, G. Concentration and risk assessment of metals in snow cover monitoring in urban and rural areas. Ann. Agric. Environ. Med. 2024, 31, 205–211. [Google Scholar] [CrossRef] [Scilit]
- Grzywa-Celińska, A.; Krusiński, A.; Dos Santos Szewczyk, K.; Kurys-Denis, E.; Milanowski, J. Relationship between concentration of air pollutants and frequency of hospitalisations due to respiratory diseases. Ann. Agric. Environ. Med. 2024, 31, 13–23. [Google Scholar] [CrossRef] [Scilit] [PubMed]
- Sørensen, I.M.; Joner, G.; Jenum, P.A.; Eskild, A.; Brunborg, C.; Torjesen, P.A.; Stene, L.C. Vitamin D-binding protein and 25-hydroxyvitamin D during pregnancy in mothers whose children later developed type 1 diabetes. Diabetes Metab. Res. Rev. 2016, 32, 883–890. [Google Scholar] [CrossRef] [Scilit] [PubMed]
- Myśliwiec, M.; Balcerska, A.; Zorena, K.; Jędrzejczyk, A.; Malinowska, E.; Myśliwska, J. Increasing incidence of diabetes mellitus type 1 in children–the role of environmental factors. Pol. J. Environ. Stud. 2007, 16, 109–112. [Google Scholar]
- Tampe, I.; Garfias, C.; Borzutzky, A.; Slaibe, L.; García, H. Incidence of type 1 diabetes in Chilean children between 2006 and 2021: Significant increase during the COVID-19 pandemic. Acta Diabetol. 2024, 61, 29–34. [Google Scholar] [CrossRef] [Scilit] [PubMed]
- Rosinska, M.; Czarkowski, M.P.; Sadkowska-Todys, M. Infectious diseases in Poland in 2022. Prz. Epidemiol. 2024, 78, 524–542, (In English, Polish). [Google Scholar] [CrossRef] [Scilit] [PubMed]
- Liang, L.; Gong, P. Urban and air pollution: A multi-city study of long-term effects of urban landscape patterns on air quality trends. Sci. Rep. 2020, 10, 18618. [Google Scholar] [CrossRef] [Scilit] [PubMed] [PubMed Central]
- Predieri, B.; Bruzzi, P.; Bigi, E.; Ciancia, S.; Madeo, S.F.; Lucaccioni, L.; Iughetti, L. Endocrine Disrupting Chemicals and Type 1 Diabetes. Int. J. Mol. Sci. 2020, 21, 2937. [Google Scholar] [CrossRef] [Scilit] [PubMed]
- Boboc, A.A.; Novac, C.N.; Ilie, M.T.; Ieșanu, M.I.; Galoș, F.; Bălgrădean, M.; Berghea, E.C.; Ionescu, M.D. The Impact of SARS-CoV-2 Pandemic on the New Cases of T1DM in Children. A Single-Centre Cohort Study. J. Pers. Med. 2021, 11, 551. [Google Scholar] [CrossRef] [Scilit] [PubMed]
- Salmi, H.; Heinonen, S.; Hästbacka, J.; Lääperi, M.; Rautiainen, P.; Miettinen, P.J.; Vapalahti, O.; Hepojoki, J.; Knip, M. New-Onset Type 1 Diabetes in Finnish Children during the COVID-19 Pandemic. Arch. Dis. Child. 2022, 107, 180–185. [Google Scholar] [CrossRef] [Scilit] [PubMed]
- Ho, J.; Rosolowsky, E.; Pacaud, D.; Huang, C.; Lemay, J.A.; Brockman, N.; Rath, M.; Doulla, M. Diabetic Ketoacidosis at Type 1 Diabetes Diagnosis in Children during the COVID-19 Pandemic. Pediatr. Diabetes 2021, 22, 552–557. [Google Scholar] [CrossRef] [Scilit]
- Lee, M.S.; Lee, R.; Ko, C.W.; Moon, J.E. Increase in blood glucose level and incidence of diabetic ketoacidosis in children with type 1 diabetes mellitus in the Daegu-Gyeongbuk area during the coronavirus disease 2019 (COVID-19) pandemic: A retrospective cross-sectional study. Med. Sci. 2022, 39, 46–52. [Google Scholar] [CrossRef] [Scilit] [PubMed]
- Annual Air Quality Assessment in the Lublin Voivodeship. Provincial Report for 2017—GIOŚ. Available online: https://powietrze.gios.gov.pl/pjp/rwms/publications/card/75 (accessed on 20 November 2023).
- Annual Air Quality Assessment in the Lublin Voivodeship. Provincial Report for 2018—GIOŚ. Available online: https://powietrze.gios.gov.pl/pjp/rwms/publications/card/82 (accessed on 20 November 2023).
- Annual Air Quality Assessment in the Lublin Voivodeship. Provincial Report for 2020—GIOŚ. Available online: https://powietrze.gios.gov.pl/pjp/rwms/publications/card/1448 (accessed on 20 November 2023).
- Annual Air Quality Assessment in the Lublin Voivodeship. Provincial Report for 2021—GIOŚ. Available online: https://powietrze.gios.gov.pl/pjp/rwms/publications/card/1721 (accessed on 20 November 2023).
- Voivodship Inspectorate for Environmental Protection (WIOS)in Lublin. Available online: https://labs.pops.int/Laboratory/LaboratoryGeneral.aspx?lab=126 (accessed on 20 November 2023).

Disclaimer/Publisher’s Note: The statements, opinions and data contained in all publications are solely those of the individual author(s) and contributor(s) and not of MDPI and/or the editor(s). MDPI and/or the editor(s) disclaim responsibility for any injury to people or property resulting from any ideas, methods, instructions or products referred to in the content. |
© 2026 by the authors. Licensee MDPI, Basel, Switzerland. This article is an open access article distributed under the terms and conditions of the Creative Commons Attribution (CC BY) license.