


Abstract
The subject of this research is the exploration of the potential of remote sensing and Geographic Information Systems (GIS) for basin-scale spatio-temporal monitoring of drought and its impacts in the Ukrina River Basin, Bosnia and Herzegovina (BH), during the last decade (2015–2024). The aim is to integrate meteorological, hydrological, agricultural, and socio-economic drought signals and to delineate areas of long-term drought exposure. Meteorological drought was evaluated using CHIRPS precipitation and the Standardized Precipitation Index (SPI) calculated at 1-, 3-, 6-, and 12- month accumulation scales using Gamma fitting and a fixed long term reference period; hydrological drought was examined using available water-level records complemented by the Standardized Water Level Index (SWLI) and supported by correspondence with standardized ERA5-Land runoff anomalies; agricultural drought was mapped using remote sensing indices—the Temperature Condition Index (TCI), Vegetation Condition Index (VCI), and Vegetation Health Index (VHI)—calculated from MODIS satellite data; and socio-economic effects were assessed using municipal crop-production statistics (2015–2019). The results indicate that drought conditions were most pronounced in 2015, 2017, 2021, and especially 2022, showing consistent agreement between precipitation deficits, hydrological responses, and vegetation stress, while 2016, 2018–2020, 2023, and 2024 were generally more favorable. As a key novelty, a persistent drought-prone zone was delineated by intersecting drought-affected areas across major episodes, providing a basin-scale identification of chronic drought hotspots for a river basin in BH. The persistent zone covers 40.02% of the basin and spans nine cities and municipalities, with >93% located in Prnjavor, Derventa, Stanari, and Teslić. Hotspots are concentrated mainly in lowlands below 400 m a.s.l., with a statistically significant concentration across lower elevation classes, indicating higher long-term exposure in the central and northern valley sectors, and land use overlay further highlights high relative exposure of productive land. Overall, the integrated remote sensing and GIS framework strengthens drought monitoring by providing spatially explicit and repeatable evidence to support targeted adaptation planning and drought-risk management.
1. Introduction
Under contemporary global-warming conditions, an increase in the frequency of extreme hydro-climatic events has been observed [1], with drought emerging as a frequent, destructive, long-lasting, and complex hydro-meteorological hazard [2,3]. As one of the most widespread natural hazards affecting terrestrial ecosystems [4], drought typically has a broad spatial extent and substantial adverse impacts on environmental conditions and population well-being at multiple scales [1,5,6]. Unlike rapid-onset hazards such as floods [7,8,9] or wildfires [10], drought develops gradually, which complicates the reliable identification of its onset, monitoring of its progression, and assessment of impacts [6]. Its effects are commonly expressed through reduced surface- and groundwater availability, constraints on water supply and energy production, and limitations to agricultural productivity and crop yields [6,11,12,13,14,15].
Drought is commonly classified into meteorological, hydrological, agricultural, and socio-economic types [3,16,17]. Meteorological drought is often considered the earliest signal of a developing dry period and refers to prolonged precipitation deficits relative to long-term conditions [18]. Traditional monitoring approaches rely primarily on meteorological station observations [6], which frequently suffer from limited spatial coverage and incomplete temporal records [18,19]. These limitations are particularly evident in Bosnia and Herzegovina (BH), where uneven station distribution and incomplete precipitation series constrain robust drought assessments, and basin-specific studies remain scarce [5]. As a complementary data source, remote sensing can mitigate these constraints by providing spatially continuous precipitation products and satellite-derived variables, which support consistent drought detection and monitoring over large areas [20,21,22,23,24,25,26,27], although their application in BH remains limited [5]. Meteorological drought may act as a “trigger” for other drought types [28], including hydrological drought, which is characterized by reduced water availability in rivers, reservoirs, and groundwater systems [3,29,30,31].
Drought has repeatedly affected the territory of BH [5,32,33,34]. Studies report an increase in the frequency of severe and extreme meteorological droughts in BH [35], accompanied by rising air temperatures and increasingly uneven precipitation distribution [36,37,38,39,40]. Trbić et al. [38] further emphasize that this trend—and the associated likelihood of drought occurrence—is expected to persist, primarily due to the increase in hot/tropical days, defined as days with daily maximum air temperature exceeding 30 °C [41]. This combination is considered a key driver of more frequent and more intense summer droughts, when agricultural water demand is highest [40]. Syntheses for BH identify multiple drought-affected years during 1961–2001 and a marked increase in documented drought years after 2000 (e.g., 2003–2017), highlighting the value of past drought impacts for anticipating future risks under continued warming [32,38,40].
Meteorological and hydrological drought conditions often propagate into agricultural drought, which develops when soil moisture becomes insufficient to sustain plant growth, typically resulting in yield reductions and economic losses [3,42]. Remote sensing enables the derivation of agricultural drought indicators such as Land Surface Temperature (LST), the Vegetation Condition Index (VCI), the Temperature Condition Index (TCI), and the Vegetation Health Index (VHI), which are widely used to assess vegetation stress and drought impacts [12,43,44,45]. Reduced agricultural production may, in turn, contribute to socio-economic drought, defined as water shortages that disrupt economic activities and affect the balance between supply and demand for essential goods [17,42]. The economic consequences of drought can be substantial across Europe and severe impacts have also been documented in BH (e.g., the 2012 drought) [46,47,48,49,50,51].
Given the slow-onset nature of drought and its cascading impacts across water resources, agriculture, and socio-economic systems, effective monitoring increasingly requires integrated, spatially explicit approaches that can capture multiple drought dimensions simultaneously. In data-limited settings such as BH (where meteorological and hydrological observation networks are often sparse and unevenly distributed), remote sensing and GIS provide a particularly valuable basis for consistent, basin-wide assessments. However, despite the increasing global application of these technologies, comprehensive basin-scale studies that jointly examine meteorological, hydrological, agricultural, and socio-economic drought in BH remain relatively limited. This gap is especially relevant for river basins with a strong agricultural character, where drought sensitivity is high and impacts can be underestimated if drought is assessed through isolated indicators or single-sector perspectives. To help address this gap, the present study examines drought dynamics in the Ukrina River Basin (BH) and is guided by the following research questions:
- Which periods during the last decade were characterized by the most pronounced drought conditions in the Ukrina River Basin, and what are their key spatial and temporal patterns?
- To what extent do different drought dimensions (meteorological, hydrological, agricultural, and socio-economic) indicate consistent signals of drought development and severity within the basin?
- Which areas within the basin exhibit repeated exposure to drought conditions (i.e., persistent drought-prone zones), and how are these patterns related to land-use structure and basin physiography?
- How do remote sensing and GIS-based drought indicators complement and improve traditional station- and observation-based monitoring in the Ukrina River Basin, particularly in terms of spatial coverage, consistency, and the delineation of drought-affected areas?
- How can the identified drought patterns support evidence-based prioritization of monitoring and adaptation measures in agriculture and water management at the river-basin scale in BH?
The objectives of this study are to: (i) quantify meteorological drought using satellite-based precipitation data and a standardized precipitation indicator; (ii) characterize hydrological drought using water-level records supported by an independent runoff-based proxy check; (iii) map agricultural drought using remote sensing data; (iv) evaluate drought-related socio-economic impacts using available municipal crop-production statistics as partial impact validation; and (v) integrate these drought dimensions to identify major drought episodes and delineate a persistent drought-prone zone using GIS-based spatial overlay, followed by interpretation in relation to topography, land use, and administrative units.
This research advances drought understanding at the river-basin scale by adopting an integrated perspective in which drought is interpreted as a multidimensional process with cascading impacts, rather than a single isolated phenomenon. It contributes to drought monitoring by providing a coherent basin-level integration of complementary indicators and spatial products, enabling consistent interpretation of drought dynamics and long-term exposure. The results offer practical, map-based evidence for delineating zones of elevated vulnerability and supporting more targeted monitoring and adaptation planning, particularly in agricultural areas where drought impacts translate directly into yield losses and broader socio-economic consequences. The proposed framework is transferable and can support the adoption of integrated drought-monitoring practices in other river basins in BH and in comparable data-limited regions.
2. Materials and Methods
2.1. Study Area
The study area corresponds to the Ukrina River Basin, located in the northern part of the Republic of Srpska and Bosnia and Herzegovina (Figure 1). It extends from 44°35′09″ N to 45°05′12″ N and from 17°23′53″ E to 18°07′53″ E. The basin covers an area of 1498.66 km2 [52]. Spatially, it is situated between the Vrbas River Basin to the west and the Bosna River Basin to the east [8]. The area encompasses the southern portion of the Pannonian Basin and lies at the interface between two macro-regional units: the Pannonian Basin and the mountainous belt [53]. A specific characteristic of the basin is that the Ukrina River does not originate from a single source; instead, it forms at an elevation of 149 m a.s.l. through the confluence of the Velika Ukrina and Mala Ukrina rivers in the central part of the basin. The main channel is 134.90 km long [54], and the river flows into the Sava River, to whose drainage system it contributes 1.57%. According to the Köppen–Geiger climate classification [55], the Ukrina River Basin partly belongs to the Cfb climate type (southwestern part), characterized by mild winters and moderately warm summers, while the northeastern part falls under the Cfc type, defined by mild winters and short, cool summers. Based on the 2023 population estimate [56] and an analysis of the spatial share of administrative units, it is estimated that approximately 69,800 inhabitants reside within the Ukrina River Basin. According to the Corine Land Cover geospatial database (2018), the basin is dominated by agricultural areas (around 55%), indicating a high sensitivity to the impacts of drought and other climatic extremes.
Figure 1.
Location of the study area.
The climatic conditions of the Ukrina River Basin indicate increasing susceptibility to drought (Figure 2). Based on ERA5 data [57] (a globally complete dataset that combines model output with observations and provides temporally consistent climate variables at ~0.25° spatial resolution), for the period 1984–2024, a linear increase in mean annual air temperature of approximately 0.059 °C per year was recorded, amounting to a total rise of about 2.37 °C (R2 = 0.57); this trend is statistically significant based on the Pearson correlation with time (p < 0.001). At the same time, annual precipitation totals show no statistically significant long-term trend (a very slight increase of around 1.56 mm per year, R2 = 0.01), based on the Pearson correlation with time (p = 0.479), but are characterized by pronounced interannual variability. Continuous warming, combined with an unstable precipitation regime, leads to more frequent moisture deficits and intensifies the risk of occurrence and persistence of drought episodes within the basin.
Figure 2.
Long-term trends of climatic characteristics based on ERA5 satellite data for the Ukrina River Basin (1984–2024), showing a statistically significant warming trend (p < 0.001) and a non-significant precipitation trend (p = 0.479) based on the Pearson correlation with time.
2.2. Methodology
The methodological approach to drought assessment builds upon the framework presented in Sabljić et al. [5] and is further refined in the present study to better support a coherent river-basin-scale interpretation of drought dynamics. It involves an analysis of four primary drought types (meteorological, hydrological, agricultural, and socio-economic) as well as an evaluation of adverse drought impacts. The study relies on the use of GIS through the processing of remote sensing “products” in the form of satellite imagery, using open-source software and platforms (QGIS 3.40 and GEE), which enables spatial and temporal analysis of drought intensity and distribution. A systematic overview of the workflow is presented in Figure 3; the integration logic is summarized below, and the following subsections provide a detailed description of each component.
Figure 3.
Workflow for integrated drought assessment and interpretation (Step 1—meteorological drought; Step 2—hydrological drought; Step 3—agricultural drought; Step 4—socio-economic impacts; Step 5—multi-indicator integration and persistent-zone mapping).
To clarify the sequence of activities and the integration of drought information, each drought type is first quantified independently in the following subsections using its corresponding datasets and indices. Integration is then implemented as a stepwise workflow that combines temporal consistency across indicators with GIS-based spatial overlay to derive long-term drought exposure patterns. Persistent drought-prone areas are subsequently delineated using GIS-based spatial overlay, and the resulting persistence pattern is further interpreted in relation to topography, land use, and administrative units.
2.2.1. Methodology for the Analysis of Meteorological Drought
Meteorological drought in this study was identified using the Climate Hazards Group InfraRed Precipitation with Station data (CHIRPS v3) dataset [58], specifically the pentad product (5-day precipitation totals) available in the Google Earth Engine (GEE) platform. CHIRPS is a precipitation dataset developed to improve climate monitoring and drought assessment [59]. As noted by Pellicone et al. [59], CHIRPS is based on an innovative integration of satellite-derived Cold Cloud Duration (CCD) information and meteorological station observations, enabling detailed and reliable estimates of precipitation amounts. It is a global dataset with relatively high spatial resolution (0.05° × 0.05°; ~5.3 km) [7] and a long temporal coverage (from 1981 to the present). The suitability of this dataset for the study area (the Ukrina River Basin) is supported by its validation against meteorological station (MS) data, with an overall percentage agreement of 94.18% for 1981–2023 [8]. Sabljić et al. [8] additionally reported a very strong positive Pearson correlation between the monthly CHIRPS estimates and MS observations (r = 0.875), indicating consistent covariation between the two datasets.
Meteorological drought is characterized by a precipitation deficit, and its occurrence in this study was determined by comparing the mean monthly precipitation for the 43-year reference period (1981–2024) with the mean monthly precipitation within each calendar year over the last decade (2015–2024). In this way, following the recommendations of the World Meteorological Organization (WMO) [60], a climatological-normal approach was applied, whereby precipitation variability is assessed relative to the long-term climatological cycle [61].
In accordance with the WMO guidelines (WMO-1203), deviations of monthly values from the climatological normal were expressed as the percentage of normal precipitation, which represents one of the fundamental climatological indicators for identifying dry and wet conditions. The indicator was calculated as the ratio between the observed monthly precipitation amount and the long-term monthly mean, and it was expressed as a percentage:
where denotes the precipitation amount in month i of year t, and represents the long-term monthly mean for the 1981–2024 period. Based on this indicator, a precipitation deficit or surplus was defined as the percentage deviation from the climatological normal:
Values of < 0 indicate a precipitation deficit and drier conditions relative to the climatological normal, whereas > 0 denotes a precipitation surplus. Periods characterized by a pronounced deficit compared with the long-term mean were interpreted as occurrences of meteorological drought.
The occurrence of meteorological drought was further quantified using the Standardized Precipitation Index (SPI). SPI, originally proposed by McKee et al. [62], provides a standardized measure of precipitation anomalies derived through probabilistic modeling of precipitation totals rather than a simple z-score calculation. In this study, SPI was derived from the validated CHIRPS precipitation data for the selected accumulation period(s) over the analysis interval. To capture drought conditions across multiple temporal scales, SPI was computed for 1-, 3-, 6-, and 12-month accumulation periods (SPI-1, SPI-3, SPI-6, and SPI-12). Following Jamalzi et al. [63], SPI was calculated using long-term precipitation records aggregated at the monthly scale. SPI values were obtained by fitting the long-term precipitation time series to a Gamma probability distribution, with the distribution parameters estimated using the maximum likelihood estimation (MLE) method. The corresponding Gamma probability density function (PDF) is given in Equation (3):
Here, x is the monthly precipitation; α and β are the shape and scale parameters, respectively; and is the Gamma function given by Equation (4).
The estimation of the gamma parameters α and β is performed using the sample mean x and sample standard deviation Sd of the precipitation time series, as expressed in Equation (5).
where
To account for the fact that the gamma distribution is undefined at , an adjusted form of the cumulative probability function is applied. The adjustment uses q, the probability of zero rainfall, calculated as the fraction of zero-rainfall months among all observations. The cumulative probability therefore takes the form shown in Equation (7).
where is the cumulative distribution function of the gamma distribution.
The SPI values are obtained by transforming the cumulative probability into a standard normal distribution. For , SPI is computed as in Equation (8):
where
For values of , the SPI is calculated as in Equation (10):
where
The constants used in the approximation are: , , , , , .
It should be noted that SPI is computed with respect to a fixed reference climatology (here, the long-term calibration period 1981–2024) and therefore implicitly assumes stationarity of the baseline climate conditions. Given the detected warming trend in the study area (Figure 2), SPI values reported for 2015–2024 are interpreted as standardized anomalies relative to this fixed baseline, and potential non-stationarity may affect their probabilistic interpretation over long periods.
The obtained SPI results were classified into categories according to the classifications proposed by McKee et al. [62] and Moccia et al. [64], which reflect different levels of intensity of wet and dry conditions (Table 1). Each category is associated with a specific probability of occurrence, symmetrically defined for both types of extreme events (dry and wet periods) [8].
Table 1.
SPI class thresholds defining wet-condition classes and drought severity from SPI values follow McKee et al. [62] and Moccia et al. [64].
2.2.2. Methodology for the Analysis of Hydrological Drought
Hydrological drought was evaluated as the hydrological response to sustained precipitation deficits [11,65]. Due to the absence of in-basin gauging stations, monthly mean water levels from HS Srbac (Sava River) were used as a proxy indicator to establish drought chronology and interpret low-water phases relevant to the Ukrina River Basin. Although HS Srbac is located outside the basin boundary, the station lies in the immediate vicinity of the Ukrina confluence within the same broader Sava River system (Figure 1), enabling the interpretation of low-water anomalies as a basin-relevant regional hydrological signal under data limitations.
This proxy approach is intended to characterize hydrological drought conditions at the monthly scale within the receiving Sava–Ukrina system and is not intended to capture short-term (event-scale) hydrological dynamics within the Ukrina Basin. To strengthen the justification for using HS Srbac as a proxy indicator under data limitations, a basin-scale runoff proxy for the Ukrina River Basin was additionally derived from ERA5-Land monthly reanalysis data (1997–2024). Basin-mean monthly runoff was computed by spatially averaging ERA5-Land runoff over the study area (runoff_sum; additionally surface_runoff_sum and sub_surface_runoff_sum) within the GEE environment. To remove seasonality and enable comparable interpretation, both the runoff proxy series and the HS Srbac water-level series were transformed into standardized monthly anomalies (z-scores computed separately for each calendar month), i.e., , where μm and σm denote the long-term mean and standard deviation for month m. The correspondence between the two standardized series was evaluated using Pearson correlation, including a 0–2 month lag test, to assess whether low-runoff phases in the Ukrina Basin proxy are associated with low-water conditions at HS Srbac. This supporting analysis provides a quantitative basis for interpreting the HS Srbac water-level record as an indirect indicator of regional hydrological drought conditions relevant to the Ukrina River Basin at the monthly scale.
In accordance with the WMO guidelines [66], and considering that discharge data were not publicly available at the time of the study, the hydrological drought was assessed indirectly using river stage (water level) observations, which is consistent with conceptual definitions of hydrological drought as a period of below-average flows and low surface- and groundwater levels [11]. For HS Srbac, the measurement period 1997–2024 was analyzed, and the mean monthly water-level values for the entire record were used as the long-term reference average. These values were compared with the mean monthly water levels for each calendar year during 2015–2024. Negative deviations of monthly water levels from the long-term mean were adopted as the criterion for identifying deficit months hydrologically. This threshold represents a simplified indicator of hydrological deficit, enabling the detection of even moderate hydrological responses to meteorological extremes and the approximate identification of periods of potential hydrological drought. Months in which precipitation deficits and negative SPI values (meteorological drought) coincided with reduced water levels relative to the long-term mean (hydrological drought) were highlighted as key indicators of multiple water deficits within the system. These periods are particularly important for subsequent interpretation and for identifying agricultural drought as a consequence of meteorological and hydrological drought.
To ensure that hydrological drought monitoring is supported by standardized values, in addition to the comparison of monthly mean water levels against the long-term mean, the Standardized Water Level Index (SWLI) was computed, following the methodology by Nazarenko et al. [67]. SWLI quantifies water-level anomalies for a given time interval by comparing observed water levels with the long-term baseline, expressed in standardized (dimensionless) form. As input data, monthly mean water levels at HS Srbac were used.
SWLI was calculated as [67]:
where denotes the monthly mean water level for year i and calendar month j, is the long-term mean water level for the same calendar month, and is the corresponding long-term standard deviation.
Because SWLI is a standardized index derived through the same standardization logic as SPI, SWLI values were interpreted using the SPI categorization scheme adopted in this study (Table 1).
2.2.3. Methodology for the Analysis of Agricultural Drought
The analysis of agricultural drought was methodologically based on the calculation of the Temperature Condition Index (TCI) and the Vegetation Condition Index (VCI). Using the results of these indices, the Vegetation Health Index (VHI) was subsequently derived. For the computation of these indices, Moderate Resolution Imaging Spectroradiometer (MODIS) satellite products were used, specifically MOD13Q1 and MOD11A2. The main characteristics of these satellite datasets are presented in Table 2.
Table 2.
Key characteristics of the MOD13Q1 and MOD11A2 MODIS products compiled from the product documentation [68,69] support transparent interpretation of the remote sensing–derived indices (TCI, VCI, and VHI).
TCI represents an initial indicator of water stress and drought occurrence [5]. The index was developed by Kogan [70] using the thermal spectral bands of the Advanced Very High Resolution Radiometer (AVHRR) sensor to identify temperature stress in vegetation, as well as stress caused by excessive moisture. The equation for calculating the TCI is given as follows [70]:
where and represent the maximum and minimum TCI values derived from the multi-year dataset, and j denotes the TCI value for the current month within the calculation period.
According to Sabljić et al. [5], the VCI is applied in agricultural drought assessment, and its key input is the Normalized Difference Vegetation Index (NDVI). Similarly to the TCI, this index was developed by Kogan [70]. The VCI evaluates the current NDVI condition by comparing it with the range of NDVI values observed in previous [5]. As emphasized by Sabljić et al. [5], VCI is expressed as a numerical value, where lower values indicate degraded or weakened vegetation conditions, whereas higher values denote preserved and healthy vegetation status. The VCI computation for each pixel and the analyzed period across the reference years is based on the following equation [71]:
where and are the maximum and minimum NDVI values within the multi-year dataset, while j represents the NDVI value for the current month within the calculation period.
The VHI is an indicator that measures vegetation condition (health) and is widely used for drought identification [72]. It accounts for local biophysical conditions as well as climatic factors, which makes it highly suitable for drought monitoring across different agrometeorological regions [73]. Serban and Maftei [74] emphasize that VHI is strongly correlated with crop yields, particularly during critical growth stages. To compute this index successfully, the results of the two previously described indices (TCI and VCI) must be integrated [5]. The final equation for calculating the VHI is as follows [72]:
where α is a “weighting coefficient” that determines the relative contribution of the VCI and TCI to drought-condition assessment, with values ranging from 0 to 1 [75]. In practice, α is most commonly set to 0.5, assuming an equal contribution of VCI (moisture-related vegetation condition) and TCI (temperature-related stress) to vegetation health, because the relative share of these components is uncertain and may vary across locations and time [76,77,78,79].
The results of the presented indices range from −1 to 1, where negative values indicate the “presence” of drought, while positive values denote its “absence” [5]. In this study, and in accordance with the recommendations of Kogan [80,81] and previous research [5,72,78,82], these indices were standardized by reclassifying their values into a 0–100 range and dividing them into an equal number of drought categories (Table 3).
Table 3.
Drought severity classes used to reclassify the remote sensing-derived indices (TCI, VCI, and VHI) into a 0–100 scale follow Kogan [80,81] and previous studies [5,72,78,82].
2.2.4. Methodology for the Analysis of the Socio-Economic Drought
The impacts of the identified agricultural drought were examined through an assessment of socio-economic drought, based on official crop statistics. Data were requested from the Republic of Srpska Institute of Statistics. Production was analyzed for wheat, maize, barley, potato, apple, pear, and plum. Because this institution collects data at the city/municipality level, the analysis included only those local self-government units in which at least approximately one-third of the total area lies within the Ukrina River Basin. The following cities and municipalities were included: Teslić (29.00%), Čelinac (32.25%), Derventa (75.98%), Prnjavor (80.47%), and Stanari (99.08%). Crop production data (in tonnes) were analyzed for the 2015–2019 period. The extension of this socio-economic validation to 2020–2024 was not possible due to data availability: according to an official reply from the Republic of Srpska Institute of Statistics (No. 06.3/060-451/25, 15 August 2025), municipal/city-level agricultural production data have not been available since 2020 (only higher-level aggregates are reported). Therefore, the socio-economic drought assessment is interpreted as a partial validation (2015–2019) and treated as a limitation for the remainder of the study period.
2.2.5. Methodology for Assessing the Adverse Impacts of Drought
The methodology for assessing the adverse impacts of drought in this study is focused on determining the spatial persistence of drought as a hydro-meteorological hazard. The primary objective is not to quantify the total spatial extent, but rather to precisely delineate the persistent drought zone, i.e., areas that were affected by drought during each major recorded event within the 2015–2024 reference period. This approach enables the identification of drought hazard hotspots, namely spatial units that exhibit chronic sensitivity to this phenomenon.
The methodological procedure is based on an iterative spatial intersection of vector data models within the QGIS software environment. The workflow involves cascading intersections of geospatial drought layers, whereby the polygon layer of the first recorded event is spatially intersected with the layer of the subsequent event. The resulting output layer is then used as the input for intersection analysis with the data from the third event, and the process continues across all available time intervals. This iterative reduction of spatial extent at each step eliminates areas that do not meet the criterion of complete spatial coincidence across all analyzed events.
The final geospatial output of this procedure is a polygon-based vector model that delineates the “persistence core”, defined as the spatial unit that was exposed to drought as a hydro-meteorological hazard during all observed extreme events. This zone, representing the highest level of vulnerability, provides a fundamental basis for subsequent analytical steps, which include spatial correlation with a digital elevation model (SRTM), land use, and administrative–territorial units, with the aim of detailed characterization of the physical-geographical and human-geographical factors of the most exposed areas. To assess the elevation dependence of drought persistence, the persistence core was intersected with SRTM-derived elevation belts and compared with the basin-wide hypsometric structure. Differences between the elevation-belt distributions of the persistence core and the entire basin were evaluated using a chi-square (χ2) goodness-of-fit test.
Land use was analyzed to contextualize the adverse impacts of drought and to determine which surface types are repeatedly affected within the persistent drought-prone zone. Because drought impacts are strongly mediated by land-use characteristics (e.g., agricultural land and grasslands may respond rapidly through vegetation stress, while forested areas often exhibit different resilience and recovery dynamics), overlaying the persistence core with land-use classes enables a more meaningful interpretation of drought exposure in relation to potential ecosystem degradation and socio-economic sensitivity. In particular, quantifying the share of agricultural areas within the persistent zone supports the subsequent interpretation of drought impacts in the context of agricultural production and potential socio-economic consequences. With regard to identifying land use for assessing the adverse impacts of drought, a supervised classification procedure was applied at the study-area scale. Sentinel-2 optical satellite imagery was used as the input dataset, and its main characteristics are presented in Table 4 [83].
Table 4.
Key characteristics of Sentinel-2 imagery compiled from Transon et al. [83] support transparent selection of input data and interpretation of the land-use classification results.
The supervised classification procedure was based on the methodological framework presented in Sabljić et al. [84,85]. The workflow was divided into two phases: pre-processing and post-processing. During the pre-processing phase, the temporal window for classification was defined, and the classification was performed for 2024 in order to identify, in near real time, the adverse impacts of persistent droughts within the basin. To improve land-use separability, three intra-annual sub-periods were used to build a multi-temporal composite; the first sub-period spans late 2023 to capture post-harvest/autumn conditions relevant for agricultural areas, while the remaining two sub-periods cover spring and summer–autumn 2024.
In addition to defining the study period, pre-processing included filtering the imagery based on cloud-cover percentage and spatial extent. Spatial filtering was applied by retaining only Sentinel-2 scenes intersecting the study area. Cloud filtering was performed using scene-level metadata (CLOUDY_PIXEL_PERCENTAGE < 6%). The filtering outcome was quantified for each sub-period: for the first sub-period (1 September 2023 to 31 December 2023), 147 scenes intersected the study area and 35 scenes met the cloud criterion (112 rejected; 76.19%); for the second sub-period (1 February 2024 to 1 June 2024), 147 scenes intersected the study area and 9 scenes met the cloud criterion (138 rejected; 93.88%); and for the third sub-period (1 July 2024 to 31 December 2024), 213 scenes intersected the study area and 43 scenes met the cloud criterion (176 rejected; 82.63%). Residual cloudy pixels were additionally masked using the Sentinel-2 Scene Classification Layer (SCL) prior to compositing.
In the post-processing phase, land use classes were delineated. A multi-temporal composite generated from the three sub-periods described above was used as the input for producing training data and performing the classification. Classification was performed using the Random Forest algorithm through the GEE cloud platform [86]. The following land use classes were extracted: water bodies, forest areas, agricultural areas, meadows/grasslands, and artificial (built-up) surfaces. Finally, the classification results were subjected to an accuracy assessment by calculating the following statistical metrics: user’s accuracy (UA), producer’s accuracy (PA), overall accuracy (OA), the Kappa coefficient, and the F1-score. The 2024 land-use classification achieved an overall accuracy of 0.98 and a Kappa coefficient of 0.98. According to van Vliet et al. [87], Kappa values in the 0.81–1.00 range indicate an almost perfect agreement, supporting the validity and high reliability of the classification. The full error matrix and class-level accuracy metrics are provided in Table S1.
3. Results
3.1. Results of Meteorological Drought
To identify meteorological drought in the Ukrina River Basin, mean monthly CHIRPS precipitation for the 1981–2024 period was compared with mean monthly precipitation totals for each year within the study period (2015–2024). Months with negative percentage precipitation anomalies (i.e., deviations below the climatological normal) were interpreted as drought-affected months.
Monthly anomaly patterns (Figure 4a–j) show strong interannual variability and indicate that the most pronounced precipitation deficits were concentrated in 2015, 2020, 2021, and 2022, while most other years were characterized by mixed monthly departures that were largely offset by wet months. The 2015 anomaly pattern is dominated by vegetation-season deficits and culminates in very large shortfalls (e.g., July −59.55% and December −85.74%), indicating pronounced meteorological drought conditions. A distinct vegetation-season drought signal is also evident in 2017, with negative anomalies concentrated in summer months despite near-normal annual totals. The 2020 pattern highlights strong winter–spring deficits (e.g., January −61.00% and April −52.30%), consistent with a negative annual anomaly. The most persistent within-year drought signal occurs in 2021, with broadly negative anomalies across much of the vegetation period (including severe deficits such as June −61.94% and September −58.07%). The 2022 anomaly pattern is characterized by deficits in the cold season and early spring and is reinforced by an additional extreme anomaly in autumn (October −62.85%), indicating sustained drought pressure.
Figure 4.
Percentage comparison of monthly precipitation based on CHIRPS data for (a) 2015, (b) 2016, (c) 2017, (d) 2018, (e) 2019, (f) 2020, (g) 2021, (h) 2022, (i) 2023, and (j) 2024 relative to the multi-year average for the 1981–2024 period.
By contrast, 2016, 2018, 2019, 2023, and 2024 do not show consistent negative annual anomalies, as dry months were generally compensated by substantial positive departures; however, these years still include distinct seasonal dry spells (e.g., autumn deficits in 2018–2019 and spring–summer deficits in 2024) that may be relevant for short-term impacts.
However, the anomaly-based assessment shown in Figure 4 provides only a descriptive indication of precipitation departures and does not allow a rigorous classification of drought intensity, duration, and persistence. To address this limitation, SPI was derived from validated CHIRPS precipitation data at multiple accumulation periods (Figure 5a–d), thereby enabling a structured interpretation of meteorological drought across short-term anomalies and progressively longer moisture-deficit regimes. In practical terms, SPI-1 (Figure 5a) captures short-lived precipitation shocks (meteorological drought onset), SPI-3 (Figure 5b) reflects seasonal deficits most relevant for vegetation stress and agricultural impacts, SPI-6 (Figure 5c) characterizes medium-term persistence that often precedes and accompanies hydrological responses, and SPI-12 (Figure 5d) represents long-term moisture anomalies that frame water-resource sensitivity and the potential for socio-economic consequences.
Figure 5.
SPI time series across the study area for 2015–2024 at different accumulation periods: (a) SPI-1, (b) SPI-3, (c) SPI-6, and (d) SPI-12 (negative values indicate drought conditions).
Across these timescales (Figure 5a–d), the results indicate that drought conditions during 2015–2024 were shaped by both episodic extremes and sustained multi-month deficits. Short-term intensification is most clearly expressed in 2015, where SPI-1 (Figure 5a) reaches extreme values (e.g., July −2.22; December −2.98) and is accompanied by a coherent seasonal deficit at SPI-3 (Figure 5b), consistent with the vegetation-period precipitation shortfalls indicated in Figure 4a. A seasonally concentrated drought signal is also evident in 2017, expressed primarily at SPI-1 and SPI-3 (Figure 5a,b), which supports the interpretation of growing-season drought despite near-normal annual totals and indicates limited persistence at longer timescales. A mixed drought structure is apparent in 2020, combining episodic monthly deficits at SPI-1 (Figure 5a) with a weaker long-term component at SPI-12 (Figure 5d) (moderate drought is reached in mid-2020, −1.21), consistent with a moderate drought year relative to subsequent persistent phases.
The most robust and persistent drought phase occurs in 2021–2022, when drought conditions are consistently expressed at SPI-6 and SPI-12 (Figure 5c,d), indicating sustained medium- to long-term moisture deficits. During 2021, drought intensified through the growing season, with SPI-3 (Figure 5b) reaching severe drought in June (−1.78) and SPI-6 (Figure 5c) reaching severe drought by late summer (e.g., September −1.88). In 2022, the long-term drought regime is most pronounced, with SPI-12 (Figure 5d) reaching severe drought in May (−1.62) and remaining below −1.0 through mid-year, indicating persistent annual-scale moisture deficit conditions. By contrast, 2016, 2018, 2019, 2023, and 2024 are dominated by near-normal to wet conditions across the seasonal to long-term scales (SPI-3/6/12; Figure 5b–d), with drought signals generally limited to short-lived departures at SPI-1 (Figure 5a) rather than sustained multi-month deficits.
Across SPI accumulation periods (SPI-1/3/6/12; Figure 5a–d), the results indicate that meteorological drought in 2015–2024 was governed by both short-lived extremes and sustained multi-month precipitation deficits. The most robust and persistent drought phase is observed in 2021–2022, expressed consistently at SPI-6 and SPI-12 (Figure 5c,d), indicating prolonged medium- to long-term moisture shortage. In contrast, 2015 is primarily characterized by pronounced short-term and seasonal drought expression (SPI-1 and SPI-3, with partial propagation to SPI-6; Figure 5a–c), while 2017 reflects a clear vegetation-season drought signal at shorter timescales (Figure 5a,b) despite near-normal annual totals. The year 2020 is best interpreted as a moderate drought year, with episodic monthly deficits and a comparatively weaker long-term signal than 2021–2022 (Figure 5a,d). Conversely, 2016, 2018, 2019, 2023, and 2024 exhibit predominantly near-normal to wet conditions at seasonal to annual scales (Figure 5b–d), indicating limited persistence of meteorological drought. Overall, this multi-timescale characterization provides a consistent meteorological baseline for interpreting the agricultural (vegetation) responses analyzed in the subsequent section and for contextualizing associated hydrological and socio-economic implications.
3.2. Results of Hydrological Drought
Precipitation deficits and negative SPI values—together with drought-type categorization by intensity derived from CHIRPS satellite data—confirm the occurrence of meteorological drought, which may act as a trigger for the development of hydrological drought. To identify hydrological drought, the long-term mean monthly water level for the reference period (1997–2024 for HS Srbac) was compared with the mean monthly values for each year of the study period (2015–2024). Although HS Srbac is not located directly within the Ukrina River Basin but rather in its immediate surroundings, the water-level data can be interpreted as a partial hydrological response to the meteorological conditions affecting the basin. Months in which water levels decreased below the long-term mean were classified as periods of hydrological drought. Because hydrological drought may act as an intermediate factor in the development of agricultural drought, particular emphasis was placed on analyzing water levels during the vegetation period. Negative anomalies of the mean monthly water level during this period indicate reduced water availability for crops, thereby directly increasing the likelihood of agricultural drought.
To further support the interpretation of HS Srbac as an indirect indicator of basin-relevant hydrological conditions under data limitations, standardized monthly anomalies of basin-mean ERA5-Land runoff (Ukrina River Basin; 1997–2024) were compared with standardized monthly anomalies of mean water levels at HS Srbac. The analysis yielded a statistically significant relationship for the same month (lag 0), with Pearson r = 0.492 (p < 0.001, N=336) for total runoff (runoff_sum). A comparable association was obtained for subsurface runoff (r = 0.474, p < 0.001), whereas surface runoff showed a weaker yet still significant relationship (r = 0.366, p < 0.001). Lagged correlations (runoff leading by 1–2 months) were noticeably lower (for total runoff: lag 1 r = 0.243, p < 0.001; lag 2 r = 0.129, p = 0.018), indicating that the shared signal is predominantly synchronous at the monthly scale. Overall, these results confirm that HS Srbac captures a coherent regional low-water signal relevant for hydrological drought chronology of the Ukrina River Basin (Figure S1a–c).
Monthly water-level anomalies at HS Srbac (Figure 6a–j) show pronounced interannual variability in hydrological conditions during 2015–2024 and provide an indirect indication of basin-relevant low-water phases. At the scale of the vegetation season, negative mean anomalies identify years with elevated hydrological drought pressure and increased likelihood of agricultural drought. In this respect, hydrological drought conditions are most clearly expressed in 2015, 2017, 2022, and 2024, where the vegetation-season mean anomalies are negative (−4.06%, −19.34%, −29.45%, and −6.82%, respectively; Figure 6a,c,h,j). These years also coincide with, or follow, pronounced meteorological drought signals identified in Section 3.1, indicating compounding drought risk across drought dimensions.
Figure 6.
Percentage comparison of the mean monthly water-level values (HS Srbac), with an emphasis on negative anomalies, for (a) 2015, (b) 2016, (c) 2017, (d) 2018, (e) 2019, (f) 2020, (g) 2021, (h) 2022, (i) 2023, and (j) 2024, relative to the long-term mean (1997–2024) in the surroundings of the study area.
The strongest and most persistent hydrological drought signal occurs in 2022, when below-average water levels dominate much of the vegetation season and the mean anomaly reaches −29.45% (Figure 6h), consistent with the most persistent meteorological drought phase (2021–2022) identified by SPI at longer accumulation periods. A distinct drought year is also evident in 2017, when exceptionally low water levels occur early and during the vegetation season (Figure 6c), resulting in a markedly negative vegetation-season anomaly (−19.34%) and reinforcing the seasonal drought signal identified meteorologically. Although the vegetation-season anomaly in 2015 is more moderate (−4.06%), the year still exhibits clear within-year low-water phases that align with the pronounced short-term/seasonal meteorological drought in 2015. Finally, 2024 shows sustained negative vegetation-season conditions (−6.82%) and multiple within-year low-water phases (Figure 6j), suggesting renewed hydrological drought pressure toward the end of the study period.
By contrast, 2016, 2018, 2019, 2020, 2021, and 2023 exhibit positive mean anomalies during the vegetation season (+11.06%, +6.87%, +17.39%, +44.53%, +12.70%, and +61.88%; Figure 6b,d–g,i), indicating that basin-wide hydrological drought conditions were not sustained throughout the vegetation season in these years. Nevertheless, monthly patterns highlight that hydrological stress may still occur during agriculturally sensitive windows. In particular, 2020 and 2021 show exceptionally low water levels in the first half of the year (Figure 6f,g), especially during spring and early summer, which overlaps with sowing and early crop development stages and may therefore increase agricultural drought susceptibility despite positive vegetation-season means.
To complement the percent-deviation analysis of monthly mean water levels (Figure 6) with standardized values, hydrological drought conditions were additionally assessed using SWLI (Figure 7), interpreted according to the SPI drought-intensity classes adopted in this study (Table 1). Given the drought-propagation logic established in the previous subsection, particular attention was paid to SWLI behavior during the vegetation period and its consistency with the precipitation-deficit and SPI-based meteorological drought signals.
Figure 7.
SWLI time series at HS Srbac, 2015–2024.
In 2015, SWLI during the vegetation season is predominantly within mildly drought to near-normal classes, which is consistent with the meteorological drought signal identified from precipitation anomalies and SPI; an additional low-water phase is confirmed by moderate drought in December (−1.02). In 2016, conditions are mostly near normal to wet, while December again reaches moderate drought (−1.03), indicating an end-of-year standardized deficit. During 2017, a strong standardized low-water anomaly occurs in January (severe drought, −1.53), while the vegetation period is mostly characterized by mildly drought values, supporting the interpretation of drought-relevant low-water phases during the year. In 2018, SWLI indicates predominantly wet conditions through the first half of the year, followed by deterioration toward autumn with moderate drought in October (−1.15); 2019 shows moderate drought in January (−1.35), whereas most of the vegetation period remains near normal.
The most pronounced standardized hydrological drought signal occurs in 2020, when SWLI indicates persistent severe-to-extreme low-water conditions through winter–spring, including extreme drought in February (−2.00) and multiple months within severe drought classes extending into early summer, which is highly relevant for early-season agricultural water availability. In 2021, although meteorological drought was pronounced based on precipitation anomalies and multi-timescale SPI, SWLI remains mainly within mildly drought to near-normal classes during the vegetation period, suggesting that monthly mean water-level departures at HS Srbac were comparatively muted at the standardized scale. In 2022, SWLI indicates renewed hydrological stress during late winter–spring, reaching moderate drought in March (−1.01) and remaining predominantly mildly drought into summer, consistent with reduced water availability during key parts of the year. In contrast, 2023 is characterized by persistently wet conditions, while 2024 remains largely near normal, without moderate-or-stronger standardized drought during the vegetation period.
The analysis of water levels at HS Srbac during the 2015–2024 period indicates that the Ukrina Basin was indirectly exposed to multiple occurrences of hydrological drought, particularly in 2017 and 2022, when markedly below-average values were recorded during the vegetation period. Drought conditions were also evident in 2015, as well as in individual months of 2016, 2018, 2019, and 2021, indicating a relatively high frequency of drought occurrence within the basin. Although in some years (e.g., 2016, 2019, 2020, and 2023) the mean anomalies during the vegetation period were positive, certain months still exhibited extremely low water-level values that could locally favor the development of hydrological drought and, indirectly, agricultural drought. The most extreme situation occurred in 2017 and 2022, when negative anomalies throughout most of the year clearly confirmed hydrological drought and highlighted the sensitivity of the Ukrina Basin to precipitation deficits. In addition, SWLI-based standardized values provide an independent confirmation of low-water phases and support the interpretation of drought propagation from meteorological deficits toward hydrological constraints relevant for the subsequent agricultural drought assessment. Overall, the results confirm that the basin was highly prone to dry conditions during the study period, directly indicating a substantial risk of agricultural drought.
3.3. Results of Agricultural Drought
To identify agricultural drought driven by temperature-related factors, the TCI was calculated for the 2015–2024 period across the Ukrina River Basin. TCI was computed following the previously described methodology using MODIS data, with the analysis focused on July of each year, since this month is critical for the intensive development of agricultural crops in BH, and consequently within the Ukrina River Basin.
The spatial distribution of TCI values (Figure 8a–j) shows pronounced interannual variability. In 2015 (Figure 8a), negative values dominate across the entire basin, whereas in 2016 (Figure 8b) an improved thermal regime is evident, with predominantly positive values. Nevertheless, it should be noted that localized zones of temperature stress occurred in the northern parts of the basin during that year. In 2017 (Figure 8c), negative values were concentrated over almost the entire basin. In 2018 (Figure 8d) and 2019 (Figure 8e), values were mostly positive, indicating the absence of pronounced temperature stress. Similarly, 2020 (Figure 8f) was characterized predominantly by positive values. In contrast, in 2021 (Figure 8g), negative values dominated across almost the entire basin, indicating substantial temperature stress. In 2022 (Figure 8h), markedly negative values covered nearly the whole basin, pointing to intense temperature stress. During 2023 (Figure 8i) and 2024 (Figure 8j), values were largely positive, reflecting more stable thermal conditions, with only occasional localized negative areas.
Figure 8.
TCI values (a–j) and reclassified TCI values (k–t) for the study period (2015–2024) across the study area.
The classified TCI values (Figure 8k–t), according to the methodology described earlier, were grouped into the following categories: no drought, mild drought, moderate drought, severe drought, and extreme drought. The spatial and quantitative analysis indicates that 2015 (Figure 8k and Figure S2a) was characterized by the dominance of extreme drought, affecting almost the entire basin (89.14% of total basin area). In 2016 (Figure 8l and Figure S2b), a mosaic pattern is evident: at certain locations—particularly in the northern and southern parts—severe to extreme drought occurred (25.74% and 22.80% of total basin area, respectively), whereas the remaining basin was largely classified as mild drought or no drought (21.76% and 4.05% of total basin area, respectively). During 2017 (Figure 8m and Figure S2c), severe to extreme drought was widespread, covering nearly the entire basin (46.58% and 36.24% of total basin area, respectively). In contrast, 2018 (Figure 8n and Figure S2d) stands out as the only year within the study period with spatially dominant no-drought conditions (97.64% of total basin area). In 2019 (Figure 8o and Figure S2e), most of the basin falls within the no-drought category (54.87% of total basin area), with smaller zones of mild drought along the northwestern and northeastern basin margins (37.52% of total basin area). During 2020 (Figure 8p and Figure S2f), most of the basin was characterized by mild drought (51.90% of total basin area). Conversely, in 2021 (Figure 8q and Figure S2g), the basin was dominated by severe to extreme drought (47.91% and 37.53% of total basin area, respectively). In 2022 (Figure 8r and Figure S2h), the entire basin was affected by extreme drought (94.79% of total basin area), making it the most critical year of the study period. By contrast, 2023 (Figure 8s and Figure S2i) shows predominantly no-drought conditions (56.57% of total basin area) with only isolated zones of mild drought (31.35% of total basin area), while 2024 (Figure 8t and Figure S2j) is dominated by mild to moderate drought (40.00% and 31.62% of total basin area, respectively), with localized areas of severe to extreme drought along the eastern and northern basin margins (10.34% and 1.02% of total basin area, respectively).
The presented TCI results clearly indicate that temperature stress in the Ukrina River Basin varied substantially throughout the analyzed period, with major drought events in 2015 and 2022, and pronounced stress also observed in 2016, 2017, and 2021. These patterns show strong spatial and temporal agreement with the previously identified meteorological and hydrological droughts, a consistent linkage between precipitation deficits (negative SPI), below-average water levels (negative SWLI), and the occurrence of temperature-driven agricultural drought.
To identify agricultural drought driven by vegetation-related factors, the VCI was calculated for the 2015–2024 period across the Ukrina River Basin. VCI was computed following the previously described methodology using MODIS data, with the analysis focused on July of each year, since this month is critical for the intensive growth and development of agricultural crops in BH, and consequently within the Ukrina River Basin.
The spatial distribution of VCI values (Figure 9a–j) indicates pronounced interannual variability. In 2015 (Figure 9a), reduced values were observed in the northern, northeastern, and central parts of the basin, suggesting the presence of vegetation stress, whereas the remaining areas generally reflect more stable conditions. The year 2016 (Figure 9b) is characterized by a spatially uniform predominance of positive values, indicating favorable conditions for vegetation development. In 2017 (Figure 9c), markedly reduced values were recorded across almost the entire basin, pointing to widespread vegetation stress. In 2018 (Figure 9d) and 2019 (Figure 9e), VCI values were predominantly positive, with only minor localized zones of lower values, reflecting generally stable conditions within the basin. A similar pattern was observed in 2020 (Figure 9f), when most of the area was dominated by positive values. In 2021 (Figure 9g), more pronounced indicators of reduced VCI values re-emerged across the basin. In 2022 (Figure 9h), more extensive zones of reduced values were evident, particularly in the central and northern sectors, indicating intensified vegetation stress. By contrast, 2023 (Figure 9i) and 2024 (Figure 9j) were dominated by positive values, with only isolated, localized patches of reduced VCI, reflecting more stable conditions compared with previous years.
Figure 9.
VCI values (a–j) and reclassified VCI values (k–t) for the study period (2015–2024) across the Ukrina River Basin.
The classified VCI values (Figure 9k–t), following the previously described methodology, were grouped into the following categories: no drought, mild drought, moderate drought, severe drought, and extreme drought. These categories provide a clearer representation of vegetation conditions by highlighting their spatio-temporal variability. In 2015 (Figure 9k and Figure S3a), the no-drought category predominates (83.17% of total basin area), although patches of severe and extreme drought are evident in the northern part of the basin (2.29% and 2.56% of total basin area, respectively). In 2016 (Figure 9l and Figure S3b), almost the entire basin falls within the no-drought category (97.95% of total basin area). By contrast, 2017 (Figure 9m and Figure S3c) shows a broad spatial extent of severe and extreme drought (3.51% and 3.37% of total basin area, respectively) across the northern, central, and southeastern sectors of the basin, making it one of the most critical years in terms of vegetation stress within the analyzed period. In 2018 (Figure 9n and Figure S3d), the basin is largely classified as no drought (96.37% of total basin area), with only small, isolated zones of moderate, severe, and extreme drought. A similar pattern is observed in 2019 (Figure 9o and Figure S3e), when drought conditions are spatially negligible. In 2020 (Figure 9p and Figure S3f), conditions remain comparable, with the predominance of no-drought areas (98.17% of total basin area). In 2021 (Figure 9q and Figure S3g), zones of moderate to severe drought (6.48% and 4.06% of total basin area, respectively)—locally reaching extreme drought (3.69% of total basin area)—reappear, primarily in the central and northern parts of the basin. In 2022 (Figure 9r and Figure S3h), a substantial portion of the basin is affected by a mosaic of moderate, severe, and extreme drought (8.03%, 5.11%, 5.88% of total basin area, respectively). In 2023 (Figure 9s and Figure S3i) and 2024 (Figure 9t and Figure S3j), most of the basin is again classified as no drought (98.24% and 97.91% of total basin area, respectively), with only small localized patches of severe and extreme drought in the northern sector (0.57% and 0.77% of total basin area, respectively).
The presented VCI results clearly indicate that vegetation conditions across the Ukrina River Basin were relatively stable throughout most of the analyzed period, with a predominance of favorable conditions and an overall absence of drought. However, several critical years stand out—namely 2017, 2021, and 2022—as well as localized signals observed in 2015, when more pronounced vegetation stress was recorded. The spatial and temporal correspondence of these years with the previously identified meteorological and hydrological droughts further confirms a clear cause–effect relationship between precipitation deficits, reduced water levels, and the deterioration of vegetation condition within the basin.
A comprehensive assessment of agricultural drought in the Ukrina River Basin was conducted by calculating the VHI for the 2015–2024 period. As outlined in the methodological section, VHI is a composite index that integrates information on temperature stress (TCI) and vegetation/moisture conditions (VCI) into a single, overall indicator of vegetation health. In this way, VHI simultaneously reflects the combined effects of elevated temperatures and reduced soil moisture, providing a more comprehensive and reliable depiction of agricultural drought occurrence than individual indicators.
The spatial distribution of VHI values indicates pronounced interannual fluctuations in both the intensity and the extent of integrated vegetation stress (Figure 10a–j). In 2015 (Figure 10a), reduced VHI values were observed, particularly across the northeastern and central parts of the basin, suggesting the presence of vegetation stress. The following year, 2016 (Figure 10b), shows a marked improvement, with predominantly positive values and generally stable conditions. In contrast, 2017 (Figure 10c) stands out as distinctly unfavorable, with a basin-wide decline in VHI—especially in the northern, central, and southern sectors—reflecting strong combined thermal and vegetation stress. Subsequently, 2018 (Figure 10d) and 2019 (Figure 10e) indicate a stabilization of overall vegetation conditions, as positive values dominate spatially and no pronounced stress is evident. Favorable conditions persisted in 2020 (Figure 10f), again characterized by predominantly positive values. The pattern shifted in 2021 (Figure 10g), when a decline was detected in the central basin, signaling renewed integrated vegetation stress. An even stronger deterioration was recorded in 2022 (Figure 10h), when a mosaic of reduced values covered almost the entire basin, pointing to severe drought conditions. In 2023 (Figure 10i) and 2024 (Figure 10j), positive values once again prevail, with only small, localized areas of moderate stress.
Figure 10.
VHI values (a–j) and reclassified VHI values (k–t) for the study period (2015–2024) across the Ukrina River Basin.
The classified VHI values (Figure 10k–t), derived using the methodology described earlier, were grouped into five categories: no drought, mild drought, moderate drought, severe drought, and extreme drought. In 2015 (Figure 10k and Figure S4a), the basin is largely characterized by the moderate, severe, and extreme drought conditions (24.97%, 11.90%, 5.89% of total basin area, respectively) in the northeastern, central, and southwestern sectors of the basin. The year 2016 (Figure 10l and Figure S4b) stands out as relatively stable and favorable, with no-drought conditions (81.42% of total basin area) prevailing across most of the basin, while spatially fragmented patches of moderate, severe, and extreme drought (4.01%, 1.07%, 0.49% of total basin area, respectively) occur in the northern and southern parts. By contrast, 2017 (Figure 10m and Figure S4c) represents a pronounced drought year, as the northern, central, and southern sectors are affected by a mosaic of moderate, severe, and extreme drought (21.16%, 8.84%, 3.69% of total basin area, respectively). Following this dry year, 2018 (Figure 10n and Figure S4d) shows a substantial improvement, with the basin being virtually drought-free (98.41% of total basin area), a pattern that is largely maintained in 2019 with 97.11% of total basin area with no drought occurrence (Figure 10o and Figure S4e). Favorable conditions persist in 2020 (Figure 10p and Figure S4f), again dominated by the no-drought category (96.54% of total basin area). In 2021 (Figure 10q and Figure S4g), severe and extreme drought conditions (10.14% and 4.43% of total basin area, respectively) re-emerge more prominently, particularly across the northern and central basin. The most spatially extensive manifestation of agricultural drought is identified in 2022 (Figure 10r and Figure S4h), when moderate and severe drought (28.55% and 21.05% of total basin area, respectively) occur throughout the basin, while extreme drought (16.79% of total basin area) is dominant in the central sector. The final two years, 2023 (Figure 10s and Figure S4i) and 2024 (Figure 10t and Figure S4j), are generally favorable, with the no-drought category (96.83% and 94.56% of total basin area, respectively) prevailing and only rare, localized drought patches.
VHI, as an integrated indicator, clearly confirms that 2017 and 2022 were the key drought years in the Ukrina River Basin, consistent with the spatially extensive negative TCI and VCI values. In addition, pronounced agricultural drought conditions were recorded in 2015 and 2021. In contrast, 2016, 2018, 2019, 2020, 2023, and 2024 stand out as more favorable years, characterized by the dominance of the no-drought category and generally stable conditions for vegetation development. Overall, the integrated VHI-based approach suggests that, in the identified drought years, agricultural drought was sufficiently widespread and intense to potentially trigger socio-economic consequences, affecting agricultural production and local development.
3.4. Results of Socio-Economic Drought
According to the previously described methodology, socio-economic drought is manifested through reduced crop yields, i.e., decreased agricultural production, which serves as an integrated indicator of the impacts of drought conditions on the population and the local economy. For the Ukrina River Basin, the analysis included production data for maize, potatoes, wheat, apples, pears, and plums for the 2015–2019 period (Figure 11). A key limitation is that production data for later years have not been systematically monitored by the relevant institutions; therefore, this socio-economic assessment represents a partial validation limited to 2015–2019 and cannot be extended to the subsequent drought episodes after 2019. Nevertheless, the available five-year series provides supportive evidence for the consistency between previously identified meteorological, hydrological and agricultural drought signals and observed inter-annual yield variability within the period covered by official statistics.
Figure 11.
Agricultural production values (tons) in the study area for the 2015–2019 period: (a) arable crops; (b) fruit crops.
Maize production shows pronounced inter-annual fluctuations (Figure 11a). In 2015, total production was 60,947 t, which is lower than in 2016 (92,838 t). The decline in 2015 clearly reflects the drought severity classes previously identified for that year. In 2017, production decreased to 55,253 t, consistent with agricultural drought driven by precipitation deficits and lower water levels. This was followed by a recovery in 2018 (106,679 t), while production remained high in 2019 (87,776 t), albeit slightly below the 2018 level. Potato production amounted to 7765 t in 2015, again lower than in 2016 (9732 t). In 2017, production declined to 8806 t, which can be linked to drought conditions, before increasing to 9472 t in 2018. In 2019, production fell to 8009 t, indicating that fluctuations also occurred in years when drought extremes were not dominant—potentially related to flood events previously documented in the Ukrina River Basin [8]. Wheat production ranged from 14,885 t in 2015 to 18,722 t in 2016 and 21,038 t in 2017, reaching its highest value in 2018 (23,296 t). In 2019, production declined to 18,529 t. Unlike maize and potatoes, wheat did not exhibit the same magnitude of decline during drought years, suggesting a different sensitivity of winter crops to spring and autumn climatic conditions.
Apple production exhibits pronounced fluctuations (Figure 11b). In 2015, it amounted to 3474 t, declining to 2724 t in 2016 and reaching its lowest value in 2017 (2239 t), which is consistent with the drought conditions identified for that period. This was followed by an increase in 2018 (4077 t), whereas in 2019 production dropped to 856 t. The reductions observed in 2016 and 2017 reflect the influence of drought conditions, while the sharp decline in 2019 was likely driven by a combination of unfavorable climatic factors during critical developmental stages, including flood events reported for the Ukrina River Basin [8]. Pear production reached 1931 t in 2015, then decreased to 1380 t in 2016 and 1307 t in 2017. It peaked in 2018 (2055 t) and declined again in 2019 (1192 t). Pear, as a crop, shows a clear sensitivity to drought conditions in 2015 and 2017, whereas more humid years are associated with more stable yields. Plum production amounted to 9868 t in 2015, decreased to 8026 t in 2016, and reached a minimum in 2017 (4471 t). In 2018, it recorded the highest value of the entire period (12,749 t), while production was substantially lower in 2019 (4246 t). Plum appears particularly sensitive to drought conditions, but it also demonstrates strong yield potential in favorable years; the observed oscillations are additionally influenced by the pronounced alternate bearing characteristic of this fruit crop.
3.5. Results of the Assessment of the Negative Impacts of Drought
The assessment of drought impacts across the study area is based on the previously presented annual monitoring results (2015–2024), which clearly identify 2015, 2017, 2021, and 2022 as drought years. According to the defined methodology, for each of these four years, all drought categories (from mild to extreme) were first merged into a single drought polygon. Subsequently, the persistent drought zone was delineated through successive spatial intersection of the four annual polygons, i.e., the area affected by some form of drought in each of the selected years. The total area of this zone—representing the part of the basin with the highest continuous drought risk—amounts to 599.91 km2, corresponding to 40.02% of the basin area (Figure 12a).
Figure 12.
(a) The persistent drought zone in relation to elevation, and (b) its areal distribution by elevation belts within the Ukrina River Basin.
The hypsometric analysis of the persistent drought zone in the Ukrina River Basin reveals a clear regularity in the spatial distribution of this hazard (Figure 12b). Across the Ukrina River Basin, areas below 400 m a.s.l. cover 1335.21 km2, corresponding to 89.09% of the total basin area, providing the hypsometric baseline for comparison with the persistent drought zone. Although the hazard appears visually widespread, the numerical results indicate a pronounced concentration within the lower elevation belts. Compared with the basin-wide hypsometric structure, the distribution of the persistent drought zone across elevation belts differs significantly (χ2 = 49.58, df = 8, p < 0.001), indicating a non-random concentration of drought persistence at lower elevations.
The results indicate that drought as a hazard is predominantly confined to areas below 400 m a.s.l., where it covers 576.72 km2, accounting for 96.13% of the total persistent drought zone. The highest level of exposure occurs within the two lowest elevation belts: 88–200 m (297.08 km2) and 200–300 m (228.92 km2). These two belts—geographically corresponding to the broadest and lowest parts of the valley in the central and northern sections of the basin—together account for nearly 88% of the total area affected by persistent drought.
With increasing elevation, the risk of persistent drought decreases markedly. In areas above 400 m a.s.l., only 23.19 km2 (3.87%) of the analyzed zone is identified. The limited occurrence in the hilly and mountainous southern parts of the basin indicates a considerably higher resilience to drought, likely due to a greater presence of forest vegetation and different microclimatic conditions. Accordingly, persistent drought in the Ukrina River Basin represents a lowland phenomenon primarily.
The next step in assessing the adverse impacts of drought involved identifying land-use types across the basin to determine which land-use categories—and to what extent—have been persistently threatened by drought over the past decade. For this purpose, supervised classification was carried out for 2024 following the methodology described earlier, and the resulting land-use layer served as the baseline for subsequent spatial overlay analyses. Using these data, a land-use map for 2024 was produced for the Ukrina River Basin (Figure 13a). According to the classification results, forest areas represent the dominant land-use type, covering 922.22 km2 (61.54%), followed by meadows with 383.54 km2 (25.59%), agricultural areas with 158.96 km2 (10.61%), artificial surfaces with 17.95 km2 (1.20%), and water bodies with 15.99 km2 (1.06%).
Figure 13.
(a) Land use and (b) drought-affected areas as a share of the total drought-affected area, by land-use classes in the Ukrina River Basin.
By intersecting the persistent drought area with the 2024 land-use data, the land-cover structure within the zone of the highest continuous drought risk in the Ukrina River Basin was determined. Quantitative analysis (Figure 13b) indicates that forest areas are the most affected by persistent drought, covering 266.25 km2 (44.68%), which corresponds to 28.87% of the total forest area in the basin. Meadows account for 221.67 km2 (37.21%) of the persistent drought zone, meaning that 57.80% of all meadow/pasture areas are exposed to persistent drought, while agricultural areas cover 98.84 km2 (15.92%), representing as much as 59.96% of the total agricultural land. Artificial surfaces occupy 13.07 km2 (2.19%) of the persistent drought zone, which amounts to 72.81% of all areas classified as artificial surfaces; this high share is partly due to the fact that this class, in addition to built-up areas, also includes bare soil and other sparsely vegetated surfaces that are especially prone to drought signals.
Beyond the areal exposure quantified by this land-use overlay, realized drought sensitivity is also shaped by qualitative controls that are not captured by class area alone, particularly irrigation availability and soil hydrological conditions. In the Ukrina River Basin, the Basic Soil Map of Bosnia and Herzegovina (1:50,000) indicates that the lowland belt includes soil types associated with periodic water stagnation and floodplain settings (e.g., Stagnic Luvisols and alluvial soils along the river corridor), implying spatial contrasts in drainage and plant-available water within the productive zone [88]. In this lowland setting, water-management options become especially relevant: prior flood mapping documented several flood events in 2016–2019 concentrated in low-lying agricultural areas along the river corridor [8], suggesting that retention and seasonal storage of high flows (where feasible) could potentially support irrigation supply and help buffer drought impacts in the same productive belt.
This distribution—with especially high relative exposure of agricultural (arable) land and meadows/pastures, i.e., the main cultivated and productive areas—accords with the hypsometric analysis, which showed that persistent drought in the Ukrina Basin is almost exclusively associated with lowland zones, where these land-use types are concentrated.
To provide insight into the socio-geographical context of the hazard, the distribution of the persistent drought zone was analyzed in relation to the administrative–territorial division. The results show that the persistent drought zone extends across the territory of nine cities and municipalities: Srbac, Brod, Derventa, Prnjavor, Stanari, Doboj, Čelinac, Kotor Varoš, and Teslić (Figure 14a). However, the distribution is highly concentrated, with four cities/municipalities clearly standing out as the most affected, accounting for more than 93% of the total persistent drought zone (Figure 14b). The largest share belongs to the City of Prnjavor, with 247.21 km2 (41.42%), followed by the City of Derventa with 174.77 km2 (29.29%), the Municipality of Stanari with 76.88 km2 (12.88%), and the Municipality of Teslić with 59.67 km2 (10.00%).
Figure 14.
(a) The persistent drought zone in relation to the administrative boundaries of cities, municipalities, and settlements, and (b) its areal distribution by cities and municipalities within the Ukrina River Basin.
At a lower hierarchical level, the analysis indicates that the areas most affected by drought are large and spatially dispersed rural settlements. Within the City of Prnjavor, the most vulnerable settlements are Gornji Štrpci (18.10 km2), Donji Štrpci (15.34 km2), Gornji Vijačani (11.85 km2), Donji Vijačani (10.28 km2), and Kulaši (9.55 km2). Within the territory of the City of Derventa, the largest extent of persistent drought was recorded in the settlements of Cerani (18.10 km2), Osinja (17.84 km2), Donja Lupljanica (9.85 km2), and Crnča (9.55 km2). In the Municipality of Teslić, the settlement of Čečava is particularly affected (26.05 km2), while in the Municipality of Stanari, the largest shares of persistent drought occur in the settlements of Brestovo (8.68 km2), Cvrtkovci (8.68 km2), Raškovci (7.43 km2), Jelanjska (7.34 km2), and Stanari (7.20 km2).
4. Discussion
Drought conditions in BH have been reported across different regions and periods, suggesting that recent drought episodes are embedded within broader national-scale hydro-climatic variability [89,90]. In this context, the findings from the Ukrina River Basin are discussed in relation to available evidence from BH and, where needed, complemented by relevant broader literature, with methodological limitations noted where they affect interpretation.
Historical analyses confirm that drought periods have occurred continuously across different parts of BH. During 2001–2010, Zurovec et al. [89] identified 24 months with drought characteristics in central BH, while over 2001–2016, six years with extreme drought were recorded [90]. Papić [34] also reported that extreme drought was recorded at most stations in BH in 2017 and 2021–2022 based on SPI-1 and SPI-3 at 12 meteorological stations (1956–2022). Consistently, Čadro et al. [91] identified 2017 as an extremely dry summer year in BH based on SPEI. More recent evidence further supports the broader territorial footprint of drought episodes. At sub-national scales, drought conditions were also documented through precipitation deficits, negative SPI values, and elevated air temperature in the Sana River Basin [5], and through similar meteorological drought signals in the Sarajevo Canton [92].
The results of the present study are consistent with these findings. In the Ukrina River Basin, meteorological drought—characterized by precipitation deficits and negative SPI values—was identified in 2015, 2017, 2021, and 2022. The overlap of 2017 as a pronounced drought year in the Ukrina River Basin with observations from the Sarajevo Canton [92] and the Sana River Basin [5] supports the interpretation that this episode had a wider spatial extent across BH rather than being limited to a single basin.
Hydrological drought has also been documented in BH. Čadro et al. [91] found that hydrological drought was repeatedly recorded in the BH during 1961–2010, indicating the long-term presence of this phenomenon within the hydrological system of BH. In addition, Sabljić et al. [5] identified hydrological drought in the Sana River Basin during 2017, expressed through a substantial decline in water levels relative to the long-term average and linked to precipitation deficits and elevated summer air temperatures. These findings provide a relevant regional context for hydrological drought behaviour in northern BH river basins.
The present study supports this meteorological–hydrological linkage for northern BH. In the Ukrina River Basin, hydrological drought was assessed using water-level observations from the Sava River gauging station at Srbac, given that the Ukrina is a direct tributary of the Sava and no in-basin gauging data were available for Ukrina during the study period. In each year characterized by pronounced meteorological drought in the Ukrina River Basin (2015, 2017, 2021, and 2022), a substantial decline in Sava River water levels was also recorded, indicating coherent regional low-flow conditions and a strong interdependence between atmospheric forcing and hydrological response in northern BH, consistent with earlier BH evidence [5,91]. Basin-scale studies further support this interpretation for the wider Sava River Basin, as hydrological drought indicators reveal widespread decreases in summer streamflow across the basin [93], while long-term reconstructions suggest that recent decades rank among the driest and lowest-flow intervals in the Sava record [94]. Overall, these findings support the interpretation that meteorological drought acted as the primary trigger, subsequently manifesting as hydrological drought through reduced water levels and diminished discharge conditions.
Given the agricultural potential and socio-economic importance of the study area and its wider surroundings—particularly the dependence of the local population on agricultural production [85,95]—the identification of agricultural drought is critical for understanding drought impacts. The assessment in this study relied on remote sensing approaches that enable continuous spatio-temporal monitoring of vegetation conditions and drought severity, with particular emphasis on the VHI, derived by combining the TCI and the VCI. In BH, remote-sensing-based agricultural drought assessments using TCI, VCI, and VHI remain limited, which constrains direct country-specific comparisons; therefore, the interpretation is complemented by broader literature that has established the applicability and robustness of these indices.
The relevance of these indices has been widely recognized. VHI has been reported as strongly correlated with precipitation patterns and as a reliable indicator of the spatial extent and intensity of agricultural drought [96]. Combining VCI and TCI has also been shown to provide satisfactory results for drought identification and vegetation-condition assessment [97,98]. In addition, VHI has been applied to determine duration, spatial distribution, intensity, and drought categories [99], while low VCI and TCI values together with elevated air temperatures have been emphasized as strong indicators of vegetation stress and increased drought risk [100].
In line with these studies, the results obtained for the Ukrina River Basin show a high degree of agreement among TCI, VCI, and VHI patterns and their correspondence with meteorological and hydrological drought years identified in 2015, 2017, 2021, and 2022. The most pronounced declines in VHI values during 2017 and 2022 indicate a strong vegetation response to drought conditions, particularly in river valleys and on agricultural lands that are sensitive to climatic variability. The agreement between drought years detected through remote sensing and those identified through meteorological and hydrological indicators further supports the interpretation of drought as a multi-component process in northern BH, consistent with event-scale evidence reported for other regions of the country [5,92].
The obtained results should be interpreted in light of several methodological constraints. First, the spatial resolution of the CHIRPS dataset and the use of moderate-resolution satellite imagery partly constrain the precision of local-scale drought assessments. Second, hydrological conditions were evaluated using observations from a gauging station on the Sava River, which is located near—but outside—the Ukrina River Basin, and therefore represents an indirect but hydrologically relevant indicator of the basin’s hydrological response to drought. Finally, the socio-economic drought assessment based on crop-yield statistics could be performed only for 2015–2019 because municipal/city-level production data have not been maintained by the responsible institutions after 2019; therefore, socio-economic impacts of the most recent drought episodes (2020–2024) could not be quantitatively validated in the same way and should be interpreted through the meteorological, hydrological, and remote-sensing-based agricultural indicators.
Overall, comparison with available evidence from the BH indicates that the drought years identified in the Ukrina River Basin fit within documented national-scale drought variability, while the integrated framework applied here provides a coherent basin-scale interpretation of meteorological forcing, hydrological response, and vegetation impacts.
5. Conclusions
The results indicate that meteorological and hydrological drought represent key triggers of agricultural drought in the Ukrina River Basin, with impacts reflected in both the temporal evolution and spatial patterns of vegetation-based indicators. In this context, the study contributes to understanding interactions among climate anomalies, vegetation response, and drought-related degradation processes within agroecological systems of northern BH.
Based on CHIRPS precipitation data, precipitation deficits were first quantified to establish the timing and magnitude of rainfall shortages, after which SPI was derived using Gamma distribution fitting and evaluated at 1-, 3-, 6-, and 12-month accumulation periods. This approach enables a clear distinction between shorter-term anomalies and persistent precipitation deficits. The indicator-based chronology identifies pronounced meteorological drought conditions in 2015, 2017, 2021, and 2022, with the strongest persistence during 2021–2022 particularly evident at longer accumulation scales (SPI-6/12).
Hydrological variability was assessed using HS Srbac water-level observations, expressed through both anomalies and SWLI. The proxy use of HS Srbac for monthly scale drought chronology is supported by its correspondence with standardized anomalies of basin-mean ERA5-Land runoff, indicating that the station captures a coherent regional low-water signal under in-basin data limitations. Consistently, the clearest low-water phases are identified in 2017 and 2022, while SWLI also highlights severe winter–spring low-water conditions in 2020, emphasizing the relevance of off-season hydrological constraints.
The integration of satellite-based TCI, VCI, and VHI confirms that agricultural drought impacts were most pronounced in 2017 and 2022, with additional notable vegetation stress in 2015 and 2021. These findings emphasize that drought in the basin develops as a compound process whose impacts become most evident when climatic, hydrological, and vegetation indicators are interpreted jointly, thereby reinforcing the value of remote sensing as a core component of contemporary drought monitoring for early detection of vegetation stress and spatial hotspot identification.
A key practical output is the delineation of a persistent drought-prone zone covering 599.91 km2 (40.02% of the basin), concentrated predominantly below 400 m a.s.l. and largely within Prnjavor, Derventa, Stanari, and Teslić (>93% of the zone extent). The hotspot delineation indicates particularly high exposure of productive land-use types, supporting the prioritization of targeted drought-risk reduction and climate-adaptation measures in agriculture and water management at the local-government level.
Overall, the applied workflow provides a transferable basis for drought hotspot identification and supports targeted drought-risk reduction and climate-adaptation planning in data-scarce river basins, with methodological constraints addressed in Section 4. Future research should prioritize strengthening in-basin hydrometric observations, extending socio-economic validation with consistent annual datasets, and testing hotspot robustness using complementary indicators (e.g., SPEI and soil-moisture-based metrics) to support operational early-warning applications.
Supplementary Materials
The following supporting information can be downloaded at: https://www.mdpi.com/article/10.3390/atmos17020124/s1, Table S1. Error matrix for evaluating the supervised land-use classification for 2024 in the Ukrina River Basin, with rows indicating reference labels, columns indicating mapped classes, and UA (user’s accuracy) and PA (producer’s accuracy) provided alongside F1 scores. Figure S1. Evaluation of HS Srbac (Sava River) as a proxy indicator using ERA5-Land basin-mean runoff anomalies for the Ukrina River Basin. (a) Scatterplot of standardized monthly ERA5-Land basin-mean runoff anomaly (Ukrina) versus standardized monthly mean water-level anomaly at HS Srbac (Sava), with linear regression fit. (b) Time series of standardized anomalies (z) for Ukrina runoff and HS Srbac water level over 1997–2024. (c) Pearson correlation coefficients between standardized runoff and water-level anomalies for lags of 0–2 months (runoff leading). Figure S2. Percentage area share of the identified drought categories based on TCI values for (a) 2015, (b) 2016, (c) 2017, (d) 2018, (e) 2019, (f) 2020, (g) 2021, (h) 2022, (i) 2023, and (j) 2024 within the study area. Figure S3. Percentage area share of the identified drought categories based on VCI values for (a) 2015, (b) 2016, (c) 2017, (d) 2018, (e) 2019, (f) 2020, (g) 2021, (h) 2022, (i) 2023, and (j) 2024 within the study area. Figure S4. Percentage area share of the identified drought categories based on VHI values for (a) 2015, (b) 2016, (c) 2017, (d) 2018, (e) 2019, (f) 2020, (g) 2021, (h) 2022, (i) 2023, and (j) 2024 within the study area.
Author Contributions
Conceptualization, L.S., T.L. and D.B.; methodology, L.S.; software, L.S., D.B. and D.A.; validation, L.S., D.B., T.L. and D.P.; formal analysis: L.S. and D.B.; investigation, L.S. and D.A.; resources, T.L.; data curation, L.S., D.B. and D.A.; writing—original draft preparation, L.S. and T.L.; writing—review and editing, L.S., T.L., D.B., S.B.M., D.A., V.S., P.S., D.P. and T.L.; visualization, L.S.; supervision, T.L., D.B. and D.A.; project administration, L.S.; funding acquisition, T.L. All authors have read and agreed to the published version of the manuscript.
Funding
This research received no external funding.
Institutional Review Board Statement
Not applicable.
Informed Consent Statement
Not applicable.
Data Availability Statement
The data presented in this study are available on request from the corresponding author.
Acknowledgments
The authors thank the anonymous reviewers, whose comments and suggestions contributed to improving the manuscript. In preparing the manuscript, AI-assisted tools were used, including the ChatGPT—GPT-5.1 series and the Grammarly app for English proofreading. Authors are fully responsible for the originality, validity, and integrity of the content of their manuscript, including any material contributed by AI or AI-assisted tools. Furthermore, S.B.M., D.P., and T.L. acknowledge the support by the Program of Cooperation with the Serbian Scientific Diaspora—Joint Research Projects—DIASPORA 2023, from the Science Fund of the Republic of Serbia, under the project LAMINATION (The Loess Plateau Margins: Towards Innovative Sustainable Conservation), Project number: 17807.
Conflicts of Interest
The authors declare no conflicts of interest.
References
- Ghazi, B.; Salehi, H.; Przybylak, R.; Pospieszyńska, A. Assessment of drought conditions under climate change scenarios in Central Europe (Poland) using the standardized precipitation index (SPI). Clim. Serv. 2025, 39, 100591. [Google Scholar] [CrossRef] [Scilit]
- Cvetković, V.M.; Renner, R.; Aleksova, B.; Lukić, T. Geospatial and Temporal Patterns of Natural and Man-Made (Technological) Disasters (1900–2024): Insights from Different Socio-Economic and Demographic Perspectives. Appl. Sci. 2024, 14, 8129. [Google Scholar] [CrossRef] [Scilit]
- Chen, H.; Yang, N.; Song, X.; Lu, C.; Lu, M.; Chen, T.; Deng, S. A Novel Agricultural Drought Index Based on Multi-Source Remote Sensing Data and Interpretable Machine Learning. Agric. Water Manag. 2025, 308, 109303. [Google Scholar] [CrossRef] [Scilit]
- Dong, Z.; Liu, H.; Baiyinbaoligao; Hu, H.; Yawar, M.; Khan, A.; Wen, J.; Chen, L.; Tian, F. Future Projection of Seasonal Drought Characteristics Using CMIP6 in the Lancang–Mekong River Basin. J. Hydrol. 2022, 610, 127815. [Google Scholar] [CrossRef] [Scilit]
- Sabljić, L.; Lukić, T.; Marković, S.B.; Bajić, D. Potential of Remote Sensing Techniques for Integrated Spatio-Temporal Monitoring and Analysis of Drought in the Sana River Basin, Bosnia and Herzegovina. Időjárás 2024, 128, 399–423. [Google Scholar] [CrossRef] [Scilit]
- Zhao, Z.; Aslam, R.W.; Naz, I.; Afzal, Z.; Liaqut, A.; Liaquat, M.A.; Elmannai, H.; Zulqarnain, R.M. Assessment of Drought Impact on Rangelands Using Multi-Index Remote Sensing Approach. Rangel. Ecol. Manag. 2025, 102, 198–209. [Google Scholar] [CrossRef] [Scilit]
- Sabljić, L.; Pavić, D.; Savić, S.; Bajić, D. Extreme Precipitations and Their Influence on the River Flood Hazards: A Case Study of the Sana River Basin in Bosnia and Herzegovina. Geogr. Pannon. 2023, 27, 184–198. [Google Scholar] [CrossRef] [Scilit]
- Sabljić, L.; Lukić, T.; Bajić, D.; Marković, S.B.; Spalevic, V.; Cvetković, V.M.; Delić, D.; Adžić, D.; Aleksova, B.; Milevski, I.; et al. Spatio-Temporal Analysis of Flood Events Using GIS and Remote Sensing-Based Approach in the Ukrina River Basin, Bosnia and Herzegovina. Open Geosci. 2025, 17, 20250856. [Google Scholar] [CrossRef] [Scilit]
- Stojanović, V.; Sabljić, L.; Marković, V.; Lukić, T. Where Faith Meets Geomorphology: The Cultural and Religious Significance of Geodiversity Explored Through Geospatial Technologies. Open Geosci. 2025, 17, 20250876. [Google Scholar] [CrossRef] [Scilit]
- Sabljić, L.; Perić, Z.M.; Bajić, D.; Marković, S.B.; Adžić, D.; Lukić, T. Advancing Wildfire Monitoring: Remote Sensing Techniques and Applications in the Sana River Basin, Bosnia and Herzegovina. Nat. Hazards 2025, 121, 18321–18360. [Google Scholar] [CrossRef] [Scilit]
- van Loon, A.F. Hydrological Drought Explained. WIREs Water 2015, 2, 359–392. [Google Scholar] [CrossRef] [Scilit]
- Zubair, M.; Zafar, Z.; Yao, S.; Guo, Z.; Nadeem, A.A.; Fahd, S. Agricultural Drought Forecasting Using Remote Sensing: A Hybrid Modeling Framework by Integrating Wavelet Transformation and Machine Learning Techniques. Agric. Water Manag. 2025, 321, 109922. [Google Scholar] [CrossRef] [Scilit]
- Su, J.; Ding, Y.; Liu, Y.; Wang, J.; Zhang, Y. China Is Suffering from Fewer but More Severe Drought-to-Flood Abrupt Alternation Events. Weather Clim. Extrem. 2024, 46, 100737. [Google Scholar] [CrossRef] [Scilit]
- Heiß, I.; Stegmann, F.; Wolf, M.; Volk, M.; Kaim, A. Supporting the Spatial Allocation of Management Practices to Improve Ecosystem Services—An Opportunity Map Approach for Agricultural Landscapes. Ecol. Indic. 2025, 172, 113212. [Google Scholar] [CrossRef] [Scilit]
- Jiang, J.; Wang, Z.; Zhang, Z.; Wu, X.; Lai, C.; Zeng, Z.; Chen, X. Extreme Drought–Heatwave Exacerbates Water Quality Deterioration in China. Ecol. Indic. 2025, 170, 113008. [Google Scholar] [CrossRef] [Scilit]
- Dracup, J.A.; Lee, K.S.; Paulson, E.G., Jr. On the Statistical Characteristics of Drought Events. Water Resour. Res. 1980, 16, 289–296. [Google Scholar] [CrossRef] [Scilit]
- Wilhite, D.A.; Glantz, M.H. Understanding the Drought Phenomenon: The Role of Definitions. Water Int. 1985, 10, 111–120. [Google Scholar] [CrossRef] [Scilit]
- Li, Z.; Han, Y.; Hao, T. Assessing the Consistency of Remotely Sensed Multiple Drought Indices for Monitoring Drought Phenomena in Continental China. IEEE Trans. Geosci. Remote Sens. 2020, 58, 5490–5502. [Google Scholar] [CrossRef] [Scilit]
- Aslam, R.W.; Shu, H.; Yaseen, A.; Sajjad, A.; Ul Abidin, S.Z. Identification of Time-Varying Wetlands Neglected in Pakistan through Remote Sensing Techniques. Environ. Sci. Pollut. Res. 2023, 30, 74031–74044. [Google Scholar] [CrossRef] [Scilit]
- Shu, P.; Aslam, R.W.; Naz, I.; Ghaffar, B.; Kucher, D.E.; Quddoos, S. Deep Learning-Based Super-Resolution of Remote Sensing Images for Enhanced Groundwater Quality Assessment and Environmental Monitoring in Urban Areas. IEEE J. Sel. Top. Appl. Earth Obs. Remote Sens. 2025, 18, 7933–7949. [Google Scholar] [CrossRef] [Scilit]
- Ezzine, H.; Bouziane, A.; Ouazar, R. Seasonal Comparisons of Meteorological and Agricultural Drought Indices in Morocco Using Open Short Time-Series Data. Int. J. Appl. Earth Obs. Geoinf. 2014, 26, 36–48. [Google Scholar] [CrossRef] [Scilit]
- Tang, J.; Zeng, J.; Zhang, L.; Zhang, R.; Li, J.; Li, X.; Zou, J.; Zeng, Y.; Xu, Z.; Wang, Q.; et al. A Modified Flexible Spatiotemporal Data Fusion Model. Front. Earth Sci. 2020, 14, 601–614. [Google Scholar] [CrossRef] [Scilit]
- Zhu, Q.; Luo, Y.; Zhou, D.; Xu, Y.-P.; Wang, G.; Gao, H. Drought Monitoring Utility Using Satellite-Based Precipitation Products over the Xiang River Basin in China. Remote Sens. 2019, 11, 1483. [Google Scholar] [CrossRef] [Scilit]
- Gao, F.; Zhang, Y.; Ren, X.; Yao, Y.; Hao, Z.; Cai, W. Evaluation of CHIRPS and Its Application for Drought Monitoring over the Haihe River Basin, China. Nat. Hazards 2018, 92, 155–172. [Google Scholar] [CrossRef] [Scilit]
- Tladi, T.M.; Ndambuki, J.M.; Salim, R.W. Meteorological Drought Monitoring in the Upper Olifants Sub-Basin, South Africa. Phys. Chem. Earth 2022, 128, 103273. [Google Scholar] [CrossRef] [Scilit]
- Zhang, X.; Duan, J.; Cherubini, F.; Ma, Z. A Global Daily Evapotranspiration Deficit Index Dataset for Quantifying Drought Severity from 1979 to 2022. Sci. Data 2023, 10, 824. [Google Scholar] [CrossRef] [Scilit]
- Oukaddour, K.; Le Page, M.; Fakir, Y. Toward a Redefinition of Agricultural Drought Periods—A Case Study in a Mediterranean Semi-Arid Region. Remote Sens. 2024, 16, 83. [Google Scholar] [CrossRef] [Scilit]
- Wilhite, D.A. Drought as a Natural Hazard: Concepts and Definitions. In Drought: A Global Assessment; Wilhite, D.A., Ed.; Routledge: London, UK, 2000; Volume 1, pp. 3–18. [Google Scholar]
- Terzi, T.B.; Önöz, B. DroughtStats: A Comprehensive Software for Drought Monitoring and Analysis. Earth Sci. Inform. 2025, 18, 159. [Google Scholar] [CrossRef] [Scilit]
- Nalbantis, I.; Tsakiris, G. Assessment of Hydrological Drought Revisited. Water Resour. Manag. 2009, 23, 881–897. [Google Scholar] [CrossRef] [Scilit]
- Zhu, Y.; Wang, W.; Singh, V.P.; Liu, Y. Combined Use of Meteorological Drought Indices at Multi-Time Scales for Improving Hydrological Drought Detection. Sci. Total Environ. 2016, 571, 1058–1068. [Google Scholar] [CrossRef] [Scilit]
- Čadro, S.; Marković, M.; Hadžić, A.; Hadžić, A.; Žurovec, O. Assessing the Impact of Climate Change on Extreme Hydrological Events in Bosnia and Herzegovina Using SPEI. J. Cent. Eur. Agric. 2024, 25, 531–541. [Google Scholar] [CrossRef] [Scilit]
- Papić, D. Spatial and Temporal Dynamics of Drought in Bosnia and Herzegovina during the Period 1956–2023. Int. J. Climatol. 2025, 45, e70054. [Google Scholar] [CrossRef] [Scilit]
- Papić, D. Evaluation of Drought in Bosnia and Herzegovina During the Period 1956–2022. Időjárás 2025, 129, 357–372. [Google Scholar] [CrossRef] [Scilit]
- Ducić, V.; Burić, D.; Trbić, G.; Cupać, R. Analysis of Precipitation and Droughts on BiH Territory Based upon Standardized Precipitation Index (SPI). Herald 2014, 18, 53–70. [Google Scholar] [CrossRef] [Scilit]
- Popov, T.; Gnjato, S.; Bajić, D.; Trbić, G. Spatial Patterns of Precipitation in Bosnia and Herzegovina. J. Geogr. Inst. Jovan Cvijic SASA 2019, 69, 185–195. [Google Scholar] [CrossRef] [Scilit]
- Popov, T.; Delić, D. Recent Climate Change in the Semberija Region—Impact on Agricultural Production. Herald 2019, 23, 35–58. [Google Scholar] [CrossRef] [Scilit]
- Trbić, G.; Bajić, D.; Popov, T.; Oprašić, S. Problems of Drought in Bosnia and Herzegovina. Herald 2013, 17, 103–120. [Google Scholar] [CrossRef] [Scilit]
- Trbić, G.; Đurđević, V.; Bajić, D.; Cupać, R.; Vukmir, G.; Popov, T. Climate Change and Adaptation Options in Bosnia and Herzegovina—Case Study in Agriculture. In Proceedings of the International Conference “ADAPT to CLIMATE”, Nicosia, Cyprus, 27–28 March 2014. [Google Scholar]
- Trbic, G.; Popov, T.; Djurdjevic, V.; Milunovic, I.; Dejanovic, T.; Gnjato, S.; Ivanisevic, M. Climate Change in Bosnia and Herzegovina According to Climate Scenario RCP8.5 and Possible Impact on Fruit Production. Atmosphere 2022, 13, 1. [Google Scholar] [CrossRef] [Scilit]
- Popov, T.; Gnjato, S.; Trbić, G. Changes in temperature extremes in Bosnia and Herzegovina: A fixed thresholds-based index analysis. J. Geogr. Inst. Jovan Cvijic SASA 2018, 68, 17–33. [Google Scholar] [CrossRef] [Scilit]
- Mishra, A.K.; Singh, V.P. A Review of Drought Concepts. J. Hydrol. 2010, 391, 202–216. [Google Scholar] [CrossRef] [Scilit]
- Wang, Y.; Chen, Y.; Wen, J.; Wu, C.; Zhou, W.; Han, L.; Tang, X. Early Warning of Drought-Induced Vegetation Stress Using Multiple Satellite-Based Ecological Indicators. Ecol. Indic. 2024, 169, 112857. [Google Scholar] [CrossRef] [Scilit]
- Anyamba, A.; Tucker, C.J.; Eastman, J.R. NDVI Anomaly Patterns over Africa during the 1997/98 ENSO Warm Event. Int. J. Remote Sens. 2001, 22, 1847–1859. [Google Scholar] [CrossRef]
- Ji, L.; Peters, A.J. Assessing Vegetation Response to Drought in the Northern Great Plains Using Vegetation and Drought Indices. Remote Sens. Environ. 2003, 87, 85–98. [Google Scholar] [CrossRef] [Scilit]
- Ahady, A.B.; Klopries, E.-M.; Schüttrumpf, H.; Wolf, S. Drought Analysis Methods: A Multidisciplinary Review with Insights on Key Decision-Making Factors in Method Selection. Water 2025, 17, 2248. [Google Scholar] [CrossRef] [Scilit]
- Cammalleri, C.; Naumann, G.; Mentaschi, L.; Formetta, G.; Forzieri, G.; Gosling, S.; Bisselink, B.; De Roo, A.; Feyen, L. Global Warming and Drought Impacts in the EU (EUR 29956 EN); Publications Office of the European Union: Luxembourg, 2020. [Google Scholar] [CrossRef]
- Smith, A.B. U.S. Billion-Dollar Weather and Climate Disasters, 1980–Present; NCEI Accession 0209268; National Centers for Environmental Information (NCEI): Asheville, NC, USA, 2020. [Google Scholar]
- Al-Qubati, A.; Zhang, L.; Pyarali, K. Climatic Drought Impacts on Key Ecosystem Services of a Low Mountain Region in Germany. Environ. Monit. Assess. 2023, 195, 800. [Google Scholar] [CrossRef] [Scilit]
- Łabędzki, L. Actions and Measures for Mitigation of Drought and Water Scarcity in Agriculture. J. Water Land Dev. 2016, 29, 3–10. [Google Scholar] [CrossRef] [Scilit]
- Hodzic, S.; Markovic, M.; Custovic, H. Drought Conditions and Management Strategies in Bosnia and Herzegovina (Bosnia and Herzegovina—Concise Country Report); Initiative on “Capacity Development to Support National Drought Management Policy”; WMO: Geneva, Switzerland; UNCCD: Bonn, Germany; FAO: Rome, Italy; UNW-DPC: Bonn, Germany, 2013. [Google Scholar]
- Lehner, B.; Grill, G. Global River Hydrography and Network Routing: Baseline Data and New Approaches to Study the World’s Large River Systems. Hydrol. Process. 2013, 27, 2171–2186. [Google Scholar] [CrossRef] [Scilit]
- Lovrić, N.; Tošić, R.; Dragićević, S.; Novković, I. Assessment of Torrential Flood Susceptibility: Case Study—Ukrina River Basin (B&H). Bull. Serb. Geogr. Soc. 2019, 99, 1–16. [Google Scholar] [CrossRef] [Scilit]
- Tošić, R. Bilans nanosa u slivu rijeke Ukrine [Sediment Balance in the Ukrina River Basin]. Glas. Geogr. Društva Repub. Srp. 2005, 10, 59–75. (In Serbian) [Google Scholar]
- Kottek, M.; Grieser, J.; Beck, C.; Rudolf, B.; Rubel, F. World Map of the Köppen–Geiger Climate Classification Updated. Meteorol. Z. 2006, 15, 259–263. [Google Scholar] [CrossRef] [Scilit]
- Republika Srpska Institute of Statistics. Cities and Municipalities of Republika Srpska 2024; Republika Srpska Institute of Statistics: Banja Luka, Bosnia and Herzegovina, 2024; Available online: https://rzs.rs.ba (accessed on 10 September 2025).
- Hersbach, H.; Bell, B.; Berrisford, P.; Hirahara, S.; Horányi, A.; Muñoz-Sabater, J.; Nicolas, J.; Peubey, C.; Radu, R.; Schepers, D.; et al. Complete ERA5 from 1940: Fifth Generation of ECMWF Atmospheric Reanalyses of the Global Climate. Copernicus Climate Change Service (C3S) Climate Data Store (CDS). 2017. Available online: https://cds.climate.copernicus.eu/datasets/reanalysis-era5-complete?tab=overview (accessed on 22 August 2025). [CrossRef]
- Funk, C.; Peterson, P.; Landsfeld, M.; Pedreros, D.; Verdin, J.; Shukla, S.; Husak, G.; Rowland, J.; Harrison, L.; Hoell, A.; et al. The Climate Hazards Infrared Precipitation with Stations—A New Environmental Record for Monitoring Extremes. Sci. Data 2015, 2, 150066. [Google Scholar] [CrossRef] [Scilit]
- Pellicone, G.; Caloiero, T.; Coscarelli, R.; Chiaravalloti, F. Assessment of Multiple Satellite Precipitation Products over Italy. Remote Sens. 2025, 17, 3772. [Google Scholar] [CrossRef] [Scilit]
- World Meteorological Organization (WMO). WMO Guidelines on the Calculation of Climate Normals (WMO-No. 1203); World Meteorological Organization: Geneva, Switzerland, 2017; ISBN 978-92-63-11203-3. [Google Scholar]
- Lukić, T.; Micić Ponjiger, T.; Basarin, B.; Sakulski, D.; Gavrilov, M.; Marković, S.; Zorn, M.; Komac, B.; Milanović, M.; Pavić, D.; et al. Application of Angot Precipitation Index in the Assessment of Rainfall Erosivity: Vojvodina Region Case Study (North Serbia). Acta Geogr. Slov. 2021, 61, 123–153. [Google Scholar] [CrossRef] [Scilit]
- McKee, T.B.; Doesken, N.J.; Kleist, J. The Relationship of Drought Frequency and Duration to Time Scales. In Proceedings of the 8th Conference on Applied Climatology, Anaheim, CA, USA, 17–22 January 1993; pp. 179–183. [Google Scholar]
- Jamalzi, A.B.; Rahman, G.; Akhtar, F.; Ikram, Q.D.; Kwon, H. Spatiotemporal assessment and trend analysis of meteorological drought in Afghanistan (1974–2023) using SPI and SPEI indices. J. Hydrol. Reg. Stud. 2025, 61, 102711. [Google Scholar] [CrossRef] [Scilit]
- Moccia, B.; Mineo, C.; Ridolfi, E.; Russo, F.; Napolitano, F. SPI-Based Drought Classification in Italy: Influence of Different Probability Distribution Functions. Water 2022, 14, 3668. [Google Scholar] [CrossRef] [Scilit]
- Leščešen, I.; Gnjato, S.; Vujačić, D.; Petrović, A.M.; Radevski, I. Seasonal Variability Changes and Trends in Minimum Discharge for Western Balkan Rivers. J. Hydrol. Reg. Stud. 2025, 60, 102529. [Google Scholar] [CrossRef] [Scilit]
- World Meteorological Organization (WMO). Guide to Hydrological Practices: Volume I—Hydrology—From Measurement to Hydrological Information, 6th ed.; WMO-No. 168/1; World Meteorological Organization: Geneva, Switzerland, 2008. [Google Scholar]
- Nazarenko, S.; Kriaučiūnienė, J.; Šarauskienė, D.; Povilaitis, A. The Development of a Hydrological Drought Index for Lithuania. Water 2023, 15, 1512. [Google Scholar] [CrossRef] [Scilit]
- Didan, K. MODIS/Terra Vegetation Indices 16-Day L3 Global 250m SIN Grid V061; Data Set; NASA EOSDIS Land Processes Distributed Active Archive Center: Sioux Falls, SD, USA, 2021. [Google Scholar] [CrossRef]
- Wan, Z.; Hook, S.; Hulley, G. MODIS/Terra Land Surface Temperature/Emissivity 8-Day L3 Global 1km SIN Grid V061; Data Set; NASA EOSDIS Land Processes Distributed Active Archive Center: Sioux Falls, SD, USA, 2021. [Google Scholar] [CrossRef]
- Kogan, F.N. Application of Vegetation Index and Brightness Temperature for Drought Detection. Adv. Space Res. 1995, 15, 91–100. [Google Scholar] [CrossRef] [Scilit]
- Kogan, F.N. Global Drought Watch from Space. Bull. Am. Meteorol. Soc. 1997, 78, 621–636. [Google Scholar] [CrossRef] [Scilit]
- Wang, A.; Sun, L.; Liu, J. An Innovative TOPSIS–Mahalanobis Distance Approach to Comprehensive Spatial Prioritization Based on Multi-Dimensional Drought Indicators. Atmosphere 2024, 15, 1347. [Google Scholar] [CrossRef] [Scilit]
- Bhuiyan, C.; Singh, R.P.; Kogan, F.N. Monitoring Drought Dynamics in the Aravalli Region (India) Using Different Indices Based on Ground and Remote Sensing Data. Int. J. Appl. Earth Obs. Geoinf. 2006, 8, 289–302. [Google Scholar] [CrossRef] [Scilit]
- Serban, C.; Maftei, C. Remote Sensing Evaluation of Drought Effects on Crop Yields Across Dobrogea, Romania, Using Vegetation Health Index (VHI). Agriculture 2025, 15, 668. [Google Scholar] [CrossRef] [Scilit]
- Chou, C.-B.; Weng, M.-C.; Huang, H.-P.; Chang, Y.-C.; Chang, H.-C.; Yeh, T.-Y. Monitoring the Spring 2021 Drought Event in Taiwan Using Multiple Satellite-Based Vegetation and Water Indices. Atmosphere 2022, 13, 1374. [Google Scholar] [CrossRef] [Scilit]
- Jiang, R.; Liang, J.; Zhao, Y.; Wang, H.; Xie, J.; Lu, X.; Li, F. Assessment of vegetation growth and drought conditions using satellite-based vegetation health indices in Jing-Jin-Ji region of China. Sci. Rep. 2021, 11, 13775. [Google Scholar] [CrossRef] [Scilit] [PubMed]
- Mathbout, S.; Boustras, G.; Papazoglou, P.; Martin Vide, J.; Raai, F. Integrating climate indices and land use practices for comprehensive drought monitoring in Syria: Impacts and implications. Environ. Sustain. Indic. 2025, 26, 100631. [Google Scholar] [CrossRef] [Scilit]
- Monteleone, B.; Bonaccorso, B.; Martina, M. A joint probabilistic index for objective drought identification: The case study of Haiti. Nat. Hazards Earth Syst. Sci. 2020, 20, 471–487. [Google Scholar] [CrossRef] [Scilit]
- Kogan, F.; Salazar, L.; Roytman, L. Forecasting crop production using satellite-based vegetation health indices in Kansas, USA. Int. J. Remote Sens. 2012, 33, 2798–2814. [Google Scholar] [CrossRef] [Scilit]
- Kogan, F.N. Remote Sensing of Weather Impacts on Vegetation in Non-Homogeneous Areas. Int. J. Remote Sens. 1990, 11, 1405–1419. [Google Scholar] [CrossRef] [Scilit]
- Kogan, F.N. Droughts of the Late 1980s in the United States as Derived from NOAA Polar-Orbiting Satellite Data. Bull. Am. Meteorol. Soc. 1995, 76, 655–668. [Google Scholar] [CrossRef] [Scilit]
- Zeng, J.; Zhang, R.; Qu, Y.; Bento, V.A.; Zhou, T.; Lin, Y.; Wu, X.; Qi, J.; Shui, W.; Wang, Q. Improving the Drought Monitoring Capability of VHI at the Global Scale via Ensemble Indices for Various Vegetation Types from 2001 to 2018. Weather Clim. Extrem. 2022, 35, 100412. [Google Scholar] [CrossRef] [Scilit]
- Transon, J.; D’Andrimont, R.; Maugnard, A.; Defourny, P. Survey of Hyperspectral Earth Observation Applications from Space in the Sentinel-2 Context. Remote Sens. 2018, 10, 157. [Google Scholar] [CrossRef] [Scilit]
- Sabljić, L.; Lukić, T.; Bajić, D.; Marković, S.B.; Delić, D. Application of Remote Sensing in Monitoring Land Degradation: A Case Study of Stanari Municipality (Bosnia and Herzegovina). Open Geosci. 2024, 16, 20220671. [Google Scholar] [CrossRef] [Scilit]
- Sabljić, L.; Lukić, T.; Bajić, D.; Marković, R.; Spalević, V.; Delić, D.; Radivojević, A.R. Optimizing Agricultural Land Use: A GIS-Based Assessment of Suitability in the Sana River Basin, Bosnia and Herzegovina. Open Geosci. 2024, 16, 20220683. [Google Scholar] [CrossRef] [Scilit]
- Bajić, D.; Adžić, D.; Sabljić, L. Winter Crops Classification Using Combination of Multi-Temporal Optical Sentinel-2 and Radar Sentinel-1 Images. Herald 2022, 26, 27–50. [Google Scholar] [CrossRef] [Scilit]
- van Vliet, J.; Bregt, A.K.; Hagen-Zanker, A. Revisiting Kappa to Account for Change in the Accuracy Assessment of Land-Use Change Models. Ecol. Model. 2011, 222, 1367–1375. [Google Scholar] [CrossRef] [Scilit]
- Institut za agropedologiju. Osnovna pedološka karta Bosne i Hercegovine u razmeri 1:50.000 [Basic Soil Map of Bosnia and Herzegovina, scale 1:50,000]; Institut za agropedologiju: Sarajevo, Bosnia and Herzegovina, 1990. [Google Scholar]
- Zurovec, J.; Cadro, S.; Murtic, S. Drought Analysis in Sarajevo Using Standardized Precipitation Index (SPI). In Proceedings of the 22nd International Scientific-Expert Conference of Agriculture and Food Industry, Sarajevo, Bosnia and Herzegovina, 28 September–1 October 2011; pp. 261–264. [Google Scholar]
- Zurovec, O.; Vedeld, P.O.; Sitaula, B.K. Agricultural Sector of Bosnia and Herzegovina and Climate Change—Challenges and Opportunities. Agriculture 2015, 5, 245–266. [Google Scholar] [CrossRef] [Scilit]
- Čadro, S.; Žurovec, J.; Cherni-Čadro, S. Severity, Magnitude and Duration of Droughts in Bosnia and Herzegovina Using Standardized Precipitation Evapotranspiration Index (SPEI). Agric. For. 2017, 63, 199–206. [Google Scholar] [CrossRef] [Scilit]
- Điderlija, M.; Kulo, N.; Mulahusić, A.; Tuno, N.; Topoljak, J. Correlation Analysis of Different Optical Remote Sensing Indices for Drought Monitoring: A Case Study of Canton Sarajevo, Bosnia and Herzegovina. Environ. Monit. Assess. 2023, 195, 1338. [Google Scholar] [CrossRef] [Scilit]
- Leščešen, I.; Gnjato, S.; Galinović, I.; Basarin, B. Hydrological Drought Assessment of the Sava River Basin in South-Eastern Europe. J. Water Clim. Chang. 2024, 15, 3902–3918. [Google Scholar] [CrossRef] [Scilit]
- Ramírez Molina, A.A.; Leščešen, I.; Tootle, G.; Gong, J.; Josić, M. Hydrological Dynamics and Climate Variability in the Sava River Basin: Streamflow Reconstructions Using Tree-Ring-Based Paleo Proxies. Water 2025, 17, 417. [Google Scholar] [CrossRef] [Scilit]
- Korjenić, A. Climate as Spatial Planning Factor of the Una Sana Canton, Bosnia and Herzegovina. Geogr. Pannon. 2012, 16, 126–135. [Google Scholar] [CrossRef] [Scilit]
- Seiler, R.A.; Kogan, F.; Sullivan, J. AVHRR-Based Vegetation and Temperature Condition Indices for Drought Detection in Argentina. Adv. Space Res. 1998, 21, 481–484. [Google Scholar] [CrossRef] [Scilit]
- Tsiros, E.; Domenikiotis, C.; Spiliotopoulos, M.; Dalezios, N.R. Use of NOAA/AVHRR-Based Vegetation Condition Index (VCI) and Temperature Condition Index (TCI) for Drought Monitoring in Thessaly, Greece. In Proceedings of the EWRA Symposium on Water Resources Management: Risks and Challenges for the 21st Century, Izmir, Turkey, 2–4 September 2004. [Google Scholar]
- Parviz, L. Determination of Effective Indices in the Drought Monitoring through Analysis of Satellite Images. Agric. For. 2016, 62, 305–324. [Google Scholar] [CrossRef] [Scilit]
- Ma’rufah, U.; Hidayat, R.; Prasasti, I. Analysis of Relationship between Meteorological and Agricultural Drought Using Standardized Precipitation Index and Vegetation Health Index. IOP Conf. Ser. Earth Environ. Sci. 2017, 54, 012008. [Google Scholar] [CrossRef] [Scilit]
- Gidey, E.; Dikinya, O.; Sebego, R.; Segosebe, E.; Zenebe, A. Analysis of the Long-Term Agricultural Drought Onset, Cessation, Duration, Frequency, Severity and Spatial Extent Using Vegetation Health Index (VHI) in Raya and Its Environs, Northern Ethiopia. Environ. Syst. Res. 2018, 7, 13. [Google Scholar] [CrossRef] [Scilit]
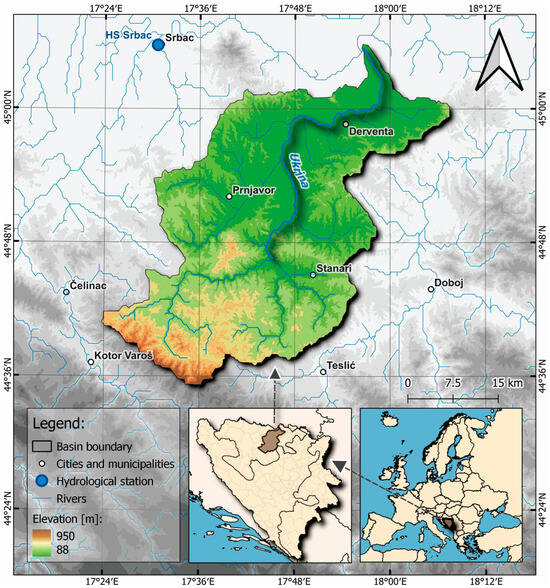
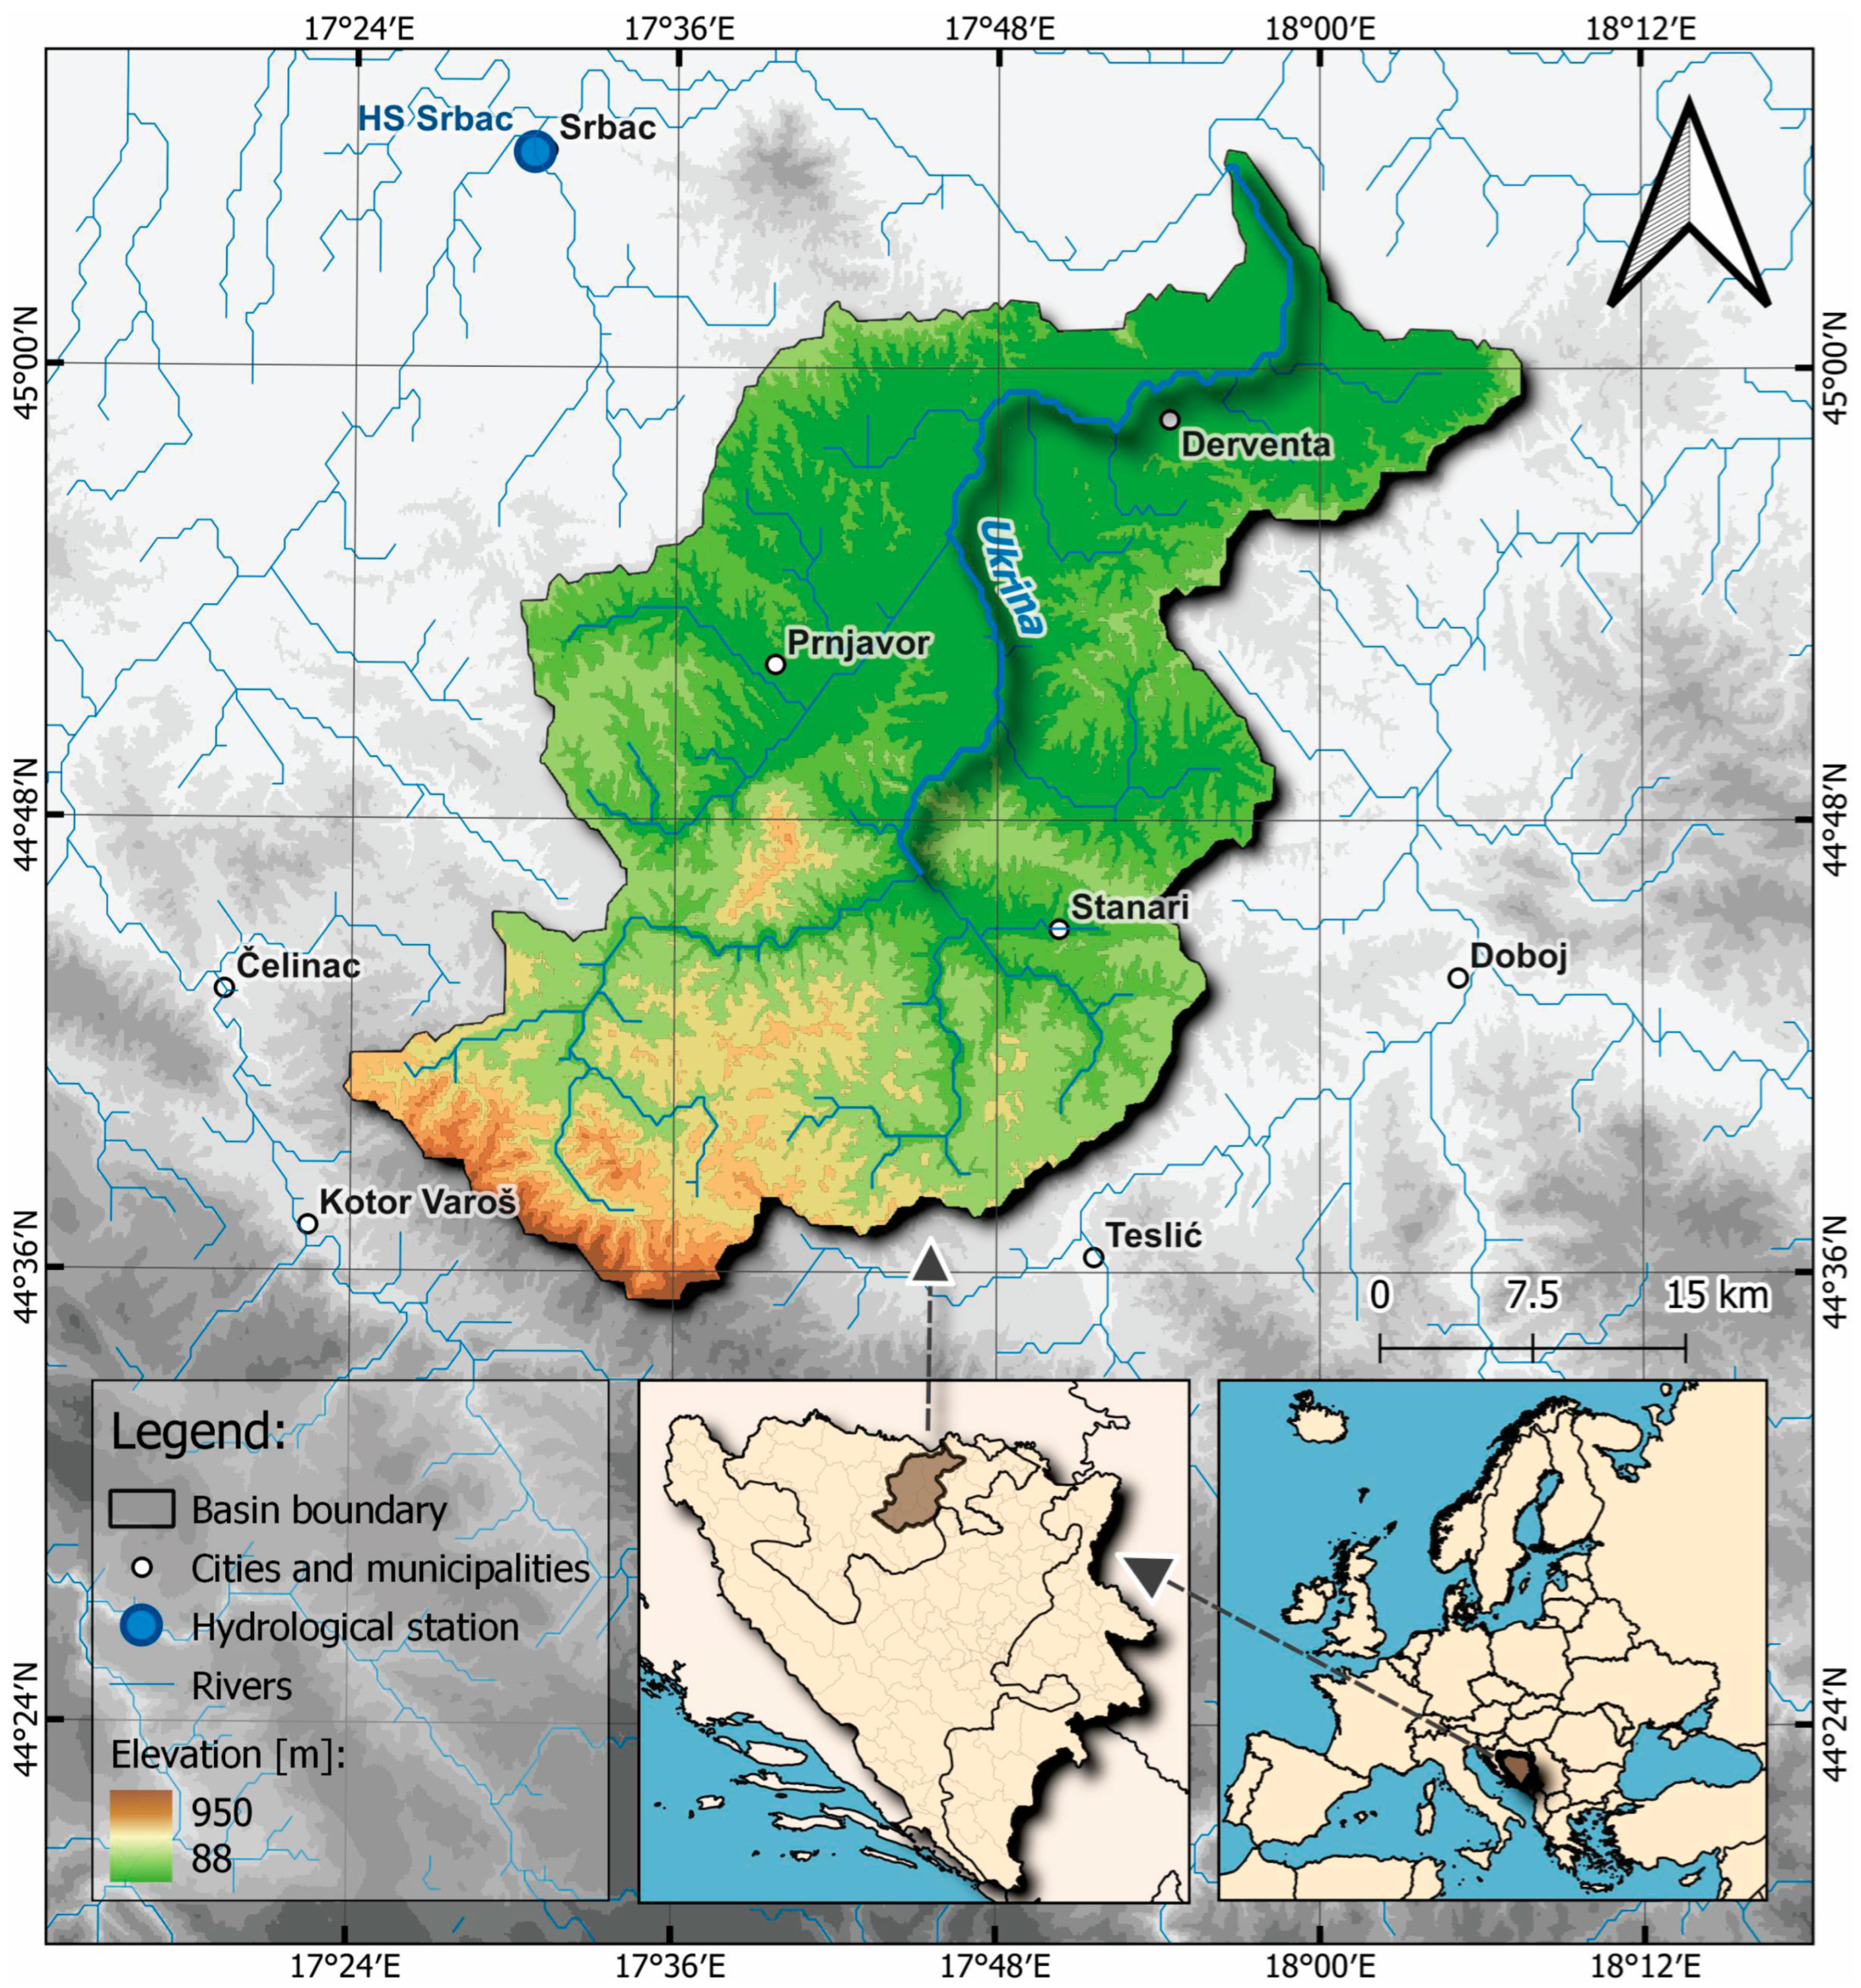
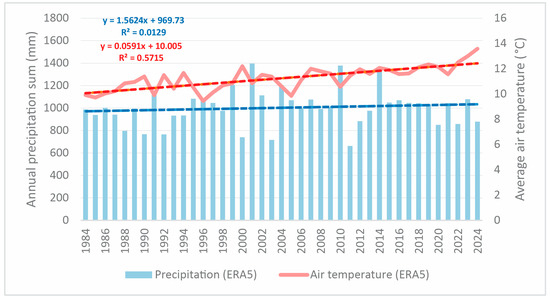
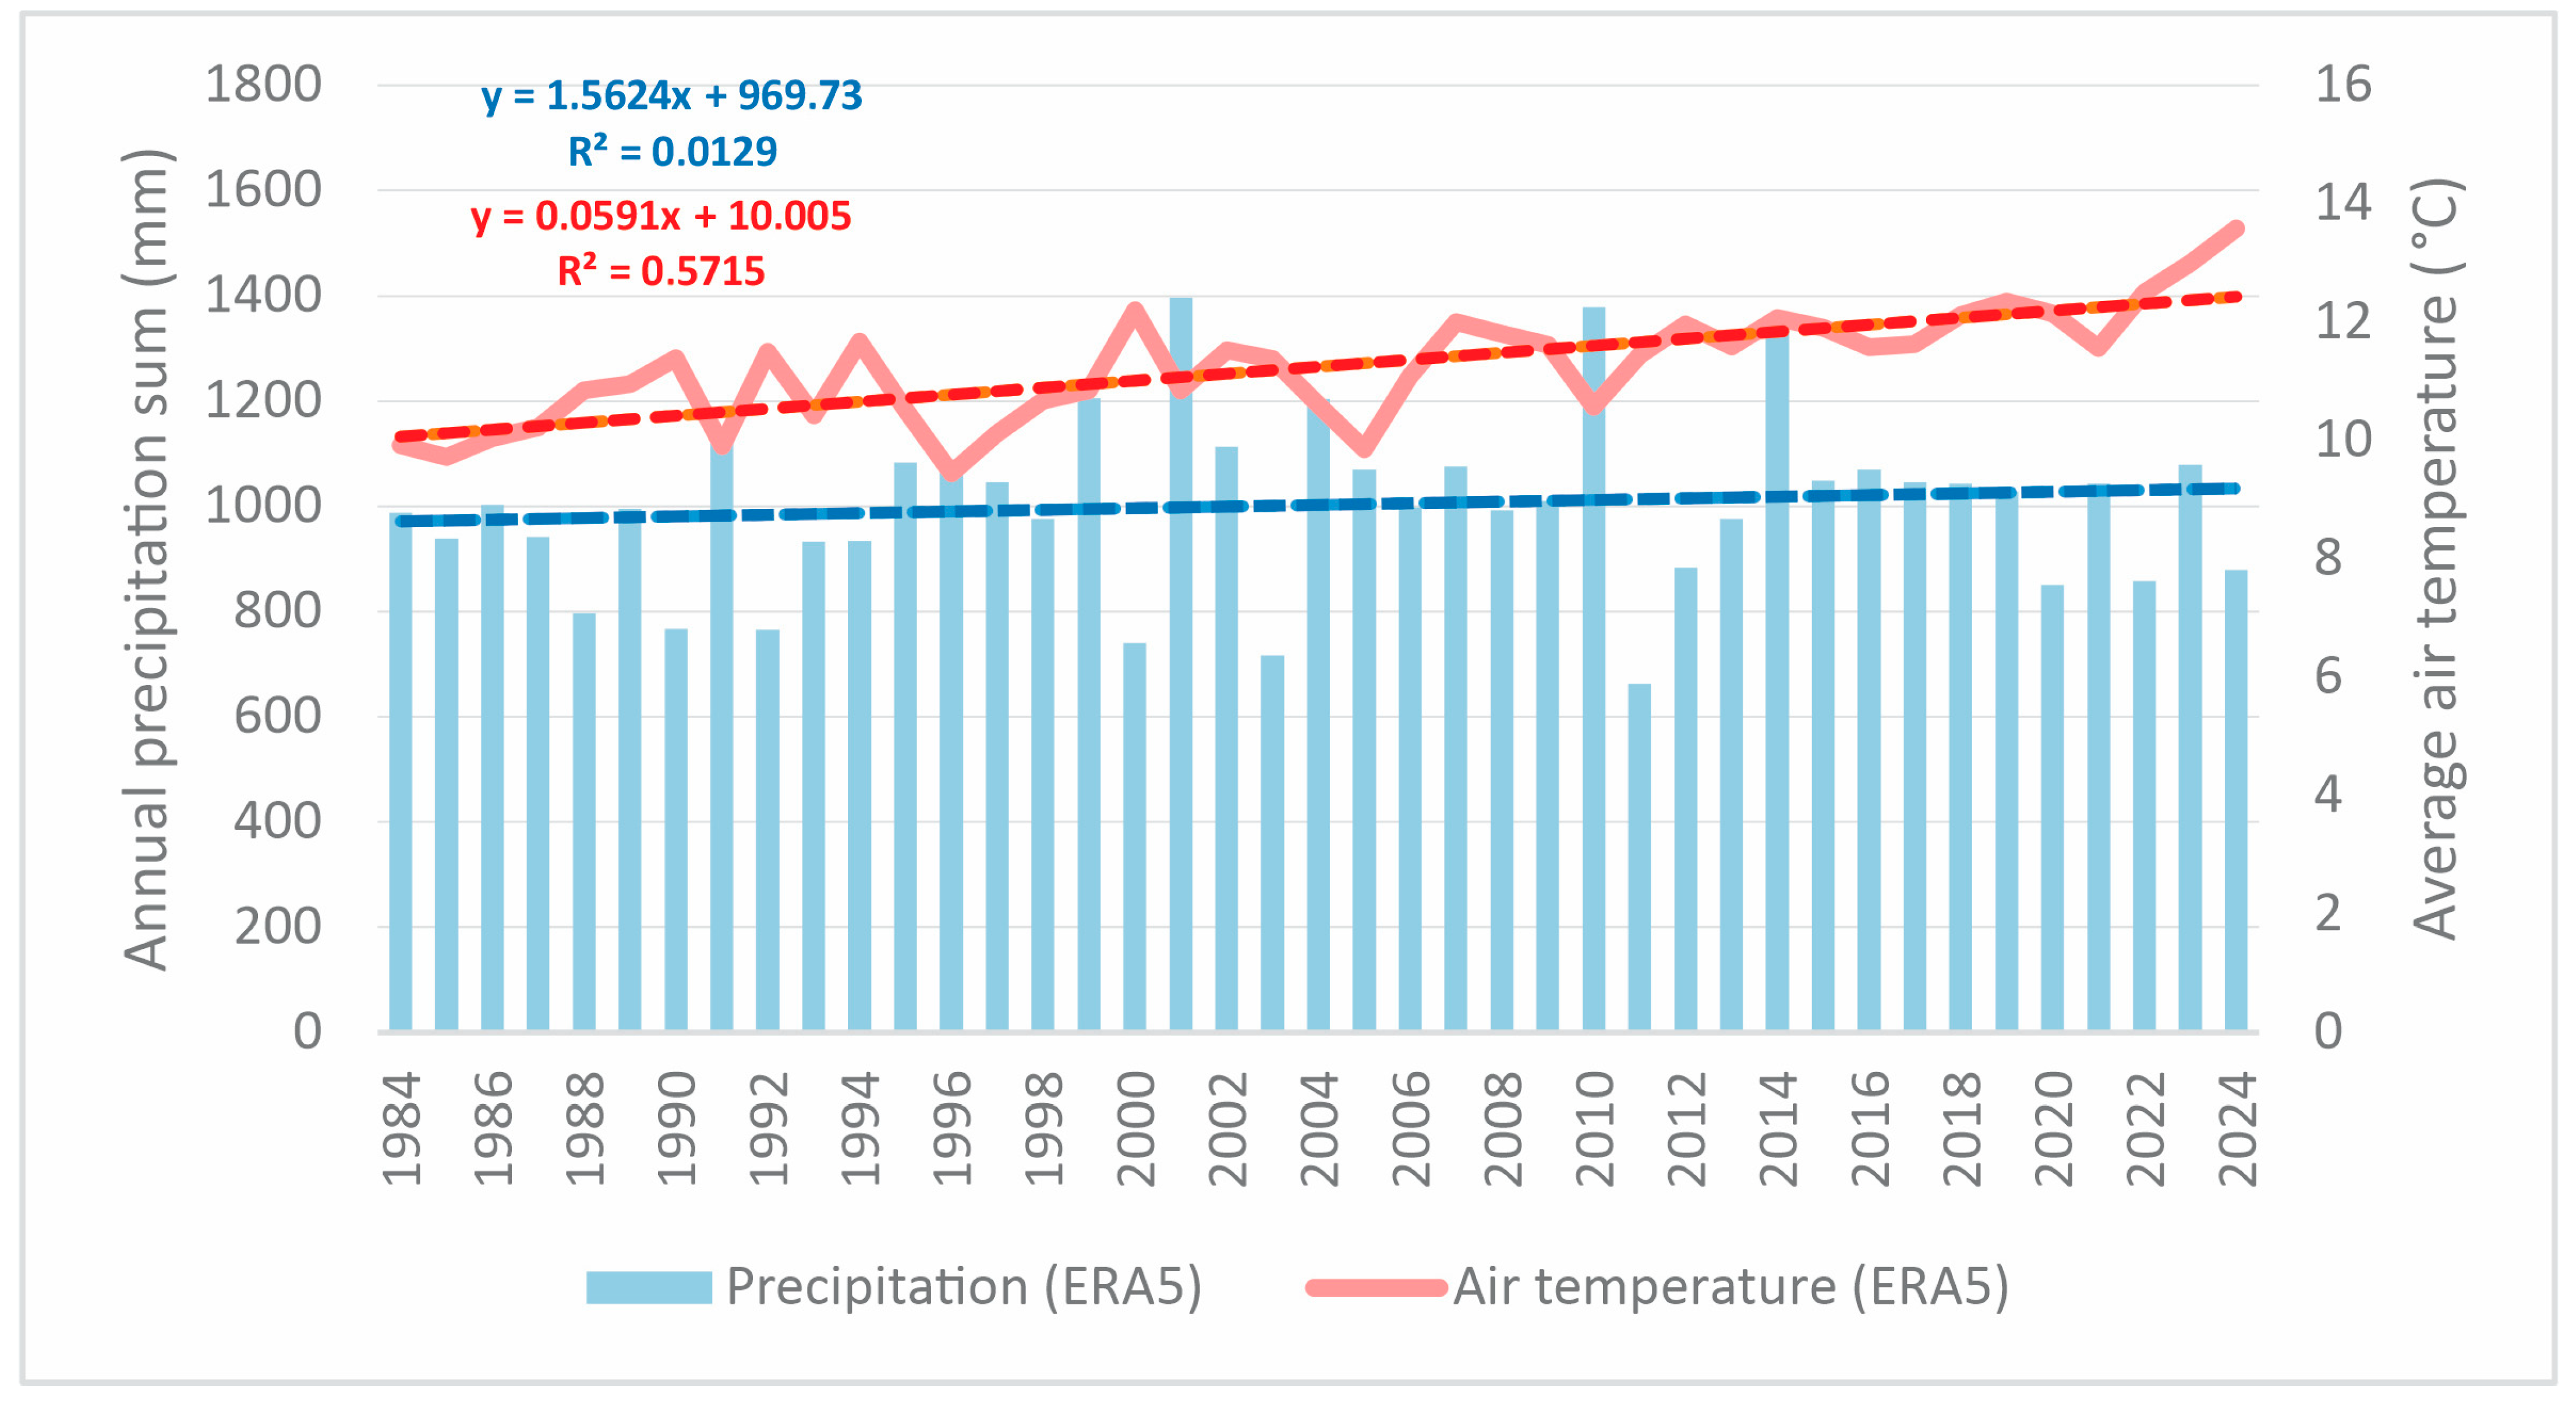
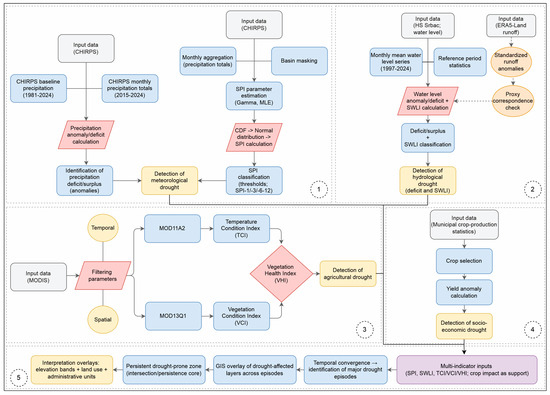
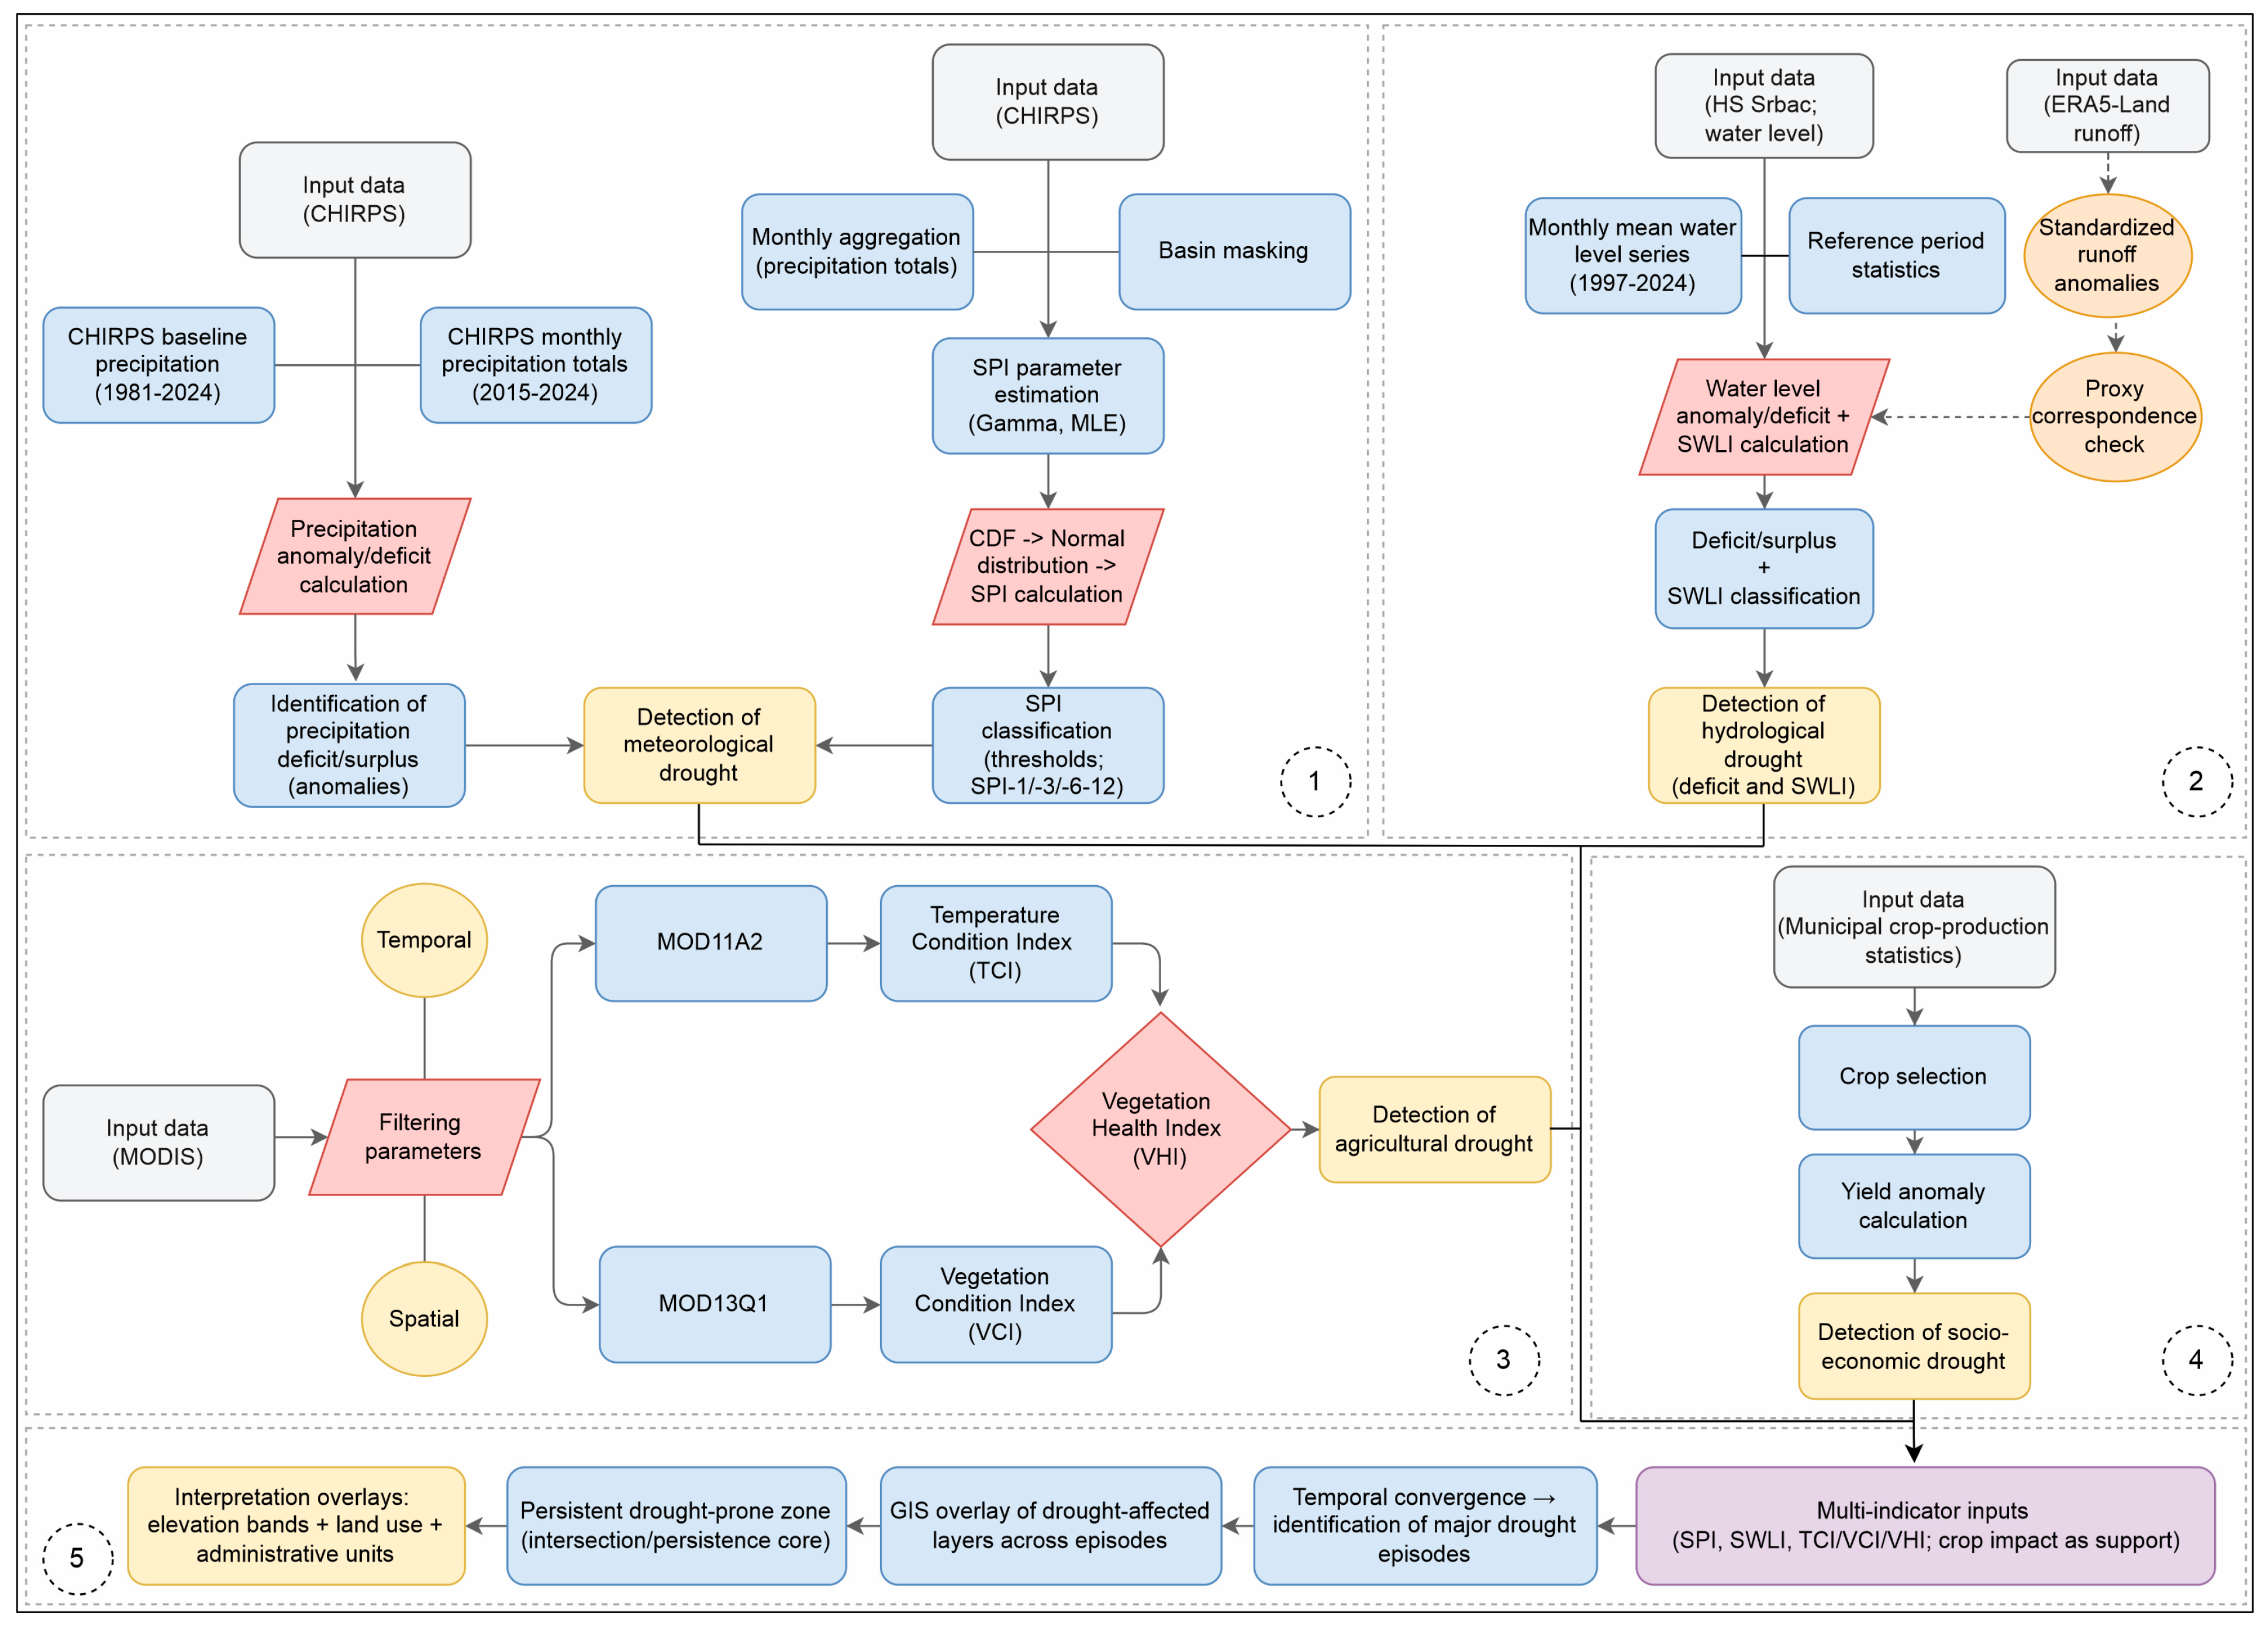
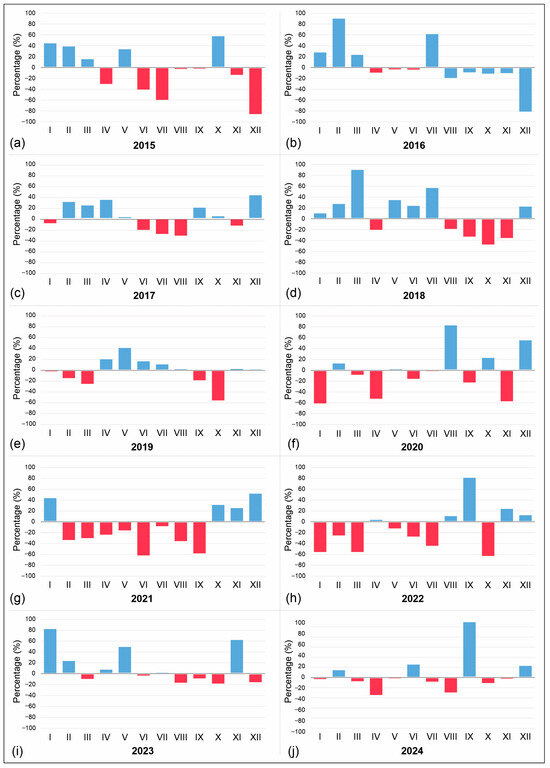
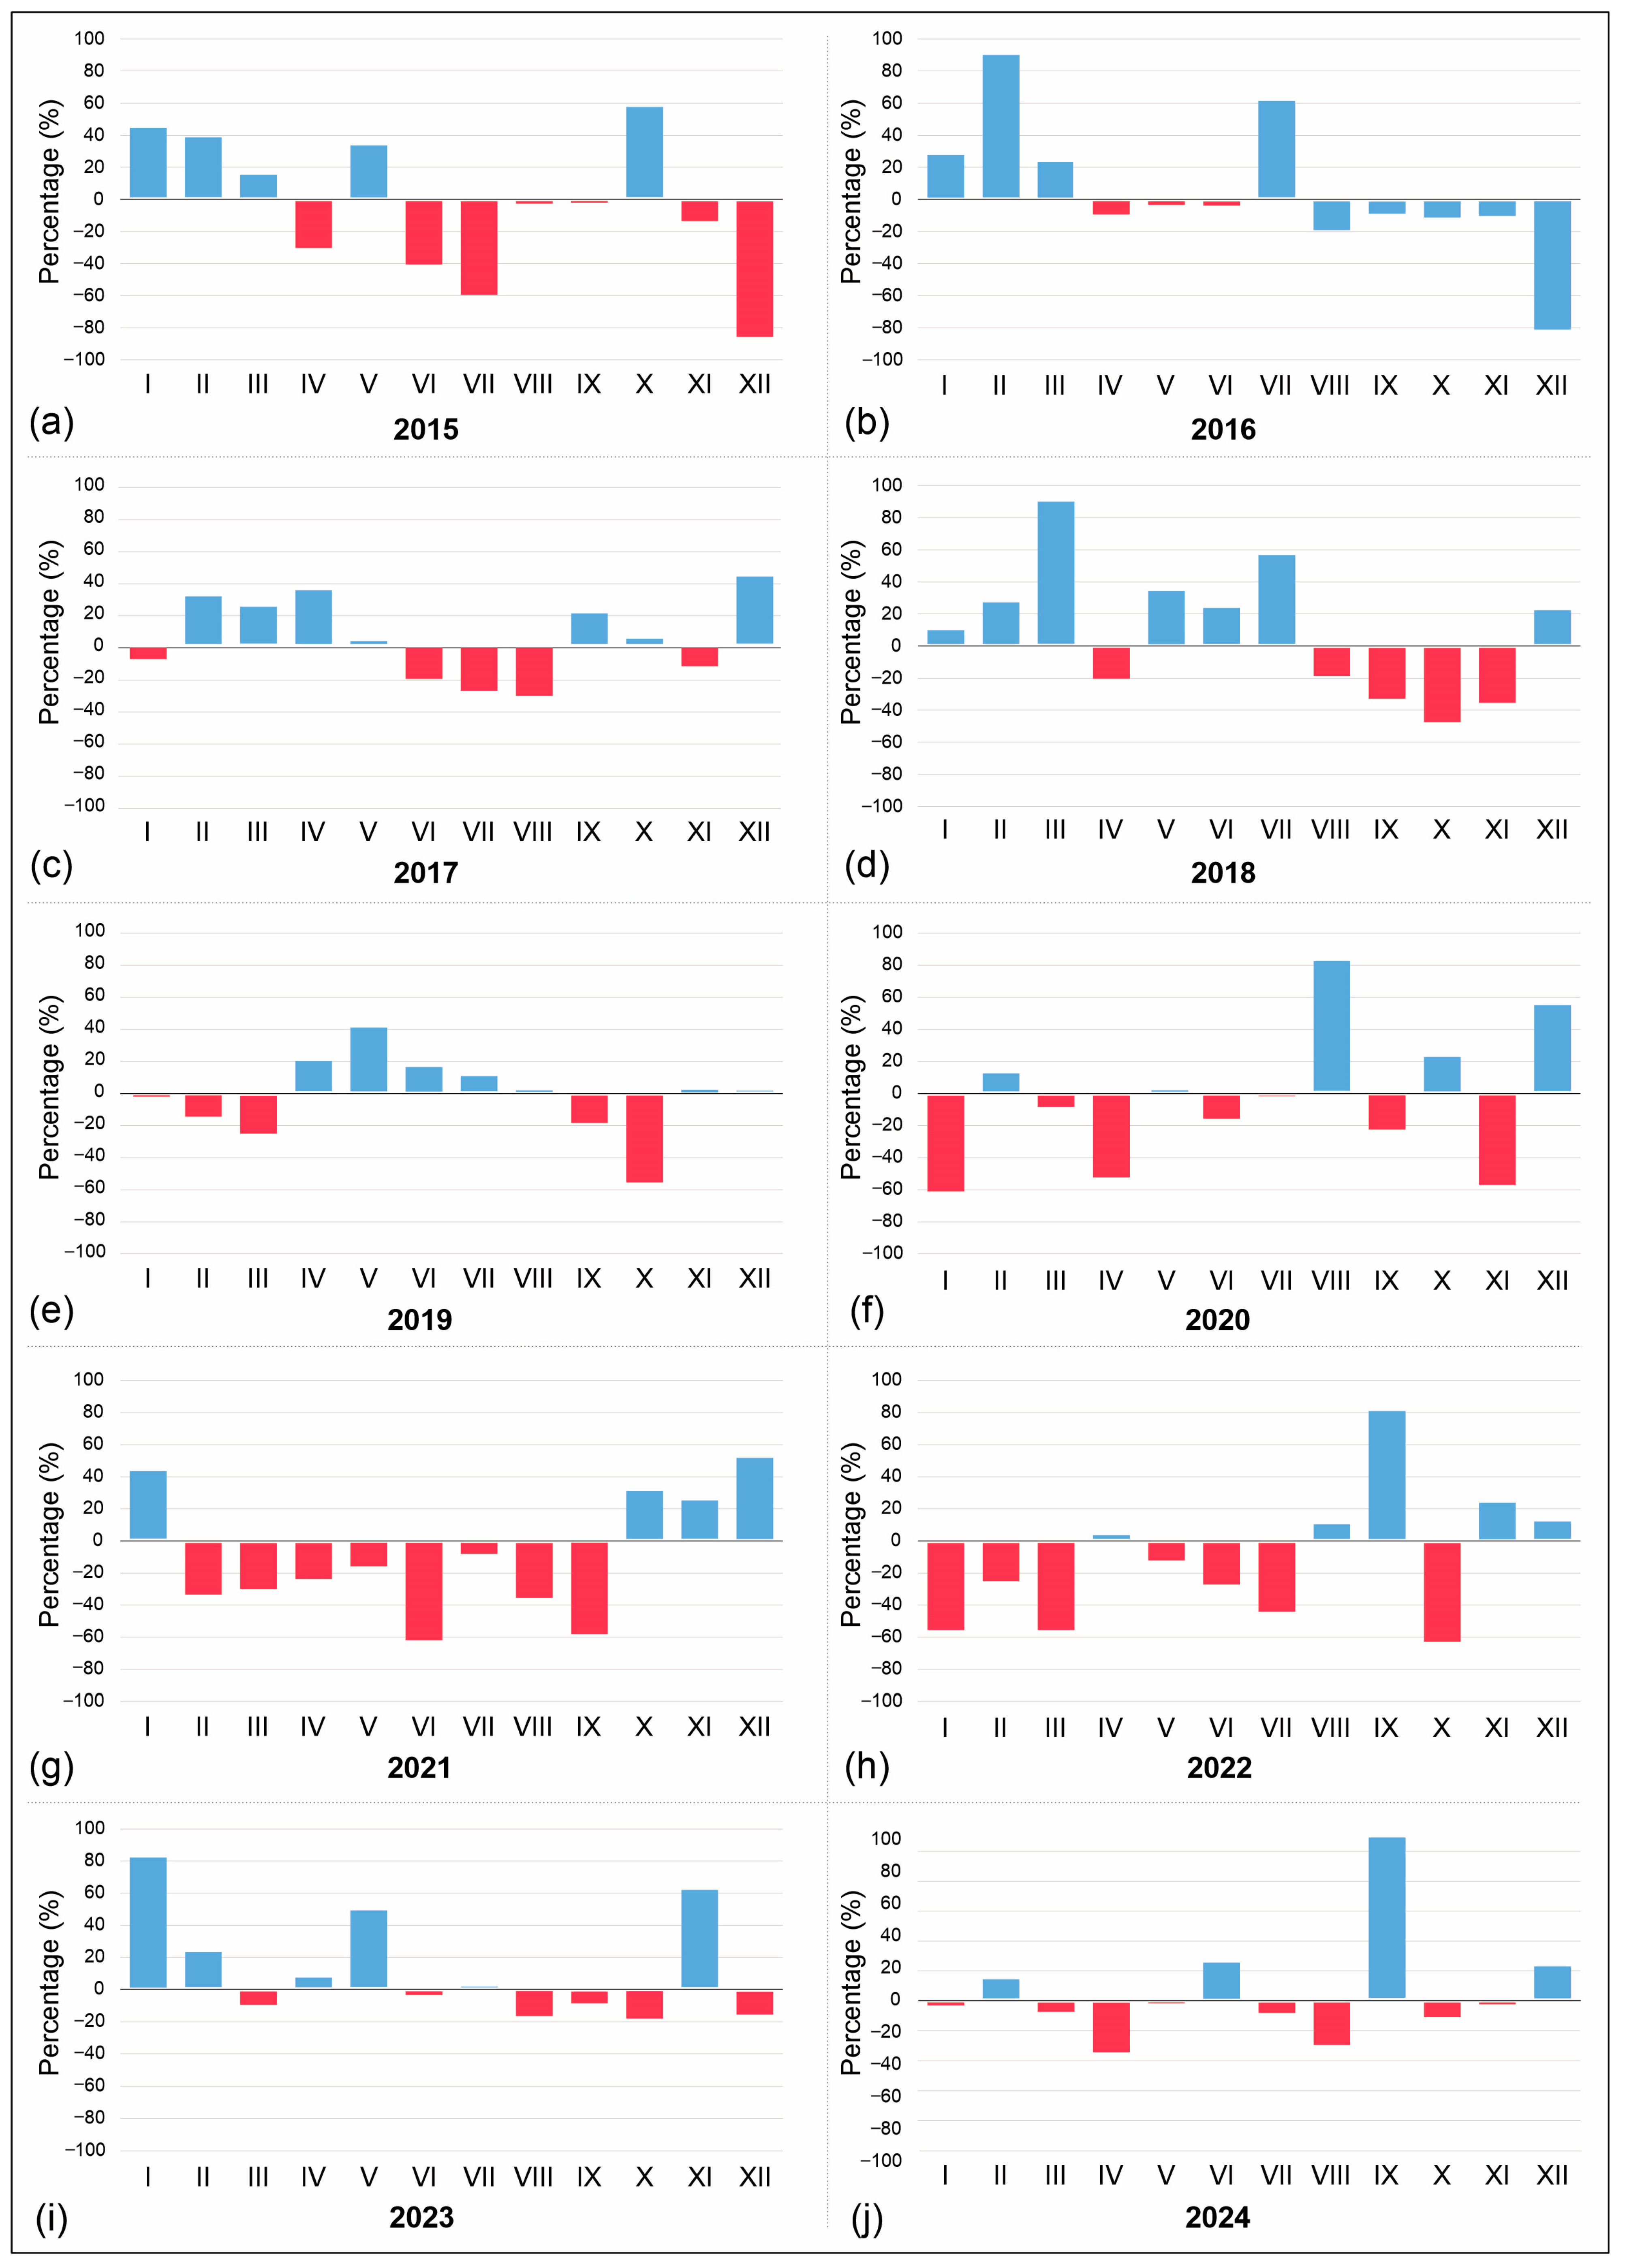
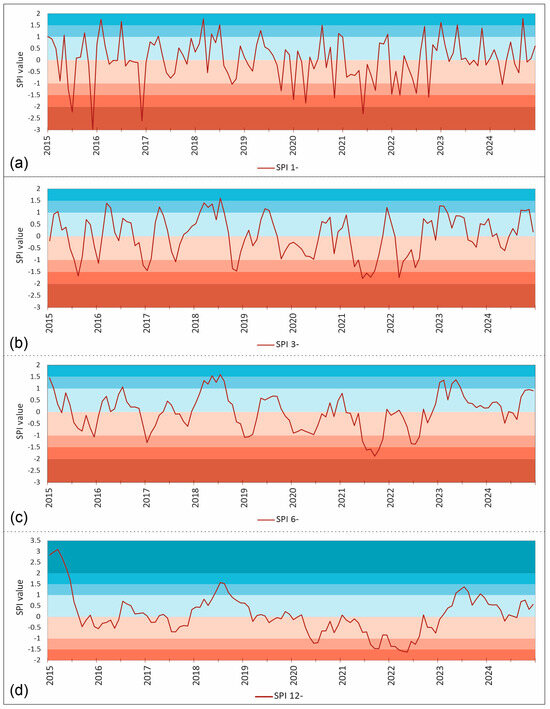
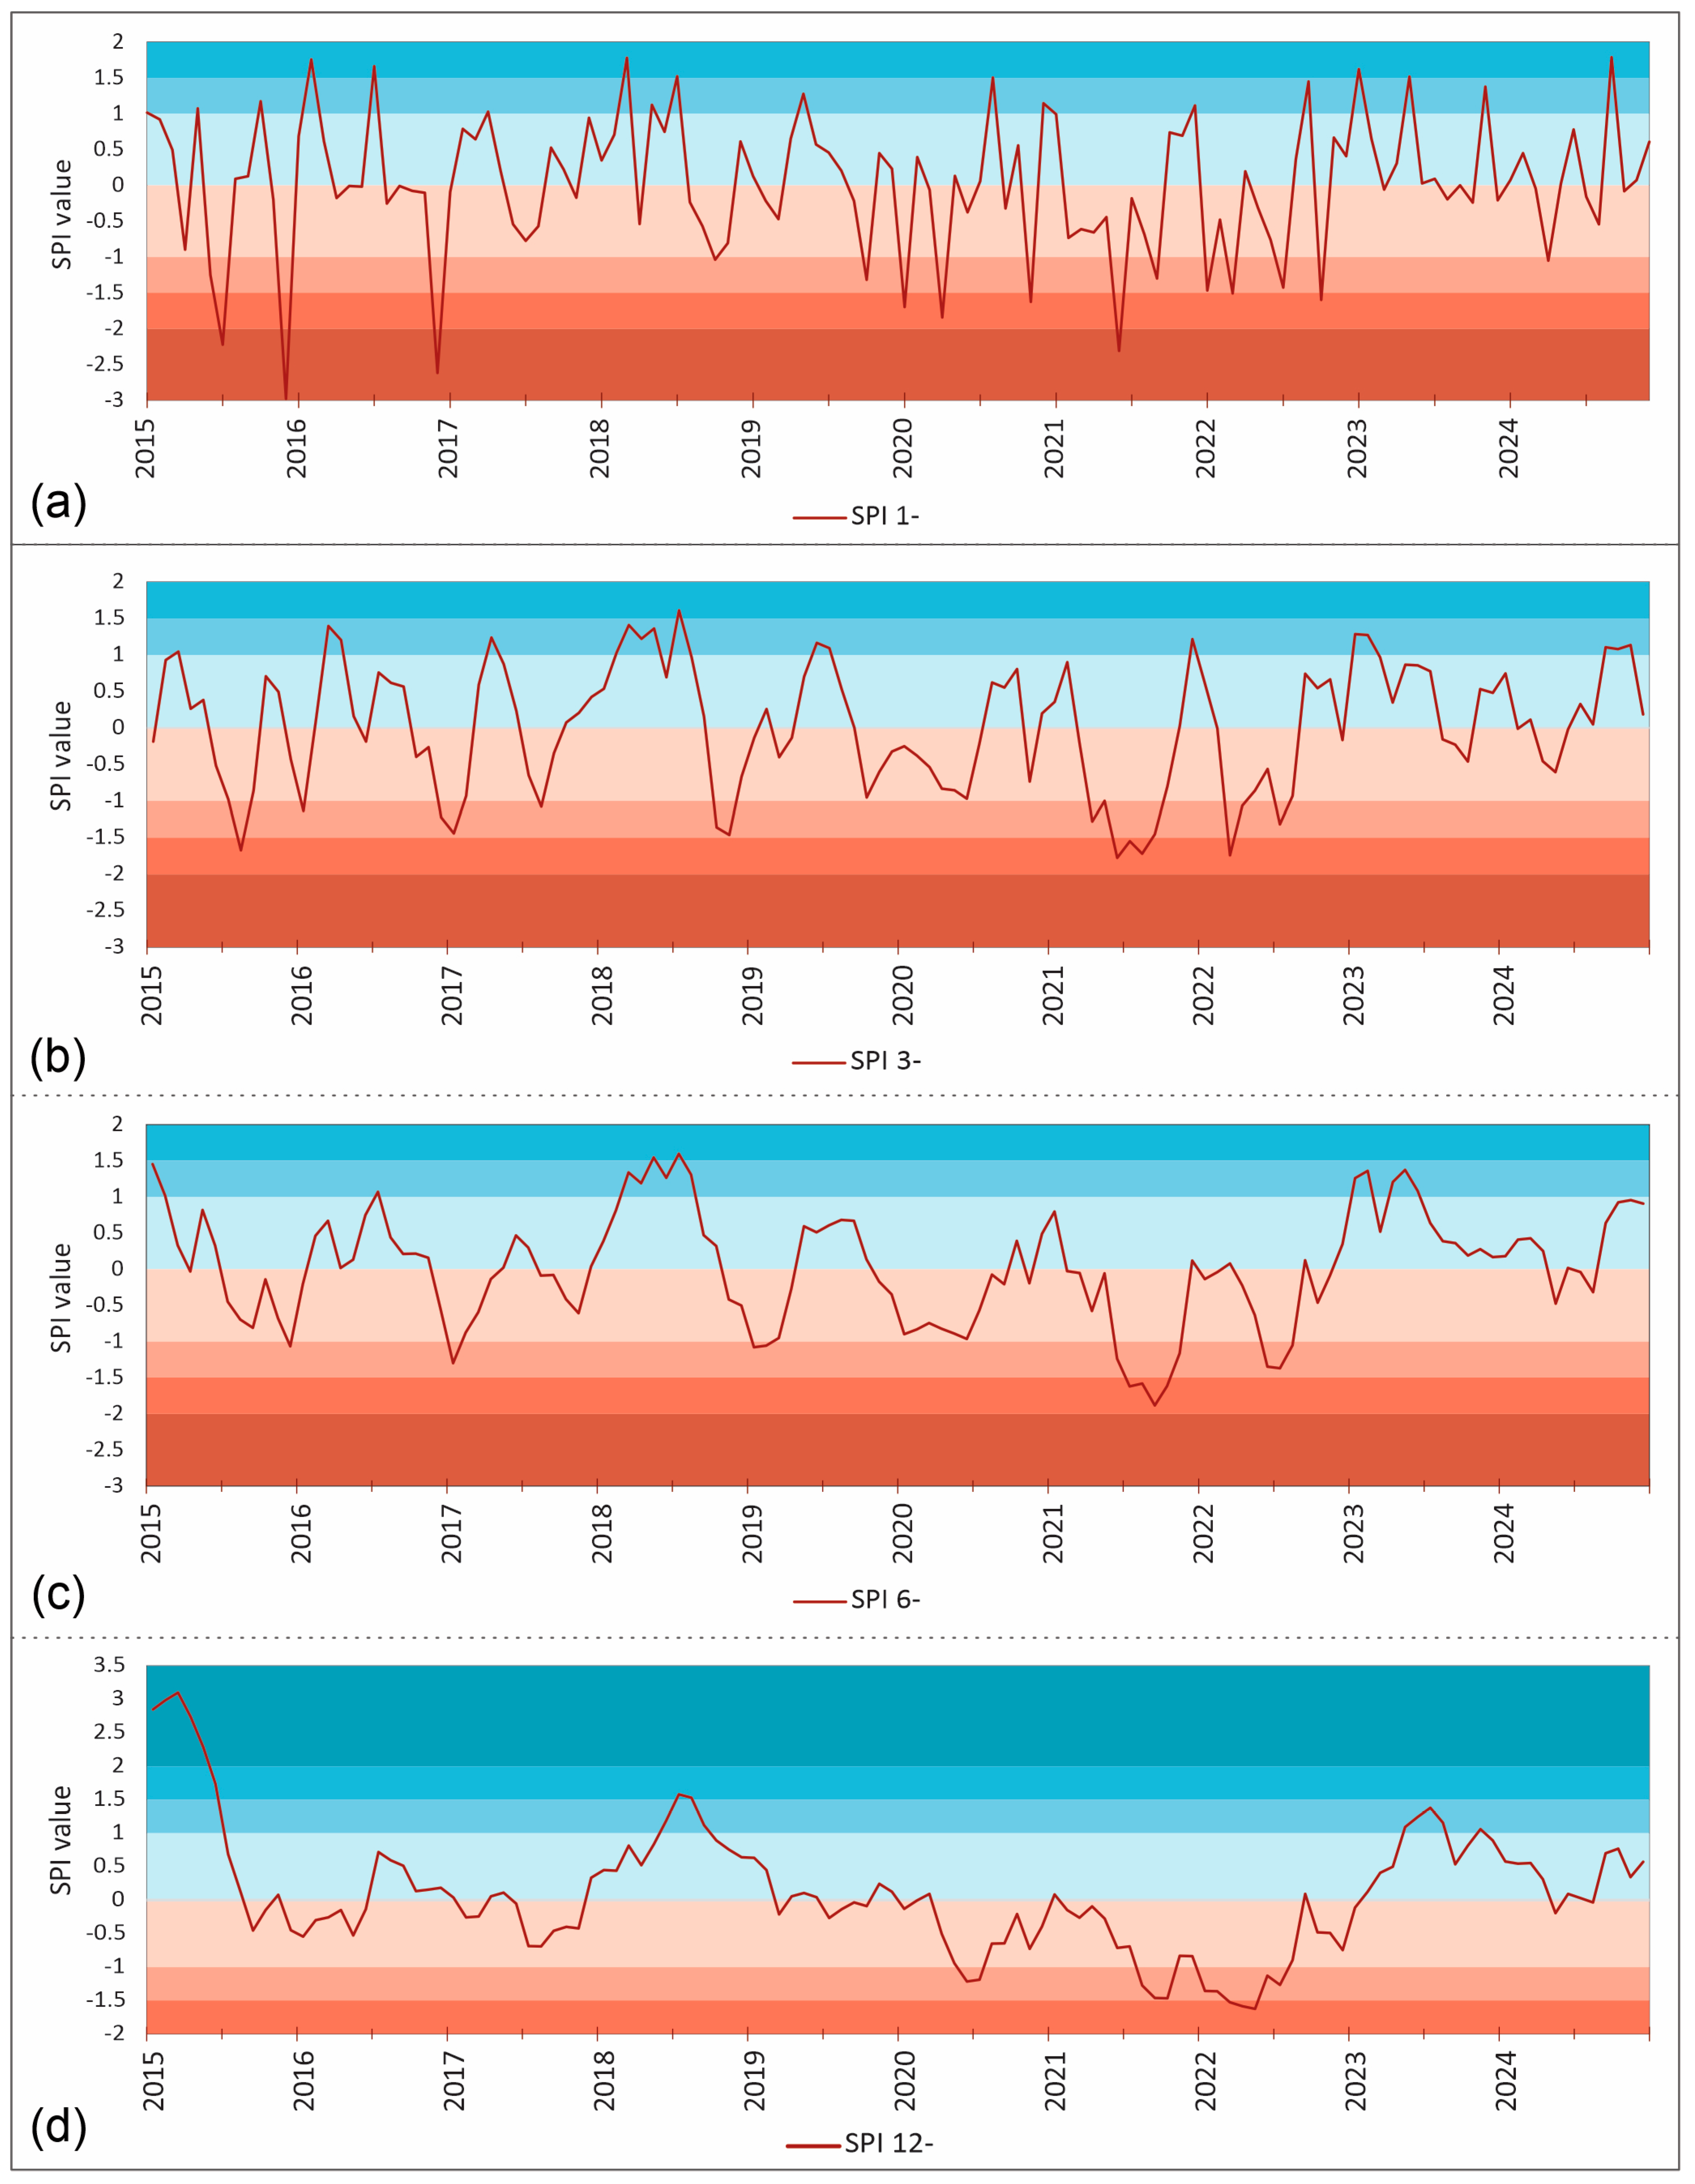
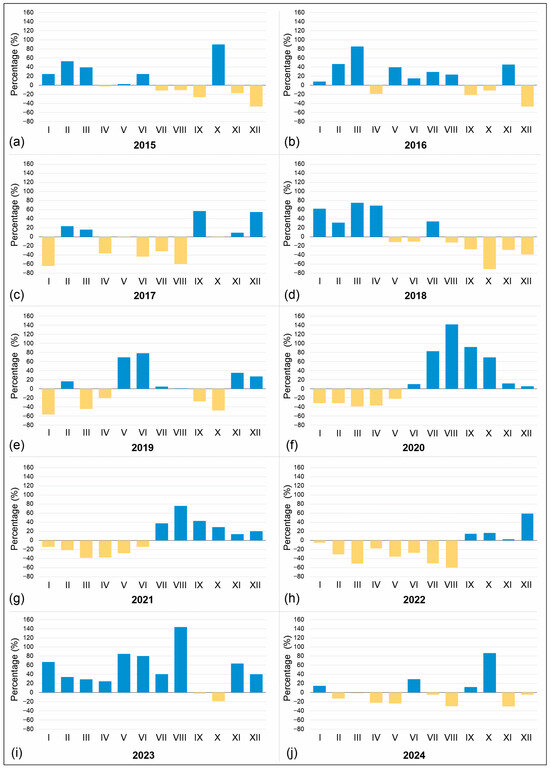
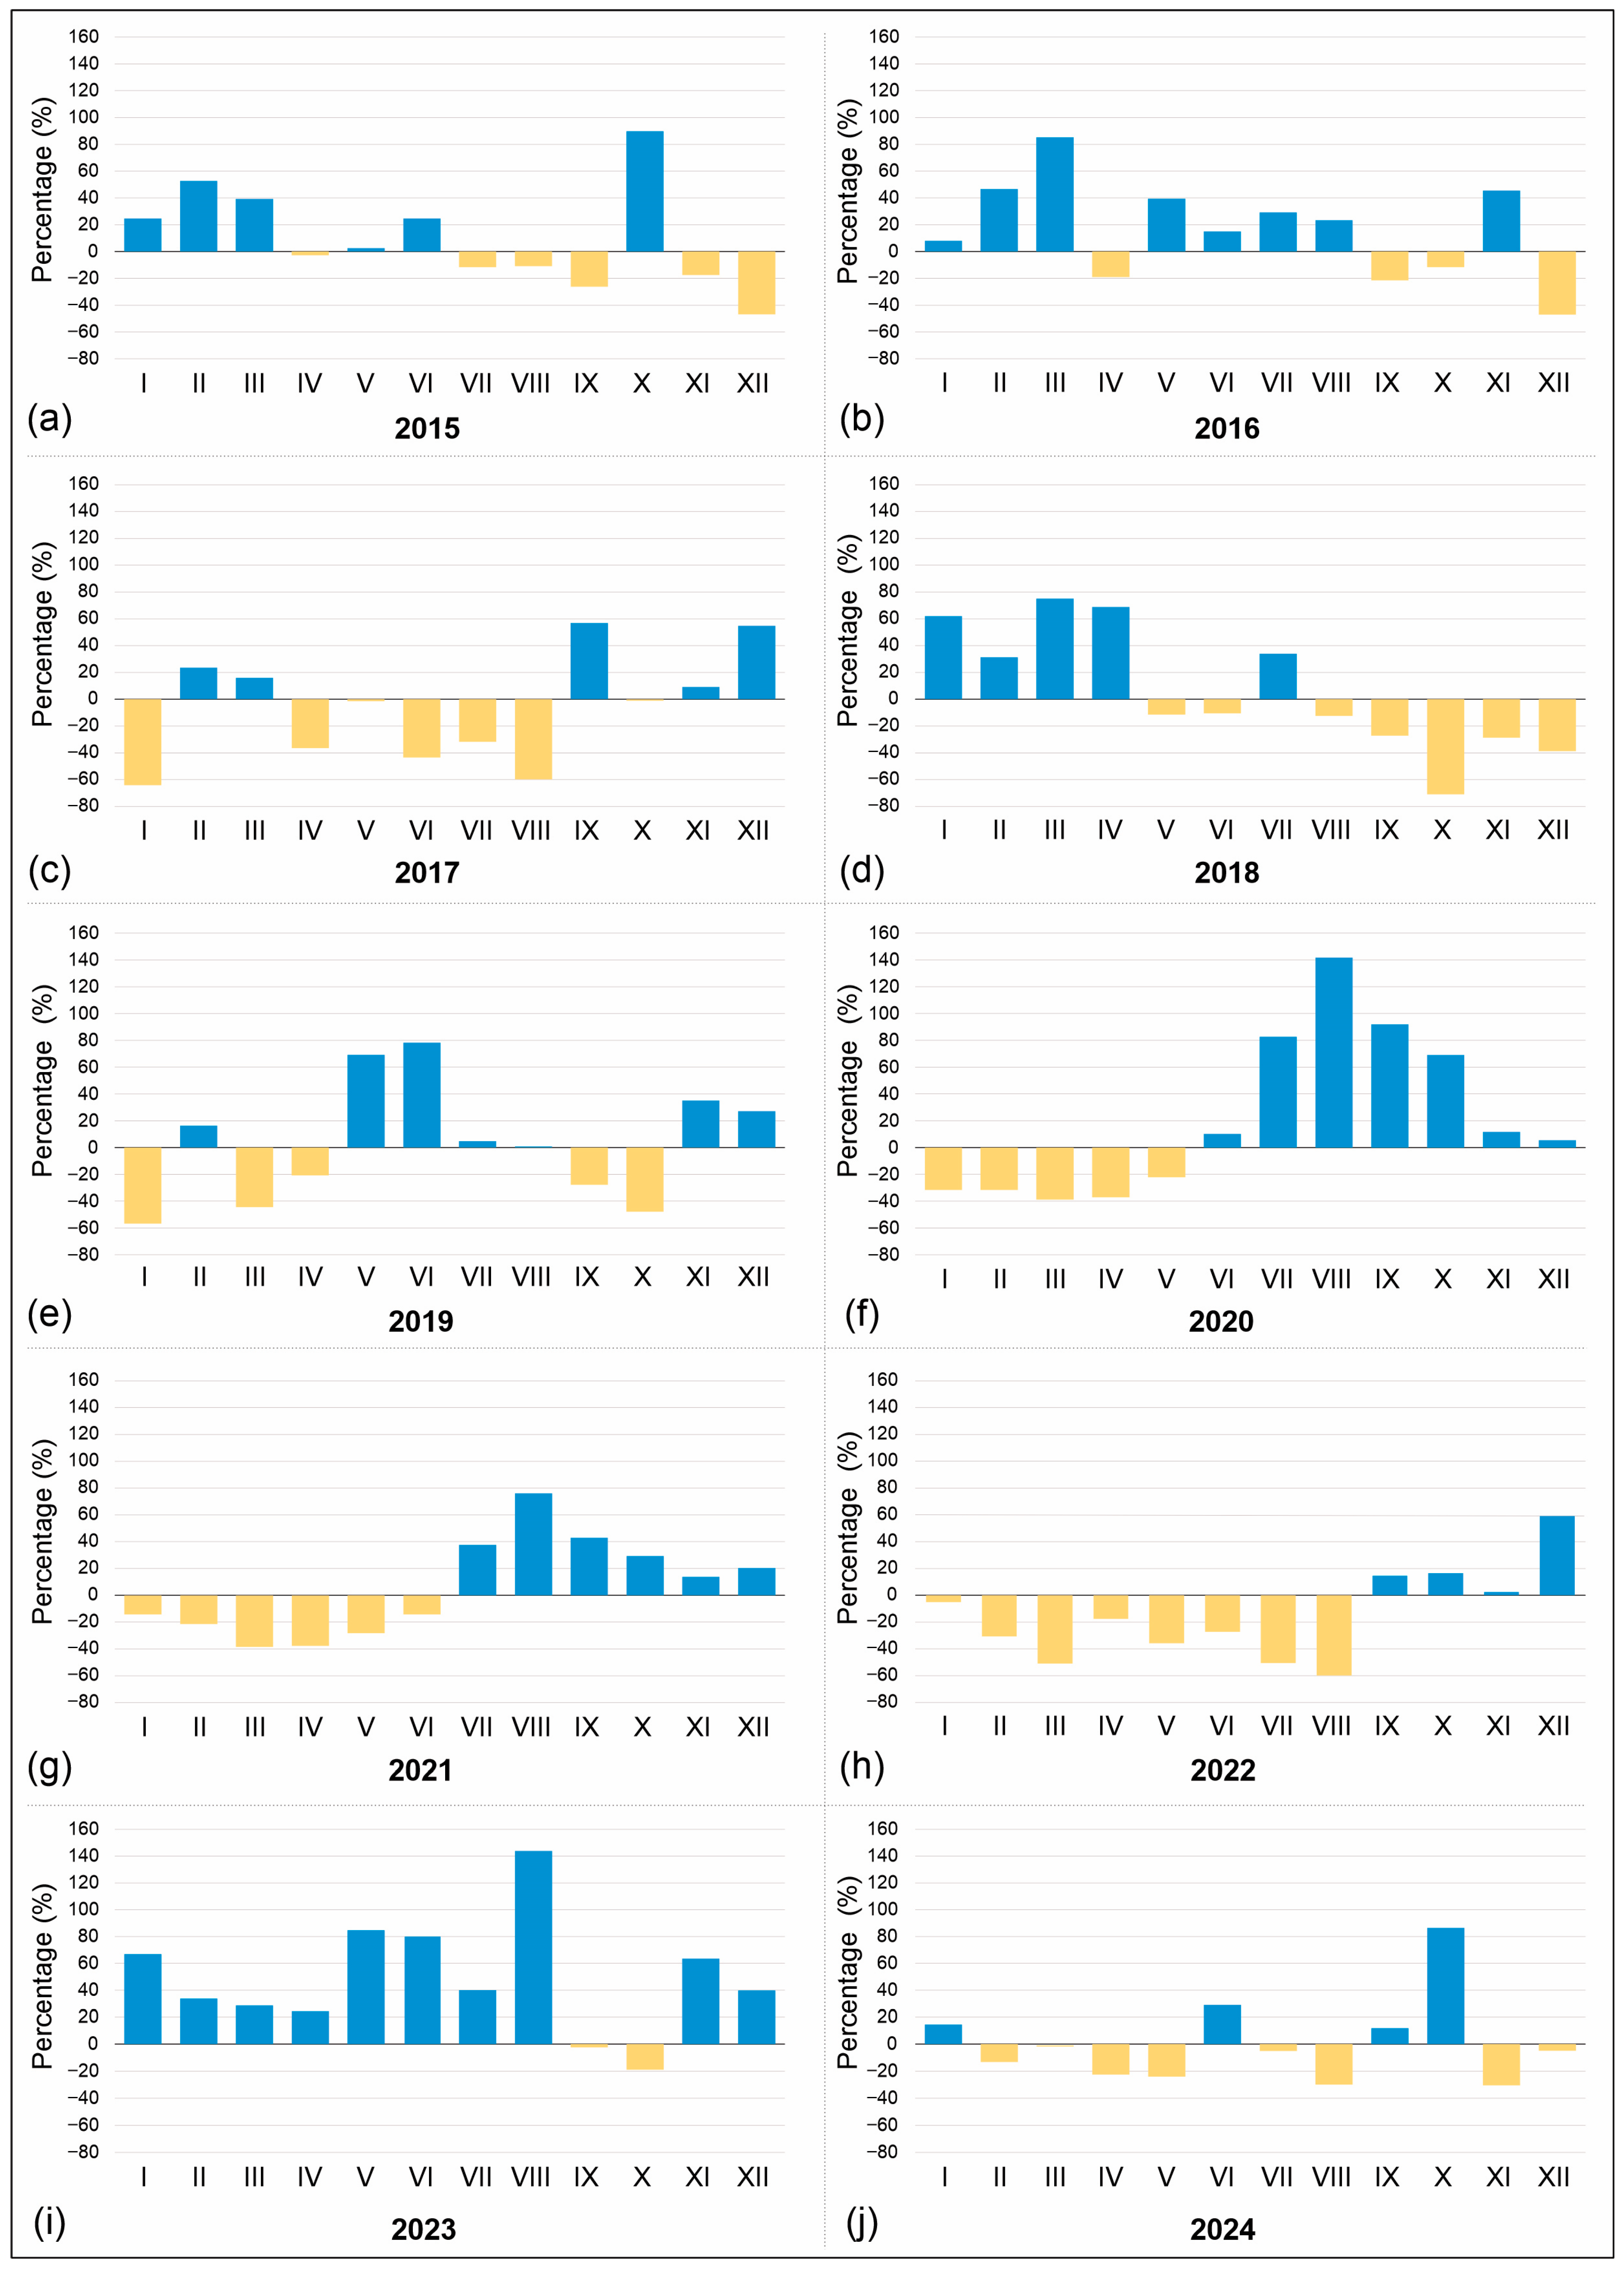
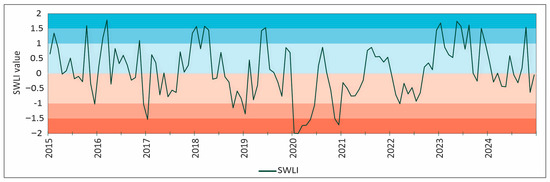
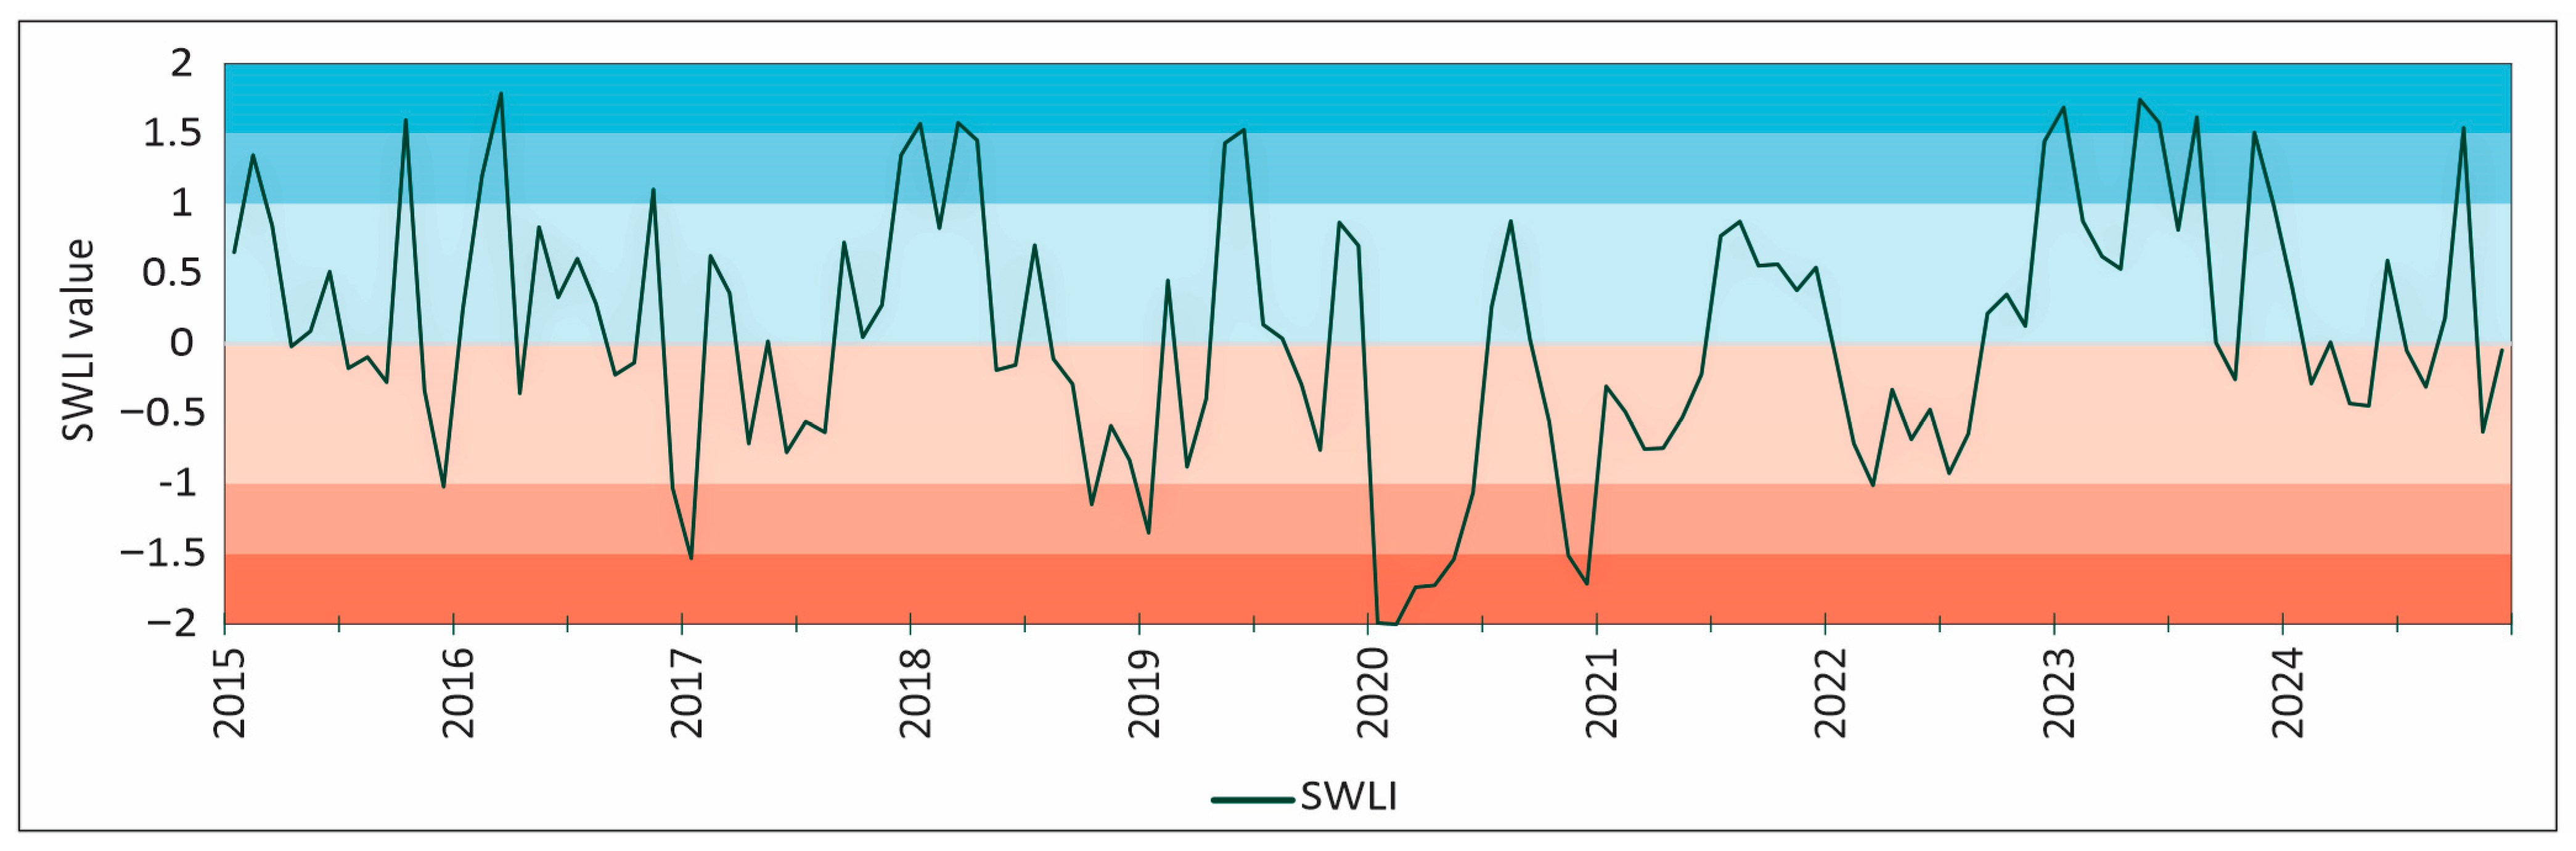
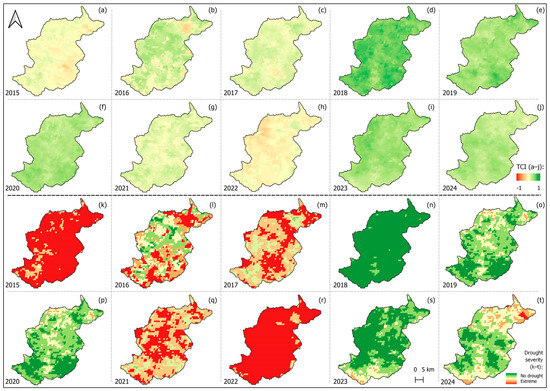
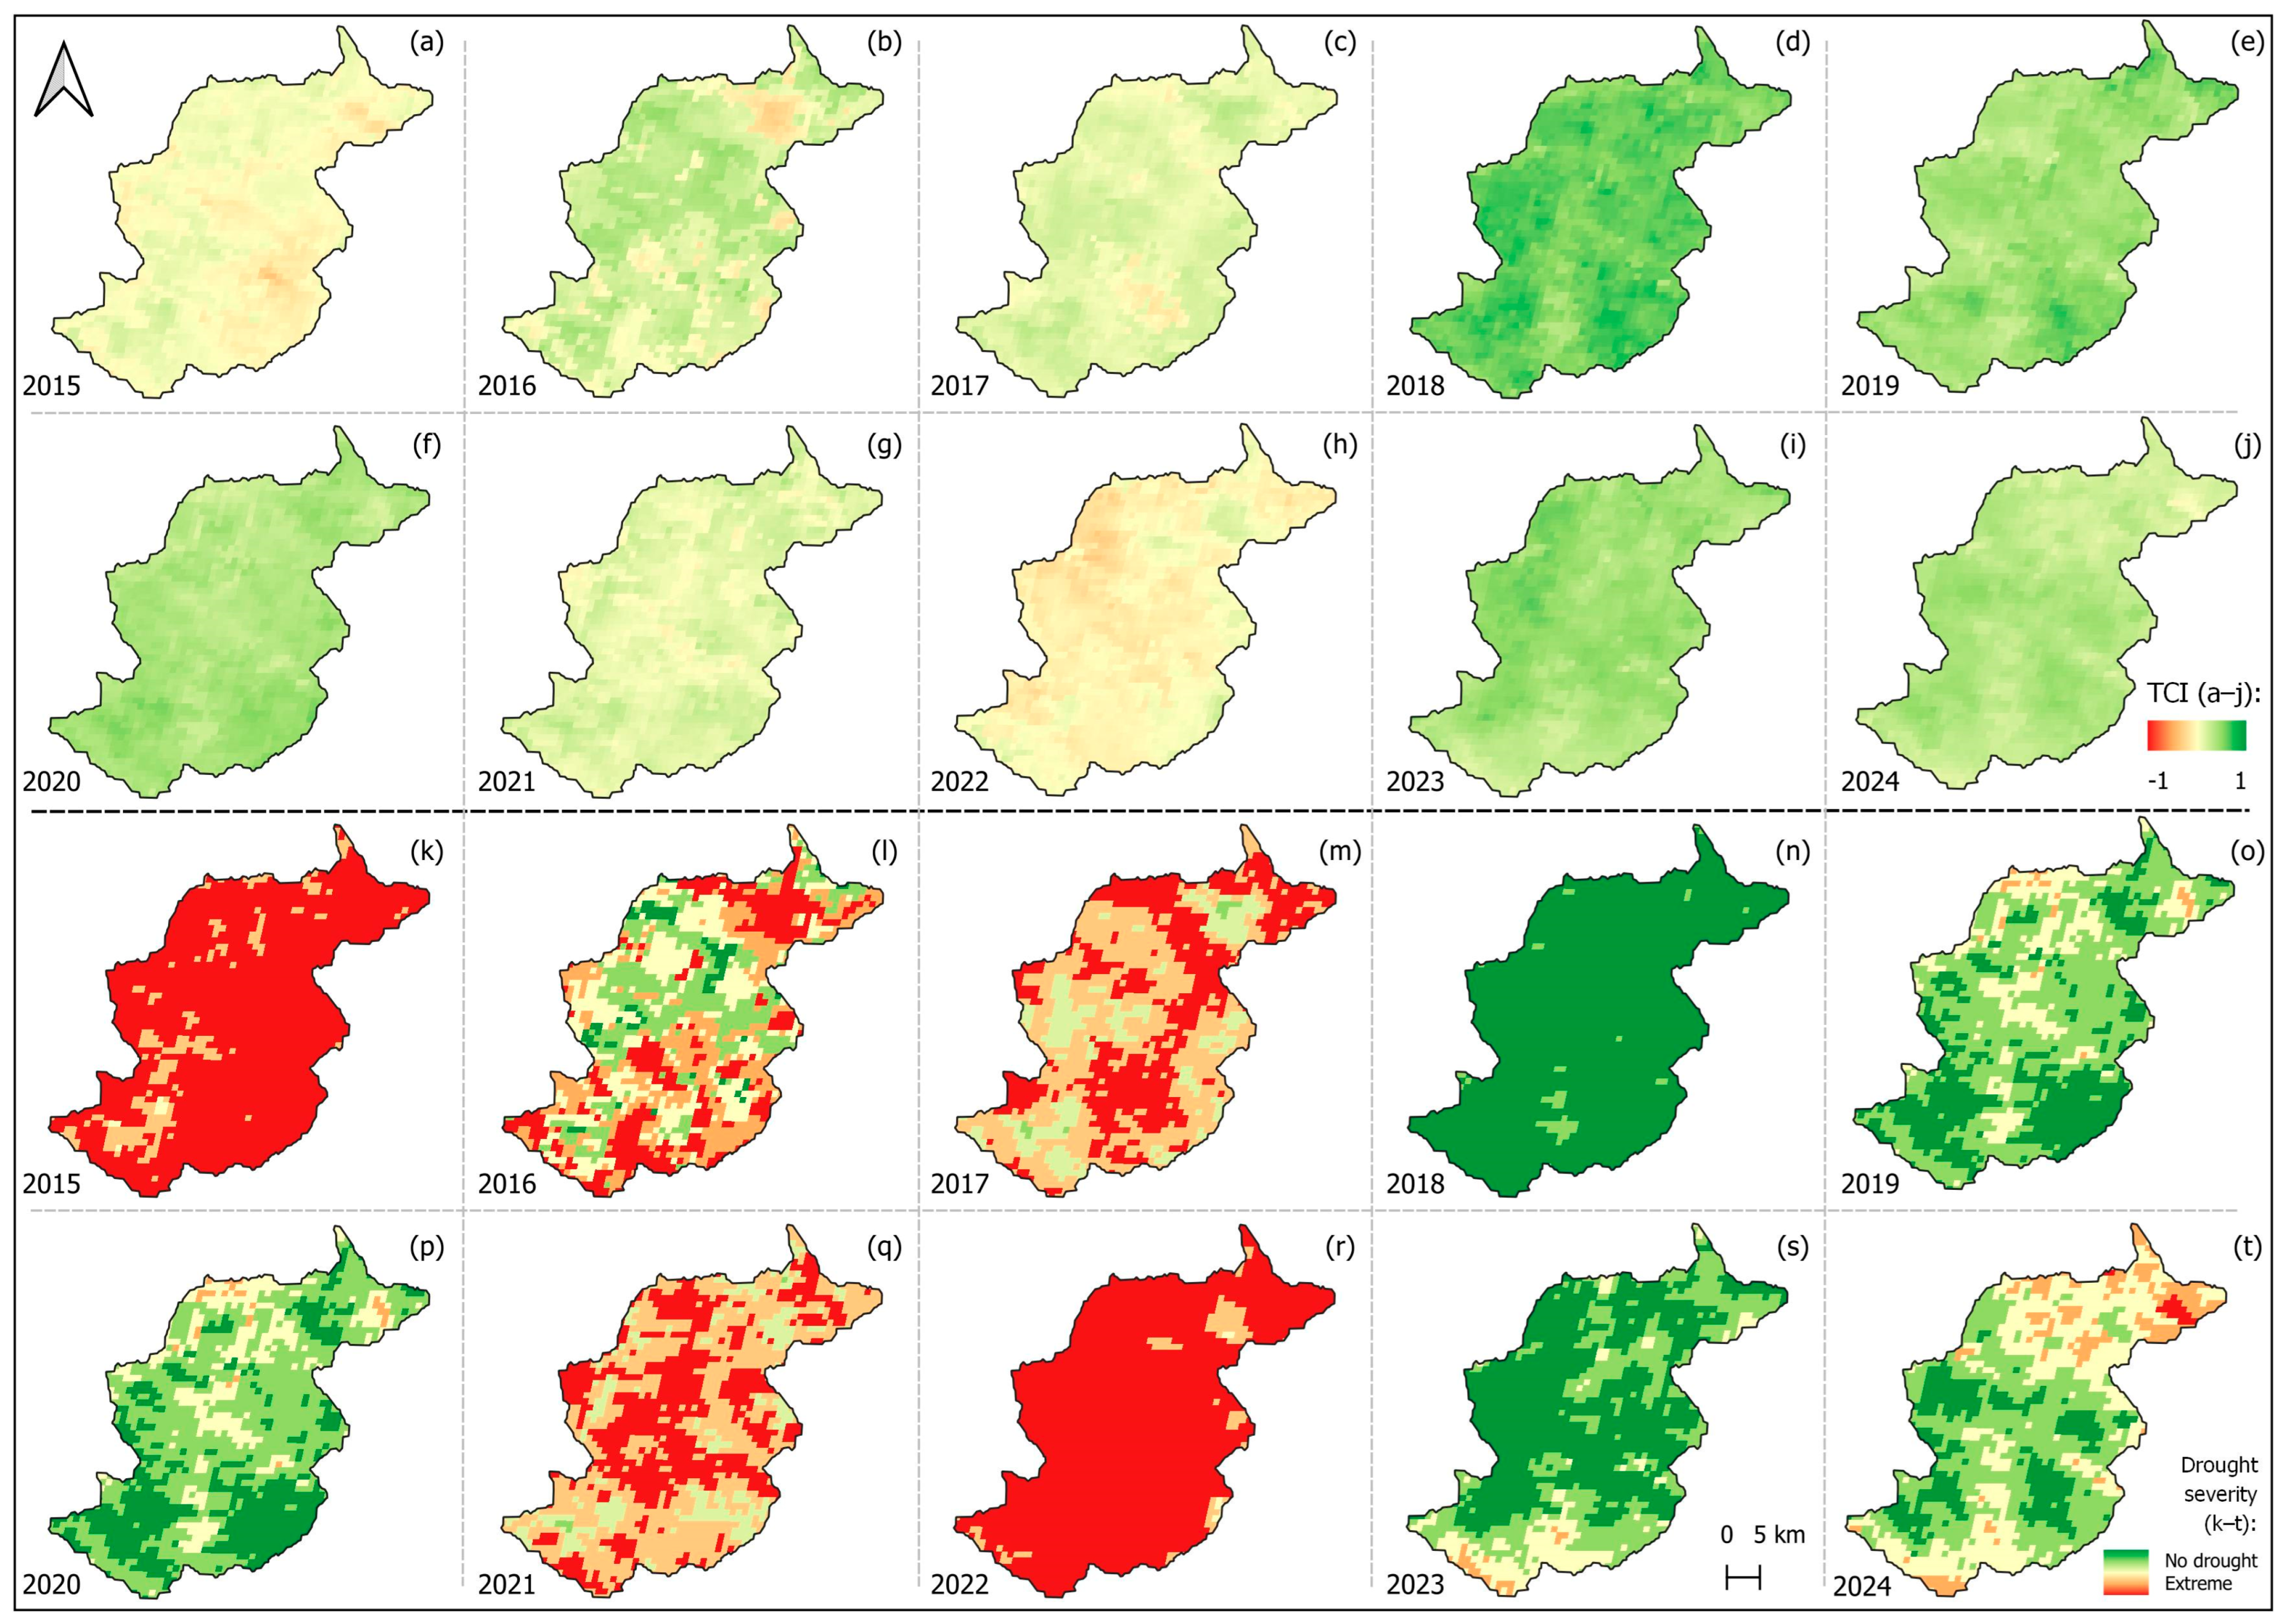
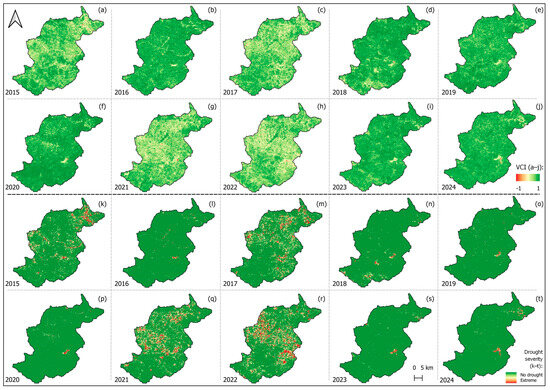
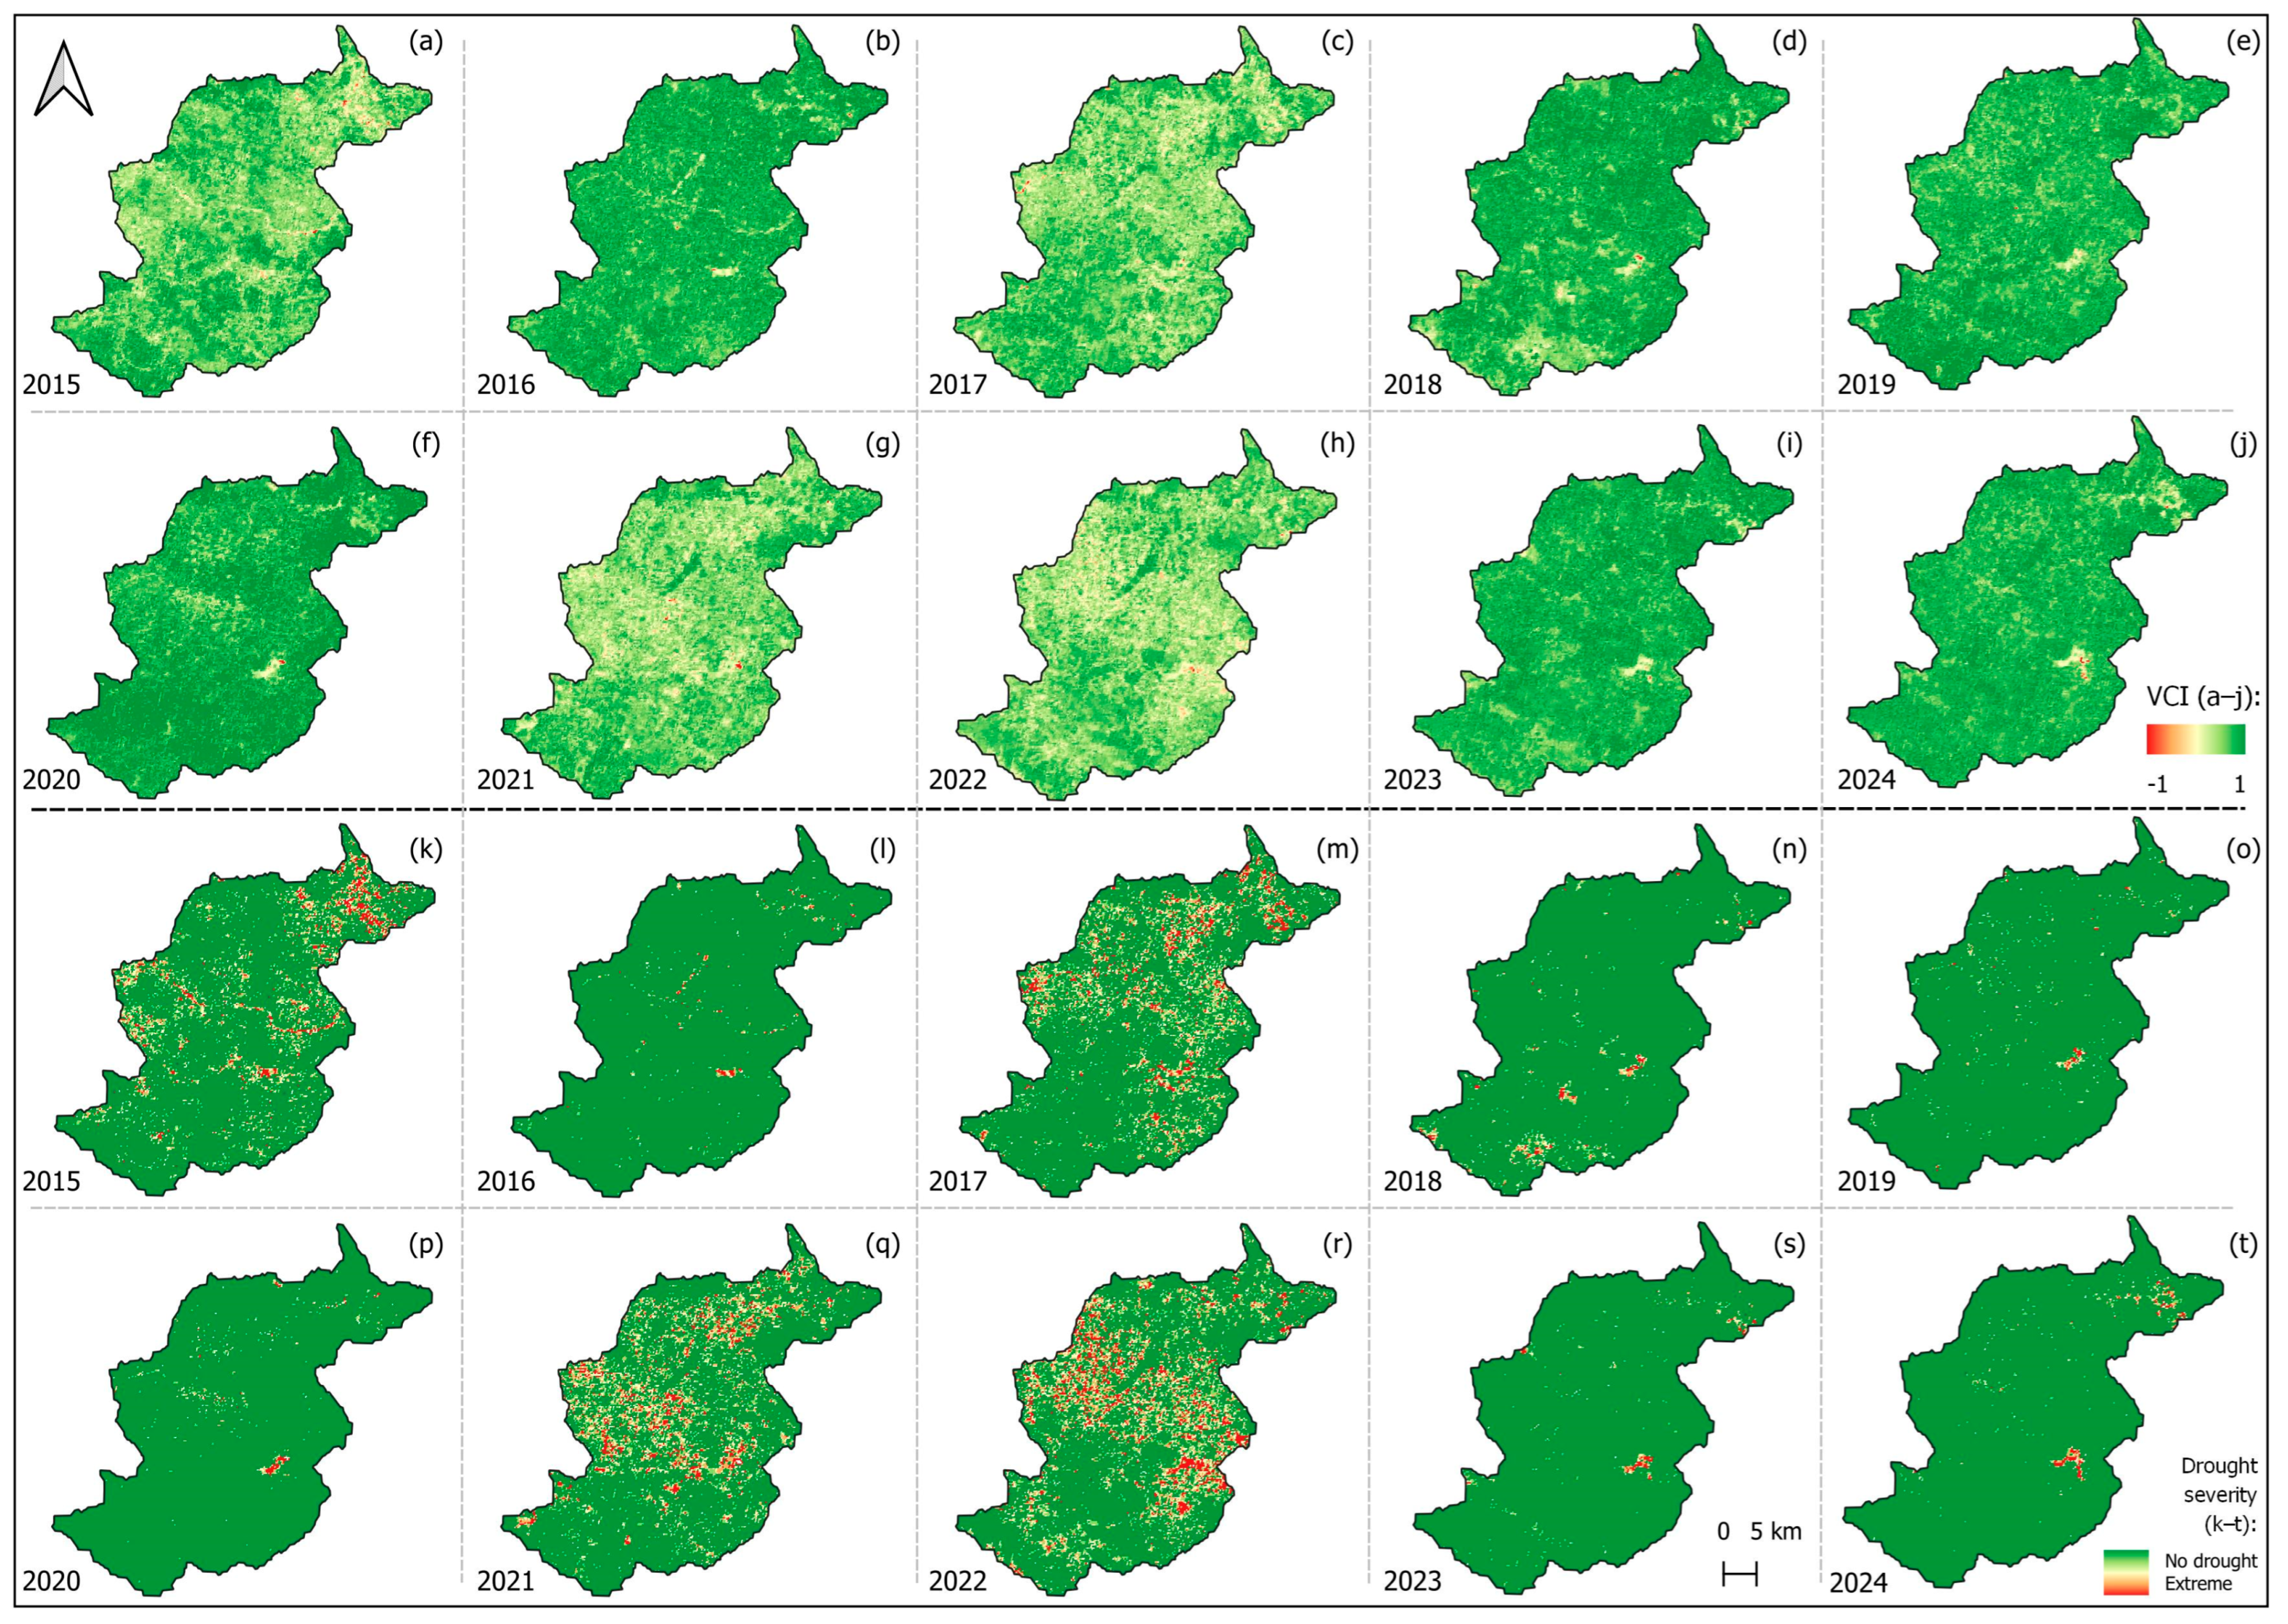
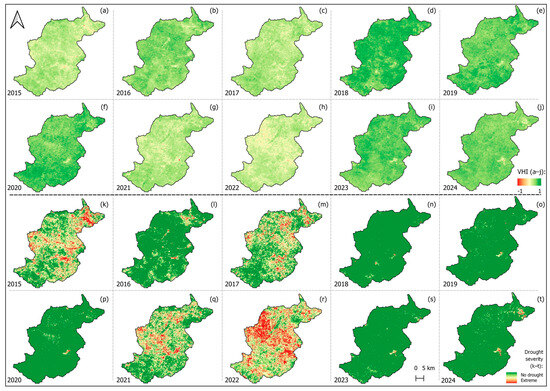
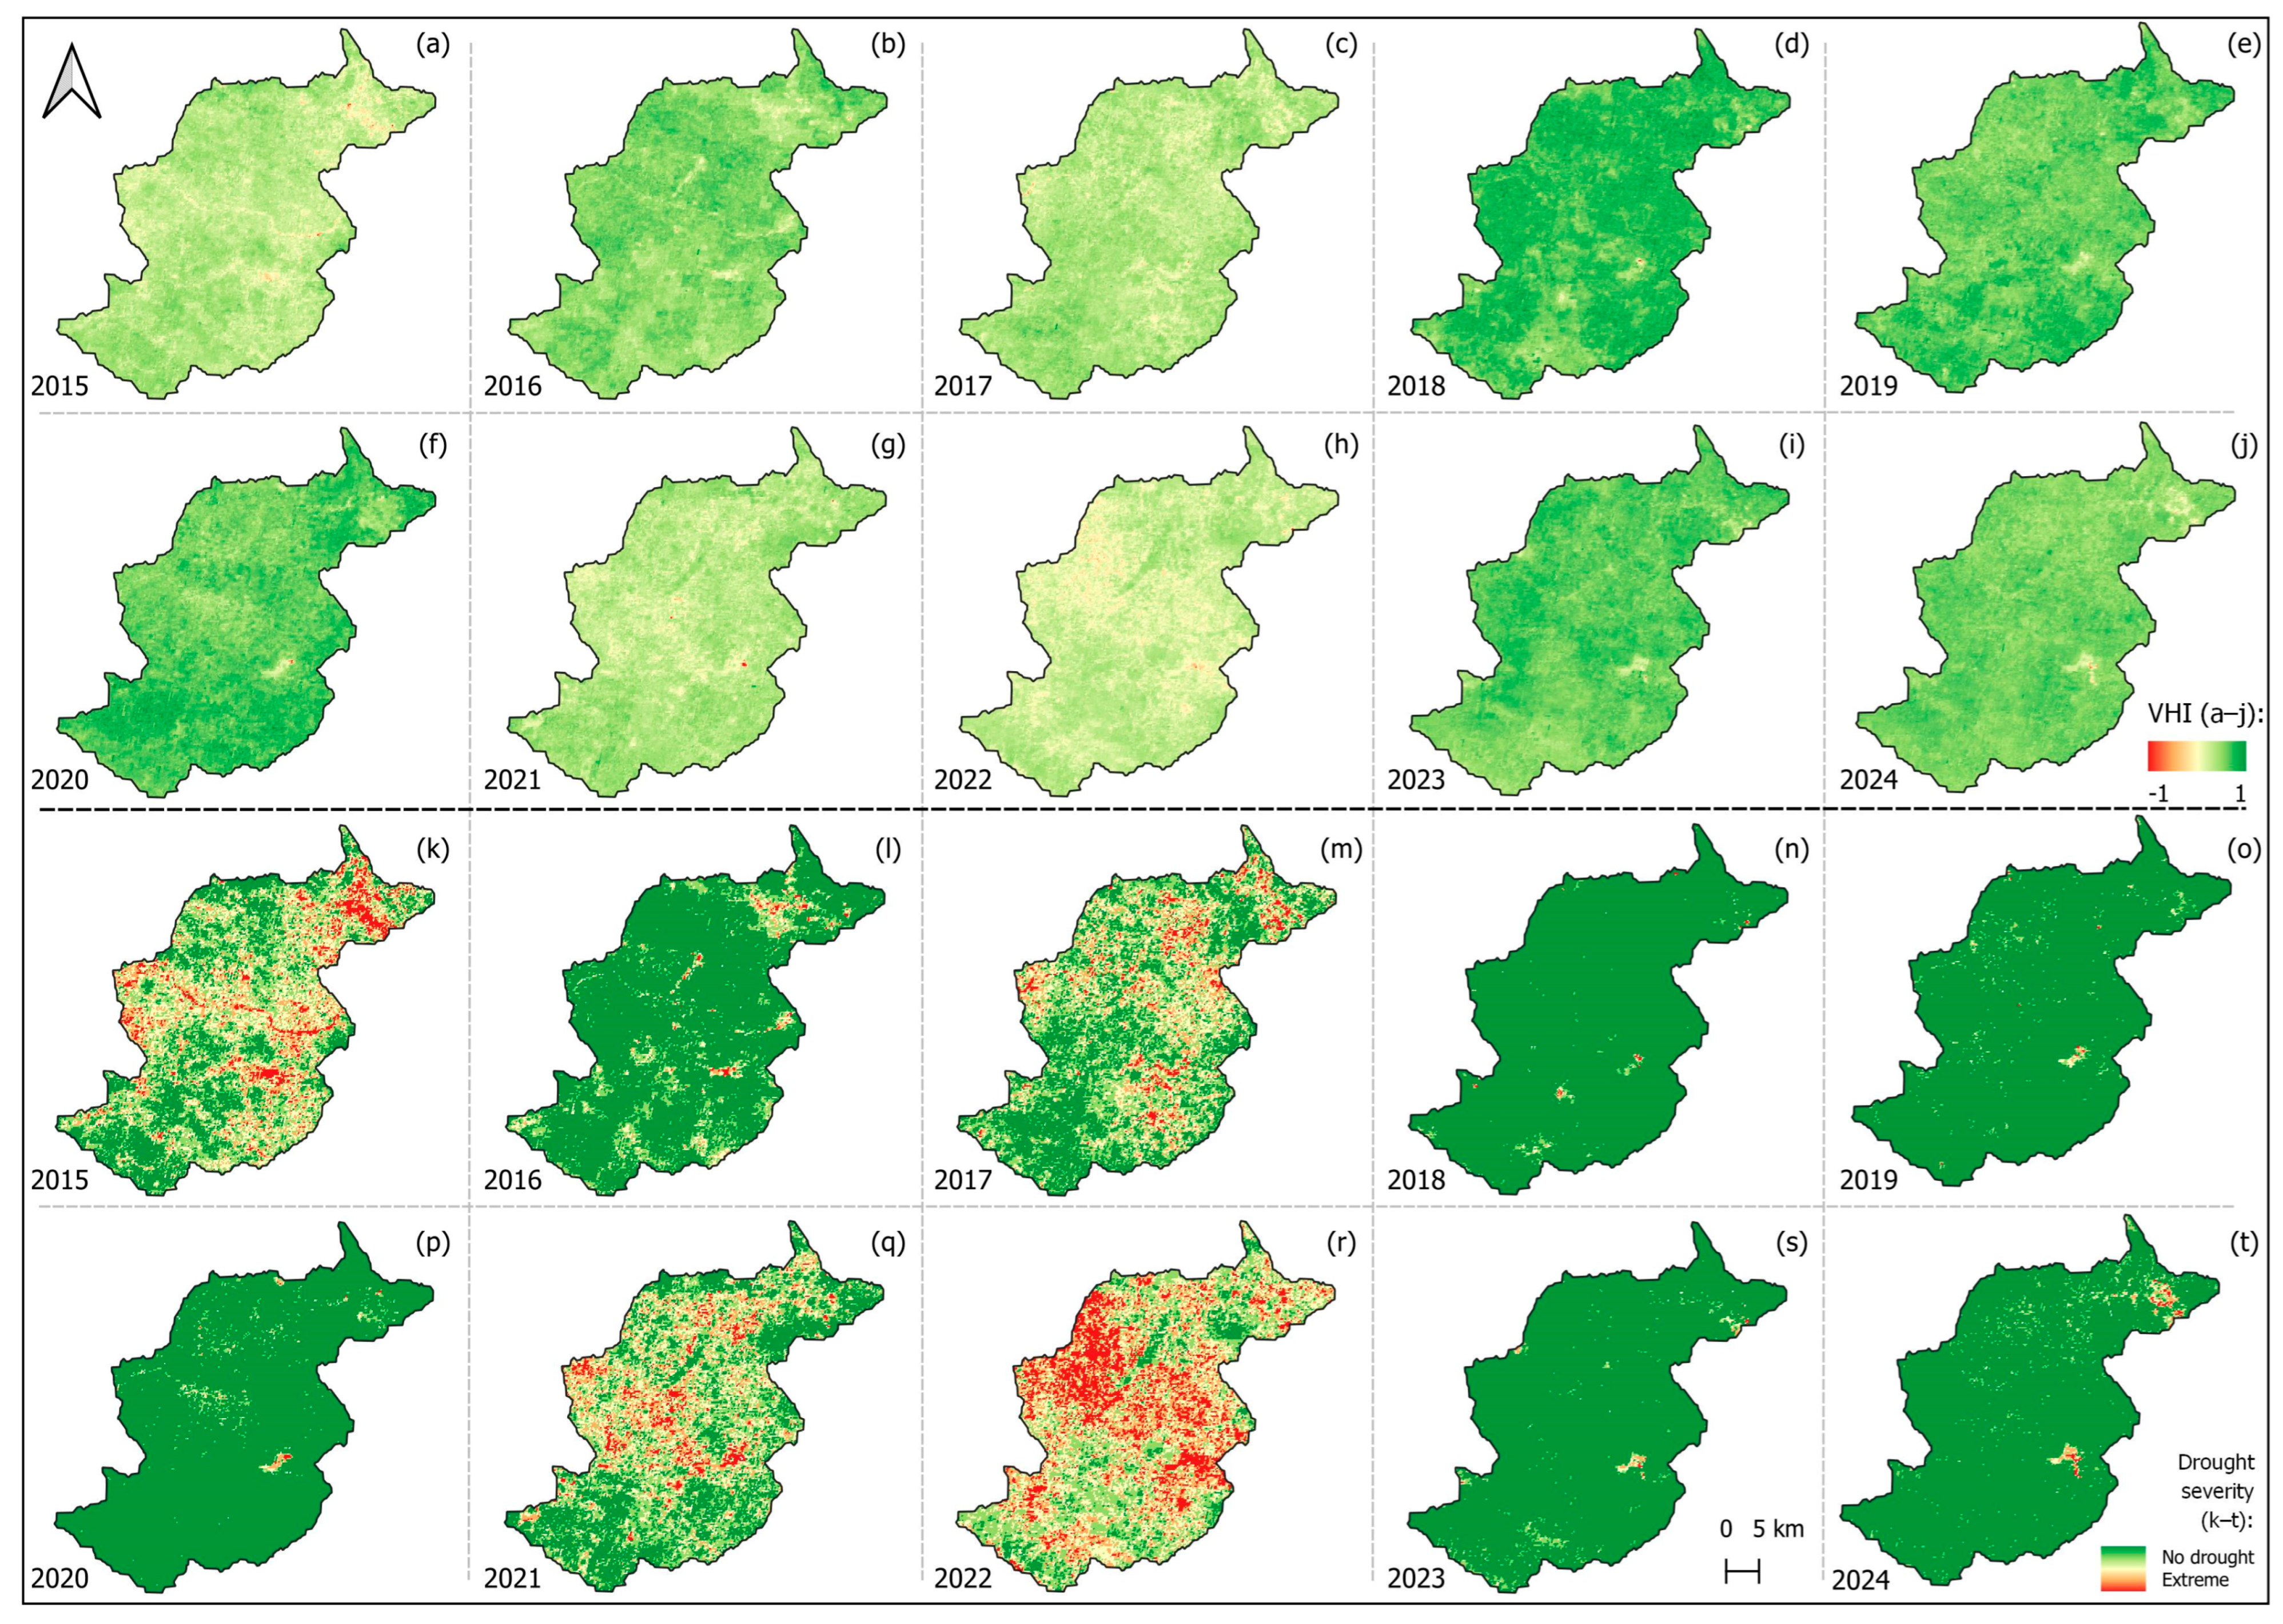
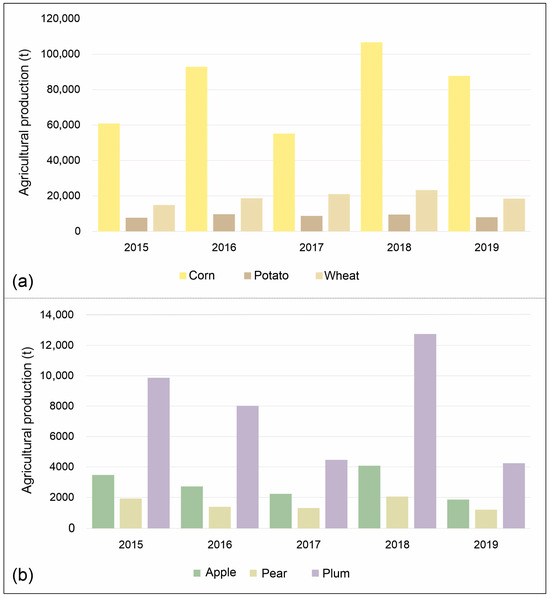
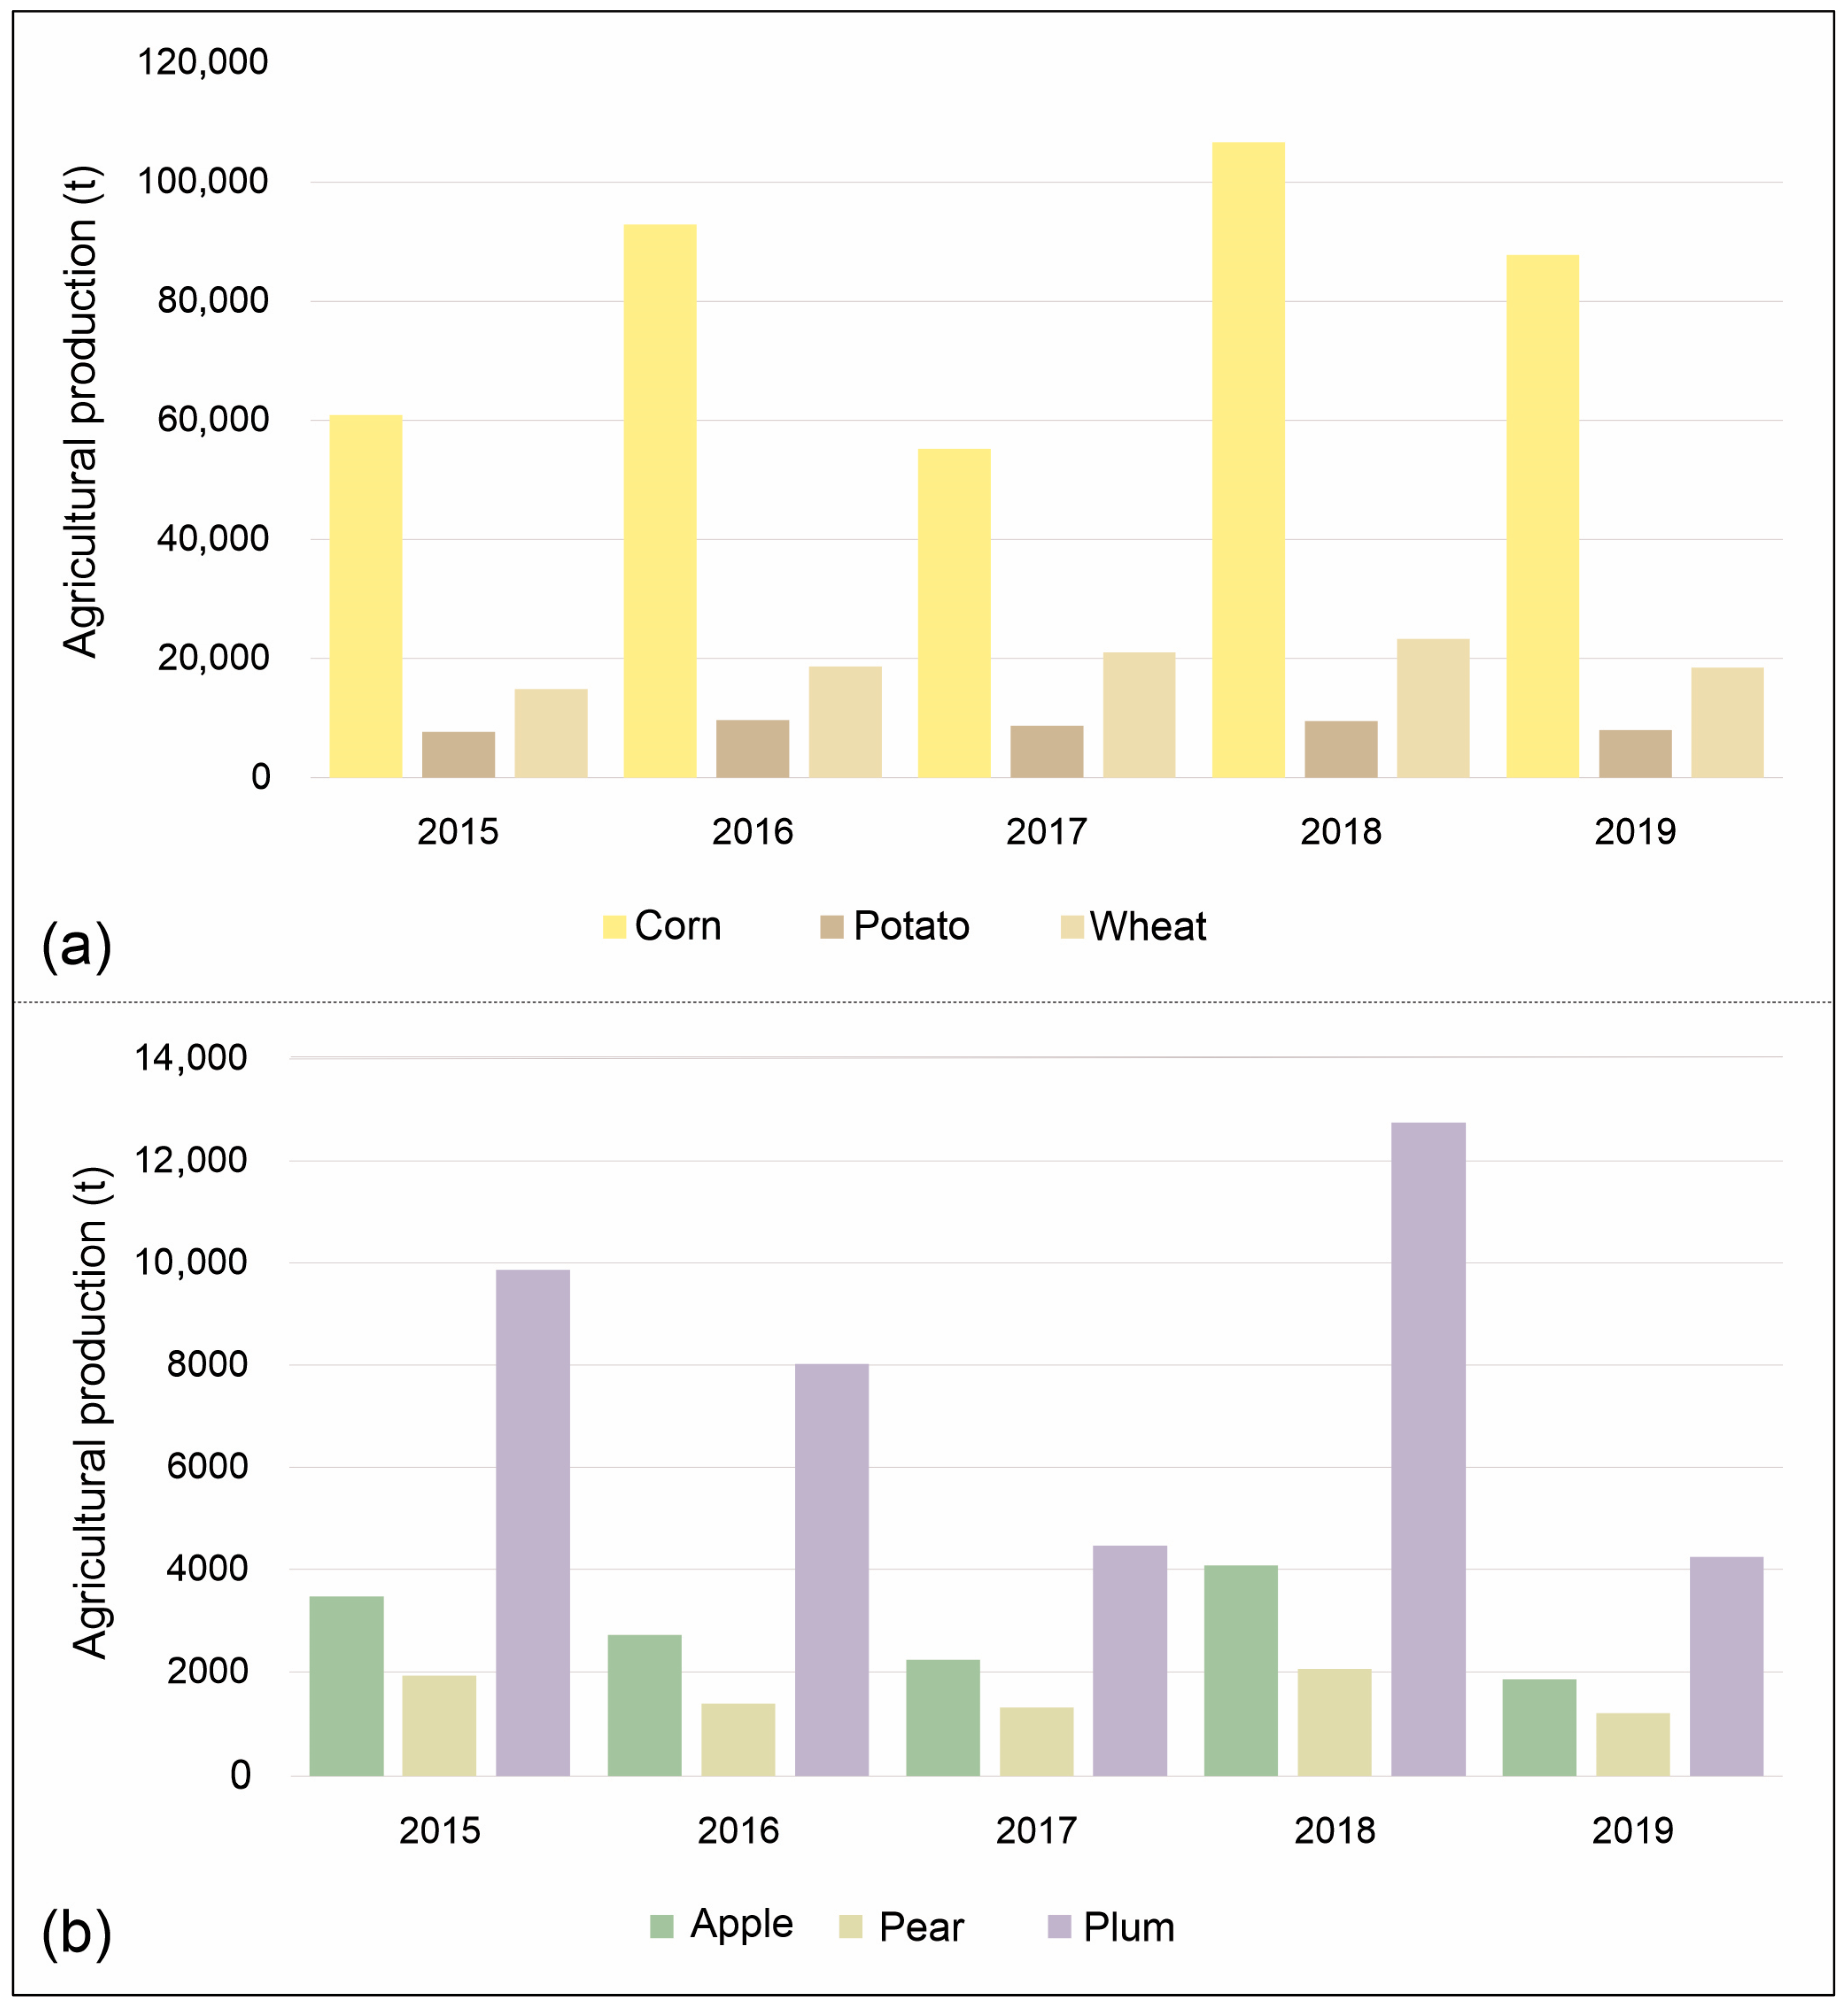
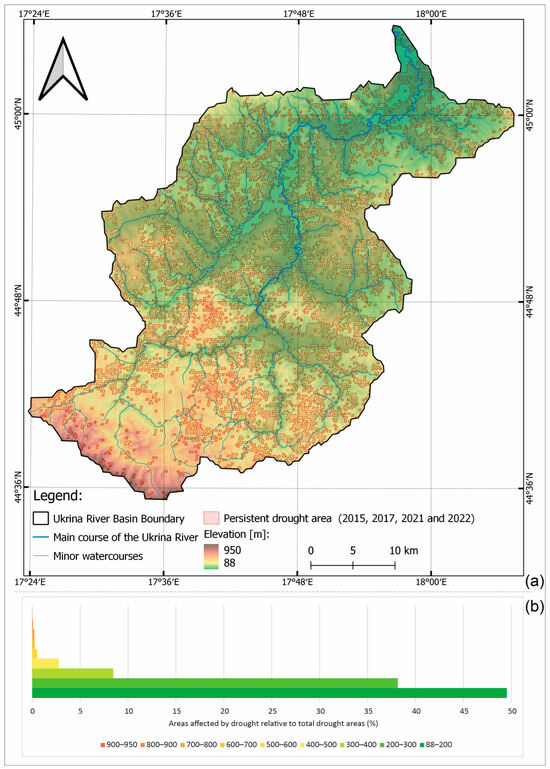
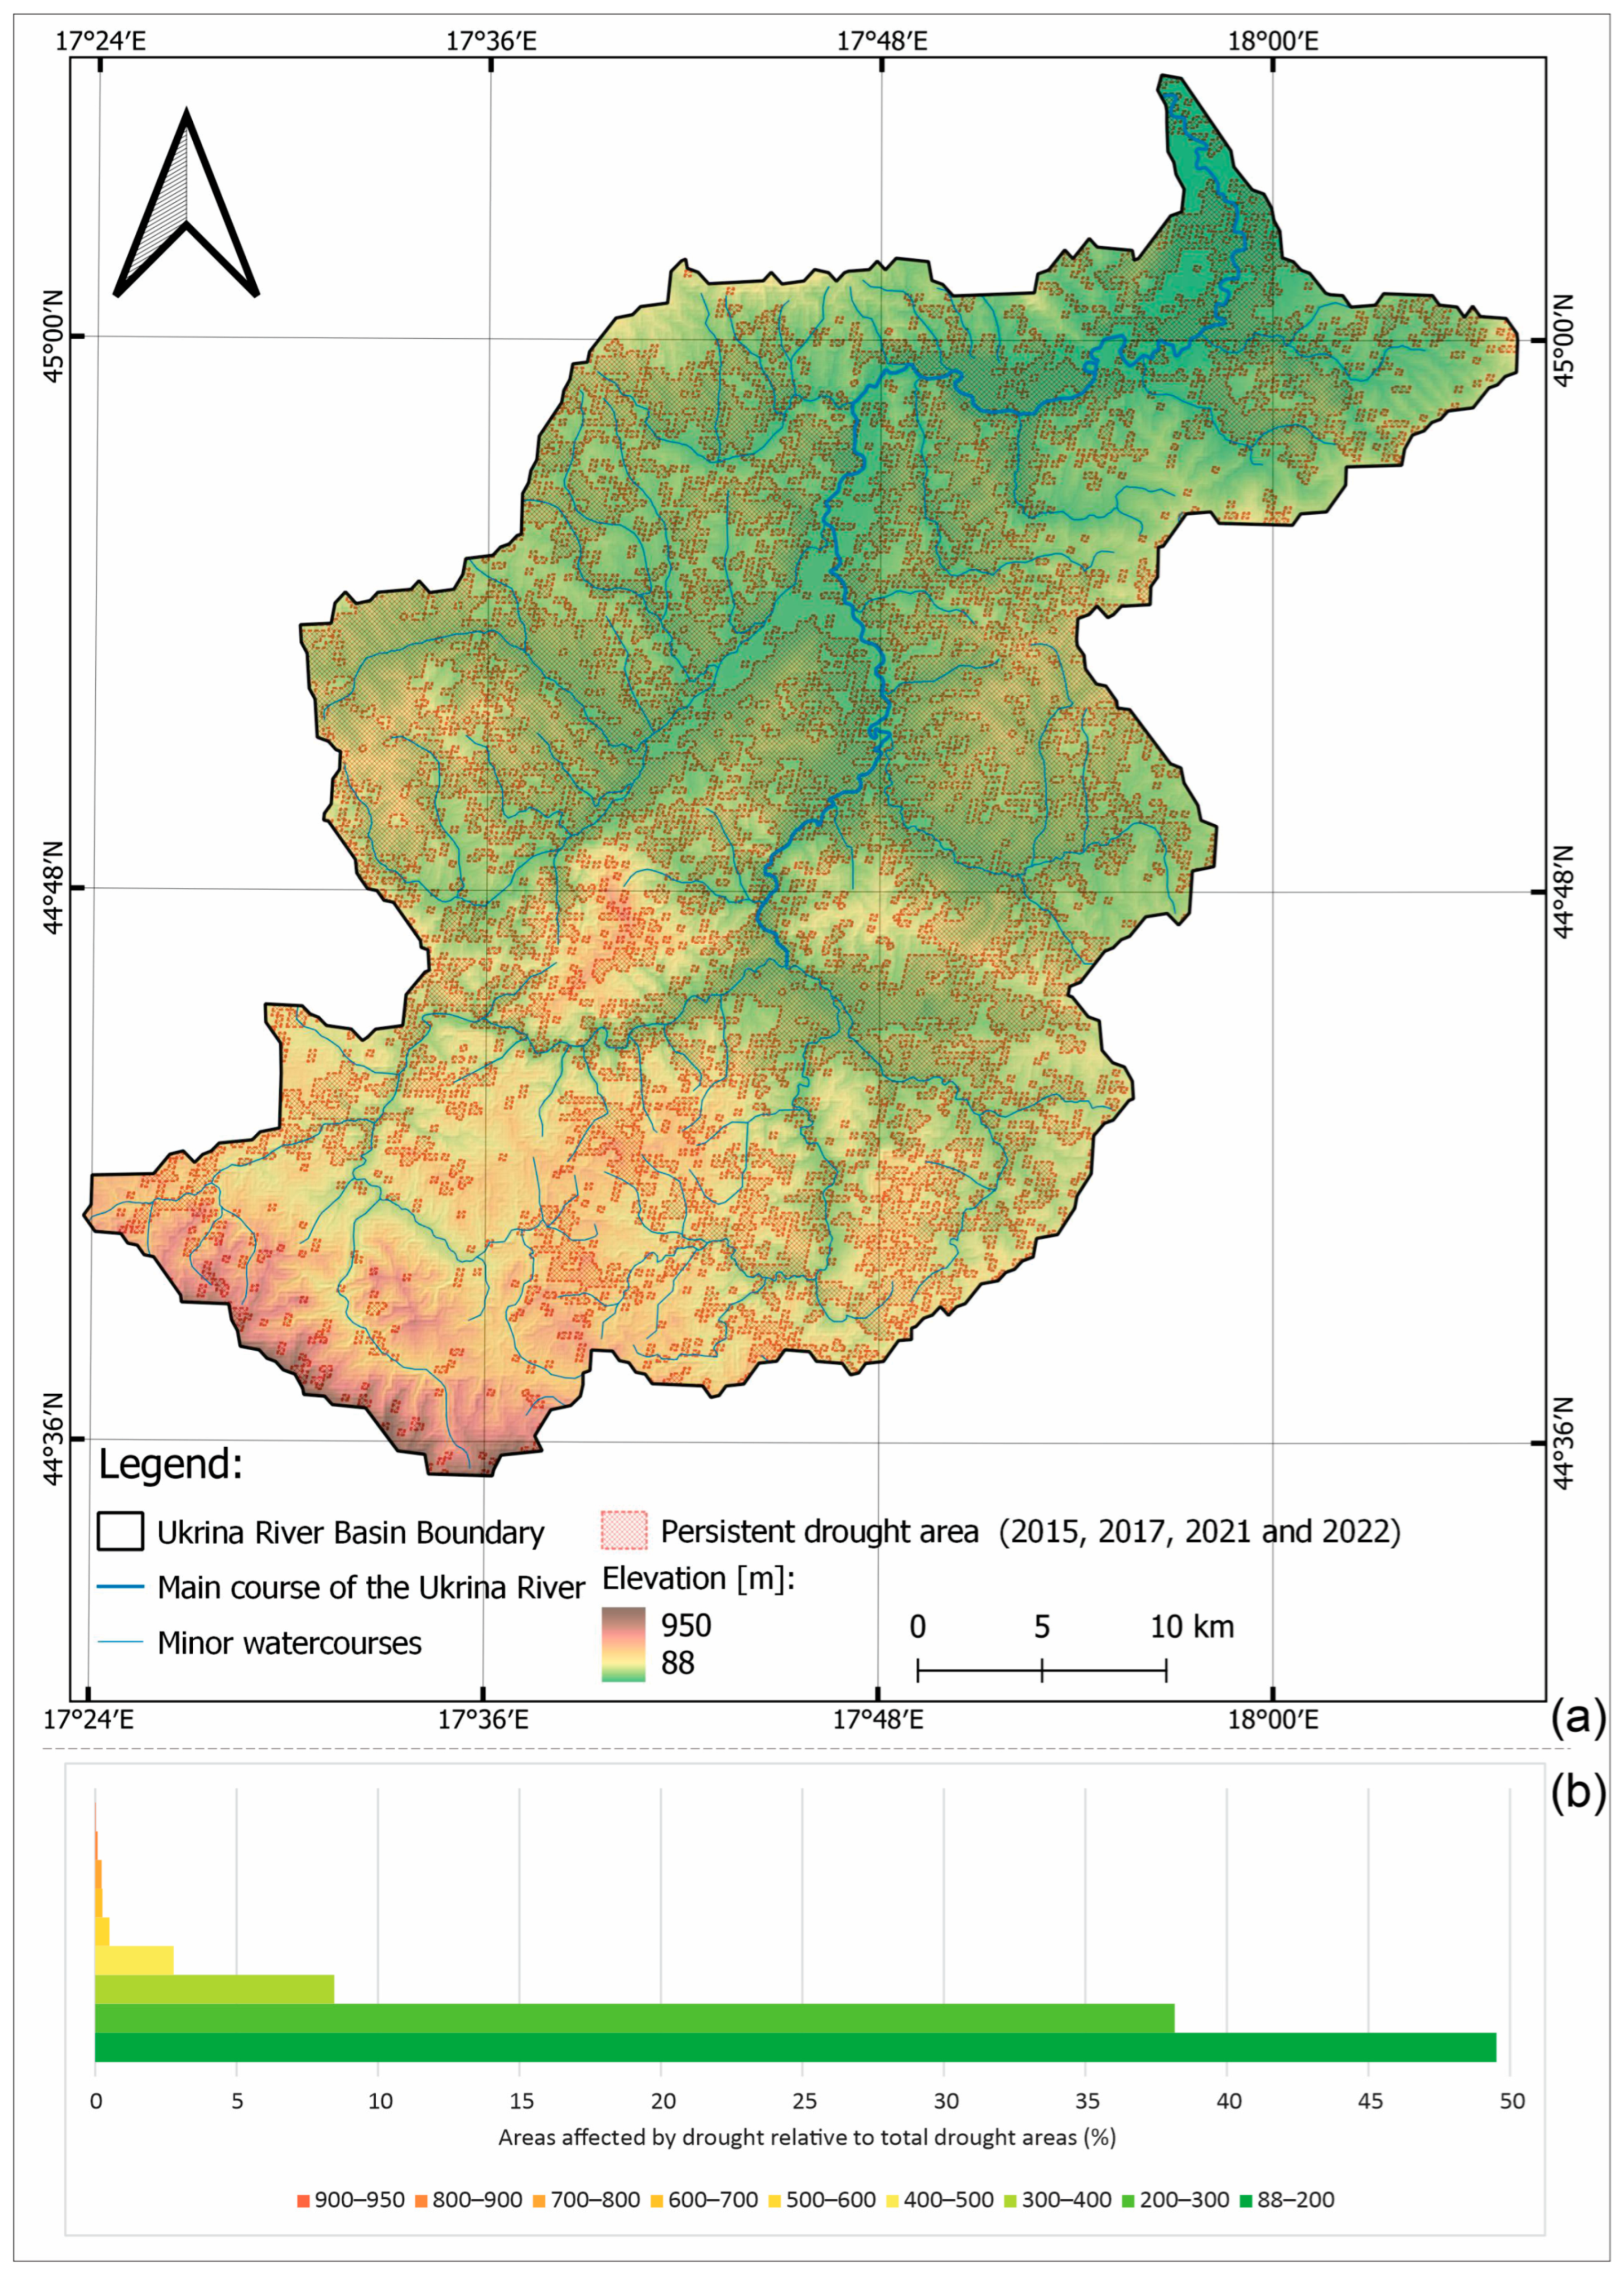
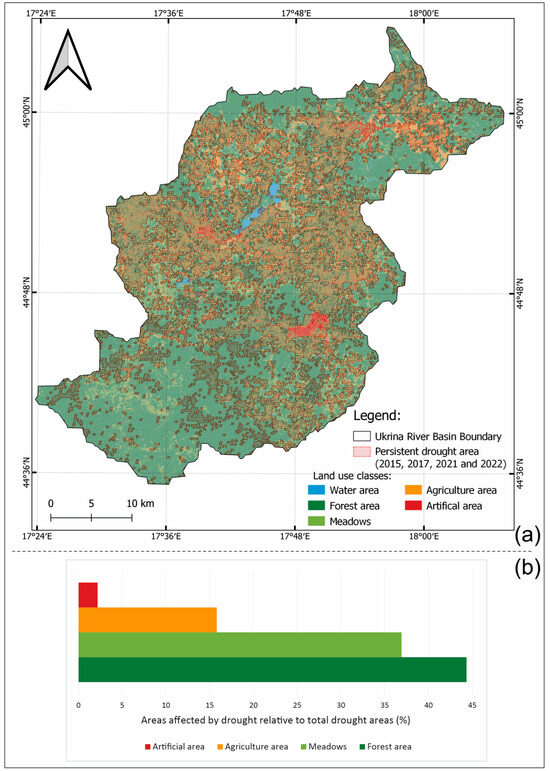
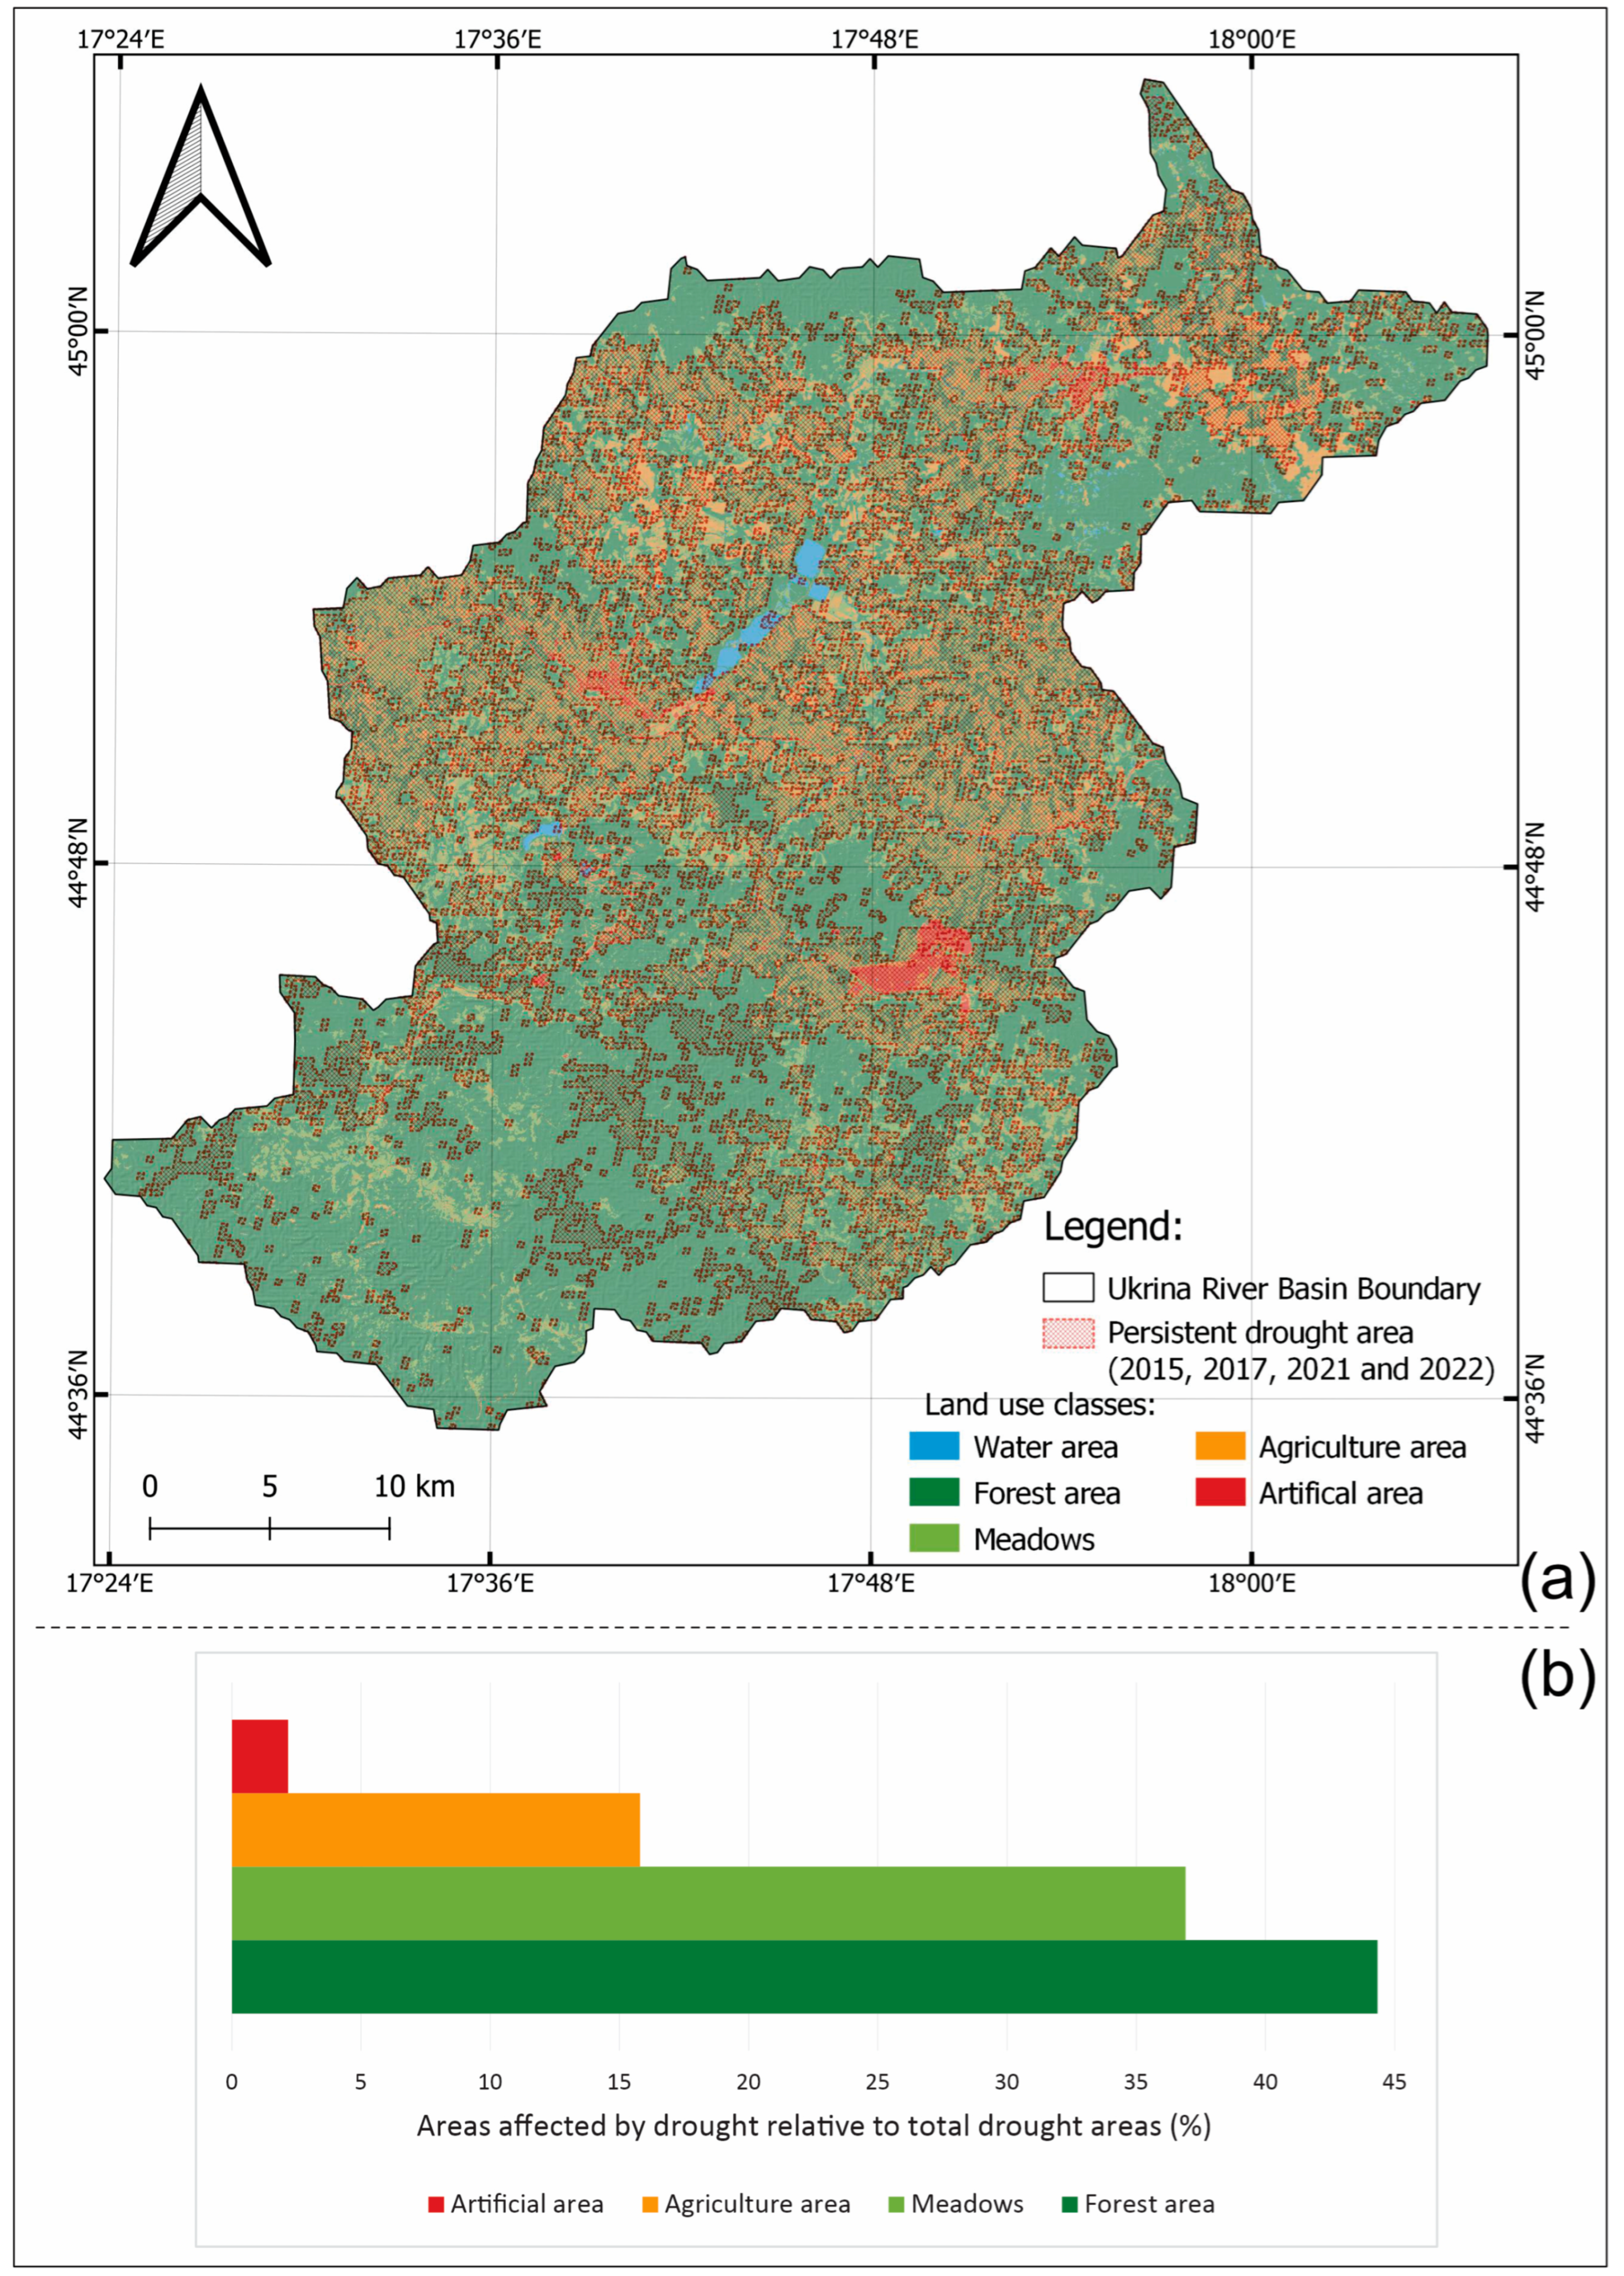
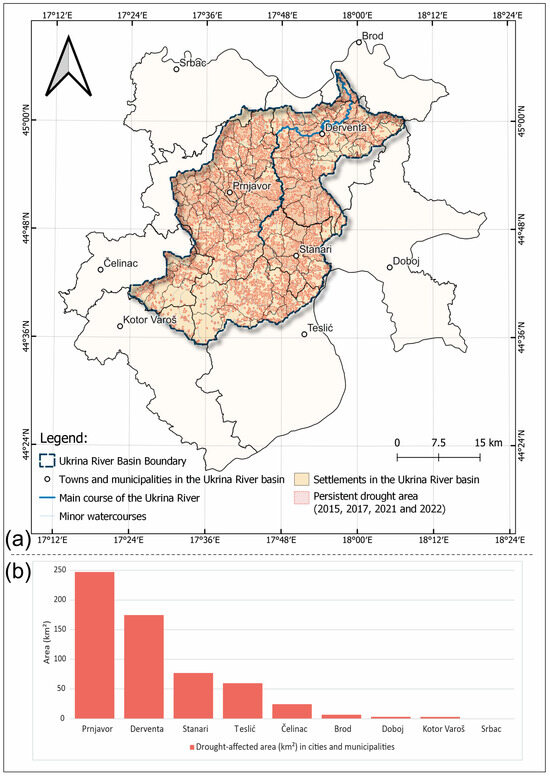
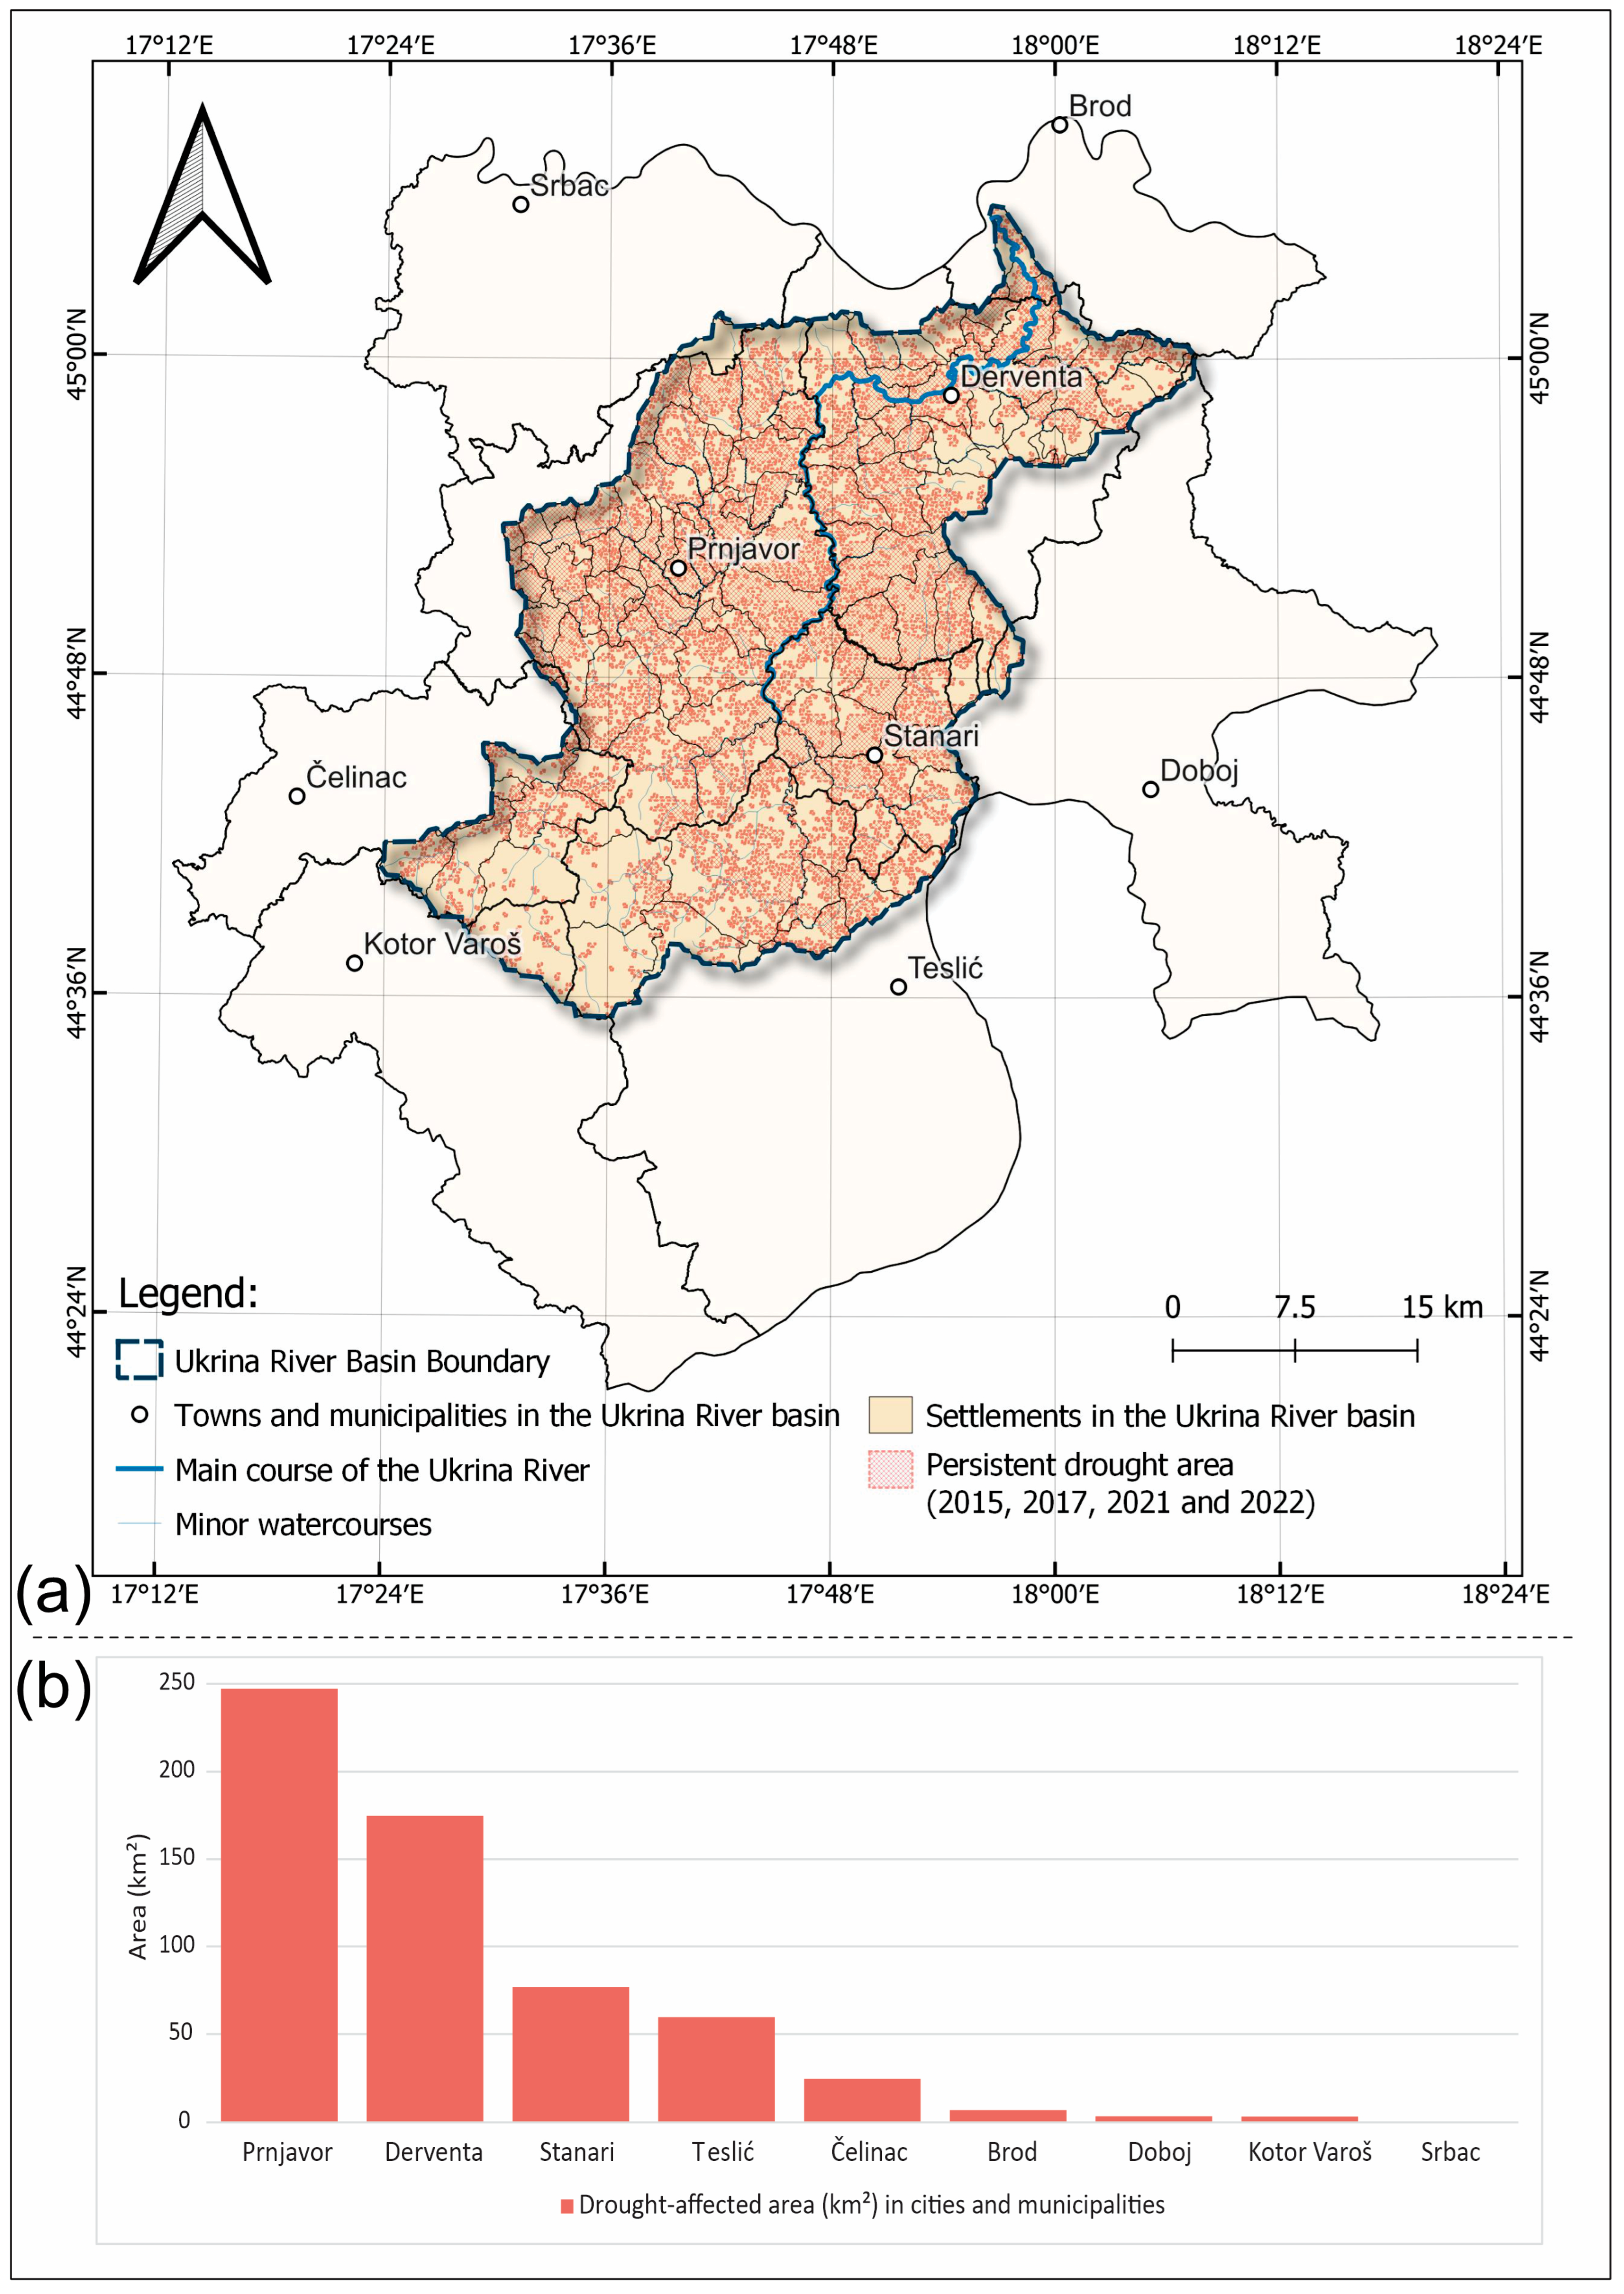

Disclaimer/Publisher’s Note: The statements, opinions and data contained in all publications are solely those of the individual author(s) and contributor(s) and not of MDPI and/or the editor(s). MDPI and/or the editor(s) disclaim responsibility for any injury to people or property resulting from any ideas, methods, instructions or products referred to in the content. |
© 2026 by the authors. Licensee MDPI, Basel, Switzerland. This article is an open access article distributed under the terms and conditions of the Creative Commons Attribution (CC BY) license.