


Abstract
Droughts are recognized as one of the most devastating extreme climate events, leading to severe socioeconomic losses and ecological degradation globally under climate change. With global warming, the frequency and intensity of extreme droughts are increasing, posing critical challenges to water resource management. The Standardized Precipitation Conversion Index (SPCI) has demonstrated potential in drought monitoring; however, its applicability across diverse climatic zones and multiple temporal scales remains inadequately validated. This study addresses this gap by establishing a novel multi-scale inversion analysis using ERA5-based precipitable water vapor (PWV) and precipitation data. SPCI is selected for its advantage in eliminating climatic background biases through probability normalization, overcoming limitations of traditional indices such as the Standardized Precipitation Index (SPI) and Standardized Precipitation-Evapotranspiration Index (SPEI). We systematically evaluated the spatiotemporal evolution of Precipitation Efficiency (PE) and SPCI across four climatic zones in China. Results show that the first two principal components explain over 85% of the spatiotemporal variability of PE, with PC1 independently contributing from 82.05% to 83.80%. This high variance contribution underscores that the spatiotemporal patterns of PE are dominated by a few key climatic drivers, validating the robustness of the principal component analysis. SPCI exhibits strong correlation with SPI, exceeding 0.95 in the Tropical Monsoon Zone (TMZ) at scales of 1–6 months, indicating its utility for short-to-medium-term drought monitoring. Distinct zonal differentiation in PE patterns is revealed, such as the bimodal annual cycle in the Tropical-Subtropical Monsoon Composite Zone (TSMCZ). This study evaluates the performance of the SPCI against the widely used SPI and SPEI across four major climatic zones in China. It validates the SPCI’s applicability across China’s complex climates, providing a scientific basis for region-specific drought early warning and water resource optimization.
1. Introduction
Against the backdrop of global warming, the frequency of extreme climatic events, such as severe droughts and floods, exhibits an increasing trend [1]. Water vapor, acting as a significant greenhouse gas component within the climate of the Earth system, plays a crucial regulatory role in the global energy balance through its cyclic processes [2,3]. The spatiotemporal transmission and transformation mechanisms of latent heat energy during water vapor phase transitions constitute a core feedback loop within the climate system [4]. Specifically, atmospheric water vapor transports latent heat energy from low to high latitudes via advection. When ascending air masses reach the condensation level, the latent heat released during phase change is converted into sensible heat [5]. This energy conversion process not only drives the operation of atmospheric circulation systems but also directly impacts the energy budget of the Earth-atmosphere system by altering radiative forcing [6]. Water vapor, as the primary contributor to cloud formation and precipitation, is observed to exhibit significant spatiotemporal fluctuations, with its concentration generally recognized as positively correlated with extreme events [7,8,9]. Consequently, a detailed understanding of the spatiotemporal variability patterns of water vapor content and precipitation amount holds significant scientific value for quantifying dynamic changes within the climate system and enhancing predictive capabilities for extreme weather events.
The role of water vapor content in precipitation is widely acknowledged; however, the intrinsic mechanisms governing this connection are not fully understood [10,11]. Observed correlations between water vapor and precipitation are often limited [12,13], especially during extreme events where precipitation intensity is critically dependent on moisture availability [14]. Given this context, Precipitation Efficiency (PE) has emerged as a widely used metric for assessing the effectiveness of dynamic precipitation mechanisms, highlighting the crucial roles of both moisture availability and these mechanisms in precipitation generation [15]. Specifically, PE characterizes the conversion efficacy of atmospheric moisture at specific spatiotemporal scales, defined as the ratio within regional grid cells and widely applied in extreme weather analysis and hydrological cycle studies [16]. The utilization of PE as a diagnostic tool provides valuable insights into the underlying mechanisms driving extreme drought and pluvial events [17]. By quantifying the conversion of atmospheric water vapor to precipitation at given locations, PE contributes to enhanced understanding of precipitation generation mechanisms [18,19]. A case study of Guangdong obtained long-term high-resolution historical records of PE by combining dense GNSS station network observations with precipitation data; these records were subsequently characterized for extreme droughts and pluvial events through climatic indices [20].
However, PE exhibits divergent outcomes across long-term sequences and diverse climates due to inherent limitations. It shows systematically depressed values in humid, high-PWV zones like monsoon regions because it quantifies instantaneous vapor conversion while neglecting climatic background variations [21]. Furthermore, CMIP6 models indicate that PE’s ability to project extreme precipitation is constrained by an inability to decouple thermodynamic and dynamic processes, amplifying biases in humid zones [22]. In contrast, the Standardized Precipitation Conversion Index (SPCI) effectively eliminates these climatic biases through probability normalization, building on the Standardized Precipitation Index (SPI) foundation [23,24]. By integrating historical PE data, SPCI simultaneously quantifies drought intensity, duration, and spatial distribution, enabling the identification of localized disparities, which is valuable in complex topography [25]. For instance, the GNSS-derived SPCI was first applied by Zhu et al. to analyze drought propagation in Yunnan, quantifying the transition from meteorological to hydrological drought [26]. Subsequent validations across diverse environments, including improved flash drought capture with a temperature term [27], enhanced agricultural warning with vegetation indices [28], and effective use in alpine regions, demonstrating SPCI’s applicability beyond single climate types. Nevertheless, challenges remain, such as capturing detailed wet–dry transitions in complex terrains due to satellite data resolution limits [29], requiring further investigation into interannual circulation anomalies for improved long-term monitoring [30].
Given the complex spatial variability of SPCI across regions, region-specific investigations are imperative. China, located in eastern Asia, exhibits significant moisture fluctuations in its southeastern coastal zones and frequent land–atmosphere interactions in its northwestern inland regions. The topography of China features a distinctive three-step ladder-like spatial division which extends from west to east as the uplifted Tibetan Plateau belt, the transitional second-step terrain belt, and the eastern alluvial plain belt. Thermodynamic forcing and orographic blocking generate complex atmospheric circulation patterns, predisposing the region to extreme climatic phenomena such as torrential rainfall, floods, and droughts. Recent research on the 2023 extreme rainstorm in Beijing that applies GNSS-PWV has further confirmed that anomalous moisture transport triggers extreme rainfall, and the spatiotemporal evolution characteristics of PWV under the combined effects of typhoon systems and topographic uplift have been revealed [31].
However, to the best of our knowledge, a systematic national-scale zonal comparison of the SPCI across multiple climatic zones remains limited. Although previous studies have explored SPCI-like or PWV-based drought analyses in specific regions, a systematic national-scale zonal comparison using a consistent ERA5-only framework is lacking. This study aims to fill this gap by establishing a multi-scale integrated inversion analysis scheme based solely on ERA5 reanalysis data, focusing on the unique aspects of national-scale zonal comparison and the ERA5-only approach to distinguish it from previous work. The primary objectives are to systematically characterize the spatiotemporal evolution patterns of PE across four representative climatic zones in China, calculate SPCI for each climatic zone using long-term PE datasets, analyze nationwide extreme drought and pluvial events through corresponding climatic indices, and explore the occurrence frequency characteristics of dry and wet periods under multi-temporal scales. Methodologically, PWV and precipitation data from ERA5 reanalysis are innovatively integrated to overcome limitations of previous studies that focused on single climatic zones or short-term scales. This study conducts a multi-scale analysis of PE and SPCI across China’s major climatic zones using an ERA5-only framework. The novelty lies in three aspects: first, a multi-scale analytical method for PE and SPCI analysis across four climatic zones in China is constructed, emphasizing the national-scale zonal comparison; second, the cross-zone differentiation mechanisms of PE driven by monsoon dynamics and topographic effects are systematically clarified, distinguishing this work from previous regional studies; third, the applicability of SPCI across complex climatic gradients is comprehensively validated, highlighting the unique contribution of the ERA5-only approach. This distinguishes our study from earlier research that often relied on mixed data sources or focused on single regions. The contributions of this study provide a scientific basis for understanding the dynamic mechanisms of extreme drought and pluvial events and offer robust support for region-specific drought early warning and water resource optimization.
2. Materials and Methods
2.1. Study Area and Data
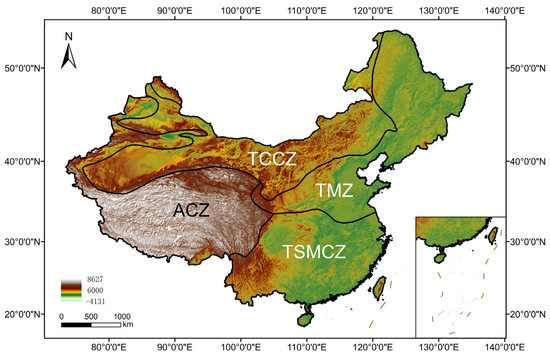
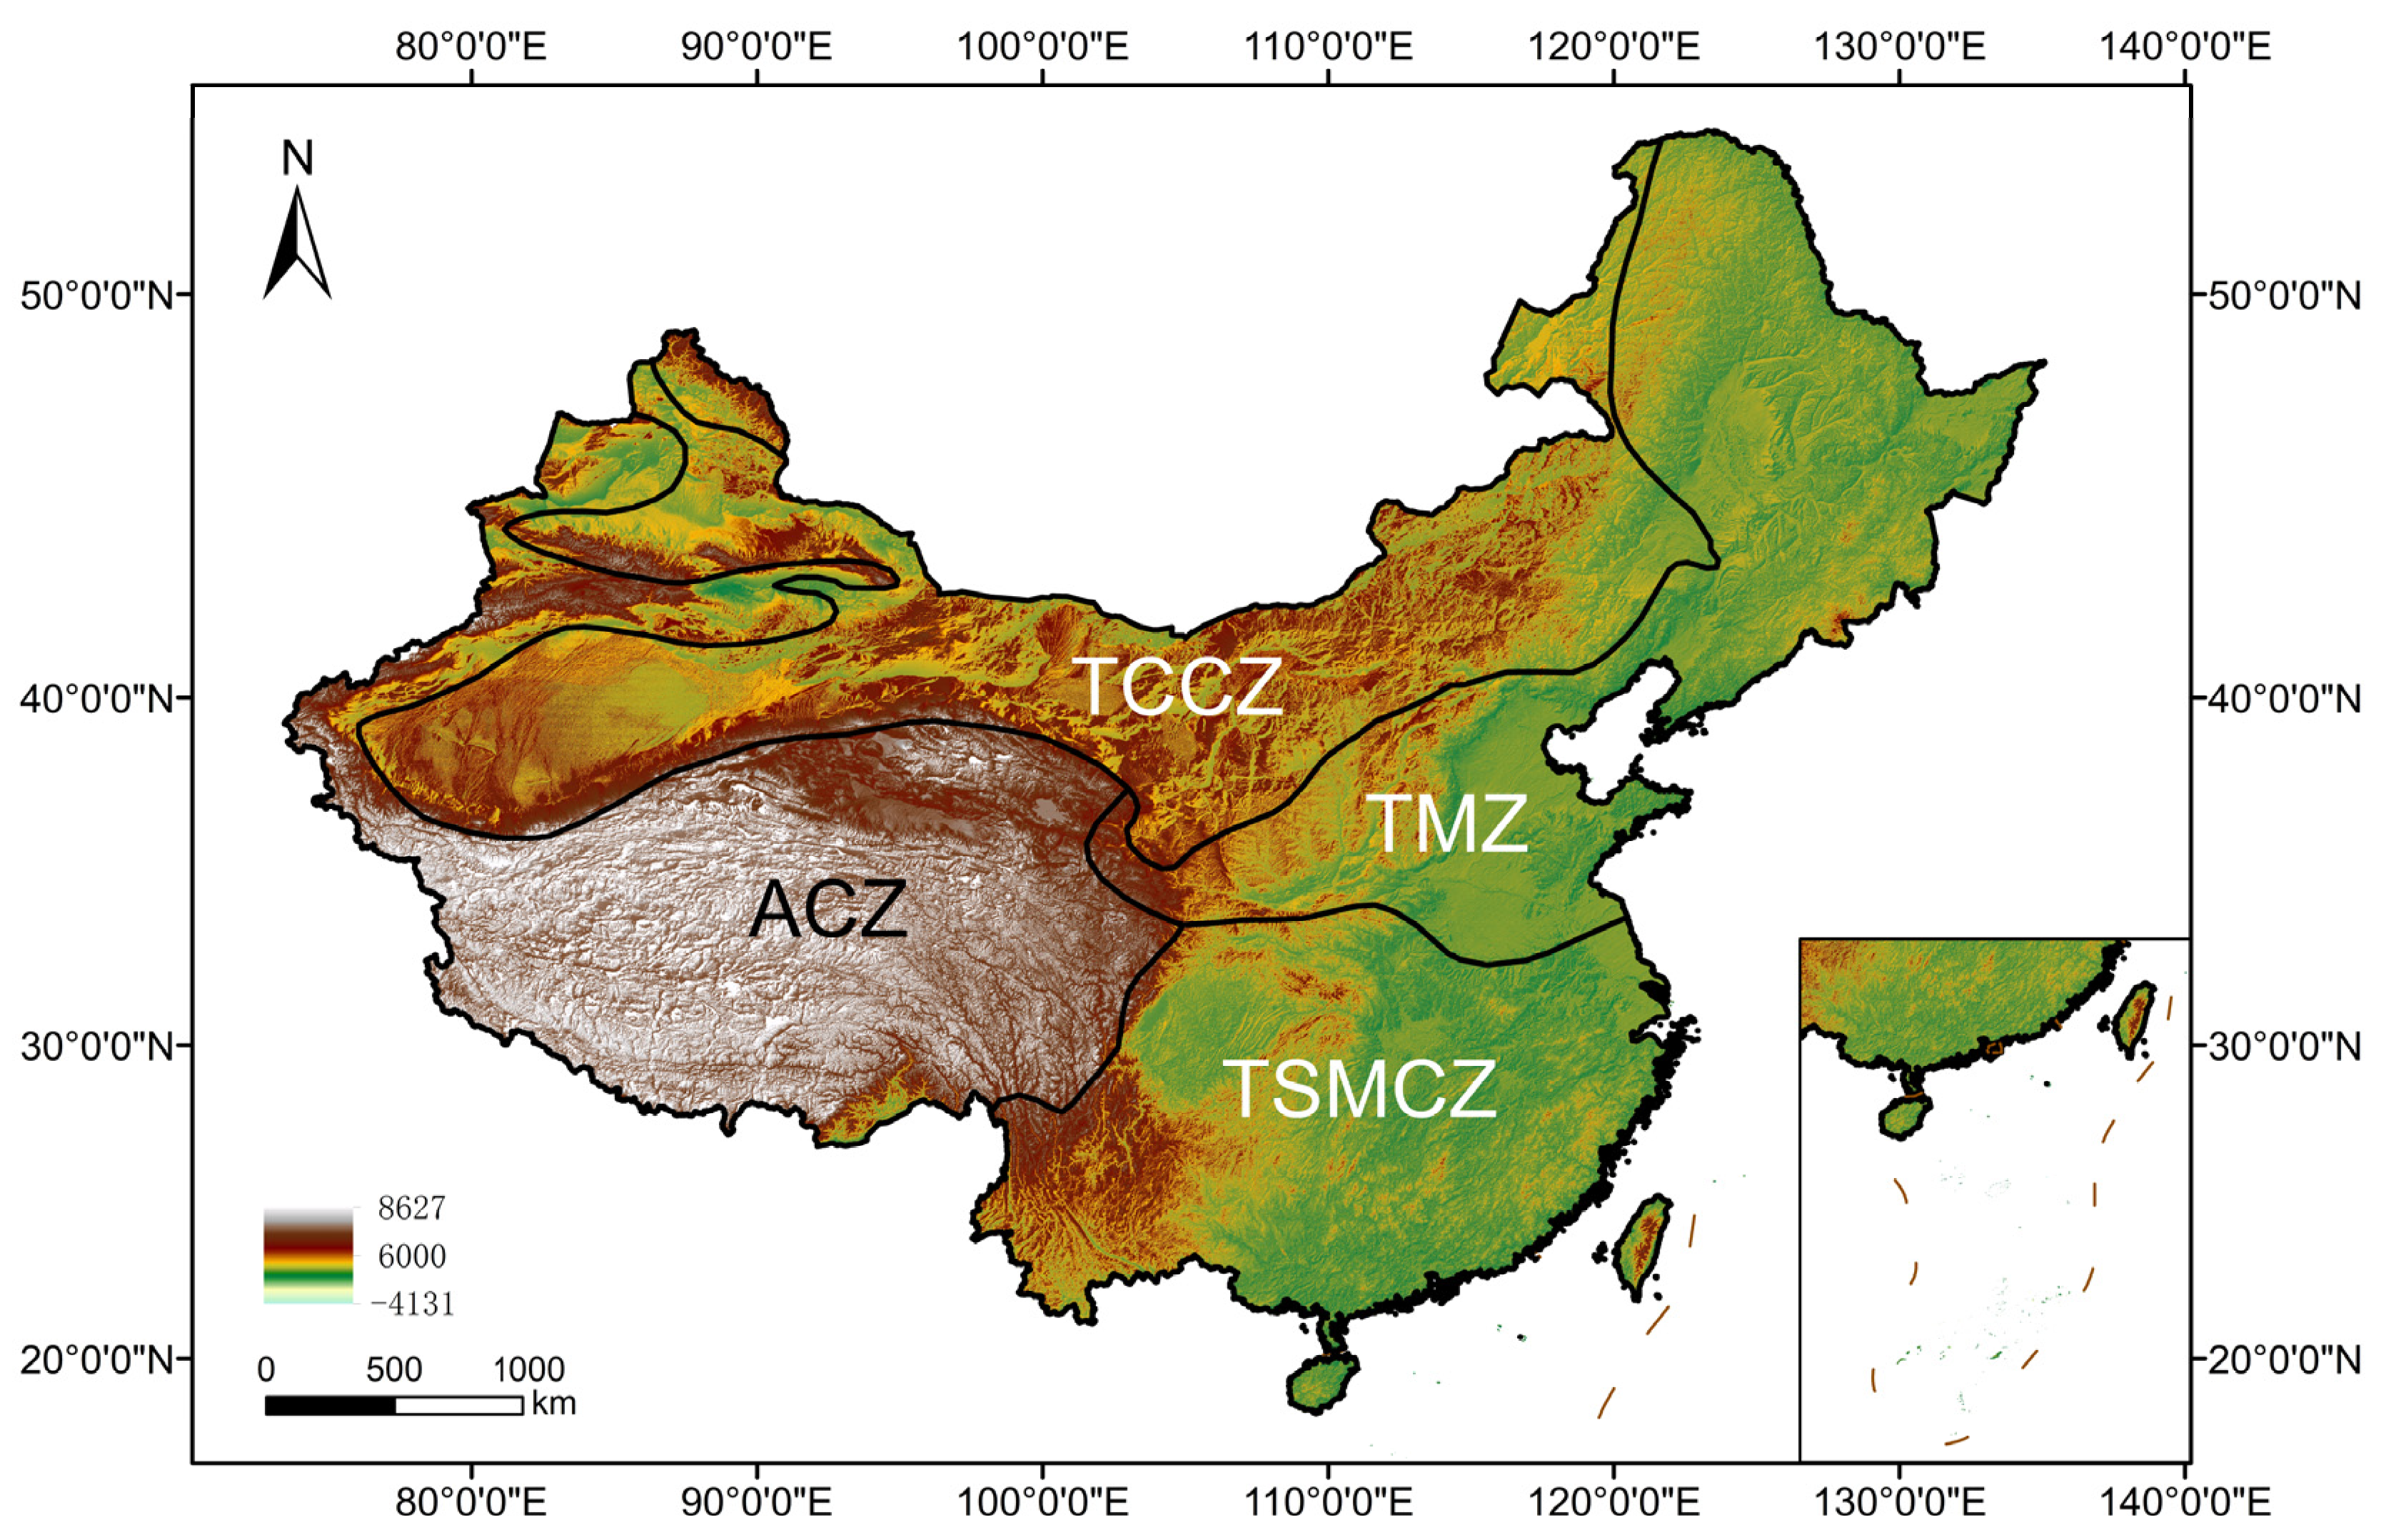
China exhibits complex and diverse topography characterized by a distinct terraced geomorphological distribution. Based on climatic systems and moisture transport dynamics, the territory of China is classified into four primary climatic divisions comprising the Tropical-Subtropical Monsoon Composite Zone (TSMCZ), temperate monsoon zone (TMZ), alpine climate zone (ACZ), and temperate continental climate zone (TCCZ), as delineated in Figure 1. The TSMCZ is modulated by the East Asian monsoon and subtropical high, yielding abundant precipitation with marked wet–dry seasonality. The TMZ is characterized by four-season cyclicity where precipitation concentrates during summer monsoon dominance. Governed by westerlies and continental highs, TCCZ exhibits minimal precipitation and significant thermal variability. Driven by altitudinal thermo-dynamic processes, ACZ demonstrates pronounced vertical climate stratification.
Figure 1.
Map of climatic zonation in China.
Owing to its vast territory, the climate of China encompasses both monsoonal and continental characteristics. The interaction between atmospheric circulation and topography shapes the spatiotemporal distribution of precipitation, exhibiting a general pattern of abundance in the southeast and scarcity in the northwest. Furthermore, precipitation is predominantly concentrated during the advancing phase of the summer monsoon. Monsoon regions are prone to flood disasters triggered by intense precipitation events, while inland arid and semi-arid areas face risks associated with seasonal water scarcity. This climatic differentiation profoundly influences regional hydrological cycles and the frequency of extreme weather events across different zones.
This study utilizes the ERA5 reanalysis dataset, the latest global atmospheric reanalysis product released by the European Centre for Medium-Range Weather Forecasts (ECMWF, https://cds.climate.copernicus.eu/). Although widely used in tropospheric parameter modeling and validated for consistency, ERA5 data may contain biases in complex terrains like mountainous areas, requiring cautious interpretation of results. The period from January 2000 to December 2024 was selected for analysis, during which single-level monthly data products were acquired. Total precipitation (TP) and total column water vapor (TCWV) datasets were retrieved at a spatial resolution of 0.25° × 0.25°. Based on the principle of synergistic water vapor–precipitation retrieval, we established a computational analytical method for precipitation PE and SPCI.
The standardized Precipitation-Evapotranspiration Index (SPEI) functions as an integrated drought metric, characterizing multi-scale moisture deficits by quantifying precipitation-potential evapotranspiration equilibrium [32]. Based on hydrothermal coupling principles, it incorporates atmospheric water balance parameters to objectively capture drought drivers. This study utilizes the SPEIbase Global Standardized Drought Database (https://spei.csic.es), providing monthly 0.5° × 0.5° resolution data since 1901. This dataset establishes a benchmark analytical method for validating precipitation–vapor coupling indices’ drought characterization capabilities.
The detailed attributes of all original datasets utilized in this study, including their sources, temporal coverage, and resolutions, are comprehensively summarized in Appendix A, Table A1 for reference.
2.2. Establishment of Precipitation Efficiency and Standardized Precipitation Conversion Index
PE denotes the fraction of average PWV above a station that is effectively converted into measurable precipitation over a specific time interval. This metric is extensively applied in extreme weather analysis and hydrological cycle research [33]. During data preprocessing, we applied physical constraints to TP and TCWV. For example, we set TP values below zero to 0.1 mm and constrained TCWV values less than 0.1 mm to 0.1 mm to eliminate physically implausible values. Concurrently, missing values are filled via nearest-neighbor interpolation along latitude and longitude dimensions. For PE computation, an effective mask is constructed to exclude invalid data points, with PE subsequently calculated using the following equation:
where refers to PE, which is expressed in percentage, while P refers to the monthly average of daily total precipitation, and denotes the monthly mean PWV, corresponding to the TCWV in the downloaded dataset.
SPCI quantifies the efficiency of atmospheric moisture conversion to precipitation over specific spatiotemporal scales. It is defined as the ratio of the total amount of precipitation to the total amount of atmospheric water vapor in a given period of time in a certain region [25]. Building on PE core logic, SPCI eliminates climatic background biases through probability normalization, enabling direct cross-regional and cross-temporal comparison. Bordi et al. [33] demonstrated that lower precipitation conversion rates correspond to drier conditions, while higher rates indicate wetter environments. Physically, SPCI reflects the coupling degree between PWV and actual precipitation: high SPCI indicates a large proportion of atmospheric moisture converted into measurable precipitation, corresponding to wet conditions with sufficient water supply and active moisture condensation; low SPCI signifies low moisture conversion efficiency, reflecting dry conditions where atmospheric PWV is not effectively released as precipitation, leading to water deficit.
denotes SPCI at the n-month scale, following a standard normal distribution with mean 0 and standard deviation 1 after normalization, where n serves as the temporal resolution parameter (1, 3, 6, 12, …). is the month index, ranging from the starting month to , and m represents the first month of the multi-month time scale. stands for the total precipitation in month with the unit of mm. refers to the monthly average PWV in month (unit: mm), derived from the calculation of TCWV in ERA5 datasets. is the number of days in month , used to normalize PWV to the total monthly moisture stock. is the summation operator, accumulating variables over the -month time scale. represents the month-wise Z-score normalization operator, defined as where is the raw PCI value, is the long-term mean of PCI for calendar month , and is the standard deviation of PCI for calendar month . This process is applied to the accumulated PCI values separately for each calendar month across the entire time series: for any given calendar month, such as all Januarys in the study period, we first calculate the long-term mean and standard deviation of PCI values for that specific month, then standardize each raw PCI value by subtracting the monthly mean and dividing by the monthly standard deviation. This procedure ensures that the resulting SPCI values for each calendar month follow a standard normal distribution, effectively removing the seasonal climatic cycle while aligning with established practices in climate extreme indices analysis. This standardization eliminates seasonal climatic differences, ensures the comparability of SPCI across seasons and regions, and facilitates consistent threshold-based classification of wet and dry events throughout the year.
This study characterizes drought and wet events based on their duration and peak severity. The severity level is determined by the SPCI value according to the classification in Table 1. An extreme climatic event is defined as a period of anomalous PE persisting for three months or longer encompassing both extreme wet and dry conditions [20]. The duration threshold is adopted based on the drought event definition established by Thomas et al. ensuring the capture of sustained climatic anomalies [34]. Consequently each identified event has a defined duration from the start to the end month and a peak severity value represented by the most extreme SPCI value recorded during the event.
Table 1.
The drought/wet classification catalog.
The SPI is one of the core metrics for assessing drought conditions. It essentially quantifies precipitation anomalies at different time scales using a probabilistic approach. The calculation of SPI first requires selecting an appropriate probability distribution function for the long-term precipitation series of the study area. Extensive research shows that the two-parameter Gamma distribution effectively describes the statistical characteristics of monthly precipitation data and is the most commonly used probability density function for SPI calculation [35]. Prior to application, goodness-of-fit tests such as the Chi-Square test or the Kolmogorov–Smirnov test should be conducted to confirm the suitability of the Gamma distribution for the local precipitation data [36].
The probability density function of the Gamma distribution is defined as
where is the precipitation amount; is the shape parameter; is the scale parameter; and is the Gamma function.
The specific calculation of the SPI follows a sequence of steps. First, the monthly precipitation data are aggregated over the chosen time scale to produce a new precipitation series. Next, for each calendar month separately, the parameters of the Gamma distribution are estimated from the aggregated series using a robust method such as the L-moments approach. Based on these parameters, the cumulative probability corresponding to every aggregated precipitation value is then computed. Finally, this cumulative probability is transformed into a standard normal variable, or Z-score, through the inverse of the standard normal distribution function. The resulting SPI series thus follows a standard normal distribution with a mean of zero and a standard deviation of one. Negative SPI values indicate precipitation below the long-term median, representing dry conditions, whereas positive values reflect precipitation above the median, indicating wet conditions.
2.3. The Analytical Method
The principal component analysis (PCA) orthogonally transforms correlated variables into independent components to extract temporal features [37]. Eigenvector matrices capture spatial patterns, while PCs are ranked by variance contribution. Dominant PCs retain key variability. SVD resolves the spatiotemporal patterns for m × n datasets as
where refers to the temporal pattern matrix, while pertains to the spatial pattern matrix and denotes the diagonal matrix of singular values.
The Pearson product–moment correlation coefficient is utilized to quantify the linear association intensity and direction between multiscalar hydrometeorological drought indices, which is essential for verifying the consistency and comparability of the proposed SPCI with SPI and SPEI. Its mathematical formulation adheres to the classic definition proposed by Rodgers and Nicewander [38]:
where r represents the Pearson product–moment correlation coefficient; and denote the regionally averaged monthly observations of two drought indices at the i-th time step across specific 1, 3, 6, and 12-month time scales; X and Y signify the long-term means of the two indices, calculated from the valid regional average sequences over the entire study period; n is the number of valid paired observations, corresponding to the count of synchronized monthly time points shared by the two indices after temporal alignment; the numerator is the sum of the cross-products of the centered values of X and Y, reflecting the synchronous fluctuation tendency of the two indices around their respective long-term means; and the denominator is the square root of the product of the sum of squared centered values of X and Y, functioning to normalize the numerator and eliminate the influence of differences in the magnitude of the two indices.
The Taylor diagram is a powerful graphical tool that provides a concise statistical summary of the pattern agreement between a test dataset and a reference dataset. It simultaneously presents three key metrics that quantify the similarity between two data series, namely the standard deviation, which captures variability; the correlation coefficient, which reflects pattern similarity; and the root-mean-square difference, which can be derived from the other two statistics. In this diagram the radial distance from the origin corresponds to the standard deviation of the test dataset often normalized by that of the reference dataset. The azimuthal angle represents the correlation coefficient linking the test and reference datasets. A point positioned closer to the reference point on the diagram denotes a higher degree of agreement. In this study, we used Taylor diagrams to visually compare the performance of SPCI and SPI against the benchmark SPEI at four temporal scales (1, 3, 6, and 12 months) within each climatic zone. This approach offers an integrated perspective on both pattern agreement and amplitude consistency among the indices.
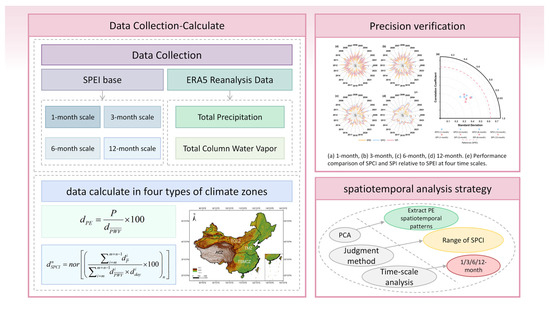
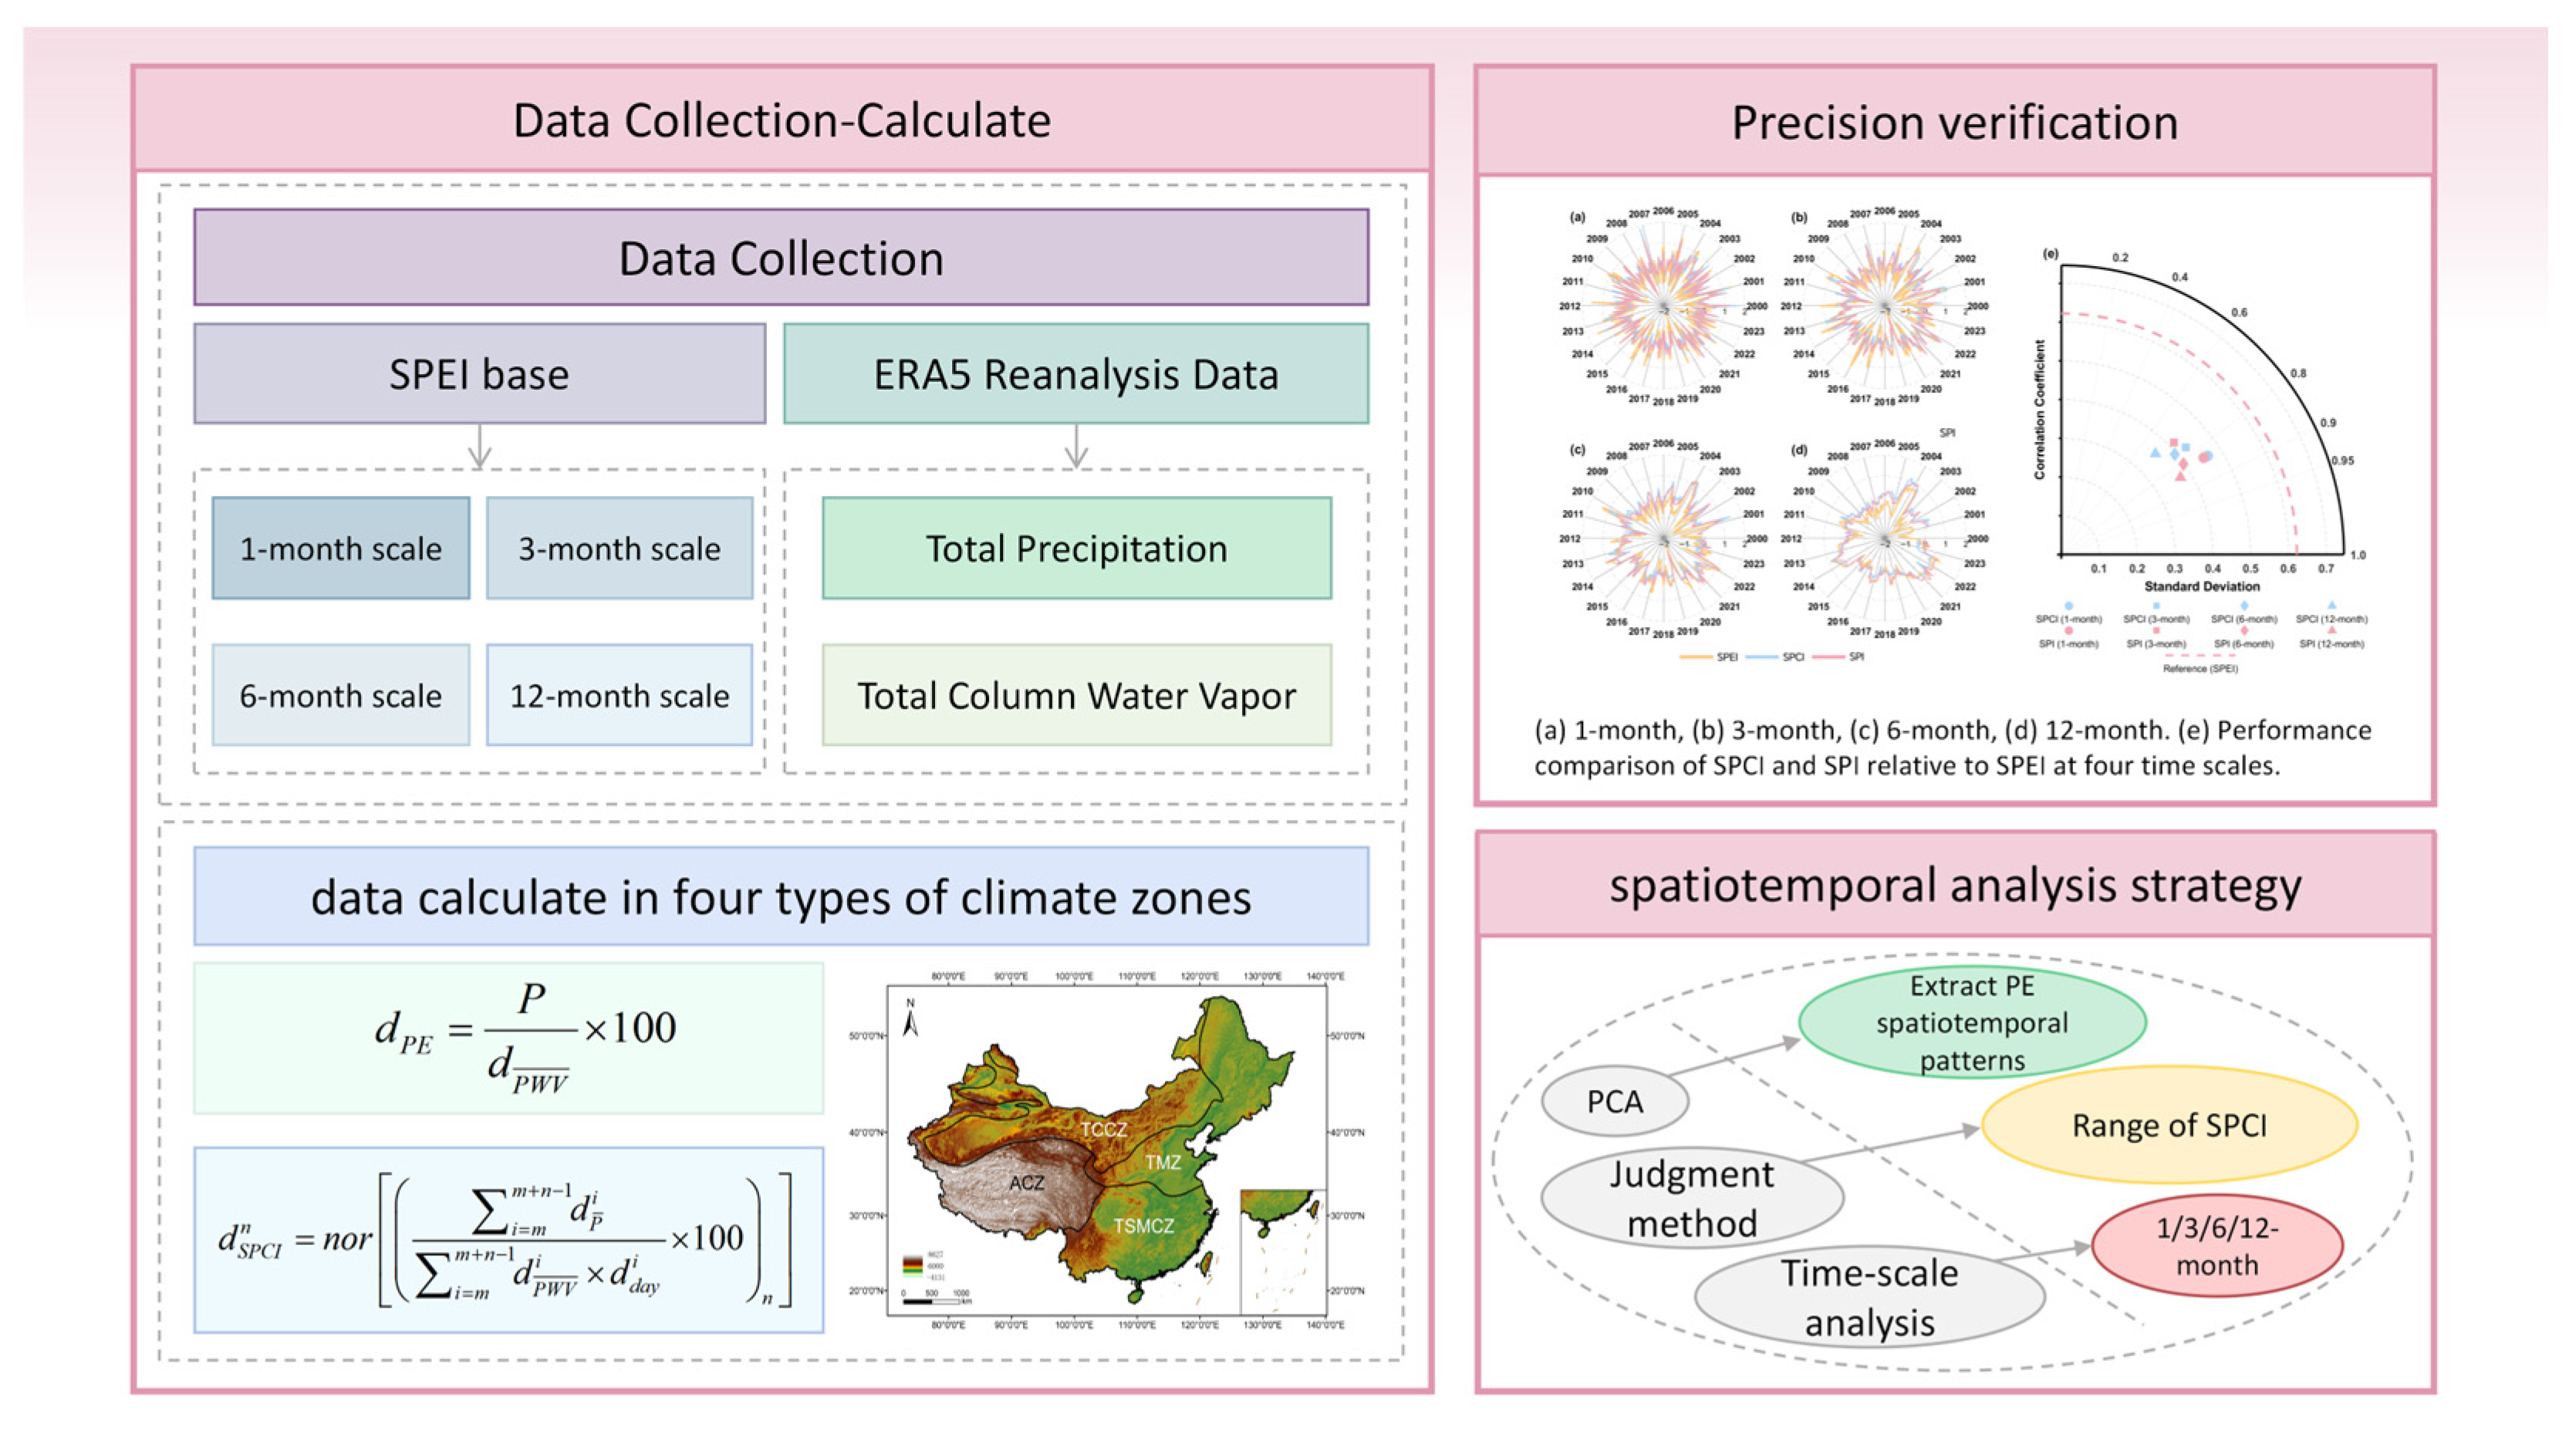
To facilitate understanding of the methodology outlined in Section 2.3, Figure 2 presents a flowchart summarizing the integrated research approach. This flowchart systematically integrates the processes of data collection, preprocessing, data calculation, spatiotemporal analysis, and precision validation. The flowchart modules correspond to the key steps and logical relationships described in the text, providing an overview of the research process from data acquisition to conclusion.
Figure 2.
Flowchart includes the processes of data collection, calculation, precision validation, and spatiotemporal analysis.
3. Results and Analysis
3.1. Spatiotemporal Variability of Precipitation Efficiency over China
The PE calculated across China over 25 years was analyzed using PCA, which reveals distinct gradients in the cumulative variance contributions of the first five PCs of PE in the four climatic zones, as shown in Table 2. Table 2 indicates that the first two principal components (PC1 and PC2) account for over 85% of the spatiotemporal variability of PE in all four climatic zones, with PC1 alone explaining 82.05–83.80% of the total variance. This highlights the dominant role of a few key climatic drivers in shaping PE’s spatiotemporal patterns, justifying the retention of only PC1 and PC2 for subsequent interpretation, an approach that balances explanatory power and dimensionality reduction. In contrast, the variance contributions of PC3 and beyond decline sharply for each increment < 5%, confirming their minimal impact on overall PE variability.
Table 2.
Variance contribution of PCs.
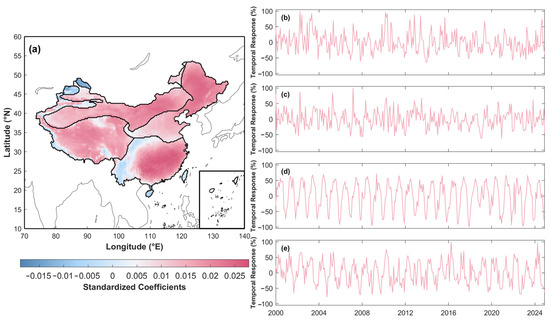
The spatiotemporal response pattern of PC1 in PE is illustrated in Figure 3. Distinct seasonal patterns of the temporal response of PC1 in PE were exhibited across different climatic zones. A compound unimodal–bimodal distribution was presented in TSMCZ, which indicates pronounced intra-annual precipitation heterogeneity. A unimodal distribution was observed in ACZ, the peak of which occurs during the primary rainy season that lasts from June to September. The secondary rainy season, which runs from March to May, was found to exert a relatively weaker influence on PE, while negative-phase responses were displayed in ACZ during the dry winter months.
Figure 3.
Spatiotemporal response pattern of PC1 for PE, (a) PC1 spatial response, (b) TMZ temporal response, (c) TCCZ temporal response, (d) ACZ temporal response, (e)TSMCZ temporal response.
Regarding the spatial loadings of PC1 in PE, standardized coefficients were predominantly concentrated between 0.01 and 0.02 in most regions, which suggests moderate PE variability. Significantly elevated coefficients, which exceed 0.05, were detected in three monsoon-dominated zones, namely Northeast China, the Middle-Lower Yangtze Basin, and the South China Coastal Region. This spatial pattern strongly aligns with the core regions influenced by the East Asian Summer Monsoon (EASM), where intense moisture transport and convective activity lead to high precipitation conversion rates [39]. Intensified PE fluctuations were demonstrated by these peak coefficients, and consequently, the risks of hydrometeorological hazards, such as droughts and floods, were heightened in these vulnerable areas.
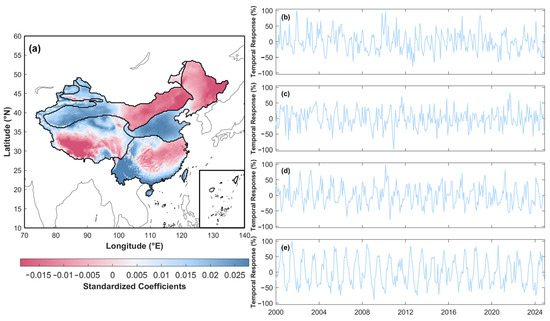
Furthermore, the spatiotemporal response pattern of PC2 in PE is depicted in Figure 4, which shows a consistent pattern of a positive phase from June to September and a negative phase from October to May in the temporal response of PC2 in PE across all climatic zones. Spatially, PC2 manifests a pronounced east–west dipole pattern, highlighting fundamental heterogeneity in PE between eastern and western sectors. This dipole structure likely reflects the contrasting influences of the monsoonal regimes in the east and the westerlies coupled with orographic lifting effects, particularly by the Tibetan Plateau, which modulates moisture transport and convergence patterns [6]. The influence of PC3 on overall spatiotemporal patterns is demonstrated to be negligible.
Figure 4.
Spatiotemporal response pattern of PC2 for PE, (a) PC2 spatial response, (b) TMZ temporal response, (c) TCCZ temporal response, (d) ACZ temporal response, (e) TSMCZ temporal response.
3.2. Exploring Drought–Wet Extremes Through Precipitation Anomalies
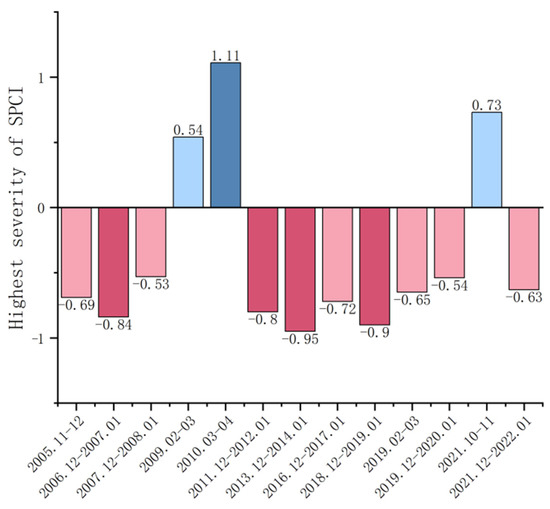
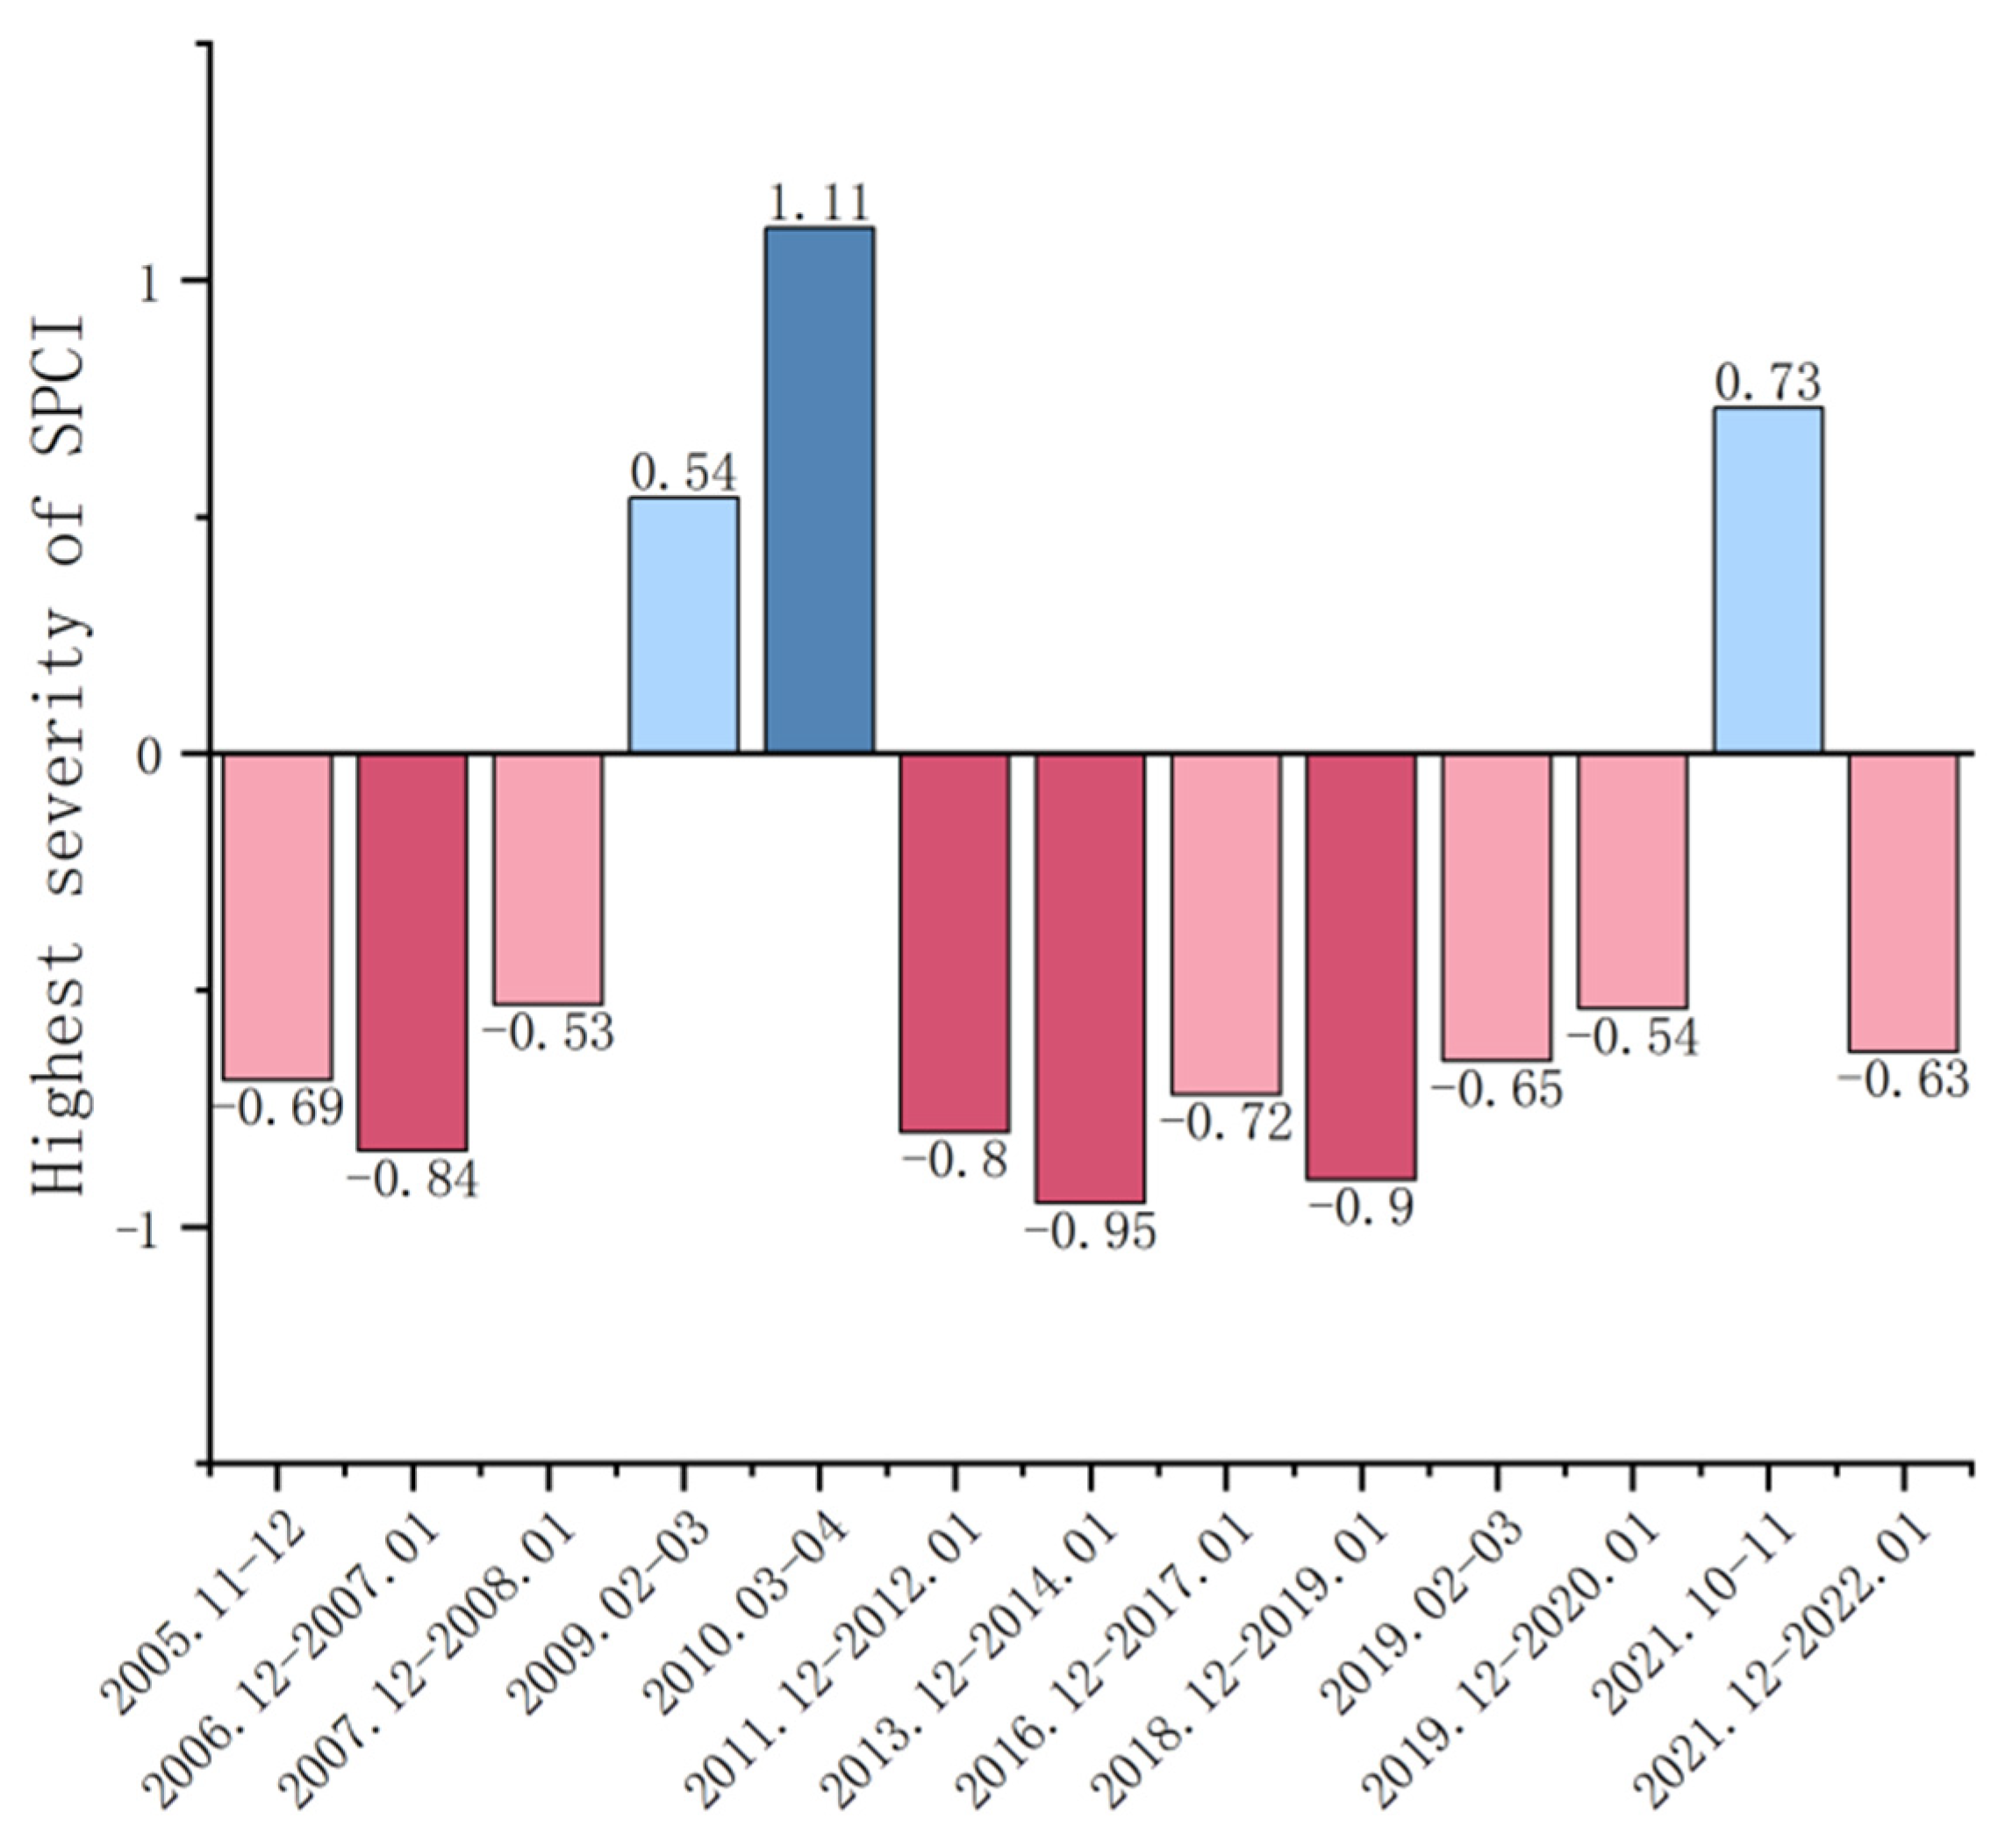
As a region prone to hydro-meteorological hazards, China exhibits recurrent drought–flood transitions, where analyses of PE reveal distinct seasonal extremes that peak during the June–September monsoon season and plummet in the October–March dry period, with these maxima and minima strongly correlating with extreme wet and dry events, respectively. The SPCI quantifies anomalous moisture conversion processes, elucidating how precipitation transformation efficiency drives climatic anomalies. The SPI assesses meteorological drought solely via precipitation deficits, while SPCI incorporates dynamic mechanisms governing atmospheric moisture release, enabling comprehensive evaluation of PE deficits across temporal scales. Following the approach of Zhu et al. in their study of drought propagation which yielded robust results, an extreme climatic event in a given climate zone is defined by an anomalous SPCI value outside the Near Normal category in Table 1 persisting for three months or more. An event lasting more than 3 months in the TSMCZ, as detailed in Table 3, was considered to have been an extreme climate event. For the TMZ the longest continuous period of SPCI anomalies was found to be two months. Therefore, to comprehensively capture the drought–wetness characteristics in this zone, we documented all instances where SPCI anomalies lasted for two months along with their peak SPCI values as illustrated in Figure 5.
Table 3.
Extremely wet/drought events in the Tropical-Subtropical Monsoon Composite Zone.
Figure 5.
Extremely wet/drought events in the temperate monsoon zone. Deep pink, light pink, light blue, and dark blue correspond to categories D1, D0, W0, and W1.
In the TCCZ, a singular W1-class extreme pluvial event was documented over the 15-year period, characterized by an SPCI peak value of 1.29. This event persisted from March to May 2003, with a duration of three consecutive months. Conversely, four extreme wet/dry events were registered in the ACZ. Each event exhibited a uniform duration of 3 months, occurring from November 2022 to January in 2003, from April to June in 2003, from October to December in 2003, and from November 2023 to January 2024. Corresponding SPCI maxima were quantified as −0.62, 0.76, −0.50, and −0.96, classified as D0, W0, D0, and W1, respectively.
3.3. Investigating Dry–Wet Event Frequency Across Multiple Temporal Scales
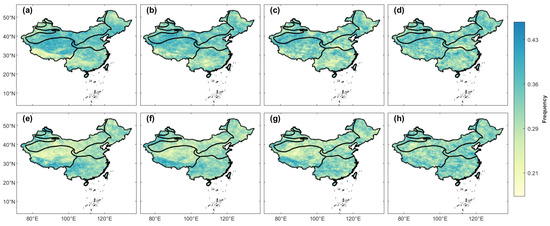
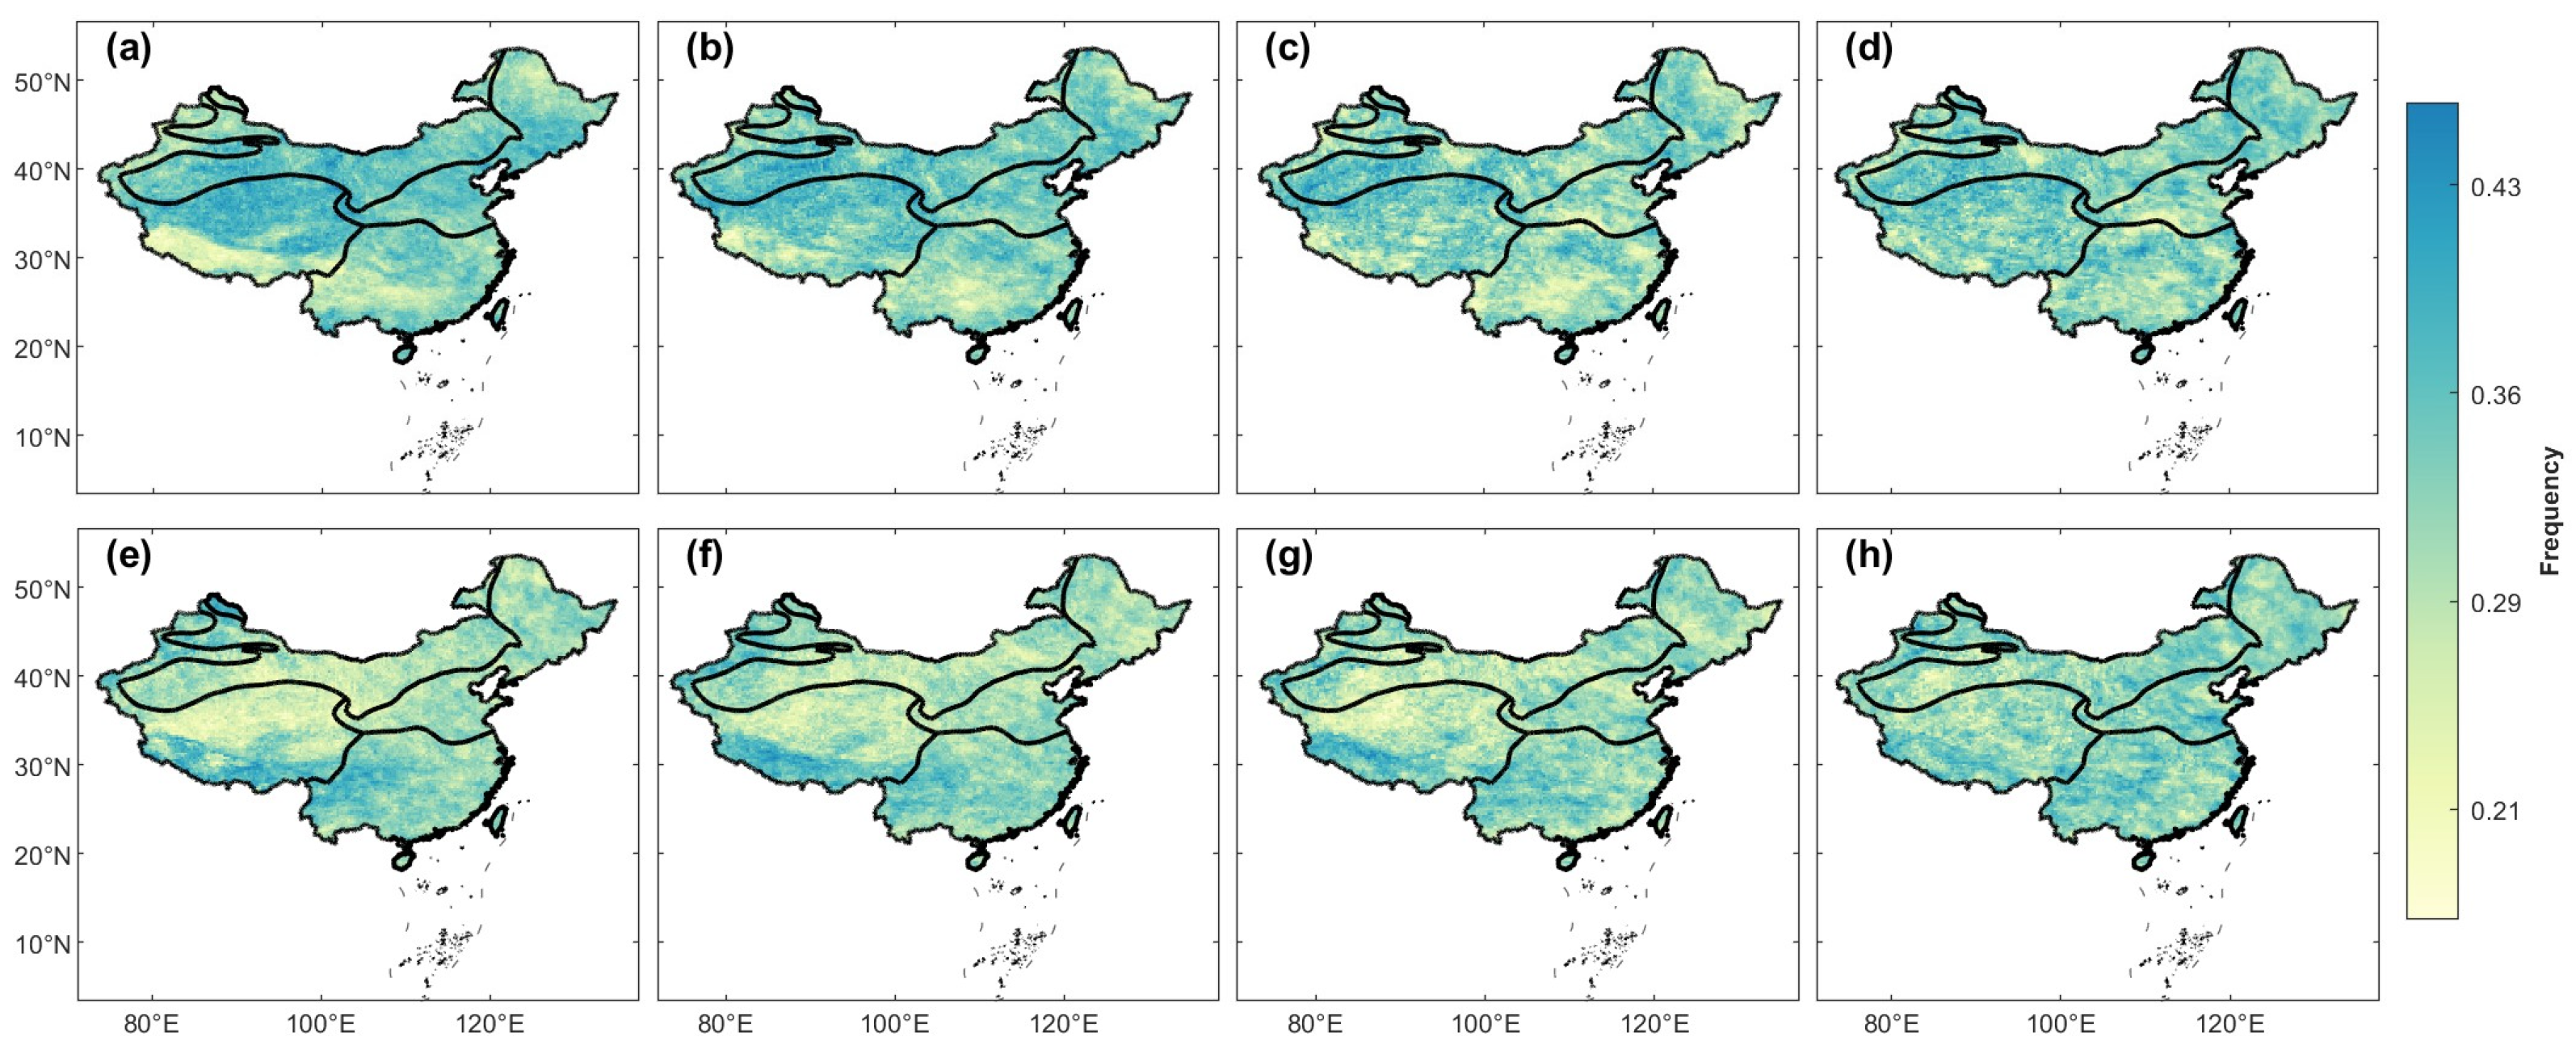
As a core metric for probabilistic assessment of extreme dry–wet events, dry–wet occurrence frequency directly quantifies regional climate risk intensity, with areas exhibiting high frequencies facing significantly elevated probabilities of future hydroclimatic disasters. This study adopts standardized definitions in which dry months, defined as those with SPCI values below −0.5, and wet months, defined as those with SPCI values above 0.5, are quantified based on their percentage occurrence relative to the total number of observed months. Then, a multi-scale standardized climate index (SCI) dry–wet frequency assessment was developed, which was operated at 1-month (sub-seasonal), 3-month (seasonal), 6-month (semi-annual), and 12-month (annual) temporal resolutions. The sensitivity differences in event-duration hydrological responses across distinct timescales is illustrated in Figure 6.
Figure 6.
Spatial distribution of dry–wet frequency across multiple temporal scales: (a) 1-month wet, (b) 3-month wet, (c) 6-month wet, (d) 12-month wet, (e) 1-month dry, (f) 3-month dry, (g) 6-month dry, (h) 12-month dry.
This study uncovers the spatial heterogeneity and evolutionary characteristics of dry–wet frequency across multiple temporal scales. Specifically, the SPCI1-derived dry–wet frequency manifests a distinct east–west dipole pattern, with high-frequency hotspots concentrated in the Northwest Inland Basin Cluster, Southwest Karst Terrain, and Southern Qinghai-Tibet Plateau, indicating heightened sensitivity to short-term meteorological perturbations. At the SPCI3, high wet-frequency zones dominate desert-oasis ecotones in Northwest China, while dry-event prevalence characterizes the Southern Qinghai-Tibet and Eastern Yunnan-Guizhou Plateau. Furthermore, SPCI6 exhibit spatial patterns inheriting seasonal signatures, particularly over the Northeast China Plain and aforementioned hotspots, evidencing cumulative meteorological anomalies persisting 3–6 months. SPCI12 reveals a fragmented distribution pattern of dry–wet frequency extremes, reflecting divergent regional responses to sustained climatic anomalies governed by moisture source disparities and local feedback mechanisms.
3.4. Comparative Analysis of Multi-Scale Climate Indices over China
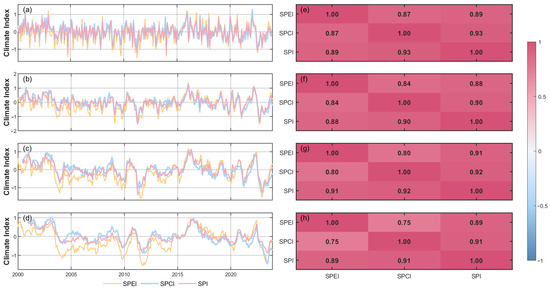
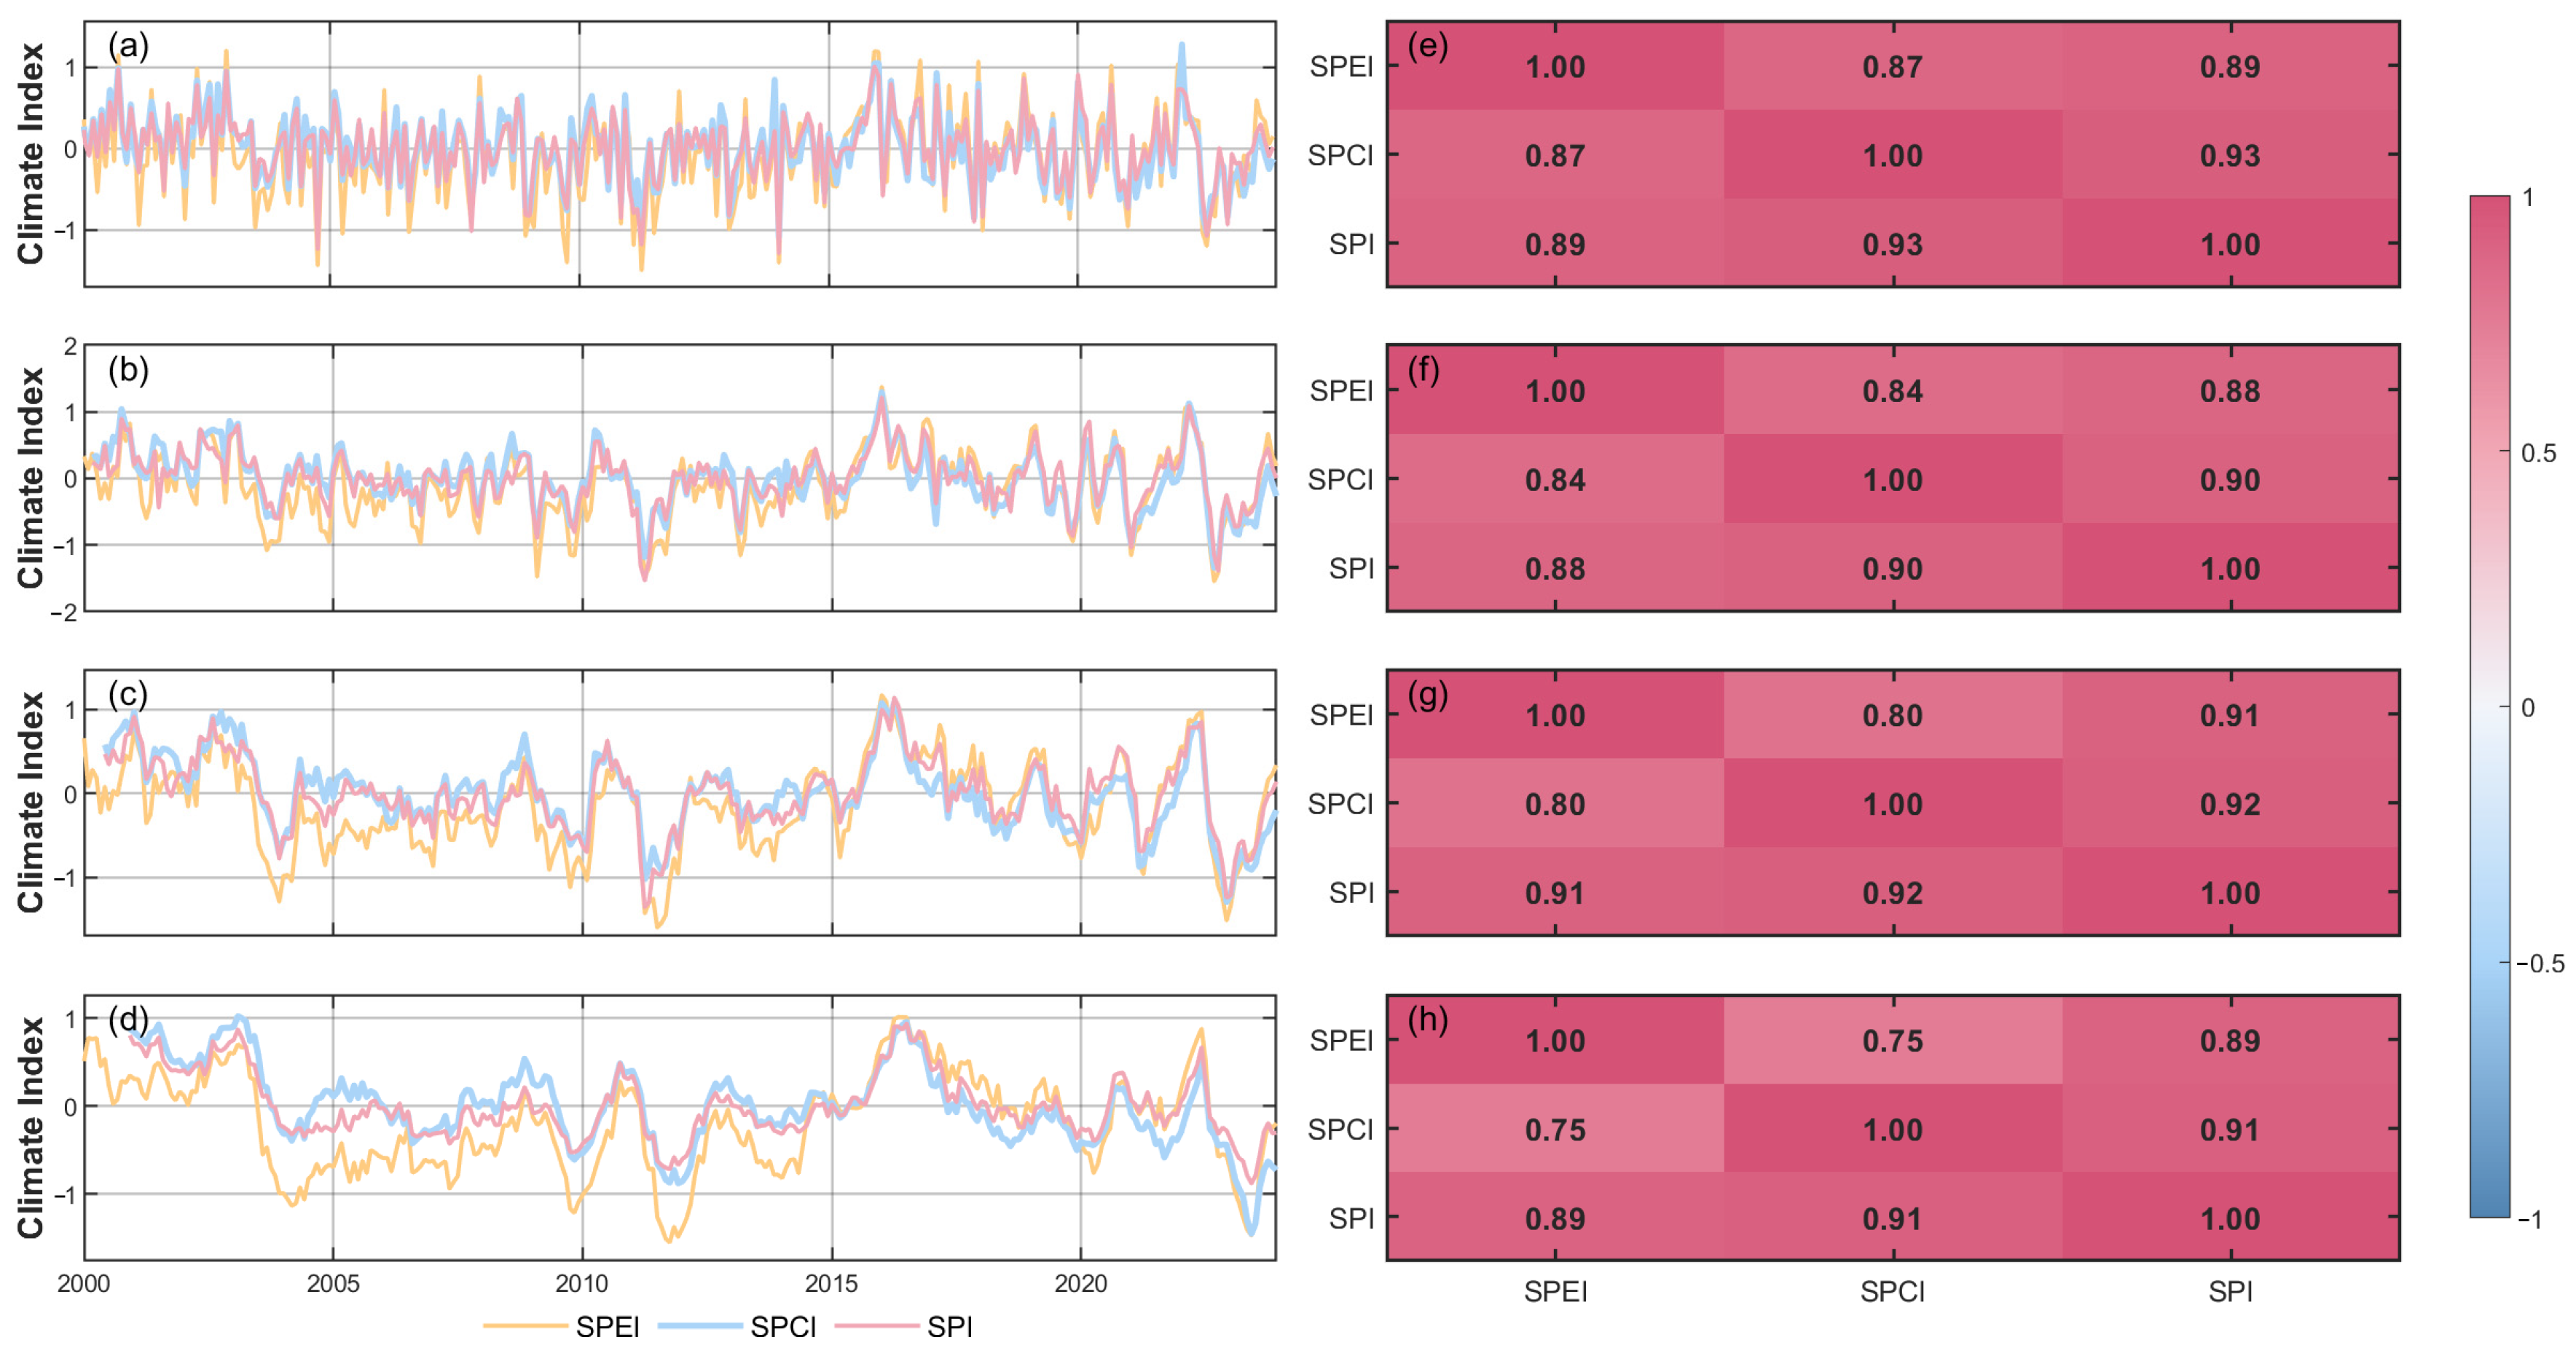
Accurate identification of extreme dry–wet events and their spatiotemporal characteristics constitutes a critical prerequisite for assessing climate index efficacy. This study validates drought index reliability through systematic comparative analysis of multi-temporal-scale SPCI metrics, including those at 1-, 3-, 6-, and 12-month intervals, against corresponding SPI and SPEI indices. To mitigate spatial interpolation artifacts stemming from SPEIbase dataset limitations, the SPCI and SPI sequences were recomputed using homogeneous ERA5 reanalysis monthly data. It demonstrates robust positive correlations between SPCI and benchmark indices in the four climatic zones at all temporal scales. All regions exhibit periodic dry–wet oscillations in standardized sequences, characterized by largest amplitude extremes at the 1-month scale and significantly smoother fluctuations at the 12-month scale, indicating the smoothing effect of long-term scaling on extreme event signals.
In the TSMCZ, it can be seen that the SPCI has the strongest phase synchronization with SPEI at the 1-month scale, but exhibits maximum phase divergence at the 12-month scale, reflecting differential representations of evaporative processes in long-term moisture balance in Figure 7. This study reveals that the correlation of SPI-SPCI remained above 0.9 at all time scales. Consequently, given that the correlation between SPEI and SPCI has been below 0.8 at the 12-month scale, SPCI is recommended as the primary index for drought monitoring at short-to-medium scales in this region, while interannual analyses necessitate multi-mechanism validation incorporating SPEI.
Figure 7.
Correlation analysis of climate indices in the TSMCZ: (a) 1-month, (b) 3-month, (c) 6-month, (d) 12-month. (e–h) are the correlation coefficient matrices of three climate indices across multiple temporal scales.
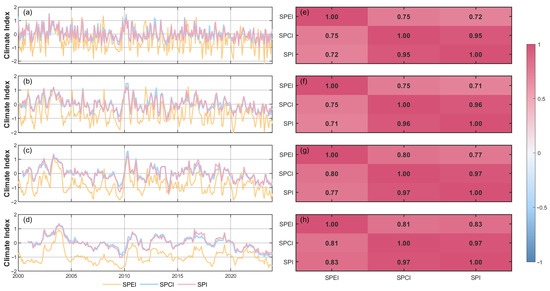
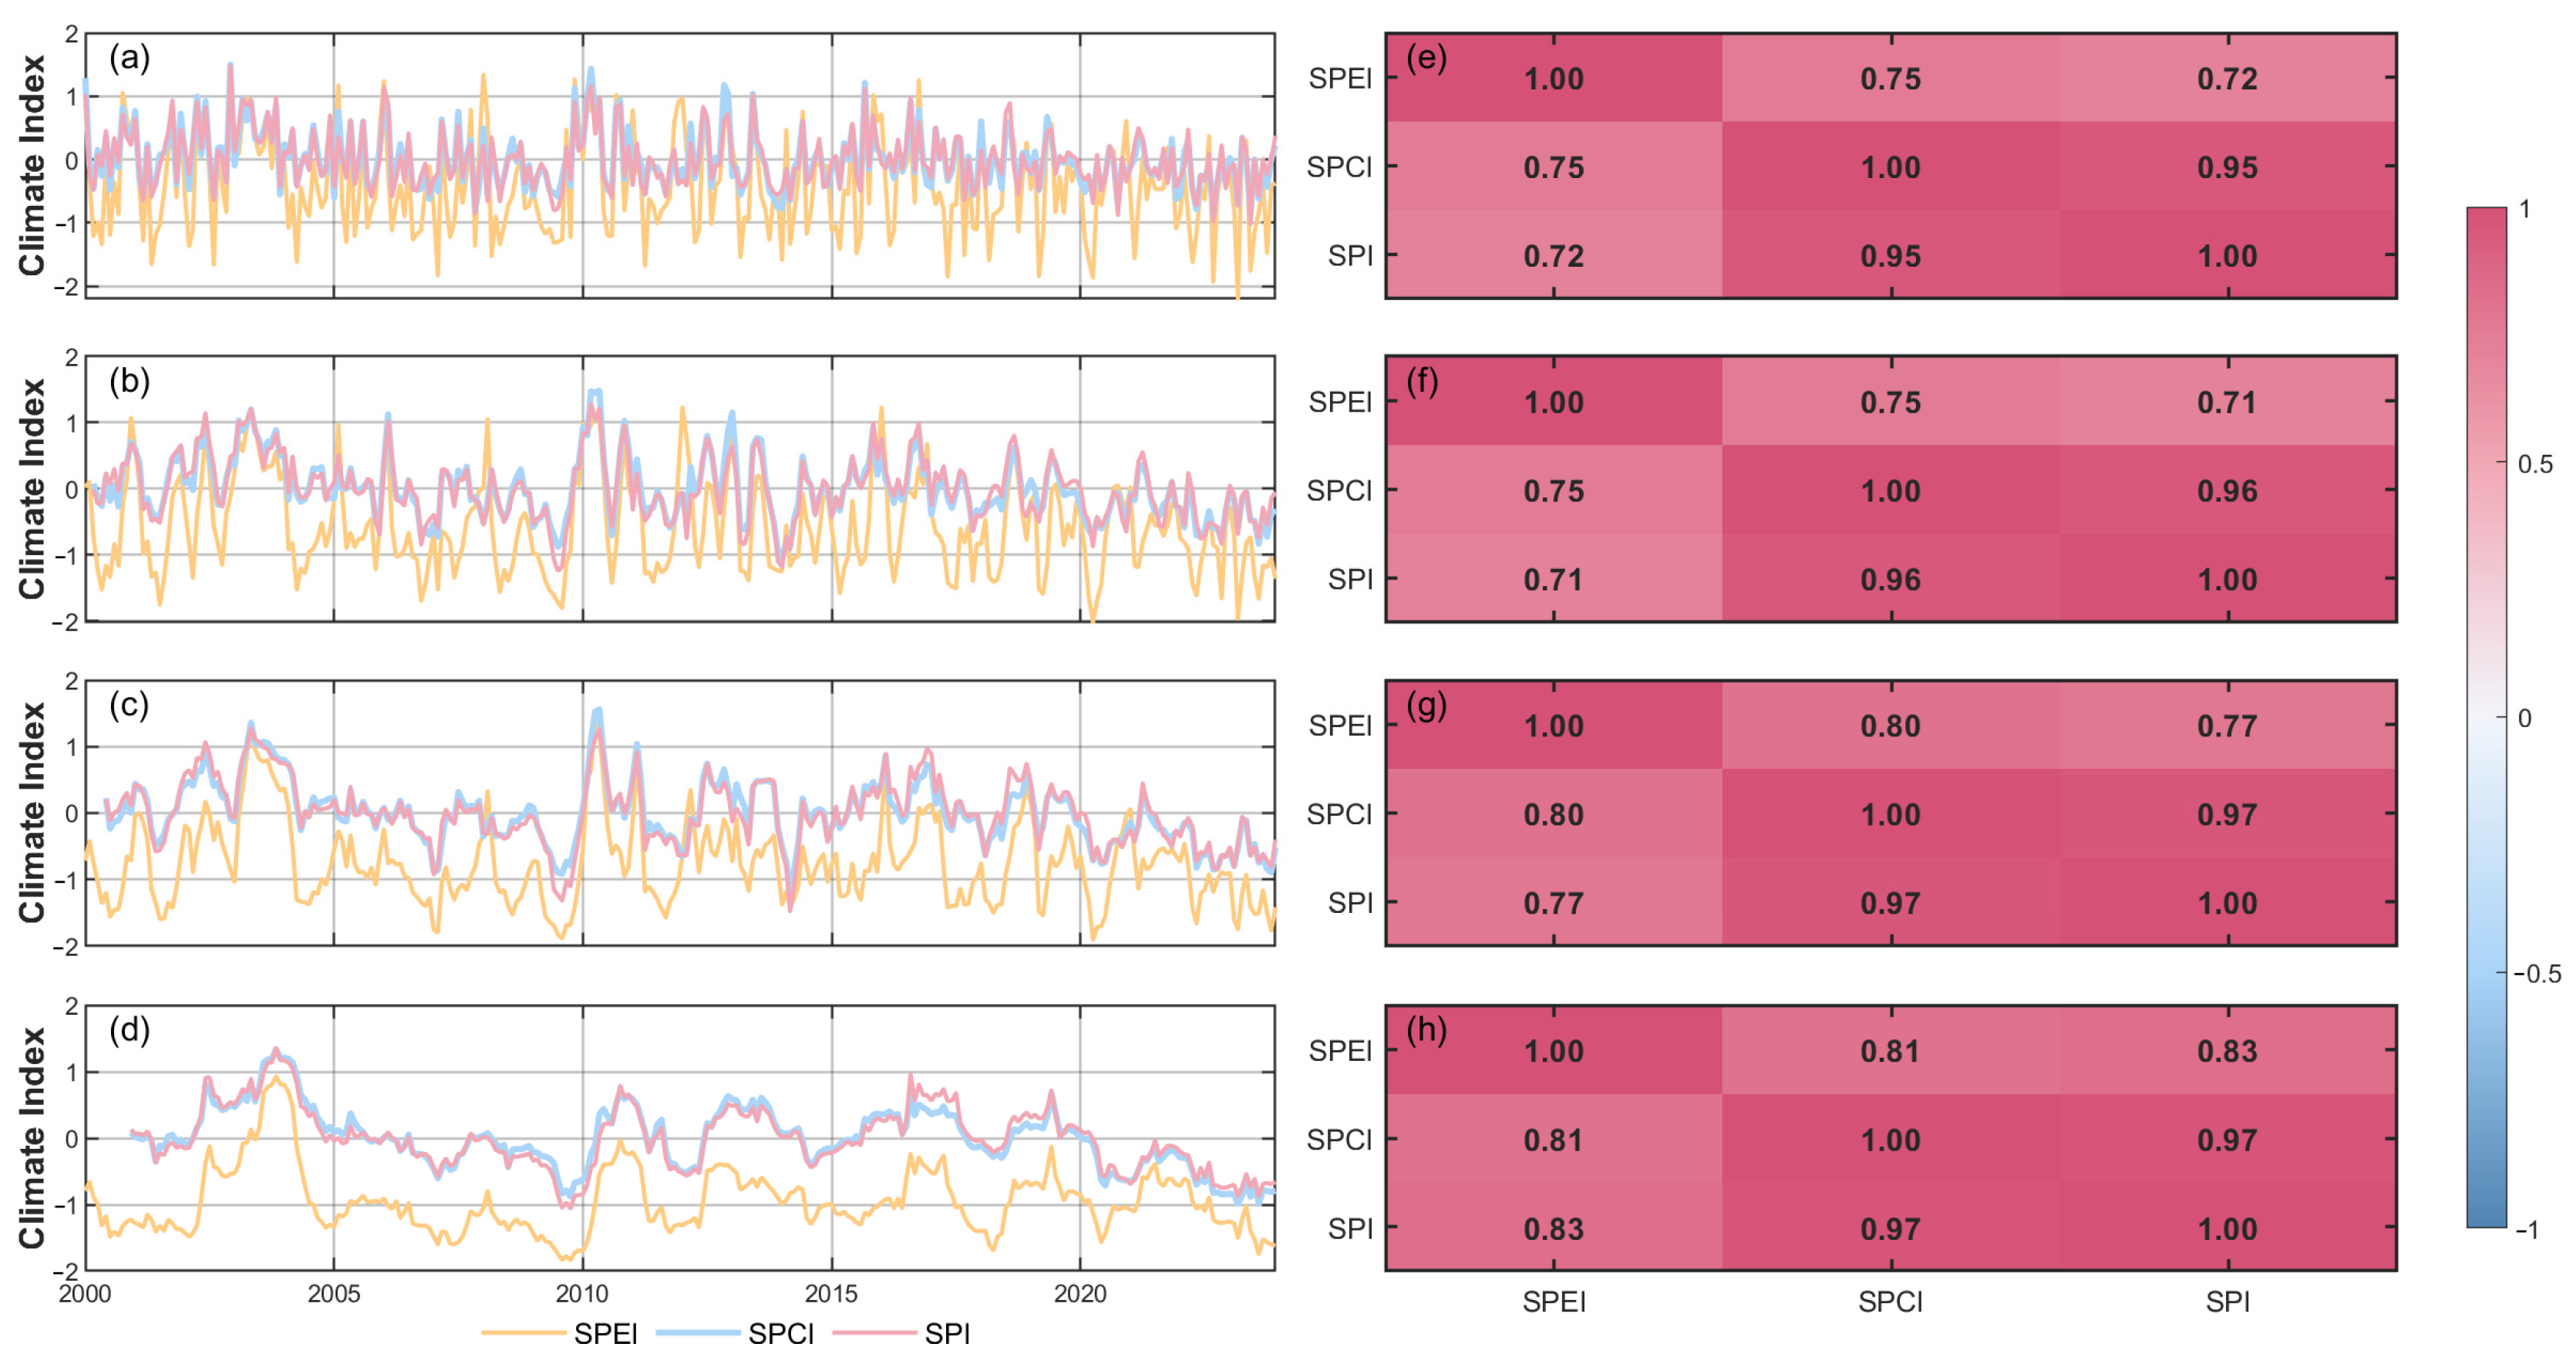
In the TMZ, it is clear that the accentuated oscillations in SPEI appeared at monthly scales, exceeding SPCI and SPI variability, which reveals heightened sensitivity of short-term droughts to precipitation anomalies in Figure 8. At the 12-month scale, persistent deviations between SPEI and the other two indices reflect the impact of evaporation regulation on persistent drought. Optimal SPCI-SPEI synchronization occurs at the 12-month scale, but is only 0.81, while SPCI-SPI correlations stabilize at 0.96–0.97, indicating regime shifts in moisture balance mechanisms during seasonal transitions that establish an optimal monitoring window for agricultural droughts. Meanwhile, the correlation between SPCI and SPEI remained significantly higher than that of TSMCZ at 0.75 on a 12-month scale, implying stronger compensatory effects of potential evaporation on temperate annual-scale droughts.
Figure 8.
Correlation analysis of climate indices in the TMZ: (a) 1-month, (b) 3-month, (c) 6-month, (d) 12-month. (e–h) are the correlation coefficient matrices of three climate indices across multiple temporal scales.
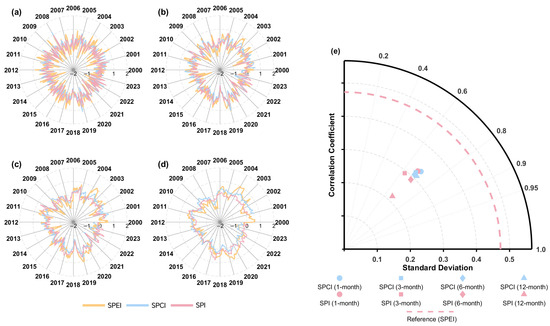
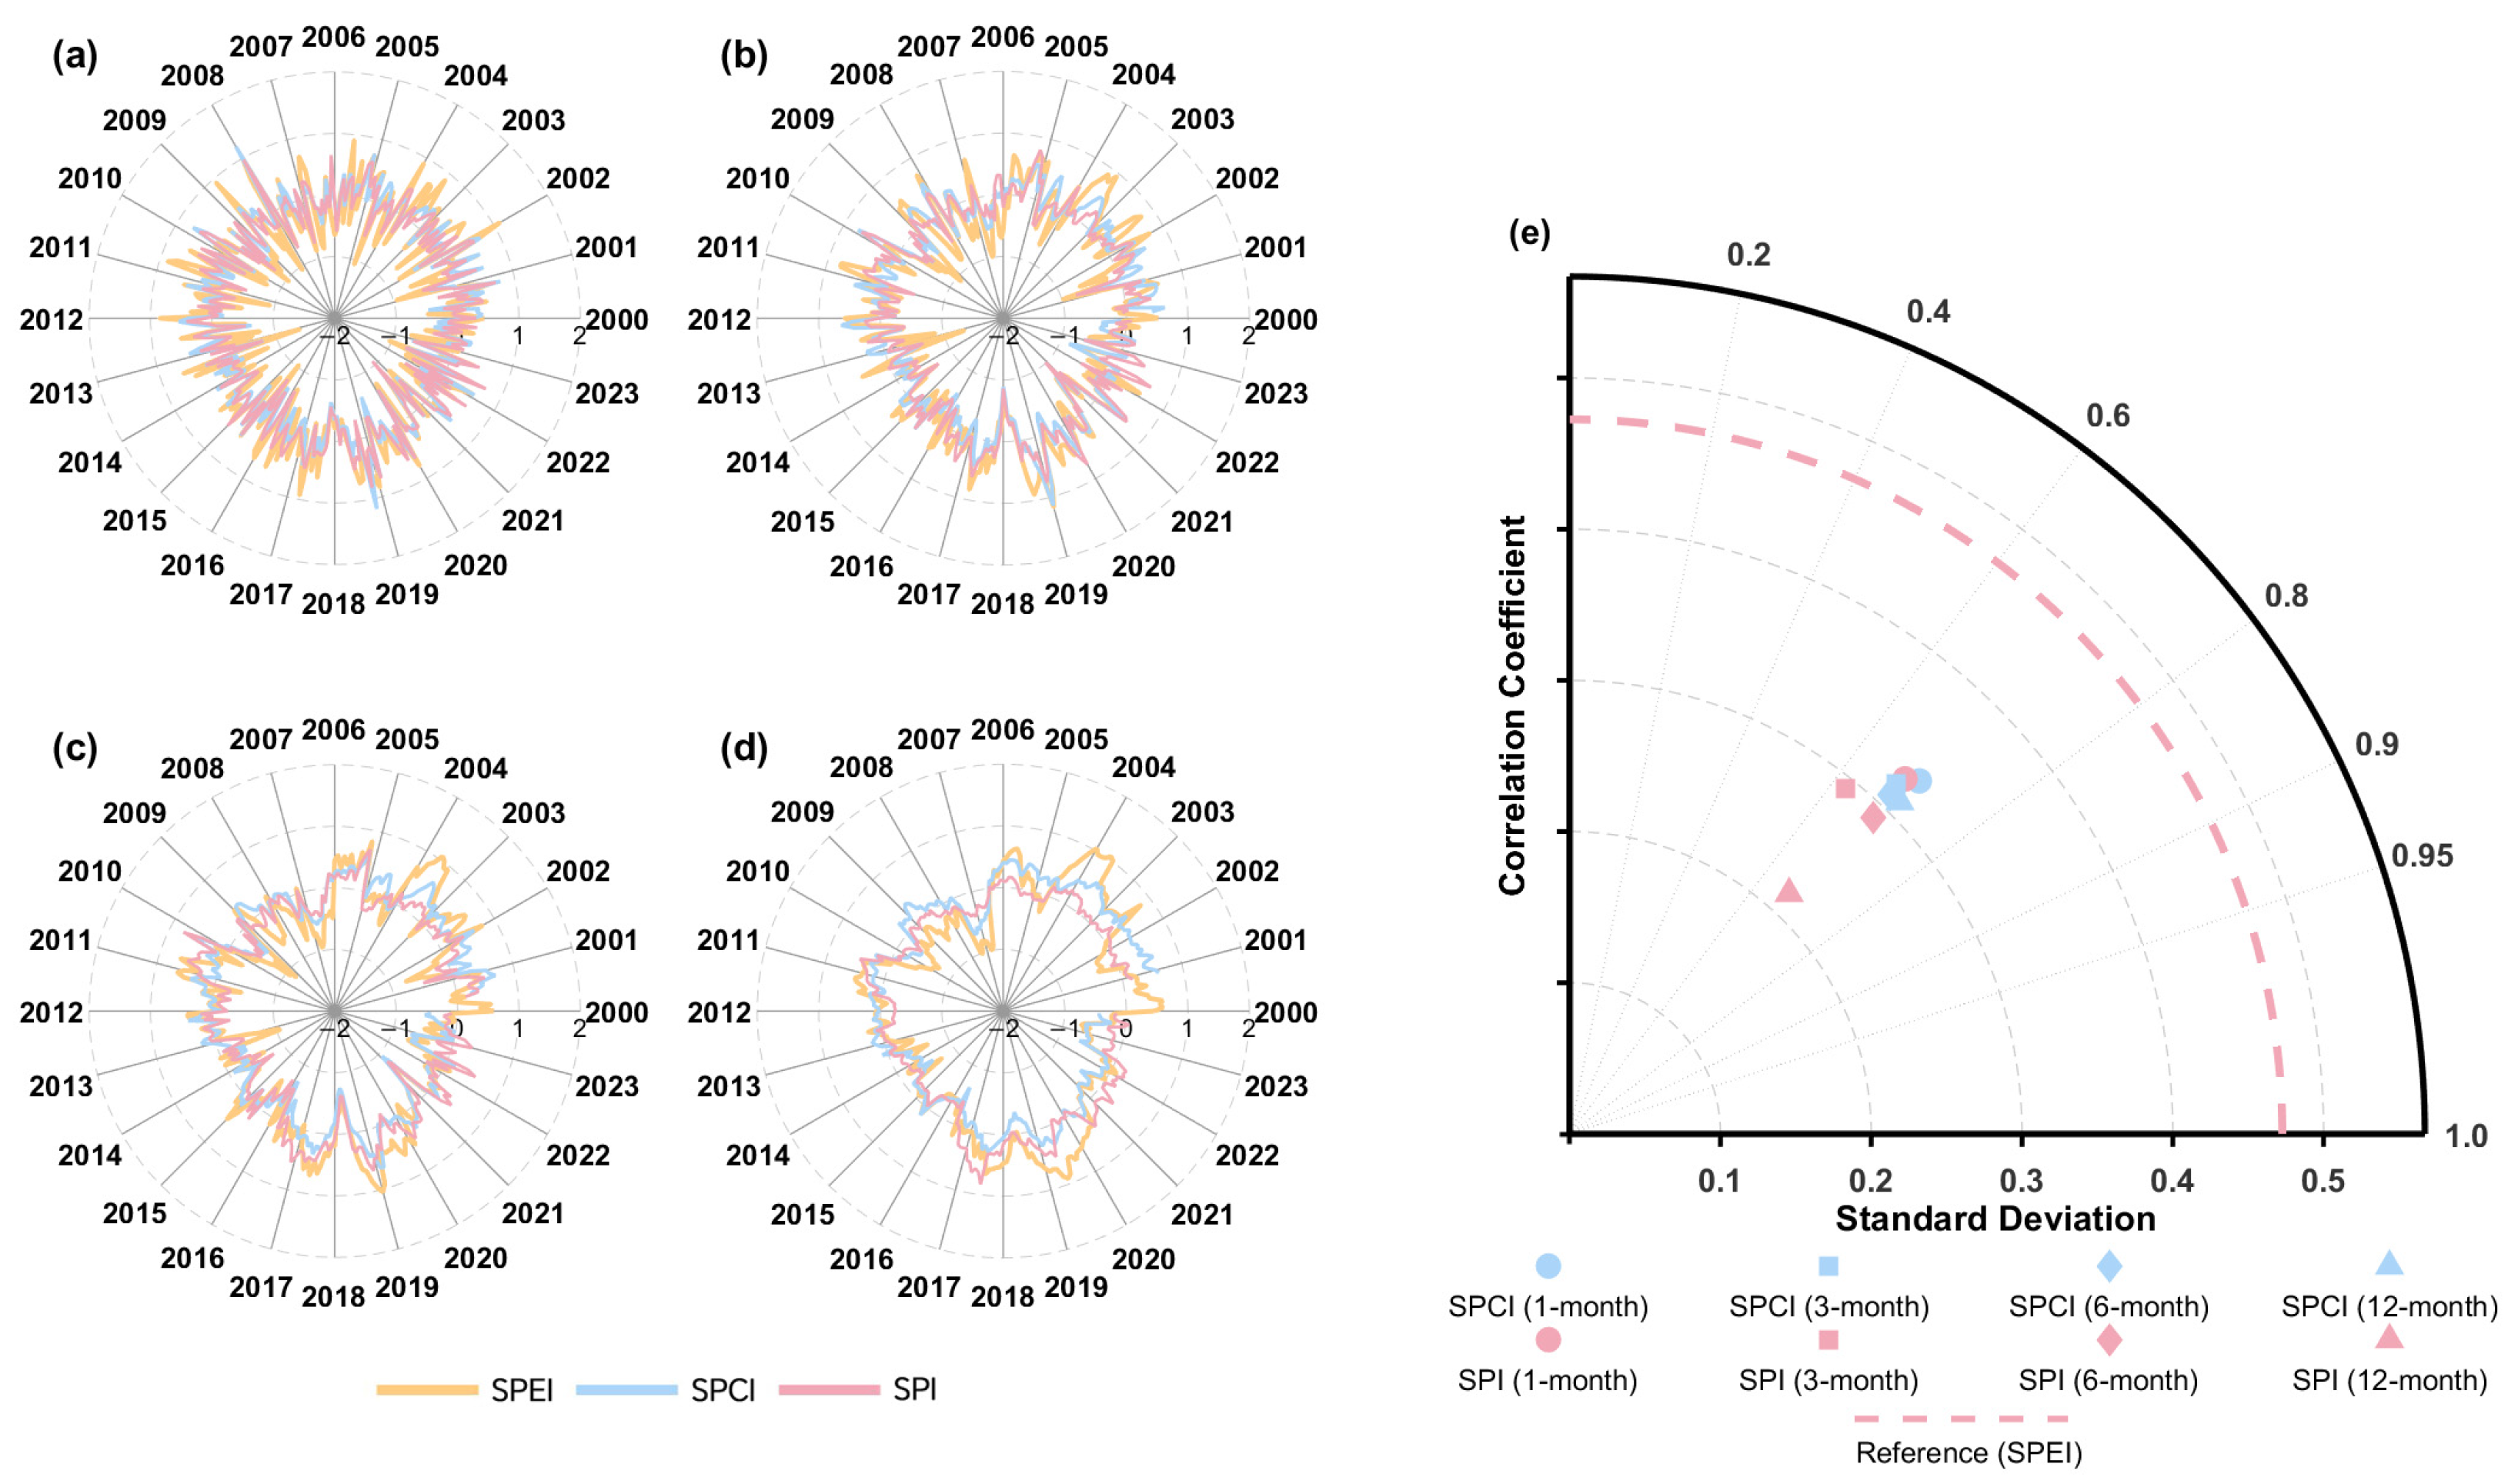
In the TCCZ, the Taylar plots, which correspond to Figure 9e, illustrate that the synchrony between SPCI and SPI decreases as the time scale increases, as is evidenced by the overlapping fluctuation patterns of their time series. Complementing this, the Taylor diagram analysis, which refers to Figure 9e and takes SPEI as the reference, reveals an overall decreasing trend in the correlation between SPI, SPCI, and SPEI as the temporal scale increases from 1-month to 12-month, albeit not strictly progressively.
Figure 9.
Correlation analysis of climate indices in the TCCZ: (a) 1-month, (b) 3-month, (c) 6-month, (d) 12-month. (e) Performance comparison of SPCI and SPI relative to SPEI at four time scales.
These findings indicate that in inland regions remote from oceanic influence, greater consideration should be given to the role of potential evaporation. When assessing drought impacts over medium-to-long-term timescales, particularly in agricultural applications, the influence of potential evaporation ought to be given further consideration.
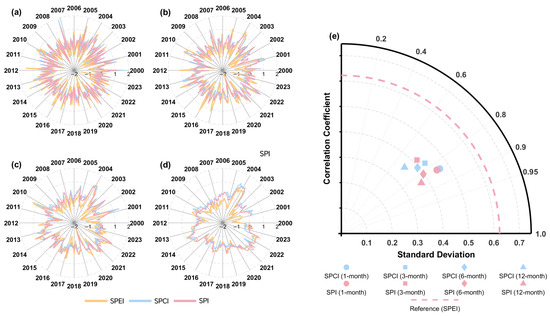
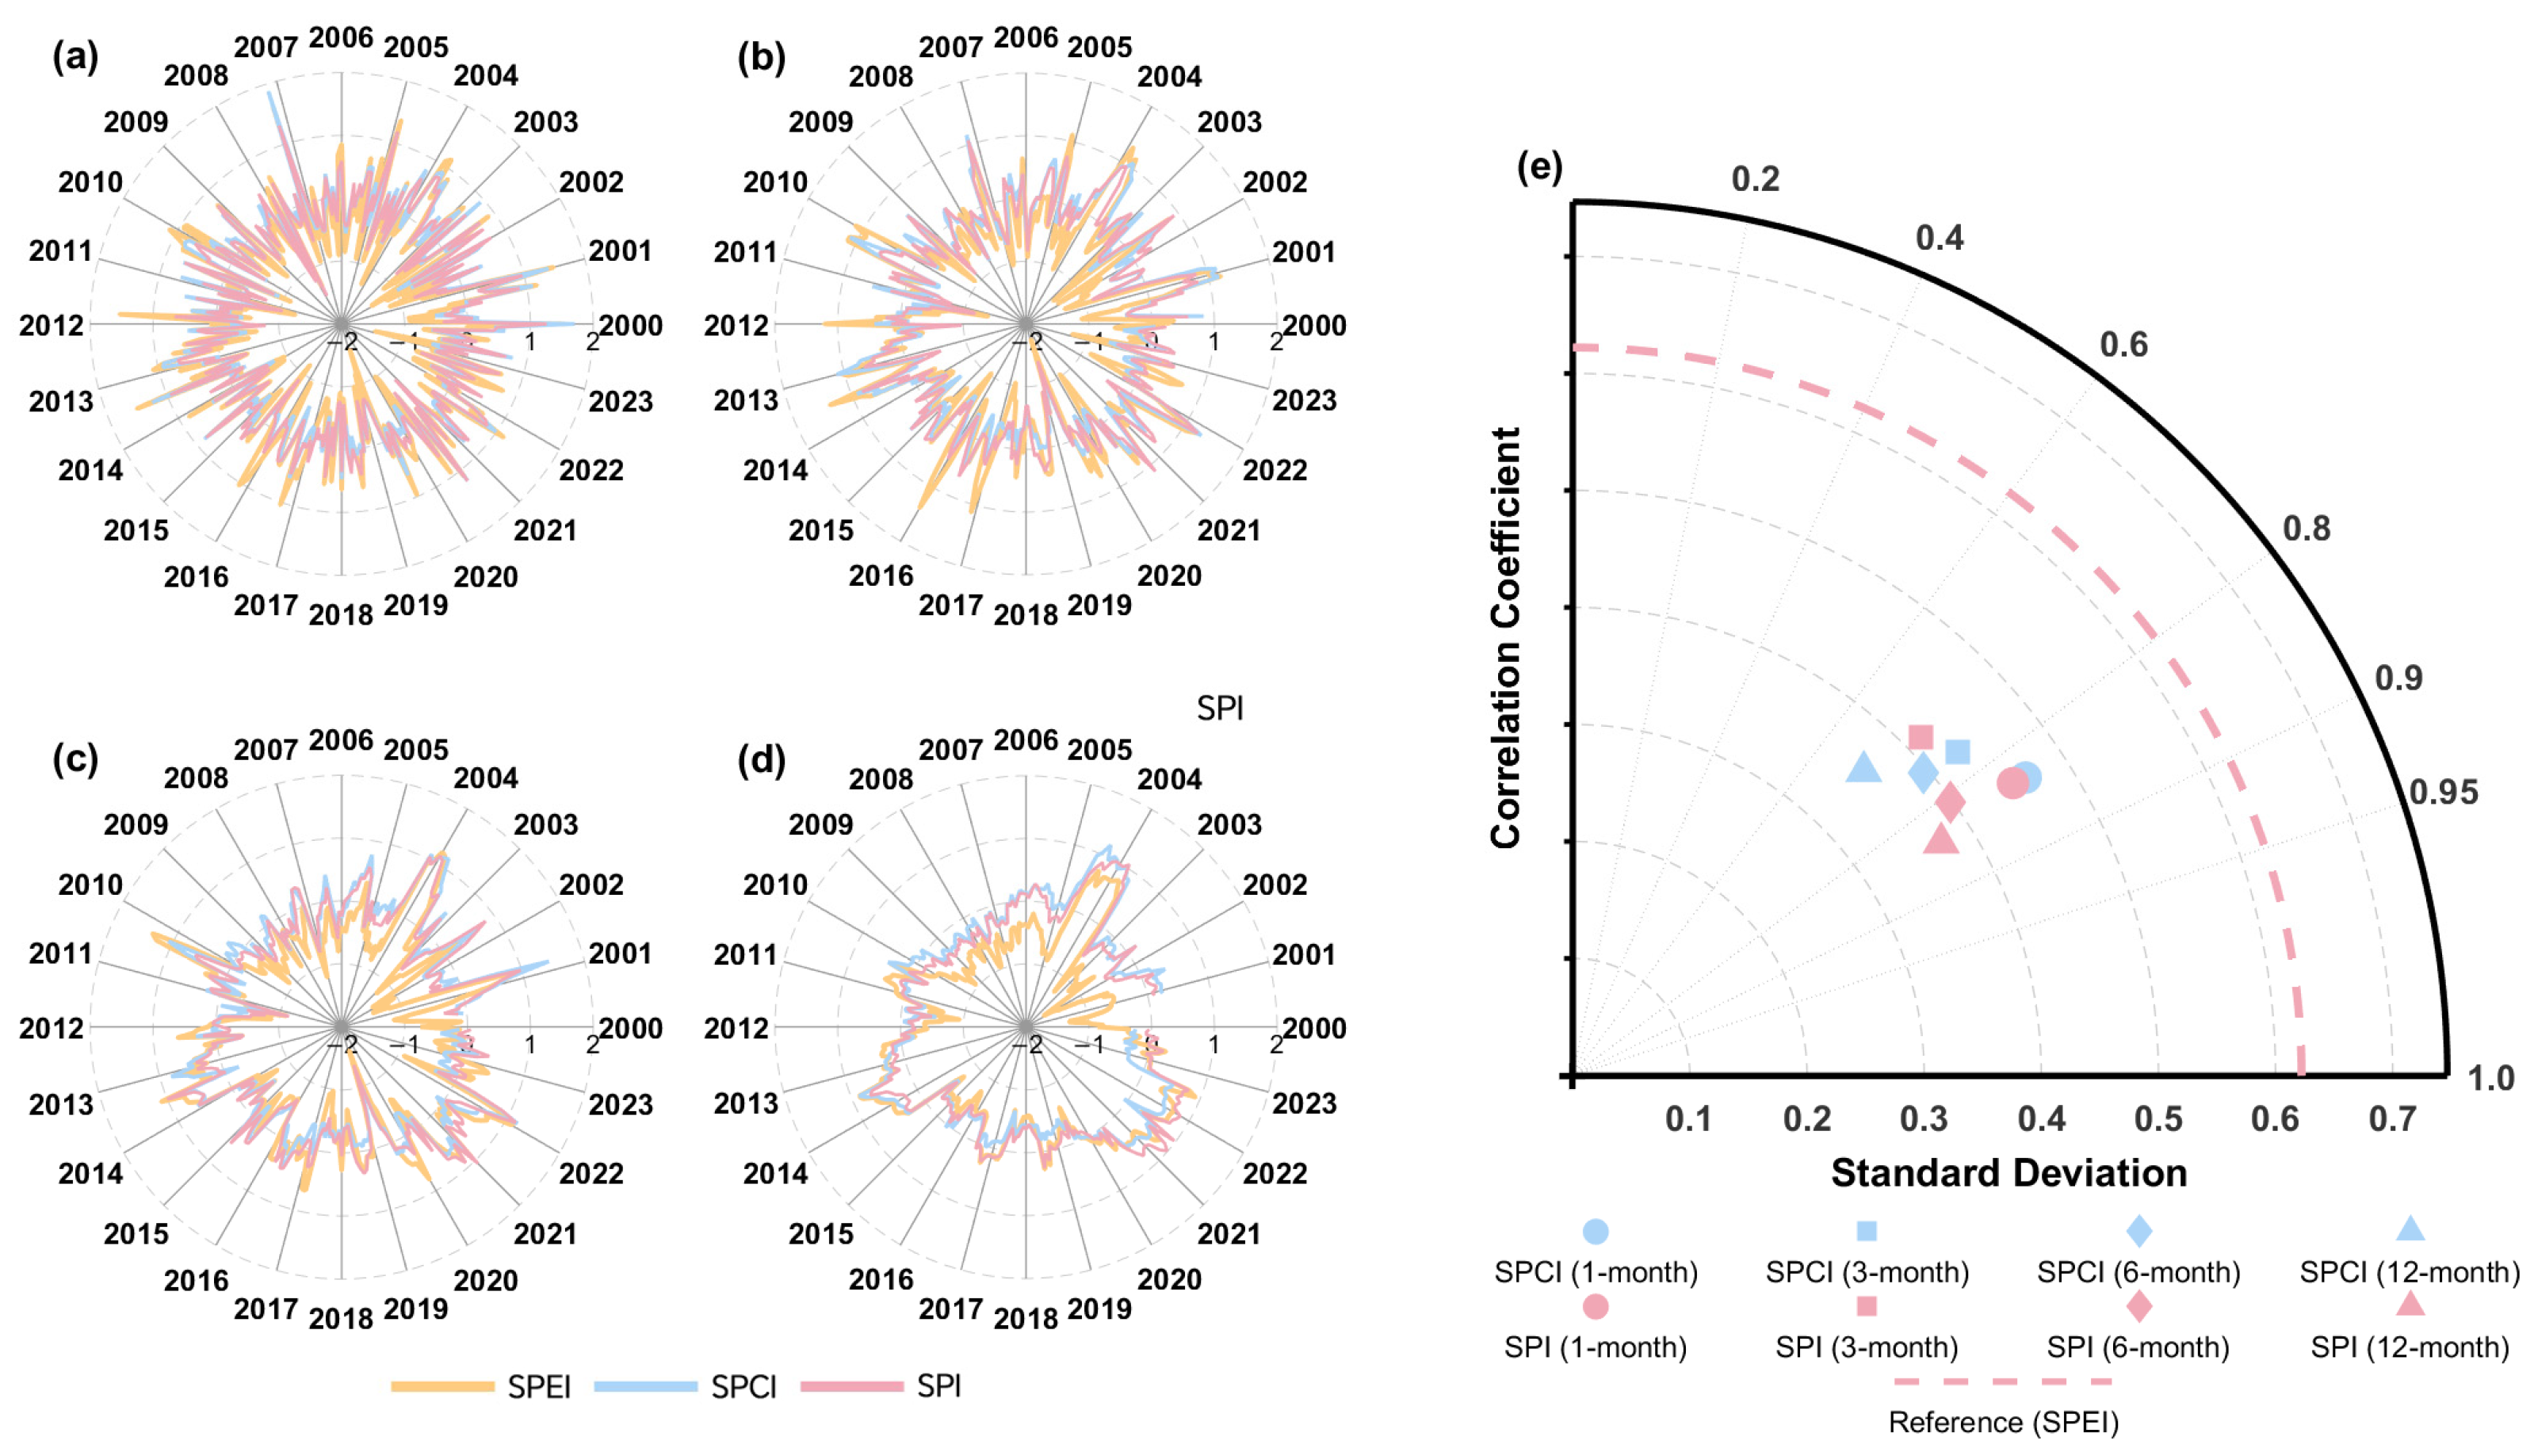
In the ACZ, the polar plots, which correspond to Figure 10a–d, illustrate that the correlation between SPCI and SPI exhibits marked attenuation as the temporal scale increases, a pattern that is evidenced by the divergent fluctuation trajectories of their time series across different scales. Complementing this, the Taylor diagram analysis, which refers to Figure 10e and takes SPEI as the reference, quantifies that while the SPCI-SPI correlation diminishes with extended temporal scales, a stable correlation is maintained between SPCI and SPEI.
Figure 10.
Correlation analysis of climate indices in the ACZ. (a) 1-month, (b) 3-month, (c) 6-month, (d) 12-month. (e) Performance comparison of SPCI and SPI relative to SPEI at four time scales.
This divergence at short-term scales originates from the asynchrony between atmospheric water vapor dynamics and precipitation processes, a well-documented hydrometeorological mechanism where the accumulation and transport of water vapor, which is monitored by PWV in SPCI, do not always align instantaneously with precipitation inputs, which is reflected solely by SPI. In this context, vapor release captured by SPCI is decoupled from immediate precipitation records due to the time lag between vapor condensation and rainfall formation, whereas only direct precipitation inputs are registered by SPI. Over medium-to-long terms, cross-seasonal dynamics are dominated by the process where stored moisture in terrestrial systems, such as soil and shallow groundwater, is gradually released under seasonal thermal forcing, a process that leads to enhanced local evaporation and a subsequent increase in atmospheric PWV [40]. Here, prior seasonal contributions of stored moisture-derived vapor are incorporated by SPCI, whereas only current-year precipitation inputs are reflected by SPI. Consequently, a stable correlation is maintained between SPCI and SPEI, which reflects the shared moisture sources that link the evapotranspiration component in SPEI, which is driven by stored moisture release, and the efficiency of vapor conversion, which is derived from PWV in SPCI.
4. Discussion
The comparative analysis conducted in this study highlights not only the performance but also the practical advantages of the SPCI. A key benefit of SPCI lies in its data efficiency and computational simplicity relative to the more established indices. Specifically, compared to the SPI, the SPCI incorporates the dimension of atmospheric moisture availability (PWV), thereby providing a more comprehensive drought analysis than one based on precipitation alone. More importantly, when contrasted with the SPEI, the SPCI offers a significant operational advantage. The calculation of SPEI requires accurate estimation of potential evapotranspiration (PET), which itself is dependent on multiple meteorological variables that can introduce cumulative uncertainties and increase data acquisition complexity. In contrast, the SPCI relies solely on precipitation and PWV data. This streamlined requirement makes the SPCI particularly advantageous for regions with sparse meteorological observations and allows for a more straightforward and robust calculation process.
In terms of SPCI, previous studies on its application were mostly limited to single climatic zones, and its adaptability across complex climatic gradients was not verified. This gap has been addressed by this research through the systematic validation of SPCI across four major climatic zones in China. The results demonstrate that, within the ERA5-based framework of this study, the SPCI shows comparable performance to the established indices in capturing short-to-medium-term drought signals while it simplifies data acquisition and computational procedures.
Secondly, several limitations of this research should be acknowledged. The ERA5 reanalysis data used in this study exhibit a PWV RMSE of 1.584 mm when validated against radiosonde observations [9]. The propagation of this uncertainty to the calculated SPCI results in a negligible magnitude across all climatic zones, with slightly higher relative effects in arid regions but no substantive impact on drought characterization. Consequently, potential biases in the ERA5 data do not compromise the robustness of the identified drought characteristics across different climatic zones.
Meanwhile, this study is based on PE to analyze the evolution characteristics of dry–wet events across China and utilizes high-resolution observational data from the recent 25 years. Although a minimum 30-year dataset is generally recommended in climate statistics to enhance result robustness, the 25-year study period from 2000 to 2024 adopted is supported by the “Acceptable Time Period” concept proposed by Abu Arra and Şişman [41], which holds that 10–20 years is sufficient as the minimum period for drought research. This timeframe fully captures the spatiotemporal variability of drought events under global warming and provides a robust data basis for multi-scale analysis. Furthermore, this study relies on ERA5 reanalysis data that have a spatial resolution of 0.25° × 0.25°. These inherent data characteristics particularly influence the analysis in regions with complex terrain and arid climates, such as the TCCZ and ACZ. The coarser spatial resolution of ERA5 may inadequately represent the highly localized variations in PWV and precipitation driven by complex topography and strong surface–atmosphere interactions in these zones. Consequently, the calculated PE and SPCI values might smooth over critical fine-scale drought signals. For instance, in the TCCZ, intense solar radiation leads to strong evaporation that operates on a very localized scale, while in the ACZ, the spatial heterogeneity of snow accumulation and melt is significant. The 0.25° resolution of ERA5 likely cannot fully resolve these processes, which contributes to the observed weaker performance and higher uncertainty of SPCI in long-term drought monitoring within these arid and semi-arid inland areas. This data-induced limitation underscores that the applicability of any drought index, including SPCI, is intrinsically linked to the quality and resolution of the underlying input data.
To address the aforementioned limitations, several directions for future research are proposed. First, integrate high-resolution observational data and separately delineate complex terrain areas for the calculation and analysis of relevant indicators. At the same time, incorporate hydrological response data and agricultural indicators to enhance the applicability of SPCI in these areas. Furthermore, during years with ENSO events, drought signals tend to be more pronounced. Previous studies have documented that ENSO events can indeed trigger drought occurrences [42,43]. However, due to time constraints, a detailed investigation of this relationship in the Chinese region was not conducted in the present study. This aspect will be progressively incorporated in future research.
The findings of this study systematically validate the applicability of SPCI across different climatic zones, thereby providing a scientific basis for region-specific drought monitoring. The results offer scientific references for the formulation of regional climate change adaptation strategies and the optimization of disaster risk management systems.
5. Conclusions
This study develops a PWV-based multiscale drought analysis scheme for drought characterization across climatic zones in China, developed through multiscale analysis of PE derived from PWV. By utilizing ERA5 reanalysis data from 2000 to 2024, fundamental zonal differentiation in PE spatiotemporal patterns is revealed, with each zone governed by distinct climatic mechanisms: (1) Analysis of the spatiotemporal distribution of PE in China revealed that the first two principal components explain over 85% of the spatiotemporal variability of PE across all zones, with PC1 contributing independently from 82.05% to 83.80%. (2) Multi-temporal analysis of SPCI identifies heightened short-term (1–3 month) drought sensitivity in the Northwest Inland Basins and the southern Tibetan Plateau. (3) Correlation analysis of climate indices across multiple temporal scales in China demonstrated robust positive correlations between SPCI and benchmark indices across all four climatic zones at all temporal scales. Specifically, first, the strongest phase synchronization between SPCI and SPEI in the TSMCZ is observed at the 1-month scale, while the largest phase difference is shown at the 12-month scale. Second, in the TMZ, the strongest correlation between SPCI and SPEI is found at the 12-month scale. Lastly, in the TCCZ and ACZ, the correlations among the three indices generally exhibit a decreasing trend as the temporal scale increases.
The results demonstrate comparable performance between SPCI and established indices (SPI/SPEI) in capturing short-to-medium-term drought signals, coupled with simplified data acquisition and computational procedures. This study provides a systematic, ERA5-based validation of SPCI’s applicability across different climatic zones in China, establishing a scientific basis for region-specific drought monitoring. Furthermore, scientific references for the formulation of regional climate change adaptation strategies and the optimization of disaster risk management systems are offered by these findings. Future research will include further investigation into the impact of ENSO on drought events in China, along with an evaluation of SPCI applicability in regions with complex topography such as the ACZ.
Author Contributions
Conceptualization, R.L. and F.Y.; methodology, R.L. and F.Y.; software, Q.D. and L.Z.; validation, R.L. and F.Y.; formal analysis, R.L. and Q.D.; investigation, Y.S. and S.Z.; Resources, R.L., F.Y., and L.Z.; data curation, Q.D., L.Z., Y.S., and Y.Y.; writing—original draft preparation, R.L.; writing—review and editing, F.Y., Q.D., Y.S., Y.Y., and S.Z.; visualization, R.L.; supervision, F.Y.; project administration, F.Y.; funding acquisition, F.Y. All authors have read and agreed to the published version of the manuscript.
Funding
This study is supported by the open Research Fund of State Key Laboratory for Fine Exploration and Intelligent Development of Coal Resources (SKLCRSM24KFA13), Beijing Natural Science Foundation (8262026), Fundamental Research Funds for the Central Universities (2024ZKPYDC02), Key Special Plan Projects of Technological Research in Zhenhai District under the 14th Five-Year Plan (2024006), China University of Mining and Technology-Beijing Innovation Training Program for College Students (202502006, 202502011).
Institutional Review Board Statement
Not applicable.
Informed Consent Statement
Not applicable.
Data Availability Statement
The TP and TCWV data used in this study are available from the ECMWF (https://cds.climate.copernicus.eu/ (accessed on 7 March 2025)). The SPEI data were obtained via SPEIbase (http://hdl.handle.net/10261/364137 (accessed on 17 March 2025)).
Acknowledgments
The authors would like to thank the European Centre for Medium-Range Weather Forecasts (ECMWF) for providing the TP and TCWV data. SPEIbase is also gratefully acknowledged for providing the SPEI data.
Conflicts of Interest
The authors declare no conflicts of interest.
Abbreviations
The following abbreviations are used in this manuscript:
| PWV | Precipitable Water Vapor |
| SPCI | Standardized Precipitation Conversion Index |
| PE | Precipitation Efficiency |
| TSMCZ | Tropical-Subtropical Monsoon Composite Zone |
| TMZ | Temperate Monsoon Zone |
| ACZ | Alpine Climate Zone |
| TCCZ | Temperate Continental Climate Zone |
| TP | Total Precipitation |
| TCWV | Total Column Water Vapor |
| SPEI | Standardized Precipitation-Evapotranspiration Index |
| PCA | Principal Component Analysis |
| PCC | Pearson Correlation Coefficient |
| SPI | Standardized Precipitation Index |
| ENSO | El Niño-Southern Oscillation |
Appendix A
The Table A1 is used to introduce various attributes of the original data.
Table A1.
Attributes of the original data.
References
- Rodell, M.; Houser, P.R.; Jambor, U.; Gottschalck, J.; Mitchell, K.; Meng, C.-J.; Arsenault, K.; Cosgrove, B.; Radakovich, J.; Bosilovich, M.; et al. The global land data assimilation system. Bull. Am. Meteor. Soc. 2004, 85, 381–394. [Google Scholar] [CrossRef] [Scilit]
- Shuman, F.G.; Hovermale, J.B. An operational six-layer primitive equation model. J. Appl. Meteor. 1968, 7, 525–547. [Google Scholar] [CrossRef] [Scilit]
- Ingram, W. A very simple model for the water vapour feedback on climate change. Q. J. R. Meteorol. Soc. 2010, 136, 30–40. [Google Scholar] [CrossRef] [Scilit]
- Schneider, T.; O’Gorman, P.A.; Levine, X.J. Water vapor and the dynamics of climate changes. Rev. Geophys. 2010, 48, RG3001. [Google Scholar] [CrossRef] [Scilit]
- Cao, D.; Chen, X.; Chen, D.; Du, Y.; Luo, Y.; Hu, Y.; Zhang, Q.; Ma, Y.; Chen, F. Two types of heavy precipitation in the southeastern Tibetan Plateau. Sci. Bull. 2025, 70, 748–755. [Google Scholar] [CrossRef] [Scilit]
- Wu, F.; You, Q.; Pepin, N.; Kang, S.; Zhai, P. Surface warming in summer over the Tibetan Plateau: Local and atmospheric circulation processes. Glob. Planet. Change 2025, 252, 104904. [Google Scholar] [CrossRef] [Scilit]
- O’Gorman, P.A. Precipitation extremes under climate change. Curr. Clim. Change Rep. 2025, 1, 49–59. [Google Scholar] [CrossRef] [Scilit]
- Yang, F.; Sun, Y.; Meng, X.; Guo, J.; Gong, X. Assessment of tomographic window and sampling rate effects on GNSS water vapor tomography. Satell. Navig. 2023, 4, 7. [Google Scholar] [CrossRef] [Scilit]
- Wang, H.; Yang, F.; Zheng, J.; Wang, Z.; Chen, W.; Xie, J. From GNSS Zenith Tropospheric Delay to Precipitable Water Vapor: Accuracy Assessment Using In-Situ and Reanalysis Meteorological Data Over China. IEEE J. Sel. Top. Appl. Earth. Obs. Remote Sens. 2025, 18, 14582–14593. [Google Scholar] [CrossRef] [Scilit]
- Yang, F.; Meng, X.; Guo, J.; Yuan, D.; Chen, M. Development and evaluation of the refined zenith tropospheric delay (ZTD) models. Satell. Navig. 2021, 2, 21. [Google Scholar] [CrossRef] [Scilit]
- Benevides, P.; Catalao, J.; Miranda, P.M.A. On the inclusion of GPS precipitable water vapour in the nowcasting of rainfall. Nat. Hazards Earth Syst. Sci. 2015, 15, 2605–2616. [Google Scholar] [CrossRef] [Scilit]
- Jadala, N.B.; Sridhar, M.; Dutta, G.; Yousuf, M.; Reddy, Y. Integrated water vapor during active and break spells of monsoon and its relationship with temperature, precipitation and precipitation effciency over a tropical site. Geod. Geodyn. 2022, 13, 238–246. [Google Scholar] [CrossRef] [Scilit]
- Li, J.; Yang, F.; Fan, L.; Yuan, D.; Jing, G.; Wang, Z.; Xie, J.; Yang, Y. Improving the accuracy of zenith tropospheric delay in TUW-VMF3 and GFZ-VMF3 using feedforward neural networks. GPS Solut. 2025, 29, 151. [Google Scholar] [CrossRef] [Scilit]
- Trenberth, K.E.; Dai, A.; Rasmussen, R.M.; Parsons, D.B. The changing character of precipitation. Bull. Am. Meteor. Soc. 2003, 84, 1205–1217. [Google Scholar] [CrossRef] [Scilit]
- Sui, C.; Li, X.; Yang, M. On the defnition of precipitation effciency. J. Atmos. Sci. 2007, 64, 4506–4513. [Google Scholar] [CrossRef] [Scilit]
- Tuller, S.E. The world distribution of annual precipitation effciency. J. Geogr. 1971, 70, 219–223. [Google Scholar] [CrossRef] [Scilit]
- Ye, H.; Fetzer, E.J.; Wong, S.; Behrangi, A.; Olsen, E.T.; Cohen, J.; Lambrigtsen, B.H.; Chen, L. Impact of increased water vapor on precipitation effciency over northern Eurasia. Geophys. Res. Lett. 2014, 41, 2941–2947. [Google Scholar] [CrossRef] [Scilit]
- Yin, L.; Ping, F.; Mao, J.; Jin, S. Analysis on precipitation effciency of the “21.7” henan extremely heavy rainfall event. Adv. Atmos. Sci. 2022, 40, 374–392. [Google Scholar] [CrossRef] [Scilit]
- Hao, R.; Yang, F.; Li, Z.; Zhang, Y.; Zhou, L.; Wang, L. ERA5-SH: A global grided scale height dataset for tropospheric parameters based on ERA5 reanalysis. Sci. Data 2025, 12, 381. [Google Scholar] [CrossRef] [Scilit]
- Zhu, H.; Chen, K.; Chai, H.; Ye, Y.; Liu, W. Characterizing extreme drought and wetness in Guangdong, China using global navigation satellite system and precipitation data. Satell. Navig. 2024, 5, 1. [Google Scholar] [CrossRef] [Scilit]
- Liu, H.; Yao, C.; Wang, R.; Qin, P.; Yu, Q.; Zhai, H.; Pang, J. Meteorological drought monitoring combined with GNSS precipitable water vapor and measured precipitation: A case study of GNSS stations in Hubei Province. Torrent. Rain Disasters 2025, 44, 236–245. [Google Scholar] [CrossRef]
- Gu, L.; Yin, J.; Gentine, P.; Wang, H.-M.; Slater, L.J.; Sullivan, S.C.; Chen, J.; Zscheischler, J.; Guo, S. Large anomalies in future extreme precipitation sensitivity driven by atmospheric dynamics. Nat. Commun. 2023, 14, 3197. [Google Scholar] [CrossRef] [Scilit]
- McKee, T.B.; Doesken, N.J.; Kleist, J. The Relationship of Drought Frequency and Duration to Time Scales. In Proceedings of the 8th Conference on Applied Climatology, Anaheim, CA, USA, 17–22 January 1993; pp. 179–184. [Google Scholar]
- Yao, C.; Shum, C.; Luo, Z.; Li, Q.; Lin, X.; Xu, C.; Zhang, Y.; Chen, J.; Huang, Q.; Chen, Y. An optimized hydrological drought index integrating GNSS displacement and satellite gravimetry data. J. Hydrol. 2022, 614, 128647. [Google Scholar] [CrossRef] [Scilit]
- Zhao, Q.; Ma, X.; Yao, W.; Liu, Y.; Yao, Y. A Drought Monitoring Method Based on Precipitable Water Vapor and Precipitation. J. Clim. 2020, 33, 10727–10741. [Google Scholar] [CrossRef] [Scilit]
- Zhu, H.; Chen, K.; Hu, S.; Liu, J.; Shi, H.; Wei, G.; Chai, H.; Li, J.; Wang, T. Using the Global Navigation Satellite System and Precipitation Data to Establish the Propagation Characteristics of Meteorological and Hydrological Drought in Yunnan, China. Water Resour. Res. 2023, 59, e2022WR033126. [Google Scholar] [CrossRef] [Scilit]
- Xue, Y.; Bai, X.; Zhao, C.; Tan, Q.; Li, Y.; Luo, G.; Wu, L.; Chen, F.; Li, C.; Ran, C.; et al. Spring Photosynthetic Phenology of Chinese Vegetation in Response to Climate Change and Its Impact on Net Primary Productivity. Agric. For. Meteorol. 2023, 342, 109734. [Google Scholar] [CrossRef] [Scilit]
- Yang, C.; Liu, C.; Gu, Y.; Wang, Y.; Xing, X.; Ma, X. A Novel Comprehensive Agricultural Drought Index Accounting for Precipitation, Evapotranspiration, and Soil Moisture. Ecol. Indic. 2023, 154, 110593. [Google Scholar] [CrossRef] [Scilit]
- Xu, L.; Abbaszadeh, P.; Moradkhani, H.; Chen, N.; Zhang, X. Continental Drought Monitoring Using Satellite Soil Moisture, Data Assimilation and an Integrated Drought Index. Remote Sens. Environ. 2020, 250, 112028. [Google Scholar] [CrossRef] [Scilit]
- Li, C.; Wang, J.; He, J. Impacts of Atmospheric Circulations on the Interannual Variability of Springtime Haze Frequency in the Pearl River Delta Region, China. Theor. Appl. Climatol. 2022, 150, 1643–1657. [Google Scholar] [CrossRef] [Scilit]
- Yang, F.; Wang, Y.; Li, Z.; Yu, B.; Wu, J.; Cao, Y.; Zhang, S. Analysis of heavy rainstorm in Beijing in 2023 based on GNSS observations. Acta Geod. Cartogr. Sin. 2025, 54, 14–25. [Google Scholar] [CrossRef]
- Vicente-Serrano, S.M.; Begueria, S.; Lopez-Moreno, J.I. A multiscalar drought index sensitive to global warming: The standardized precipitation evapotranspiration index. J. Clim. 2023, 23, 1696–1718. [Google Scholar] [CrossRef] [Scilit]
- Bordi, I.; Zhu, X.; Fraedrich, K. Precipitable water vapor and its relationship with the Standardized Precipitation Index: Ground-based GPS measurements and reanalysis data. Theor. Appl. Climatol. 2016, 123, 263–275. [Google Scholar] [CrossRef] [Scilit]
- Thomas, A.C.; Reager, J.T.; Famiglietti, J.S.; Rodell, M. A GRACE based water storage deficit approach for hydrological drought characterization. Geophys. Res. Lett. 2014, 41, 1537–1545. [Google Scholar] [CrossRef] [Scilit]
- Wang, H.; Chen, Y.; Pan, Y.; Chen, Z.; Ren, Z. Assessment of candidate distributions for SPI/SPEI and sensitivity of drought to climatic variables in China. Int. J. Climatol. 2019, 39, 4392–4412. [Google Scholar] [CrossRef] [Scilit]
- Stephens, M.A. Use of the Kolmogorov-Smirnov, Cramer-Von Mises and related statistics without extensive tables. J. R. Stat. Soc. B. 1970, 32, 115–122. [Google Scholar] [CrossRef] [Scilit]
- Abdi, H.; Williams, L.J. Principal component analysis. Wiley Interdiscip. Rev. Comput. Stat. 2010, 2, 433–459. [Google Scholar] [CrossRef] [Scilit]
- Rodgers, J.L.; Nicewander, W.A. Thirteen ways to look at the correlation coefficient. Am. Stat. 1988, 42, 59–66. [Google Scholar] [CrossRef] [Scilit]
- Duan, A.; Wu, G.; Wang, B.; Turner, A.G.; Hu, J.; Hu, W.; Zhang, P.; Hu, D.; Tang, Y. Drivers of East Asian summer monsoon variability: Global oceans and the Tibetan Plateau. Sci. Bull. 2024, 69, 2487–2490. [Google Scholar] [CrossRef] [Scilit]
- Trenberth, K.E.; Fasullo, J.T.; Mackaro, J. Atmospheric moisture transports from ocean to land and global energy flows in reanalyses. J. Clim. 2011, 24, 4907–4924. [Google Scholar] [CrossRef] [Scilit]
- Abu Arra, A.; Şişman, E. Innovative Drought Classification Matrix and Acceptable Time Period for Temporal Drought Evaluation. Water Resour. Manag. 2024, 38, 2811–2833. [Google Scholar] [CrossRef] [Scilit]
- Cook, B.I.; Smerdon, J.E.; Cook, E.R.; Williams, A.P.; Anchukaitis, K.J.; Mankin, J.S.; Allen, K.; Andreu-Hayles, L.; Ault, T.R.; Belmecheri, S.; et al. Megadroughts in the Common Era and the Anthropocene. Nat. Rev. Earth Environ. 2022, 3, 741–757. [Google Scholar] [CrossRef] [Scilit]
- Campbell, O.G.; Goodrich, G.B. Drought in the Breadbasket of America and the Influence of Oceanic Teleconnections. Hydrology 2023, 10, 215. [Google Scholar] [CrossRef] [Scilit]

Disclaimer/Publisher’s Note: The statements, opinions and data contained in all publications are solely those of the individual author(s) and contributor(s) and not of MDPI and/or the editor(s). MDPI and/or the editor(s) disclaim responsibility for any injury to people or property resulting from any ideas, methods, instructions or products referred to in the content. |
© 2026 by the authors. Licensee MDPI, Basel, Switzerland. This article is an open access article distributed under the terms and conditions of the Creative Commons Attribution (CC BY) license.