


Abstract
Fine particulate matter (PM2.5) and ozone (O3) are the two dominant air pollutants in China, yet their coupling relationship at the daily urban scale remains debated because observational correlations are often confounded by meteorology. This study investigates the nonlinear PM2.5–O3 relationship in Puyang, a typical oil and gas industrial city in the “2 + 26” region, using daily observations from 2015 to 2025. A set of progressively nested generalized additive models were constructed, adding meteorological factors and NO2 sequentially, followed by humidity and season interaction terms. Stratified correlation analyses revealed a concentration-stratified reversal: positive in the low-concentration segment (<35 μg·m−3; r = 0.271) and negative in the mid (35–75 μg·m−3; r = −0.208) and high (>75 μg·m−3; r = −0.313) segments. After controlling for meteorology and NO2, however, the conditional partial effect increased over most of the PM2.5 range, indicating that the uncontrolled negative correlation largely disappeared after controlling for meteorology. Humidity exerted a significant conditional modulating effect (p < 0.001), whereas seasonal modulation was concentrated in autumn (p < 0.001). The positive correlation in the low-concentration segment showed a suggestive increase over time (0.190 to 0.306), while the negative correlation in the high-concentration segment weakened (−0.380 to −0.198), indicating an asymmetric redistribution of the PM2.5–MDA8 O3 coupling during the clean-air transition. These findings suggest that coordinated control of PM2.5 and MDA8 O3 should be designed by concentration interval rather than as a single-direction linear reduction, with precursor-ratio regulation needed in the low-concentration range.
1. Introduction
Atmospheric compound pollution is a key characteristic in China, particularly in the Beijing–Tianjin–Hebei region and its surrounding areas. Since the implementation of the “Action Plan for Prevention and Control of Air Pollution” in China in 2013, PM2.5 in the Beijing–Tianjin–Hebei region has decreased to 36.7 μg·m−3 in 2024, a decrease of 65.4%. It surpassed the control effectiveness achieved by the “Clean Air Act” after 30 years of implementation in the United States. However, O3 concentrations have been rising steadily in this region [1,2,3]. PM2.5 and O3 alternated as the primary pollutant, with occasional haze episodes of dual exceedance (both of them exceeding standards simultaneously). In February 2017, the “2 + 26” region (including two municipalities, Beijing and Tianjin, and 26 cities in four surrounding provinces, namely Baoding, Cangzhou, Handan, Hengshui, Langfang, Shijiazhuang, Tangshan and Xingtai in Hebei province; Changzhi, Jincheng, Taiyuan and Yangquan in Shanxi province; Binzhou, Dezhou, Heze, Jinan, Jining, Liaocheng and Zibo in Shandong province; and Anyang, Hebi, Jiaozuo, Kaifeng, Puyang, Xinxiang and Zhengzhou in Henan province) were included in this region for air pollution control. These cities served as major air pollution hotspots and important transport pathways for pollutants. Their heavily industrialized structure, concentrated energy consumption, and substantial total pollutant emissions are the main drivers of polluted weather formation. Designating these 28 cities as important for air pollution prevention and control has expanded the governance scope of the Beijing–Tianjin–Hebei region and established a joint prevention and control mechanism with surrounding cities. This mechanism enables unified standards, coordinated emission reductions, joint law enforcement, and a concentrated response to regional air pollution challenges.
The formation of PM2.5 and O3 differs because of their disparate sources. Air pollution is closely linked to precursor emissions, regional, transport, and other contributing factors. Most studies have explored this issue from various perspectives [4,5,6,7,8,9]. Ye et al. innovatively studied the impact of urban spatial morphology on PM2.5 and O3 [3]. Yuan et al. found that the decrease in particulate matter concentration weakens its absorption and scattering of sunlight, enhancing the photochemical generation of O3 [10]. Meanwhile, particulate matter is an important sink for ꞏHOx radicals (ꞏHOx = ꞏHO + ꞏHO2), and its concentration decrease increases the concentration of ꞏHOx, thereby promoting O3 generation [4,11]. However, this process has not been found to dominate O3 generation in field observations [12]. Qiu et al. analyzed the relationship between PM2.5, O3, and total atmospheric oxidants (Ox = O3 + NO2) nationwide and found that PM2.5 and O3 exhibit opposite trends in the Beijing–Tianjin–Hebei region; under conditions of excessive O3, if PM2.5 is greater than 50 μg·m−3, PM2.5 inhibits O3 generation [6]. Li et al. used the GEOS-Chem model to simulate that the decrease in PM2.5 concentration can indirectly promote O3 generation [11]. Overall, the spatial distribution and synergistic relationship between PM2.5 and O3 exhibit regional heterogeneity [8].
However, PM2.5 and O3 indeed exhibit a trend of mutual compensation. Some studies also reveal that under specific conditions, the relationship between the two is not simply one-way suppression but involves complex interactions and synergistic effects [13,14]. Firstly, both of them share common precursors, NOx and VOCs, providing a foundation and basis for their synergistic control. Secondly, the chemical components in PM2.5 are complex, with black carbon, metals, and other components potentially affecting the photochemical reaction efficiency of O3 through absorbing solar radiation or acting as catalysts, leading to an increase in O3 concentration. This enhances the oxidizing nature of the atmosphere, promoting the conversion of NOx and VOCs in the atmosphere into PM2.5, generating more secondary organic matter, and making the pollution of PM2.5 and O3 in the atmosphere more complex. At the same time, the two can interact through heterogeneous reactions, causing complex nonlinear superposition effects [15,16], leading to the occurrence of dual-exceedance pollution weather [17]. Nevertheless, notable differences exist between PM2.5 and O3 in terms of their sources and formation mechanisms [18]. Therefore, achieving synergistic control of PM2.5 and O3 relies on scientific research to achieve precise and effective pollution abatement.
Puyang, a “2 + 26” key city and a major petrochemical base in China, is rich in oil, gas, and coal resources. The dense clustering of extraction, refining, and chemical industries makes it a major source of VOCs and NOx, with its pollution characteristics being especially typical of oil-industrial cities. The synergistic effects of VOCs and NOx can induce atmospheric compound pollution, characterized by strong synergistic intensity, high photochemical activity, and nonlinear interactions (e.g., low PM2.5 promotes O3 formation while high PM2.5 suppresses it). These features distinguish its pollution attributes significantly from those of ordinary cities. However, studies on such cities remain limited, leading to an insufficient understanding of their complex pollution mechanisms and a lack of targeted control strategies. Therefore, studying Puyang’s air pollution is of great significance. It can not only reveal the unique pollution processes of oil-industrial cities but also provide scientific support for similar cities to implement differentiated measures and precise emission reduction, demonstrating a typical value for tackling atmospheric compound challenges.
2. Materials and Methods
2.1. Location of Puyang
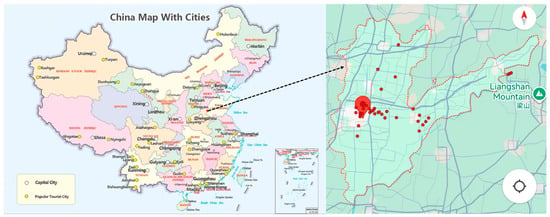
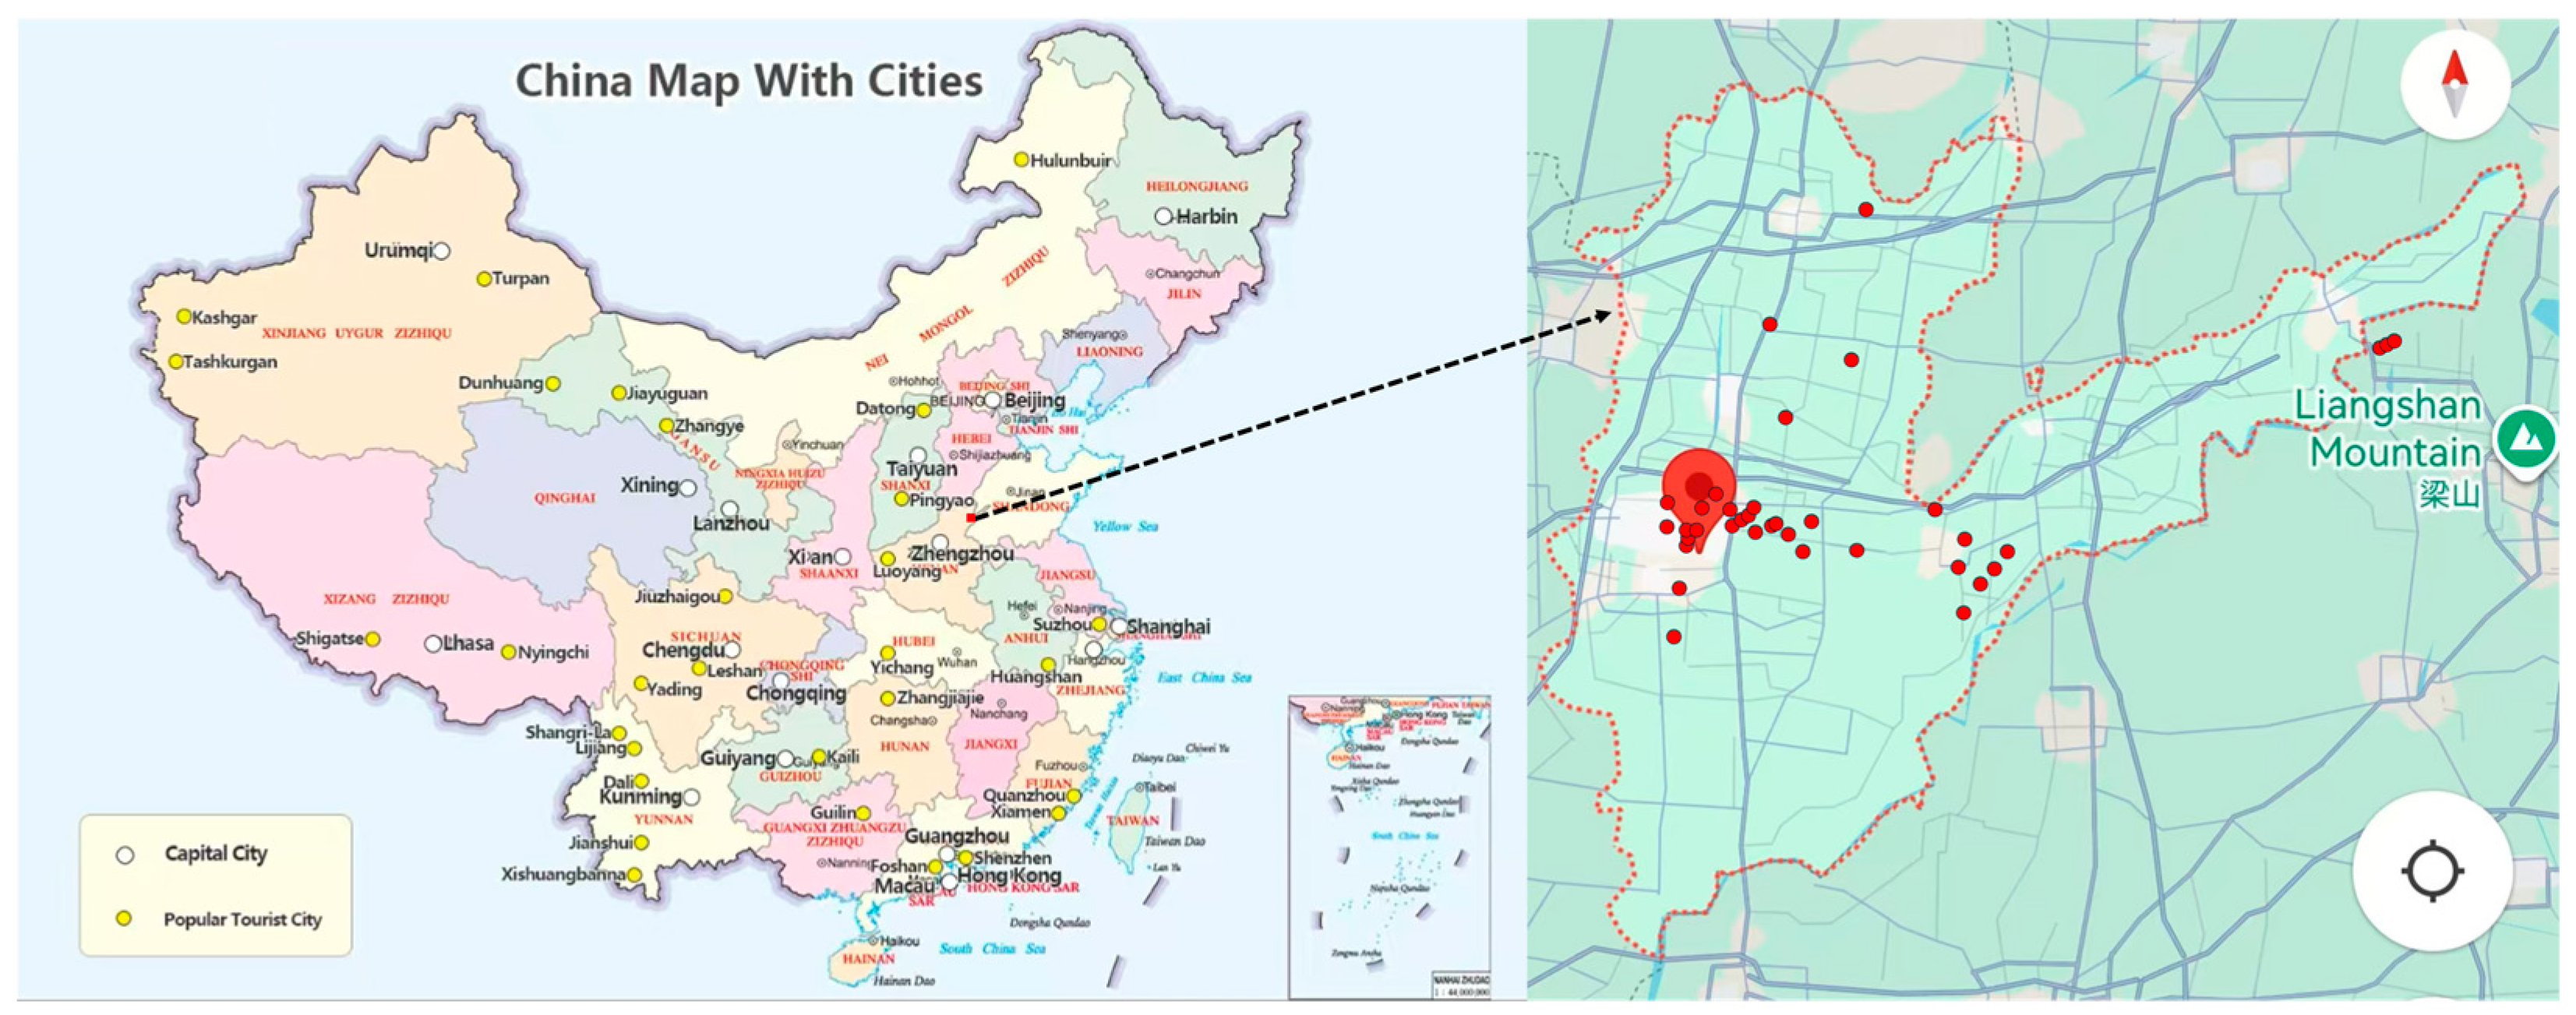
Puyang is located in the northeast of Henan Province, at the intersection of Hebei, Shandong, and Henan provinces (as shown in Figure 1). It borders Handan in Hebei and Heze in Shandong, as well as Anyang and Hebi in Henan. The city governs one district and five counties, with a total area of 4188 km2 and a permanent resident population of 4.3451 million at the end of 2023 (Puyang Statistical Yearbook 2024). The counties are Puyang County, Qingfeng County, Nanle County, Fan County, and Taiqian County, and the district is Hualong District. The city also has several functional zones, including the Puyang Economic and Technological Development Zone, the Puyang Urban-Rural Integration Demonstration Zone, and the Henan Puyang Industrial Park. As a key city in the “2 + 26” region, Puyang is a typical oil and gas industrial city, where the petrochemical industry is a pillar industry for its economic development and a key source of VOC emissions [19]. In 2023, the revenue of the petrochemical industry reached 72.6 billion yuan. In the first half of 2024, the added value of the petrochemical industry (including crude oil and natural gas extraction) accounted for 64.1% of the city’s total, with a contribution rate of 77.6% to the city’s industrial sector (http://pyrb.pyxww.com/content/202408/13/c145059.html; accessed on 10 September 2026).
Figure 1.
Location of Puyang city.
2.2. Data Sources
In Puyang, there are four state-controlled monitoring stations, namely the Puyang River Management Office, the Oilfield Transportation Company, the Ethylene Residential Area, and No. 68 Zhongyuan East Road (the blue circles in Figure 1 represent their locations). The data used in this study were obtained from these four state-controlled stations, and the average values of the four stations were adopted. The monitoring data used in this study (from 1 January 2015, to 31 December 2025) were obtained from the China National Environmental Monitoring Center (http://www.cnemc.cn; accessed on 9 September 2026), including daily, monthly, and annual average concentrations of PM2.5 (μg·m−3), PM10 (μg·m−3), SO2 (μg·m−3), NOx (μg·m−3), NO (μg·m−3), CO (mg·m−3), and O3 (μg·m−3; MDA8 O3, ozone maximum daily 8-h average). The total number of calendar days from 2015 to 2025 is 4018, of which 4011 days of observations were used in this study, corresponding to 7 missing days. The seven missing dates are 1 January 2015, 2 January 2015, 20 January 2015, 21 January 2015, 31 August 2018, 31 December 2020, and 4 July 2021.
Meteorological data were obtained from the Puyang Ecological Environment Bureau (http://sthjj.puyang.gov.cn; accessed on 9 September 2026), including daily meteorological element data such as mean temperature (°C), surface pressure (hPa), wind speed (m/s), wind direction, and relative humidity (%). The daily total radiation data were obtained from https://cds.climate.copernicus.eu (accessed on 9 September 2026), with units of MJ·m−2. This study uses the ERA5 hourly data on single levels from 1940 to the present (dataset ID: reanalysis-era5-single-levels) from the Copernicus Climate Data Store (CDS). This reanalysis dataset has a native spatial resolution of 0.25° × 0.25° and an hourly temporal resolution. The extracted meteorological variables include 2 m temperature, 2 m dewpoint temperature, 10 m U-component of wind, 10 m V-component of wind, boundary layer height, total cloud cover, surface downward solar shortwave radiation, sea level pressure, and total precipitation. Data retrieval was implemented via either the CDS web form or the Python version 3.14.7 cdsapi application programming interface (API). Within the API, we specified the study period, target variables, UTC time, and clipped the study domain using the area argument; outputs were saved in NetCDF or GRIB format.
In addition, the annual mean PM2.5 concentrations of Beijing, Tianjin, Zhengzhou, Taiyuan, Handan, Anyang and Hebei Province adopted in this study were derived from publicly released ecological and environmental status bulletins issued by local ecology and environment bureaus. Relevant URLs are listed below: Beijing (https://sthjj.beijing.gov.cn/bjhrb/index/xxgk69/sthjlyzwg/1718880/1718881/1718882/743964860/index.html; accessed 18 October 2026), Tianjin (https://sthj.tj.gov.cn/ZWGK4828/ZFXXGK8438/FDZDGK27/TJXX158/202609/t20260923_7380810.html; accessed 18 October 2026), Zhengzhou (https://sthjj.zhengzhou.gov.cn/zlbgs/10072555.jhtml; accessed 18 October 2026), Jinan (https://jnepb.jinan.gov.cn/col48576/art/2026/art_48576_4826079.html; accessed 18 October 2026), Taiyuan (https://www.taiyuan.gov.cn/szfxwbxwfbh/20260206/30282559.html; accessed 18 October 2026), Anyang (https://hbj.anyang.gov.cn/hjzl/hjzkgb/ayssthjzkgb/; accessed 18 October 2026), Handan (https://sthj.hd.gov.cn/main/detail?cid=248&id=1425803; accessed 18 October 2026), and Hebei province (https://hbepb.hebei.gov.cn/res/hbhjt/upload/file/20260604/a9e076a3dab440e0a34f707d6bf19c8d.pdf; accessed 18 October 2026).
2.3. Generalized Additive Model (GAM)
This study employed a generalized additive model (GAM) to analyze the complex relationship between PM2.5 and MDA8 O3 and the role of meteorological conditions therein. GAM expresses the expected value of the response variable as the sum of multiple smooth functions through a link function; each smooth function can be visualized separately, providing both the ability to capture nonlinear relationships and strong interpretability [20,21].
Data preprocessing included date parsing, season assignment, numeric conversion, and removal of the 7 missing days (Section 2.2). No imputation was applied. The samples were then divided into three segments according to daily mean PM2.5 concentrations: <35, 35–75, and >75 μg·m−3, which correspond to the Grade I and Grade II limits of the National Ambient Air Quality Standard (GB3095-2012) [22]. Within each segment, the Pearson correlation coefficient between PM2.5 and MDA8 O3 and its 95% confidence interval were calculated to preliminarily determine whether the relationship varied with PM2.5 concentration. Meanwhile, stratified correlation analyses were conducted by the median of temperature, humidity, wind speed, and radiation, as well as by season, to identify the moderating effects of meteorological conditions and season.
To characterize the nonlinear relationship between PM2.5 and MDA8 O3 and to identify the modulating effects of meteorological factors and precursors, a set of progressively nested generalized additive models (GAMs) was constructed. All models used MDA8 O3 as the response variable. The modeling strategy started from a univariate baseline model containing only PM2.5 (m1), then sequentially added meteorological factors—temperature, humidity, wind speed, radiation, pressure, and wind direction (m2)—and the precursor NO2 (m3, the main model). On the basis of the main model, a humidity interaction term (m4) and a season interaction term (m5) were introduced separately to test the two types of modulating effects.
To perform the GAM calculations, we used R version 4.3.1 with 14 packages (readxl, tidyverse, lubridate, mgcv, ggplot2, trend, psych, ppcor, segmented, gratia, patchwork, nlme, future and furrr). Table S1 in the Supplementary Materials summarizes the explicit formula, distribution family and link function, spline basis and k value, fitting criterion (REML), software used, and diagnostics (residual plots, k-index and concurvity) for each model, making the analysis easier to reproduce and compare.
2.4. Mann–Kendall Test
The Mann–Kendall (M–K) test is a non-parametric trend test used to examine the interannual trends of PM2.5 and MDA8 O3 in Puyang. This method does not require the data to be normally distributed and is robust to outliers [23]. For each time series, Kendall’s tau and the p-value were calculated to assess the strength and significance of the trend, and Sen’s slope with its 95% confidence interval was used to estimate the trend magnitude: a positive Sen’s slope indicates an increasing trend, while a negative value indicates a decreasing trend. The same method was also applied to the annual proportions of PM2.5 concentration bins to quantify the year-by-year changes in the frequency of low- and high-concentration days.
3. Results
3.1. Atmospheric Pollution Characteristics in Puyang During 2015–2025
3.1.1. Characteristics of PM2.5 and MDA8 O3 During 2015–2025
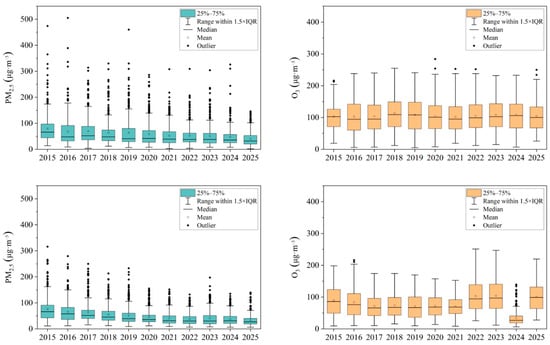
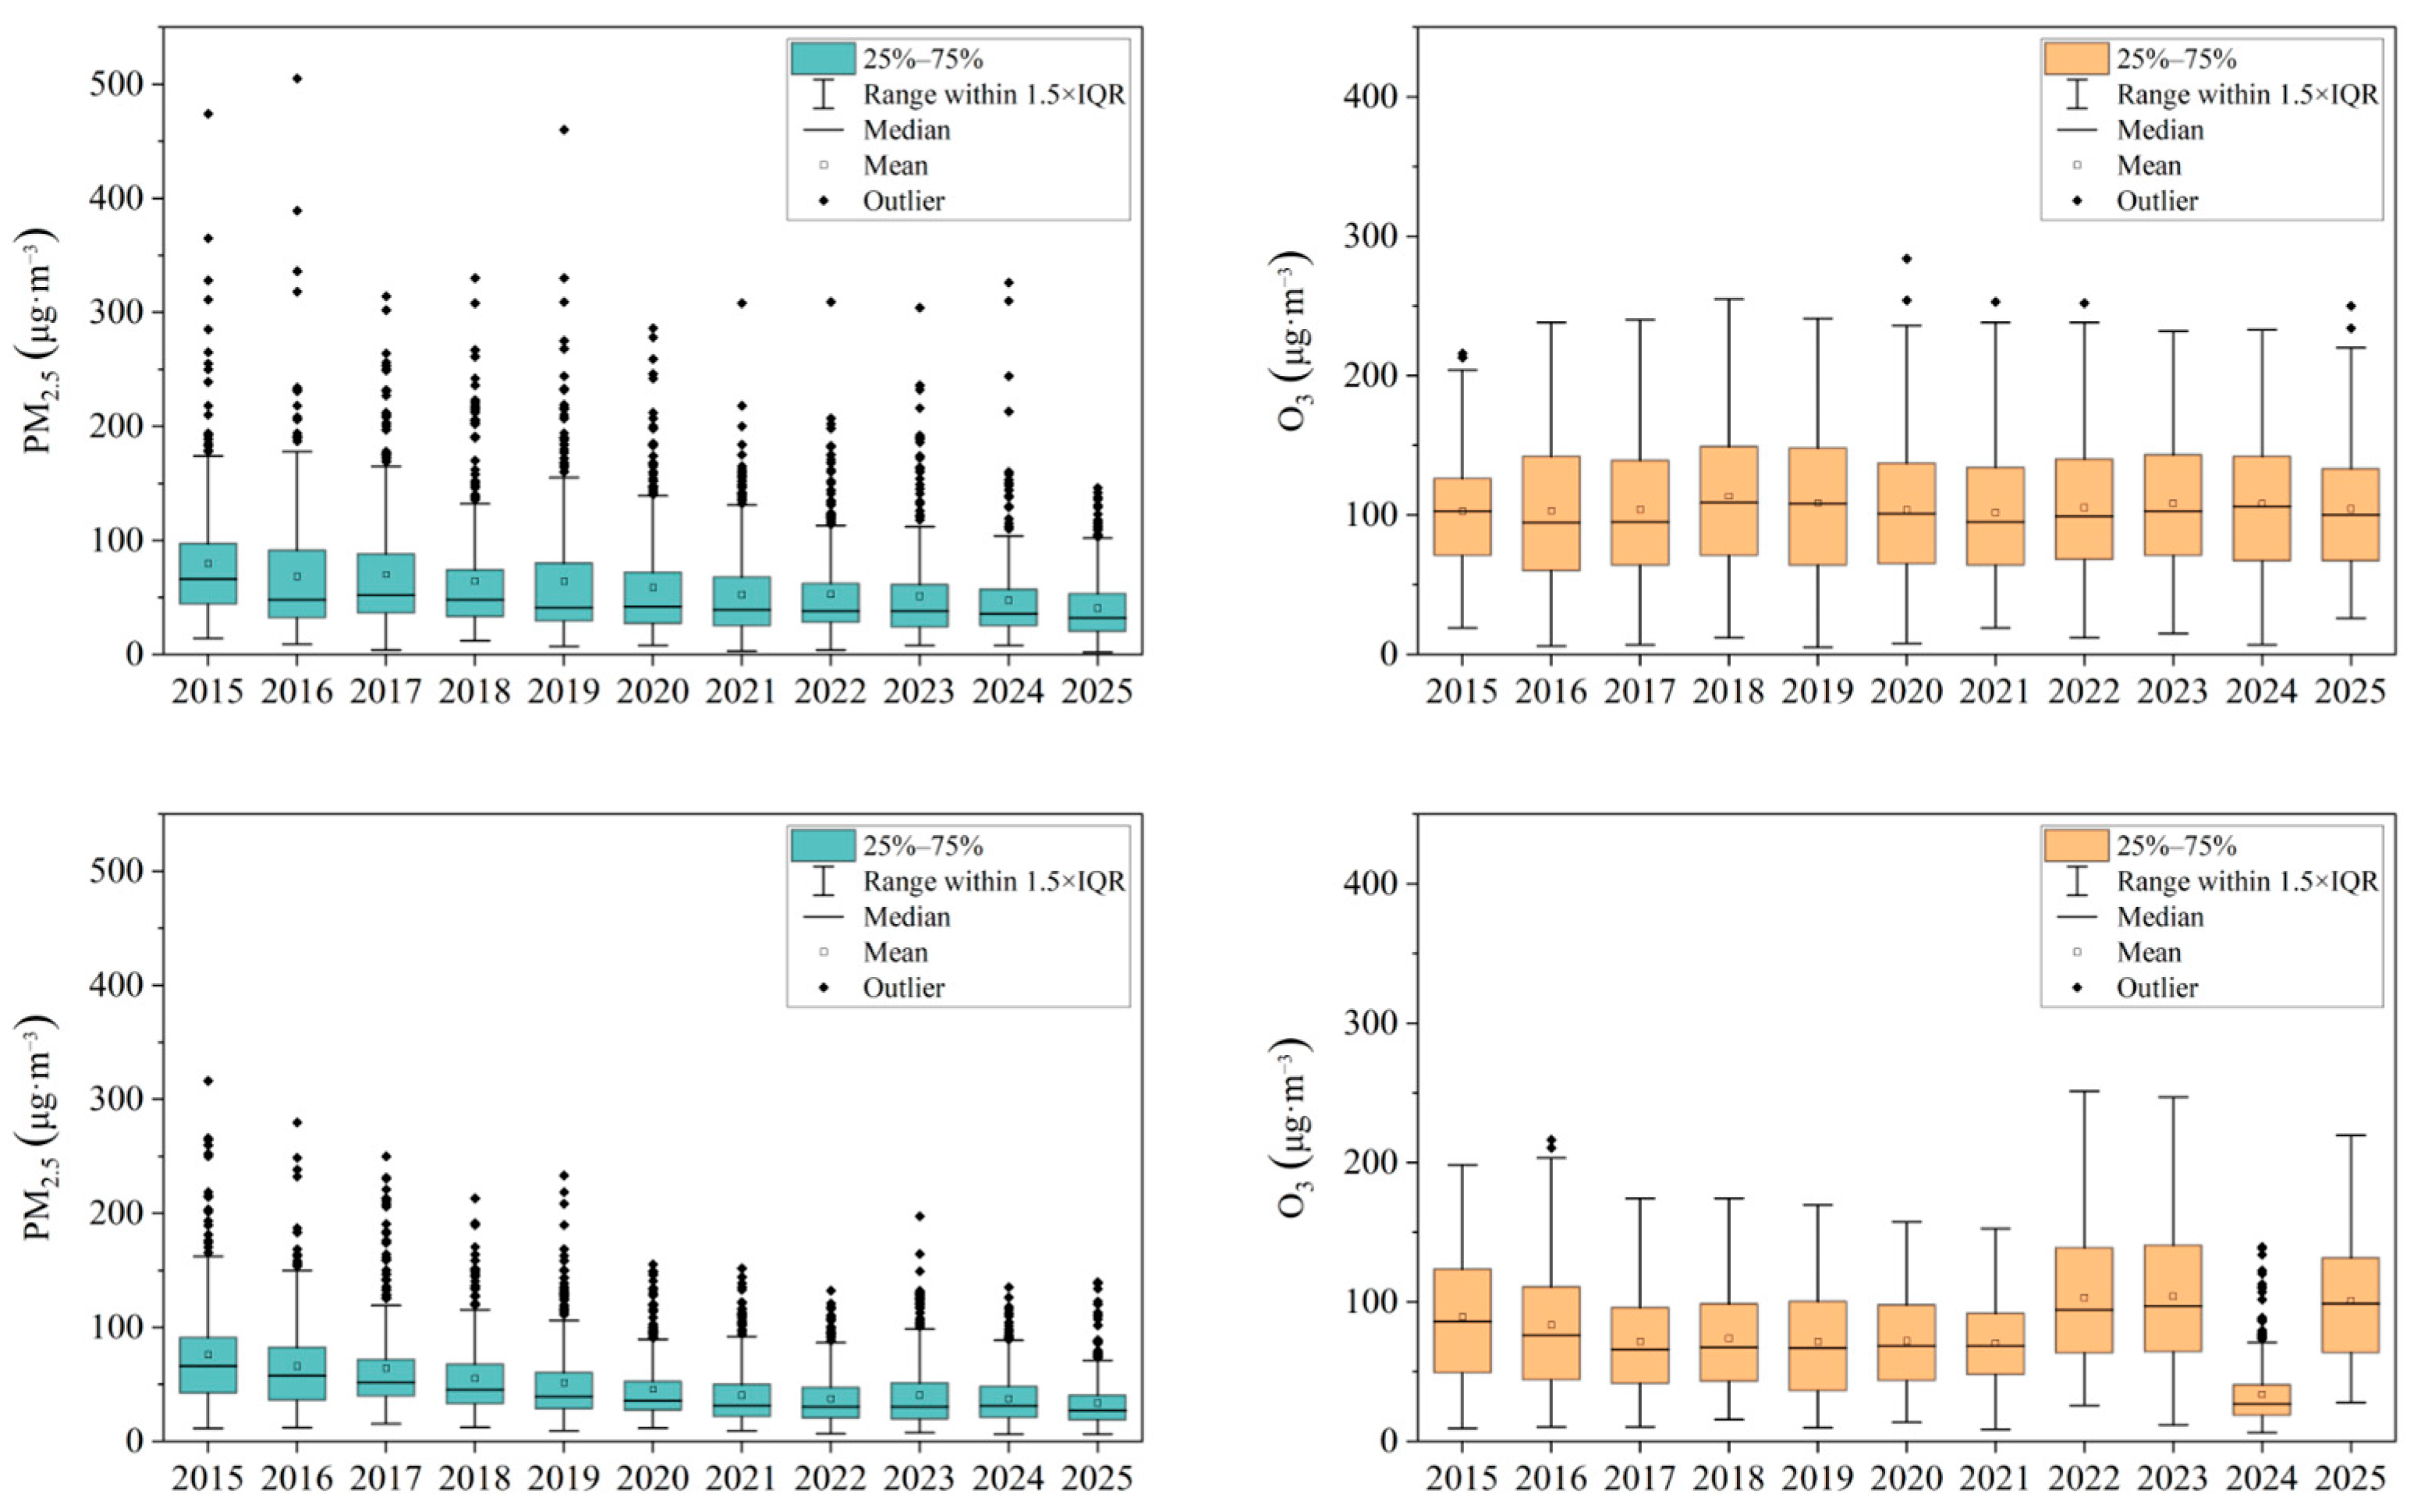
Figure 2 presents the annual mean concentrations of PM2.5 and MDA8 O3 in Puyang and the Beijing–Tianjin–Hebei region from 2015 to 2025. The annual mean concentration of PM2.5 decreased from 79.6 μg·m−3 to 40.4 μg·m−3 in Puyang during 2015–2025, representing a 49.2% reduction, although it was still 1.2 times higher than the National Grade II standard of 35 μg·m−3 (GB3095-2012). Notably, the PM2.5 level of Puyang has exceeded that of many cities in the “2 + 26” region. For example, Puyang’s PM2.5 annual average concentration reached 40.4 μg·m−3, exceeding 27 μg·m−3 of Beijing, 36.2 μg·m−3 of Tianjin, and Hebei Province’s overall average of 33.6 μg·m−3, as well as 38 μg·m−3 of Zhengzhou, 32 μg·m−3 of Jinan, and 33.6 μg·m−3 of Taiyuan. This level was comparable to that of the neighboring city of Anyang and slightly higher than 39 μg·m−3 in Handan. PM2.5 decreased year by year, while MDA8 O3 exhibited interannual variability, with only a slight net change over the study period (from 102.8 μg·m−3 in 2015 to 104.4 μg·m−3 in 2025). In the Beijing–Tianjin–Hebei region, PM2.5 decreased from 75.9 μg·m−3 to 32.0 μg·m−3 from 2015 to 2025, a reduction of 57.8%, corresponding to an average annual decline of 5.8%. In contrast, MDA8 O3 showed an endpoint increase from 90.5 μg·m−3 to 106.1 μg·m−3. This change should be distinguished from a statistically significant monotonic trend. As shown in Figure 2, PM2.5 in the Beijing–Tianjin–Hebei region showed a steady downward trend, and the 10th and 90th percentiles began to narrow—that is, the box became smaller—indicating a reduction in the frequency of extreme values, which can also be regarded as a favorable signal of a reduction in abnormally high values.
Figure 2.
The annual mean concentrations of PM2.5 and MDA8 O3 in Puyang and the Beijing–Tianjin–Hebei region during 2015–2025.
The concentration of O3 showed interannual variability with no significant monotonic trend, which differs from the continued O3 increase reported by Ye et al. [3] for the Yangtze River Delta. Previous studies have suggested that decreases in PM2.5 concentration may allow more sunlight to reach the ground and thereby affect O3 formation; however, this mechanism requires further investigation, as the interactions between PM2.5 and O3 involve highly complex atmospheric chemistry [11,24]. Chen et al. demonstrated that the Central Environmental Protection Inspection campaign has effectively decreased PM10, SO2, and CO using the panel data of 225 prefecture-level cities in China from 2014 to 2018. However, the effects on PM2.5, NO2, and O3, which have more complex formation mechanisms, were not statistically significant [25]. The limited effects on PM2.5 and O3 could be explained by the local government’s emphasis on primary emission controls (e.g., coal reduction, dust suppression, and vehicle restrictions), which were less effective for pollutants with complex secondary formation mechanisms like PM2.5 and O3 [26,27].
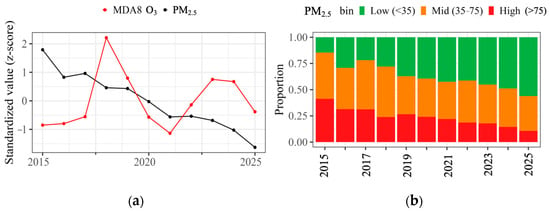
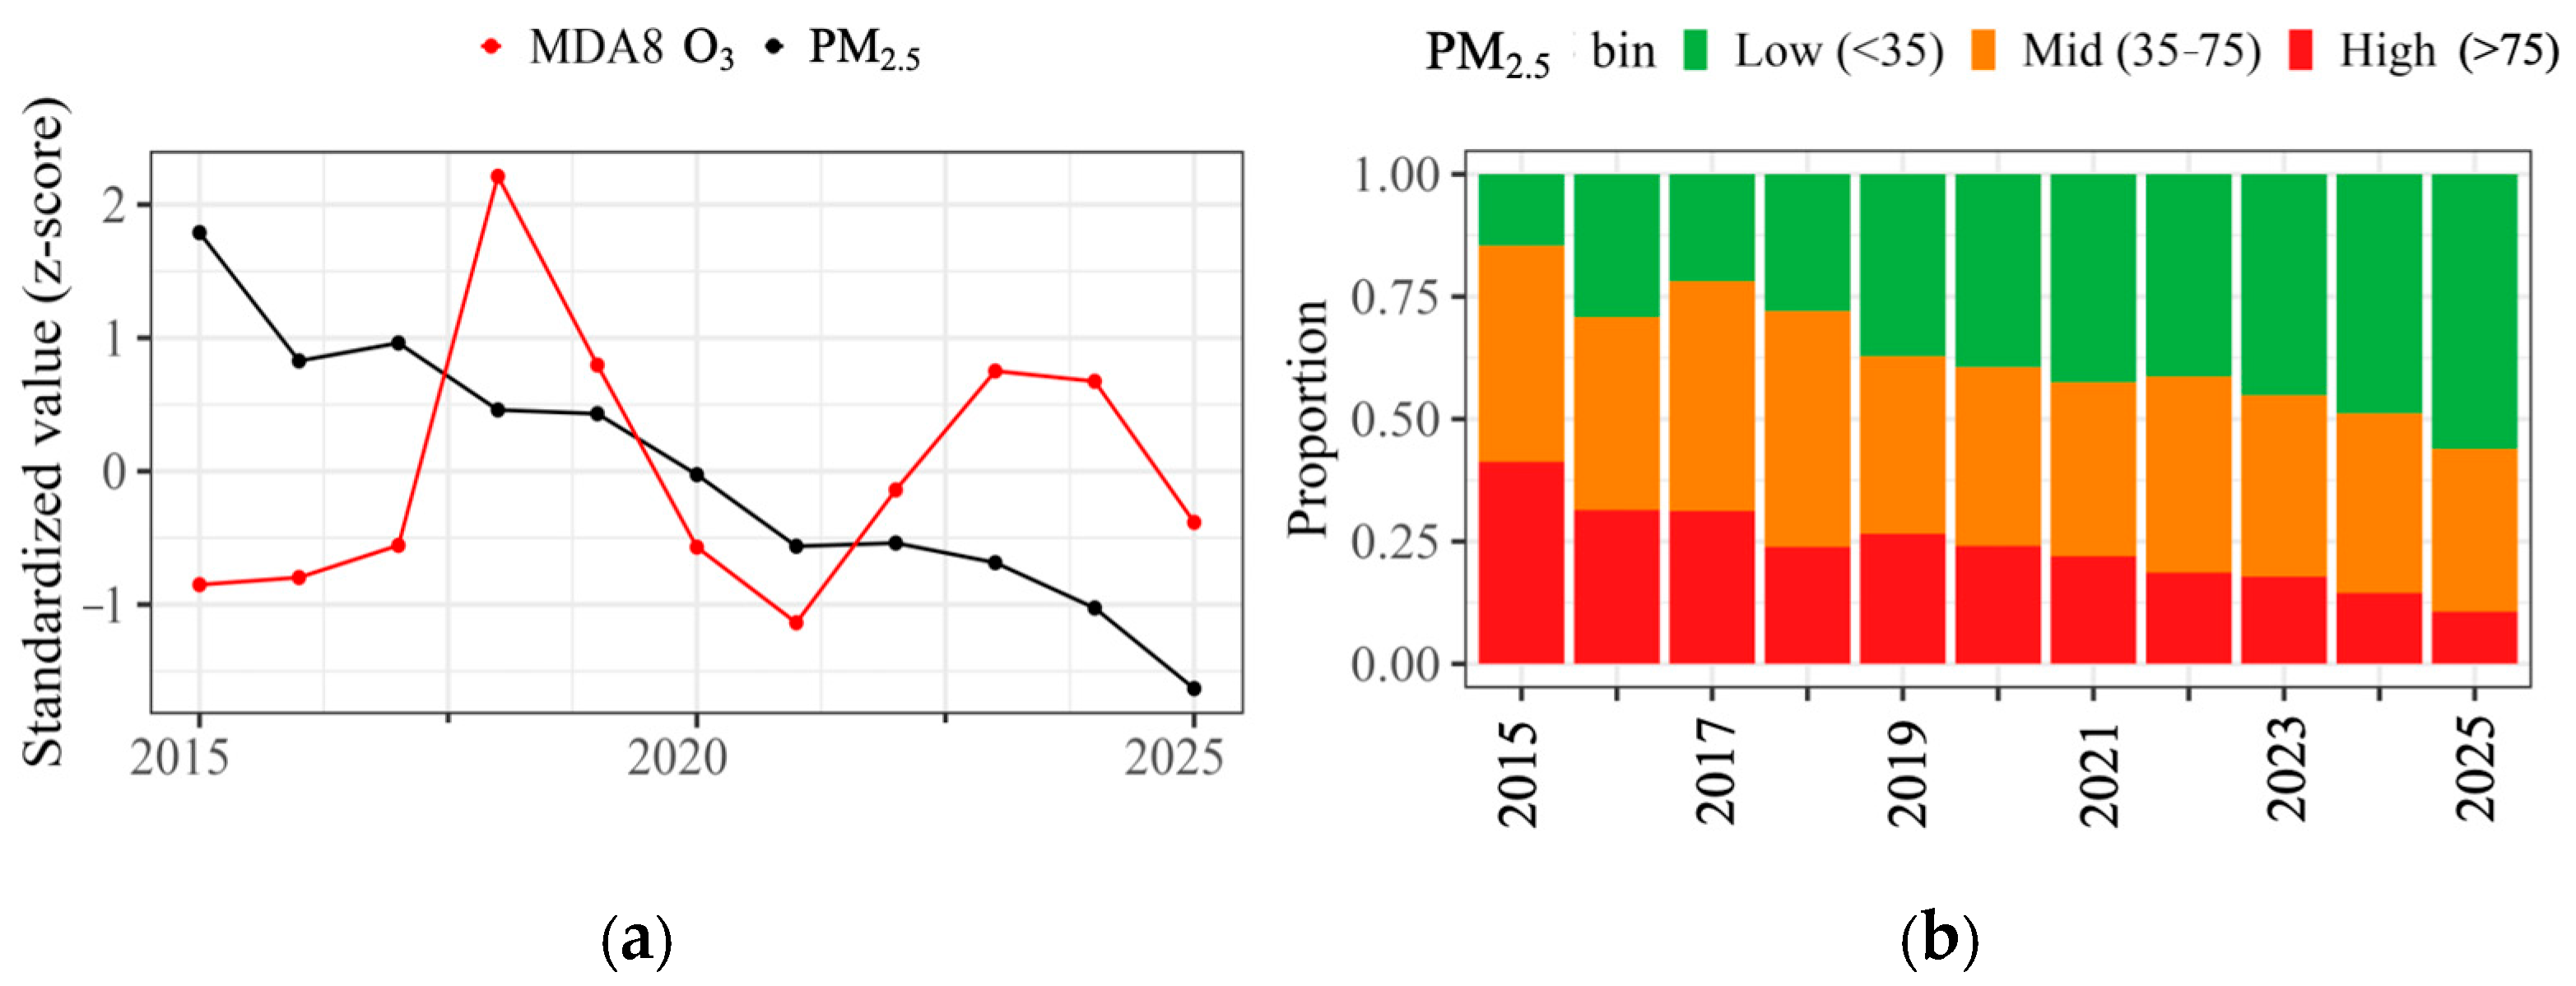
To clarify their trends in Puyang, this study conducted the Mann–Kendall test. The results showed that PM2.5 exhibited a significant decreasing trend (tau = −0.927, p < 1 × 10⁻⁴), with a Sen’s slope of −3.34 μg·m−3·a−1 (95% CI: −3.92 to −2.78) (Figure 3a). In contrast, the annual mean MDA8 O3 concentration showed no significant monotonic trend (Sen’s slope = 0.20 μg·m−3·a−1); although a peak value of 113.6 μg·m−3 occurred in 2018, the overall trend remained statistically insignificant. The PM2.5 binning results (Figure 3b) revealed that the proportion of low-concentration days (<35 μg·m−3) increased from 14.7% in 2015 to 56.2% in 2025, while the proportion of high-concentration days (>75 μg·m−3) decreased from 41.3% to 10.7%.
Figure 3.
(a) Interannual trends in PM2.5 and MDA8 O3; (b) yearly proportions of PM2.5 by concentration bin (<35; 35–75; and >75 μg·m−3) during 2015–2025 in Puyang.
3.1.2. Analysis of Exceedance Days in Puyang During 2015–2025
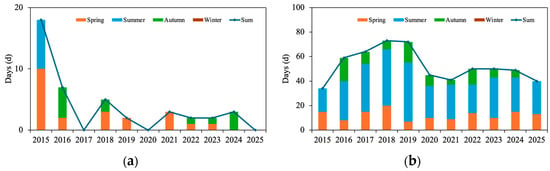
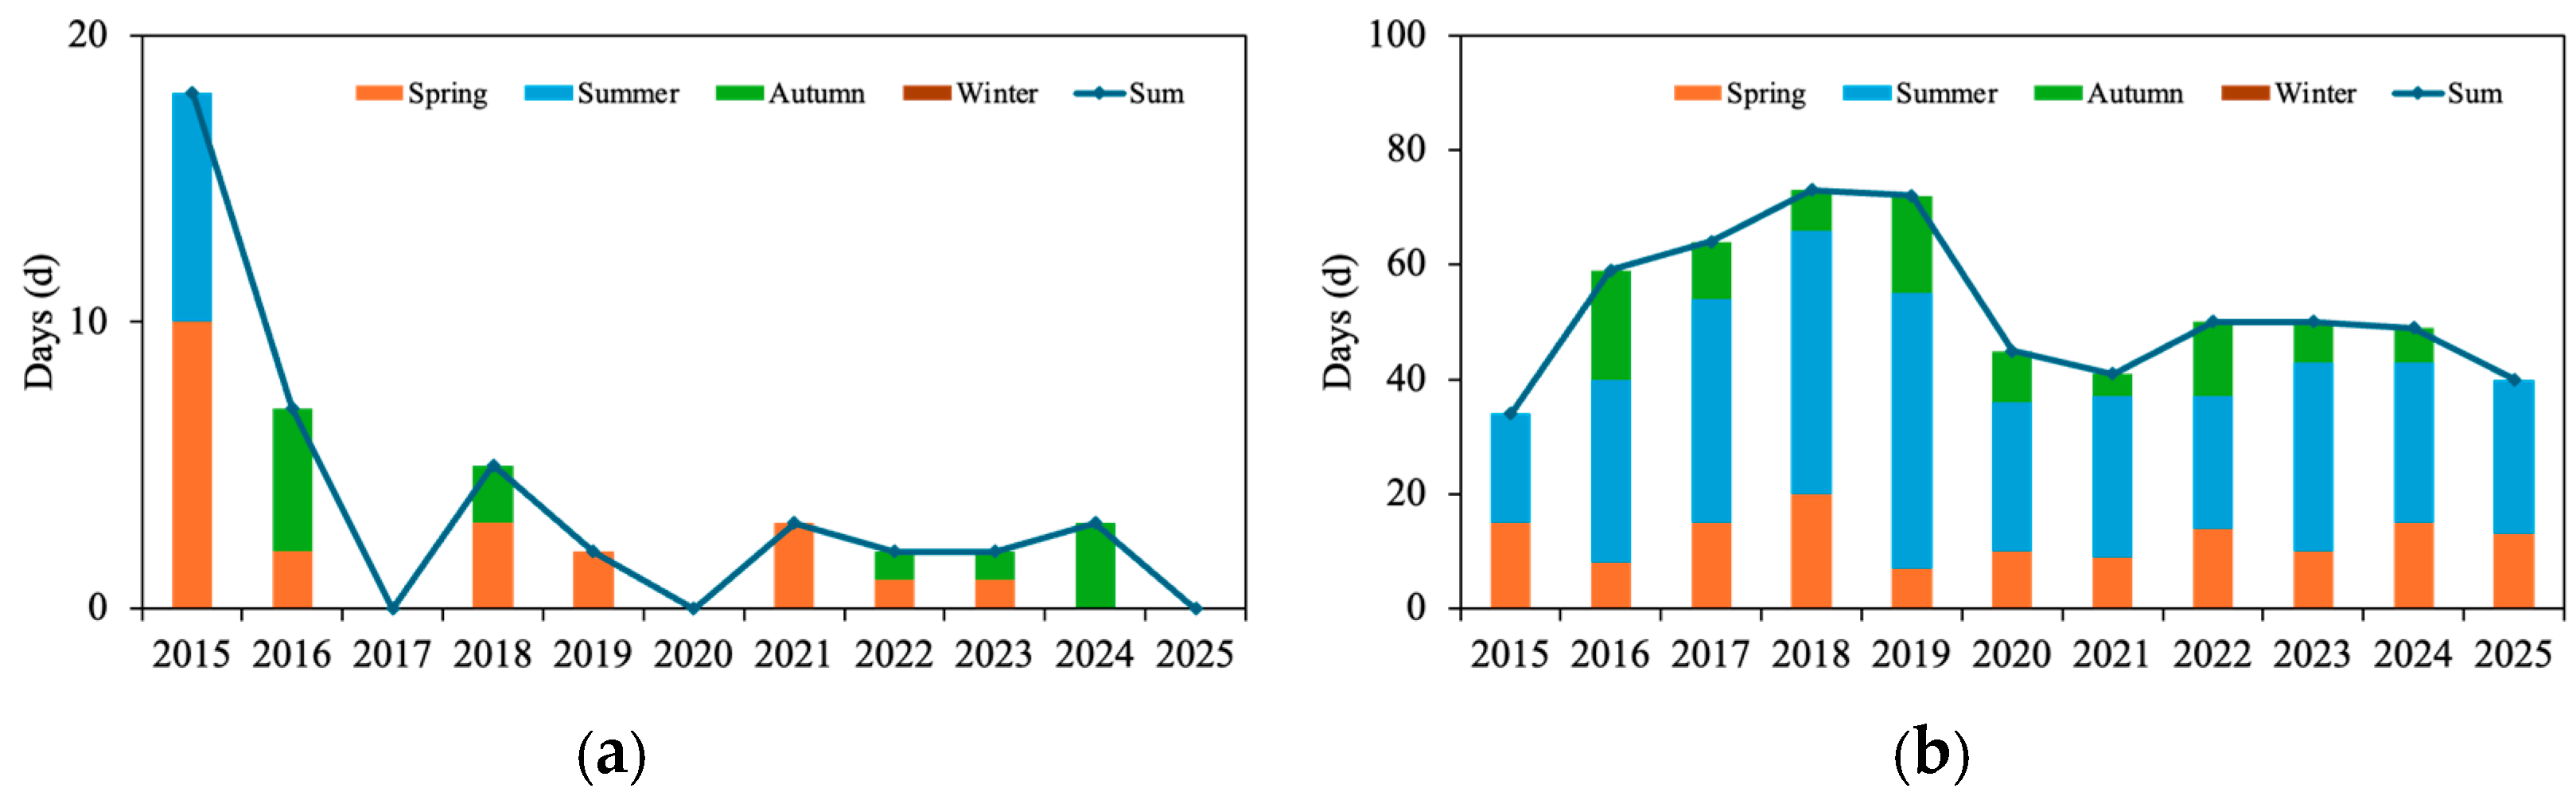
Atmospheric compound pollution features high levels of oxidants (e.g., O3) and PM2.5 [28]. The Ambient Air Quality Standards (GB 3095–2012) set limits for the PM2.5 daily mean and MDA8 O3 of 75 μg·m−3 and 160 μg·m−3, respectively. A dual-exceedance day is defined as a day when PM2.5 exceeds 75 μg·m−3 and MDA8 O3 exceeds 160 μg·m−3. The seasonal statistics of dual-exceedance days in Puyang from 2015 to 2025 are presented in Figure 4a. The highest number of dual-exceedance days occurred in 2015, reaching 18 days. During 2016–2025, the number of days showed a decreasing trend. This study found that dual-exceedance days occurred mainly in spring and summer in 2015, whereas in subsequent years they shifted to spring and autumn, with spring being the season most frequently affected by dual exceedance. Summer in northern China is hot and humid with strong atmospheric mixing, limiting PM2.5 accumulation [29,30], so dual-exceedance events were rare despite frequent MDA8 O3 exceedances from June to August.
Figure 4.
Statistical chart of PM2.5–MDA8 O3 dual-exceedance days (a) and MDA8 O3 exceedance days (b) in each quarter of Puyang during 2015–2025.
The statistics of MDA8 O3 exceedance days in Puyang from 2015 to 2025 are shown in Figure 4b. The results indicate that during 2015–2019, the number of MDA8 O3 exceedance days showed an overall upward trend, increasing from 34 days to over 70 days. Subsequently, during 2020–2021, the number of MDA8 O3 exceedance days was significantly lower than that in 2016–2019, which may be related to the impact of the COVID-19 pandemic—during which industrial production was restricted, outdoor human activities decreased, and vehicle exhaust emissions also declined [31]. In the years after 2020, the number of MDA8 O3 exceedance days remained above 40, occurring mainly in spring and summer; among these, summer exceedance days accounted for approximately 66.7% of the total annual exceedance days.
3.2. Analysis of Relationship Between PM2.5 and MDA8 O3
3.2.1. Concentration-Stratified of the PM2.5–MDA8 O3 Relationship
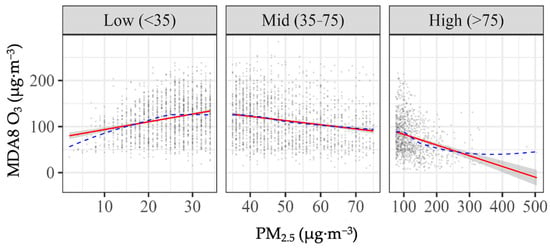
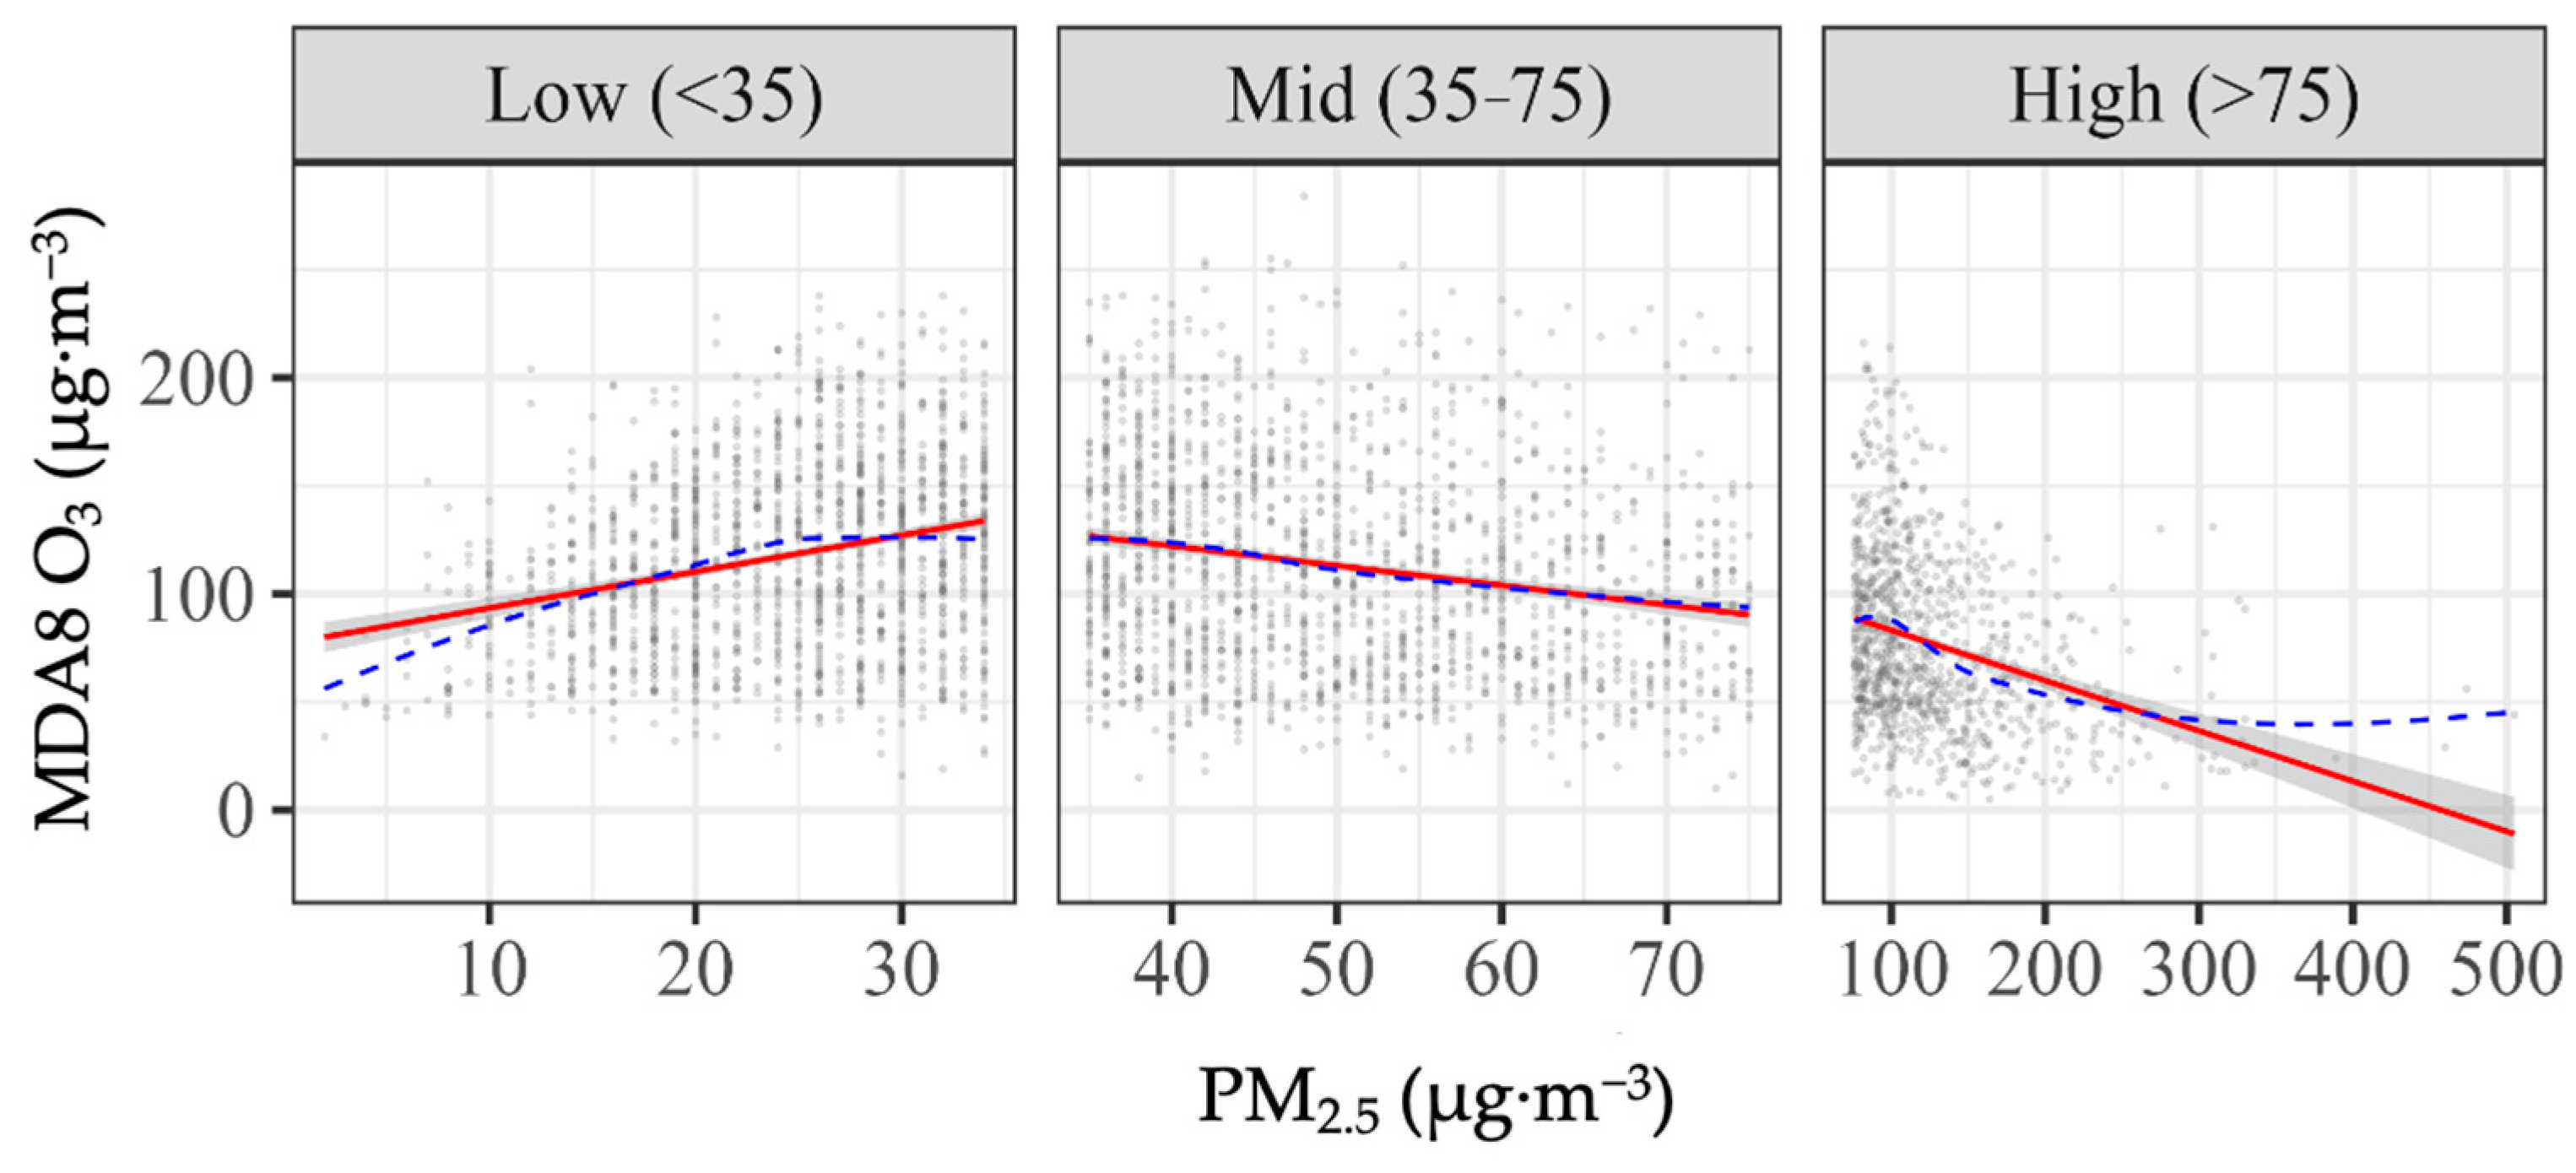
The correlation between PM2.5 and MDA8 O3 exhibited a significant concentration-stratified reversal across concentration intervals (Figure 5): a significant positive correlation in the low-concentration segment (<35 μg·m−3; r = 0.271, 95% CI: 0.223–0.318, n = 1477; Table S2), a negative correlation in the mid-concentration segment (35–75 μg·m−3; r = −0.208, 95% CI: −0.254 to −0.160, n = 1579; Table S2), and a further strengthened negative correlation in the high-concentration segment (>75 μg·m−3; r = −0.313, 95% CI: −0.369 to −0.255, n = 955; Table S2). Fisher z tests showed that all pairwise differences among the three intervals were statistically significant (Low vs. Mid: z = 13.49; Low vs. High: z = 14.48; Mid vs. High: z = 2.76, all p < 0.01), and Spearman correlation yielded results consistent with Pearson correlation, indicating that the concentration-stratified reversal pattern is robust to distributional assumptions. The same-direction variation in the low-concentration segment may reflect shared emission sources or synergistic meteorological effects, whereas the inverse variation in the high-concentration segment raises the question of whether photochemical O3 formation is suppressed by aerosol-induced reduction in radiation; this possibility, however, requires further testing after controlling for meteorological and precursor confounding, as addressed in Section 3.3.
Figure 5.
Relationship of PM2.5 and MDA8 O3 in different concentration intervals (red solid line: linear fit; blue dashed line: loess fit).
3.2.2. Modulation of the PM2.5–MDA8 O3 Relationship by Meteorological Conditions
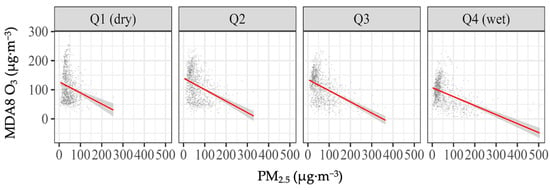
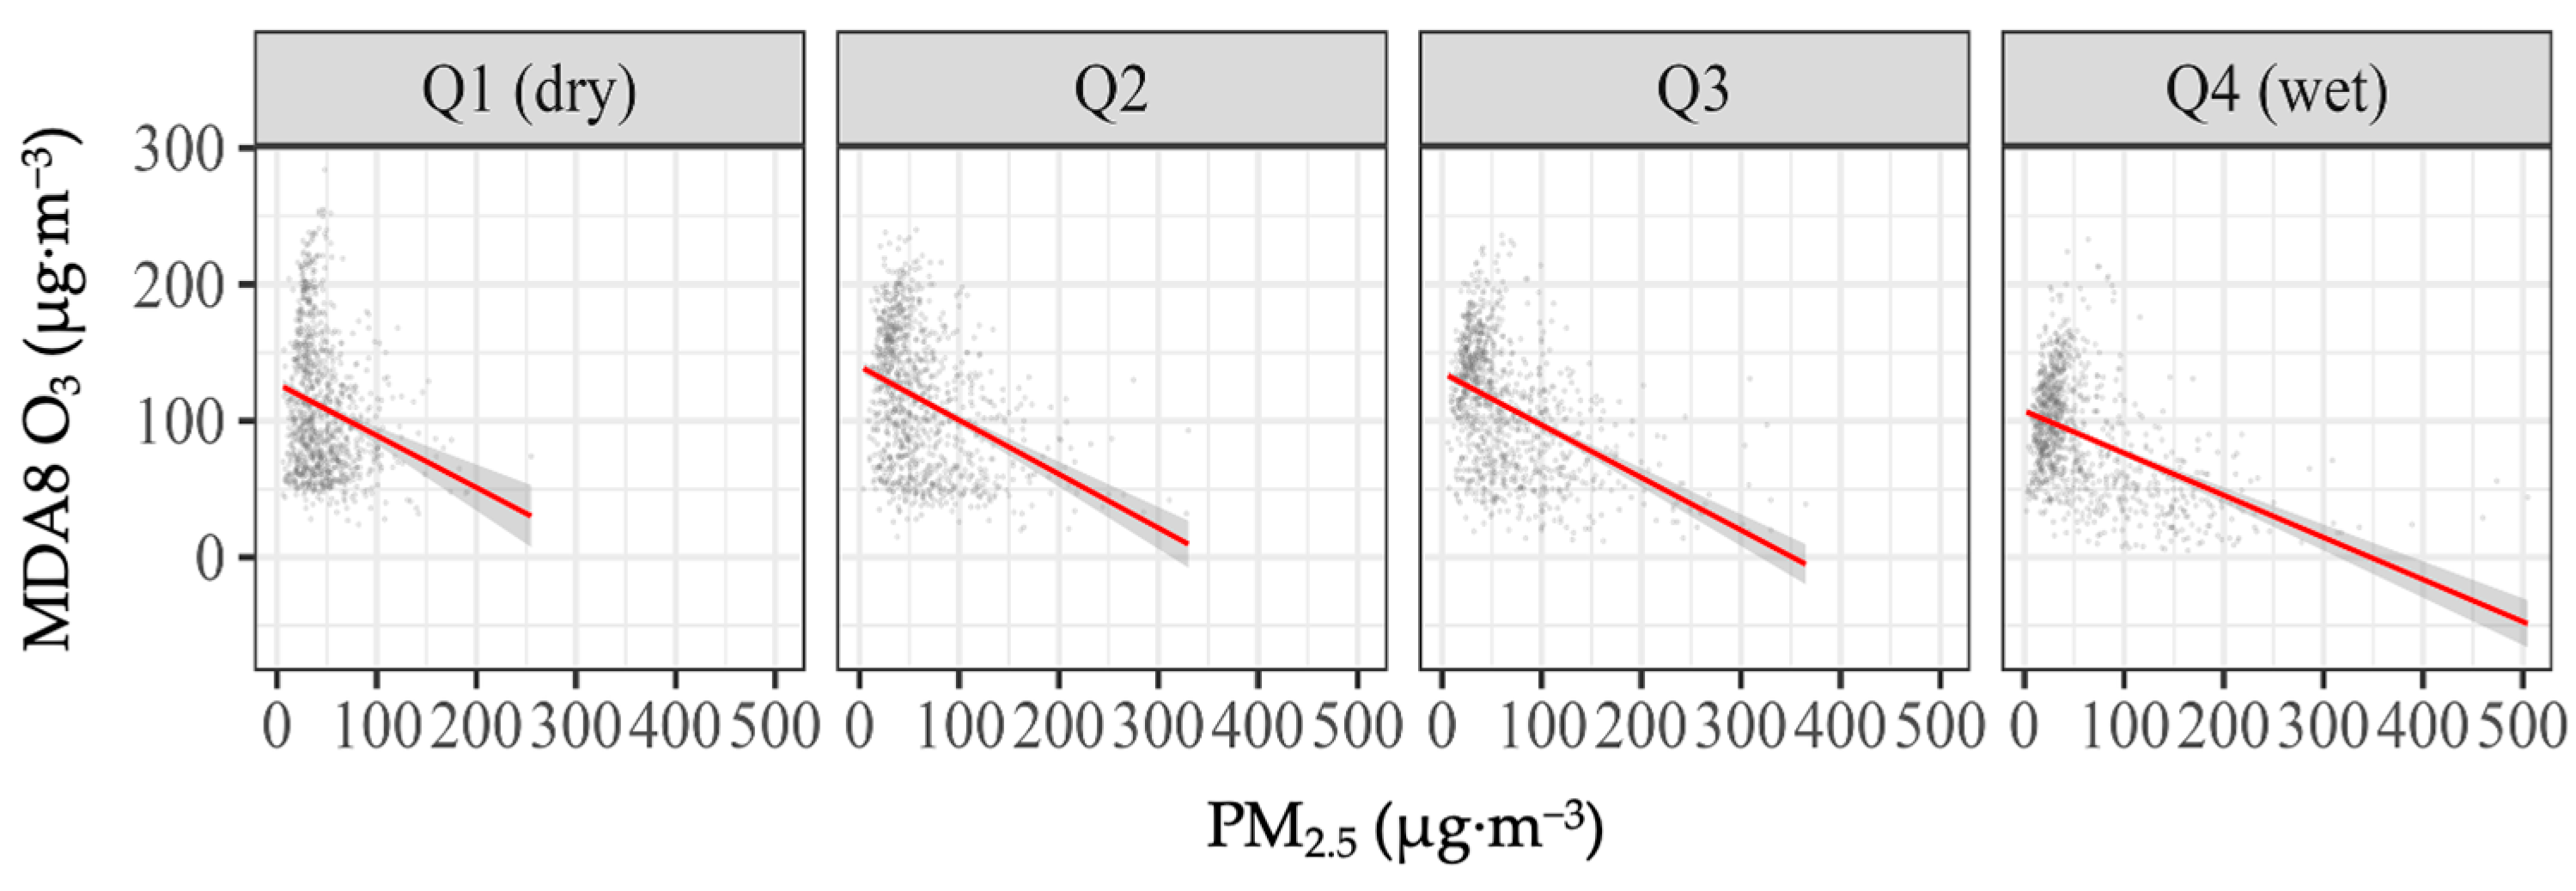
To identify the meteorological drivers of the concentration-stratified reversal, stratified correlation analyses were conducted for temperature, humidity, wind speed, and radiation (Table S3). The results showed that humidity was the strongest single modulating factor. On high-humidity days (>median), the PM2.5– MDA8 O3 correlation was r = −0.413, compared with r = −0.275 on low-humidity days. Further stratification by humidity quartile—dividing all samples into four equal-frequency groups according to relative humidity from low to high, with Q1 being the driest 25% (RH ≤ 25th percentile), Q2 and Q3 corresponding to the 25th–50th and 50th–75th percentiles, respectively, and Q4 being the wettest 25% (RH > 75th percentile), each group containing approximately equal numbers of samples—showed that the correlation coefficient varied monotonically from −0.214 in Q1 (dry) to −0.445 in Q4 (wet). The quartile scatter plots show that the fitted slopes were negative in all four quartiles and became steeper with increasing humidity: the fitted line in Q1 declined from approximately 120 to 30 (slope ≈ −0.4), whereas in Q4 it declined from approximately 100 to −30 (slope ≈ −0.7), and the dense region of the scatter cloud shifted toward lower MDA8 O3 with increasing humidity. However, the partial correlation after controlling for temperature, wind speed, and radiation was only r = 0.029 (p = 0.066), and the partial correlations within each humidity quartile were all below 0.08 (Table S4). This indicates that the strong correlations observed in the stratified analyses were mainly driven by the co-variation in meteorological conditions rather than by direct coupling between PM2.5 and MDA8 O3; whether humidity acts as a conditional modulating factor is examined in Section 3.4 using a GAM with an interaction term.
3.3. GAM Modeling and Nonlinear Effects
3.3.1. Model Comparison Across the Five GAMs
To characterize the nonlinear features of the PM2.5–MDA8 O3 relationship and the role of meteorological modulation, five progressively nested GAMs were constructed (Table S5). As shown in Table S5, from m1 to m5, the deviance explained increased monotonically from 16.6% to 78.7%, while the AIC decreased monotonically from 41,740 to 36,361. The AIC dropped by approximately 5028 from m1 to m2, indicating that meteorological conditions are the primary driver of MDA8 O3; it dropped by a further 284 from m2 to m3, with the deviance explained rising from 76.5% to 78.2%, indicating that NO2 carries non-negligible information for the PM2.5–MDA8 O3 relationship. The AIC reductions from m3 to m4 and m5 were smaller (approximately 24 and 43), indicating that the interaction terms provided limited but directionally consistent gains. In m3, the edf of s(PM2.5) was 5.90 (F = 32.4, p < 1 × 10⁻⁴), well above 1, indicating that the effect of PM2.5 on MDA8 O3 is significantly nonlinear, consistent with the concentration-stratified reversal reported in Section 3.2.1.
3.3.2. Conditional Partial Effect After Controlling for Meteorology and NO2 (m3)
m3 added s(NO2) on the basis of m2, yielding the conditional partial effect of PM2.5 on MDA8 O3, and served as the main model of this study. Compared with m2, m3 reduced the AIC by approximately 284 and increased the deviance explained from 76.5% to 78.2% (adjusted R2 = 0.780), confirming that NO2 carries non-negligible information for the PM2.5–MDA8 O3 relationship.
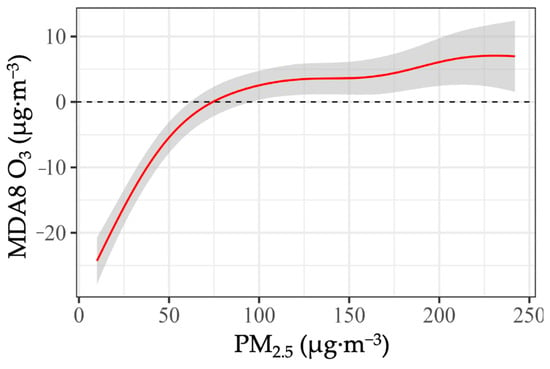
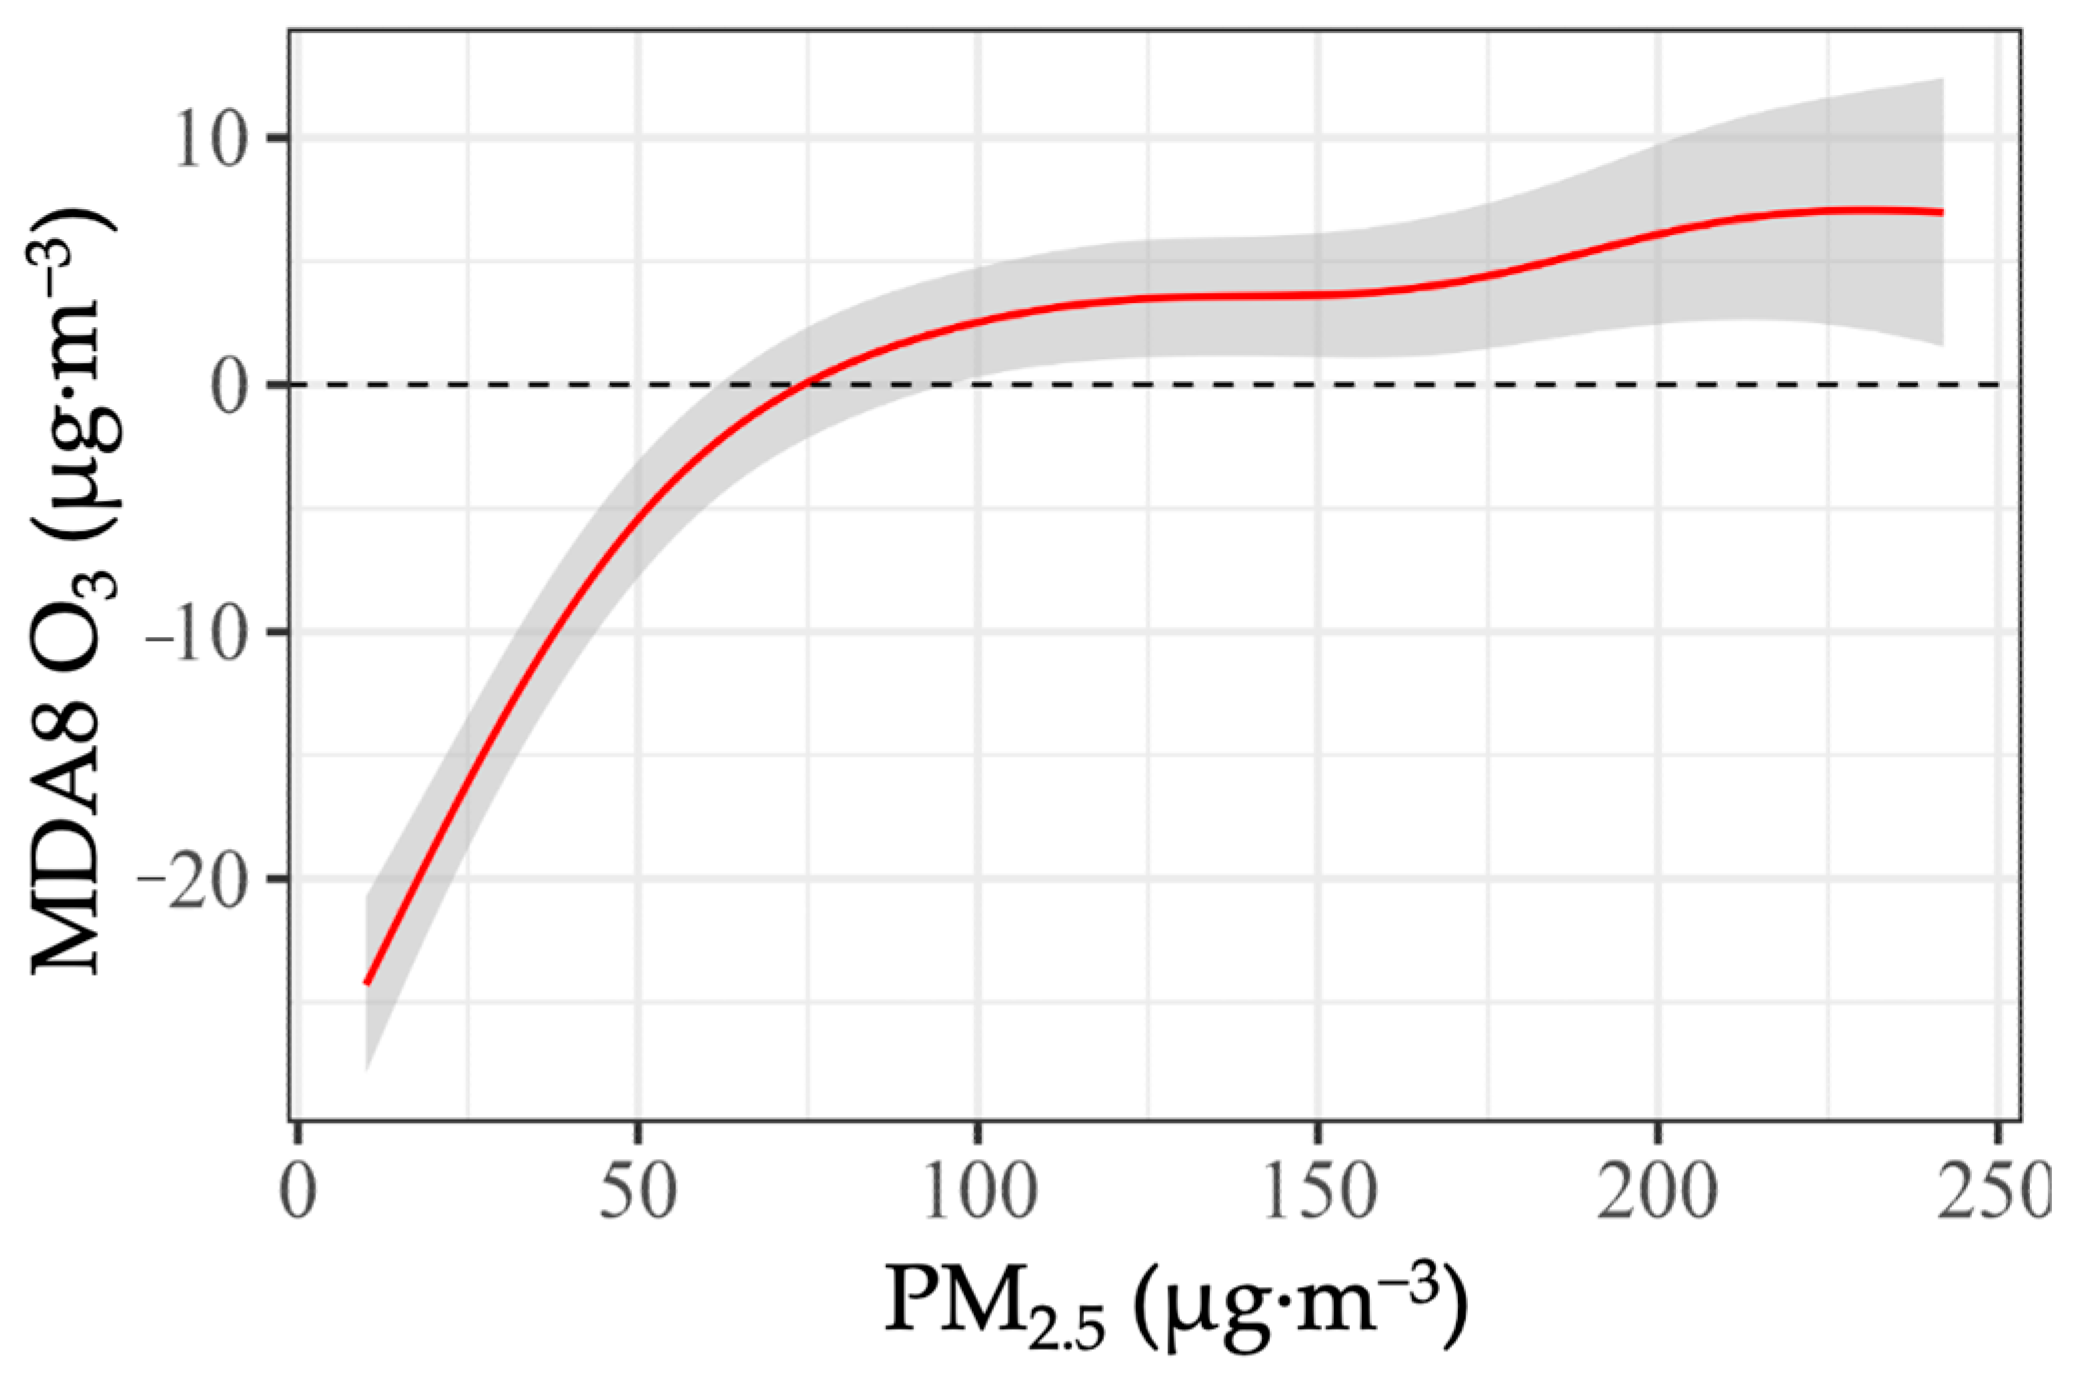
As shown in Figure 6, after controlling for temperature, humidity, wind speed, radiation, pressure, wind direction and NO2, the conditional partial effect of PM2.5 exhibited a nonlinear form that rose over most of the PM2.5 range and then leveled off: approximately −24 at PM2.5 ≈ 20 μg·m−3, approximately −8 at ≈ 50 μg·m−3, approximately 0 at ≈ 74 μg·m−3, approximately 2 at ≈ 100 μg·m−3, approximately 4–5 at ≈ 150–200 μg·m−3, and approximately 7 at ≈ 240. These values are the centered smooth values, not the marginal effect; the curve increased over most of the observed range and then levelled off.
Figure 6.
Conditional partial effect of PM2.5 on MDA8 O3 in the main model (m3). The shaded region indicates the 95% confidence band.
The difference between the conditional partial effect and the uncontrolled correlation is important. Without controls, PM2.5 and MDA8 O3 were negatively correlated in the high-concentration segment (Figure 5). After controlling for meteorology and NO2, this negative association largely disappeared, indicating that it was mainly driven by the co-variation in meteorological conditions rather than by a direct coupling between the two pollutants. The remaining positive conditional association may arise from two pathways: first, PM2.5 and the precursors of O3 (NOx, VOC) share common sources, so that elevated PM2.5 often coincides with elevated precursors, which in NOx-limited regimes can promote O3 formation; second, if the elevated PM2.5 is dominated by scattering aerosols, it may enhance diffuse radiation reaching the surface and thus promote O3 formation. These two pathways cannot be distinguished within the data structure of this study, but the result alone is sufficient to show that the conditional partial effect of PM2.5 on O3 is not a monotonic suppression, but a nonlinear relationship that varies across concentration intervals.
This finding has policy implications. Because the conditional partial effect of PM2.5 on O3 is not constant across the PM2.5 range, coordinated control strategies for PM2.5 and O3 should be designed by concentration interval rather than as a single-direction linear reduction. In the low-concentration range, the partial effect is weaker, and reducing PM2.5 may not lead to a proportional reduction in O3; in the high-concentration range, the partial effect is stronger and more stable, so reducing PM2.5 is more likely to be accompanied by a reduction in O3.
3.4. Modulating Effect Tests and Temporal Evolution
3.4.1. Humidity Modulation (m4)
Although the linear partial correlation was small (Section 3.2.2), the nonlinear tensor-product term reveals a significant conditional modulation. After controlling for temperature, RH main effect, wind speed, radiation, pressure, wind direction, and NO2, the tensor-product interaction term between PM2.5 and relative humidity, ti(PM2.5, RH), was significant (edf = 5.67, F = 4.10, p < 0.001), indicating a significant conditional modulation of relative humidity on the PM2.5–O3 relationship. This is consistent in direction with the stratified analysis, in which the fitted slopes across the four RH quartiles were all negative and became monotonically steeper with increasing humidity (approximately −0.4 in Q1 and −0.7 in Q4), with the dense region of the scatter cloud shifting toward lower O3 as humidity increased (as shown in Figure 7). Notably, the edf of ti(PM25, RH) (5.67) is well above 1, indicating that the modulation itself is nonlinear rather than a simple “higher humidity, stronger negative effect.” This is consistent with the nonlinear response of O3 to relative humidity observed at the national scale, where the O3–8 h relationship with RH is non-monotonic, peaking at RH ≈ 55% and then declining as humidity increases further [32]. Mechanistically, elevated humidity substantially increases aerosol liquid water, providing a reaction interface for NO2 heterogeneous reactions—in summer observations in Jinan, the heterogeneous pathway contributed approximately 60.9% of nitrate formation, and this process was closely related to O3 enhancement and aerosol liquid water content [33]. Meanwhile, high humidity promotes nitrate photolysis and N2O5 hydrolysis, altering the partitioning of O3 precursors, and heterogeneous N2O5 hydrolysis has been shown to reduce surface O3 by 10–20 ppbv in polluted regions [34]. In addition, high humidity enhances aerosol extinction and weakens shortwave radiation reaching the surface—summer observations in Beijing showed that the aerosol photolysis effect can reduce the net O3 production rate by up to 25% [35]—and accelerates wet deposition of O3 and its precursors. These pathways act in the same direction and jointly strengthen the negative PM2.5–O3 coupling. The partial correlations within each humidity quartile were all small (−0.064 to 0.073), but this does not contradict the GAM result: partial correlation captures only linear association, whereas the humidity modulation is nonlinear, and linear partial correlation averages out the differing relationship shapes across the quartiles, which only the GAM interaction term can resolve. Therefore, the significant PM2.5 × RH interaction indicates that humidity should be treated as an important conditional modulator of the PM2.5–O3 relationship, rather than merely an apparent factor arising from meteorological co-variation.
Figure 7.
Scatter plots and fitted lines for PM2.5-MDA8 O3 by relative humidity quartile.
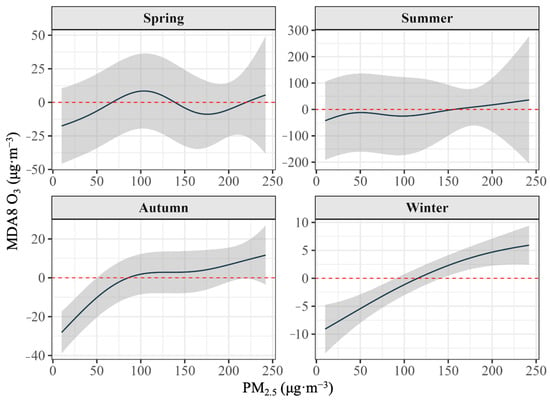
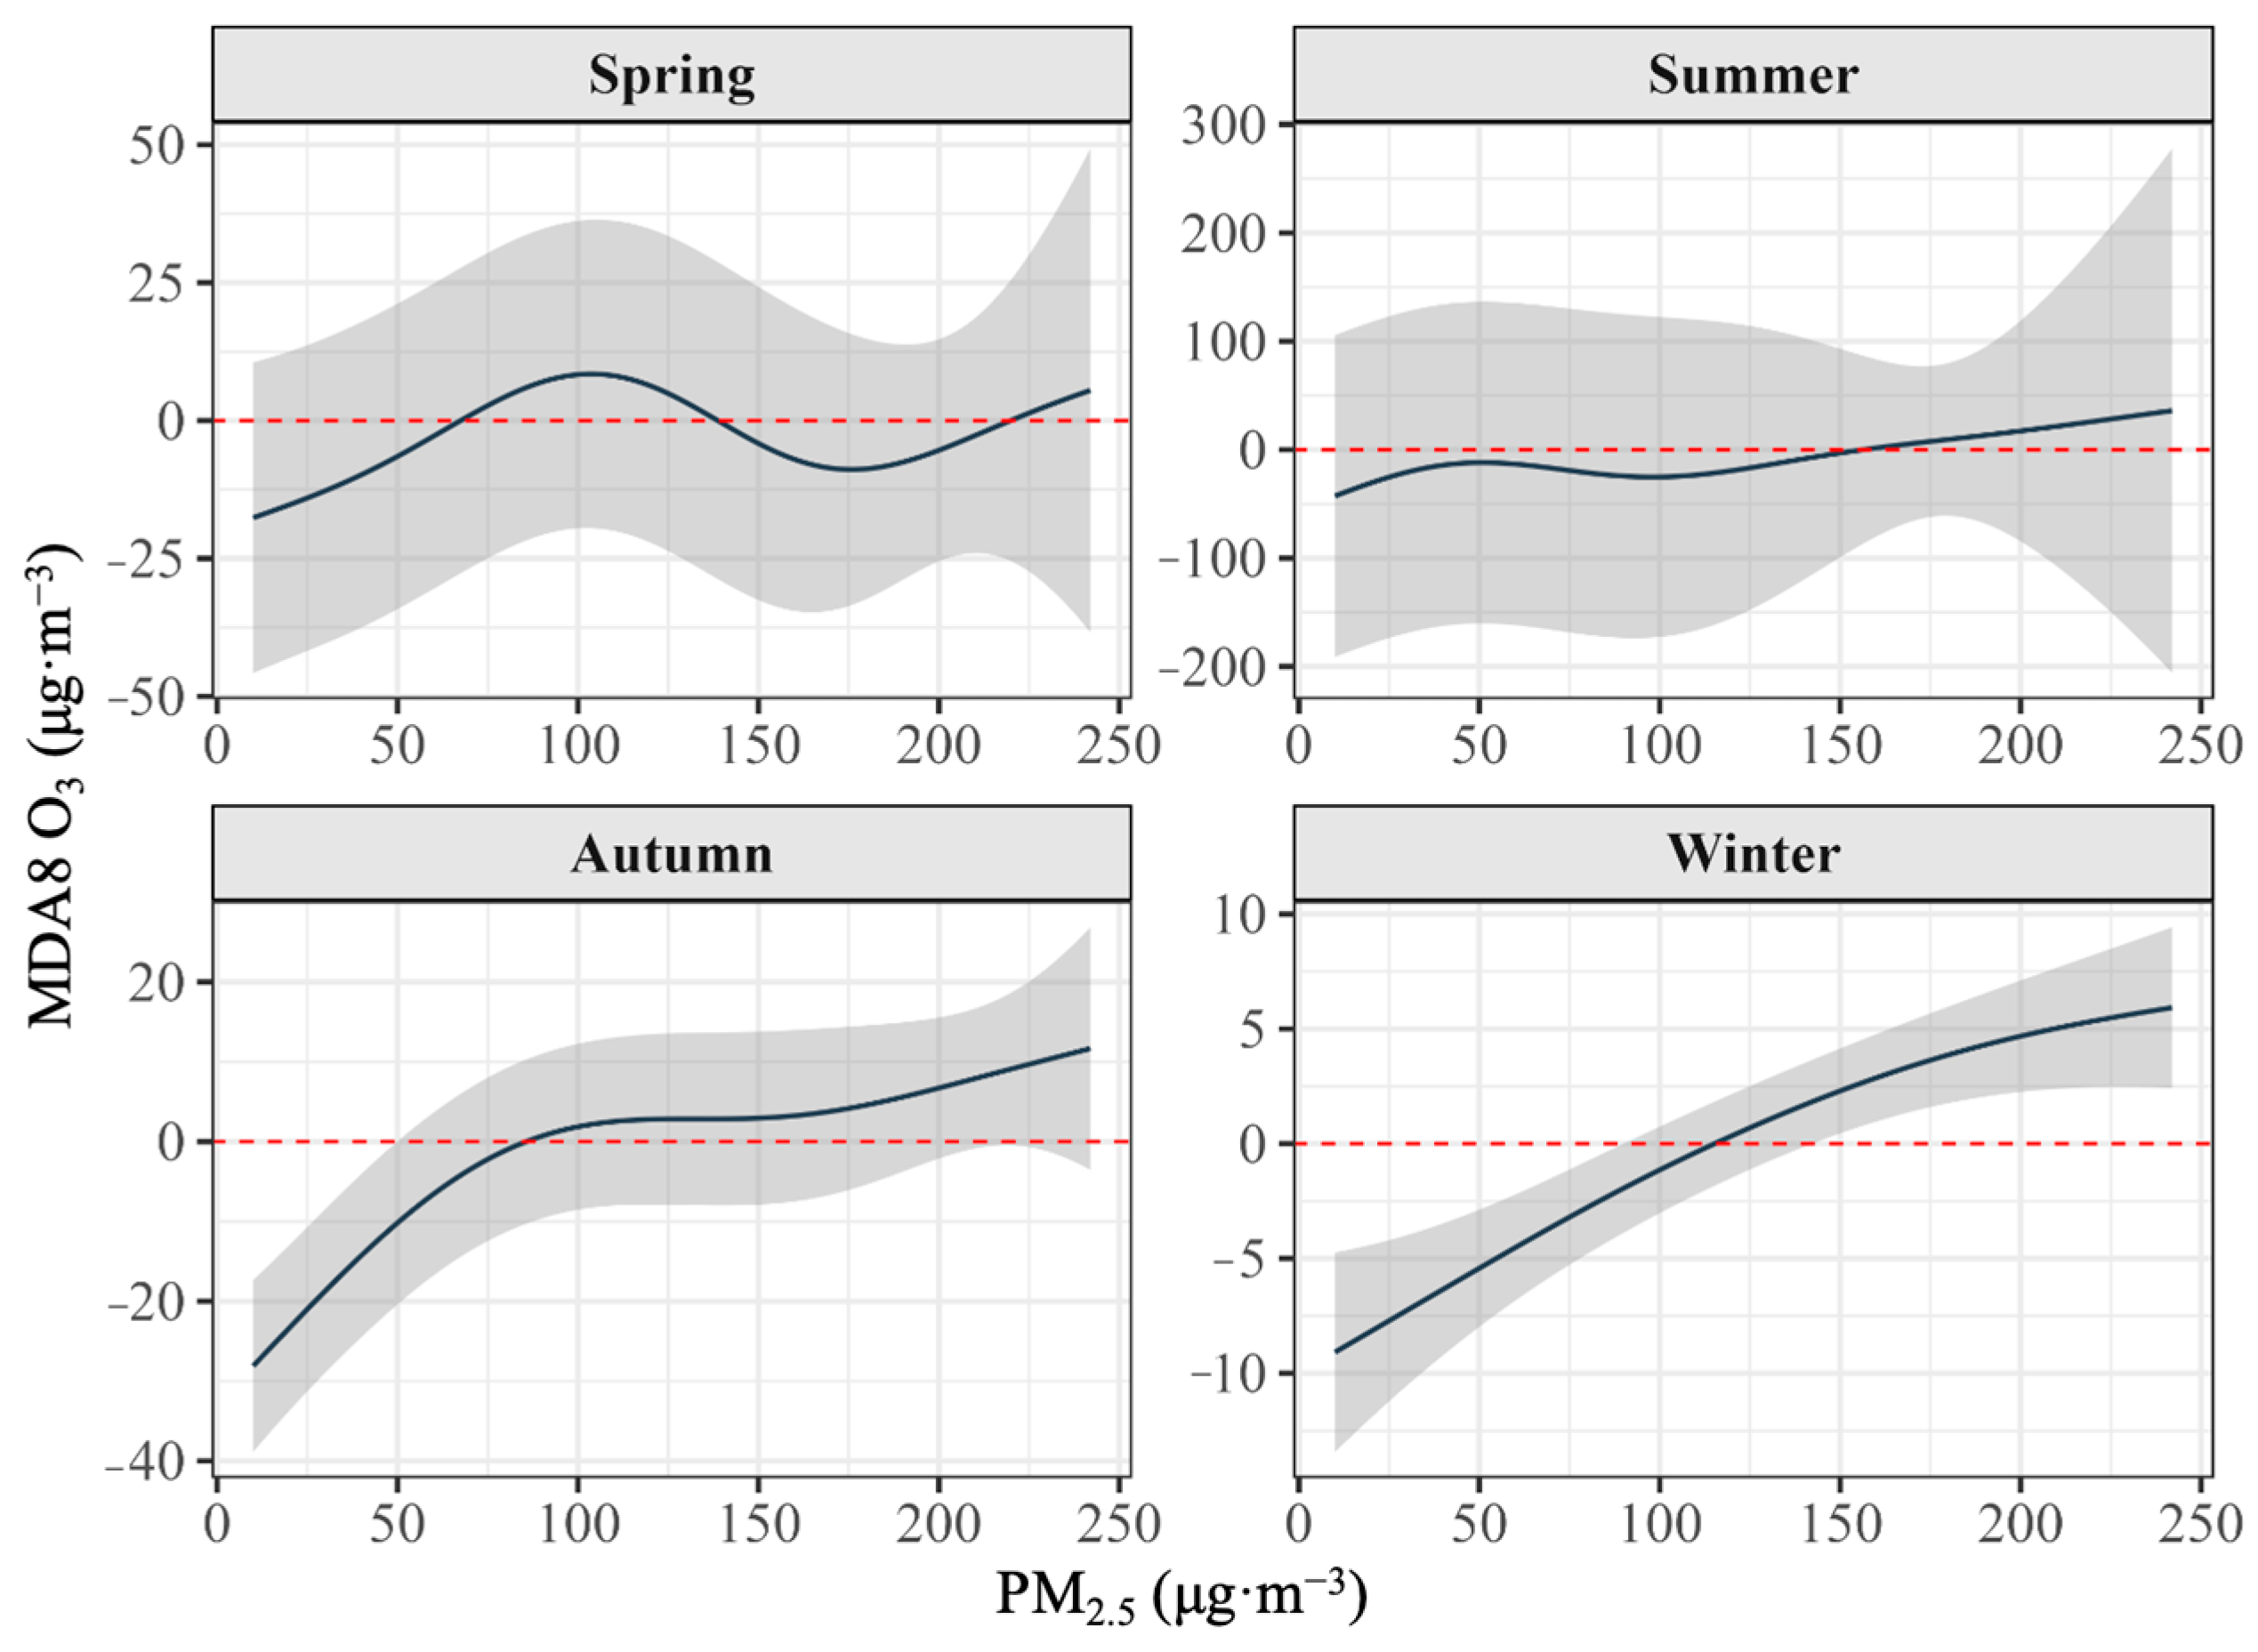
3.4.2. Seasonal Modulation (m5)
Figure 8 presents the m5 model—the season-specific PM2.5 partial effect curves after adding the factor–smooth interaction term between PM2.5 and season, s(PM2.5, by = Season), together with the season main effect to the main model. This analysis was conducted because the uncontrolled seasonal correlations differed substantially (summer 0.27, winter −0.24), and it was necessary to test whether this difference arose from seasonal changes in the PM2.5 partial effect itself or merely from differences in meteorological conditions among seasons; the factor–smooth interaction term allows each season to have its own PM2.5 smooth curve, thereby enabling direct comparison of the partial effect shapes across seasons. In the figure, the four curves largely overlap, all exhibiting a rise followed by a slight decline, with a peak at PM2.5 ≈ 130–150 μg·m−3 (approximately 2), endpoints at approximately −3 and 0, only winter being slightly higher, and the four confidence bands largely overlapping.
Figure 8.
Season-specific conditional partial effect curves of PM2.5 based on the main model.
Statistically, the seasonal interaction as a whole was significant when m5 was compared with m3 (F = 6.92, p = 1.72 × 10⁻¹³; Table S5), indicating that allowing season-specific PM2.5 improves the model. Within m5, the autumn term was highly significant (s(PM2.5): Season Autumn, F = 13.13, p < 0.001), whereas the spring, summer, and winter terms were not (p = 0.911, 0.744, and 0.200, respectively). A direct comparison of autumn with the other three seasons combined gave a significant difference in the smooth term (edf = 1.00, F = 7.69, p = 0.0056), with the difference concentrated in the low-PM2.5 range. This indicates that the seasonal modulating effect is concentrated in autumn rather than uniformly present across all seasons; the apparent seasonal differences in the other three seasons are largely attributable to inter-seasonal differences in meteorological conditions—the high temperature and strong radiation of summer and the stagnant, humid conditions of winter shape the co-variation direction in the two seasons, respectively—rather than the PM2.5 partial effect itself changing with season. Given that the four seasonal confidence bands in Figure 8 largely overlap, the seasonal curves should be compared with caution. Together with the humidity result, these findings indicate that the apparent meteorological dependence of the PM2.5–MDA8 O3 relationship is not uniformly a co-variation artifact: humidity exerts a significant conditional modulation, whereas seasonal modulation is concentrated in autumn.
3.4.3. Modulating Effects and Temporal Evolution
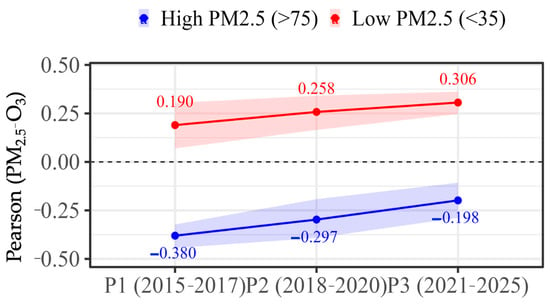
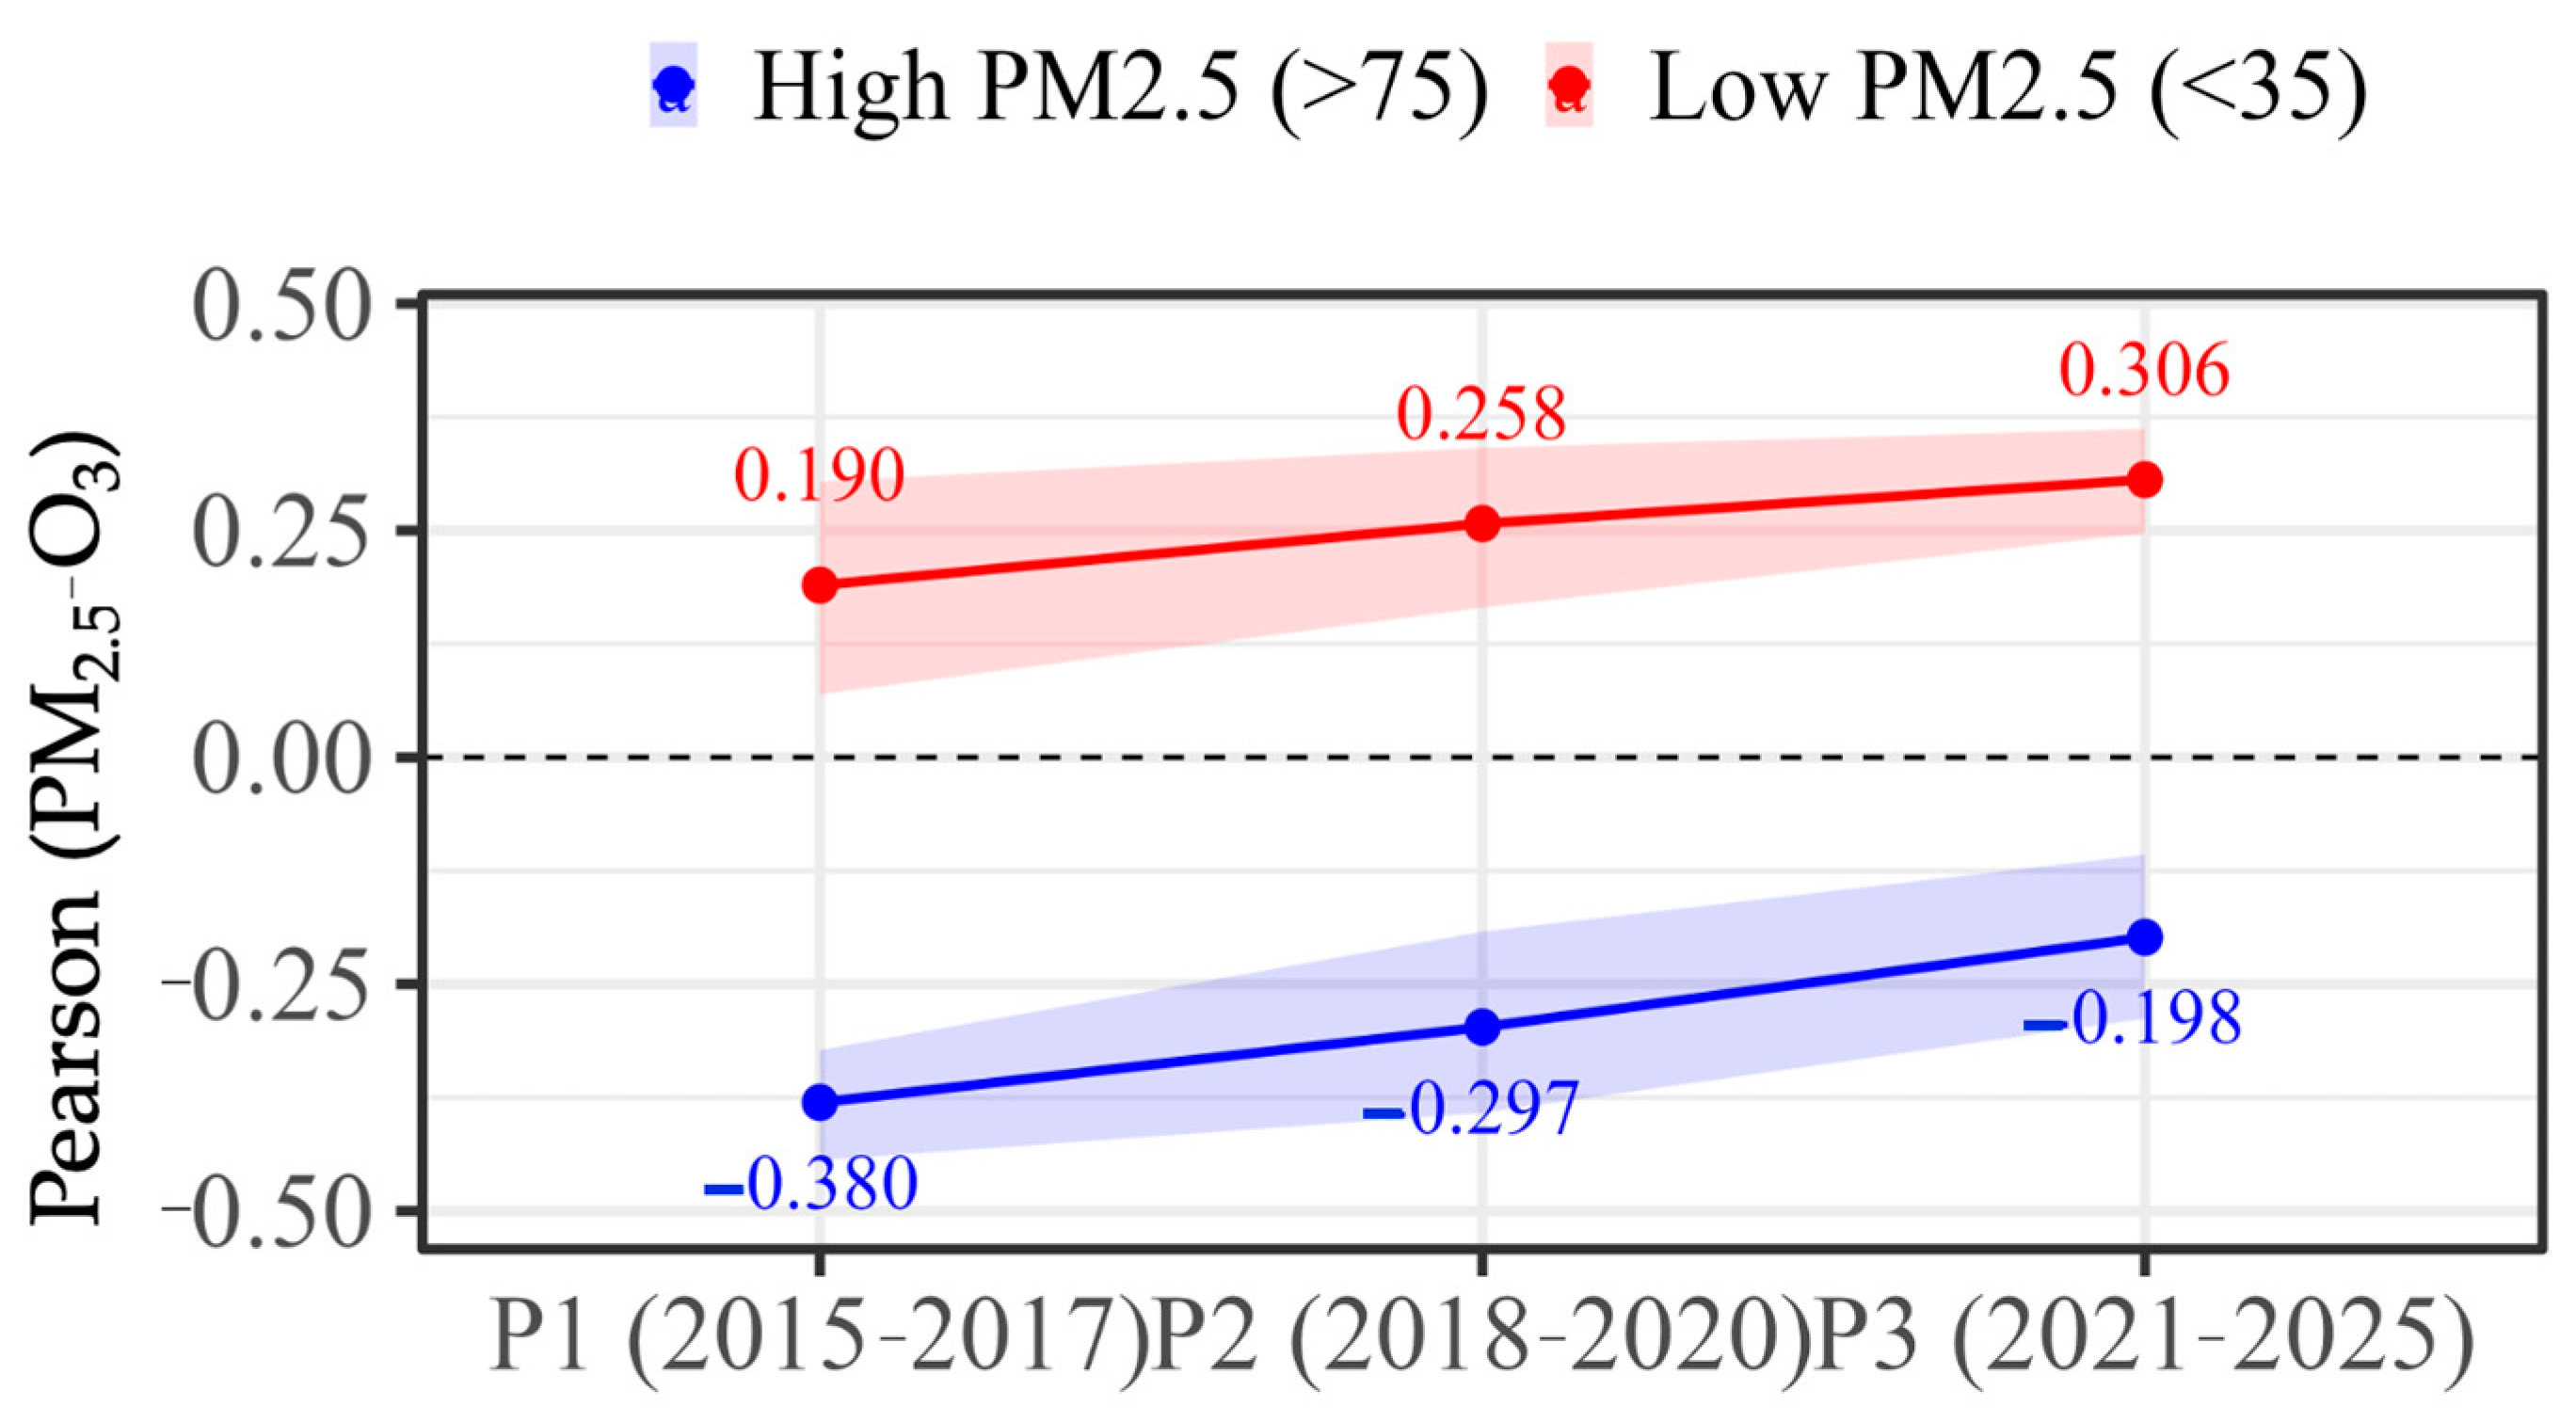
After dividing 2015–2025 into three periods—P1 (2015–2017), P2 (2018–2020), and P3 (2021–2025)—the correlation between PM2.5 and MDA8 O3 exhibited opposite temporal trends in the two extreme concentration segments (as shown in Figure 9). In the low-PM2.5 segment (<35 μg·m−3), the correlation coefficient rose monotonically from 0.190 in P1 to 0.306 in P3; in the high-PM2.5 segment (>75 μg·m−3), it rose monotonically from −0.380 in P1 to −0.198 in P3; and in the mid-concentration segment, it changed from −0.138 to −0.235. The weakening in the high-concentration segment was statistically robust: Fisher z tests showed a significant difference between P1 and P3 (p = 0.010), and the bootstrap 95% CIs did not overlap (P1: [−0.444, −0.323]; P3: [−0.288, −0.107]). The strengthening in the low-concentration segment was only marginally significant (p = 0.091), with partially overlapping bootstrap CIs. The negative correlation in the high-concentration segment weakened by 0.182, while the positive correlation in the low-concentration segment strengthened by 0.116, and the gap between the two curves narrowed from 0.570 to 0.504. The segmented regression identified breakpoints at 32.06, 25.39, and 23.00 μg·m−3 in P1, P2, and P3, respectively (Table S8). These values are slope-change points of the PM2.5–O3 relationship and are not equivalent to the zero-crossing of a centered GAM smooth, which represents the point at which the centered contribution of the term equals the model reference level and does not by itself identify a change in the sign of the marginal effect (Section 3.3.2). Because the two quantities describe different features of the relationship, we do not interpret either as a physical or regulatory threshold; the asymmetric temporal evolution of the period-specific correlations is therefore taken as the main conclusion, with the period-specific correlations and bootstrap confidence intervals reported in Table S7 and the breakpoint estimates reported in Table S8.
Figure 9.
Asymmetric temporal evolution of the PM2.5–MDA8 O3 coupling.
This asymmetric evolution indicates that the PM2.5–MDA8 O3 association has been redistributed rather than simply disappearing during the clean-air transition: the previously observed negative association in the high-concentration range weakened as extreme pollution events declined, whereas in the low-concentration range the two pollutants tended to move in the same direction, possibly owing to shared precursors or synergistic secondary formation. This finding has implications for coordinated control strategies. In the high-concentration range, the observational results suggest that continued PM2.5 reduction may be accompanied by a reduction in MDA8 O3; in the low-concentration range, however, reducing PM2.5 and MDA8 O3 may no longer move in the same direction, suggesting that precursor-ratio-oriented regulation may deserve more attention. These implications are based on conditional associations and should be interpreted with caution.
4. Discussion
The concentration-stratified reversal of the PM2.5–MDA8 O3 relationship and its meteorological modulation revealed in this study, when compared with existing studies in other cities of the North China Plain and the “2 + 26” region, show a coexistence of regional commonality and local specificity across several key dimensions.
Spatial heterogeneity of the PM2.5–MDA8 O3 coupling. This study observed that, without controls, PM2.5 and MDA8 O3 were negatively correlated in the high-concentration segment (r = −0.313; Table S2), whereas after controlling for meteorology and NO2, this negative association largely disappeared. In the “2 + 26” cities during 2015–2021, the summer PM2.5–MDA8 O3 correlation reached as high as 0.52, while winter showed a strong negative correlation [36], consistent in direction with our summer r = 0.27 and winter r = −0.24. However, most of these studies remained at the level of uncontrolled correlations. Our study further shows that the summer positive correlation mainly arises from enhanced photochemical activity and synergistic secondary aerosol formation under high temperature and strong radiation, rather than from a direct promotion of O3 by PM2.5. This distinction is consistent with recent mechanistic understanding of the “see-saw” effect—a ~40% decline in summer PM2.5 over the North China Plain reduced the heterogeneous uptake of HO2 radicals by aerosols, thereby intensifying O3 formation [11]; between 2013 and 2019, NOx emissions decreased by ~38% while NMVOC decreased by only ~11%, and this imbalance in precursor ratios is regarded as the most important cause of rising O3 [37]. Therefore, judgments of “synergy” or “antagonism” based on raw correlation coefficients may overestimate the true coupling strength between the two pollutants.
Regional comparison of meteorological modulation. Humidity, the most significant conditional modulating factor in this study (ti(PM25, RH), p < 0.001), acts in a direction consistent with existing findings in the Beijing–Tianjin–Hebei region [36]. Research on heterogeneous HONO sources in the North China Plain during autumn shows that nitrate photolysis can contribute 30–50% of near-surface O3 enhancement during haze episodes [38], and high humidity favors increased aerosol liquid water and heterogeneous reactions, providing chemical-level support for our finding that “high humidity strengthens the negative PM2.5–MDA8 O3 coupling.” An analysis of PM2.5–MDA8 O3 compound pollution in Zibo from 2017 to 2024 also showed that summer compound pollution days in this industrial city of the North China Plain can reach 46.7% of the annual total, with reactive OVOCs and alkenes being the key precursors driving compound pollution [39]. In contrast, the modulating effects of radiation and temperature in this study were relatively weak or directionally unstable, suggesting that at the daily urban scale, the chemical mediation of humidity may be more direct than the physical drivers of temperature and radiation.
Temporal evolution and the coordinated shift in photochemical regime. The strengthening of the positive correlation in the low-PM2.5 group (P1: 0.190 → P3: 0.306) and the weakening of the negative correlation in the high-PM2.5 group (−0.380 → −0.198) observed in this study are consistent with the long-term evolution of the MDA8 O3 chemical regime in the North China Plain. Coordinated observations across 37 cities in the North China Plain indicate that the urban O3 formation regime has shifted from VOC-limited in the 2010s to VOC–NOx co-limited in the 2020s [40]; analyses based on 2014–2019 observations further show that the turning point of the NOx–VOC control regime occurred around 2019 [41]. Our period-specific results are consistent with this phase pattern: as NOx continues to decline while VOCs change only modestly, urban O3 formation may shift toward the transition regime, altering the formation efficiency of secondary PM2.5 components and thereby reshaping the co-variation direction of PM2.5–MDA8 O3. The compound pollution evolution in the Yangtze River Delta from 2015 to 2023 likewise shows a 38.31% decline in PM2.5 alongside an 11.15% rise in MDA8 O3 [42], indicating that the reshaping of the PM2.5–MDA8 O3 coupling by imbalanced precursor ratios is widespread at the regional scale. The strengthening positive correlation in the low-concentration group suggests that the simplified policy logic of “reducing PM2.5 means reducing O3 simultaneously” may no longer hold in the low-concentration range, and that coordinated control strategies need to incorporate refined design by concentration interval [43].
5. Conclusions
Based on daily observations in Puyang from 2015 to 2025, this study employed progressively nested generalized additive models to systematically examine the nonlinear relationship between PM2.5 and MDA8 O3 and its meteorological modulation. After controlling for meteorology and NO2, the conditional partial effect of PM2.5 on MDA8 O3 increased over most of the PM2.5 range, whereas the negative correlation in the high-concentration segment without controls largely disappeared after controlling for meteorology. Humidity was a significant conditional modulating factor, whereas seasonal modulation was concentrated in autumn and was not significant in the other three seasons. Period-specific analyses revealed an asymmetric temporal evolution: the positive correlation in the low-concentration segment showed a suggestive increase from 0.190 (P1) to 0.306 (P3), while the negative correlation in the high-concentration segment weakened from −0.380 to −0.198, consistent with a shift in photochemical regime under imbalanced precursor reductions. Coordinated control of PM2.5 and MDA8 O3 may need to be designed by concentration interval. In the high-concentration range, the conditional partial effect was stronger and more stable, whereas in the low-concentration range, PM2.5 and MDA8 O3 may not move in the same direction, suggesting that precursor-ratio-oriented regulation may deserve more attention.
Supplementary Materials
The following supporting information can be downloaded at: https://www.mdpi.com/article/10.3390/atmos17111057/s1.
Author Contributions
Z.W. was the data analyst and writer during the process of thesis writing. C.W. was responsible for data collation and manuscript checking. All authors have read and agreed to the published version of the manuscript.
Funding
This research was funded by the Ordos Municipal Science and Technology Bureau (Municipal Key Research and Development Program in Ordos), grant number YF20240019 and YF20240037.
Institutional Review Board Statement
Not applicable.
Informed Consent Statement
Not applicable.
Data Availability Statement
Dataset available on request from the authors.
Conflicts of Interest
The authors declare no conflict of interest.
References
- Lin, M.; Horowitz, L.W.; Xie, Y.; De Smedt, I. Compound drivers of rising ozone extremes in the North China Plain (2013–2023): Aerosol decline, hot droughts, afforestation-driven BVOCs, and reduced vegetation uptake. J. Geophys. Res. Atmos. 2025, 130, e2025JD044764. [Google Scholar] [CrossRef] [Scilit]
- Chen, S.Y.; Wang, H.C.; Lu, K.D. The trend of surface ozone in Beijing from 2013 to 2019: Indications of the persisting strong atmospheric oxidation capacity. Atmos. Environ. 2020, 242, 117801. [Google Scholar] [CrossRef] [Scilit]
- Ye, S.; Wang, P.; Huang, Y.; She, Y.Y.; Ding, M.J. Urban morphology and the influence of the spatial heterogeneity of PM2.5 and O3 pollution: The case of the Yangtze River Delta. Ecol. Environ. Sci. 2023, 32, 1771–1784. (In Chinese) [Google Scholar]
- Li, K.; Jacob, D.J.; Liao, H.; Zhu, J.; Shah, V.; Shen, L.; Bates, K.H.; Zhang, Q.; Zhai, S. A two-pollutant strategy for improving ozone and particulate air quality in China. Nat. Geosci. 2019, 12, 906–910. [Google Scholar] [CrossRef] [Scilit]
- Duan, W.J.; Wang, X.; Cheng, S.; Wang, R.; Zhu, J. Influencing factors of PM2.5 and O3 from 2016 to 2020 based on DLNM and WRF-CMAQ. Environ. Pollut. 2021, 285, 117512. [Google Scholar] [CrossRef] [Scilit] [PubMed]
- Ren, J.W.; Zhang, X.Y.; Li, Z.G. Research progress and emerging trends of PM2.5–ozone co-pollution (2013–2024): A PRISMA-ScR–guided scientometric scoping review using CiteSpace. Water Air Soil Pollut. 2025, 236, 1166. [Google Scholar] [CrossRef] [Scilit]
- Buhendwa, B.M.; Fang, C.S.; Wang, J. Modeling the coupled PM2.5-ozone system in China: Chemical mechanisms, persistent model biases and future perspectives. Environ. Pollut. 2026, 408, 128887. [Google Scholar] [CrossRef] [Scilit] [PubMed]
- Wang, F.Y.; Han, X.; Xie, H.; Gao, Y.; Guan, X.; Zhang, M.G. Investigating trends and causes of simultaneous high pollution from PM2.5 and ozone in China, 2015–2023. Atmos. Pollut. Res. 2024, 16, 102351. [Google Scholar] [CrossRef] [Scilit]
- Zhang, R.X.; Chen, Z.H.; Wu, X.Y.; Liu, Q.M.; Mai, Z.L.; Zheng, Z.Y.; Chen, Y.L.; Tao, S.; Hu, Y.T.; Zhao, S.L.; et al. Adjoint analysis of PM2.5 and O3 episodes in priority control zones in China. Environ. Sci. Ecotechnol. 2025, 27, 100612. [Google Scholar] [CrossRef] [Scilit] [PubMed]
- Yuan, T.L.; Remer, L.A.; Bian, H.S.; Ziemke, J.R.; Albrecht, R.; Pickering, K.E.; Oreopoulos, L.; Goodman, S.J.; Yu, H.B.; Allen, D.J. Aerosol indirect effect on tropospheric ozone via lightning. J. Geophys. Res. Atmos. 2012, 117, D18. [Google Scholar] [CrossRef] [Scilit]
- Li, K.; Jacob, D.J.; Liao, H.; Shen, L.; Zhang, Q.; Bates, K.H. Anthropogenic drivers of 2013–2017 trends in summer surface ozone in China. Proc. Natl. Acad. Sci. USA 2019, 116, 422–427. [Google Scholar] [CrossRef] [Scilit] [PubMed]
- Tan, Z.F.; Andreas, H.; Lu, K.D.; Brown, S.S.; Holland, F.; Huey, L.G.; Kiendler-Scharr, A.; Li, X.; Liu, X.X.; Ma, N.; et al. No evidence for a significant impact of heterogeneous chemistry on radical concentrations in the North China Plain in summer 2014. Environ. Sci. Technol. 2020, 54, 5973–5979. [Google Scholar] [CrossRef] [Scilit] [PubMed]
- Wu, J.S.; Wang, Y.; Liang, J.T.; Yao, F. Exploring common factors influencing PM2.5 and O3 concentrations in the Pearl River Delta: Tradeoffs and synergies. Environ. Pollut. 2021, 285, 10–16. [Google Scholar] [CrossRef] [Scilit] [PubMed]
- Li, T.W.; Yang, Q.Q.; Wang, Y.; Wu, J.A. Joint estimation of PM2.5 and O3 over China using a knowledge-informed neural network. Geosci. Front. 2023, 14, 101499. [Google Scholar] [CrossRef] [Scilit]
- Ravishankara, A.R. Heterogeneous and multiphase chemistry in the troposphere. Science 1997, 276, 1058–1065. [Google Scholar] [CrossRef] [Scilit]
- Huang, R.J.; Yang, L.; Cao, J.J.; Chen, Y.; Chen, Q.; Li, Y.J.; Duan, J.; Zhu, C.S.; Dai, W.T.; Wang, K.; et al. Secondary organic aerosol in urban China: A distinct chemical regime for air pollution studies. Science 2025, 389, eadq2840. [Google Scholar] [CrossRef] [Scilit] [PubMed]
- Liu, Z.; An, X.Q.; Wang, C.; Li, J.T. Emission reduction measures for typical PM2.5 and O3 co-pollution event based on the adjoint model. Chin. Environ. Sci. 2024, 44, 6559–6568. (In Chinese) [Google Scholar]
- Zhong, B.W.; Zhou, J.; Wang, Y.; Yuan, B.; Shao, M. Review of ozone formation sensitivity in China. Chin. Environ. Sci. 2024, 44, 6522–6537. (In Chinese) [Google Scholar]
- Wang, B.; Li, G.M.; Zhang, X.M.; Ma, H.L.; Wu, D.L.; Wang, W.H.; Wang, X.Z. Pollution characteristics and source analysis of atmospheric VOCs: Taking Puyang, one of the “2 + 26” cities, as an example. Environ. Pollut. Control 2024, 46, 380–386. (In Chinese) [Google Scholar]
- Lee, H.; Jaffe, D.A. Impact of wildfires on O3 and air quality across the United States for 2019–2024 using generalized additive models. J. Geophys. Res. Atmos. 2025, 130, e2025JD044088. [Google Scholar] [CrossRef] [Scilit]
- Li, Y.; Hong, S.; Yang, H.; Chen, B.; He, C. A study on the nonlinear lag effects of meteorological factors on PM2.5 concentrations in Nanjing, China: Based on GAM and DLNM models. Environ. Sci. Atmos. 2026, 6, 943–961. [Google Scholar] [CrossRef] [Scilit]
- GB 3095-2012; Ambient Air Quality Standard. China Standards Press: Beijing, China, 2012.
- Yao, X.; Zhang, L. Identifying decadal trends in deweathered concentrations of criteria air pollutants in Canadian urban atmospheres with machine learning approaches. Atmos. Chem. Phys. 2024, 24, 7773–7791. [Google Scholar] [CrossRef] [Scilit]
- Wang, W.; Parrish, D.D.; Li, X.; Shao, M.; Liu, Y.; Mo, Z.; Lu, S.; Hu, M.; Fang, X.; Wu, Y.; et al. Exploring the drivers of the increased ozone production in Beijing in summertime during 2005–2016. Atmos. Chem. Phys. 2020, 20, 15617–15633. [Google Scholar] [CrossRef] [Scilit]
- Chen, D.; Zang, M.; Wang, Y.; Shi, L.; Ma, Z.; Lu, G.F. Central inspection of ecological and environmental protection and the improvement of local air quality: Evidence from using multi-phase difference-in-difference method. Sci. Technol. Rev. 2022, 40, 55–63. (In Chinese) [Google Scholar]
- Yan, X.Y.; Gao, F.; Ji, Y.; An, C.; Gao, R.; Ren, Y.; Li, J.; Gao, X.; Xue, L.; Shang, F.; et al. Assessing the contribution of VOCs to SOA formation and identifying their key species during ozone pollution episodes in a typical petrochemical city. Environ. Pollut. 2025, 375, 126315. [Google Scholar] [CrossRef] [Scilit] [PubMed]
- Tang, M.; Liu, Z.; Shen, F.; Ding, X.; Wang, Y.; Wang, X.; Wang, Q.; Liu, D. In situ continuous hourly observations of wintertime nitrate, sulfate and ammonium in a megacity in the North China Plain from 2014 to 2019. Chemosphere 2021, 262, 127745. [Google Scholar] [CrossRef] [Scilit] [PubMed]
- Zhu, T.; Shang, J.; Zhao, D.F. The roles of heterogeneous chemical processes in the formation of an air pollution complex and gray haze. Sci. Sin. Chin. 2010, 12, 1731–1740. (In Chinese) [Google Scholar]
- Jin, X.P.; Zhang, H.S.; Li, Q.H.; Song, Y.; Cai, X.H. Mechanism of haze pollution in summer and its difference with winter in the North China Plain. Sci. Total Environ. 2021, 806, 152625. [Google Scholar] [CrossRef] [Scilit] [PubMed]
- Lou, M.Y.; Guo, J.P.; Wang, L.L.; Xu, H.; Chen, D.D.; Miao, Y.C.; Lv, Y.M.; Li, Y.; Guo, X.R.; Ma, S.L.; et al. On the relationship between aerosol and boundary layer height in summer in China under different thermodynamic conditions. Earth Space Sci. 2019, 6, 887–901. [Google Scholar] [CrossRef] [Scilit]
- Miyazaki, K.; Bowman, K.; Sekiya, T.; Jiang, Z.; Chen, X.; Eskes, H.; Ru, M.; Zhang, Y.; Shindell, D. Air quality response in China linked to the 2019 novel coronavirus (COVID-19) lockdown. Geophys. Res. Lett. 2020, 47, e2020GL089252. [Google Scholar] [CrossRef] [Scilit] [PubMed]
- Liu, J.; He, C.; Zhao, S.; Zhu, J.; Wang, W.; Wang, L.; Wang, Y. Variations in ozone concentration in seven regions under different temperature and humidity conditions. Environ. Sci. 2023, 44, 5392–5399. [Google Scholar] [CrossRef] [Scilit] [PubMed]
- Zhang, Z.; Zheng, N.; Liang, Y.; Luo, L.; Xiao, H.; Xiao, H. Dominance of heterogeneous chemistry in summertime nitrate accumulation: Insights from oxygen isotope of nitrate (δ18O–NO3−). ACS Earth Space Chem. 2020, 4, 818–824. [Google Scholar] [CrossRef] [Scilit]
- Wang, Z.; Wang, W.; Tham, Y.J.; Li, Q.; Wang, H.; Wen, L.; Wang, X.; Wang, T. Fast heterogeneous N2O5 uptake and ClNO2 production in power plant and industrial plumes observed in the nocturnal residual layer over the North China Plain. Atmos. Chem. Phys. 2017, 17, 12361–12378. [Google Scholar] [CrossRef] [Scilit]
- Wang, W.; Li, X.; Shao, M.; Hu, M.; Zeng, L.; Wu, Y.; Tan, T. The impact of aerosols on photolysis frequencies and ozone production in Beijing during the 4-year period 2012–2015. Atmos. Chem. Phys. 2019, 19, 9413–9429. [Google Scholar] [CrossRef] [Scilit]
- Fang, W.S.; Cao, N.W.; Shi, X.C. Analysis of a synergistic pollution process of PM2.5 and ozone in the Beijing-Tianjin-Hebei Region. J. Atmos. Environ. Opt. 2024, 19, 342–356. (In Chinese) [Google Scholar]
- Jiang, Y.; Wang, S.; Xing, J.; Zhao, B.; Wang, S.; Yin, X.; Zhang, X.; Zhang, Q.; Hao, J. Ambient fine particulate matter and ozone pollution in China: Synergy in anthropogenic emissions and atmospheric processes. Environ. Res. Lett. 2022, 17, 123001. [Google Scholar] [CrossRef] [Scilit]
- Zhang, J.; Lian, C.; Wang, W.; Ge, M.; Guo, Y.; Ran, H.; Zhang, Y.; Zheng, F.; Fan, X.; Yan, C.; et al. Amplified role of potential HONO sources in O3 formation in North China Plain during autumn haze aggravating processes. Atmos. Chem. Phys. 2022, 22, 3275–3302. [Google Scholar] [CrossRef] [Scilit]
- Song, Y.; Bai, W.; Liu, Y.; Zhou, Z.; Liu, Y.; Geng, C.; Yang, W. Comprehensive analysis of chemical and physical characteristics of co-pollution by ozone and PM2.5 over 2017–2024 in a typical industrial city of Zibo. Atmos. Pollut. Res. 2026, 17, 103087. [Google Scholar] [CrossRef] [Scilit]
- Xue, L.; Zhu, Y.; Gao, J.; Zhong, X.; Cui, C.; Wang, S.; Jiang, Z.; Sun, Y.; Li, Q.; Zhang, Y.; et al. Critical transition of urban ozone formation regime in the North China Plain. Natl. Sci. Rev. 2026, 13, nwaf596. [Google Scholar] [CrossRef] [Scilit] [PubMed]
- Chen, X.; Jiang, Z.; Shen, Y.; Li, R.; Fu, Y.; Liu, J.; Han, H.; Liao, H.; Cheng, X.; Jones, D.B.A.; et al. Chinese regulations are working—Why is surface ozone over industrialized areas still high? Applying lessons from Northeast US air quality evolution. Geophys. Res. Lett. 2021, 48, e2021GL092816. [Google Scholar] [CrossRef] [Scilit]
- Song, X.W.; Han, Y.M.; Hao, Y.P.; Cheng, P.; Zhu, X.D.; Kong, Y.; Gao, N.X.; Li, S.S. Health risks of PM2.5 and O3 and zoning for joint prevention and control in the Yangtze River Delta Region. Res. Environ. Sci. 2026, 39, 493–505. (In Chinese) [Google Scholar]
- Liu, Y.; Zheng, Y.; Geng, G.; Cheng, J.; Liu, Y.; Tong, D.; He, K.; Zhang, Q. Strategy for coordinating near-term PM2.5, ozone, and CO2 mitigation in China. Proc. Natl. Acad. Sci. USA 2025, 122, e2513194122. [Google Scholar] [CrossRef] [Scilit] [PubMed]
Disclaimer/Publisher’s Note: The statements, opinions and data contained in all publications are solely those of the individual author(s) and contributor(s) and not of MDPI and/or the editor(s). MDPI and/or the editor(s) disclaim responsibility for any injury to people or property resulting from any ideas, methods, instructions or products referred to in the content. |
© 2026 by the authors. Licensee MDPI, Basel, Switzerland. This article is an open access article distributed under the terms and conditions of the Creative Commons Attribution (CC BY) license.