


Abstract
Seasonal observations of particulate composition are needed to characterize rural air quality near livestock facilities without assuming that nearby emissions determine ambient aerosol chemistry. This study examined PM2.5 and eight water-soluble inorganic ions in weekly 24 h filter samples collected in Duseo-myeon, Ulsan, South Korea, from June 2023 to November 2025. Seasonal concentrations and nitrate mass fractions were evaluated alongside particulate ammonium-to-sulfate ratios and a stoichiometric neutralization index. PM2.5 was highest in spring, whereas nitrate was highest in winter and lowest in summer, with seasonal means of 3.00 and 0.26 µg m−3, respectively. Spring and winter both frequently exhibited elevated ammonium-to-sulfate ratios, but nitrate exceeded sulfate by mass much more often in winter. The ratio intervals summarize observed composition and do not define thermodynamic thresholds or precursor-sensitivity regimes. The study provides a multi-year composition baseline for this rural site and shows that the seasonal PM2.5 maximum and the strongest nitrate contribution did not coincide. Weekly sampling, incomplete gas-particle time matching, and the absence of concurrent thermodynamic constraints limit attribution of the observed nitrate abundance to specific sources or formation processes.
1. Introduction
A substantial fraction of fine particulate matter (PM2.5) consists of secondary particulate material formed through atmospheric reactions of precursor gases [1]. Secondary inorganic aerosol (SIA), a major component of PM2.5, is composed primarily of sulfate (SO42−), nitrate (NO3−), and ammonium (NH4+) [2]. Ammonia (NH3) is the principal basic precursor that neutralizes sulfuric acid (H2SO4) and nitric acid (HNO3), thereby forming ammonium sulfate ((NH4)2SO4) and ammonium nitrate (NH4NO3) [2,3]. Agricultural and livestock activities are major atmospheric NH3 sources; one European assessment attributed approximately 95% of NH3 emissions in the EU-28 to agricultural activities and identified manure storage and management as important emission processes [4]. Nearby livestock activities can therefore provide a plausible source of NH3, but their presence alone does not establish their contribution to ambient NH3 or SIA at a monitoring site [4,5].
Sulfate and nitrate differ in their volatility and atmospheric processing. Sulfuric acid has very low volatility, whereas ammonium nitrate is semivolatile and its gas-particle partitioning depends on temperature, humidity, and the gas and particle composition [2,3]. Lower temperature generally favors particulate ammonium nitrate, but no single temperature defines its stability under all atmospheric conditions. Field observations near a swine facility also illustrate the coupling between NH3, acidic gases, and fine particles [5]. Consequently, the presence of NH3 alone does not establish the amount of particulate nitrate or its response to precursor changes.
Recent changes in East Asian emissions have altered SIA composition. Reductions in SO2 emissions have been accompanied by decreasing particulate sulfate and increasing relative contributions of nitrate [6,7]. An analysis of PM2.5 changes in China and South Korea during 2015–2018 reported annual decreases in surface PM2.5 of 9.1% yr−1 in China and 4.3% yr−1 in South Korea [8]. Over the same period, SO2 concentrations in China decreased to approximately half of their 2015 level. At Baengnyeong Island, located along a long-range transport pathway from China to South Korea, sulfate decreased whereas nitrate increased, a pattern attributed to nonlinear interactions among SIA components [8]. These changes indicate that nitrate has become increasingly important in SIA assessment and management.
The response of particulate nitrate to precursor reductions depends on the chemical environment. In an agricultural NH3-reduction scenario for the Hai River Basin, a 60% reduction in NH3 emissions was estimated to decrease SIA by 22–43% and PM2.5 by 9–24% in high-emission areas [9]. In the San Joaquin Valley, long-term NOx reductions were associated with lower wintertime ammonium nitrate, although daytime and nighttime production responded differently [10]. These results concern different atmospheric settings and do not identify a universally preferable control precursor. In particular, sensitivity to HNO3 availability cannot be equated directly with sensitivity to NOx emissions, because the conversion of NOx to HNO3 depends on oxidant chemistry [10].
The nonlinear response of nitrate to NH3 reduction is already established in the literature [11]. Thermodynamic assessments show that aerosol pH and liquid water affect sensitivity to NH3 and HNO3 availability [12], while particulate ion ratios alone are not reliable proxies for aerosol pH [13]. The need to consider these factors is therefore an established basis for interpreting composition measurements, rather than a new mechanism proposed here.
The particulate [NH4+]/[SO42−] molar ratio has been used to describe ammonium relative to sulfate, and a value near 1.5 has been discussed as an empirical transition in particular observational datasets [14,15]. Neither this value nor a higher ratio is a universal criterion for nitrate exceeding sulfate by mass. Furthermore, nitrate can be associated with non-ammonium cations, including those in sea-salt and crustal particles [16]. Relative nitrate abundance and thermodynamic precursor sensitivity therefore require different evidence.
Korean agricultural research has characterized paddy-field and upland-field sites [17], while other studies describe urban, industrial, and suburban environments [18]. A complementary observational need is to document seasonal particulate composition near livestock facilities, where potential NH3 emissions should not be confused with demonstrated control of ambient SIA. The present study adds observations from Duseo-myeon, Ulsan, spanning June 2023 to November 2025. Its contribution is a multi-year, site-specific description of PM2.5 and eight inorganic ions, with emphasis on the contrast between the spring PM2.5 maximum and the winter nitrate maximum. We compare seasonal nitrate concentrations and mass fractions with particulate ammonium-to-sulfate ratios to characterize their co-occurrence. The ratio-bin analysis is exploratory; the study does not seek to establish a new equilibrium threshold or quantify livestock source contributions.
2. Materials and Methods
2.1. Study Site and Measurement Period
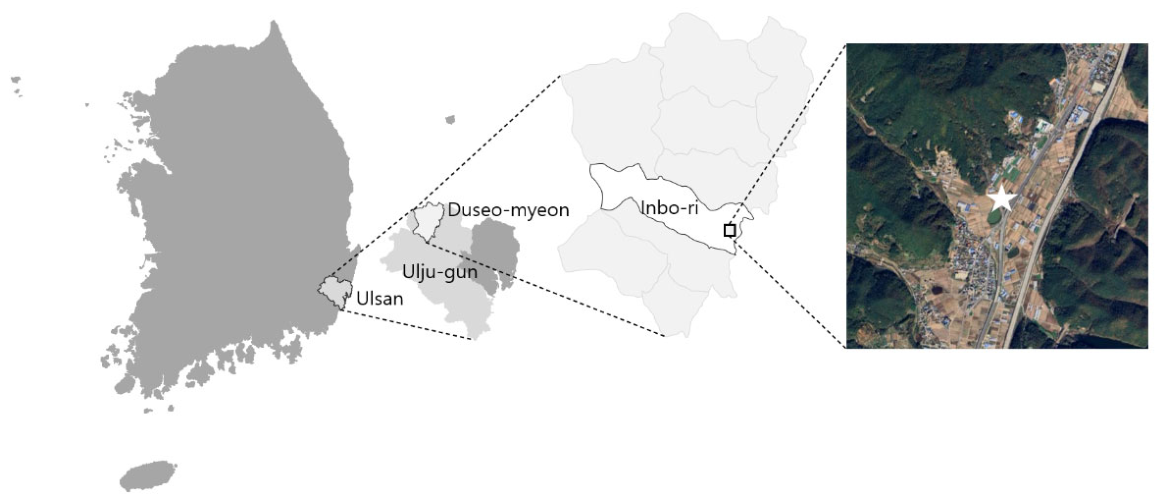
Atmospheric measurements were conducted at an air-monitoring station within the Duseo-myeon Administrative Welfare Center, 285 Inbo-ri, Duseo-myeon, Ulju-gun, Ulsan, Republic of Korea (35.64795° N, 129.16180° E; Figure 1). The site is located in a basin-like setting surrounded by forest, and livestock facilities, including cattle barns, are distributed around the monitoring station. The instruments were installed in an open area to minimize airflow obstruction by nearby structures. The measurement period extended from 12 June 2023 to 10 November 2025.
Figure 1.
Location of the study site in Duseo-myeon, Ulju-gun, Ulsan, South Korea. The white star indicates the sampling site, and different shades of gray represent administrative divisions.
The nearby livestock facilities characterize the site setting. Their contribution to measured NH3 and particulate ions was not quantified, and the present observations do not separate local livestock emissions from other local sources or regional transport.
2.2. Sample Collection and Chemical Analysis
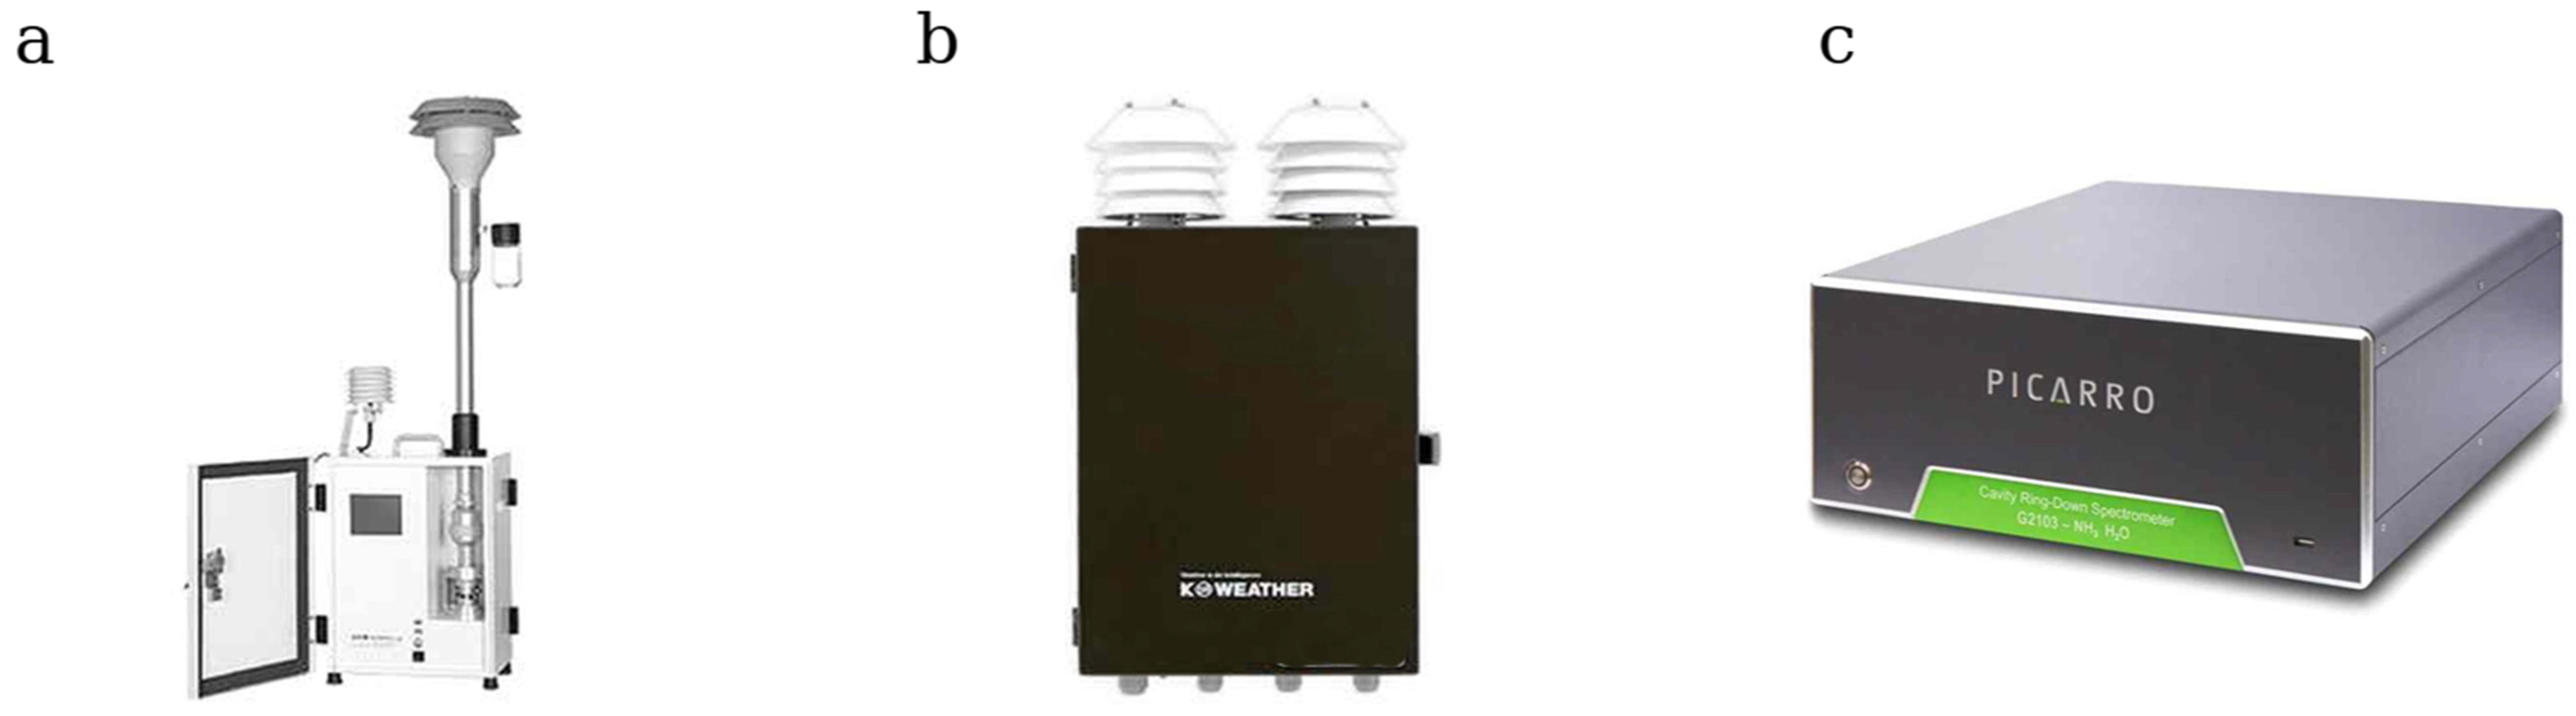
PM2.5 mass and water-soluble inorganic ions (WSIIs) were determined from 24 h samples collected once per week, generally on Mondays. Gaseous pollutants and NH3 were measured continuously and managed as 1 min data. The principal sampling and continuous-monitoring instruments are shown in Figure 2.
Figure 2.
Instruments used for atmospheric measurements: (a) low-volume PM2.5 sampler; (b) outdoor air-quality and meteorological monitoring system; and (c) cavity ring-down spectroscopy NH3 analyzer.
2.2.1. PM2.5 Sampling and Gravimetric Determination
PM2.5 samples were collected using the low-volume air-sampling method specified in the Korean Standard Method for the Examination of Air Pollution, ES 01115 [19]. A low-volume PM2.5 sampler designed to operate under conditions consistent with the U.S. Environmental Protection Agency Federal Reference Method (PMS-204, APM Co., Bucheon, Republic of Korea) was operated at 16.7 L min−1. Instantaneous, mean, and cumulative flow values recorded by the mass-flow controller were checked for each sample. Particles were collected on 47 mm polytetrafluoroethylene filters for subsequent gravimetric and ionic analyses.
Before sampling, filters were conditioned for at least 24 h at 20.0 ± 0.2 °C and 40 ± 2% relative humidity and weighed using an automated weighing system equipped with a precision balance with a readability of 0.1 µg. Exposed filters were reconditioned for at least 24 h under the same conditions and reweighed. Laboratory blanks were used to confirm the stability of the weighing process, and field blanks were used to correct mass changes associated with transport, handling, and field exposure. PM2.5 mass concentration was calculated by subtracting the field-blank mass change from the pre- and post-sampling filter mass difference and dividing the result by the actual sampled air volume.
2.2.2. Analysis of Water-Soluble Inorganic Ions
Three anions (Cl−, NO3−, and SO42−) and five cations (Na+, NH4+, K+, Mg2+, and Ca2+) were quantified. Each filter was placed in a beaker with the sampled surface facing downward, wetted with 200 µL of reagent-grade or higher-purity ethanol, and then extracted with 20 mL of ultrapure water by shaking at 120 rpm for 120 min.
The extract was filtered and analyzed by ion chromatography (IC). Calibration standards ranged from 0.1 to 20.0 μg mL−1, and the reported coefficients of determination (R2) were 0.999 for all eight ions. Ion-specific detection limits ranged from 0.002 to 0.041 μg mL−1, and relative standard deviations (RSDs) ranged from 0.1% to 1.0% (Table 1). Ambient ion concentrations were calculated by multiplying the blank-corrected extract concentration by the extraction volume and dividing by the actual sampled air volume; concentrations are reported in µg m−3.
Table 1.
Quality-control results for the ion chromatographic analysis of water-soluble inorganic ions.
2.2.3. Continuous Measurement of NH3 and Gaseous Pollutants
Ambient NH3 was measured using a cavity ring-down spectroscopy analyzer (G2103, Picarro Inc., Santa Clara, CA, USA). The manufacturer specifies a guaranteed measurement range of 0–500 ppb and a lower detection limit of <0.09 ppb at 3σ with 300 s averaging [20]. Raw data generated at 1 s intervals were aggregated to 1 min means; the manufacturer’s 300 s detection-limit specification is therefore not a field-derived detection limit for these 1 min data. The upstream filter was replaced approximately every three months. Instrument operation, optical-cavity temperature and pressure, data output, and remote communication status were checked routinely. These operational checks and manufacturer specifications do not independently establish field accuracy or long-term calibration stability during the study.
NO2, SO2, and O3, together with temperature, relative humidity, atmospheric pressure, wind direction, and wind speed, were measured continuously using a sensor-based outdoor air-quality and micrometeorological monitoring system (OAQ-C300, Kweather Co., Seoul, Republic of Korea). Gaseous pollutants were measured with electrochemical sensors at a sample flow rate of 1.0 L min−1, and data were generated at 1 min intervals. Measurements were stored internally and transmitted through LTE to the Air365 platform for monitoring instrument status and data acquisition. Optical-scattering and electrochemical sensor modules were inspected periodically; after module replacement, data were used only after a one-week calibration and stabilization period.
Data collected during the stabilization period following sensor replacement were excluded from the analysis. The NO2, SO2, and O3 time series were used as supporting observations to describe temporal variations in air quality and were not used to quantify oxidation rates or precursor sensitivity.
2.3. Data Processing and Ion-Composition Indicators
Filter-based PM2.5 and WSII data were integrated by sampling date. Samples were excluded from composition-indicator calculations when required analytes were missing or when field records and instrument-operation information indicated abnormal sampling. Continuous data were organized at 1 min resolution after removal of instrument-malfunction and missing-data periods. Long-term gaseous-pollutant variations were summarized as monthly means and standard deviations. Seasons were defined as spring (March–May), summer (June–August), autumn (September–November), and winter (December–February). Seasonal PM2.5 and ion concentrations are presented as mean ± standard deviation.
The overall and seasonal filter-based means represent the sampled 24 h periods rather than continuous calendar-period averages. The analyses presented here use monthly gas summaries, without paired NH3–ion averages for individual filter-sampling windows. Meteorological measurements were not used to stratify the filter samples or to estimate source contributions. Consequently, neither sample-matched gas-particle relationships nor the independent effects of temperature, relative humidity, wind speed, or wind direction were quantified.
For ion-composition calculations, the mass concentrations of NH4+, SO42−, and NO3− were converted to molar concentrations by division by their respective molecular weights. The neutralization ratio (NR), representing the extent to which particulate NH4+ could stoichiometrically neutralize the acidic equivalents of SO42− and NO3−, was calculated as follows [2]:
Here, brackets denote molar concentrations, whereas c(X) denotes the mass concentration of species X. NR compares ammonium with the charge equivalents of measured sulfate and nitrate. An NR of at least 1 indicates sufficient ammonium equivalents for those two anions within this restricted calculation; it does not establish neutral aerosol pH. The calculation excludes other ions and is not a complete ionic charge balance. The [NH4+]/[SO42−] molar ratio describes particulate ammonium relative to sulfate and is not a direct measure of gaseous NH3 availability or precursor sensitivity [12,13].
For descriptive comparisons, samples were grouped into [NH4+]/[SO42−] intervals of <1.5, 1.5–<4.0, and ≥4.0. The value 1.5 provides a link to empirical ion relationships discussed in previous studies [14,15]. A ratio of 2.0 corresponds to the stoichiometry of pure ammonium sulfate but does not identify the composition or acidity of an ambient particle mixture. The 1.5–<4.0 interval was further subdivided at 2.0 for subsequent exploratory comparisons. The 4.0 boundary is a dataset-specific descriptive cut point, not a fitted or independently validated transition. The interval labels refer only to measured particulate ratios and do not classify the atmosphere as NH3-deficient or NH3-rich.
SIA mass concentration was defined as c(NO3−) + c(SO42−) + c(NH4+). The NO3−/SIA mass fraction was calculated for each sample before averaging within a season or ratio interval. The operational term “nitrate-dominant” denotes c(NO3−) > c(SO42−); it does not require nitrate to exceed 50% of SIA or PM2.5, and it does not establish nitrate speciation as NH4NO3. For each season, the proportions of samples with NR ≥ 1, [NH4+]/[SO42−] ≥ 1.5, [NH4+]/[SO42−] ≥ 4.0, and nitrate dominance were summarized. Frequencies and nitrate mass fractions were also described across the <1.5, 1.5–<2.0, 2.0–<4.0, and ≥4.0 ratio intervals. These comparisons summarize composition and are not tests of nitrate formation rates or responses to emission reductions.
The seasonal joint distribution of the [NH4+]/[SO42−] molar ratio and the NO3−/SIA mass fraction was visualized using a scatter plot and bivariate kernel density estimation (KDE). To reduce right-skewness, KDE was performed after logarithmic transformation of the molar-ratio axis. The 50% density region for each season was displayed as a contour and projected back onto the original ratio scale for visualization. Vertical reference lines were placed at ratios of 1.5 and 4.0.
2.4. Statistical Analysis
Seasonal differences in PM2.5 and WSII concentrations were evaluated using one-way analysis of variance (ANOVA), with season as the independent variable and concentration as the dependent variable. Normality within each seasonal group was assessed using the Shapiro–Wilk test [21], and homogeneity of variance was evaluated using Levene’s test [22].
When both assumptions were satisfied, one-way ANOVA was applied, and the F statistic and p-value were calculated. For variables showing an overall seasonal difference at p < 0.05, Tukey’s honestly significant difference test was used for pairwise comparisons while controlling the family-wise error rate [23]. When either normality or homogeneity of variance was violated, the Kruskal–Wallis test was used as a rank-based nonparametric alternative [24]. Significant Kruskal–Wallis results were followed by Dunn’s test with Bonferroni adjustment [25].
The significance level was set at 0.05. Analyses were performed using R version 4.4.2 [26]. ANOVA and Tukey tests were conducted using aov() and TukeyHSD() in the stats package; the Shapiro–Wilk and Kruskal–Wallis tests used shapiro.test() and kruskal.test(), respectively; Levene’s test used leveneTest() in the car package; and Dunn’s test used the dunn.test package.
3. Results
3.1. Seasonal Concentrations of PM2.5 and Water-Soluble Inorganic Ions
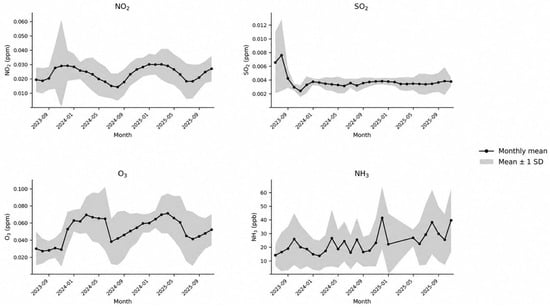
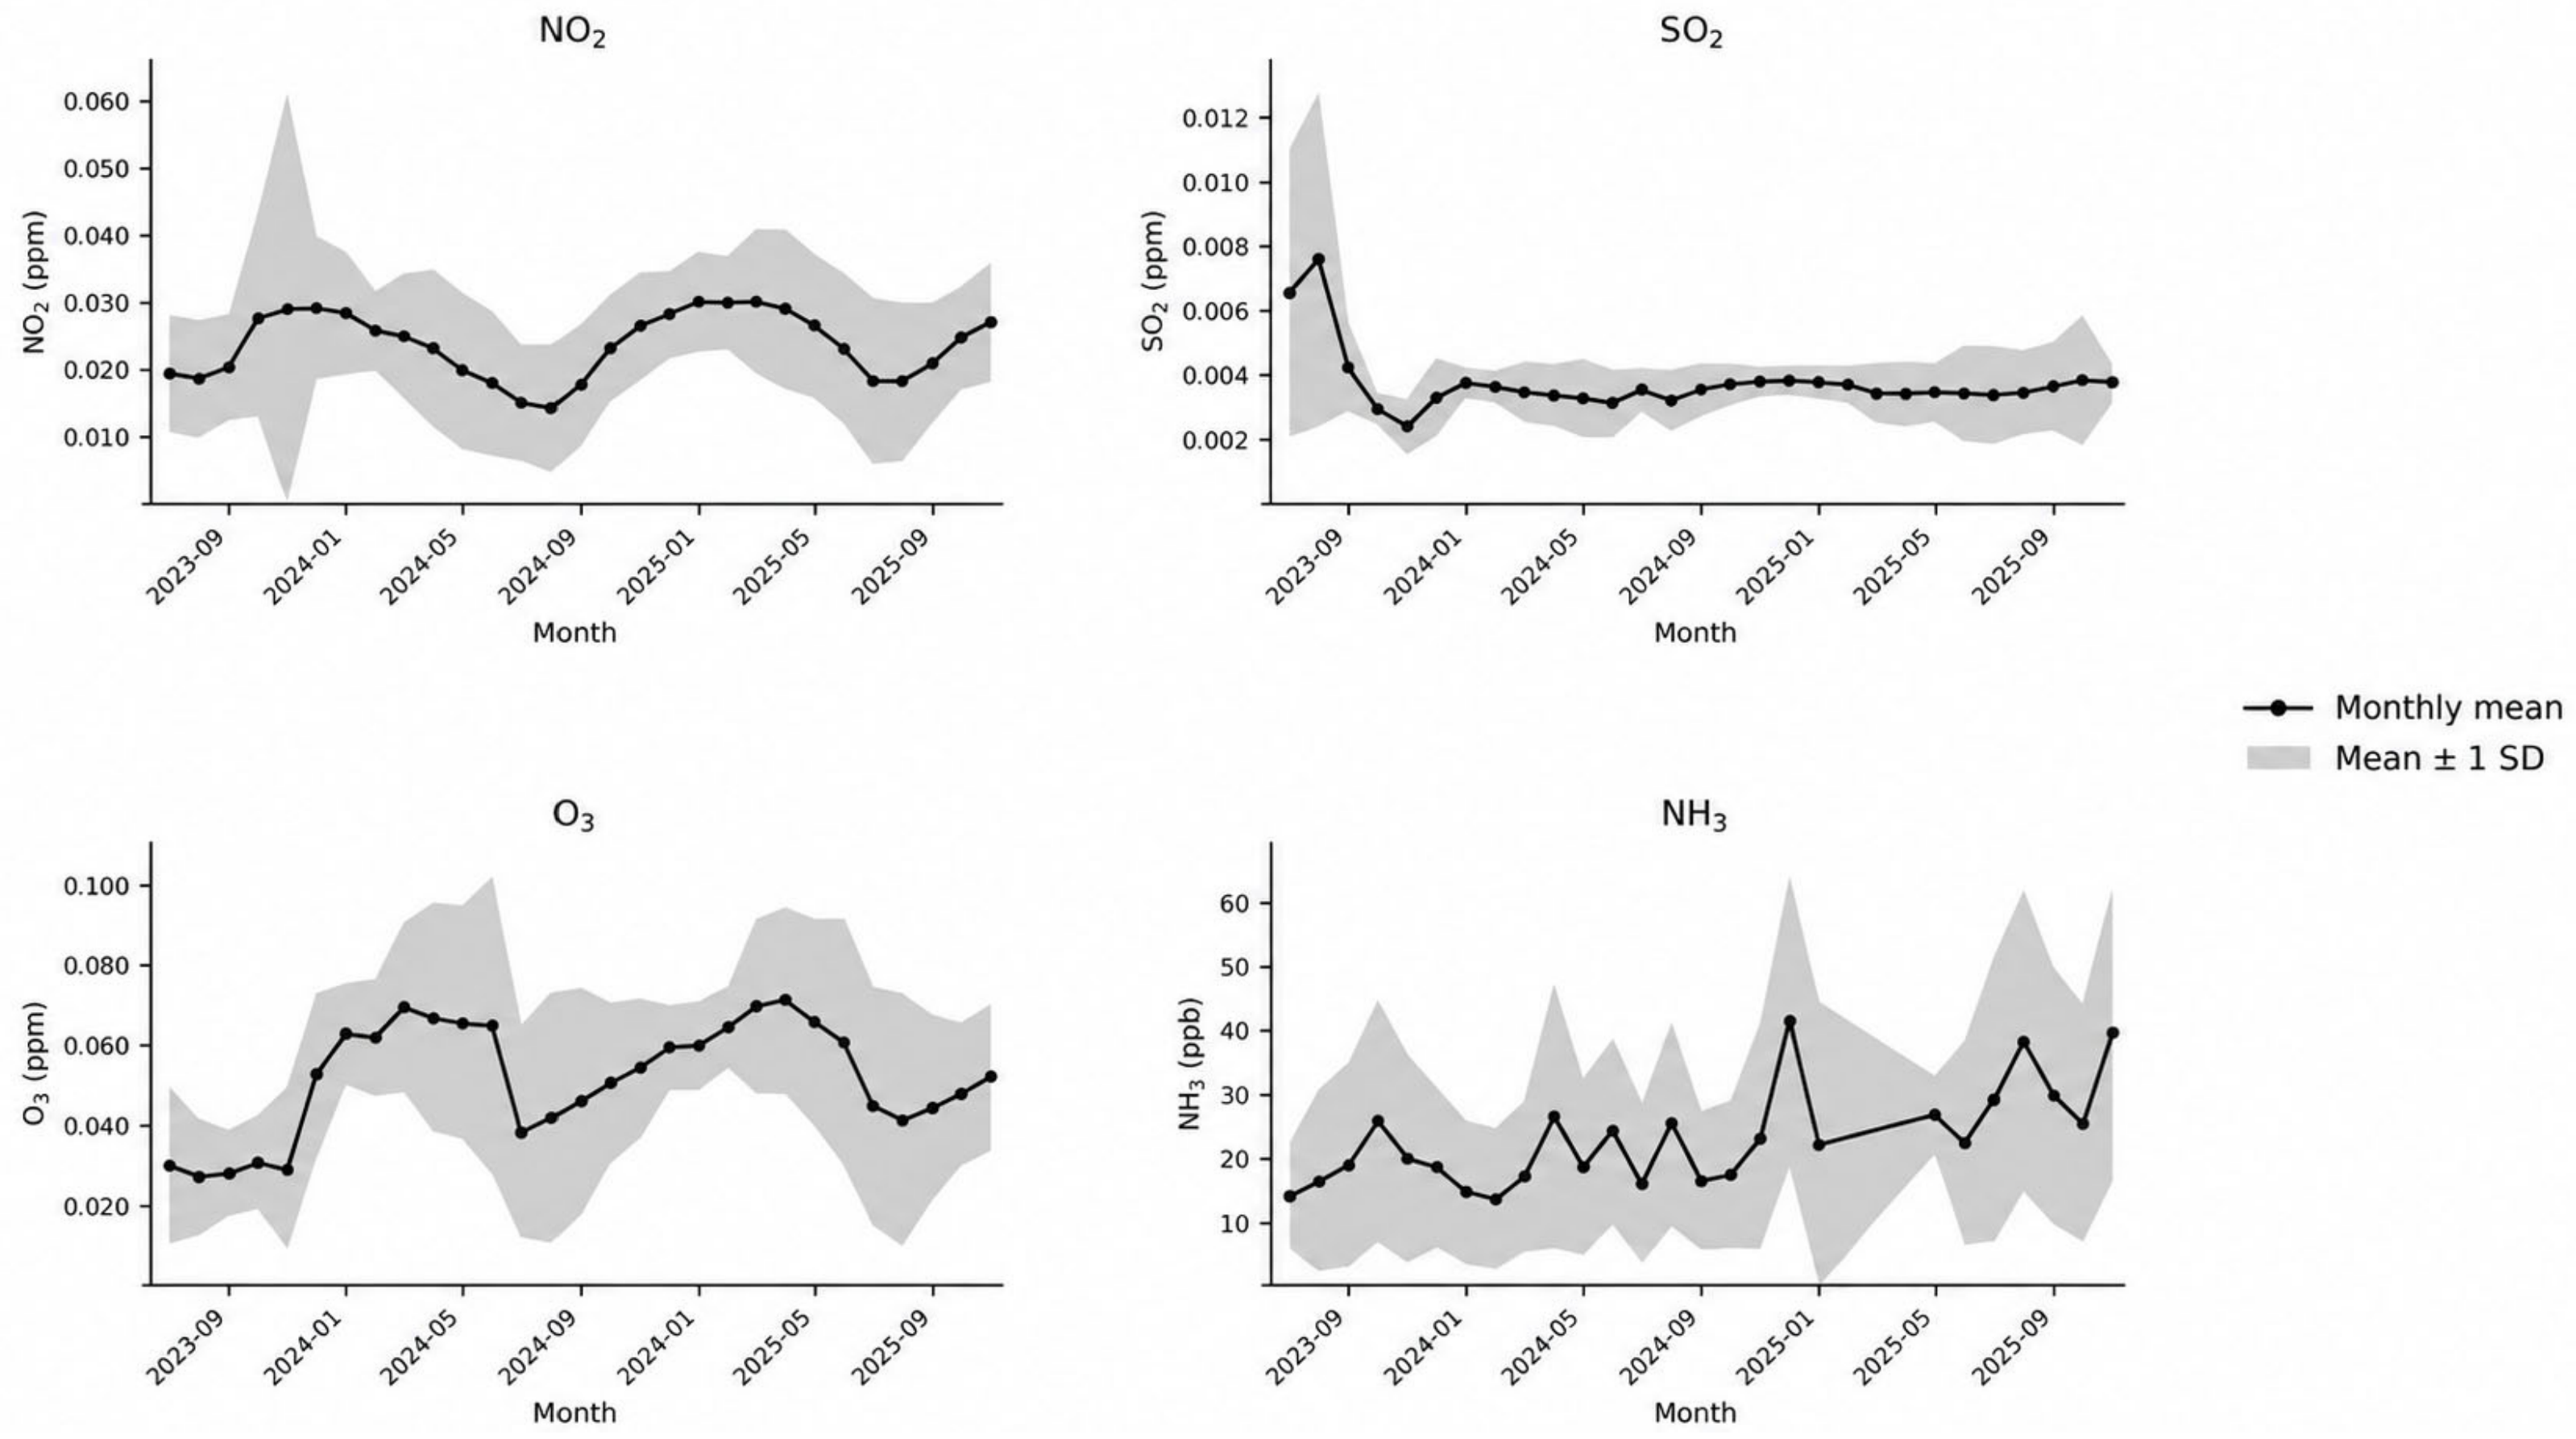
Monthly mean concentrations (±1 standard deviation) of NO2, SO2, O3, and NH3 are shown in Figure 3. The NH3 record shows its presence during both warm and cold portions of the study period, including the warm-season periods in which filter-based nitrate concentrations were low. This is a qualitative comparison of different temporal summaries, rather than a sample-matched relationship between NH3 and particulate nitrate.
Figure 3.
Monthly mean concentrations (±1 standard deviation) of NO2, SO2, O3, and NH3 during the study period.
The mean PM2.5 concentration across the filter samples was 12.20 ± 6.62 µg m−3 (Table 2). Seasonal means were highest in spring (14.77 ± 7.19 µg m−3) and winter (13.99 ± 7.73 µg m−3) and lowest in autumn (9.47 ± 4.24 µg m−3). NO3− was highest in winter (3.00 ± 2.78 µg m−3) and lowest in summer (0.26 ± 0.28 µg m−3). In contrast, SO42− was higher in spring (1.97 ± 1.22 µg m−3) and summer (1.89 ± 1.65 µg m−3) and lower in winter (1.32 ± 1.10 µg m−3). NH4+ was highest in winter (1.39 ± 0.99 µg m−3).
Table 2.
Seasonal mean concentrations (mean ± standard deviation) of PM2.5 and water-soluble inorganic ions (µg m−3).
The overall seasonal differences in PM2.5 and SIA concentrations were statistically significant (p < 0.05). The clearest seasonal contrast was observed for NO3−: the winter mean was approximately 11.5 times the summer mean, and the winter–summer difference was significant in the post hoc comparison. PM2.5 differed significantly between spring and autumn, and NH4+ differed significantly between winter and summer. By contrast, the lower-concentration ions Cl−, Na+, K+, Mg2+, and Ca2+ did not show significant seasonal differences (p ≥ 0.05).
Among the remaining ions, Na+ and Cl− had overall mean concentrations of 0.57 ± 0.29 and 0.20 ± 0.24 µg m−3, respectively (Table 2). The overall mean K+ concentration was 0.06 ± 0.07 µg m−3, while Mg2+ and Ca2+ were present at still lower reported concentrations. Values displayed as 0.00 µg m−3 reflect the reporting precision of Table 1 and should not be interpreted as proof of absence.
3.2. Seasonal Ion Ratios and Nitrate Dominance
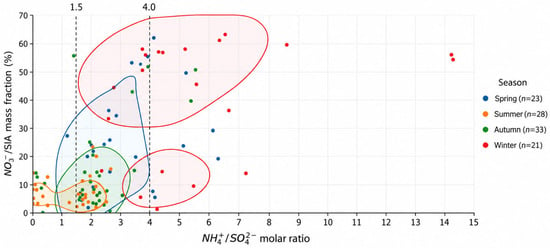
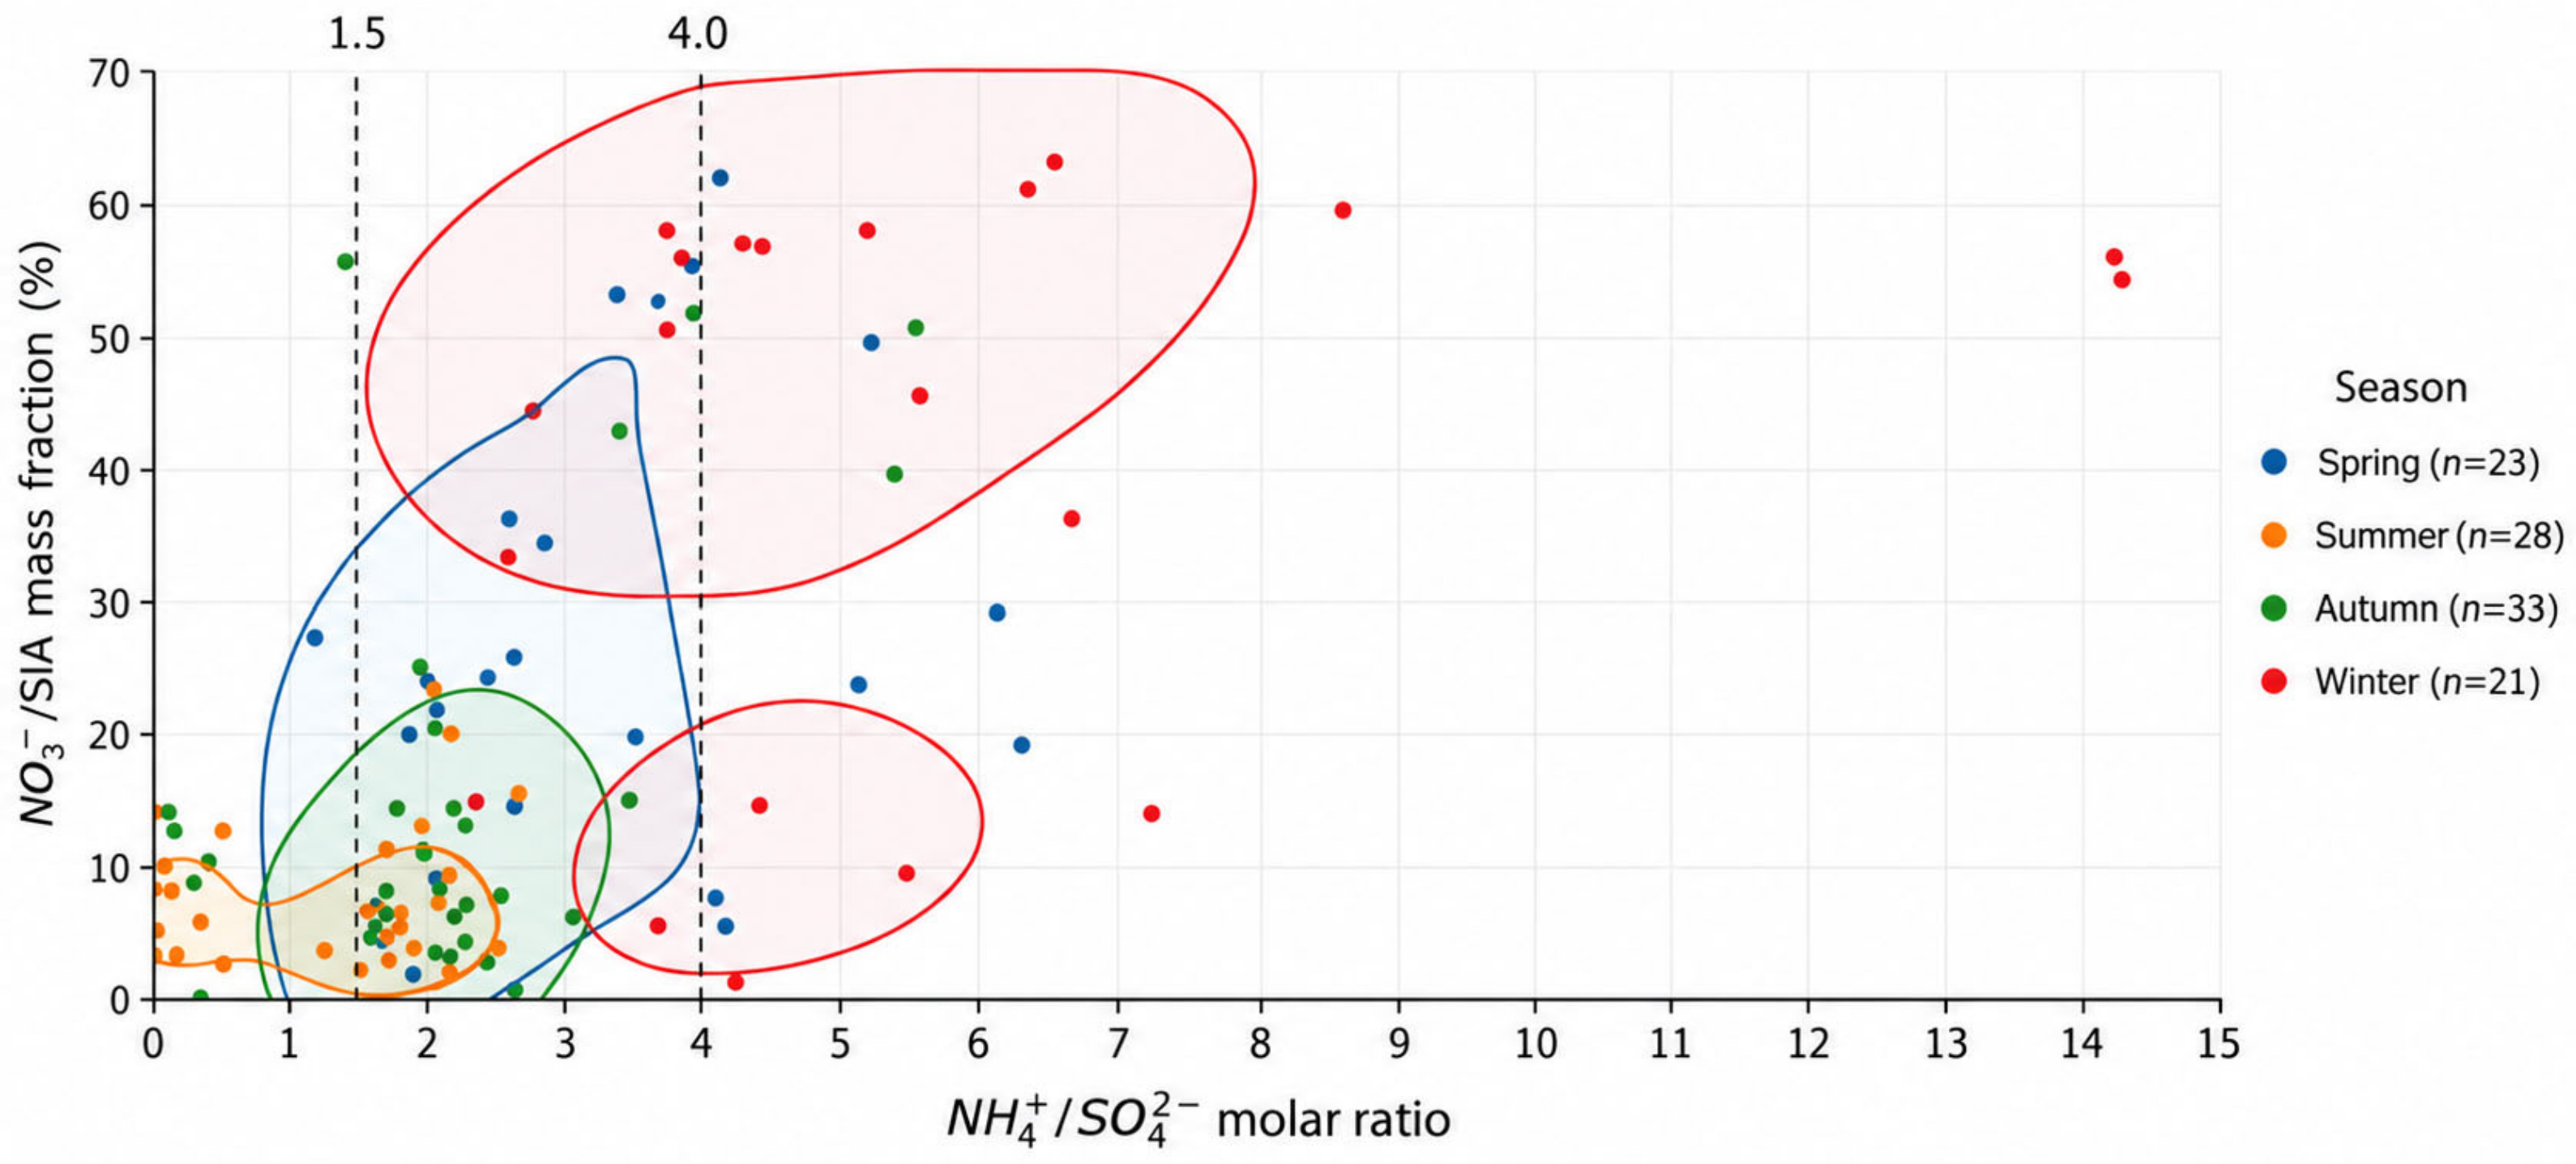
Seasonal NR, [NH4+]/[SO42−] molar ratios, nitrate-dominance frequencies, and NO3−/SIA mass fractions are summarized in Table 3 and Figure 4. The proportion of samples with NR ≥ 1 was highest in winter (47.6%), followed by spring (34.8%), autumn (33.3%), and summer (10.7%). Mean NR values followed the same order: winter, 1.26; spring, 1.08; autumn, 0.83; and summer, 0.59. Thus, even in winter, fewer than half of the samples had NR ≥ 1.
Table 3.
Seasonal distribution of ion-composition and nitrate-dominance indicators.
Figure 4.
Relationship between the [NH4+]/[SO42−] molar ratio and the NO3−/SIA mass fraction. Points represent individual samples. Colored shaded areas represent the 50% kernel-density regions for each season, and the colored outlines indicate their corresponding boundaries. These regions were estimated in log-transformed [NH4+]/[SO42−] space and then projected onto the original scale. Dashed vertical lines denote molar ratios of 1.5 and 4.0. The vertical lines are descriptive reference values, not validated transition thresholds.
The proportion of samples with [NH4+]/[SO42−] ≥ 1.5 was 100.0% in winter, 95.7% in spring, 81.8% in autumn, and 60.7% in summer. Mean molar ratios were 5.72 in winter, 3.19 in spring, 2.14 in autumn, and 1.29 in summer. The proportion with [NH4+]/[SO42−] ≥ 4.0 was 66.7% in winter, 30.4% in spring, 6.1% in autumn, and 0.0% in summer. Nitrate-dominant samples ([NO3−] > [SO42−]) showed the same seasonal maximum in winter (66.7%) but occurred less frequently in spring (17.4%) and autumn (15.2%) and were absent in summer. Mean NO3−/SIA mass fractions were 40.4% in winter, 25.0% in spring, 14.7% in autumn, and 7.8% in summer.
3.3. Seasonal Distribution of Molar-Ratio Intervals
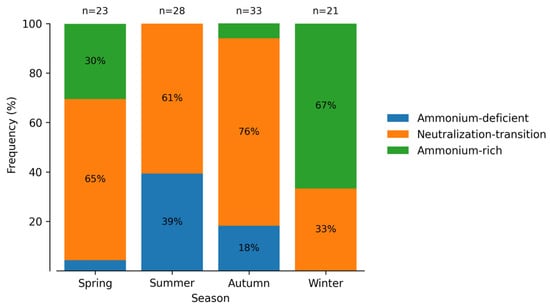
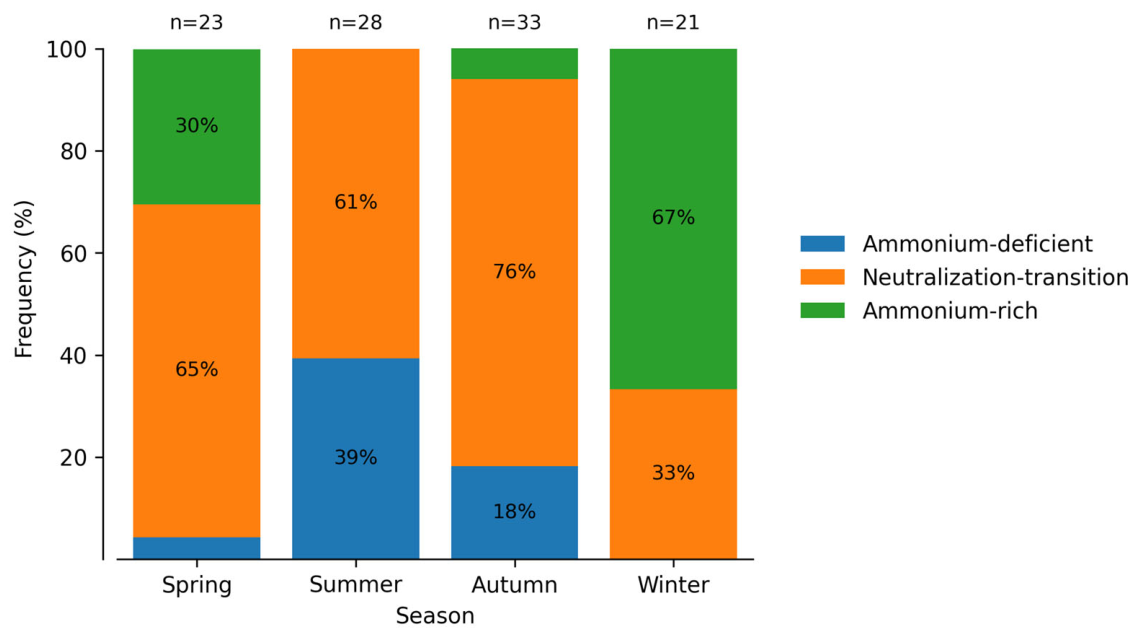
Figure 5 shows the seasonal distribution of the particulate [NH4+]/[SO42−] ratio intervals. The 1.5–<4.0 interval accounted for 65.2%, 60.7%, and 75.8% of spring, summer, and autumn samples, respectively. The <1.5 interval accounted for 4.3%, 39.3%, and 18.2% of spring, summer, and autumn samples, respectively. The ≥4.0 interval accounted for 30.4% of spring samples and 6.1% of autumn samples and was absent in summer. In winter, 66.7% of samples were in the ≥4.0 interval and 33.3% in the 1.5–<4.0 interval; no samples were in the <1.5 interval.
Figure 5.
Seasonal frequencies of the particulate [NH4+]/[SO42−] molar-ratio intervals. The intervals describe observed composition and do not represent thermodynamic or precursor-sensitivity regimes.
3.4. Nitrate Dominance Across [NH4+]/[SO42−] Ratio Intervals
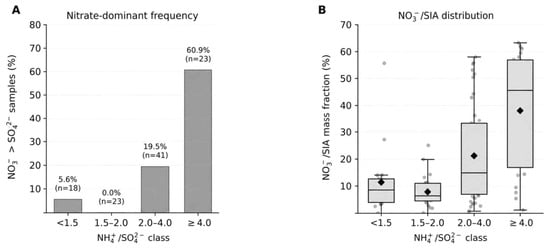
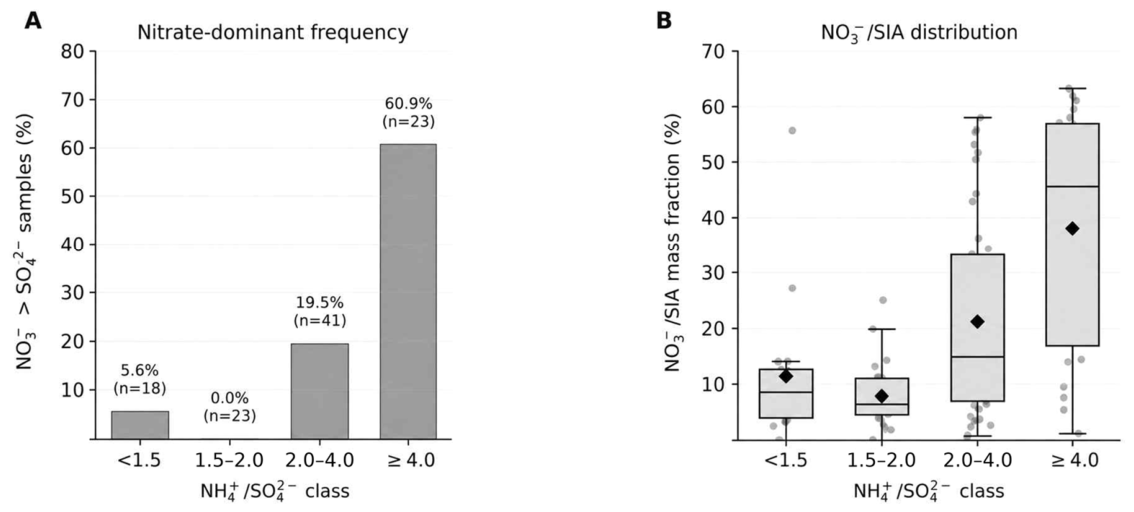
Nitrate dominance varied among the [NH4+]/[SO42−] molar-ratio intervals (Table 4 and Figure 6). In the <1.5 interval, 1 of 18 samples (5.6%) was nitrate-dominant. No nitrate-dominant sample was observed among the 23 samples in the 1.5–<2.0 interval. The frequency increased to 19.5% (8 of 41 samples) in the 2.0–<4.0 interval and to 60.9% (14 of 23 samples) in the ≥4.0 interval. Mean NO3−/SIA mass fractions were 11.4%, 7.9%, 21.2%, and 38.0% in the <1.5, 1.5–<2.0, 2.0–<4.0, and ≥4.0 intervals, respectively. The highest nitrate-dominance frequency and mean nitrate mass fraction therefore occurred in the ≥4.0 interval. These frequencies are descriptive comparisons without adjustment for season.
Table 4.
Nitrate-dominance frequency and NO3−/SIA distribution across [NH4+]/[SO42−] molar-ratio intervals.
Figure 6.
Nitrate dominance across [NH4+]/[SO42−] molar-ratio intervals: (A) frequency of nitrate-dominant samples, defined as c(NO3−) > c(SO42−); and (B) distribution of the NO3−/SIA mass fraction. Black diamonds indicate means. In panel (B), gray dots represent individual samples, and black diamonds indicate the mean NO3−/SIA mass fraction within each interval.
4. Discussion
4.1. Seasonal Shift Toward Nitrate-Rich SIA
The measured seasonal contrast was most apparent in the major SIA ions: nitrate and ammonium had their highest mean concentrations in winter, whereas sulfate was higher in spring and summer. This establishes a seasonal composition pattern at the rural study site. It does not, by itself, determine whether temperature, moisture, transport, or local emissions caused that pattern.
This pattern is consistent with observations from agricultural and urban environments in South Korea. At an agricultural site in Jeonbuk, ionic species accounted for more than 40% of PM2.5, with higher sulfate in summer and higher nitrate in winter; wintertime nitrate and sulfate contributions were 26% and 12%, respectively [17]. At the present site, wintertime nitrate also exceeded sulfate, accounting for 48.15% and 21.19% of the total measured WSII mass, respectively. In Seoul, PM2.5 increased from 13.3 ± 6.7 µg m−3 in summer to 28.3 ± 14.5 µg m−3 in winter, and nitrate was reported as the largest component of both PM1.0 and PM2.5 during winter [27].
The annual PM2.5 concentration at the present site (12.20 ± 6.62 µg m−3) was lower than the range of 21.8–26.44 µg m−3 reported for Korean urban, industrial, and suburban environments [18]. Nevertheless, the direction of the seasonal compositional change was similar: nitrate increased in winter, while sulfate was relatively enhanced during warmer seasons. This indicates that a comparatively low annual PM2.5 level does not preclude a pronounced seasonal shift in SIA composition.
The winter nitrate maximum did not coincide with the spring maximum in PM2.5 mass, demonstrating a change in composition within the sampled periods. Winter nitrate enhancement has also been reported in Seoul [28], where isotope-based observations have helped distinguish oxidation pathways [29]. In the present study, higher particulate nitrate is interpreted as greater observed abundance, not a measured increase in nitrate production rate. It can reflect changes in chemical production of total nitrate, redistribution of existing nitrate toward the particle phase, transport, atmospheric dilution, or removal [2,10,12]. Likewise, a higher nitrate-to-SIA fraction can result from increased nitrate, decreased sulfate or ammonium, or both. The filter measurements alone cannot distinguish these contributions.
Comparable winter nitrate behavior has been observed in several North American valleys, although the controlling conditions differ. In the San Joaquin Valley, observations linked changes in winter ammonium nitrate to NOx chemistry and showed different daytime and nighttime responses [10]. In Idaho’s Treasure Valley, nitrate variability was associated with time of day, NOx, and relative humidity, with cold, humid conditions favoring particulate nitrate [30]. In Cache Valley, Utah, measurements of both NH3 and HNO3, combined with thermodynamic calculations, supported nitric-acid limitation during the investigated pollution episodes [31]. In Yakima Valley, the onset of persistent low cloud reduced several primary pollutants without a corresponding decline in particulate ammonium nitrate, illustrating the combined relevance of mixing and secondary aerosol processes [32].
These studies place the Ulsan winter nitrate maximum in a wider observational context; they do not establish the same precursor sensitivity or boundary-layer conditions at Ulsan. The low sulfate contribution reported during the northern Utah episodes also differs from the appreciable sulfate observed here, particularly in spring and summer [31]. Differences in particle-size range, sampling frequency, and the denominator used for mass fractions further preclude direct equivalence of the reported percentages.
The continuous NH3 record provides complementary context: NH3 was observed during periods when particulate nitrate was low, so low particulate nitrate should not be equated with the absence of gas-phase NH3. However, monthly NH3 means cannot establish the NH3 concentration or gas-particle partitioning during an individual filter sample. Lower temperature generally favors particulate ammonium nitrate, while the effects of relative humidity depend on aerosol composition, liquid water, and acidity [2,12]. Relative humidity is not itself a measurement of aerosol liquid water or pH. Wind direction and speed can affect exposure to nearby sources and regional air masses, but no filter-matched wind analysis was performed. Thus, meteorology and nearby livestock emissions remain plausible influences rather than quantitatively demonstrated controls at this site.
4.2. Particulate Ammonium Ratios and Relative Nitrate Abundance
The spring–winter comparison illustrates the distinction between particulate composition indices. In spring, 95.7% of samples had [NH4+]/[SO42−] ≥ 1.5, but nitrate exceeded sulfate by mass in only 17.4%; the corresponding winter frequencies were 100.0% and 66.7%. These observations describe seasonal co-occurrence and do not establish an independent predictive effect of the molar ratio. Seoul PM1 studies likewise provide examples of increased nitrate contributions under winter or stagnant conditions [33,34], although their particle-size ranges and mass-fraction denominators differ from those used here.
NR includes sulfate and nitrate in its denominator, whereas [NH4+]/[SO42−] includes sulfate alone. The two indices can therefore give different impressions of ammonium relative to the measured anions. Neither index identifies aerosol pH, and NR is not a complete charge balance because non-ammonium cations and other anions are excluded [13]. The Na+, Cl−, K+, Mg2+, and Ca2+ measurements in Table 1 show that the measured inorganic mixture extends beyond the three SIA ions. Their presence does not uniquely identify marine, crustal, combustion, or livestock contributions, nor does bulk ion analysis determine which salts were present [16].
Prior observations already demonstrate why ratio-only interpretations require caution. Guangzhou measurements found substantial acidity despite abundant NH3 and high particulate ammonium-to-sulfate ratios [15], while Beijing and Shanghai observations included nitrate-rich, ammonium-poor samples [14]. These findings and thermodynamic work on aerosol pH and liquid water [12] support a limited interpretation of the Ulsan results: seasonal composition is documented, but gas-phase ammonia excess, particle acidity, and limiting precursors are not diagnosed.
4.3. Exploratory Interpretation of Molar-Ratio Intervals
Nitrate dominance was most frequent in the ≥4.0 interval, but it occurred in only 14 of its 23 samples (60.9%). This interval also contained a large winter contribution, so the pooled comparison does not separate the ratio association from season. No independent threshold validation or season-adjusted predictive analysis was performed. The value 4.0 is therefore retained only as a descriptive grouping used in Table 2 and Table 3 and Figure 4, Figure 5 and Figure 6, and no site-transferable cut point is inferred.
The indices are also chemically and mathematically coupled. Ammonium associated with particulate nitrate can increase the ammonium-to-sulfate ratio, while lower sulfate can increase both that ratio and the nitrate mass fraction without an increase in nitrate concentration. Their association is consequently not independent evidence that additional NH3 caused nitrate formation. Studies from Chengdu, the Po Valley, and the eastern United States illustrate that ammonium–sulfate relationships vary with chemical setting and cannot be interpreted independently of other aerosol components and gas-phase conditions [35,36,37].
Modeling near animal feeding operations and observations in Nanjing provide examples of nonlinear precursor responses and heterogeneous nitrate processing [38,39]. These studies motivate possible explanations, but cannot assign those mechanisms to the Ulsan samples. The transferable point is the need to distinguish descriptive particle ratios from independently constrained gas-particle chemistry; the numerical boundary itself is not generalized.
4.4. Implications and Limitations
The main implication is observational: the seasonal maximum in PM2.5 mass and the strongest nitrate contribution were different at this site, and particulate molar ratios do not independently identify a precursor-control strategy. This composition record can support comparisons with other rural observations, but does not quantify livestock emissions or a thermodynamic sensitivity regime.
Weekly 24 h sampling smooths within-day variability and can miss short pollution episodes between sampling days. Because samples were generally collected on Mondays, the seasonal summaries may also reflect day-of-week selection. Weekday–weekend changes in NOx and nitrate chemistry have been observed elsewhere [10], but neither the direction nor the magnitude of a Monday-related bias can be determined from this dataset. The reported means and frequencies therefore apply to the sampled periods and are not assumed to represent all days equally.
Semivolatile nitrate can be lost from filter samples during sampling and subsequent handling, with temperature-dependent losses documented in previous work [40]. No site-specific volatilization correction is reported here. Greater warm-period losses could exaggerate the observed winter–summer nitrate contrast, but their magnitude cannot be quantified from the available measurements. This uncertainty also affects the interpretation of nitrate mass fractions and ion ratios.
The reported IC calibration fit and operational gas-monitor checks do not fully characterize analytical uncertainty or long-term field calibration stability. In particular, the sensor gas records are contextual and cannot validate nitrate oxidation pathways. Monthly NH3 summaries are not paired with individual filter samples, and no filter-matched meteorological attribution was performed. NO2 measurements are not measurements of total NOx, oxidation rates, or HNO3 production. Concurrent HNO3, aerosol liquid water, and particle pH constraints are also lacking.
Finally, one monitoring site cannot resolve spatial variability or separate local livestock influence from regional transport. Identifying limiting processes would require temporally aligned gas and particle measurements, appropriate thermodynamic constraints, and spatial or source-specific evidence. The present study therefore supports a site-specific seasonal composition interpretation, rather than causal source attribution or an emission-control prescription.
5. Conclusions
This study documented seasonal variations in PM2.5 and secondary inorganic aerosol composition at a rural site near livestock facilities in Ulsan, South Korea, from June 2023 to November 2025. The seasonal mean PM2.5 concentration was highest in spring, whereas nitrate concentration and its mass fraction within SIA were highest in winter. These observations show that the seasonal maximum in total particle mass and the greatest relative contribution of nitrate occurred in different seasons.
The spring–winter comparison further highlighted differences in inorganic aerosol composition. Although elevated particulate ammonium-to-sulfate molar ratios occurred in both seasons, nitrate exceeded sulfate by mass in 17.4% of spring samples and 66.7% of winter samples. This contrast illustrates the distinction between particulate ammonium abundance relative to sulfate and nitrate predominance over sulfate at this site. The findings support interpreting particulate molar ratios together with seasonal concentrations and mass fractions when characterizing inorganic aerosol composition.
Weekly filter sampling and the absence of concurrent HNO3, aerosol liquid water, and particle-pH measurements limit the attribution of nitrate formation processes and precursor sensitivity. The study provides a multi-year observational reference for a Korean rural environment near livestock facilities, documenting the seasonal contrast between total PM2.5 mass and nitrate contribution. This record provides a basis for comparing seasonal inorganic aerosol composition across rural monitoring sites and for designing subsequent observations of wintertime nitrate.
Author Contributions
Conceptualization, J.-B.K. and S.-W.Y.; methodology, J.-B.K. and S.-W.Y.; software, J.-B.K. and S.-W.Y.; validation, J.-B.K. and S.-W.Y.; formal analysis, J.-B.K.; investigation, J.-B.K.; data curation, J.-B.K.; writing—original draft preparation, J.-B.K.; writing—review and editing, J.-B.K., S.-Y.P., J.-Y.C., D.-H.K., C.-M.L., S.-C.S. and S.-W.Y.; visualization, J.-B.K.; supervision, S.-W.Y.; project administration, S.-W.Y. All authors have read and agreed to the published version of the manuscript.
Funding
This research was funded by the Rural Development Administration of the Republic of Korea through the project “Emission Factors and Impact Assessment of Fine Particulate Matter in the Agricultural Sector,” grant number RS-2022-RD010415.
Institutional Review Board Statement
Not applicable.
Informed Consent Statement
Not applicable.
Data Availability Statement
The data used in this study are not publicly available due to institutional restrictions. Access to the data requires permission from the relevant institution. The data may be made available by the corresponding author upon reasonable request and with permission from the institution.
Acknowledgments
During the preparation of this manuscript, the authors used ChatGPT (OpenAI, San Francisco, CA, USA; GPT-5.6) to assist with English translation, language editing, manuscript organization, and reference checking. After using this tool, the authors reviewed and edited the content as needed and take full responsibility for the content of the published article.
Conflicts of Interest
The authors declare no conflicts of interest.
Abbreviations
The following abbreviations are used in this manuscript:
| CRDS | Cavity ring-down spectroscopy |
| HNO3 | Nitric acid |
| IC | Ion chromatography |
| KDE | Kernel density estimation |
| NH3 | Ammonia |
| NR | Neutralization ratio |
| NOx | Nitrogen oxides |
| PM2.5 | Fine particulate matter with an aerodynamic diameter of 2.5 µm or less |
| SIA | Secondary inorganic aerosol |
| WSIIs | Water-soluble inorganic ions |
References
- Putaud, J.-P.; Van Dingenen, R.; Alastuey, A.; Bauer, H.; Birmili, W.; Cyrys, J.; Flentje, H.; Fuzzi, S.; Gehrig, R.; Hansson, H.C.; et al. A European aerosol phenomenology–3: Physical and chemical characteristics of particulate matter from 60 rural, urban, and kerbside sites across Europe. Atmos. Environ. 2010, 44, 1308–1320. [Google Scholar] [CrossRef] [Scilit]
- Seinfeld, J.H.; Pandis, S.N. Atmospheric Chemistry and Physics: From Air Pollution to Climate Change, 3rd ed.; Wiley: Hoboken, NJ, USA, 2016. [Google Scholar]
- Erisman, J.W.; Schaap, M. The need for ammonia abatement with respect to secondary PM reductions in Europe. Environ. Pollut. 2004, 129, 159–163. [Google Scholar] [CrossRef] [Scilit] [PubMed]
- Viana, M.; Querol, X.; Alastuey, A.; Colette, A.; Couvidat, F.; Drevet, J.; Bessagnet, B.; Lükewille, A. Secondary Inorganic Aerosols from Agriculture in Europe; ETC/ACM Technical Paper 2016/4; European Topic Centre on Air Pollution and Climate Change Mitigation: Bilthoven, The Netherlands, 2016; Available online: https://www.eionet.europa.eu/etcs/etc-atni/products/etc-atni-reports/etcacm_tp_2016_4_agricultural_sia (accessed on 6 September 2026).
- Baek, B.H.; Aneja, V.P.; Tong, Q. Chemical coupling between ammonia, acid gases, and fine particles. Environ. Pollut. 2004, 129, 89–98. [Google Scholar] [CrossRef] [Scilit] [PubMed]
- Li, H.; Cheng, J.; Zhang, Q.; Zheng, B.; Zhang, Y.; Zheng, G.; He, K. Rapid transition in winter aerosol composition in Beijing from 2014 to 2017: Response to clean air actions. Atmos. Chem. Phys. 2019, 19, 11485–11499. [Google Scholar] [CrossRef] [Scilit]
- Zhai, S.; Jacob, D.J.; Wang, X.; Liu, Z.; Wen, T.; Shah, V.; Li, K.; Moch, J.M.; Bates, K.H.; Song, S.; et al. Control of particulate nitrate air pollution in China. Nat. Geosci. 2021, 14, 389–395. [Google Scholar] [CrossRef] [Scilit]
- Bae, M.; Kim, B.-U.; Kim, H.C.; Kim, J.; Kim, S. Role of emissions and meteorology in the recent PM2.5 changes in China and South Korea from 2015 to 2018. Environ. Pollut. 2021, 270, 116233. [Google Scholar] [CrossRef] [Scilit] [PubMed]
- Zhao, Z.Q.; Bai, Z.H.; Winiwarter, W.; Kiesewetter, G.; Heyes, C.; Ma, L. Mitigating ammonia emission from agriculture reduces PM2.5 pollution in the Hai River Basin in China. Sci. Total Environ. 2017, 609, 1152–1160. [Google Scholar] [CrossRef] [Scilit] [PubMed]
- Pusede, S.E.; Duffey, K.C.; Shusterman, A.A.; Saleh, A.; Laughner, J.L.; Wooldridge, P.J.; Zhang, Q.; Parworth, C.L.; Kim, H.; Capps, S.L.; et al. On the effectiveness of nitrogen oxide reductions as a control over ammonium nitrate aerosol. Atmos. Chem. Phys. 2016, 16, 2575–2596. [Google Scholar] [CrossRef] [Scilit]
- Guo, H.; Otjes, R.; Schlag, P.; Kiendler-Scharr, A.; Nenes, A.; Weber, R.J. Effectiveness of ammonia reduction on control of fine particle nitrate. Atmos. Chem. Phys. 2018, 18, 12241–12256. [Google Scholar] [CrossRef] [Scilit]
- Nenes, A.; Pandis, S.N.; Weber, R.J.; Russell, A. Aerosol pH and liquid water content determine when particulate matter is sensitive to ammonia and nitrate availability. Atmos. Chem. Phys. 2020, 20, 3249–3258. [Google Scholar] [CrossRef] [Scilit]
- Hennigan, C.J.; Izumi, J.; Sullivan, A.P.; Weber, R.J.; Nenes, A. A critical evaluation of proxy methods used to estimate the acidity of atmospheric particles. Atmos. Chem. Phys. 2015, 15, 2775–2790. [Google Scholar] [CrossRef] [Scilit]
- Pathak, R.K.; Wu, W.S.; Wang, T. Summertime PM2.5 ionic species in four major cities of China: Nitrate formation in an ammonia-deficient atmosphere. Atmos. Chem. Phys. 2009, 9, 1711–1722. [Google Scholar] [CrossRef] [Scilit]
- Huang, X.; Qiu, R.; Chan, C.K.; Ravi Kant, P. Evidence of high PM2.5 strong acidity in ammonia-rich atmosphere of Guangzhou, China: Transition in pathways of ambient ammonia to form aerosol ammonium at [NH4+]/[SO42−] = 1.5. Atmos. Res. 2011, 99, 488–495. [Google Scholar] [CrossRef] [Scilit]
- Lee, T.; Kreidenweis, S.M.; Collett, J.L., Jr. Aerosol ion characteristics during the Big Bend Regional Aerosol and Visibility Observational Study. J. Air Waste Manag. Assoc. 2004, 54, 585–592. [Google Scholar] [CrossRef] [Scilit] [PubMed]
- Lee, H.-M.; Bae, M.-S.; Kim, J.-H.; Kim, M.-W. Characteristics and chemical composition of PM2.5 in agricultural regions: A case study in Jeonbuk-do, South Korea. Air Qual. Atmos. Health 2025, 18, 3567–3580. [Google Scholar] [CrossRef] [Scilit]
- Hwang, K.; Kim, J.; Lee, J.Y.; Park, J.-S.; Park, S.; Lee, G.; Kim, C.H.; Kim, P.; Shin, S.H.; Lee, K.Y.; et al. Physicochemical characteristics and seasonal variations of PM2.5 in urban, industrial, and suburban areas in South Korea. Asian J. Atmos. Environ. 2023, 17, 19. [Google Scholar] [CrossRef] [Scilit]
- National Institute of Environmental Research. Korean Standard Methods for the Examination of Air Pollution: ES 01115, Ambient Air Sampling Method; National Institute of Environmental Research: Incheon, Republic of Korea, 2023. (In Korean) [Google Scholar]
- Picarro, Inc. G2103 Ammonia Gas Concentration Analyzer Datasheet; G2103-DS20-V2.1-AHDS-200806, 41-0032 Rev C; Picarro, Inc.: Santa Clara, CA, USA, 2020; Available online: https://www.picarro.com/sites/default/files/product_documents/Picarro_G2103%20Analyzer%20Datasheet_200806.pdf (accessed on 18 October 2026).
- Shapiro, S.S.; Wilk, M.B. An analysis of variance test for normality (complete samples). Biometrika 1965, 52, 591–611. [Google Scholar] [CrossRef] [Scilit]
- Levene, H. Robust tests for equality of variances. In Contributions to Probability and Statistics: Essays in Honor of Harold Hotelling; Olkin, I., Ghurye, S.G., Hoeffding, W., Madow, W.G., Mann, H.B., Eds.; Stanford University Press: Palo Alto, CA, USA, 1960; pp. 278–292. [Google Scholar]
- Tukey, J.W. Comparing individual means in the analysis of variance. Biometrics 1949, 5, 99–114. [Google Scholar] [CrossRef] [Scilit]
- Kruskal, W.H.; Wallis, W.A. Use of ranks in one-criterion variance analysis. J. Am. Stat. Assoc. 1952, 47, 583–621. [Google Scholar] [CrossRef]
- Dunn, O.J. Multiple comparisons using rank sums. Technometrics 1964, 6, 241–252. [Google Scholar] [CrossRef]
- R Core Team. R: A Language and Environment for Statistical Computing; R Foundation for Statistical Computing: Vienna, Austria, 2024. [Google Scholar] [CrossRef] [Scilit]
- Oh, S.; Kim, J.Y.; Won, S.R.; Kwon, S.; Lee, S.-J.; Choi, S.-D.; Lee, J.Y.; Shin, H.J. Comparison of the chemical characteristics and source apportionment of PM1.0 and PM2.5 using real-time air quality monitoring network data of air pollutants. J. Korean Soc. Atmos. Environ. 2023, 39, 448–468. [Google Scholar] [CrossRef] [Scilit]
- Kim, Y.; Seo, J.; Kim, J.Y.; Lee, J.Y.; Kim, H.; Kim, B.M. Characterization of PM2.5 and identification of transported secondary and biomass burning contribution in Seoul, Korea. Environ. Sci. Pollut. Res. 2018, 25, 4330–4343. [Google Scholar] [CrossRef] [Scilit] [PubMed]
- Lim, S.; Lee, M.; Savarino, J.; Laj, P. Oxidation pathways and emission sources of atmospheric particulate nitrate in Seoul: Based on δ15N and Δ17O measurements. Atmos. Chem. Phys. 2022, 22, 5099–5115. [Google Scholar] [CrossRef] [Scilit]
- Mwaniki, G.R.; Rosenkrance, C.; Wallace, H.W.; Jobson, B.T.; Erickson, M.H.; Lamb, B.K.; Hardy, R.J.; Zalakeviciute, R.; VanReken, T.M. Factors contributing to elevated concentrations of PM2.5 during wintertime near Boise, Idaho. Atmos. Pollut. Res. 2014, 5, 96–103. [Google Scholar] [CrossRef] [Scilit]
- Franchin, A.; Fibiger, D.L.; Goldberger, L.; McDuffie, E.E.; Moravek, A.; Womack, C.C.; Crosman, E.T.; Docherty, K.S.; Dube, W.P.; Hoch, S.W.; et al. Airborne and ground-based observations of ammonium-nitrate-dominated aerosols in a shallow boundary layer during intense winter pollution episodes in northern Utah. Atmos. Chem. Phys. 2018, 18, 17259–17276. [Google Scholar] [CrossRef] [Scilit]
- VanReken, T.M.; Dhammapala, R.S.; Jobson, B.T.; Bottenus, C.L.; VanderSchelden, G.S.; Kaspari, S.D.; Gao, Z.; Zhu, Q.; Lamb, B.K.; Liu, H.; et al. Role of persistent low-level clouds in mitigating air quality impacts of wintertime cold pool conditions. Atmos. Environ. 2017, 154, 236–246. [Google Scholar] [CrossRef] [Scilit]
- Kim, H.; Zhang, Q.; Bae, G.-N.; Kim, J.Y.; Lee, S.B. Sources and atmospheric processing of winter aerosols in Seoul, Korea: Insights from real-time measurements using a high-resolution aerosol mass spectrometer. Atmos. Chem. Phys. 2017, 17, 2009–2033. [Google Scholar] [CrossRef] [Scilit]
- Kwon, S.; Lim, H.-B.; Shin, H.J.; Lee, S.-J.; Choi, S.-D.; Lee, J.Y. Seasonal variation of chemical compositions in PM1.0 in the atmosphere of Seoul. J. Korean Soc. Atmos. Environ. 2022, 38, 852–868. [Google Scholar] [CrossRef] [Scilit]
- Li, Q.; Yang, Z.; Li, X.; Ding, S.; Du, F. Seasonal characteristics of sulfate and nitrate in size-segregated particles in ammonia-poor and -rich atmospheres in Chengdu, Southwest China. Aerosol Air Qual. Res. 2019, 19, 2697–2706. [Google Scholar] [CrossRef] [Scilit]
- Squizzato, S.; Masiol, M.; Brunelli, A.; Pistollato, S.; Tarabotti, E.; Rampazzo, G.; Pavoni, B. Factors determining the formation of secondary inorganic aerosol: A case study in the Po Valley (Italy). Atmos. Chem. Phys. 2013, 13, 1927–1939. [Google Scholar] [CrossRef] [Scilit]
- Silvern, R.F.; Jacob, D.J.; Kim, P.S.; Marais, E.A.; Turner, J.R.; Campuzano-Jost, P.; Jimenez, J.L. Inconsistency of ammonium–sulfate aerosol ratios with thermodynamic models in the eastern US: A possible role of organic aerosol. Atmos. Chem. Phys. 2017, 17, 5107–5118. [Google Scholar] [CrossRef] [Scilit]
- Cheng, B.; Wang-Li, L. Responses of secondary inorganic PM2.5 to precursor gases in an ammonia abundant area in North Carolina. Aerosol Air Qual. Res. 2019, 19, 1126–1138. [Google Scholar] [CrossRef] [Scilit]
- Lin, Y.-C.; Zhang, Y.-L.; Fan, M.-Y.; Bao, M. Heterogeneous formation of particulate nitrate under ammonium-rich regimes during the high-PM2.5 events in Nanjing, China. Atmos. Chem. Phys. 2020, 20, 3999–4011. [Google Scholar] [CrossRef] [Scilit]
- Chow, J.C.; Watson, J.G.; Lowenthal, D.H.; Magliano, K.L. Loss of PM2.5 nitrate from filter samples in central California. J. Air Waste Manag. Assoc. 2005, 55, 1158–1168. [Google Scholar] [CrossRef] [Scilit] [PubMed]

Disclaimer/Publisher’s Note: The statements, opinions and data contained in all publications are solely those of the individual author(s) and contributor(s) and not of MDPI and/or the editor(s). MDPI and/or the editor(s) disclaim responsibility for any injury to people or property resulting from any ideas, methods, instructions or products referred to in the content. |
© 2026 by the authors. Licensee MDPI, Basel, Switzerland. This article is an open access article distributed under the terms and conditions of the Creative Commons Attribution (CC BY) license.