


Abstract
Microbursts can cause severe low-level wind shear, posing a threat to aviation safety. However, due to their small scale, they are difficult to capture by conventional equipment such as surface Automated Weather Observing Systems (AWOS) and Doppler weather radar. On 25 June 2022, a microburst event occurred at Urumqi Diwopu International Airport. Based on multi-source and high-resolution observation data, including AWOS data, microwave radiometer data and Doppler wind lidar data, an analysis was conducted on the characteristics of this microburst event. The results indicate that before the occurrence of this microburst, the atmosphere was in an unstable state, where the lower atmosphere exhibited a significant dry adiabatic lapse rate, and the temperature and humidity profiles displayed a typical “inverted-V” thermodynamic structure. Approximately 10 min prior to the occurrence of the microburst, the Convective Available Potential Energy (CAPE), Downdraft Convective Available Potential Energy (DCAPE), Microburst Wind Potential Index (MWPI), and WINDEX increased rapidly and reached their peak values, with CAPE and DCAPE reaching 4967 J·kg−1 and 1004 J·kg−1, respectively, MWPI reaching 3.0, and WINDEX reaching 26.2 m·s−1, before subsequently decreasing rapidly. During the transition from rapid accumulation to release of the unstable energy, precipitation particles from aloft passed through the dry and warm low-level region, undergoing evaporative cooling that enhanced negative buoyancy. This effect, combined with precipitation loading, facilitated the accelerated descent and ground impact of the dry-cold air intruding from the mid-to-lower troposphere. The Doppler wind lidar data showed that the downdraft first formed at an altitude of approximately 1.5 km and rapidly extended toward the ground, reaching a maximum descent speed of 4.78 m·s−1. After impinging on the ground, the downdraft produced a pronounced divergent outflow, with the maximum surface wind speed reaching 25.5 m·s−1, which exceeded the operational downburst gust threshold of 17.9 m·s−1. This evolution of the microburst was consistent with the observed ground pressure surge, rapid temperature drop, and downward momentum transport aloft. Integrated observations from microwave radiometers and Doppler wind lidar can effectively reveal the thermodynamic stratification and dynamic characteristics of microburst, offering valuable reference for airport microburst monitoring and nowcasting early warning.
1. Introduction
During the mature stage of convective storms, intense downdrafts may develop and produce damaging surface winds exceeding 17.9 m·s−1. Fujita defined this hazardous weather phenomenon, in which strong downdrafts generate destructive outflow winds near the surface, as a downburst [1,2,3]. Based on their horizontal scale, downbursts can be classified into macrobursts (>4 km) and microbursts (≤4 km) [2,3]. Due to their small spatial scale, rapid development, and destructive potential, downbursts have become a major hazardous weather phenomenon threatening civil aviation safety [4,5]. Studies of tropical cyclone precipitation extending inland have also shown that extreme weather events can affect inland regions of China, further highlighting the importance of investigating downbursts at airports [6,7].
Previous studies have shown that Doppler weather radar can effectively identify precursor signatures associated with downbursts, including descending reflectivity cores, enhanced radial convergence, and reflectivity notches [8]. Numerous studies have analyzed multiple downburst cases and indicated that the descent of reflectivity cores, environmental wind shear, and convective available potential energy (CAPE) play important roles in the initiation and intensity of downbursts [9,10]. Furthermore, studies based on Dual-polarization radar have revealed that the formation mechanisms of downbursts differ under different humidity conditions. In wet environments, downbursts are primarily driven by precipitation loading and the melting of ice-phase particles, whereas in dry environments, dry air entrainment and evaporative cooling processes play the key role [11].
Although weather radar has demonstrated excellent performance in observing macrobursts and can clearly capture their horizontal and vertical structures, its capability for detecting small-scale microbursts remains limited. In contrast, microwave radiometers and Doppler lidar systems can partially compensate for this limitation. Among them, microwave radiometers can continuously retrieve atmospheric temperature and humidity profiles, providing significant advantages in characterizing the thermodynamic structure of convective environments and the evolution of moisture distributions. These observations provide important evidence for diagnosing the environmental conditions associated with the initiation and development of downbursts. It is generally recognized that severe storms are the result of convective activity development. During convective processes, thermodynamic instability determines the intensity of convective development, whereas dynamic processes play a key role in convective initiation and the evolution of storm types [12].
To quantitatively characterize the environmental conditions associated with the initiation and development of severe convective weather, numerous convective parameters have been proposed and developed, among which energy-related parameters, dynamic parameters, and thermodynamic stability indices are the most commonly used. For the identification of downburst-favorable environments, previous studies have developed various composite indices, including the Downburst Environmental Index (DEI) [13], Downdraft Convective Available Potential Energy (DCAPE) [14], Gust Potential Index (GUSTEX) [15], Microburst Wind Potential Index (MWPI) [16], Wet Microburst Severity Index (WMSI) [17], and Wind Index (WINDEX) [18]. These indices represent key physical processes, including thermodynamic instability, dry-air entrainment, and vertical wind shear, from different perspectives and have been widely applied in the assessment of downburst potential. Meanwhile, Doppler wind lidar exhibits unique advantages in three-dimensional wind field observations due to their high spatial resolution. They can effectively identify vertical airflow structures within thunderstorm clouds, characterize the divergent wind field associated with downbursts, and capture the formation and evolution of surface wind convergence lines [19,20,21,22]. The synergistic application of multi-source observations can facilitate a more comprehensive understanding of the initiation and evolution mechanisms of extreme weather events from both thermodynamic and dynamic perspectives. Recently, a study employed WRF–3DVAR data assimilation to integrate observations from Doppler lidar, surface meteorological stations, and satellites to simulate the urban wind field during Typhoon Yagi, providing valuable scientific support for disaster prevention and mitigation [23].
In this study, high-temporal-resolution temperature and humidity profiles retrieved from a microwave radiometer, together with typical convective parameters, are used to diagnose the environmental characteristics of a microburst event that occurred in Urumqi on 25 June 2022. By comparing the retrieved three-dimensional wind field structures from Doppler lidar observations, this study reveals the thermodynamic and dynamic mechanisms governing microburst evolution and provides scientific guidance for the early warning of low-level wind shear in critical areas such as airports. Given that this study is based on a single microburst case, the proposed diagnostic thresholds should be considered preliminary and require further statistical validation against a larger sample of microburst events.
2. Data and Methods
2.1. Study Area, Instruments, and Data
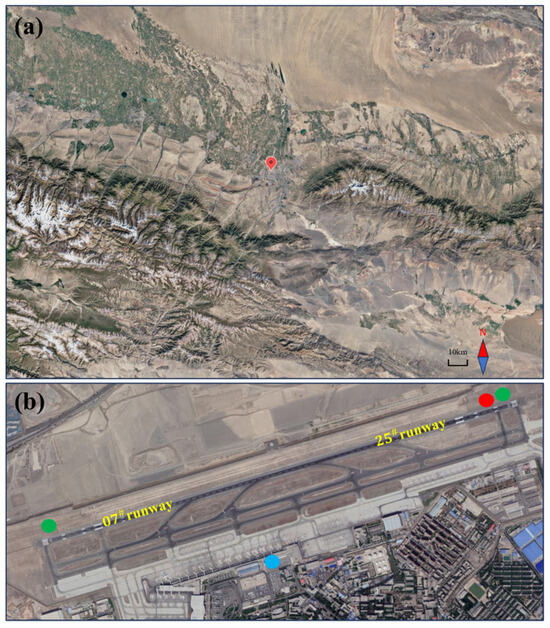
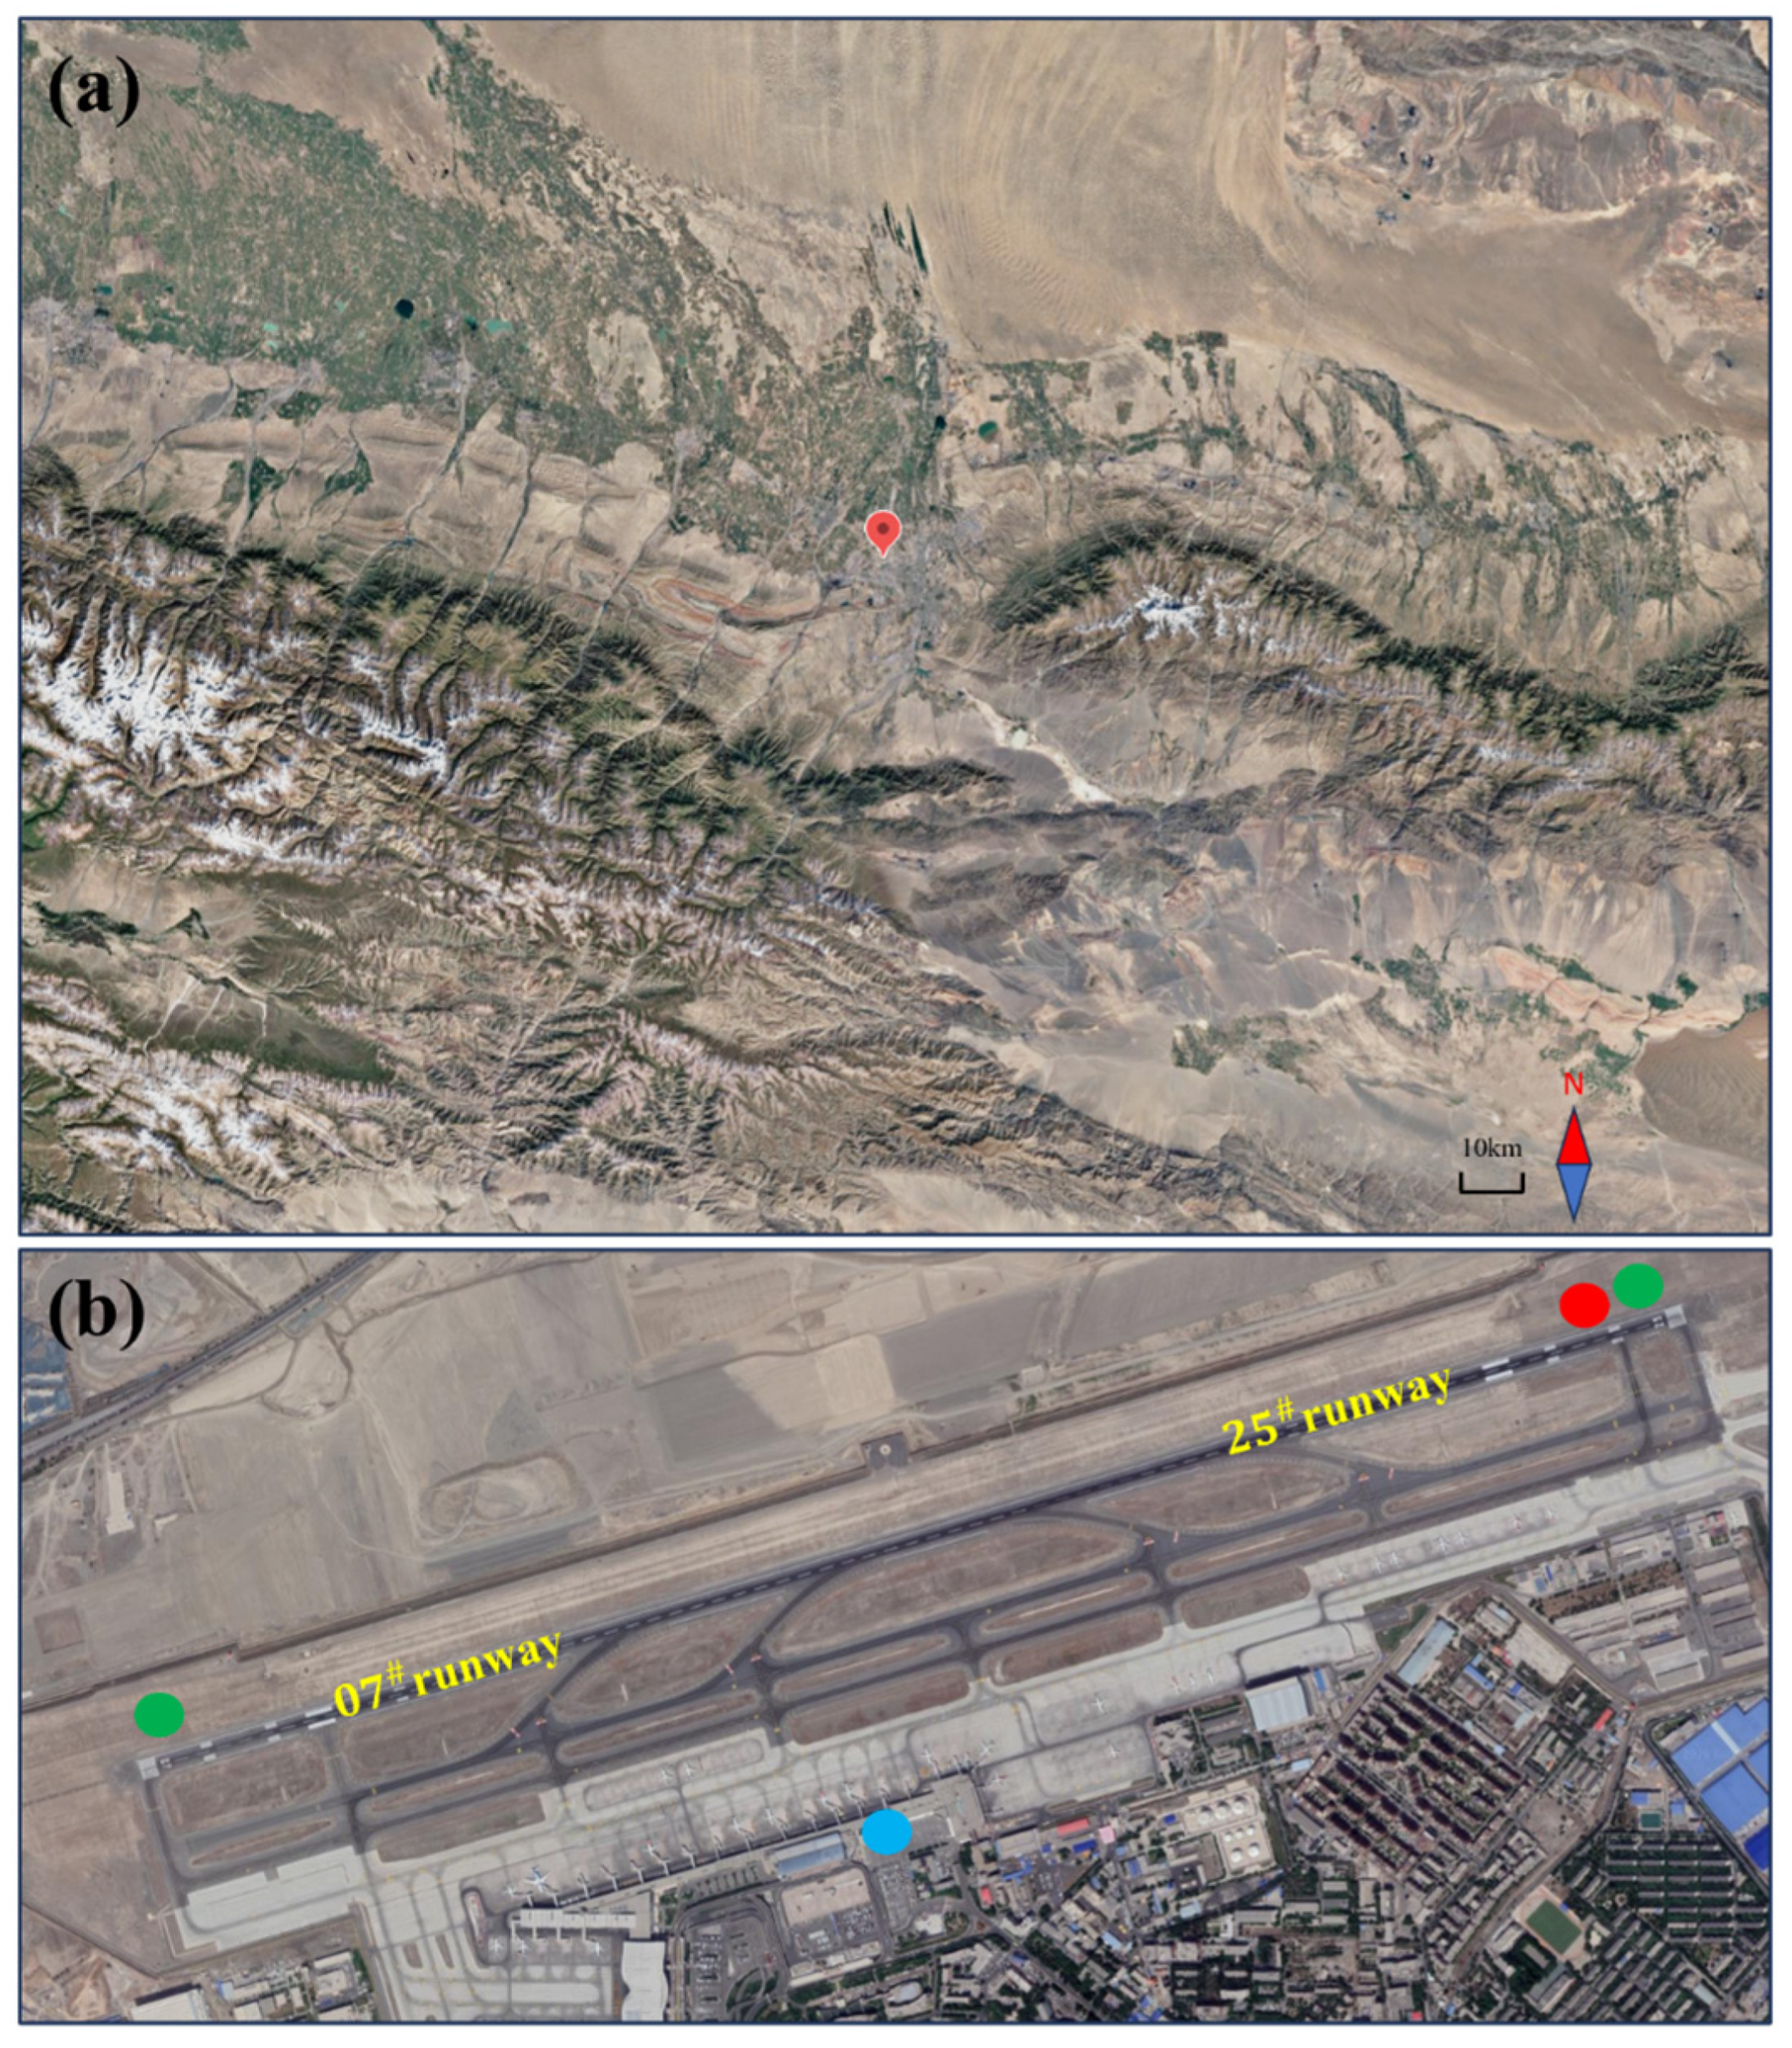
Urumqi Diwopu International Airport (hereafter referred to as Urumqi Airport) is located at the boundary between Airport Subdistrict and Diwopu Township in Xinshi District, Urumqi City, Xinjiang Uygur Autonomous Region, China. The airport is situated at an elevation of 647.6 m and approximately 17 km northwest of downtown Urumqi, and is classified as a 4E international airport. As shown in Figure 1, the airport has a southwest–northeast-oriented runway with magnetic headings of 70° and 250°, designated as Runway 07 and Runway 25, respectively, with a length of 3600 m. Located at the northwestern opening of a southeast–northwest-oriented valley between the eastern and western Tianshan Mountains, the airport is frequently affected by strong winds and other hazardous weather conditions due to the narrowing of the valley from south to north [24].
Figure 1.
Topography around Urumqi Airport and instrument layout in 2022. (a) Topography surrounding the airport; (b) Detailed layout of instruments (the green circle represents AWOS, the red circle represents Doppler wind lidar, and the blue circle represents microwave radiometer. The microwave radiometer was approximately 1500 m from the Runway 07 AWOS and approximately 2200 m from both the Runway 25 AWOS and the Doppler wind lidar).
The observational data used in this study were mainly obtained from the Automated Weather Observing System (AWOS), an HGT-4 ground-based microwave radiometer, and an FC-III Doppler lidar system. The AWOS observations include temperature, humidity, atmospheric pressure, wind speed, and wind direction. The temporal resolution of wind speed and wind direction measurements is 15 s, whereas the other parameters are recorded at a temporal resolution of 1 min.
The HTG-4 microwave radiometer used in this study was developed by Beijing Airda Electronic Equipment Co., Ltd. (Beijing, China). The instrument can continuously monitor the atmospheric vertical structure from 0 to 10 km, providing temperature, relative humidity, water vapor density, integrated water vapor (IWV), and liquid water content (LWC). The radiometer is equipped with 14 microwave channels covering two primary frequency bands. Among them, seven channels within the 22–31 GHz frequency band are mainly used for humidity profile observations, whereas seven channels within the 51–58 GHz frequency band are used for temperature profile observations [25]. The detailed technical specifications of the instrument are listed in Table 1.
Table 1.
Main technical parameters of HTG-4 microwave radiometer.
The FC-III Doppler lidar used in this study was developed by Sichuan Xiwu Laser Technology Co., Ltd. Chengdu, China [24,26]. The retrieved data include radial velocity, horizontal wind direction and speed, vertical wind velocity, and signal-to-noise ratio (SNR). The main technical specifications of the lidar are summarized in Table 2. The lidar operates in four observation modes: Plan Position Indicator (PPI), Range Height Indicator (RHI), Doppler Beam Swinging (DBS), and Glide Path (GP) modes. The lidar operates continuously under all-weather conditions, and each hybrid-mode scanning cycle requires 8–10 min. Each cycle consists of one DBS scan, one PPI scan at an elevation angle of 3°, one PPI scan at an elevation angle of 6°, one RHI scan along the runway orientation, and one GP scan.
Table 2.
Main performance parameters of FC-III Doppler wind lidar.
2.2. Introduction to Downburst-Related Parameters
Microwave radiometer sounding data can provide reliable convective parameters, such as convective available potential energy (CAPE) and downdraft convective available potential energy (DCAPE), as well as empirical indices, including the Wind Index (WINDEX) and Microburst Wind Potential Index (MWPI). These parameters are employed to quantitatively investigate the characteristics and evolution of the downburst event in this study.
CAPE () is a key indicator of atmospheric convective instability and represents the maximum buoyant energy available to an air parcel during ascent in the free troposphere. This buoyant energy can be converted into kinetic energy of convective updrafts. The calculation formula is expressed as follows:
where represents the environmental virtual temperature (), denotes the parcel virtual temperature (), EL is the equilibrium level, and LFC is the level of free convection.
() serves as a potential indicator for evaluating the intensity of prospective downdrafts. By integrating the potential temperature difference between a saturated descending air parcel and the surrounding environment, it quantifies the maximum kinetic energy that a downdraft can acquire during its descent from the source level to the surface. Based on the principle of negative buoyancy, it reflects the driving force acting on the parcel as it sinks due to being cooler than its environment, thus providing a theoretical basis for assessing the strength of thunderstorm downdrafts. The calculation formula is expressed as follows:
where () is the specific gas constant for dry air, () represents the environmental virtual temperature, () denotes the parcel virtual temperature, is the initial sinking level of the descending air parcel, and is the surface level.
MWPI is an empirical index that quantifies the potential strength of downburst gusts produced by convective storms by combining three key environmental parameters, including , low-to-mid-tropospheric temperature lapse rate, and dewpoint depression. By normalizing these parameters, MWPI generates a dimensionless value designed to assist forecasters in evaluating microburst risk under moderate thermodynamic conditions and weak wind shear. The calculation formula is expressed as follows:
where () represents the temperature lapse rate, (°C) denotes the dewpoint depression at , and (°C) represents the dewpoint depression at .
() is an empirical downburst forecasting index. It comprehensively incorporates key atmospheric parameters, including the melting layer height, environmental lapse rate, and moisture content in both the lower troposphere and the melting layer. Through a combination of these parameters and empirical coefficients, aims to estimate the potential maximum surface gust speed and has demonstrated good performance in potential forecasting across multiple regions [27,28]. The calculation formula is expressed as follows:
where () is the height of the melting layer, () represents the lapse rate from the surface to the melting layer, () denotes the mean mixing ratio in the lowest AGL (above ground level), , and () represents the mixing ratio at the melting layer.
2.3. Validation of Microwave Radiometer Data
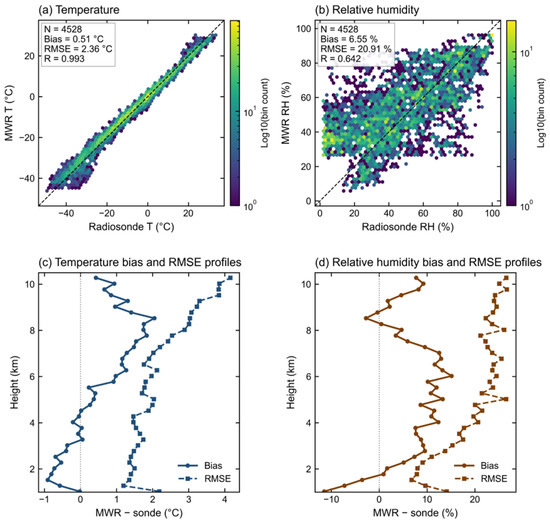
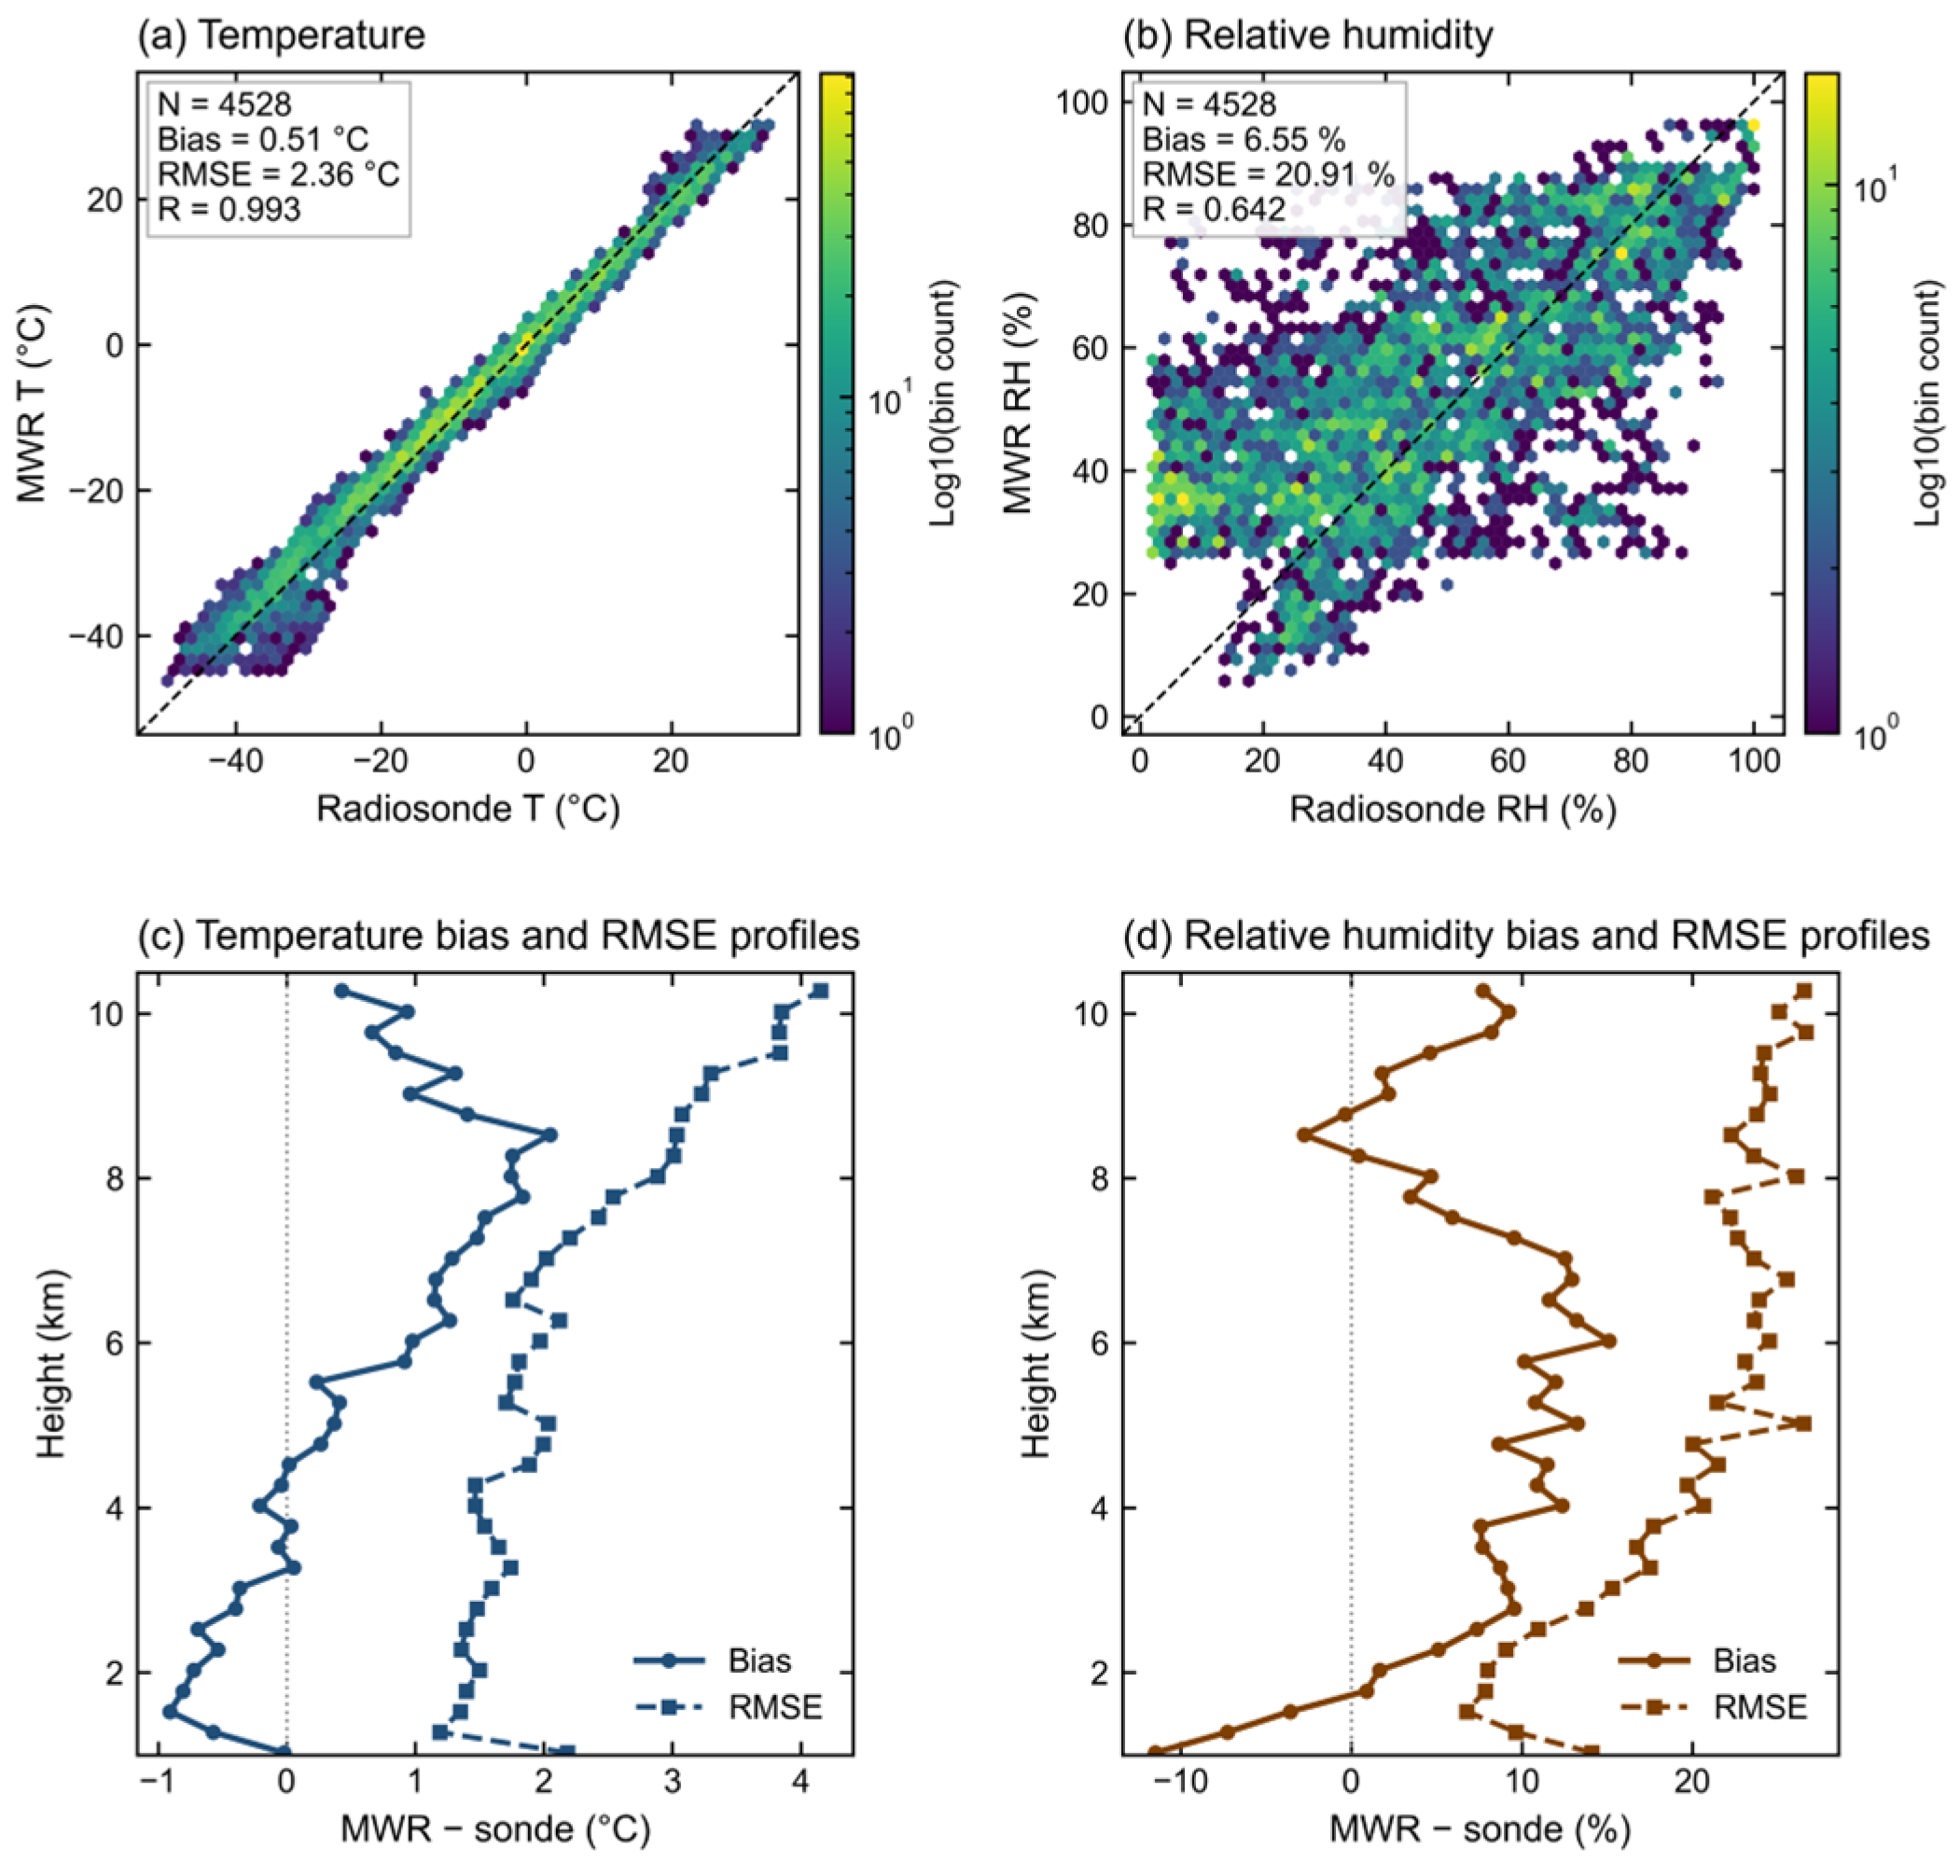
Using 57 radiosonde observations collected at station 51,463 in July 2022, the temperature and relative humidity retrieved from the microwave radiometer were evaluated. Radiosondes at station 51,463 were launched twice daily, at 23:15 and 11:15 UTC, and required approximately 30 min to ascend to an altitude of 10,000 m. The microwave radiometer produced one data value every 20 s; the mean values of the data from 23:15–23:45 and 11:15–11:45 were used and interpolated onto the height grid of the radiosonde observations, yielding a total of 4528 samples. Figure 2a shows that the temperature retrievals from the microwave radiometer are in close agreement with the radiosonde observations. The scatter points are closely distributed around the 1:1 reference line, with a Pearson correlation coefficient of 0.993, a mean bias of 0.51 °C, and a root-mean-square error (RMSE) of 2.36 °C. The vertical profiles further indicate that the temperature bias remains relatively small in the lower and middle troposphere, generally within ±1.5 °C (Figure 2c). The RMSE is relatively larger at higher altitudes, reaching approximately 4 °C above 9 km, whereas it remains relatively low in the lower troposphere. Compared with the temperature retrievals, the relative humidity retrievals exhibit greater uncertainty (Figure 2b). Nevertheless, the relative humidity retrieved by the microwave radiometer still shows a moderate positive correlation with the radiosonde measurements, with a Pearson correlation coefficient of 0.642, a mean bias of 6.55%, and an RMSE of 20.91%. The scatter points are more widely distributed, particularly in the middle and upper troposphere. As shown in Figure 2d, the relative humidity bias is generally positive below approximately 10 km. At most altitude levels, the RMSE ranges from approximately 10% to 20%, although relatively larger values occur at several levels in the upper troposphere.
Figure 2.
Comparison of temperature and relative humidity profiles retrieved by the ground-based microwave radiometer with radiosonde observations. (a,b) Scatter plots of the retrieved temperature and relative humidity against the corresponding radiosonde observations, respectively. (c,d) Vertical profiles of temperature and relative humidity bias (solid lines) and root-mean-square error (RMSE; dashed lines), respectively. Here, N denotes the number of samples, Bias denotes the mean bias calculated as the microwave radiometer retrieval minus the radiosonde observation, RMSE denotes the root-mean-square error, and R denotes the Pearson correlation coefficient.
The relatively lower correlation in relative humidity may be attributed to two main factors. First, the microwave radiometer and the radiosonde launching site were approximately 18 km apart, and the atmospheric conditions sampled at the two locations may therefore differ substantially, particularly in the presence of strong horizontal heterogeneity. Second, the two observing systems have fundamentally different sampling principles. The microwave radiometer provides retrievals based on vertically integrated radiometric measurements over a fixed ground-based location, whereas the radiosonde measures atmospheric conditions along a balloon-borne trajectory that drifts horizontally with the ambient wind. Consequently, the two instruments may sample different air masses even when observations are compared at the same nominal altitude and time, which can contribute to the relatively lower correlation in relative humidity [29].
Overall, the validation results demonstrate that the microwave radiometer provides reliable temperature retrievals with high consistency with the radiosonde observations. Although the relative humidity retrievals exhibit relatively larger errors, they are still capable of reproducing the overall vertical structure of atmospheric moisture observed by the radiosonde. Given its high temporal resolution and capability for continuous profiling, the microwave radiometer provides a useful means of capturing the rapid evolution of the thermodynamic environment associated with convective weather events. In particular, the retrieved temperature and humidity profiles provide valuable background information for examining the evolution of the thermodynamic conditions preceding the microburst event investigated in this study.
3. Characteristics of Weather Conditions
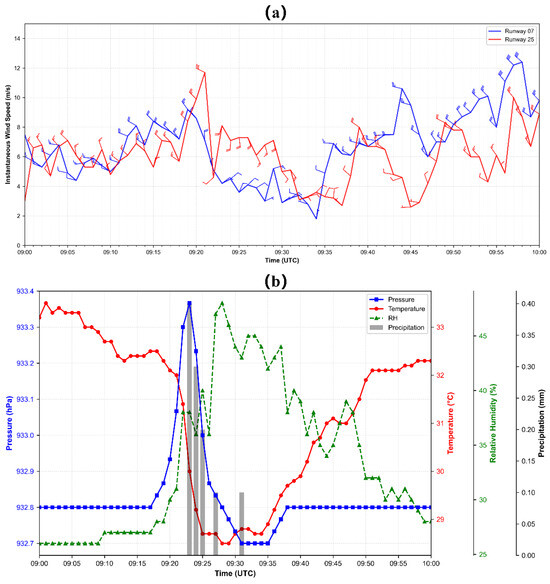
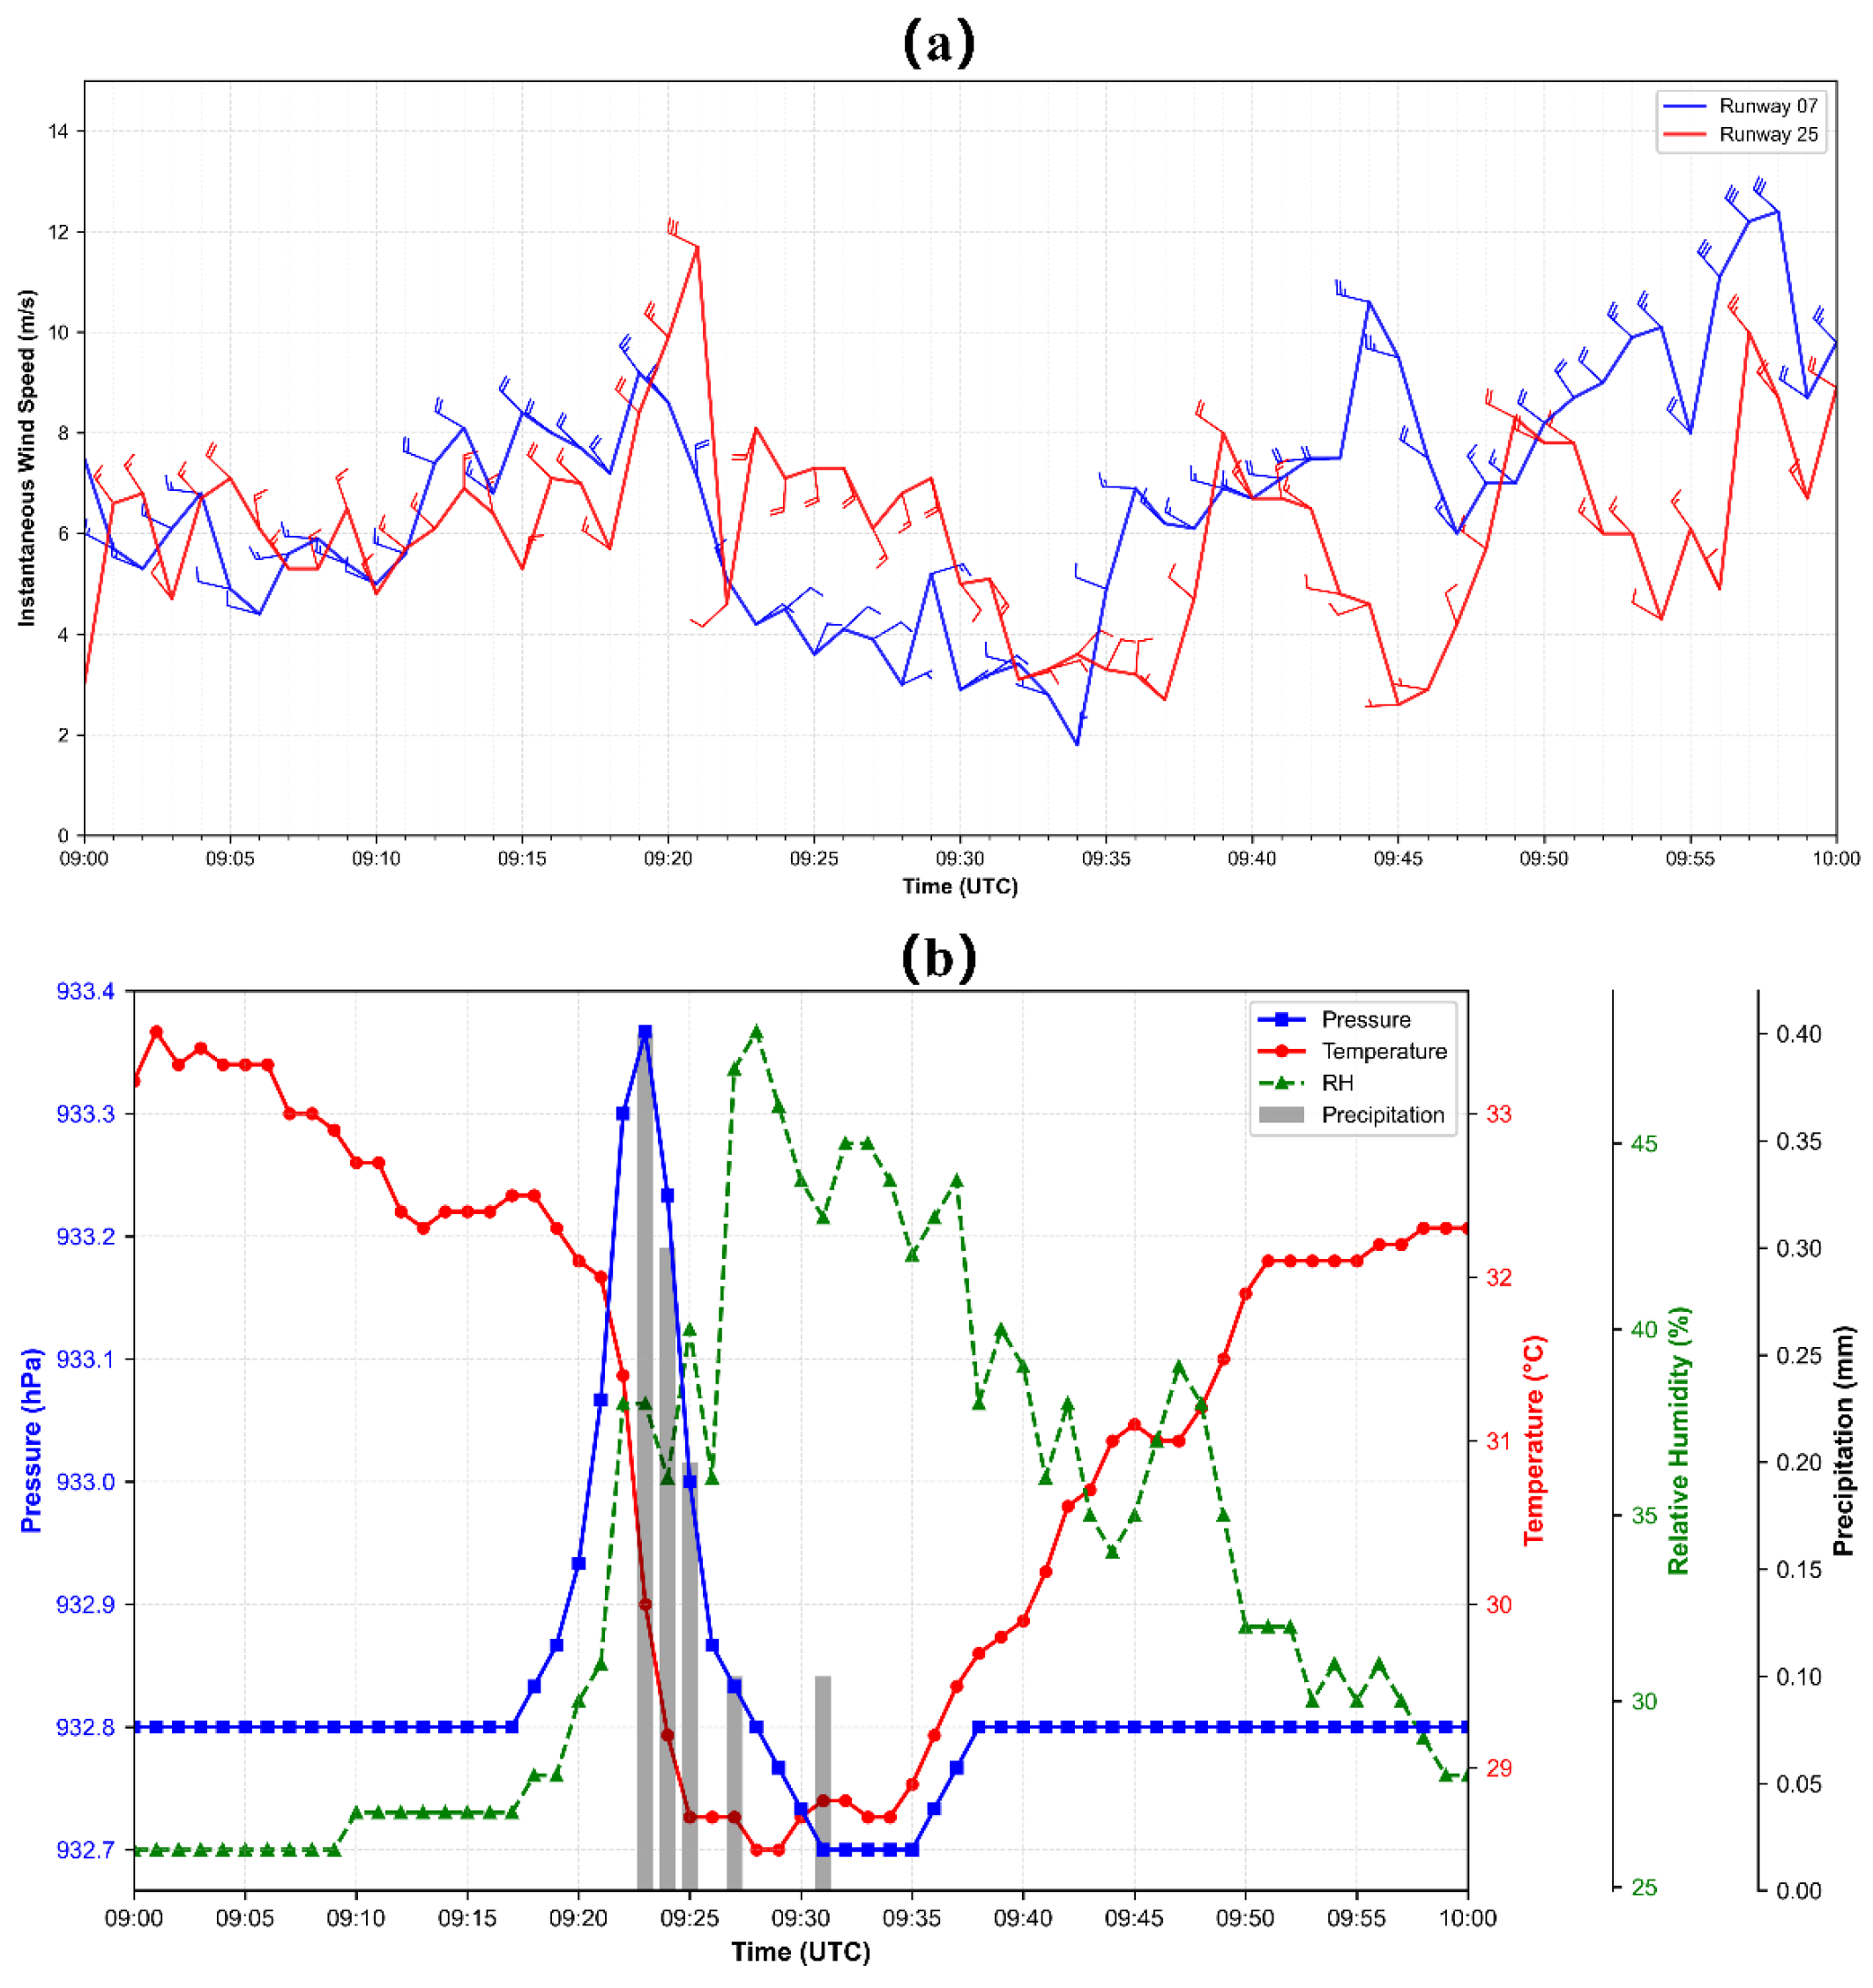
A microburst event occurred at Urumqi Airport, Xinjiang, between 09:00 and 10:00 UTC on 25 June 2022. At 09:00 UTC, cumulonimbus clouds were manually observed. From 09:00 to 09:23 UTC, the Automated Weather Observing System (AWOS) recorded consistent northwesterly winds along both Runways 07 and 25 (Figure 3a). At 09:18 UTC, the wind speed at Runway 25 was , which increased to by 09:21 UTC before dropping sharply to within . At 09:23 UTC, the wind direction at Runway 25 shifted abruptly to southeasterly (a wind direction shift of up to ), and the wind speed recovered to approximately . From 09:31 to 09:36 UTC, the wind direction gradually veered back from southeasterly to northwesterly. For Runway 07, the wind remained northwesterly between 09:00 and 09:23 UTC with decreasing speeds; it shifted to northeasterly at 09:24 UTC with speeds ranging from , and turned northwesterly again at 09:32 UTC. The wind field variations above Runway 07 exhibited a time lag compared with Runway 25, indicating that Runway 25 was impacted by the microburst prior to Runway 07. Given that the AWOS instruments were not positioned in the core area of the microburst, the wind speeds measured by AWOS were relatively low. Section 5 will provide a further analysis of the microburst wind field structure using Doppler wind lidar.
Figure 3.
Time series of meteorological elements recorded by AWOS along the runways at Urumqi Airport on 25 June 2022: (a) wind speed and wind direction for Runways 07 and 25; (b) pressure, temperature, relative humidity, and instantaneous precipitation rate for Runway 25.
As shown in Figure 3b, the surface pressure at Runway 25 fluctuated between and , displaying a distinct symmetrical distribution bounded by the peak value at 09:23 UTC (). From 09:16 to 09:23 UTC, the surface pressure continuously climbed at a rate of , corresponding to the thunderstorm high formed by the accumulation of strong downdrafts at the surface. Between 09:23 and 09:31 UTC, the pressure rapidly dropped with a maximum pressure decrease rate of , reflecting the swift passage of the high-pressure system. Regarding temperature variations, the surface air temperature at Runway 25 peaked at 33.5 °C at 09:01 UTC and decreased continuously thereafter. At 09:18 UTC, accompanied by rain showers, the temperature dropped at a rate of 0.5 °C·min−1. This temperature drop was highly synchronized with the pressure surge, demonstrating the combined effects of evaporative cooling from precipitation and the accumulation of cold air descending from aloft. The temperature plummeted to a minimum of 28.5 °C at 09:26 UTC and gradually recovered afterward. Meanwhile, the relative humidity surged from 27% at 09:09 UTC to 47% at 09:29 UTC. Surface precipitation occurred from 09:23 to 09:31 UTC, with total accumulated precipitation reaching .
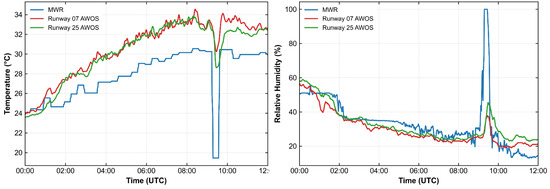
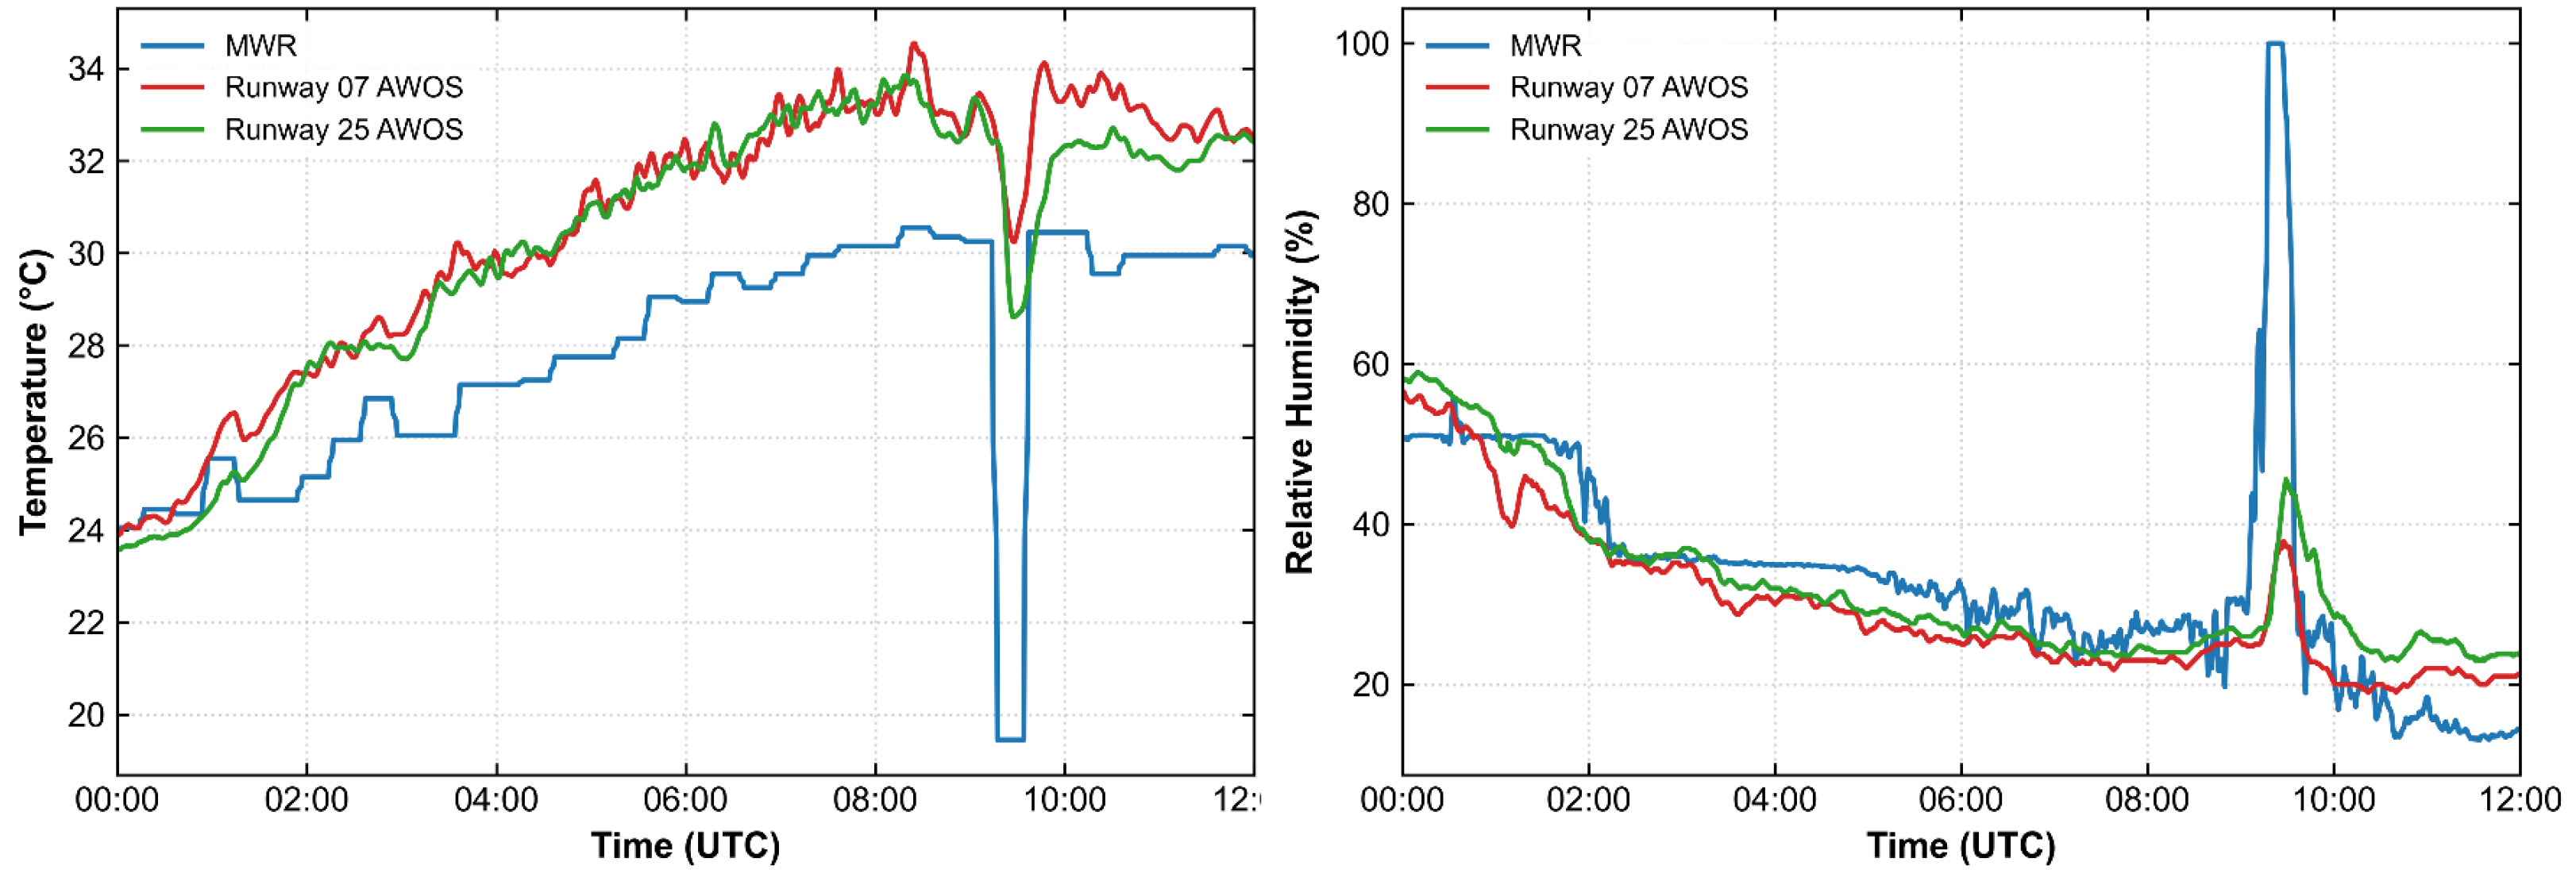
Figure 4 and Table 3 and Table 4 show that during the non-downburst period (00:00–12:00 UTC, excluding 09:00–10:00), the microwave radiometer observations were in good agreement with those of the AWOS. For runways 07 and 25, the correlation coefficients for temperature were 0.97 and 0.96, respectively, with root-mean-square errors (RMSEs) of 2.71 °C and 2.49 °C. The corresponding correlation coefficients for relative humidity were 0.92 and 0.89, with RMSEs of 5.03% and 5.15%. During the downburst-affected period (09:00–10:00 UTC), both temperature and relative humidity exhibited pronounced differences. As shown in Figure 4, the temperature measured by the microwave radiometer decreased sharply while the relative humidity increased, whereas the variations recorded by the AWOS were considerably smaller. Accordingly, the temperature RMSEs for runways 07 and 25 increased to 7.17 °C and 6.37 °C, and the relative humidity RMSEs increased to 34.29% and 33.44%, respectively. The temperature correlation coefficients decreased to 0.84 and 0.54, and the relative humidity correlation coefficients decreased to 0.80 and 0.24, respectively. These differences may be attributable to the higher precision of the microwave radiometer and the closer proximity of the microburst to the radiometer, which further suggests that this microburst was small in scale but high in intensity. From 09:18 to 09:27 UTC, the relative humidity measured by the microwave radiometer reached a maximum of 100%, corresponding to the precipitation period during the microburst.
Figure 4.
Time series comparison of temperature and relative humidity observed by the microwave radiometer and AWOS at Runways 07 and 25 of Urumqi Airport on 25 June 2022.
Table 3.
Statistical comparison of surface temperature and relative humidity measured by the microwave radiometer and AWOS at Runway 07 of Urumqi Airport on 25 June 2022.
Table 4.
Statistical comparison of surface temperature and relative humidity measured by the microwave radiometer and AWOS at Runway 25 of Urumqi Airport on 25 June 2022.
In summary, a short-lived and small-scale microburst event occurred at Urumqi Airport on 25 June 2022. Between 09:23 and 09:36 UTC, the wind direction experienced a transition from northwesterly to southeasterly, northeasterly, and finally back to northwesterly. The abrupt changes in wind direction and speed, accompanied by a sharp temperature decrease and a pressure perturbation characterized by an initial increase followed by a decrease, provided strong evidence that this event was a microburst [3,20,26,30].
4. Thermodynamic Characteristics of the Microburst Environment
The occurrence of downbursts typically depends on strong thermodynamically unstable stratification, effective convective triggering mechanisms, and specific moisture distribution characteristics [31]. This section quantitatively analyzes the thermodynamic stratification characteristics of this microburst event using high-temporal-resolution temperature and humidity profiles obtained from the ground-based microwave radiometer.
4.1. Sounding Characteristics
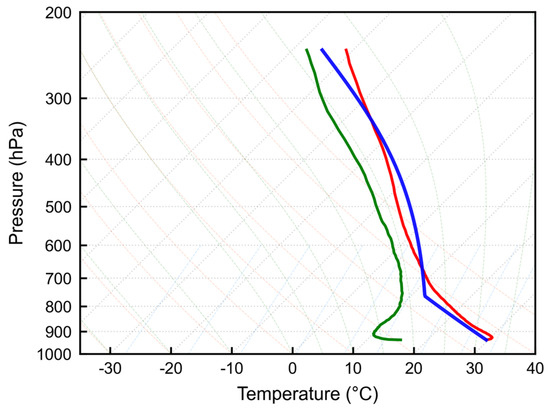
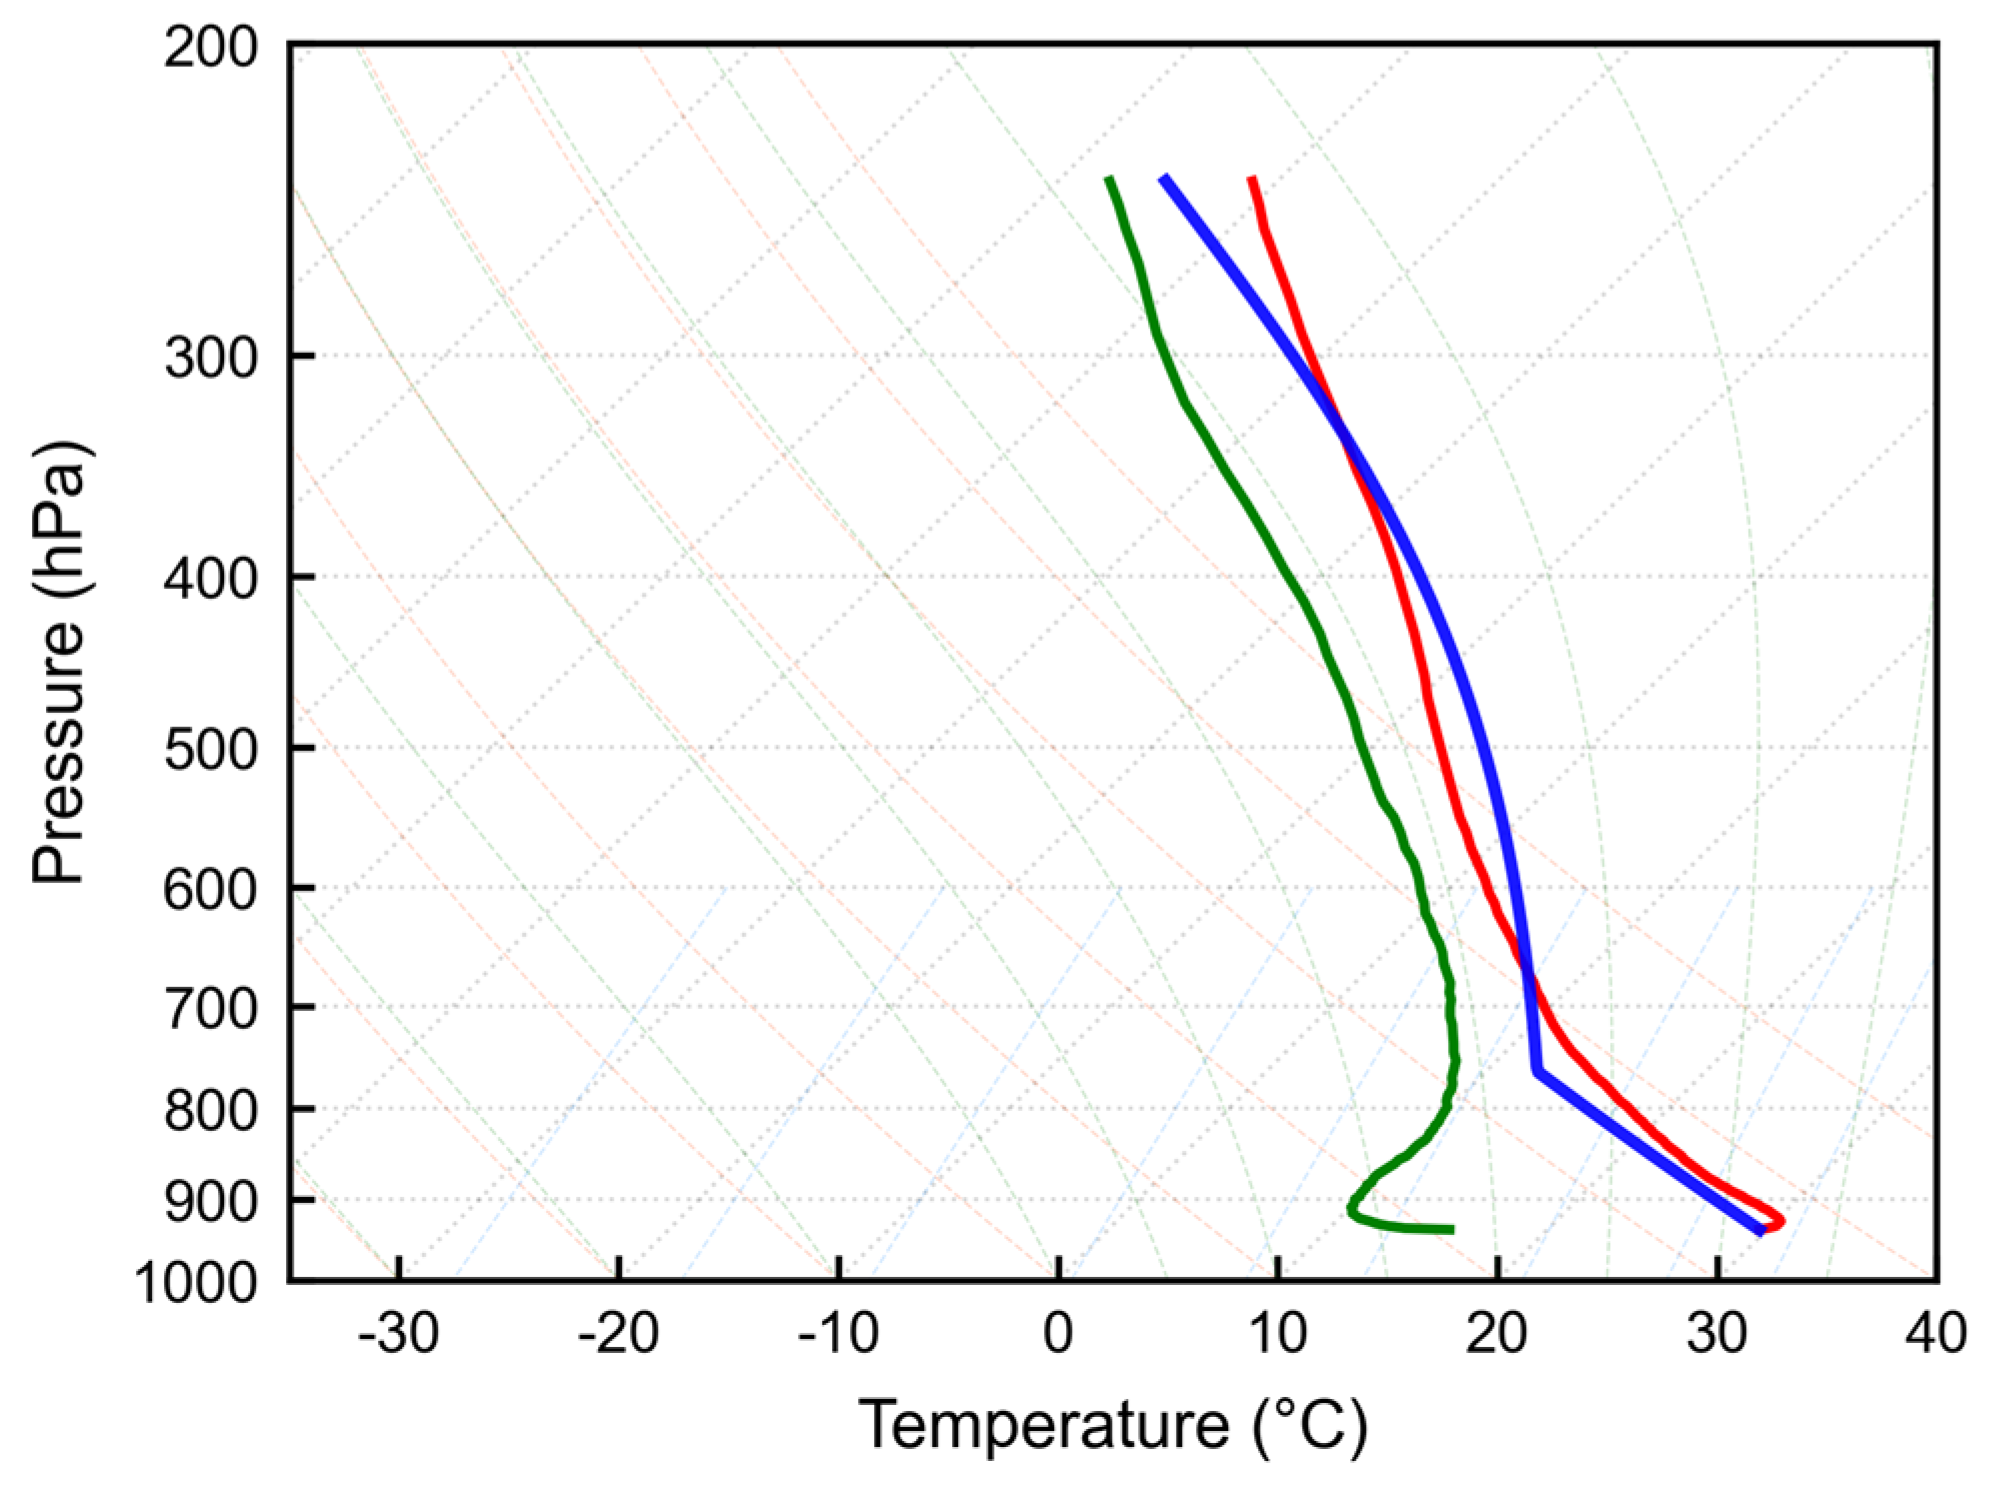
As shown in Figure 5, at 09:00 UTC, a significant vertical temperature lapse rate was present in the atmosphere, particularly below , the environmental temperature closely followed the dry adiabatic lapse rate. The boundary layer was well-mixed, and such a thermal structure favors downward momentum transport and the generation of strong downdrafts [32,33]. Meanwhile, from the surface to , the temperature and humidity profiles exhibited a distinct “inverted-V” stratification pattern. Near the surface, the dewpoint depression was remarkably large, reaching up to 18 °C, whereas in the mid-levels (), the dewpoint depression was small at only 2 °C, with the temperature and dewpoint curves tending to merge. This “inverted-V” structure is conducive to the development of microbursts [31,33,34].
Figure 5.
Atmospheric sounding profiles at Urumqi Airport at 09:00 UTC on 25 June 2022 (The red solid line represents the air temperature (°C), the green solid line represents the dewpoint temperature (°C), and the blue solid line represents the parcel path).
4.2. Temperature and Humidity Characteristics of the Environmental Field
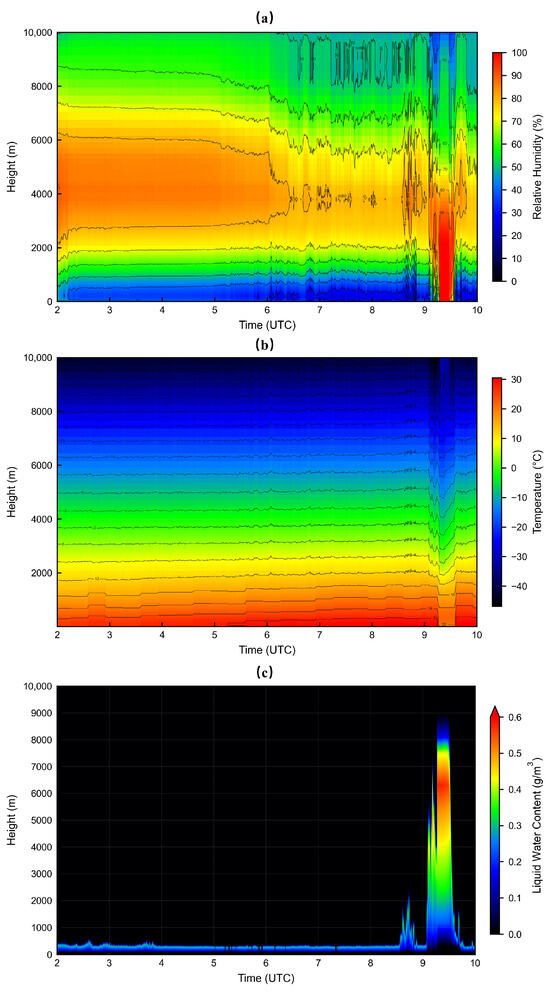
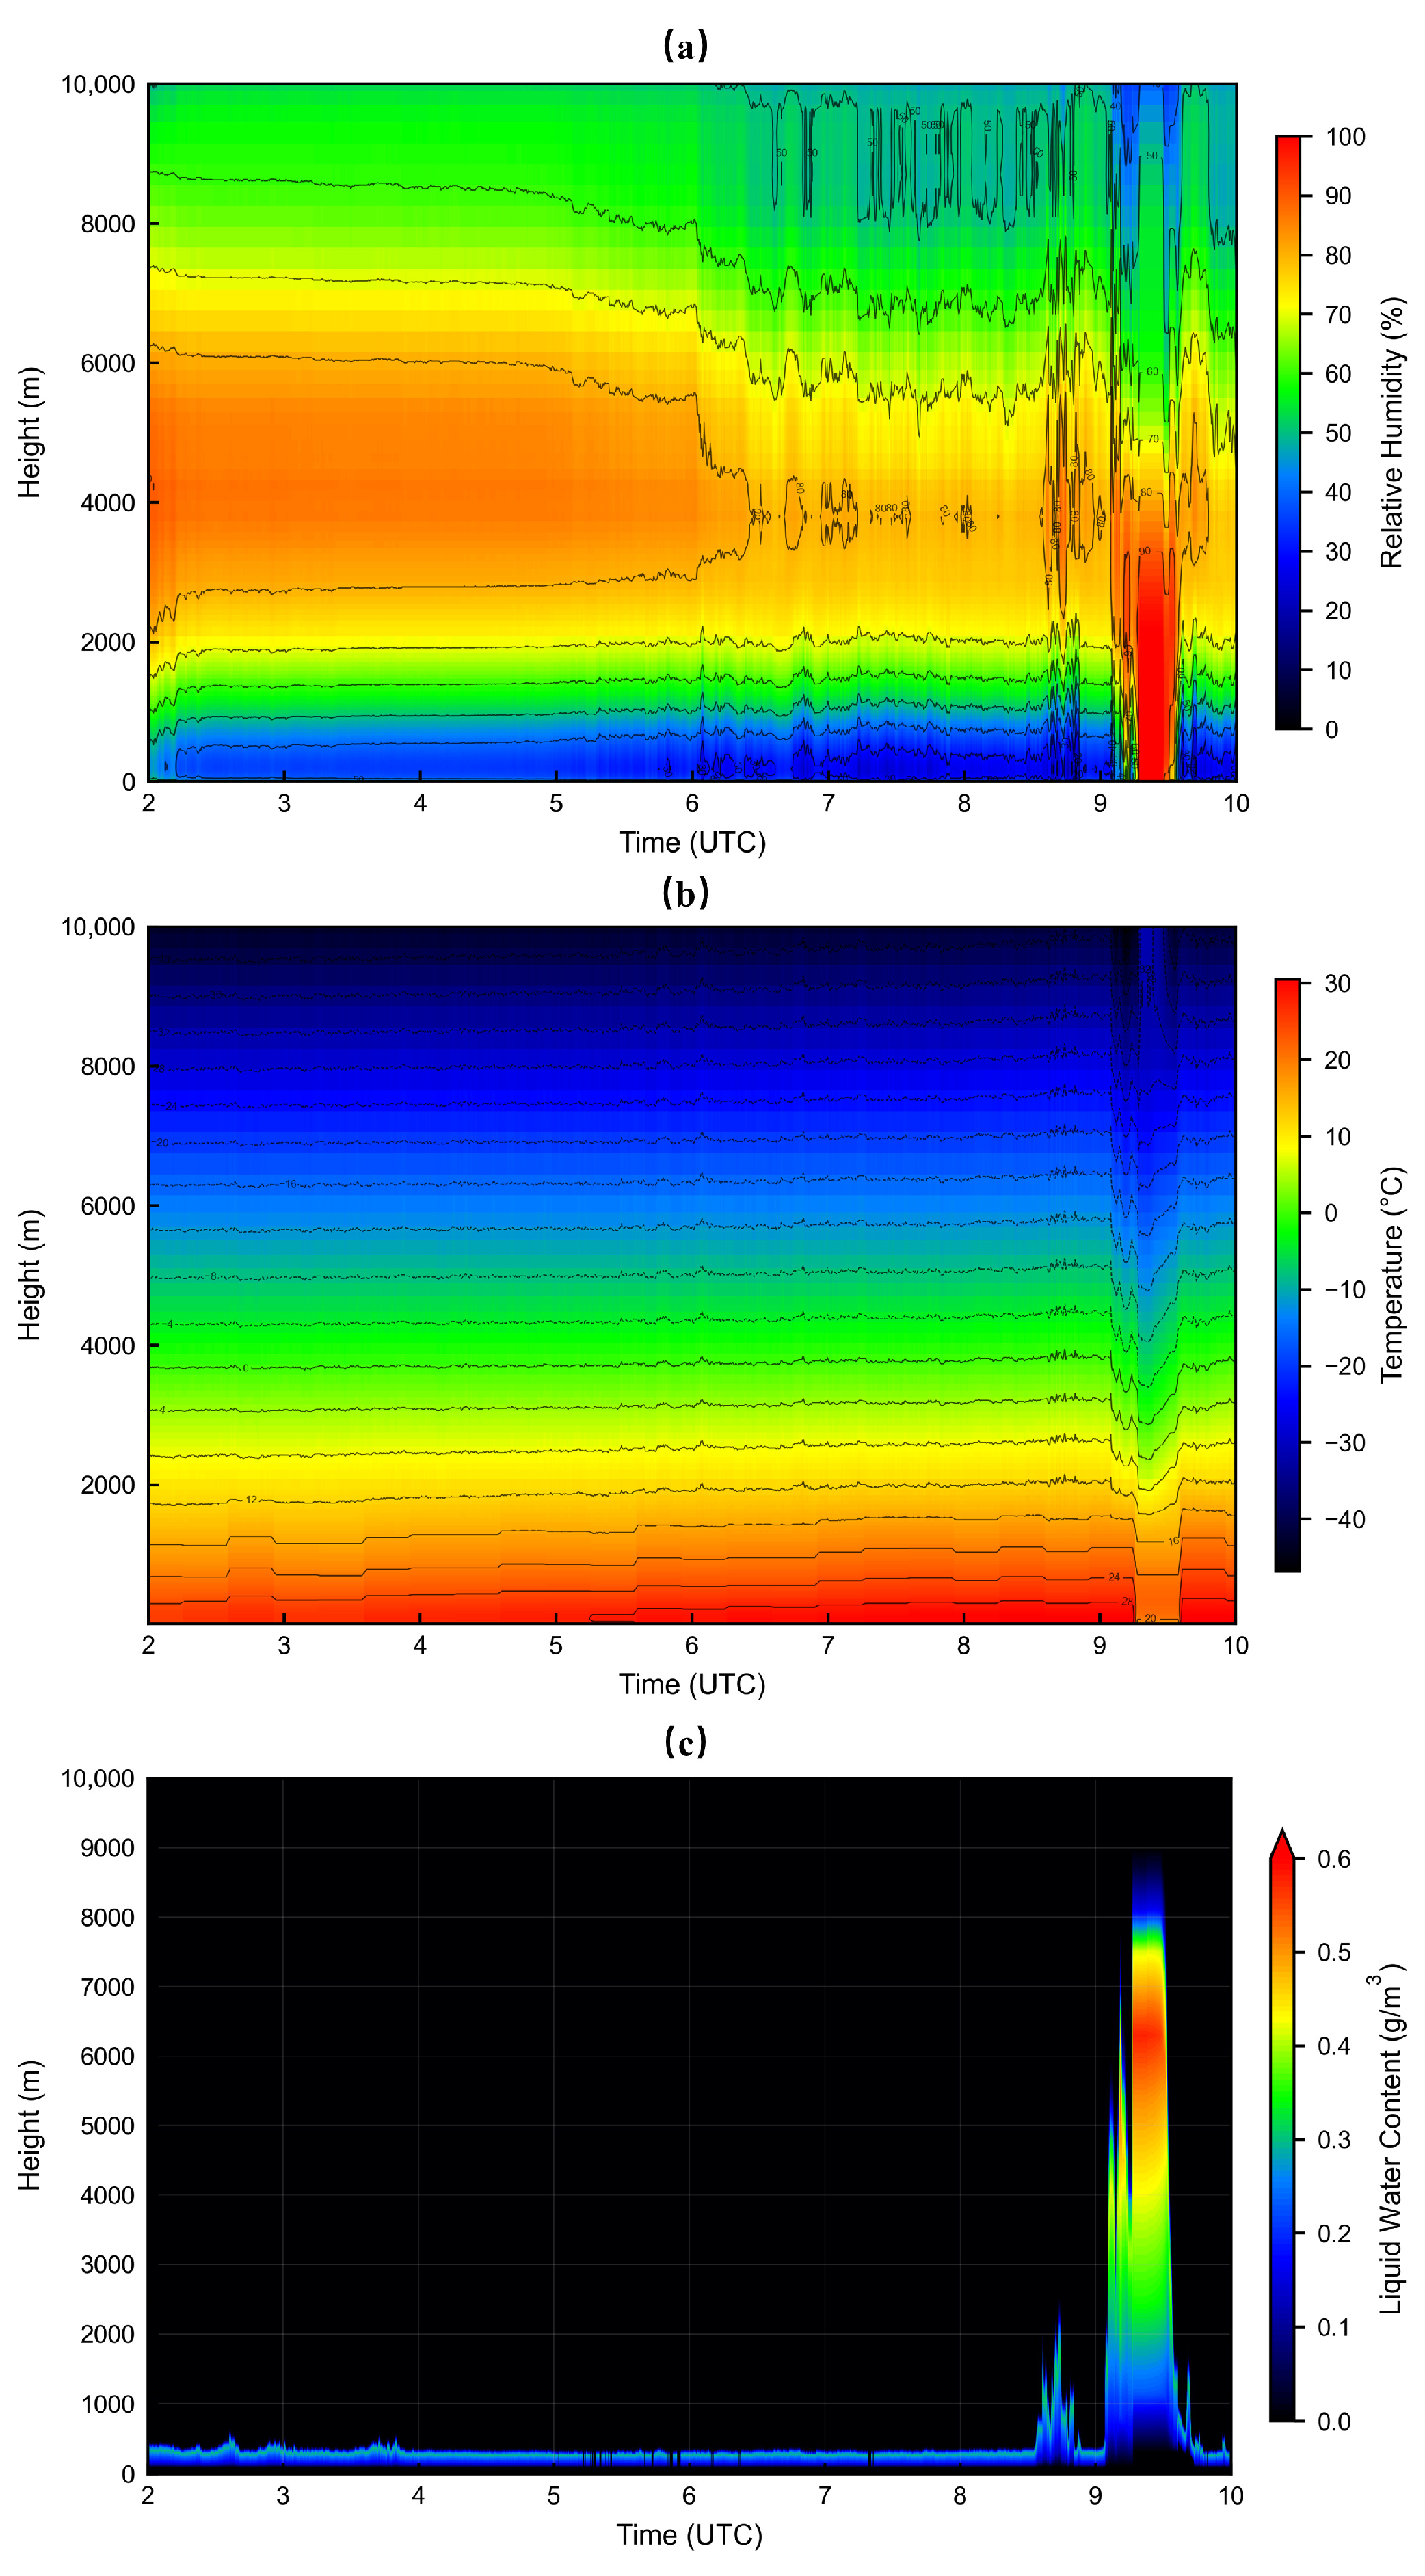
As shown in Figure 6a, from 02:00 to 09:00 UTC, the relative humidity below at Urumqi Airport remained below , indicating a dry lower-troposphere. From 02:00 to 09:00 UTC, the relative humidity in the 2000–6500 m layer exceeded 80%, indicating abundant moisture accumulation in the mid-troposphere. After 06:00 UTC, the relative humidity in this layer gradually decreased to 70%, and the moist layer became progressively thinner. Beginning at 09:05 UTC, the relative humidity in the 2000–4000 m layer increased rapidly to above 80%, and the high-humidity region expanded gradually over time. At 09:16 UTC, the relative humidity in the layer reached , which was associated with the vertical transport of moisture driven by intense convective updrafts. Figure 6b shows that a dry and warm layer below 2000 m was maintained from 02:00 to 09:16 UTC, with the surface temperature remaining above 24 °C. With intensifying solar radiation, the surface temperature continuously increased, and reached a maximum of 30.5 °C, which facilitated the formation of an unstable stratification [35,36]. Starting from 09:16 UTC, the temperature field exhibited pronounced vertical fluctuations. A distinct “cold tongue” extended downward from the upper levels to the surface. The isotherms exhibited significant downward bending. During the microburst occurrence, powerful downdrafts transported cold air from higher levels toward the surface, resulting in a significant surface temperature decrease, which was consistent with AWOS observations. Figure 6c shows that around 09:05 UTC, the liquid water content began to increase rapidly. At 09:16 UTC, it reached its maximum value of 0.54 g·m−3, which was consistent with the variation characteristics of relative humidity in Figure 6a. As the liquid water passed through the dry and warm low-level region, it absorbed ambient heat and evaporated, leading to environmental cooling and an increase in air density, which accelerated the descent of the dry-cold air. Concurrently, the downward motion of liquid water from aloft produced a drag effect that further intensified the downdraft.
Figure 6.
Time-height cross sections of relative humidity, temperature, and liquid water content retrieved from the microwave radiometer at Urumqi Airport on 25 June 2022: (a) Relative humidity; (b) Temperature; (c) Liquid water content.
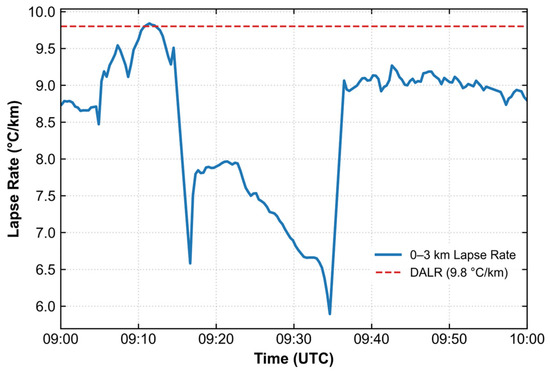
Figure 7 shows the temporal evolution of the temperature lapse rate in the 0–3 km layer from 09:00 to 10:00 UTC. From 09:05 to 09:12 UTC, the lapse rate increased rapidly from 8.7 °C · km−1 and reached a maximum value of 9.8°C · km−1 at approximately 09:12 UTC. Atmospheric temperature lapse rate almost coincided with the dry adiabatic lapse rate (DALR, 9.8 °C km−1). This indicated that the lower troposphere was extremely unstable. From 09:12 to 09:35 UTC, the temperature lapse rate decreased rapidly and reached its minimum value at 09:35 UTC. This rapid decline corresponded to the arrival of the microburst downdraft at the surface and the formation of a cold pool.
Figure 7.
Temporal evolution of the temperature lapse rate within the 0–3 km layer at Urumqi Airport on 25 June 2022.
4.3. Characteristics of Microburst-Related Parameters
The evolution of CAPE, DCAPE, MWPI, and WINDEX was analyzed to further characterize the thermodynamic instability associated with the microburst event.
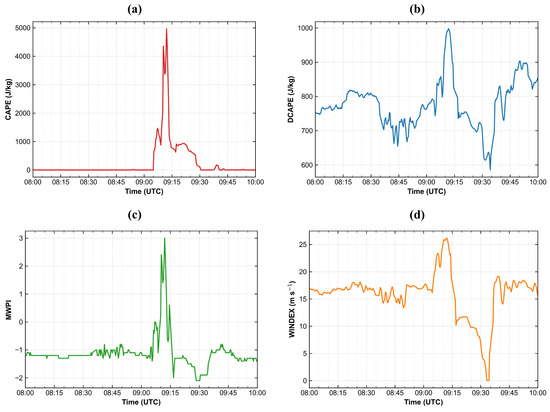
Figure 8a shows that CAPE began to increase rapidly after 09:05 UTC and reached a maximum value of at 09:12 UTC. This indicates that the microburst occurred in an exceptionally unstable atmospheric environment, which was favorable for the development of deep convection. Subsequently, CAPE decreased rapidly within a short period and returned to at 09:35 UTC. As shown in Figure 8b, DCAPE experienced a significant and continuous increase after 09:05 UTC and reached a maximum value of at 09:12 UTC. Thereafter, DCAPE began to decrease and reached a minimum value of at 09:35 UTC. DCAPE decreased by 419 within 23 min. The release of DCAPE during the microburst event enabled downdrafts to gain energy from the ambient atmosphere, establishing favorable environmental conditions for high surface wind speeds. Figure 8c shows that MWPI remained relatively low and negative before 09:05 UTC. From 09:05 to 09:12 UTC, MWPI increased rapidly with the enhancement of atmospheric instability and reached a maximum value of at 09:12 UTC, indicating that the environmental stratification below the cloud base had become favorable for microburst development. Subsequently, MWPI decreased gradually and reached its minimum value at 09:35 UTC. Figure 8d shows that WINDEX increased rapidly from 09:05 to 09:12 UTC and reached a maximum value of at 09:12 UTC, suggesting a strong potential of the ambient atmosphere to produce microbursts. Subsequently, WINDEX decreased sharply and declined to at 09:35 UTC.
Figure 8.
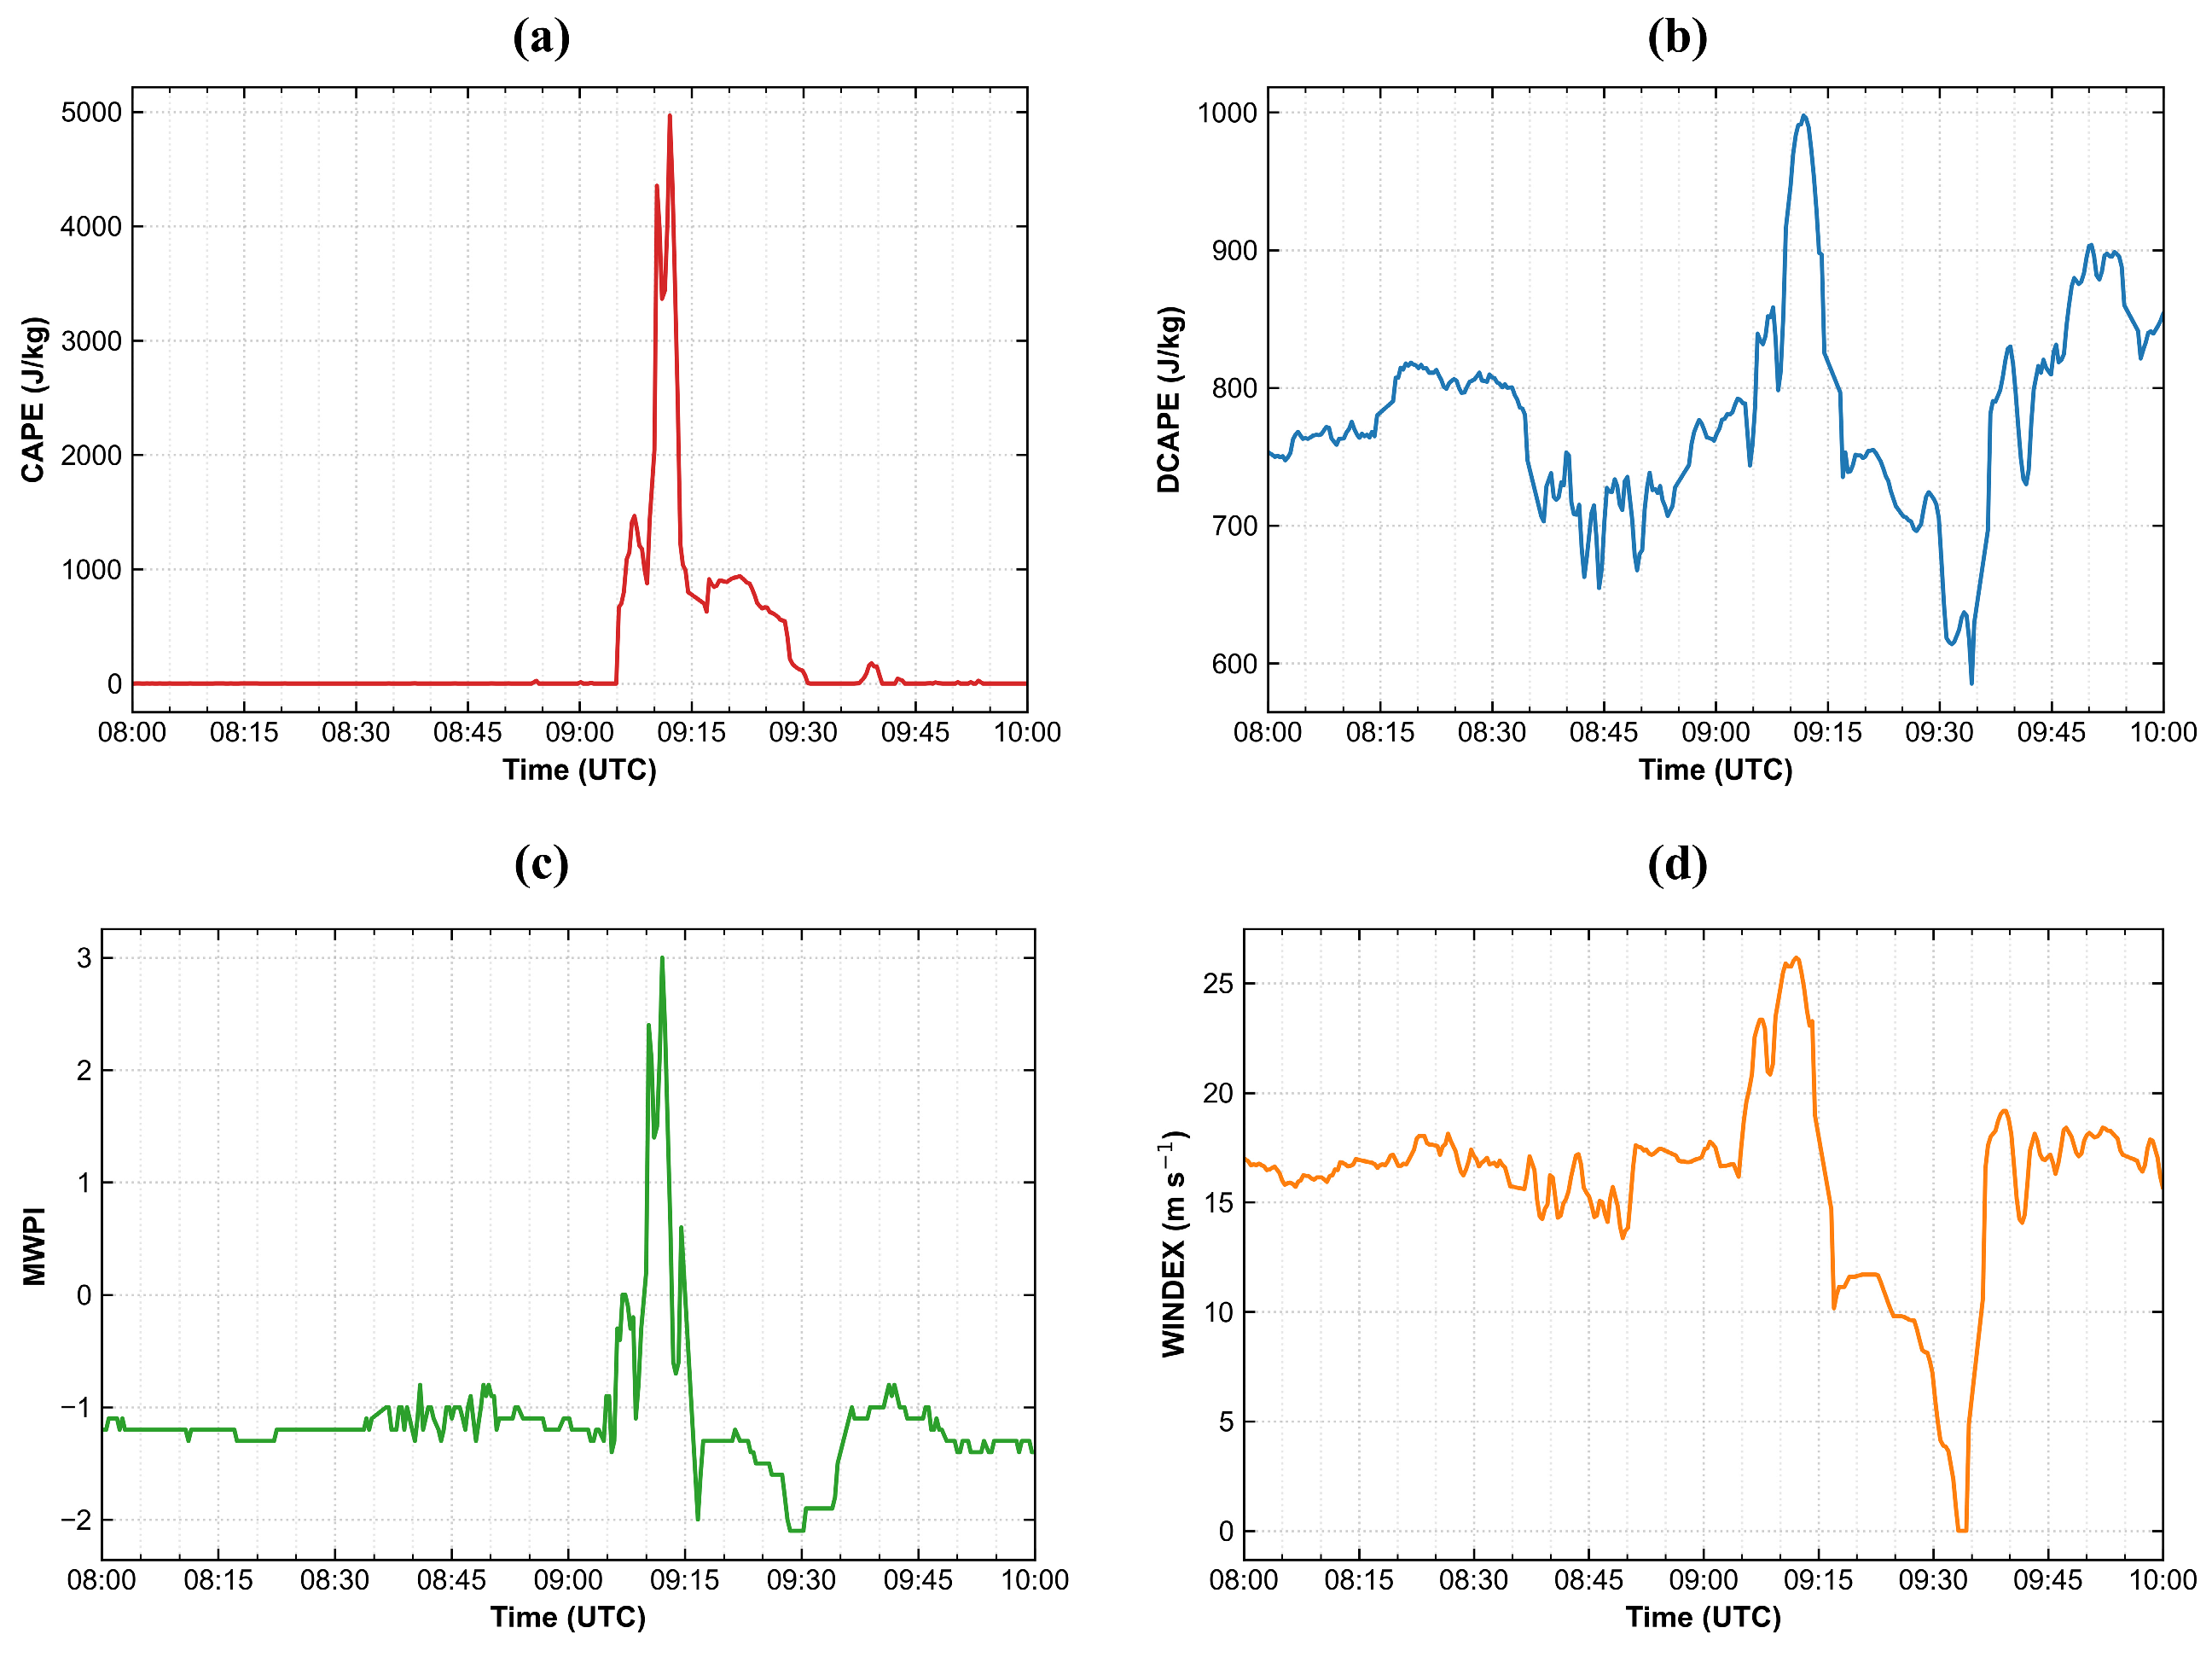
Temporal evolution of convective indices at Urumqi Airport on 25 June 2022. (a) CAPE; (b) DCAPE; (c) MWPI; (d) WINDEX.
5. Dynamic Characteristics
Since the AWOS were installed at both ends of the runway and only measured wind speed and wind direction at 10 m above the surface, they were unable to capture the wind field structure characteristics of this microburst event. In contrast, the Doppler wind lidar, as a high-precision instrument with high spatial resolution, can monitor wind speed and direction within a scanning radius of 10 km. To further investigate the dynamic characteristics during the surface-reaching process of the microburst, observations from the Doppler wind lidar were analyzed in this section.
5.1. Vertical Wind Structure Revealed by DBS Measurements
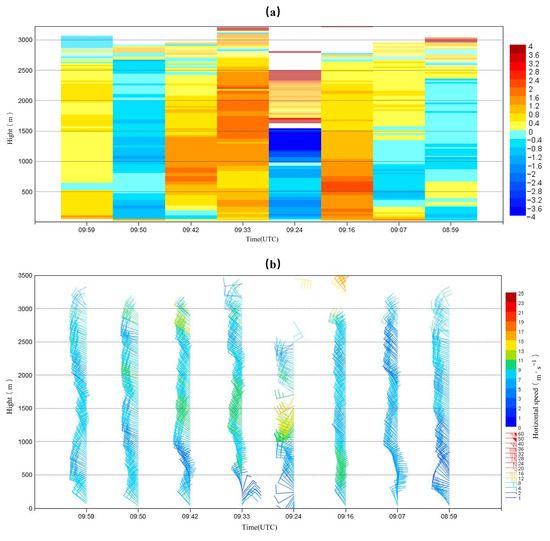
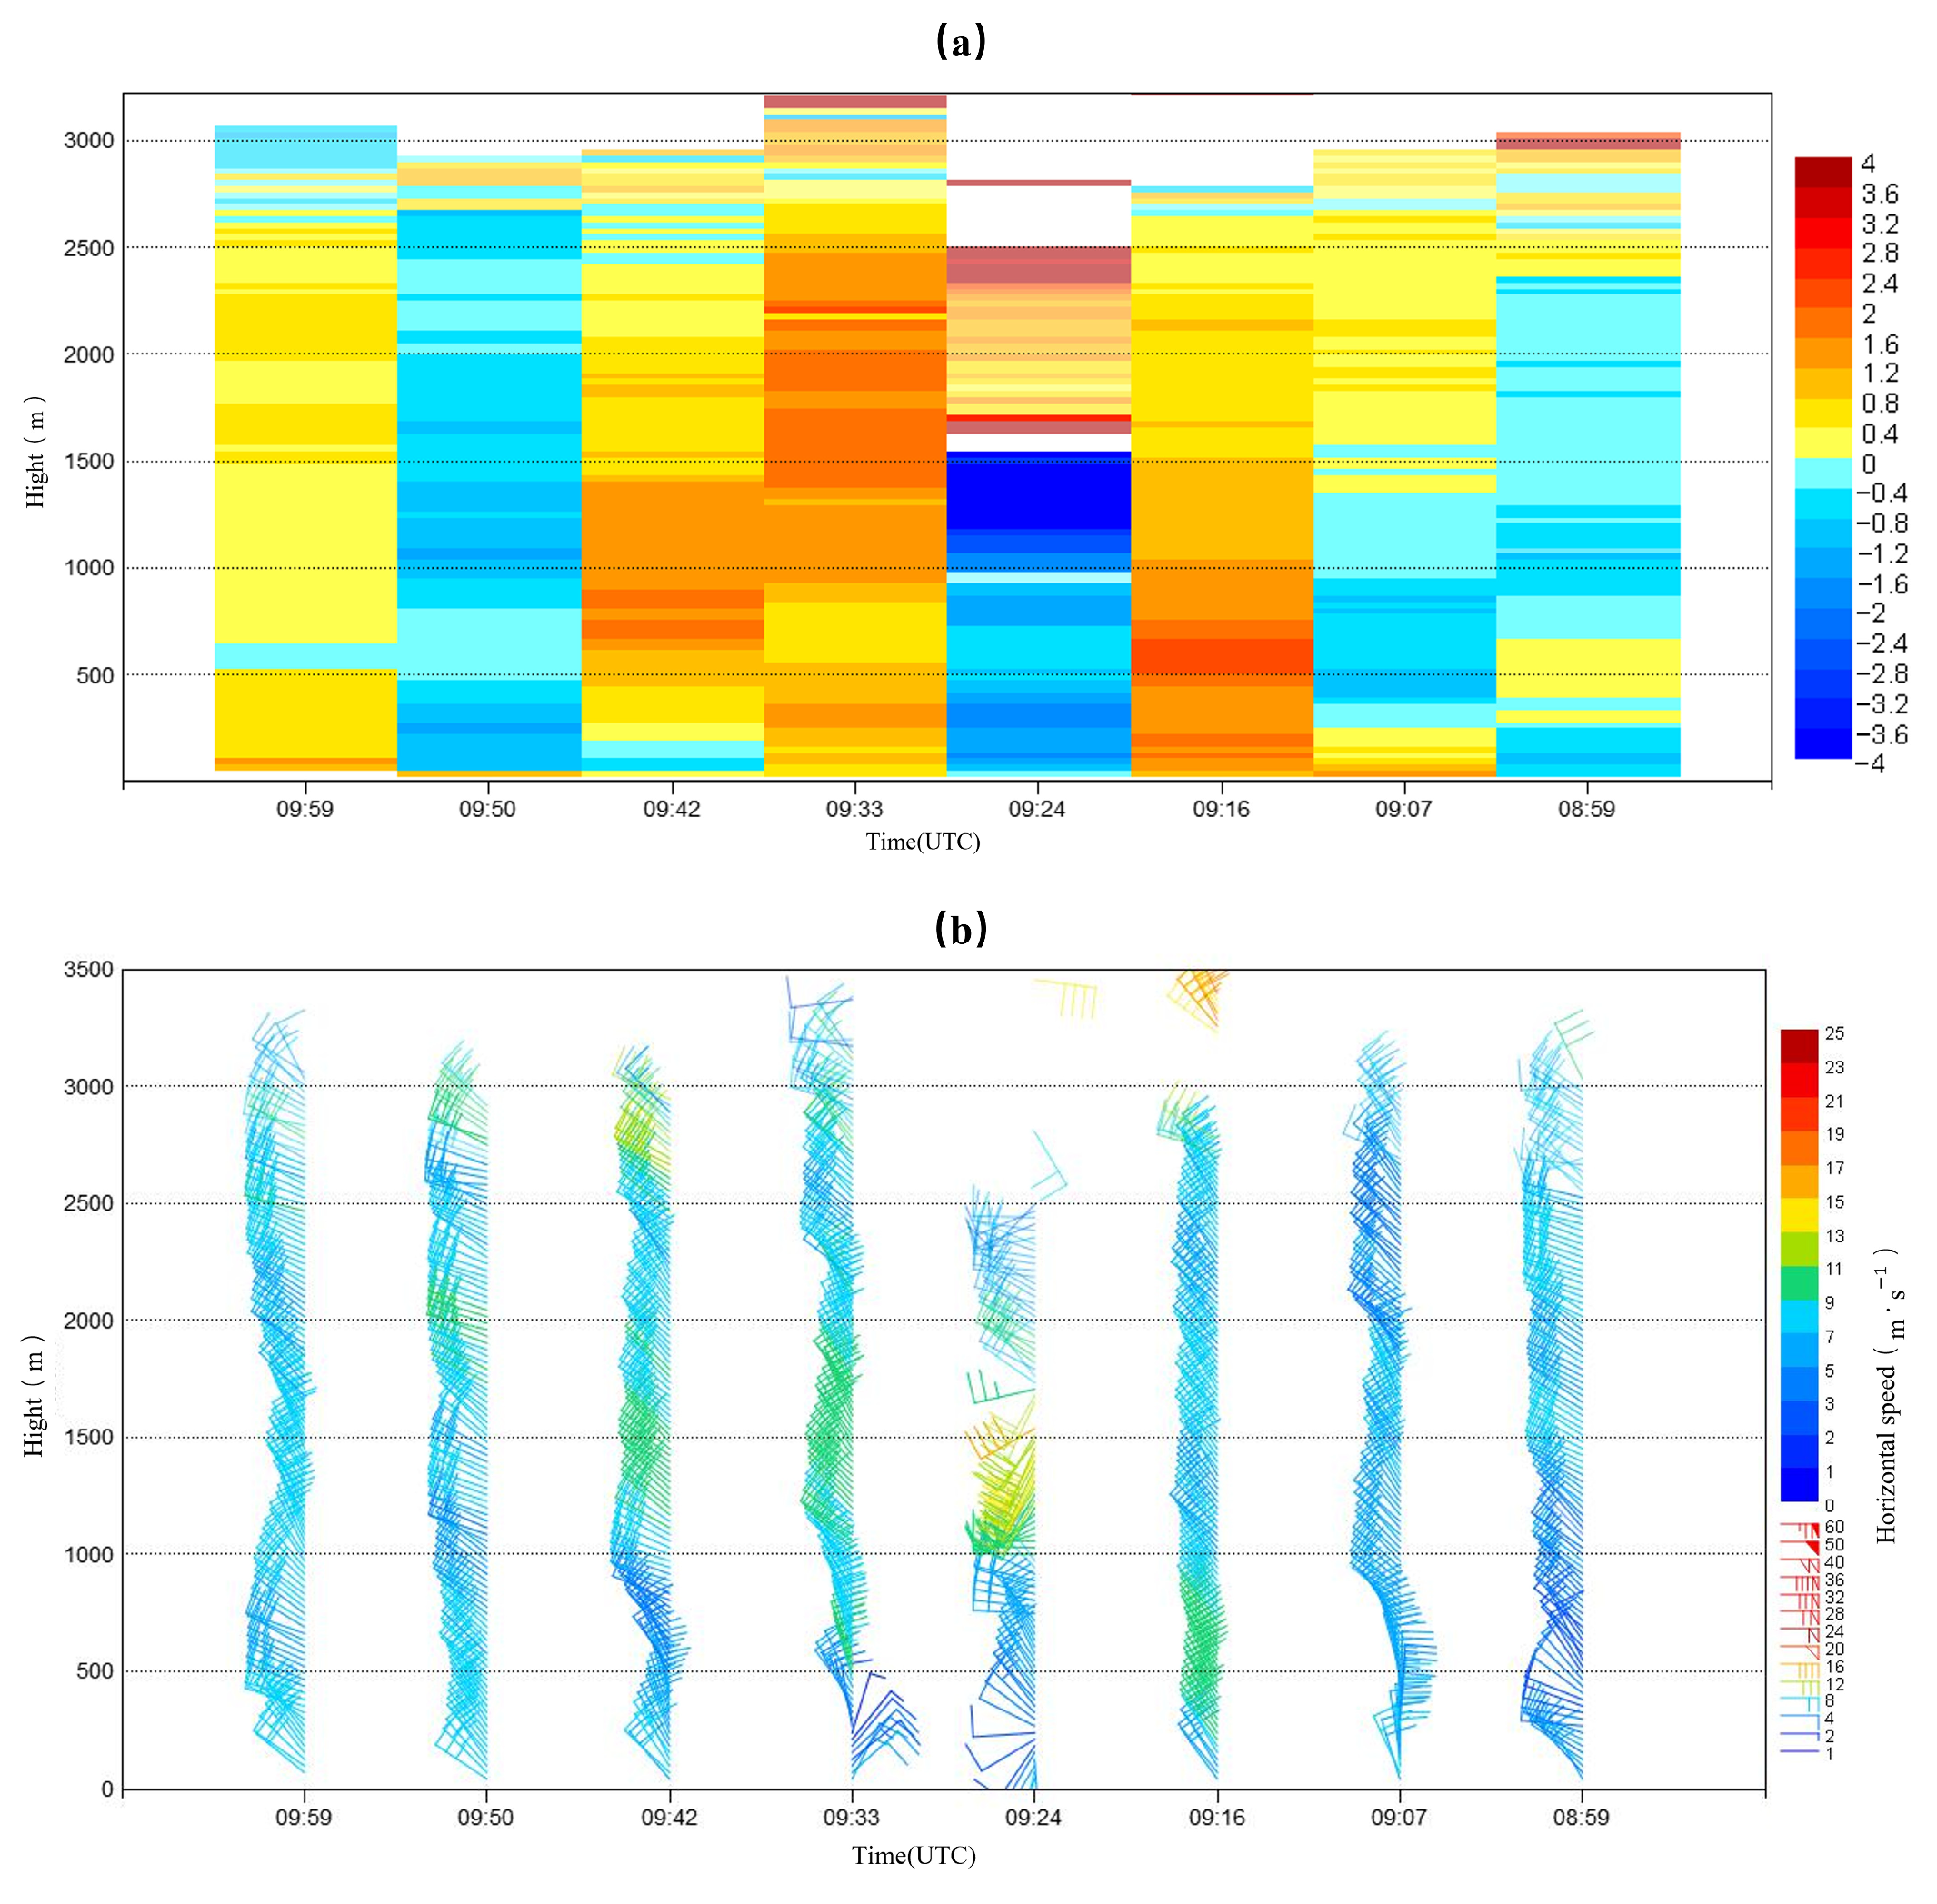
The time-height cross-section of vertical velocity from the Doppler wind lidar (Figure 9a) revealed that at 09:24 UTC (the microburst occurrence phase), a distinct downdraft occurred, with a maximum downward velocity of −4.78 m·s−1. The downdraft initiated at approximately 1500 m and extended downward through the entire layer to reach the surface, indicating the rapid descent of cold and dry air above the airport. The time-height cross-section of horizontal velocity (Figure 9b) showed that before 09:16 UTC, a consistent northwesterly wind prevailed over Urumqi Airport. At 09:16 UTC, a northwestern wind with a speed of 16 m·s−1 appeared at an altitude of 3500 m. At 09:24 UTC (the microburst stage), the upper-level wind speed core descended substantially, with the wind zone lowering from to , exhibiting clear characteristics of downward transport of momentum. Due to precipitation attenuation, data voids occurred in the layer of 1500–1650 m. The surface-reaching time of the strong downdraft signal in the vertical velocity field was consistent with the timing of the surface pressure maximum and the abrupt temperature decrease (Figure 3b), confirming that the microburst induced the formation of the thunderstorm high pressure system.
Figure 9.
Time–height cross sections of vertical velocity and horizontal wind speed derived from DBS measurements of the Doppler wind lidar at Urumqi Airport on 25 June 2022: (a) Vertical velocity; (b) horizontal wind speed.
5.2. Horizontal Wind Field Characteristics Revealed by PPI Measurements
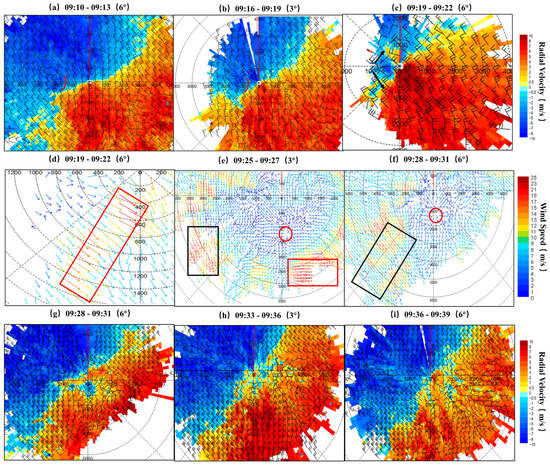
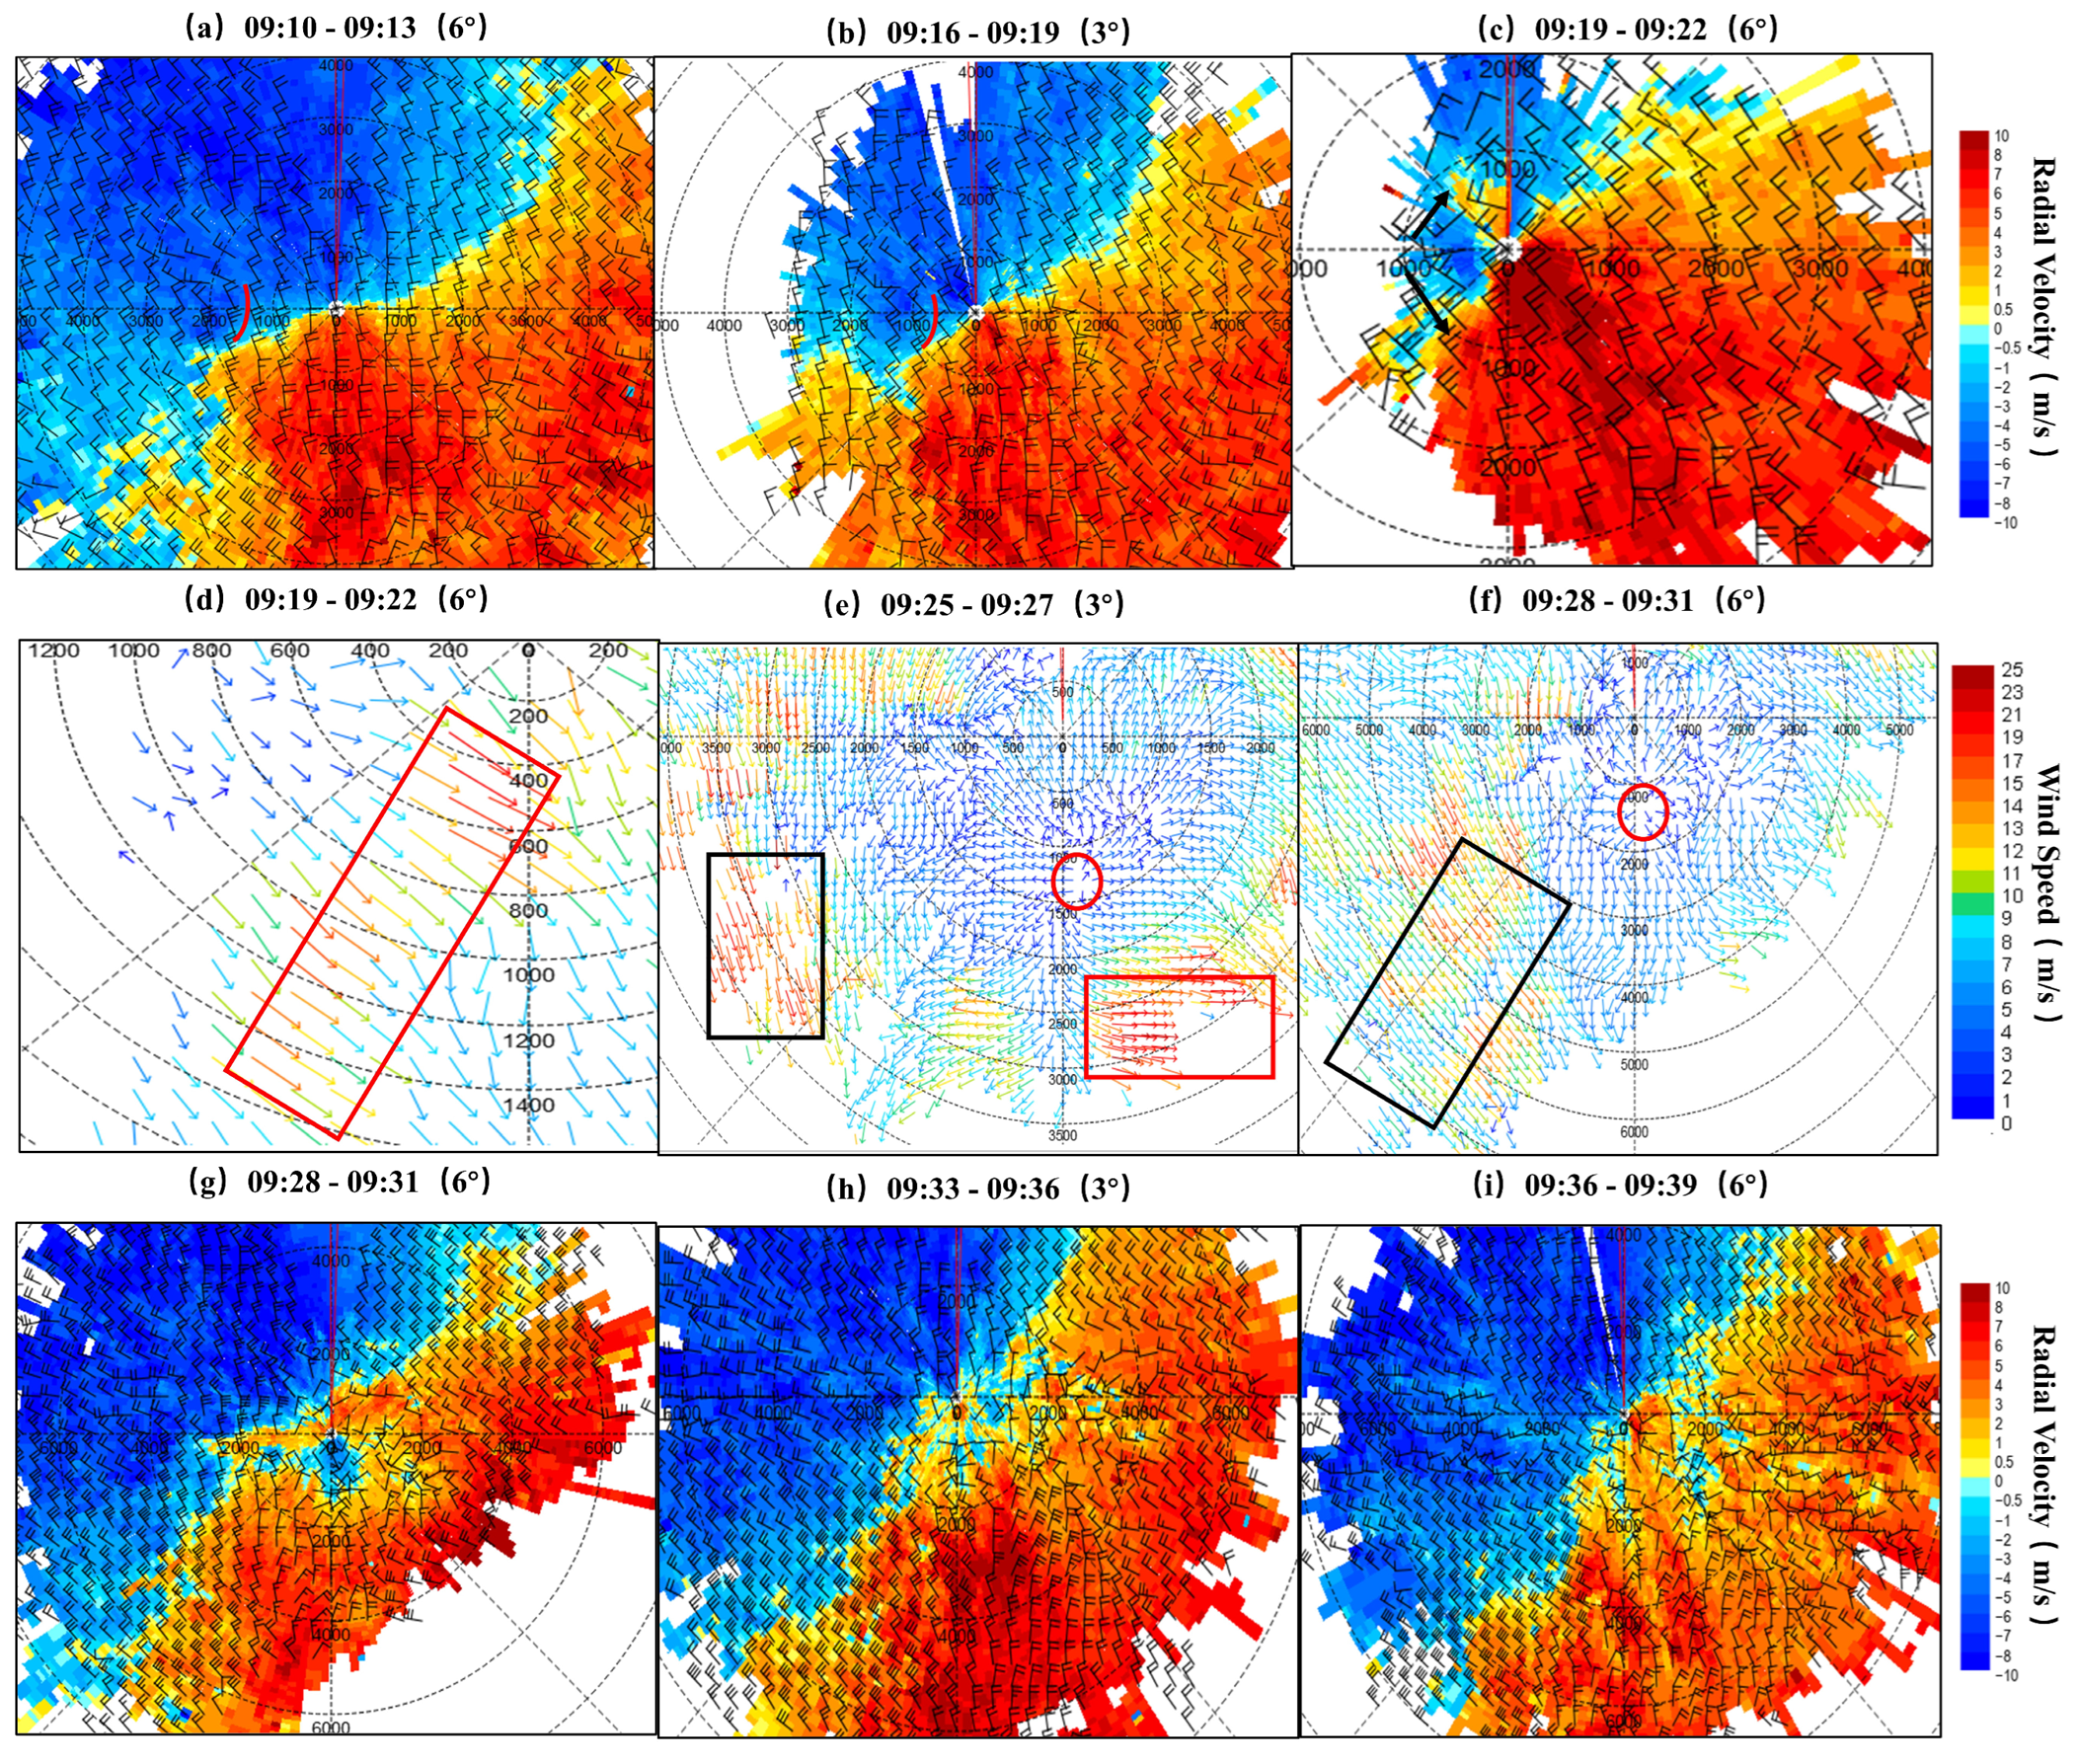
Figure 10 presents the PPI images from the Doppler wind lidar over Urumqi Airport between 09:10 and 09:31 UTC. At 09:10 UTC, the PPI image (Figure 10a) showed a convergent flow region located 1.5–2.0 km west of the Doppler wind lidar (red arc), accompanied by northerly winds of . The occurrence of convergent upward motion indicated that the microburst was in the developing stage. At 09:16 UTC, the PPI image (Figure 10b) showed that the convergent flow region was located 0.5–1 km west of the Doppler wind lidar, indicating that the convergence region moved eastward under the influence of strong winds and that the microburst further intensified. From 09:19 to 09:22 UTC, the PPI image (Figure 10c) revealed a divergent wind field approximately 1 km west of the Doppler wind lidar (arrows), with northwesterly winds reaching a maximum speed of 23.2 m s−1 occurring southeast of the divergent region (red box in Figure 10d). The emergence of the divergent wind field and the outflow gust of 23.2 m·s−1 (which met the microburst criterion) indicated that the microburst had already occurred by this time. At 09:25–09:27 UTC, the 3° PPI image (Figure 10e) showed that the microburst center had moved to 1.0–1.5 km south of the lidar. At this time, both the microburst center (red circle) and the associated strong outflow winds became more evident. The strong outflow winds occurred approximately 1.2 km southeast of the microburst center (red box), with wind speeds exceeding 16 m·s−1 and a maximum of 25.5 m·s−1. Between 09:28 and 09:31 UTC, the 6° PPI images (Figure 10f,g) indicated that the microburst divergence region remained evident. However, severe data gaps occurred in the wind field southeast of the microburst center, which resulted from the automatic removal of abnormal signals by the lidar signal processor. From 09:33 to 09:36 UTC (Figure 10h), although the divergence region of the microburst was still present, the wind speeds in the outflow area had dropped below the microburst threshold, indicating that the microburst had nearly dissipated. At 09:36–09:39 UTC (Figure 10i), the divergence region dissipated, and the background wind field became predominantly northwesterly.
Figure 10.
Temporal evolution of PPI scans observed by the Doppler wind lidar at Urumqi Airport from 09:10 to 09:39 UTC on 25 June 2022.
It is worth noting that a strong northwesterly wind region (black boxes) existed west of the microburst in Figure 10e,f. This background flow affected and blocked the westward outflow of the microburst, while also transporting small-scale cold air into the microburst system. After 09:33 UTC, the microburst gradually dissipated as the northwesterly flow suppressed the westward outflow region of the microburst.
6. Discussion
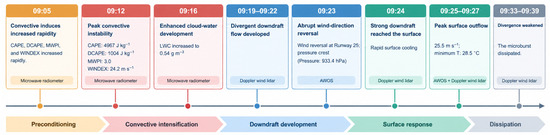
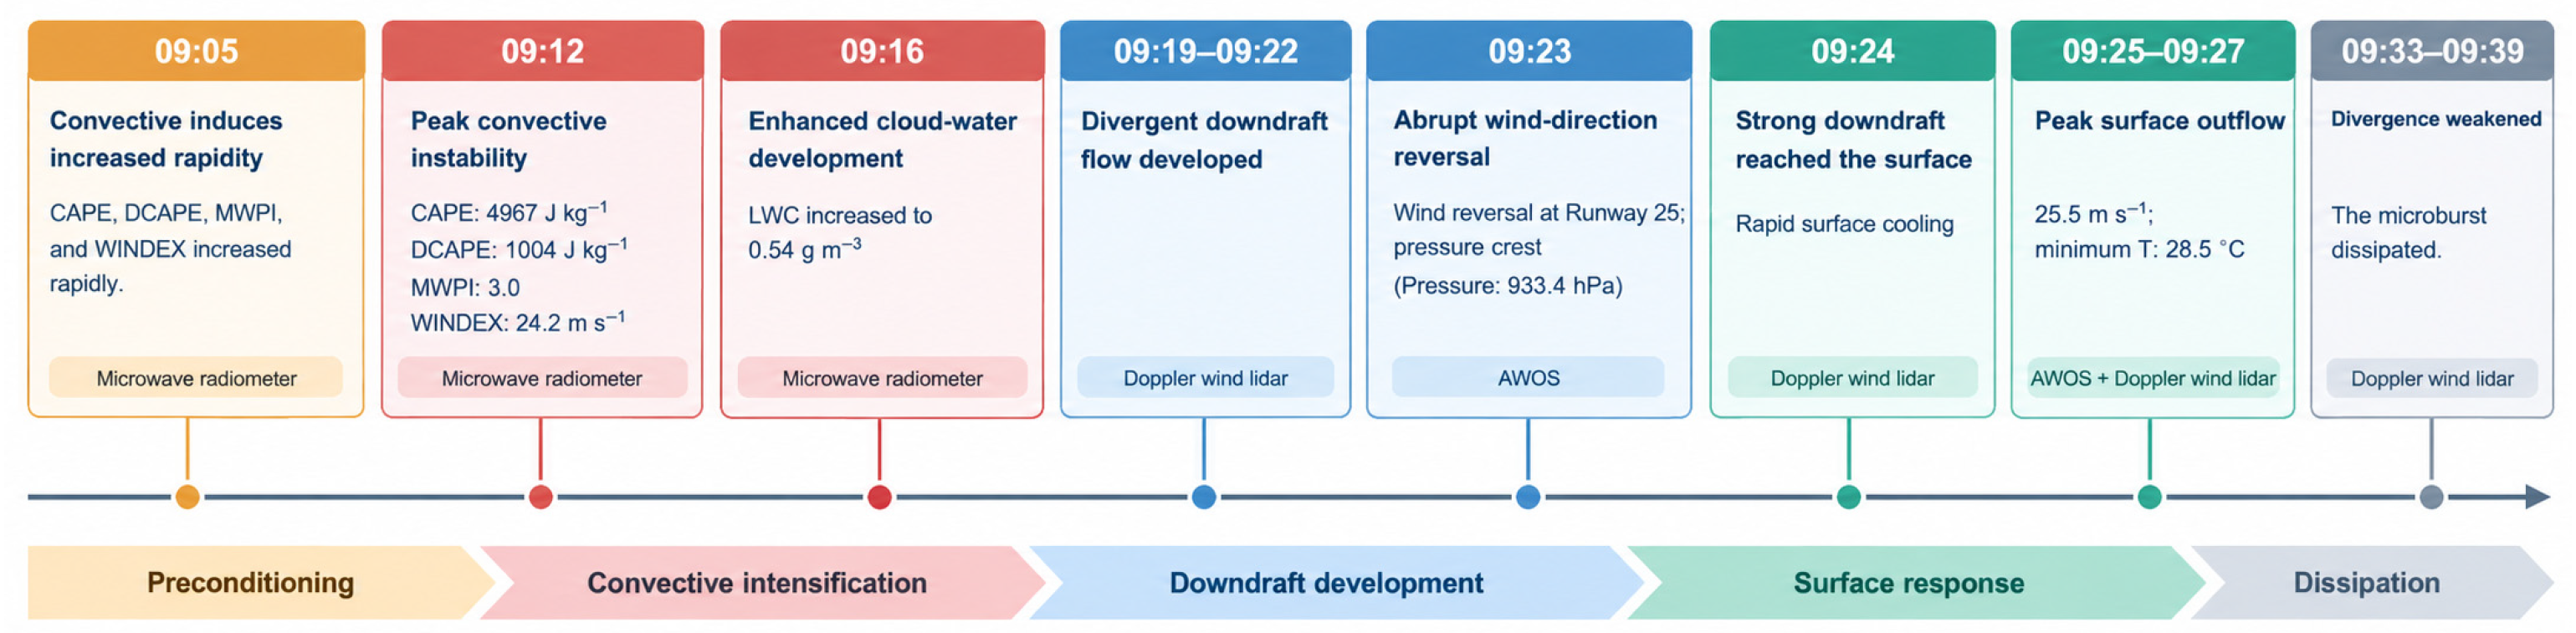
Figure 11 shows the temporal evolution of a microburst event observed at Urumqi Airport on 25 June 2022, which can be divided into five phases. In the environmental preparation phase (09:05 UTC), the convective indices began to increase rapidly, indicating that convective instability energy was accumulating in the environment. During the convective intensification phase, CAPE, DCAPE, MWPI, and WINDEX reached their maximum values at 09:12 UTC. At 09:16 UTC, the liquid water content (LWC) rose to 0.54 g m−3, indicating the development of cloud water and enhanced moisture conditions within the convective system. During the downdraft development phase (09:19–09:23 UTC), the Doppler lidar detected a descending divergent flow; meanwhile, AWOS observations at runway 25 showed a sharp shift in wind direction accompanied by an abrupt increase in pressure, with the surface pressure rising to 933.4 hPa. In the surface response phase (09:24–09:27 UTC), the downdraft reached the ground, accompanied by a sharp decrease in surface temperature to a minimum of 28.5 °C; the maximum outflow wind speed reached 25.5 m·s−1. In the dissipation phase (09:33–09:39 UTC), the divergent flow gradually weakened and the microburst dissipated.
Figure 11.
Temporal evolution of the microburst event observed at Urumqi Airport on 25 June 2022.
7. Conclusions
In this study, multi-source observations, including ground-based microwave radiometer, Doppler wind lidar, and the Automated Weather Observing System (AWOS), were used to quantitatively investigate the thermodynamic and dynamic characteristics of a typical microburst event that occurred at Urumqi Airport on 25 June 2022. The main conclusions are as follows:
- The microburst occurred under an unstable thermodynamic environment. Before the event, the boundary layer was well mixed, and the low-level temperature lapse rate approached the dry adiabatic lapse rate. The sounding exhibited a typical inverted-V structure. Meanwhile, the intrusion of dry air in the mid-level troposphere provided favorable conditions for evaporative cooling of precipitation particles and the enhancement of negative buoyancy. The high-temporal-resolution microwave radiometer observations successfully captured the rapid evolution of the thermodynamic environment and provided critical observational evidence for identifying the initiation and evolution of the microburst.
- The evolution of key convective parameters revealed the accumulation and release of unstable energy prior to the microburst occurrence. Approximately 10 min before the microburst, the CAPE, DCAPE, MWPI, and WINDEX all increased rapidly and simultaneously reached their maximum values at 09:12 UTC, followed by a rapid decrease thereafter. The synchronous evolution of these indices quantitatively reflected the accumulation and subsequent release of atmospheric instability, indicating that the combined application of multiple thermodynamic indices is more effective than any single parameter for identifying microburst potential.
- Evaporative cooling and precipitation loading jointly drove the development of the microburst. Microwave radiometer observations revealed the formation of a high-humidity column extending from the upper levels to the surface before the event. As precipitation descended through the low-level dry and warm layer, evaporative cooling enhanced negative buoyancy, while precipitation loading strengthened the downdraft. These processes promoted rapid cold-air descent and the formation of a cold pool, resulting in a surface pressure increase, rapid temperature decrease, and strong divergent wind field.
- The Doppler wind lidar successfully revealed the complete dynamic evolution of the microburst. A strong downdraft initially developed at approximately 1.5 km altitude and rapidly extended downward to the surface, with a maximum vertical velocity of −4.78 m·s−1. After reaching the ground, the microburst produced a distinct divergent wind field, with the maximum near-surface wind speed reaching 25.5 m·s−1. The evolution of the dynamic structure was highly consistent with the changes in thermodynamic parameters and surface meteorological responses, indicating that the release of thermodynamic instability energy was ultimately converted into damaging low-level winds at the airport through downward momentum transport.
In summary, ground-based microwave radiometers can effectively monitor the rapid evolution of the thermodynamic environment prior to microburst occurrence, while Doppler wind lidar can clearly characterize the three-dimensional wind structure and downdraft evolution. The combination of these two observation systems provides a comprehensive understanding of the thermodynamic and dynamic characteristics of microbursts and has important application value for short-term nowcasting and early warning of low-level wind shear and microbursts at airports.
It should be noted that this study focused on only one typical microburst case. The thresholds of thermodynamic parameters and the characteristics of dynamic structures require further statistical validation using more microburst cases.
Author Contributions
Conceptualization, K.L., Y.L. and J.Z.; methodology, K.L. and L.D.; software, K.L., H.W. and Q.W.; validation, K.L., Y.L. and J.Z.; formal analysis, K.L. and G.H.; investigation, K.L. and N.W.; resources, K.L.; data curation, K.L.; writing—original draft preparation, K.L.; writing—review and editing, K.L., Y.L. and J.Z.; visualization, K.L.; supervision, Y.L.; project administration, Y.L.; funding acquisition, Y.L. All authors have read and agreed to the published version of the manuscript.
Funding
This research was funded by Civil Aviation Safety Capacity Building Program of Civil Aviation Administration of China: “Upgrade and Development of General Aviation Meteorological Information Service Module for Pilots Cloud License” (Grant No. FB2025001). Fundamental Research Funds for the Central Universities (No. 25CAFUC09015).
Institutional Review Board Statement
Not applicable.
Informed Consent Statement
Not applicable.
Data Availability Statement
The datasets used in this study are available from the corresponding author upon reasonable request. The observational datasets were obtained from the Automated Weather Observing System (AWOS), ground-based microwave radiometer, and Doppler wind lidar installed at Urumqi Diwopu International Airport, Xinjiang, China. Due to data ownership and institutional restrictions, these datasets are not publicly available. However, reasonable requests for data access will be considered by the corresponding author, subject to relevant approval requirements.
Conflicts of Interest
Some authors are affiliated with companies that provided the meteorological observation instruments used in this study. These authors were not involved in data analysis, interpretation of the results, or decisions regarding the preparation and submission of the manuscript. The authors declare that there are no financial or commercial conflicts of interest that could have influenced the research reported in this manuscript.
References
- Fujita, T.T.; Byers, H.R. Spearhead Echo and Downburst in the Crash of an Airliner. Mon. Weather Rev. 1977, 105, 129–146. [Google Scholar] [CrossRef] [Scilit]
- Fujita, T.T. The Downburst, Microburst and Macroburst; SMRPResearch Paper 210; University of Chicago: Chicago, IL, USA, 1985; 122p. [Google Scholar]
- Fujita, T.T. The Downburst, Report of Projects NIMROD and JAWS. Univ. Chic. 1985, 210, 112–122. [Google Scholar]
- Fujita, T.T. Microbursts as an aviation wind shear hazard. In Proceedings of the 19th Aerospace Sciences Meeting, St. Louis, MO, USA, 12–15 January 1981; p. 386. [Google Scholar]
- Fujita, T.T. Downbursts and microbursts—An aviation hazard. In Proceedings of the Conference on Radar Meteorology, Miami Beach, FL, USA, 15–18 April 1980. [Google Scholar]
- Chen, H.S.; Han, L.F.; Tang, Y.Y.; Chen, J.; Lei, C.G.; Li, X.C. Impacts of Tropical Cyclones on Extreme Precipitation and Flooding in a Humid Subtropical Inland Basin of China. J. Hydrol. Reg. Stud. 2025, 57, 102096. [Google Scholar] [CrossRef] [Scilit]
- Zhang, Q.; Gu, X.H.; Li, J.F.; Shi, P.J.; Singh, V.P. The Impact of Tropical Cyclones on Extreme Precipitation over Coastal and Inland Areas of China and Its Association to ENSO. J. Clim. 2018, 31, 1865–1880. [Google Scholar] [CrossRef] [Scilit]
- Roberts, R.D.; Wilson, J.W. A Proposed Microburst Nowcasting Procedure Using Single-Doppler Radar. J. Appl. Meteorol. Clim. 1989, 28, 285–303. [Google Scholar] [CrossRef] [Scilit]
- Yu, X.D.; Zhang, A.M.; Zheng, Y.Y.; Fang, C.; Zhu, H.; Wu, L. Doppler Radar Analysis on a Series of Downburst Events. J. Appl. Meteor. Sci. 2006, 17, 385–393. [Google Scholar]
- Diao, X.G.; Zhao, Z.D.; Gao, H.J.; Jiang, P. Doppler Radar Echo Features of Three Downbursts. Meteorol. Mon. 2011, 37, 522–531. [Google Scholar]
- Guo, F.Y.; Diao, X.G.; Chu, Y.G.; Ma, Y. Dual Polarization Radar Characteristics of a Severe Downburst Occurring in Weak Vertical Wind Shear. J. Appl. Meteor. Sci. 2023, 34, 681–693. [Google Scholar] [CrossRef]
- Li, Y.D.; Liu, J.W.; Gao, S.T. On the Progress of Application for Dynamic and Energetic Convective Parameters Associated with Severe Convective Weather Forecasting. Acta Meteorol. Sin. 2004, 62, 401–409. [Google Scholar] [CrossRef]
- Romanic, D.; Taszarek, M.; Brooks, H. Convective Environments Leading to Microburst, Macroburst and Downburst Events across the United States. Weather Clim. Extrem. 2022, 37, 100474. [Google Scholar] [CrossRef] [Scilit]
- Gilmore, M.S.; Wicker, L.J. The Influence of Midtropospheric Dryness on Supercell Morphology and Evolution. Mon. Weather Rev. 1998, 126, 943–958. [Google Scholar] [CrossRef] [Scilit]
- Dotzek, N.; Friedrich, K. Downburst-Producing Thunderstorms in Southern Germany: Radar Analysis and Predictability. Atmos. Res. 2009, 93, 457–473. [Google Scholar] [CrossRef] [Scilit]
- Pryor, K.L.; Miller, S.D. Downburst Prediction Applications of GOES over the Western United States. arXiv 2016, arXiv:1611.01407. [Google Scholar] [CrossRef] [Scilit]
- Pryor, K.; Ellrod, G. WMSI—A New Index for Forecasting Wet Microburst Severity. Electron. J. Oper. Meteor. 2004, 5, 1–25. Available online: https://nwas.org/publications/electronic-journal/?utm_source=chatgpt.com (accessed on 20 September 2026).
- McCann, D.W. WINDEX—A New Index for Forecasting Microburst Potential. Weather Forecast. 1994, 9, 532–541. [Google Scholar] [CrossRef] [Scilit]
- Hua, Z.Q.; LI, Q.; Huang, X.; Ma, X.L.; Tian, W.D.; Zhao, Q.N. Analysis of the Typical Application of Laser Wind Measurement Radar in Aviation Support. Laser Technol. 2020, 44, 600–604. [Google Scholar] [CrossRef]
- Niu, X.H.; Huang, X.; Zhu, W.H.; Zheng, J.F.; Tang, S.X.; Ren, T.; Cheng, Z. Application Research of 1.55 μm Wind LiDAR in Detecting Downburst on a Plateau Airport. Laser Technol. 2024, 48, 318–326. [Google Scholar] [CrossRef]
- Wang, N.; Cheng, H.Y.; Yin, C.H. Structural Analysis of Wet Downburst Triggered by Isolated Thunderstorms Based on Wind LiDAR. Laser Technol. 2024, 48, 643–650. [Google Scholar] [CrossRef]
- Zhang, T.; Li, Q.; Zheng, J.F.; Zhang, W.L.; Fan, Q.; Zhang, J. A Study on Low-level Wind Shear Caused by Microburst Using Lidar and Other Data. Laser Technol. 2020, 44, 563–569. [Google Scholar] [CrossRef]
- Yue, H.; Deng, E.; Chan, P.W.; Ni, Y.Q. Reproducing Urban Wind Field during the Typhoon Period via Multi-Source Data Assimilation in WRF-3DVAR. Eng. Appl. Comput. Fluid Mech. 2026, 20, 2701533. [Google Scholar] [CrossRef] [Scilit]
- Wang, N.; Yin, C.H.; Liu, X.M.; Gao, J.W. Analysis of LiDAR in a Cold Front Low-Level Wind Shear in Urumqi Airport. Laser Technol. 2023, 47, 565–571. [Google Scholar] [CrossRef]
- Xie, H.L.; Zhu, K.Y.; Zhang, J.; Fan, G.Z.; Fan, Y.; Ou, Y.Y. A Quantitatively Analyze the Quality of Ground-base Microwave Radiometer. J. Yunnan Univ. Nat. Sci. Ed. 2018, 40, 94–103. [Google Scholar] [CrossRef]
- Feng, L.; Zheng, J.F.; Pan, J.; Bai, H.B.; Zhang, J. Analysis of the Causes and Wind Field Structure of a Dry Microburst in a Weak Weather Background. Atmosphere 2023, 14, 1540. [Google Scholar] [CrossRef] [Scilit]
- Fan, L.M.; Yu, X.D. Analysis on the Environment Conditions of Afternoon Thunderstorm in Hangzhou. Meteorol. Mon. 2020, 46, 1621–1632. [Google Scholar] [CrossRef]
- Liao, X.N.; Yu, B.; Lu, L.H. Climatology and Nowcasting Methods for Thunderstorm Gale in Beijing. Meteorol. Mon. 2009, 35, 18–28. [Google Scholar] [CrossRef]
- Madhulatha, A.; Rajeevan, M.; Venkat Ratnam, M.; Bhate, J.; Naidu, C.V. Nowcasting Severe Convective Activity over Southeast India Using Ground-Based Microwave Radiometer Observations. J. Geophys. Res. Atmos. 2013, 118, 1–13. [Google Scholar] [CrossRef] [Scilit]
- Huang, X.; Zheng, J.F.; Che, Y.Z.; Wang, G.L.; Ren, T.; Hua, Z.Q.; Tian, W.D.; Su, Z.K.; Su, L.X. Evolution and Structure of a Dry Microburst Line Observed by Multiple Remote Sensors in a Plateau Airport. Remote Sens. 2022, 14, 3841. [Google Scholar] [CrossRef] [Scilit]
- Wakimoto, R.M. Forecasting Dry Microburst Activity over the High Plains. Mon. Weather Rev. 1985, 113, 1131–1143. [Google Scholar] [CrossRef] [Scilit]
- Wang, X.M.; Yu, X.D.; Fei, H.Y.; Liu, X.L.; Zhu, H. A Review of Downburst Genesis Mechanism and Warning. Meteorol. Mon. 2023, 49, 129–145. [Google Scholar] [CrossRef]
- Srivastava, R. A Simple Model of Evaporatively Driven Downdraft: Application to Microburst Downdraft. J. Atmos. Sci. 1985, 42, 1004–1023. [Google Scholar] [CrossRef] [Scilit]
- Atkins, N.T.; Wakimoto, R.M. Wet Microburst Activity over the Southeastern United States: Implications for Forecasting. Weather Forecast. 1991, 6, 471–482. [Google Scholar] [CrossRef] [Scilit]
- Lee, W.C.; Wakimoto, R.M.; Carbone, R.E. The Evolution and Structure of a “Bow–Echo-Microburst” Event. Part II: The Bow Echo. Mon. Weather Rev. 1992, 120, 2211–2225. [Google Scholar] [CrossRef] [Scilit]
- Yang, K.; Koike, T.; Fujii, H.; Tamura, T.; Xu, X.D.; Bian, L.G.; Zhou, M.Y. The Daytime Evolution of the Atmospheric Boundary Layer and Convection over the Tibetan Plateau: Observations and Simulations. J. Meteorol. Soc. Jpn. Ser. II 2004, 82, 1777–1792. [Google Scholar] [CrossRef] [Scilit]

Disclaimer/Publisher’s Note: The statements, opinions and data contained in all publications are solely those of the individual author(s) and contributor(s) and not of MDPI and/or the editor(s). MDPI and/or the editor(s) disclaim responsibility for any injury to people or property resulting from any ideas, methods, instructions or products referred to in the content. |
© 2026 by the authors. Licensee MDPI, Basel, Switzerland. This article is an open access article distributed under the terms and conditions of the Creative Commons Attribution (CC BY) license.