


Abstract
Research purposes: This paper proposes an entropy-weighted-linear weighting integrated evaluation approach combining numerical simulation with field measurements. Using a specific island-type station in Beijing Metro as a case study, the research first employed Revit to construct a full-scale 3D model and utilized Autodesk Simulation CFD software to simulate indoor airflow fields and air concentration distributions under three typical scenarios: train absence, train arrival, and train departure, thereby identifying ventilation weak zones and optimizing measurement point placement. Subsequently, handheld high-precision instruments were deployed to monitor pollutant concentrations at key locations in the concourse and platforms during morning and evening peak hours. Finally, a multi-index comprehensive evaluation model centered on CO2, PM2.5, PM10, and TVOC was developed to quantitatively characterize spatial variations in indoor air quality. Research conclusions: (1) The CFD-based measurement point optimization method effectively identifies air retention zones, providing a theoretical basis for actual measurement site selection; (2) Under low-frequency operation modes of the environmental control system, air retention zones tend to form in the central areas of platforms and station halls, resulting in poor air quality; although train piston ventilation improves indoor air circulation, it may carry tunnel pollutants into public areas; (3) Overall ventilation effectiveness during train departure is less noticeable than during arrival; (4) CO2 concentration exhibits a clear positive trend with passenger flow density, with potential exceedance risks in poorly ventilated areas such as escalator entrances; particulate matter concentrations are largely influenced by outdoor environmental inputs, while internal sources may also contribute to local levels, suggesting a moderate control effect of the environmental control system on internal particulate pollution; TVOC concentrations remain consistently at low levels; (5) Comprehensive evaluation reveals that escalator entrances and central platform areas constitute weak air quality zones, with overall air quality in station halls during evening peak hours being superior to that during morning peak hours; (6) This study provides theoretical foundations and data support for optimizing operational strategies of subway station environmental control systems and enhancing indoor air quality.
1. Introduction
Urban rail transit has become the backbone of public transportation in large cities because of its high carrying capacity and operational efficiency. With the expansion of rail networks and the growth of passenger volumes, air quality in underground stations has become an increasingly prominent issue. Stations and tunnels are enclosed environments in which ventilation depends heavily on environmental control systems. However, existing system designs primarily emphasize temperature and humidity regulation and emergency ventilation; constrained by economic considerations, they often struggle to respond effectively to pollutant accumulation caused by train operation and passenger gathering and dispersion, leading to degraded in-station air quality.
Existing studies have mostly analyzed pollutant sources and distribution patterns through field measurements [1,2,3,4,5,6,7]. Recent English-language studies have further expanded this evidence: Shakya et al. [8] measured commuter exposure to particulate matter in underground subway stations in Philadelphia and found pronounced spatial variability associated with station characteristics and operating conditions; Tu and Olofsson developed a multifactor model for an underground metro platform in Stockholm, confirming that train frequency, passenger flow, urban background air quality, ventilation, and night maintenance jointly affect PM levels. [9] Smith et al. [10] characterized PM2.5 on London Underground platforms and showed that concentrations were substantially higher than urban background levels and were dominated by metal-rich particles related to rail-system wear and ventilation differences. Ji et al. [11] analyzed PM2.5 composition on subway platforms in Nanjing and found that metallic constituents were enriched and that platform workers faced higher exposure than commuters. Tan et al. [12] analyzed 41 underground metro platforms in Singapore and found that pollutant levels were influenced by platform depth, outdoor pollution, station characteristics, train intervals, and commuter volumes.
These field-measurement findings have also been supplemented by numerical simulation, which uses modeling to reveal pollutant variation characteristics under different operating conditions [13,14]. This paper takes an island-type subway station in Beijing as the object, refers to existing research [15,16], designs a method combining CFD simulation and measured data, selects relevant indicators, and proposes an entropy-weighted-linear weighting comprehensive evaluation method. A full-scale three-dimensional station model is constructed in Revit, and Autodesk Simulation CFD is used to simulate airflow characteristics under no-train, train-arrival, and train-departure conditions. At the same time, CO2, PM2.5, PM10, and TVOC concentrations are measured in key areas during morning and evening peak periods, thereby verifying the simulation patterns and providing the data basis for comprehensive evaluation. By constructing a multi-indicator comprehensive evaluation model, this study quantitatively evaluates air-quality levels at each measurement point, reveals airflow and pollutant distribution patterns under complex operating conditions, compared with existing studies, this paper uses CFD pre-simulation to identify ventilation weak areas to reverse-optimize the measurement point layout, adapts the entropy-weighted-linear weighted evaluation standard rules to adapt to the multi-pollutant characteristics of the subway to achieve quantitative air quality evaluation, and distinguishes the dual effects of different piston wind conditions on the station air environment, combines on-site measurements to identify air quality weak areas, and provides a reference for the optimization of the station’s environmental control.
2. Air Quality Comprehensive Evaluation Model
2.1. Index Selection
This paper mainly tests the concentrations of CO2, fine particulate matter (PM2.5 and PM10), and total volatile organic compounds (TVOC) in the station. For each pollutant, the “Code for Metro Design (with explanatory provisions)” [17] stipulates that the CO2 concentration limit is 1500 ppm, the “Ambient Air Quality Standard” [18] stipulates that the concentrations of PM2.5 and PM10 should be below 75 μg/m3 and 150 μg/m3, respectively, and the “Code for Indoor Environmental Pollution Control of Civil Building Engineering” [19] stipulates that the TVOC concentration should be lower than 0.6 mg/m3.
2.2. Evaluation Model Establishment
To solve the problem that the evaluation results of single pollutant indicators are scattered and it is difficult to systematically quantify the overall air quality level of the area, this paper adopts the entropy-weighted-linear weighting comprehensive evaluation method. This method uses information entropy to objectively determine the index weight, avoiding subjective weighting deviation, and then aggregates multi-index information into a single comprehensive score through linear weighting, which is convenient for comparing air quality at different measuring points and different time periods.
2.2.1. Data Standardization Processing
The original data is dimensionless according to national standard limits. Underground stations are semi-enclosed confined spaces. Because the overall concentration of PM2.5 at the station measuring points is higher than the national standard limit, if the limit method (Type A) is used, the indicator will completely lose its discrimination. Therefore, the extreme value method (Type B) is used for relative evaluation to retain the concentration differences between different measuring points. Therefore, the study sets a mixed standardization calculation rule:
where: is the standardized value of the j-th index at the i-th test point; is the measured pollutant concentration; is the national standard limit for the corresponding index.
2.2.2. Index Weight Determination
Based on the standardized matrix, the information entropy of each index is calculated, and the index weight is objectively determined through the degree of data dispersion: First, calculate the proportion of the j-th index for the i-th measuring point:
Calculate the information entropy of each index based on the index proportion:
where: is the weight of the j-th index; is the information entropy of the j-th index; n is the total number of measuring points; m is the total number of evaluation indicators. The evening peak evaluation reuses the fixed weights of the morning peak to ensure a unified evaluation benchmark between periods and comparable results. The final weight values are shown in Table 1.
Table 1.
The final weights of each evaluation index.
2.2.3. Comprehensive Score Calculation
Finally, the comprehensive air quality score of each measuring point is calculated by linear weighting:
where: is the comprehensive score of the i-th measuring point. The higher the score, the better the comprehensive air quality of the area.
This method objectively weights through the degree of data dispersion itself, avoiding subjective judgment deviation. It is suitable for identifying the spatial differences in air quality in the station and locating weak ventilation areas; this weight mainly reflects the degree of data variation and does not directly correspond to the health hazard weight of pollutants. If conducting a health risk-oriented evaluation, it is necessary to adjust the weighting combined with health effect coefficients.
2.3. Flow Chart
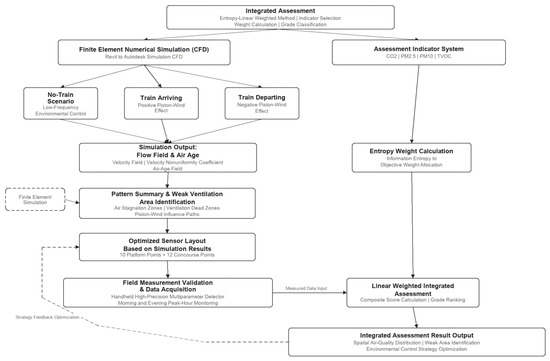
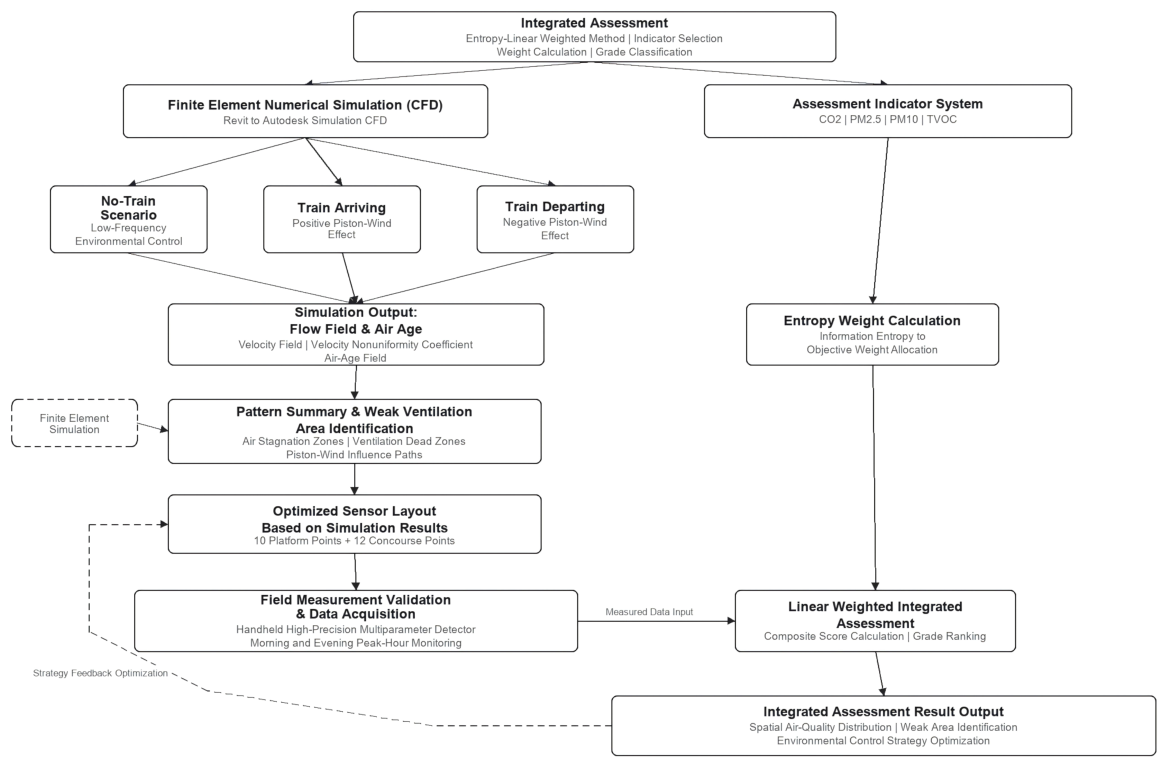
This paper proposes a four-step route of “simulation to determine patterns—measurement point optimization—actual measurement verification—comprehensive evaluation”: based on CFD simulation to identify weak ventilation areas to optimize measuring points, after obtaining data through field measurements, the entropy-weighted-linear weighting model is used to calculate comprehensive scores and quantitatively evaluate air quality. This route organically integrates numerical simulation, field measurement, and comprehensive evaluation. The process is shown in Figure 1.
Figure 1.
Flow chart of the comprehensive evaluation method.
3. Case Study
3.1. Station Overview
The main body of the station is an underground double-deck open-cut station. The modeling area does not include the equipment rooms at both ends of the platform, the detour air ducts, or the stairs and escalators at the entrances and exits of the station hall level. The length of the platform waiting area is 112.8 m, the width is 10.4 m, and the floor height is 3 m; the visible length of the station hall is 73 m, the width is 19.6 m, and the floor height is 3.2 m; the effective cross-section of the tunnel is 3.8 m wide and 5.3 m high; 22 columns of 1200 mm × 900 mm are evenly and symmetrically distributed on both sides of the platform, and 18 columns of 1200 mm × 700 mm are distributed in the station hall; between the platform and the station hall, there are two automatic escalators with a width of 1 m, two two-way mixed stairs with widths of 3 m and 2.4 m, and one accessible elevator with a cross-section of 2400 mm × 2800 mm.
3.2. Statistics of Station Morning and Evening Peak Passenger Flow
The morning peak period of Beijing Subway is 7:00–9:00, and the evening peak period is 17:00–19:00. During the morning peak period, the departure interval of up and down trains is about 2.75 min, and the number of train pairs is about 22 pairs; during the evening peak period, the departure interval is about 3 min, and the number of train pairs is about 20 pairs. The passenger flow of entering and leaving the station, the number of people getting on and off a train, the number of people waiting on the platform, and the passenger flow through the stairs and escalators during the morning and evening peaks are shown in Table 2.
Table 2.
Passenger flow statistics during morning and evening peaks.
3.3. Overview of Station Environmental Control System
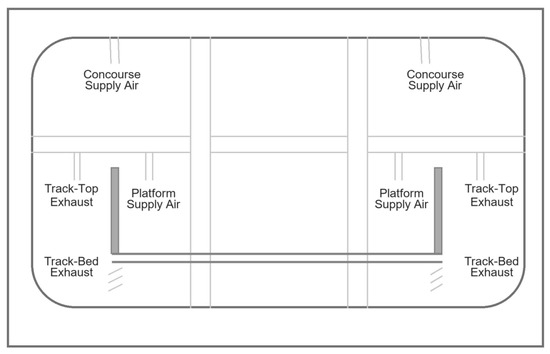
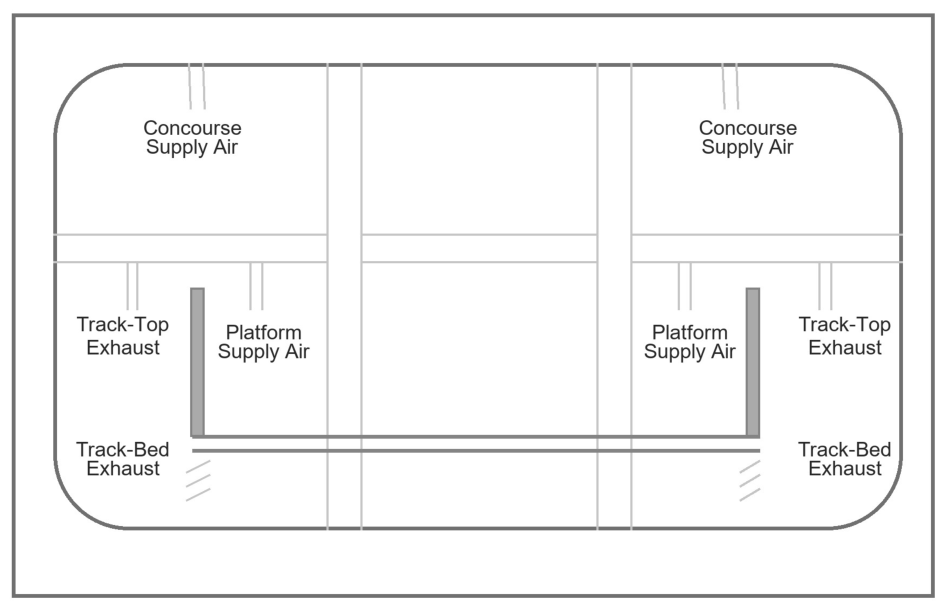
The ventilation and air conditioning system of the station is an integrated closed system. A 2.5 m full-height safety door is installed on the platform to separate it from the tunnel. There is an opening of about 50 cm above the safety door for gas exchange between the station and the tunnel, as shown in Figure 2.
Figure 2.
Schematic diagram of the integrated closed system section.
The station hall level adopts a “single supply and single return” airflow organization method, and the platform level adopts a “top supply air, rail top and rail bottom return/exhaust air” method.
3.4. Numerical Model
Based on the actual measured size of the station, a three-dimensional geometric model was first established in Revit. Since Autodesk Simulation CFD requires a continuous fluid domain inside the model, and there are barriers between the platform and the station hall, a layered modeling strategy was adopted, and corresponding area openings were reserved at the stairs and escalators; small rounded parts such as steps and escalator handrails were simplified into triangular prism structures.
The entities inside the model are set as air, and the materials in other parts are defined as concrete. Parameters such as viscosity, thermal conductivity, and density are taken as default values within the system. This calculation uses the Realizable turbulence model and the standard wall function, with the wall controlled at 30–100; the grid size in the core personnel activity area is about 0.4 m, and the local encryption at geometric mutation places such as air outlets and columns is up to 0.2 m. After three sets of grid scheme independence tests, the final grid scheme is determined by balancing accuracy and efficiency. The solution uses a pressure-velocity coupling algorithm and a second-order upwind scheme. The residual convergence threshold of each equation is set to , and the wind speed stabilization at key locations is used as an auxiliary convergence criterion.
3.5. Model Boundaries
3.5.1. Model Assumptions
This study approximates the airflow in the tunnel and station as steady-state flow, and uses the average wind speed measured 25 s before and after the train enters and leaves the station as the piston wind boundary, reflecting the average aerodynamic effect during peak hours, focusing on the average ventilation and pollutant distribution laws, without capturing transient pulsations; the tunnel section shape is regular, and the cross-section flow velocity distribution is relatively uniform under the dominance of piston wind. A single-point measured wind speed is used to approximate the average wind speed of the cross-section, and only the piston effect is considered for the airflow at the entrance and exit.
3.5.2. Piston Wind Boundary Conditions
Measure the wind speed at the tunnel entrance and the opposite entrance of the inbound end when the train enters and leaves the station within s, and the wind speed at the tunnel entrance and the opposite entrance of the outbound end within s, as shown in Table 3. According to field investigations, there is no situation where two trains arrive at the station at the same time, so only the conditions of a single train arriving and departing are simulated.
Table 3.
Test results of average piston wind speed during train arrival and departure.
3.6. Mechanical Ventilation Boundary Conditions
The measured initial indoor air temperature is 25 °C. The surrounding walls, ceiling, and floor wall surfaces are set as adiabatic boundaries; the atmospheric pressure at the entrance and exit relative to the outside of the subway station is set to 0 Pa, and the tunnel wall is set as a no-slip boundary. Buoyancy terms are not activated in this simulation, the chimney effect of natural convection is not considered, and humidity is not used as a simulation parameter. The boundary parameters of each air outlet are shown in Table 4.
Table 4.
Boundary conditions of each air outlet.
3.7. Evaluation Indicators for Indoor Ventilation Effect
3.7.1. Wind Speed in the Personnel Activity Area
The wind speed in the personnel activity area is a key indicator affecting human comfort. Soligo et al. [20] subdivided different types of activities and concluded that the comfortable wind speed for pedestrians sitting or standing for a short time is 3.4–5.4 m/s, while for sitting or standing for a long time it is 1.6–3.3 m/s.
3.7.2. Velocity Non-Uniformity Coefficient
The purpose of airflow organization is to achieve comprehensive ventilation by diluting pollutants with fresh air. Reducing eddy currents and uniform flow fields can promote the effective diffusion of pollutants. The non-uniformity of the flow field is evaluated by the velocity non-uniformity coefficient, and the calculation formula is as follows:
where is the velocity of the i-th measuring point. The larger , the more uneven the flow field in the area.
3.7.3. Air Age
Air age is a key indicator for evaluating the freshness of indoor air and the performance of ventilation systems. It was proposed by Sandberg [21], and its physical meaning is the time required for fresh air to reach a certain point from the air supply outlet. The smaller the air age, the better the air quality at that point.
To quantify air age, the air at a certain point can be regarded as a collection of micro-groups of different ages, and its age distribution conforms to the frequency distribution function and the cumulative distribution function :
The air age at a certain point can be expressed as the average air age of all micro-groups at that point. The expression is:
where: —air age at a certain point in the room; —initial concentration of tracer gas; —instantaneous concentration of tracer gas; —frequency distribution function; —cumulative distribution function.
Air age is solved by the built-in tracer gas method of CFD software. A unit concentration of tracer gas is set at the air supply outlet, and the concentration evolution of tracer gas at each point is calculated through the convection-diffusion equation to obtain the average air age.
4. Analysis of Model Calculation Results
Based on CFD numerical simulation, the airflow organization characteristics of the station hall and platform levels under three typical working conditions were analyzed, and the ventilation effect was evaluated through indicators such as velocity field and air age field.
4.1. Ventilation Effect Analysis Without Train Operation
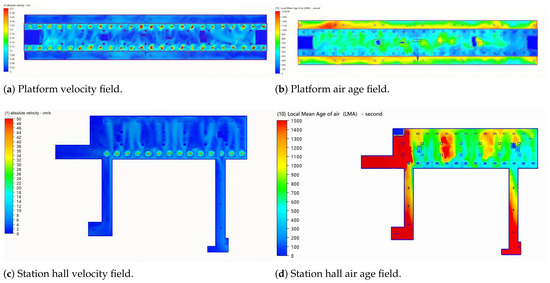
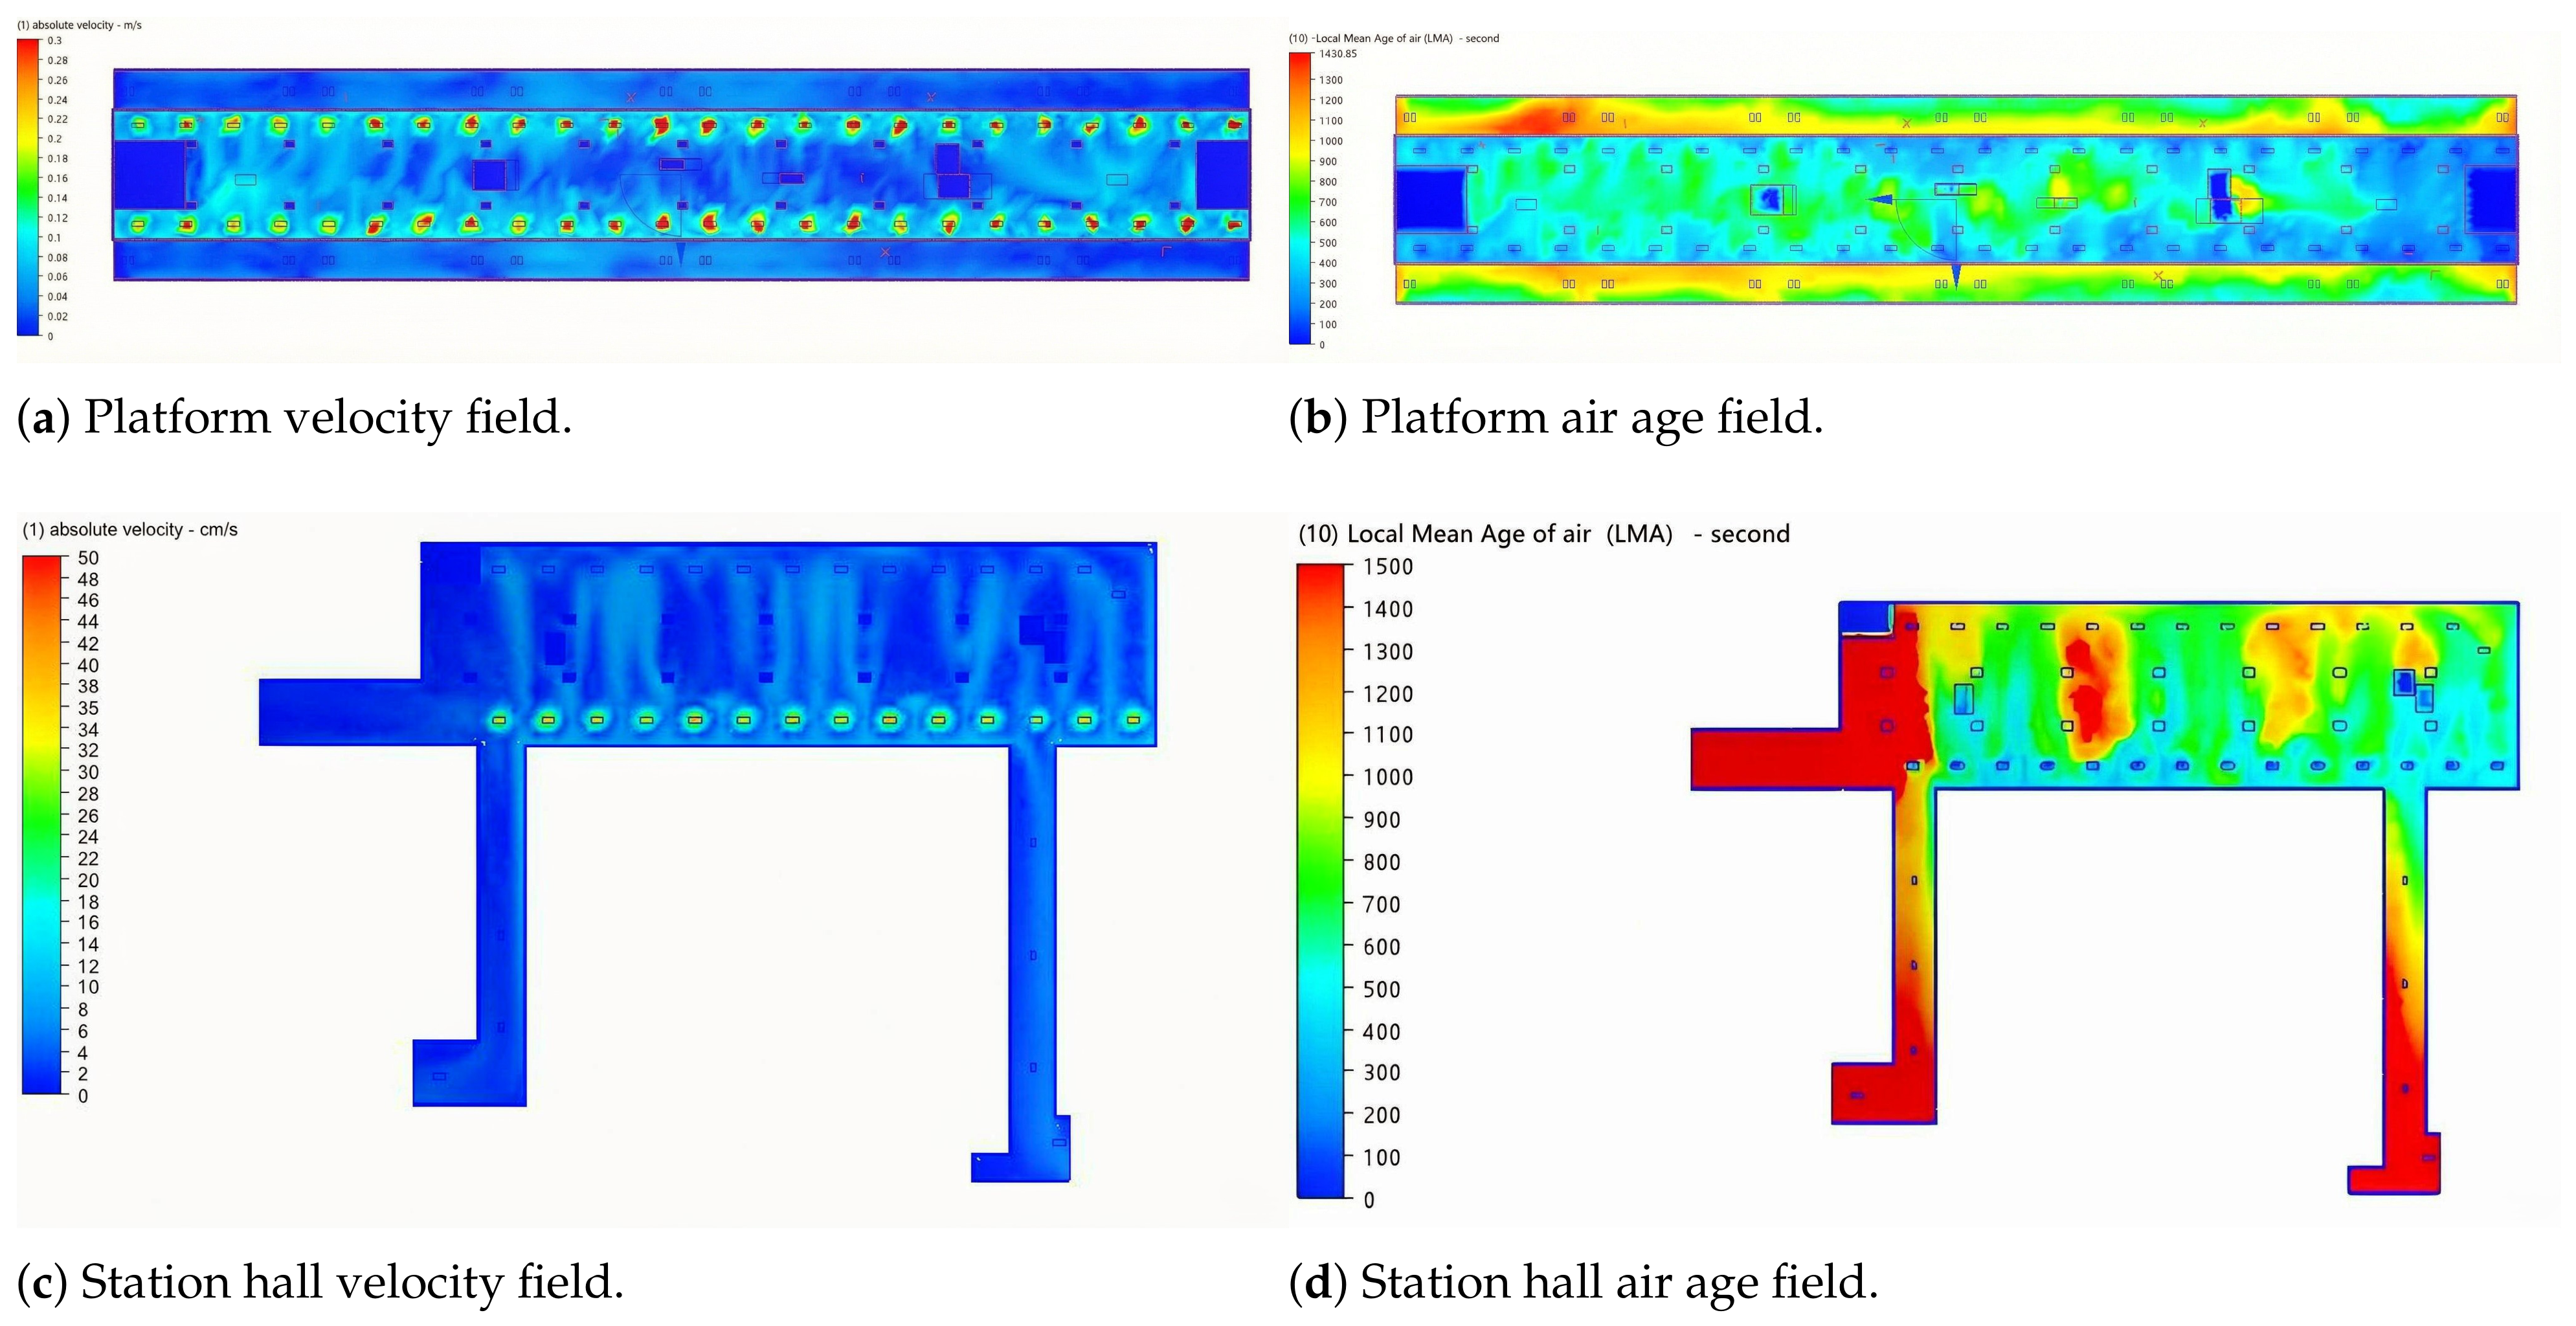
When no train is running, there is no influence of piston wind, and the interaction between the station hall and the platform can be ignored. The simulation of the station flow field is shown in Figure 3.
Figure 3.
Flow field simulation without train operation.
At the height of Z = 3.45 m, which is the breathing plane of passengers at 1.65 m, the wind speed in most areas of the platform is 0.1–0.15 m/s, and the flow field distribution is uniform; a large area of low-speed zone is formed around the middle stairs and columns of the platform, and the air age value increases by about 50% compared with other areas, and increases by nearly 100% at the corner of the elevator and stairs, indicating that the air circulation in this area is poor and there is a risk of pollutant accumulation.
There are obvious regional differences in the ventilation effect of the station hall level. There are large areas of no-wind zones in the middle and west, and the flow field distribution is uneven. When the supply air flows northward, it is blocked by facilities such as entrance gates, ticket offices, and elevators, resulting in the formation of ventilation dead corners downstream of the obstacles in the west and middle. The air age in these areas is noticeably higher than other locations, becoming a weak link in ventilation effect.
4.2. Impact of Train Arrival on Station Flow Field
The piston wind generated by train arrival greatly changes the flow field in the station and plays a noticeable role in improving air circulation.
4.2.1. Platform Level
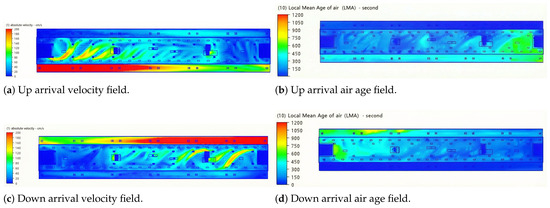
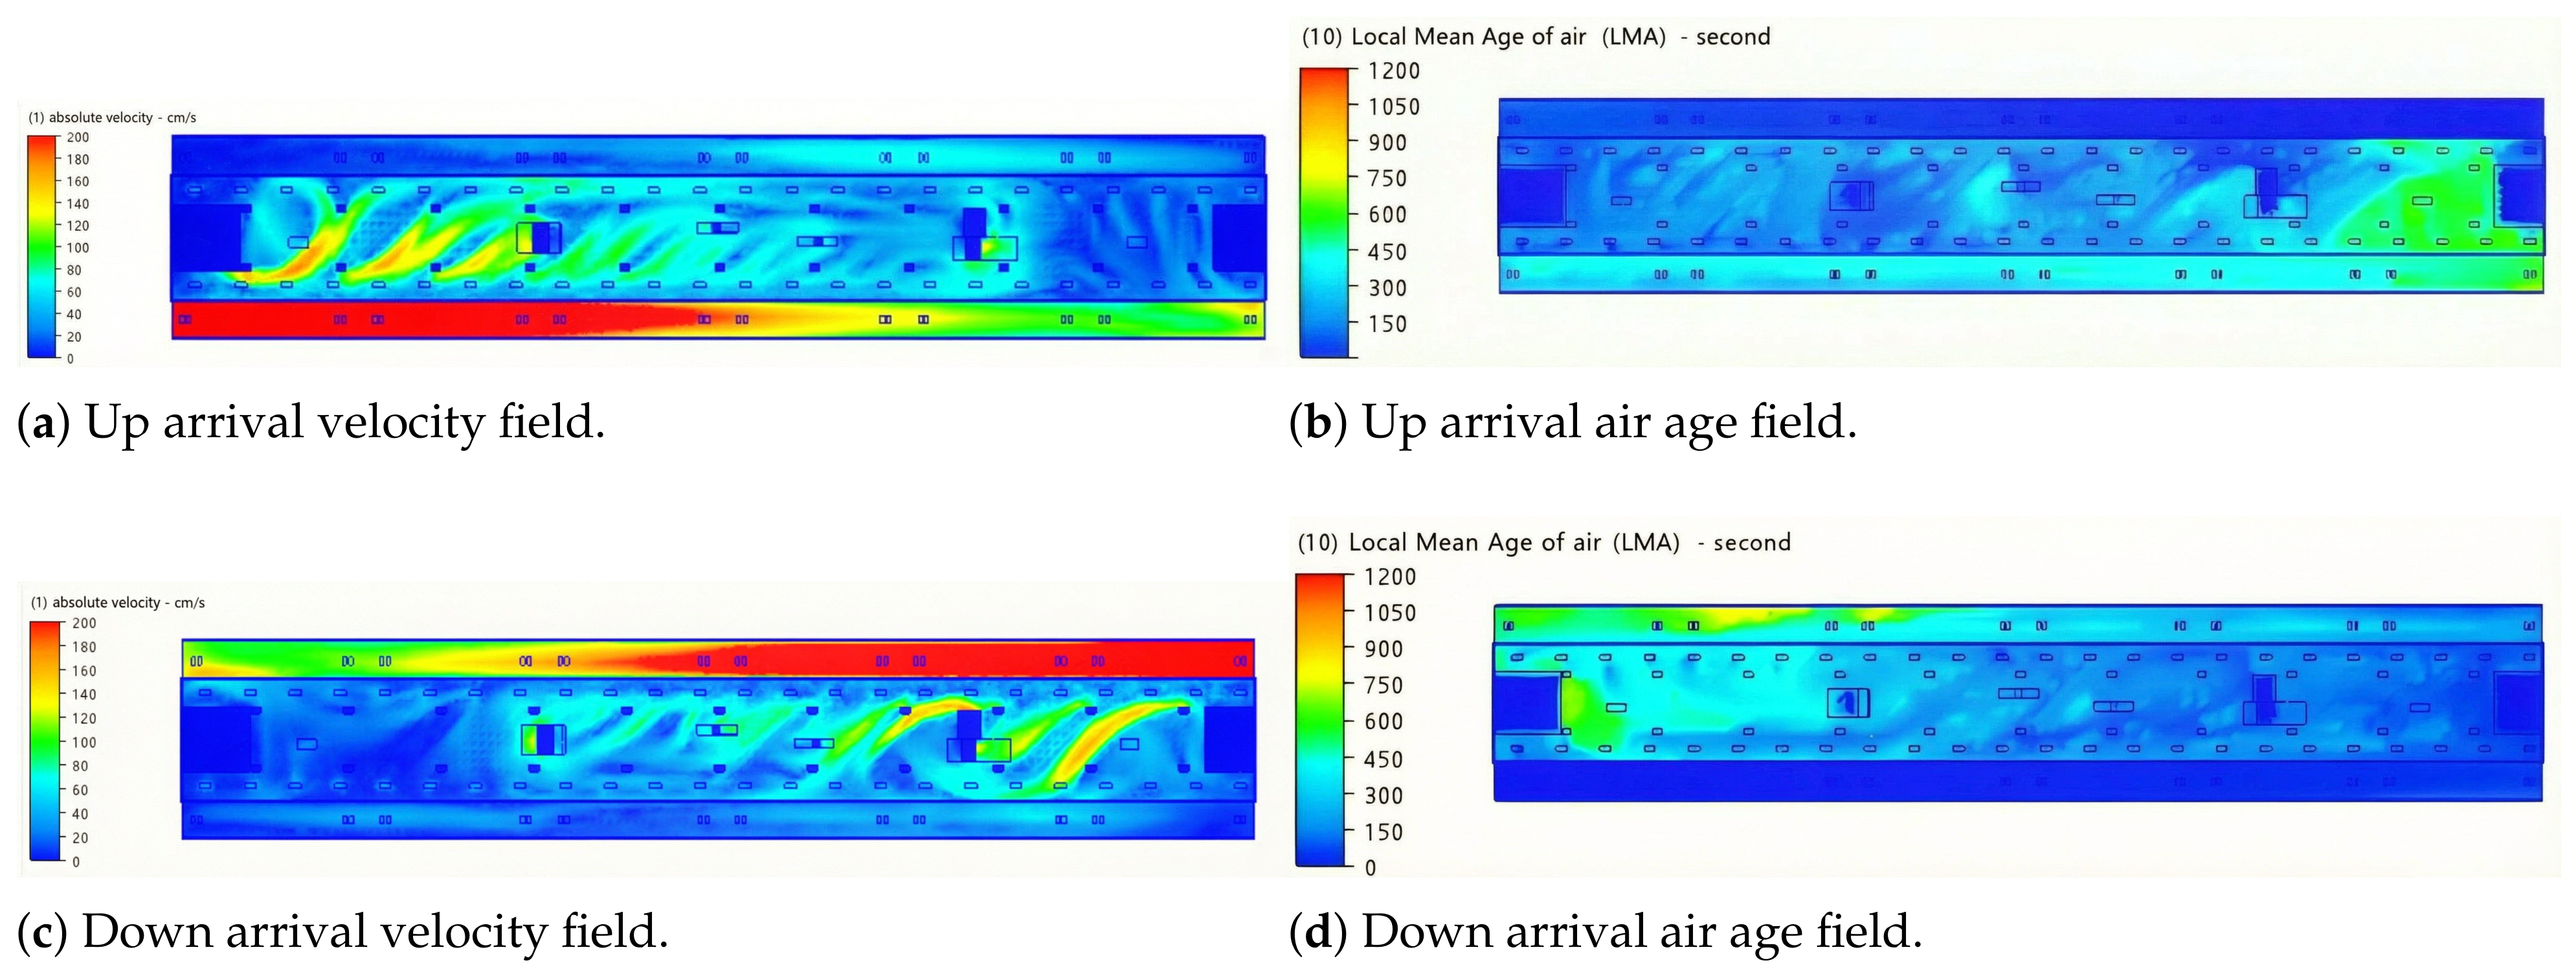
Figure 4 shows the velocity field and air age field distribution of the passenger breathing plane on the platform level when the up and down trains arrive at the station.
Figure 4.
Platform level flow field during train arrival.
Data analysis shows that train arrival noticeably increases the non-uniformity of platform airflow. When the up train arrives, the velocity non-uniformity coefficient of the breathing plane increases from 1.1 to 1.21; when the down train arrives, it further increases to 1.32. The tunnel piston wind blows into the platform through the top of the safety door, causing the wind speed at the inbound end to increase noticeably, reaching up to 2 m/s locally.
Piston wind can effectively improve platform ventilation and noticeably reduce the air age in the middle of the platform during low-frequency operation. However, the simulation regards tunnel wind as fresh air, while actual tunnel air may be polluted, such as metal pollutants generated by friction between trains and tracks. If the rail bottom exhaust system fails to effectively remove these pollutants, the piston wind will not only fail to dilute the platform air, but may also aggravate pollution.
4.2.2. Station Hall Level
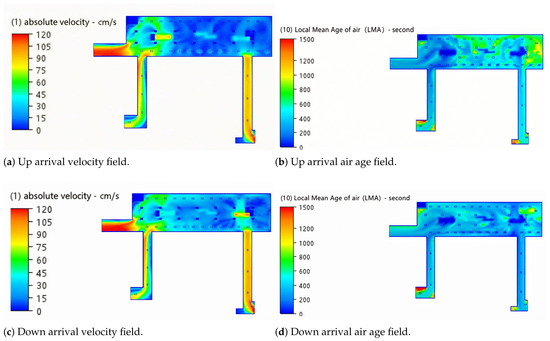
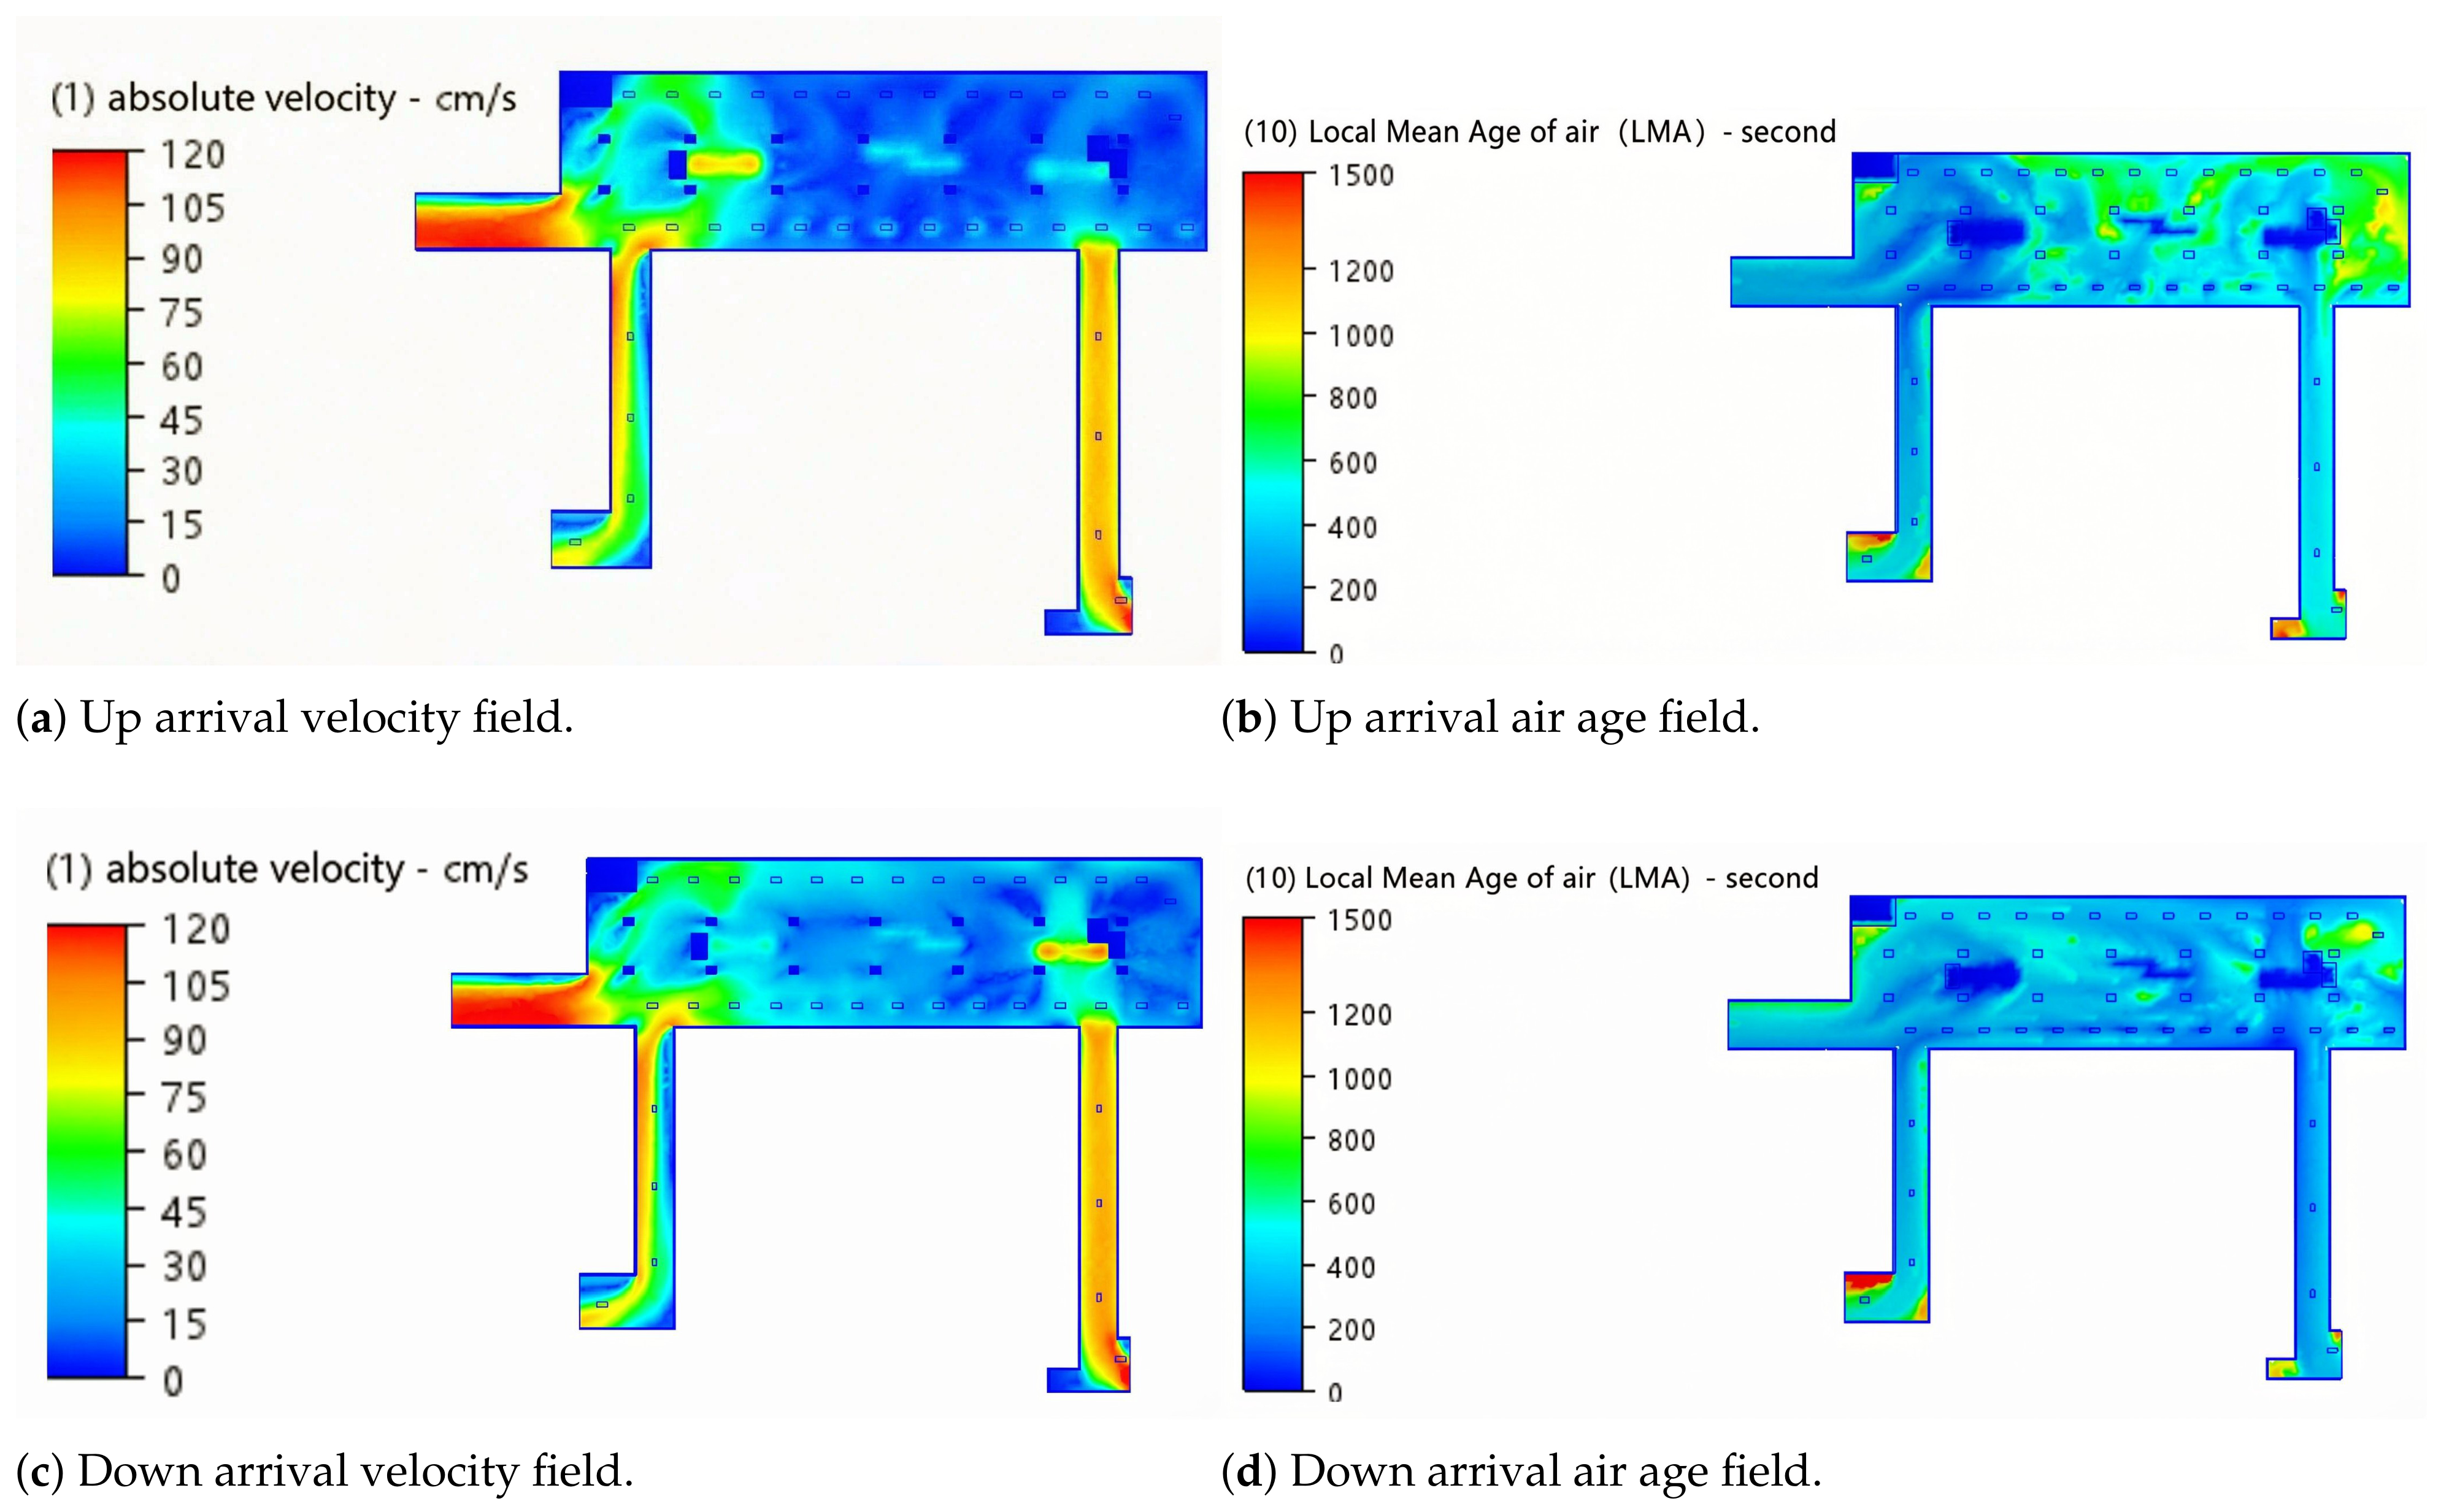
Figure 5 shows the velocity field and air age field distribution of the passenger breathing plane in the station hall when the up and down trains arrive at the station.
Figure 5.
Station hall level flow field during train arrival.
The piston wind generated by train arrival drives the air from the platform to the station hall through the stairs and escalators, which noticeably enhances the air flow in most areas of the station hall, and the wind speed of the breathing plane increases to 0.3–0.7 m/s. This airflow effectively eliminates the air retention area on the west side of the station hall, and also makes the station hall form a positive pressure, causing the air to accelerate and discharge at narrow exits such as Channel E, with a local wind speed of 1.2 m/s. However, the air age behind the elevator on the east side is still high due to obstruction, and the retention problem has not been solved.
4.3. Impact of Train Departure on Station Flow Field
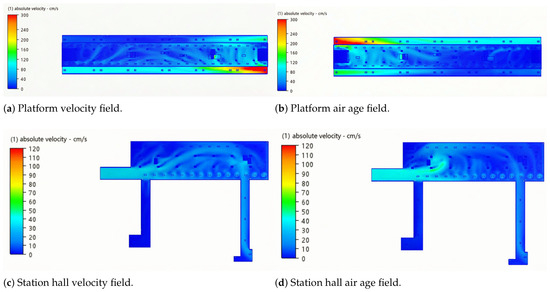
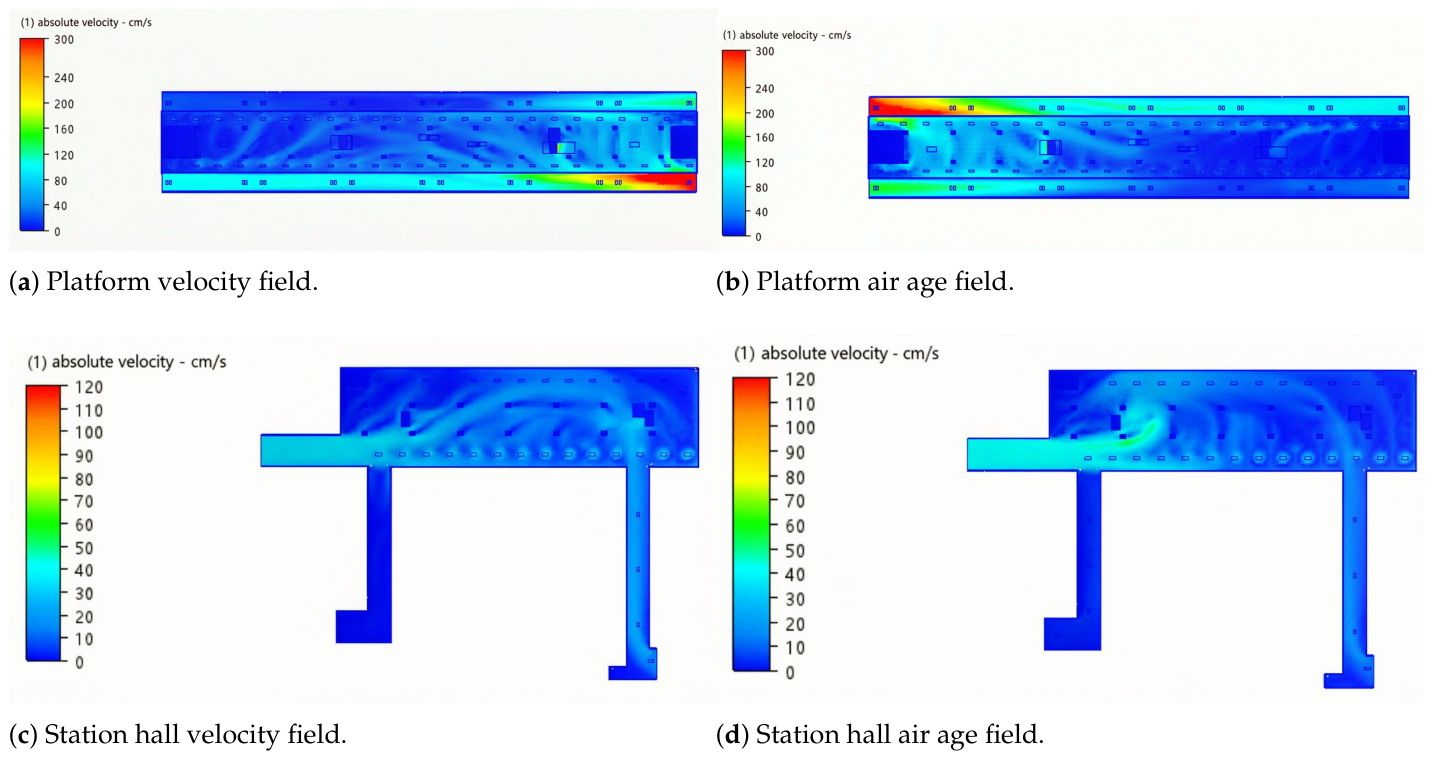
The simulation results of the velocity field in the station during train departure are shown in Figure 6.
Figure 6.
Velocity field simulation during train departure.
When the train departs, the piston effect forms a negative pressure in the station, driving the platform air to flow to the tunnel through the opening above the safety door. However, compared with the arrival condition, the velocity field formed during departure is noticeably smaller. The main reason is that the wind speed at the tunnel exit end is low and the safety door produces a blocking effect, which ultimately leads to the exhaust air volume of the station being much larger than the amount of fresh air supplied from outside.
The piston effect of train departure forms a dominant airflow path of “outdoor → entrance → station hall → stairs/escalators → platform”. Outdoor fresh air has the most noticeable impact on the stair area at the exit end, with a wind speed of about 0.5 m/s; the wind speed in the middle of the station hall is low (0.1–0.4 m/s), and passengers have no wind feeling; however, there are large areas of fresh air uncovered areas on the east and west sides. The air intake effects of each channel are noticeably different, with Channel E being the best, Channel C being the second, and Channel D being the weakest.
5. Major Pollutant Concentration Test
5.1. Test Point Layout
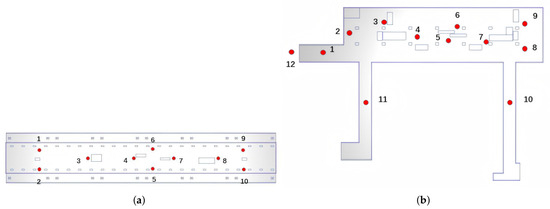
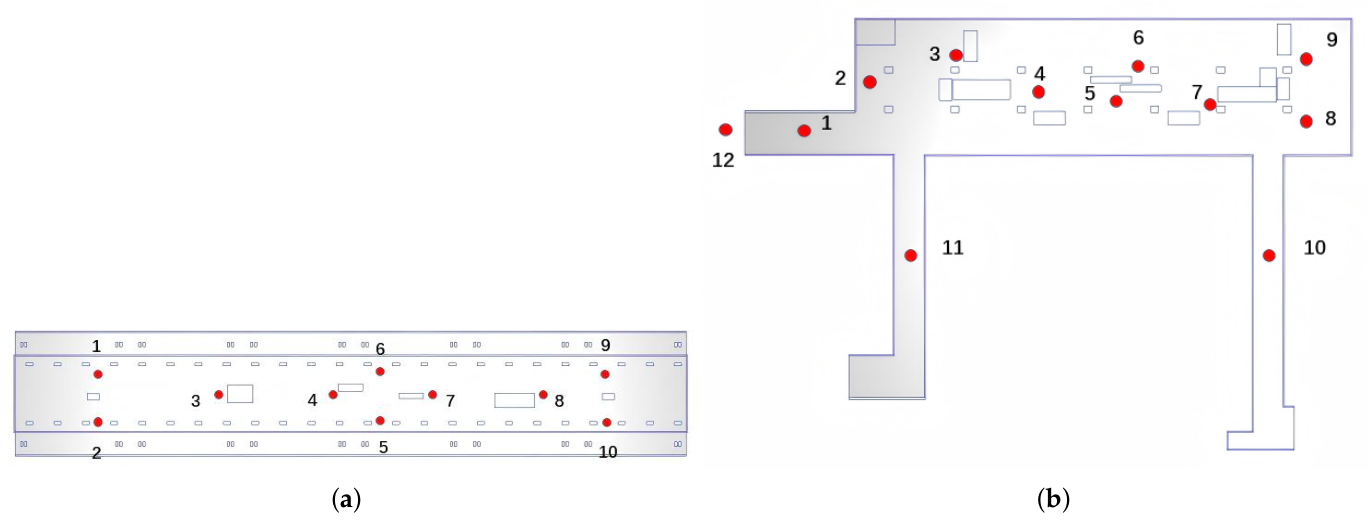
According to the “Technical Specification for Public Health Monitoring” [22], combined with the ventilation weak areas identified by CFD simulation, high air age areas, and piston wind influence paths, 10 measuring points are evenly arranged on the platform level and 12 measuring points on the station hall level, covering the main passenger activity areas and ventilation characteristic areas. All measuring points are located at the height of the passenger breathing plane, as shown in Figure 7.
Figure 7.
Schematic diagram of measurement point layout in the station. (a) Layout of measurement points on the platform level; (b) Layout of measurement points on the station hall level.
The CO2 concentration was measured using a XINTEST/HTI HT-2000 carbon dioxide detector (manufacturer: Dongguan Xintai Instrument Co., Ltd., Dongguan, Guangdong, China; measurement range: 0–9999 ppm; accuracy: ppm or ; resolution: 1 ppm; sensor: non-dispersive infrared absorption). For PM2.5, PM10, and TVOC, a LVCHI air quality monitor equipped with multiple sensors was used: a semiconductor sensor for TVOC and laser particle sensors for PM2.5 and PM10. Both instruments support real-time data logging and recording via their accompanying software. 22 measuring points were tested simultaneously. Data were collected for 200 s at each measuring point during the morning and evening peak periods. Among them, the CO2 index sampling interval was 1 s, and automatic continuous recording was performed; PM2.5, PM10, and TVOC took the average of the extreme values in the period.
5.2. Result Analysis
5.2.1. CO2 Concentration
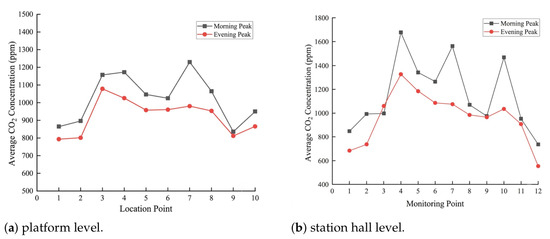
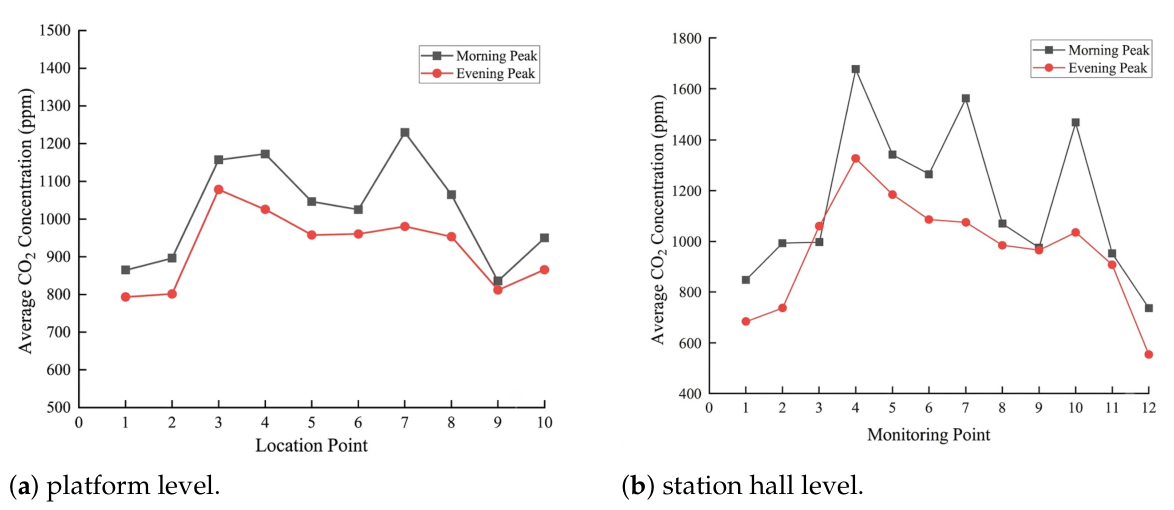
The average CO2 concentration levels during the morning and evening peaks of the station are shown in Figure 8. From the perspective of time and space distribution characteristics, its concentration shows a noticeable positive trend with passenger flow density. In terms of time, the average concentration on the platform during the morning peak is higher than that during the evening peak, but neither exceeds the 1500 ppm limit. In terms of spatial distribution, it shows the characteristics of “low at both ends, high in the middle and at the stairs/escalators”. The concentration in the upbound waiting area is higher during the morning peak, while the concentration at the west stair entrance is the highest during both morning and evening peaks; the concentration in the station hall is generally higher during the morning peak than during the evening peak, and is higher than that on the platform and outside the station. High concentration points are concentrated at the stairs and escalators. During the morning peak, the CO2 concentrations at points 4 and 7 even exceeded the 1500 ppm limit. The reasons are: large passenger flow during the morning peak, heavy load on the west stairs; the air rich in CO2 on the platform is carried to the station hall by the inbound piston wind, while the fresh air supply in the middle of the station hall is insufficient, especially the fresh air volume is small due to the departure effect, resulting in pollutants accumulating at the stairs and escalators and unable to be effectively diluted.
Figure 8.
Comparison of CO2 concentration during morning and evening peaks.
5.2.2. Fine Particulate Matter Concentration
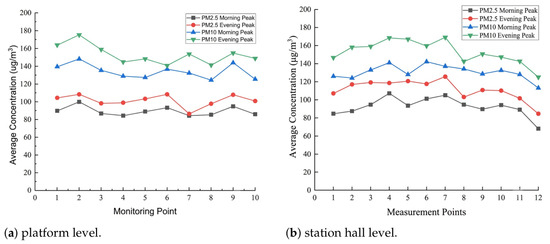
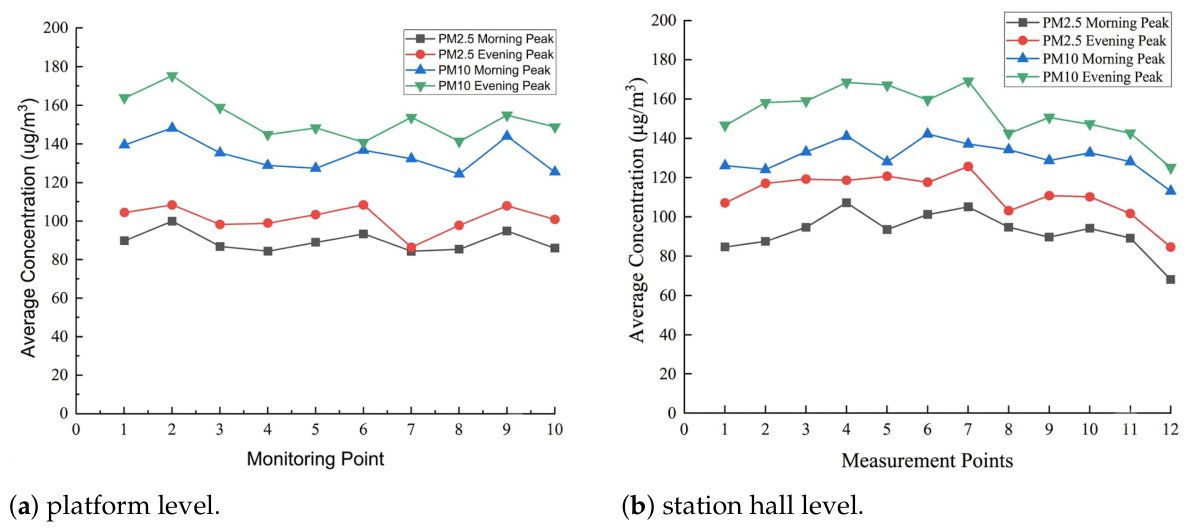
The average values of PM2.5 and PM10 at each measuring point during the morning and evening peaks are shown in Figure 9. The distribution patterns of PM2.5 and PM10 on the platform level are highly consistent, indicating that their sources and diffusion paths are similar. The difference in the concentration levels of the two pollutants during the morning and evening peaks is close to the difference in the air quality index in the morning and evening of the outdoor atmosphere, indicating that the indoor fine particulate matter concentration is noticeably affected by outdoor environmental input; internal sources such as metal particulate matter generated by friction between trains and tracks may also affect local concentrations, and the rail bottom exhaust system can discharge such pollutants to a certain extent.
Figure 9.
Comparison of fine particulate matter concentration during morning and evening peaks.
5.2.3. TVOC Concentration
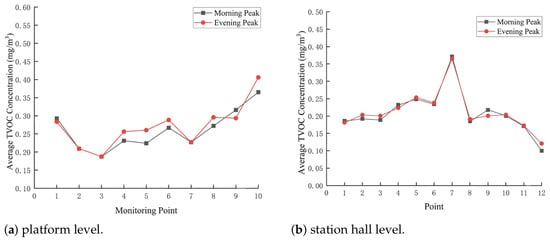
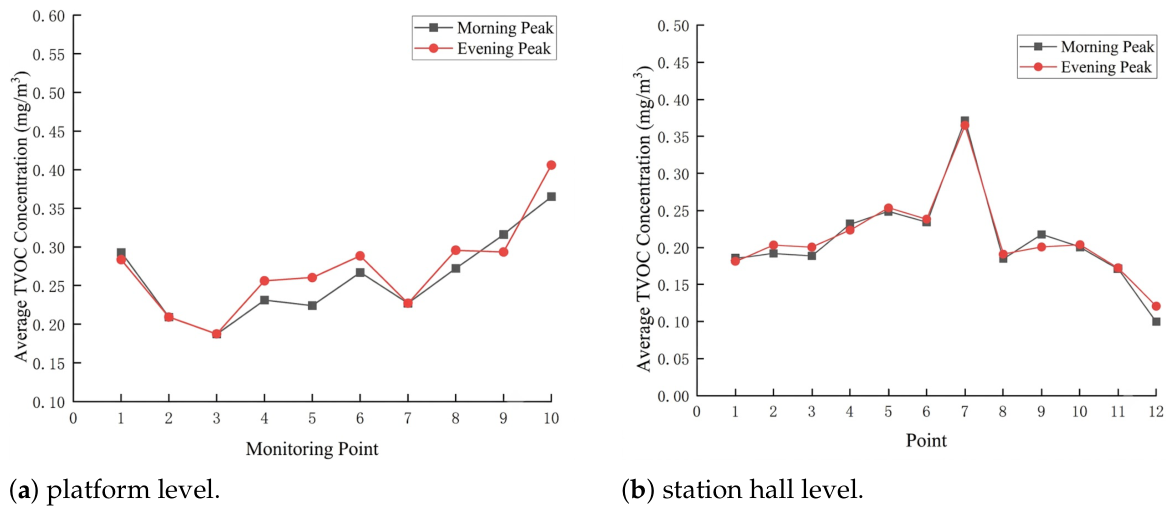
The test results of TVOC on the platform and in the station hall are shown in Figure 10. The TVOC concentration during the morning and evening peak hours is far less than the standard limit of 0.6 mg/m3, and the average concentration in the morning peak and evening peak is not much different, indicating that TVOC is not affected by passenger activities in the station.
Figure 10.
Comparison of TVOC concentration during morning and evening peaks.
5.2.4. Pattern Analysis
(1) Comprehensive analysis of CO2, fine particulate matter and TVOC measured data shows that the three types of pollutants exhibit a noticeable “ventilation control” characteristic in spatial distribution, that is, the high-value areas of air age highly coincide with the high-value areas of pollutant concentration. The specific performance is: in poorly ventilated areas such as the middle of the platform, the west side of the station hall, and the stairs and escalators, the concentrations of the three pollutants are relatively higher than those in the surrounding areas; while in the airflow active areas close to the air supply outlet, stairs and escalators openings, and passages, the pollutant concentrations are generally lower. This shows that the spatial heterogeneity of air quality in the station is mainly dominated by ventilation conditions, and mechanical ventilation and piston wind jointly determine the migration and accumulation pattern of pollutants.
(2) Although the three types of pollutants are affected by ventilation conditions, the formation mechanisms are noticeably different: CO2 concentration is dominated by passenger flow and has strong time-varying fluctuations; fine particulate matter mainly comes from outdoor penetration; TVOC remains at a low level for a long time, mainly from the continuous slow release of building materials, and is weakly disturbed by passenger flow and train operation.
(3) Finite element simulation shows that the air age at the west side of the station hall and the east stair entrance is the highest when no train is running, and the CO2 concentration at the corresponding point exceeds 1500 ppm during the morning peak, which verifies the model’s prediction ability for ventilation dead zones. During train arrival, the piston wind increases the wind speed at the inbound end of the platform to 2 m/s, and the flow velocity at the stairs and escalators of the station hall reaches 0.7 m/s. The concentrations of PM2.5 and PM10 in the corresponding areas fluctuate noticeably, indicating that high-speed airflow may carry tunnel particulate matter into the station. The air retention areas in the west side of the station hall and the middle of the platform identified in the simulation results highly coincide with the high pollution areas measured, which can qualitatively verify the reliability of the CFD model in capturing macroscopic airflow and pollutant distribution patterns.
5.3. Analysis of Air Quality Comprehensive Evaluation Results and Robustness Test
5.3.1. Analysis of Comprehensive Evaluation Results
The measured concentrations of CO2, fine particulate matter and TVOC are brought into the comprehensive evaluation model, and the air quality of 10 measuring points on the platform level and 12 measuring points on the station hall level is comprehensively evaluated. The index weights are calculated based on the morning peak as the benchmark condition, and the unified weights are used to complete the comparison and verification of the evening peak results to ensure consistent evaluation benchmarks.
According to formulas (1)–(3), the comprehensive air quality scores of each measuring point are calculated, and the results are shown in Table 5.
Table 5.
Extreme values of comprehensive air quality scores of each layer in the subway station during morning and evening peaks.
The results show that the comprehensive scores of the measuring points close to the stairs and escalators on the platform level are relatively high, mainly due to the air exchange effect of piston wind and mechanical ventilation. The worst air quality is concentrated in the platform entrance, the middle of the platform, and the stairs and escalators of the station hall. These areas highly coincide with the air retention areas identified by CFD simulation; from the comparison of time periods, the overall air quality of the station hall level during the evening peak is better than that during the morning peak, because the passenger flow is large during the morning peak, the CO2 emission intensity is high, and the space of the stairs and escalators is narrow and the ventilation is poor, so pollution is easy to accumulate. The comprehensive evaluation results quantitatively verify the rule that “ventilation conditions determine the spatial pattern of air quality”, providing a direct basis for accurately identifying weak areas and formulating differentiated environmental control strategies.
5.3.2. Robustness Test of Evaluation Method
The control schemes are designed from three dimensions: weighting method, weight fluctuation, and normalization method. The Spearman rank correlation coefficient is used to measure the ranking consistency. The results are shown in Table 6.
Table 6.
Ranking consistency test of site under different schemes.
The results show that within the reasonable method adjustment range, the ranking correlation coefficients of the two layers are higher than 0.9, and the core echelon of the site remains stable. Only small fluctuations occur in the middle adjacent measuring points, indicating that the conclusion is not noticeably affected by the weight and normalization method. The inter-layer difference in full-limit standardization stems from scenario adaptability: the dominant pollutant CO2 in the station hall level is within the limit, and the index discrimination is complete; the dominant pollutant PM2.5 in the platform level exceeds the standard as a whole, and the index loses its discrimination under the full-limit method, resulting in a decrease in correlation. This result also confirms the necessity of the mixed standardization strategy.
6. Discussion
The findings of this study are generally consistent with the literature reviewed in the Introduction. The observed spatial heterogeneity of CO2, PM2.5, and PM10 agrees with the field-measurement studies of Shakya et al. [8], Smith et al. [10], and Ji et al. [11], which also reported elevated particulate-matter levels and strong spatial variability in underground subway environments. The present study further shows that the piston-wind effect during train arrival can improve local air circulation but may also transport tunnel-borne pollutants into public areas, a dual effect that is consistent with the ventilation-difference mechanism discussed by Tan et al. [12].
Compared with previous single-indicator studies, the entropy-weighted-linear weighting comprehensive evaluation method proposed here can systematically quantify the overall air quality of each measuring point, and the robustness test confirms that the ranking results are not sensitive to moderate changes in weighting or standardization methods. Nevertheless, this study has several limitations: only a single island-platform station was investigated; field monitoring was limited to one-day morning and evening peaks; the CFD simulation adopted a steady-state approximation of the piston effect; and no chemical composition analysis of particulate matter or parallel monitoring in the tunnel was carried out. These limitations suggest that future work should adopt multi-site, long-period monitoring combined with transient numerical simulation to further improve the universality and quantitative reliability of the conclusions.
7. Conclusions
This paper proposes an entropy-weighted-linear weighting comprehensive evaluation method for air quality in subway stations based on the coupling of numerical simulation and field measurement, which elevates the decentralized simulation and measurement work to a systematic evaluation theory with guiding significance. The main conclusions are as follows:
(1) The proposed four-step technical route can effectively integrate the spatial prediction advantages of CFD simulation and the data authenticity of field measurement, overcome the limitations of single-index and single-means evaluation, and provide a reference method for air quality evaluation of similar underground stations.
(2) Under the condition of low-frequency operation of the environmental control system, low-speed zones or air retention zones are easily formed in the middle of the platform level and the west and middle areas of the station hall level due to the obstruction of airflow by facilities, and the air age is noticeably higher. The simulation shows that the air age downstream of the obstacles in the middle of the station hall is much higher than other areas, and the measured data also shows that the CO2 concentration in this area is prone to exceed the standard.
(3) The piston wind effect during train arrival can effectively improve the air circulation efficiency in the station and reduce the air age, but the piston wind may also carry tunnel pollutants to the public area of the station. In the measurement, the particulate matter concentration at the stairs and escalators increased, and the distribution coincided with the piston wind path.
(4) Although the piston effect during train departure can introduce outdoor fresh air, the simulation shows that its air volume is small and the coverage is uneven. There are areas on the east and west sides of the station hall where fresh air is difficult to reach effectively. Combined with the measured data, the overall ventilation effect is not as noticeable as the arrival condition.
(5) The distribution of PM2.5 and PM10 concentrations is highly consistent, which is noticeably affected by outdoor air quality input. The full-height safety door and rail bottom exhaust system have a certain control effect on internal pollution sources, and the particulate matter concentration in the station is generally controllable; TVOC concentration is at a stable low level due to the long operation time of the station, far below the standard limit; CO2 concentration is positively correlated with passenger flow density during morning and evening peaks, especially in poorly ventilated areas such as the stairs and escalators of the station hall, there is a risk of exceeding the standard. The simulated air age field highly coincides with the measured high concentration area.
(6) The comprehensive evaluation results quantitatively reveal the spatial distribution of air quality in the station: the stairs and escalators of the station hall and the middle of the platform are weak air quality areas, and the risk of pollution accumulation during the morning peak is higher than that during the evening peak. By optimizing the operation strategy of the environmental control system, the air age in high-concentration areas can be effectively reduced and the local ventilation effect can be improved. In the future, real-time monitoring data can be further combined to realize automatic control of the environmental control system.
(7) This study still has certain limitations: First, the study only carried out research on a single island-type underground station, and factors such as station geometry, operating conditions, and climatic conditions will affect the universality of the results; secondly, the field monitoring only covers a single day of morning and evening peak periods, the sample size is limited, and long-term effects such as seasonal changes and fluctuations in outdoor pollution levels are not covered; third, the CFD simulation uses steady-state approximate processing of the piston effect, which cannot fully capture the transient airflow dynamics characteristics; fourth, no chemical composition analysis of particulate matter and parallel monitoring in the tunnel were carried out, and pollution source identification was mainly based on distribution characteristics. Subsequent research can be further improved through multi-site, long-period monitoring and transient numerical simulation.
Author Contributions
Conceptualization, J.L. and M.L.; methodology, M.L.; software, Q.T.; validation, Y.Z., C.Z. and Z.C.; formal analysis, J.L.; investigation, W.L.; resources, L.Y.; data curation, Q.T.; writing—original draft preparation, J.L.; writing—review and editing, M.L.; visualization, Z.C.; supervision, M.L.; project administration, L.Y.; funding acquisition, M.L. All authors have read and agreed to the published version of the manuscript.
Funding
This work was supported by the Science and Technology Research Project of China State Construction Infrastructure Co., Ltd. (Grant No. CSCIC-2024-KT-(02)) and the 2025 Science and Technology Innovation Program of the Department of Housing and Urban-Rural Development of Guangdong Province (Grant No. 20250228K0022).
Institutional Review Board Statement
Not applicable.
Informed Consent Statement
Not applicable.
Data Availability Statement
The data presented in this study are available on request from the corresponding author.
Acknowledgments
This work was supported by the Science and Technology Research Project of China State Construction Infrastructure Co., Ltd. (Grant No. CSCIC-2024-KT-(02)) and the 2025 Science and Technology Innovation Program of the Department of Housing and Urban-Rural Development of Guangdong Province (Grant No. 20250228K0022). The authors would like to express their sincere gratitude to all participants who contributed to this study.
Conflicts of Interest
Jinyan Liu and Qianyu Tang were employed by the company China Construction Infrastructure Corp., Wanhua Li was employed by the company China Construction Third Bureau First Engineering Co., Ltd. The authors declare that this study received funding from Science and Technology Research Project of China State Construction In-frastructure Co., Ltd. and the 2025 Science and Technology Innovation Program of the Department of Housing and Urban-Rural Development of Guangdong Province. The funder was not involved in the study design, collection, analysis, interpretation of data, the writing of this article, or the decision to submit it for publication.
Abbreviations
The following abbreviations are used in this manuscript:
| CFD | Computational Fluid Dynamics |
| TVOC | Total Volatile Organic Compounds |
| PM | Particulate Matter |
| CO2 | Carbon Dioxide |
References
- Jung, H.; Kim, B.; Ryu, J.; Maskey, S.; Kim, J.-C.; Sohn, J.R.; Ro, C.-U. Source identification of particulate matter collected at underground subway stations in Seoul, Korea using quantitative single-particle analysis. Atmos. Environ. 2010, 44, 2287–2293. [Google Scholar] [CrossRef] [Scilit]
- Chillrud, S.N.; Grass, D.; Ross, J.M.; Coulibaly, D.; Slavkovich, V.; Epstein, D.; Sax, S.N.; Pederson, D.; Johnson, D.; Spengler, J.D.; et al. Steel dust in the New York City subway system as a source of manganese, chromium, and iron exposures for transit workers. J. Urban Health 2005, 82, 33–42. [Google Scholar] [CrossRef] [Scilit] [PubMed]
- Kim, K.Y.; Kim, Y.S.; Roh, Y.M.; Lee, C.M.; Kim, C.N. Spatial distribution of particulate matter (PM10 and PM2.5) in Seoul Metropolitan Subway stations. J. Hazard. Mater. 2008, 154, 440–443. [Google Scholar] [CrossRef] [Scilit] [PubMed]
- Ye, X.J. Investigation of indoor environmental quality in Shanghai metro stations, China. Environ. Monit. Assess. 2009, 167, 643–651. [Google Scholar] [CrossRef] [Scilit] [PubMed]
- Gu, Y.X.; Wang, J.J.; Xie, J.C.; Liu, J.P.; Pan, S.; Wang, X.R. Experimental study of distribution of particulate matter pollution in different metro environmental control systems. J. Xi’an Univ. Technol. 2018, 34, 55–60. (In Chinese) [Google Scholar]
- Mugica-Álvarez, V.; Figueroa-Lara, J.; Romero-Romo, M.; Sepúlveda-Sánchez, J.; López-Moreno, T. Concentrations and properties of airborne particles in the Mexico City subway system. Atmos. Environ. 2012, 49, 284–293. [Google Scholar] [CrossRef] [Scilit]
- He, S.Q.; Jin, L.Z.; Wu, X.; Ci, H.P. Field measurement research of inhalable particles in Beijing typical subway system. Saf. Environ. Eng. 2017, 24, 40–44, 50. (In Chinese) [Google Scholar]
- Shakya, K.M.; Saad, A.; Aharonian, A. Commuter exposure to particulate matter at underground subway stations in Philadelphia. Build. Environ. 2020, 186, 107322. [Google Scholar] [CrossRef] [Scilit]
- Tu, M.; Olofsson, U. PM levels on an underground metro platform: A study of the train, passenger flow, urban background, ventilation, and night maintenance effects. Atmos. Environ. X 2021, 12, 100134. [Google Scholar] [CrossRef] [Scilit]
- Smith, J.D.; Barratt, B.M.; Fuller, G.W.; Kelly, F.J.; Loxham, M.; Nicolosi, E.; Priestman, M.; Tremper, A.H.; Green, D.C. PM2.5 on the London Underground. Environ. Int. 2020, 134, 105188. [Google Scholar] [CrossRef] [Scilit] [PubMed]
- Ji, W.; Li, X.; Wang, C. Composition and exposure characteristics of PM2.5 on subway platforms and estimates of exposure reduction by protective masks. Environ. Res. 2021, 197, 111042. [Google Scholar] [CrossRef] [Scilit] [PubMed]
- Tan, S.T.; Mohamed, N.; Ng, L.C.; Aik, J. Air quality in underground metro station commuter platforms in Singapore: A cross-sectional analysis of factors influencing commuter exposure levels. Atmos. Environ. 2022, 273, 118962. [Google Scholar] [CrossRef] [Scilit]
- Zhang, R. Study on Indoor Air Quality in Subway Stations. Ph.D. Thesis, Nanjing University of Science and Technology, Nanjing, China, 2015. (In Chinese) [Google Scholar]
- Yang, W.C. Study on Calculation Method and Application of Pollutant Concentration in Operating Subway. Ph.D. Thesis, Central South University, Changsha, China, 2009. (In Chinese) [Google Scholar]
- Faugier, L.; Marinus, B.G.; Bosschaerts, W.; Laboureur, D.; Limam, K. CFD model for airflow in a subway station compared to on-site measurements: The challenges of as-built environment. Tunn. Undergr. Space Technol. 2023, 140, 105248. [Google Scholar] [CrossRef] [Scilit]
- Ma’bdeh, S.N.; Hamasheh, A.A.; Al-Shawbkeh, M.; Alali, R.O.; Almomani, R.M.; Obeidat, L.M.; Alrebei, O.F. Enhancing office air quality: The role of window to wall ratio with window-wind catchers using CFD analysis. Energy Rep. 2025, 13, 1508–1524. [Google Scholar] [CrossRef] [Scilit]
- GB 50157-2013; Code for Metro Design (with Explanatory Provisions). Standards Press of China: Beijing, China, 2013. (In Chinese)
- GB 3095-2012; Ambient Air Quality Standard. Standards Press of China: Beijing, China, 2012. (In Chinese)
- GB 50325-2010; Code for Indoor Environmental Pollution Control of Civil Building Engineering. Standards Press of China: Beijing, China, 2010. (In Chinese)
- Soligo, M.J.; Irwin, P.A.; Williams, C.J.; Schuyler, G.D. A comprehensive assessment of pedestrian comfort including thermal effects. J. Wind Eng. Ind. Aerodyn. 1998, 77, 753–766. [Google Scholar] [CrossRef] [Scilit]
- Sandberg, M. What is Ventilation Efficiency? Build. Environ. 1981, 16, 123–135. [Google Scholar] [CrossRef] [Scilit]
- GB/T 17220-1998; Technical Specification for Public Health Monitoring. Standards Press of China: Beijing, China, 1998. (In Chinese)

Disclaimer/Publisher’s Note: The statements, opinions and data contained in all publications are solely those of the individual author(s) and contributor(s) and not of MDPI and/or the editor(s). MDPI and/or the editor(s) disclaim responsibility for any injury to people or property resulting from any ideas, methods, instructions or products referred to in the content. |
© 2026 by the authors. Licensee MDPI, Basel, Switzerland. This article is an open access article distributed under the terms and conditions of the Creative Commons Attribution (CC BY) license.