


Abstract
Mesoscale convective systems (MCSs) are organized convective precipitation regions that produce severe weather hazards, including heavy rainfall, flooding, and strong winds. Objective identification and tracking remain essential for MCS statistical analysis and operational forecasting. Conventional threshold-based methods using radar reflectivity or satellite brightness temperature are limited by terrain blockage, detection range constraints, and poor performance under nighttime or low-cloud conditions. This study developed a deep learning framework for MCS identification and tracking using hourly multi-source merged precipitation products from 18 summer seasons (2008–2025). A semi-supervised labeling strategy combining threshold-based pre-annotation and manual quality control was used to construct the dataset. Four architectures (DNN, U-Net, Attention U-Net, and Swin-Unet) were evaluated for pixel-level semantic segmentation, coupled with a conventional area overlap tracker and a proposed hybrid-criterion tracking method. Swin-Unet achieved the highest identification accuracy, with an Intersection over Union (IoU) of 0.90, and outperformed the other models in critical success index (CSI) and probability of detection (POD). The hybrid-criterion tracker, integrating area overlap, centroid distance, and deep feature similarity, attained a tracking accuracy of 0.94, with a 7.2% improvement over the area overlap method and a 34% lower break rate. A representative Meiyu rainfall event confirmed that the proposed approach captures the complete MCS life cycle. These results demonstrate that merged precipitation products offer a viable data source for operational MCS monitoring, particularly in radar-sparse regions.
1. Introduction
Mesoscale Convective Systems (MCSs) are organized convective precipitation systems with a horizontal scale exceeding 100 km in at least one direction [1]. As primary carriers of severe weather hazards, including heavy rainfall, hailstorms, lightning, and damaging winds, MCSs pose significant threats to urban flood control and public safety. In the Yangtze-Huaihe River region of China, MCSs are primary triggers of Meiyu-front heavy rainfall, with a single intense system capable of producing over 100 mm of precipitation within a few hours [2,3]. Objective identification and tracking of MCSs are fundamental to spatiotemporal statistics, mechanistic studies, and forecasting and early warning applications [4,5].
Currently, operational MCS identification relies primarily on threshold-based methods using radar reflectivity or satellite cloud-top brightness temperature [6,7]. These approaches are limited by terrain blockage, radar range limitations in mountainous areas of western China, and less effective satellite imagery during nighttime or cloudy conditions. Moreover, classical threshold methods assume constant echo intensity and stable morphology, leading to pseudo-identification or pseudo-separation during rapid MCS evolution, splitting, and merging processes. Traditional methods also provide relatively coarse boundary delineation and cannot learn morphological features automatically, making it difficult to meet the demands of refined intelligent MCS monitoring [5,8,9].
In recent years, methods for identifying and tracking MCSs based on precipitation products have received increasing attention. These products offer advantages, including broad coverage, lack of dependence on radar range or terrain, and long-term continuous availability. The FiT tracking algorithm, developed based on IMERG precipitation products, achieved 10-year continuous tracking of global tropical MCSs [10]. An MCS tracking dataset constructed from tropical precipitation has shown that, despite limitations in spatiotemporal continuity, precipitation fields provide a complementary perspective for MCS monitoring alongside radar and satellite observations [11]. However, precipitation-product-based MCS identification also has limitations; for instance, satellite-retrieved precipitation may underestimate strong convective rainfall, potentially leading to missed detection of some MCSs [12].
Nevertheless, multi-source merged precipitation products integrate ground-based rain gauge observations, satellite retrievals, and numerical model outputs, effectively improving quantitative accuracy while maintaining broad spatial coverage [13]. This provides a data foundation for MCS identification that balances both coverage and precision requirements. Recent evaluations have further confirmed the superior performance of merged products over individual satellite or reanalysis datasets in regional applications, particularly in data-scarce areas [14]. Therefore, exploring MCS identification based on merged precipitation products offers potential value for monitoring in western China, where radar coverage is insufficient.
Deep learning techniques have demonstrated tremendous potential in meteorological image analysis, offering new approaches for automated MCS identification and tracking. Swin-Unet leverages the transformer architecture to overcome the limited contextual modeling capability of traditional CNNs when processing radar reflectivity or satellite cloud-top brightness temperature [15,16]. TGNet, an R2U-Net-based architecture with residual connections and recurrent convolution, achieved a CSI of 0.77 in severe convective weather (thunderstorm wind gust) identification [17]. For tracking, spatiotemporal overlap tracking was applied to match MCSs identified by DNN, with favorable performance confirmed through case verification [8]. Beyond these data-driven approaches, the EMMA-Tracker employed IMERG satellite precipitation products for MCS identification and tracking, combined with physical filtering using uplift indices derived from ERA5 reanalysis, to construct a 27-year European MCS climatological dataset [18]. These studies demonstrate the broad application prospects of deep learning methods in MCS identification and tracking.
Motivated by these considerations, this study develops an integrated framework for MCS identification and tracking using four deep learning architectures—DNN, U-Net, Attention U-Net, and Swin-Unet—which were selected to represent different design paradigms in image segmentation and enable a systematic comparison of architectural innovations for MCS identification. The framework is applied to hourly merged precipitation data from 18 summer seasons (2008–2025) to identify and track MCSs affecting Hefei, China. Through seven comparative experiments and case analyses, we systematically evaluate the identification accuracy and tracking continuity of each method. The results demonstrate the feasibility of deep learning-based MCS identification using merged precipitation products and provide valuable references for operational heavy rainfall monitoring and forecasting.
2. Materials and Methods
2.1. Study Area and Data
2.1.1. Merged Precipitation Product
This study uses the hourly precipitation product from the China Meteorological Administration Land Data Assimilation System (CLDAS) [19]. The product is generated using the Space–Time Multiscale Analysis System (STMAS) three-dimensional variational assimilation method, which merges ground-based rain gauge observations, CPC MORPHing technique (CMORPH) satellite precipitation estimates [20], and Global/Regional Assimilation and Prediction System (GRAPES) model outputs [21]. Ground station data are assimilated to correct systematic biases in satellite retrievals, significantly improving quantitative accuracy [22]. The CLDAS merged precipitation product has been operational since 2008, providing an 18-year record (2008–2025) that is sufficiently long for MCS statistical analysis. From this product, we compiled a dataset at 0.05° spatial and 1 h temporal resolution. Previous independent validation over China reported that the 0.05° three-source merged precipitation product achieves a correlation coefficient of 0.807 and a root mean square error (RMSE) of 0.934 mm/h at the hourly scale, outperforming gauge interpolation, radar Quantitative Precipitation Estimation (QPE), and satellite-only products [23]. The correlation coefficient reaches 0.808 in gauge-dense regions of eastern China but decreases to 0.512 in gauge-sparse regions of western China, while still outperforming single-source products [23]. The relatively dense rain gauge network in eastern China, including the study area, supports the high quality of the merged product used in this study.
2.1.2. Study Area Determination
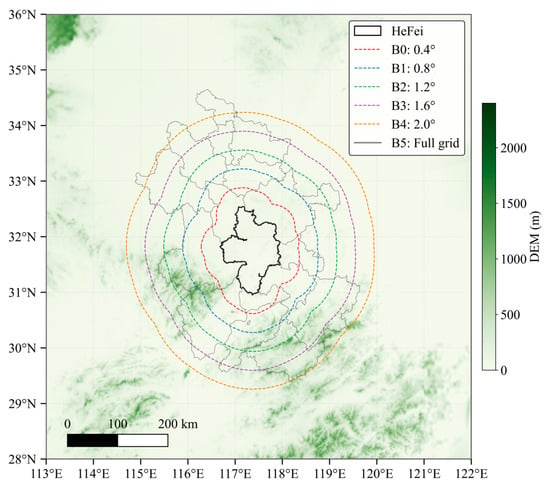
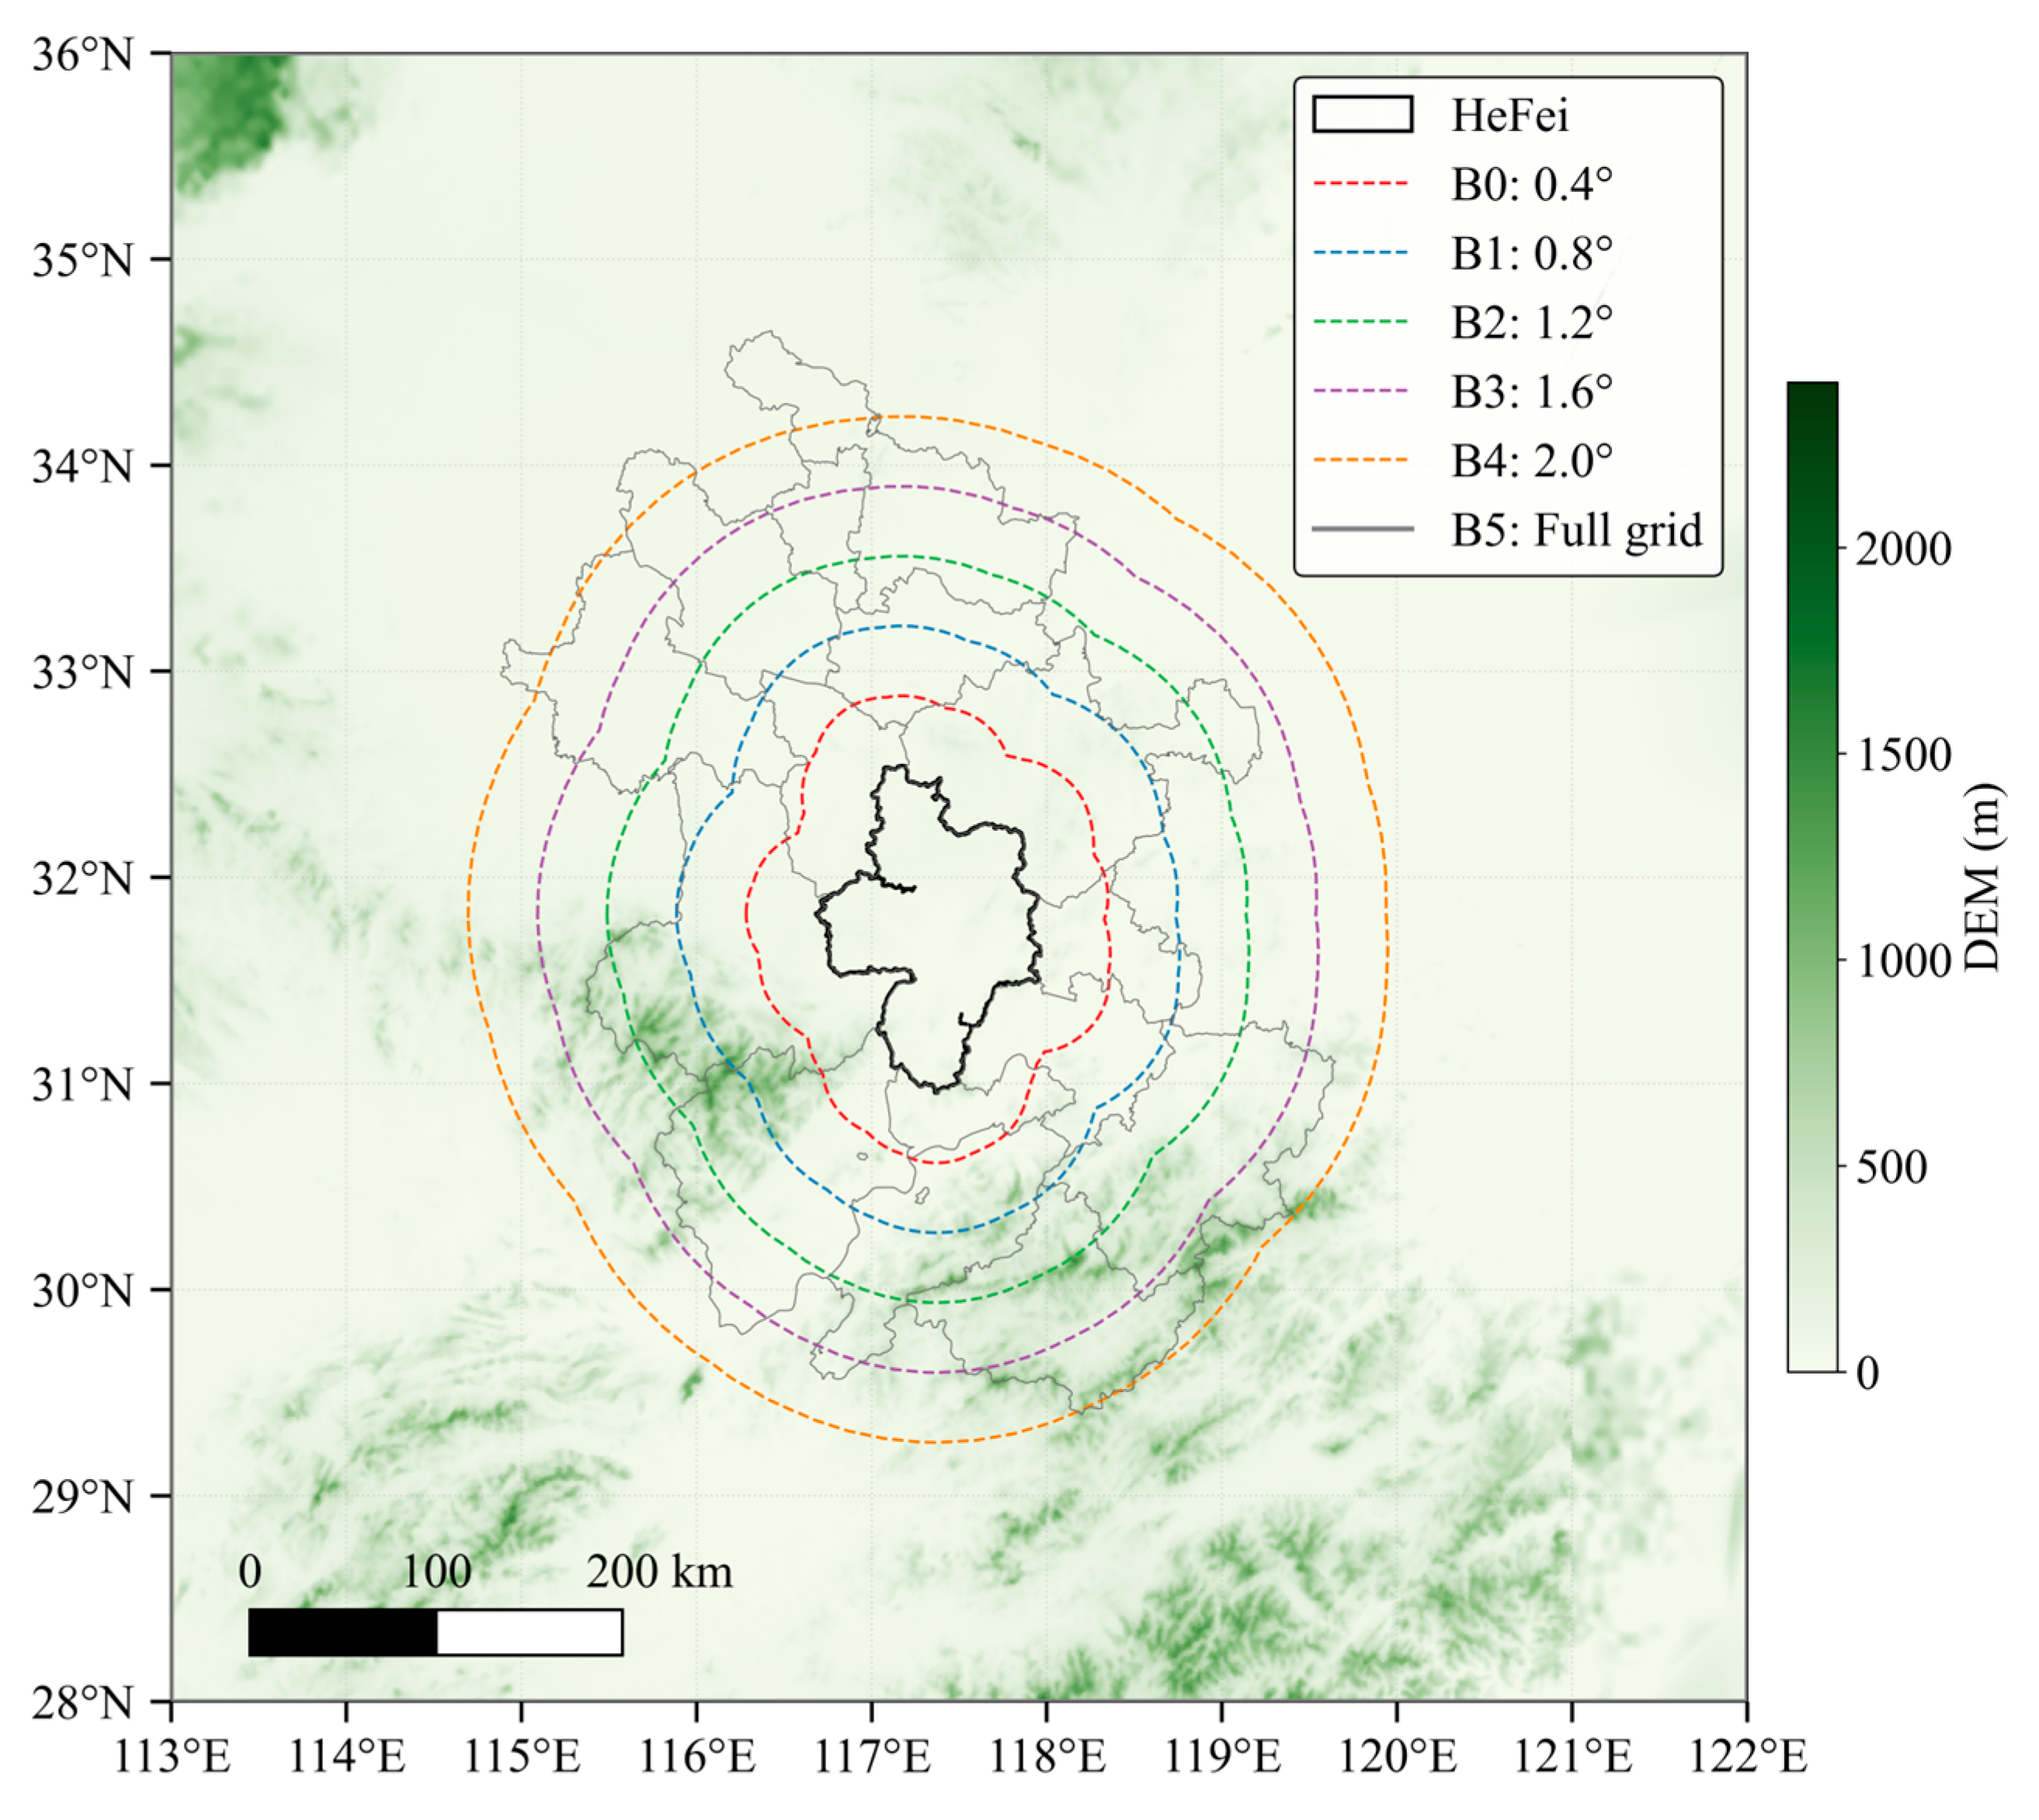
This study focuses on identifying and tracking MCS events that affect Hefei, specifically targeting continuous events whose precipitation regions geographically overlap with its administrative boundary. The city is located in the Yangtze–Huaihe River region, one of the most active areas for Meiyu-season MCSs in China. This region also has relatively limited radar coverage, which motivates the use of merged precipitation products in this study. To determine an appropriate study domain extending outward from Hefei, we conducted sensitivity experiments constrained by data availability and computational resources. Using Hefei’s administrative boundary as the baseline, we established six buffer levels (Table 1). Their spatial distribution is shown in Figure 1. The merged precipitation data were cropped accordingly, and a traditional threshold-based MCS identification method was applied to quantify the total number of MCSs in the domain, the number affecting Hefei, and their durations.
Table 1.
Range of buffer sensitivity experiments.
Figure 1.
Study area and buffer zones.
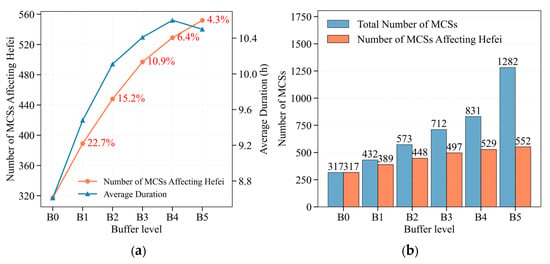
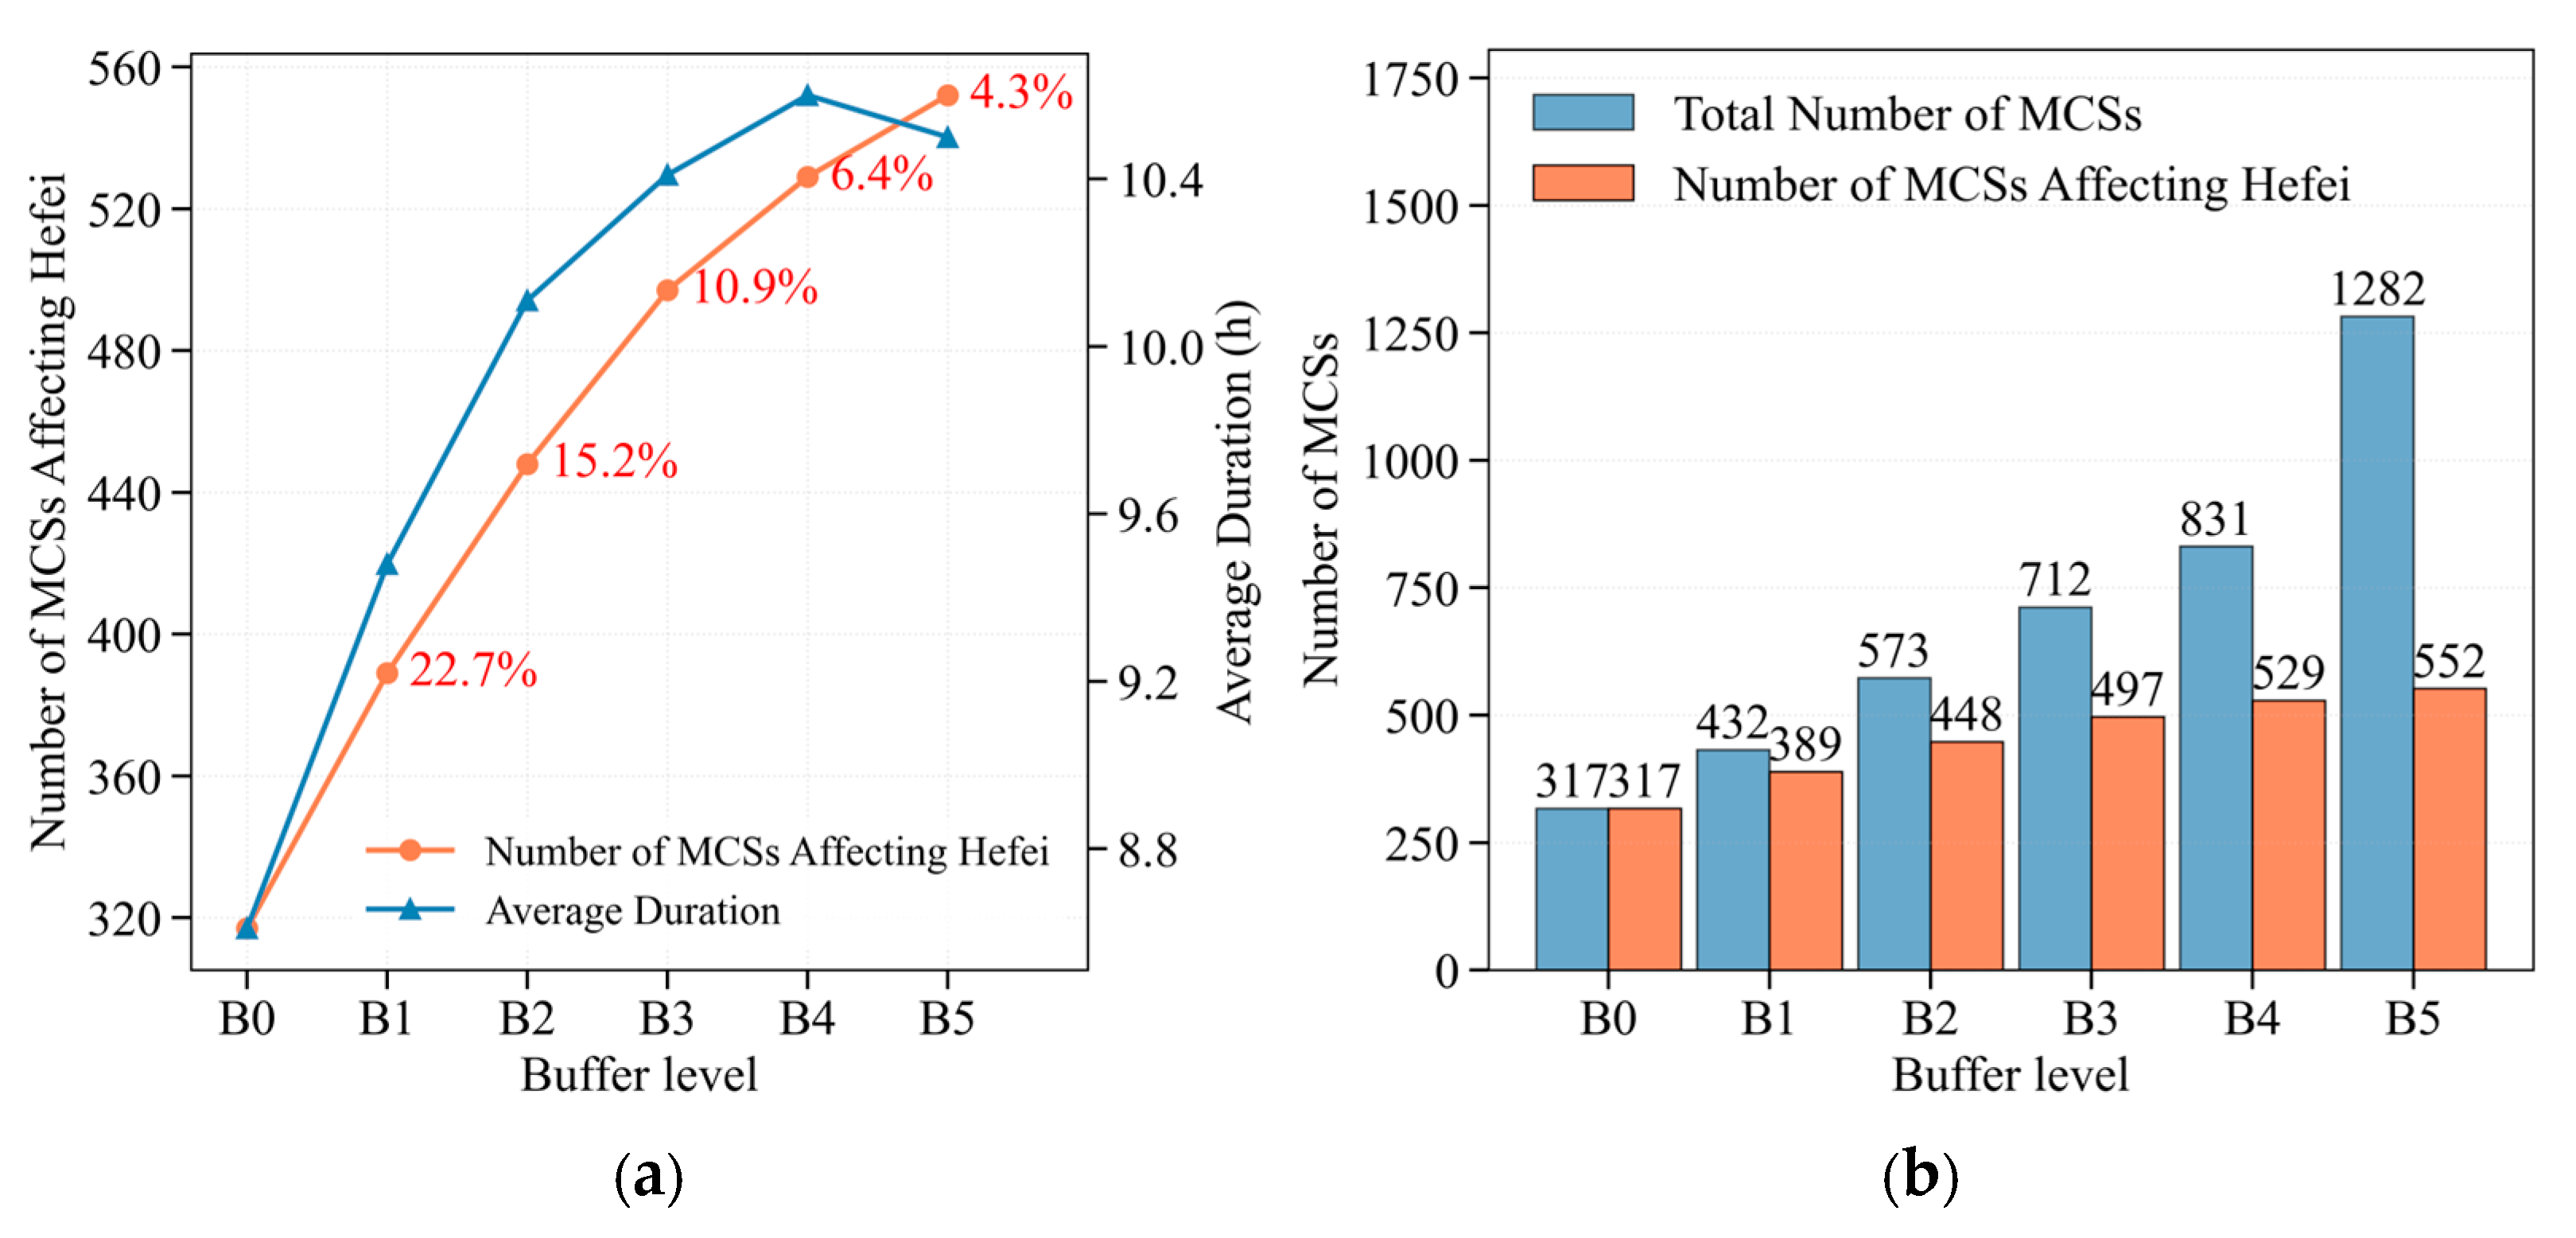
The study area was determined using a saturation criterion while accounting for computational efficiency. Level B4 marks a clear inflection point in the saturation curve for the number of MCSs affecting Hefei (Figure 2a). Expanding to B5 increases the total number of identified MCSs by 61.6%, whereas the number affecting Hefei increases by only 4.3% (Figure 2b). The average duration peaks at B4, providing the most complete characterization of MCS life cycles. This buffer extends 2.0° outward from Hefei’s administrative boundary, corresponding to approximately 220 km. Based on these results, it was selected as the optimal buffer zone.
Figure 2.
Sensitivity experiments for the study area. (a) Changes in the number of MCSs affecting Hefei (orange line) and average duration (blue line) with buffer level; (b) Comparison between the total number of MCSs and the number of MCSs affecting Hefei.
2.1.3. Construction of the Labeled MCS Dataset
As merged precipitation data are not annotated with MCS labels, they cannot be directly used for supervised deep learning training. Therefore, the labeled dataset was constructed using a semi-supervised strategy that combines traditional threshold-based pre-labeling with manual quality inspection. Using the traditional threshold method over the B4 analysis domain, 536 MCS events affecting Hefei were pre-labeled. After manual quality inspection, 529 valid events (98.7%) were confirmed and retained to construct the MCS dataset with complete trajectories. The labels consist of pixel-level masks for each time step of every MCS event; these masks were then subjected to manual quality inspection (Table 2) and served as positive samples for deep learning training. Meanwhile, from all hourly precipitation fields during the summers of 2008–2023, time steps with precipitation but not meeting MCS criteria were selected, and negative samples were randomly sampled at approximately a ratio of 1:1. Finally, the dataset was divided into training, validation, and test sets at a ratio of 7:2:1, ensuring uniform distribution across different years.
Table 2.
MCS dataset quality inspection.
2.2. MCS Identification Methods
2.2.1. Traditional Threshold Method
Area, rainfall rate, and duration thresholds for MCSs were defined based on IMERG precipitation products [11]. This threshold method serves as both the comparative baseline for deep learning methods and the pre-labeling tool for the labeled dataset. In this study, we synthesize classical MCS definitions and the characteristics of merged precipitation products to construct a threshold method based on three criteria: area, duration, and intensity. Specifically:
- The precipitation field is binarized using a 0.1 mm/h threshold to distinguish precipitation areas from rain-free background;
- An 8-connectivity labeling algorithm is applied to identify spatially continuous precipitation regions;
- Systems with area ≥ 3500 km2 (corresponding to an approximately circular shape with a major axis ≥ 100 km) and duration ≥ 4 h are retained;
- The 10 mm/h threshold approximately identifies convective active areas on 0.05° spatial resolution. Within the identified precipitation systems, at least one grid point with precipitation intensity ≥ 10 mm/h is required, ensuring that the system contains convective cores rather than merely stratiform weak precipitation areas [1,2,11,24]. It should be emphasized that this intensity criterion is not a standalone condition for MCS classification, but is applied in combination with the area and duration criteria, which together define the MCS.
2.2.2. Deep Neural Network Model
The Deep Neural Network (DNN) model was one of the early applications of deep learning to MCS identification [8]. Its architecture follows a deep encoder–decoder structure. The model extracts multi-scale features from the input through multiple convolutional and pooling layers, and then restores the feature maps to the original resolution via upsampling layers. The loss function combines Dice Loss and Binary Cross-Entropy (BCE) Loss and outputs pixel-level MCS probability maps. The same loss function and output format are used in Section 2.2.3, Section 2.2.4 and Section 2.2.5.
2.2.3. U-Net Model
U-Net is a classic encoder–decoder architecture originally developed for medical image segmentation, which preserves high-resolution spatial information from the encoder through skip connections. MCSs often appear as connected regions with irregular morphology and large-scale variations, requiring high edge localization accuracy. The skip connections of U-Net directly address this requirement by preserving shallow edge details while extracting deep features.
2.2.4. Attention U-Net Model
Attention U-Net introduces attention gates into the skip connections of standard U-Net, enabling the decoder to adaptively focus on the most task-relevant regions in the encoder features. For MCS identification, the attention mechanism helps the model focus on MCS boundary regions, thereby improving segmentation accuracy. The attention mechanism can be formulated as:
where X represents the encoder features, G represents the decoder features, σ denotes the Sigmoid activation function, and ⨀ denotes element-wise multiplication.
Attention(X,G) = σ(Wx · X + Wg · G + b)⨀X
2.2.5. Swin-Unet Model
Swin-Unet [15] is a Transformer-only segmentation architecture based on the Swin Transformer, modeling global contextual dependencies through shifted window multi-head self-attention. The encoder consists of four layers, performing downsampling layer by layer through Patch Merging, while the decoder performs upsampling through transposed convolution and establishes skip connections with the encoder, outputting MCS probability maps. Unlike the local receptive fields of traditional CNNs, the self-attention mechanism of Transformers can directly capture long-range dependencies between arbitrary positions, offering theoretical advantages for large-scale convective systems such as MCSs. Beyond segmentation tasks, the Swin Transformer architecture has also proven effective in precipitation nowcasting [25], further justifying its adoption for precipitation-field-based MCS identification in our study.
2.3. MCS Tracking Methods
2.3.1. Area Overlap Method
The classical area overlap ratio tracking method primarily identifies MCS associations between consecutive time steps. When the area overlap ratio is ≥0.5, two MCSs at adjacent time steps are considered to belong to the same system. Brief interruptions of 1 h are allowed, with a maximum time interval of 6 h [4].
2.3.2. Hybrid-Criterion Tracking Method
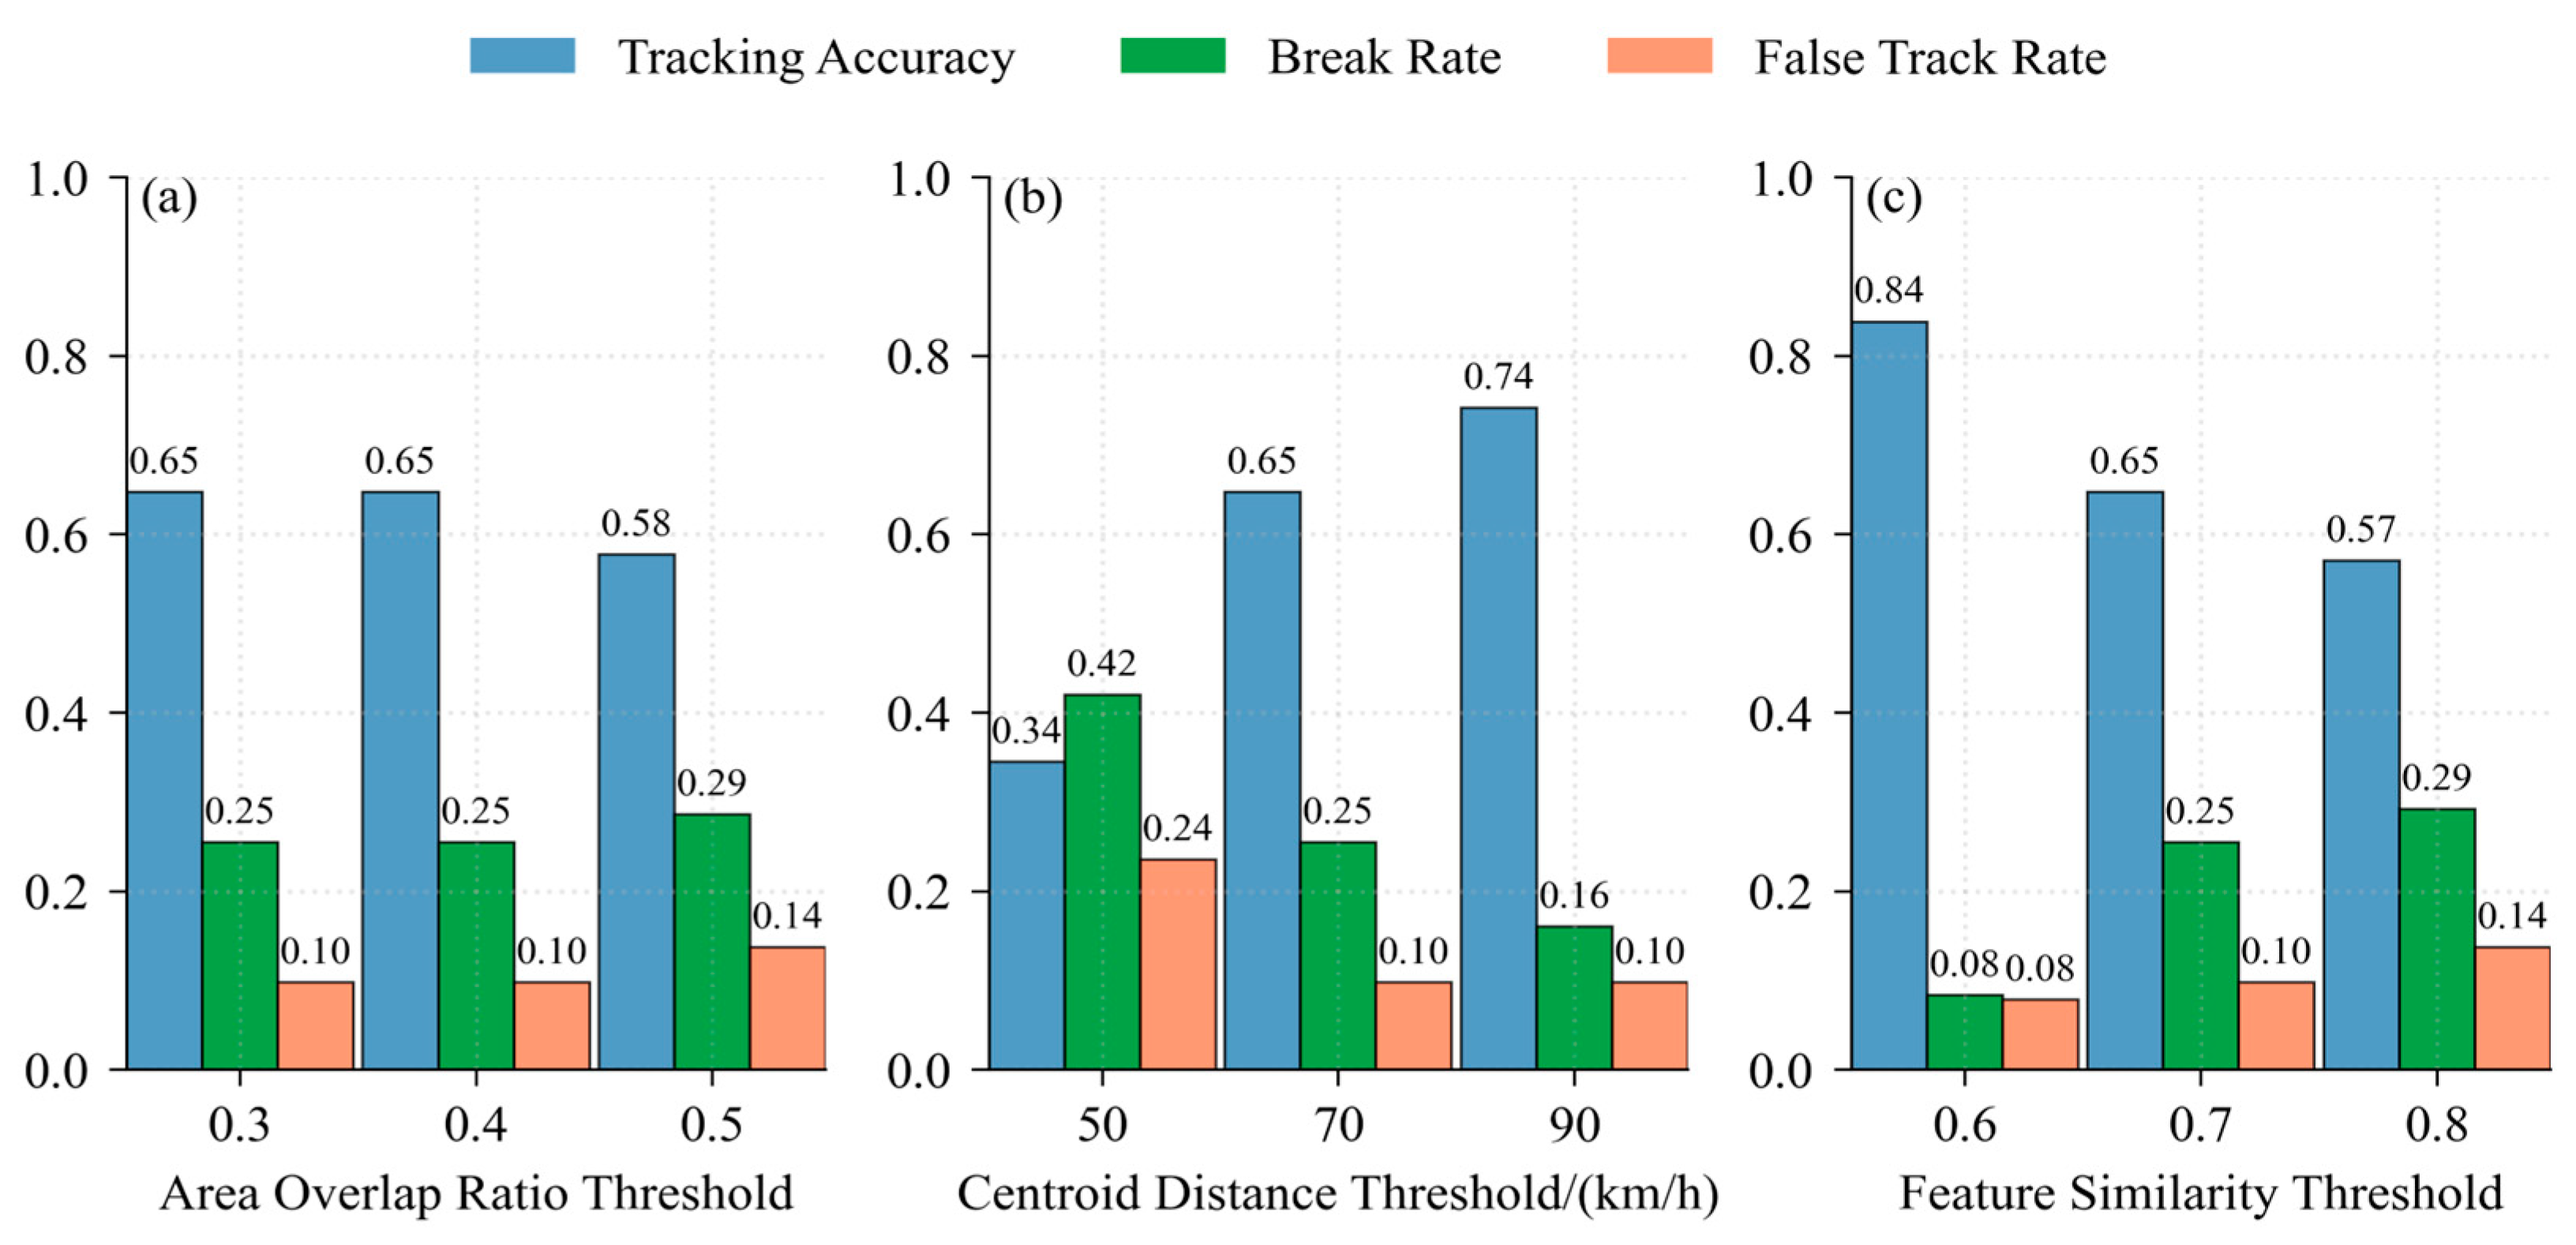
Building upon the traditional area overlap method, this study introduces deep learning feature similarity (cosine similarity of deep feature vectors extracted by the encoder) and centroid distance as two additional criteria, forming a triple-criterion tracking method based on area overlap, centroid distance, and feature similarity. Associations are established if at least two of the three criteria are satisfied. Single-factor perturbation sensitivity experiments were conducted on the thresholds of the three criteria—area overlap ratio, centroid distance, and feature similarity—to evaluate changes in tracking accuracy, break rate, and false track rate.
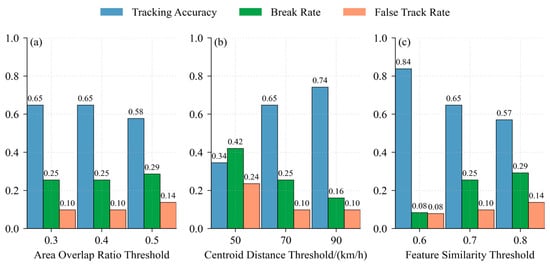
The experimental results of the hybrid-criterion tracking method (Figure 3) indicate that the feature similarity threshold has the greatest impact: when the threshold decreases from 0.7 to 0.6, tracking accuracy improves by approximately 29%, and the break rate decreases by approximately 69%. The centroid distance threshold has the second-largest impact, while the area overlap ratio has the smallest impact. The optimal parameter combination is an area overlap ratio of 0.4, a centroid distance of 90 km, and a feature similarity of 0.6.
Figure 3.
Parameter sensitivity experiments for the hybrid-criterion tracking method: (a) Area overlap ratio threshold; (b) Centroid distance threshold; (c) Feature similarity threshold.
2.4. Experimental Design and Evaluation Metrics
2.4.1. Experimental Design
Seven comparative experiments were designed (Table 3), establishing an identification and tracking evaluation metric system (Table 4) to compare performance among four deep learning models. The contributions of U-Net, Attention U-Net, and Swin-Unet to MCS segmentation accuracy are evaluated. For tracking method comparison, both the area overlap method and the hybrid-criterion method are applied for tracking evaluation, comparing the performance of the two approaches. The hybrid-criterion method was applied to U-Net, Attention U-Net, and Swin-Unet, but not to DNN. This is because the method relies on deep feature similarity extracted by the encoder, and the simple encoder architecture of DNN produces feature vectors with lower discriminability, which weakens the effectiveness of the feature similarity criterion. In addition, since DNN achieves the lowest identification accuracy (IoU = 0.82), we prioritized applying the hybrid-criterion method to the higher-performing models to evaluate its tracking performance under the best identification results.
Table 3.
Design of comparative experiments for MCS identification and tracking.
Table 4.
MCS identification and tracking evaluation metrics.
2.4.2. Evaluation Metrics
Identification performance is evaluated at both pixel and object levels. At the pixel level, four metrics are used: IoU defined as the ratio of the intersection area to the union area between the predicted mask and the ground truth mask; the Dice coefficient, an equivalent form of IoU that is more robust for small objects; Precision, the proportion of correctly predicted positive pixels among all predicted positive pixels; and Recall, the proportion of correctly predicted positive pixels among all ground truth positive pixels. At the object level, the predicted and ground truth masks are each labeled as independent objects using the area overlap threshold method. The 0.5 threshold is a widely used criterion in object-based tracking studies and was originally proposed for radar-based MCS tracking [5]. The area overlap ratio is defined as the ratio of the intersection area to the union area of two objects; when this ratio is ≥0.5, the two objects are considered to belong to the same system. Three metrics are then defined: CSI, POD, and False Alarm Ratio (FAR).
Tracking performance is evaluated using three trajectory-level metrics. Tracking accuracy is defined as the proportion of correctly associated time steps, excluding break and false track components. The break rate quantifies the extent to which ground truth trajectories are erroneously interrupted. The false track rate quantifies the deviation of the number of predicted trajectories from the number of ground truth trajectories. In addition, the frequency distribution of trajectory durations is analyzed across four categories (4–6, 7–12, 13–24, and ≥25 h) to evaluate how completely the tracking methods characterize the MCS life cycle. The significance of these metrics depends on the specific task and application. Compared with relevant MCS identification studies [9,26], the CSI and FAR values achieved in this study are sufficient to meet the requirements of operational MCS monitoring and early warning.
3. Results
3.1. MCS Identification Accuracy Comparison
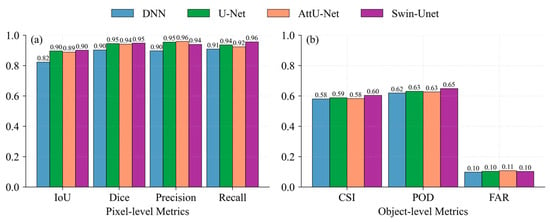
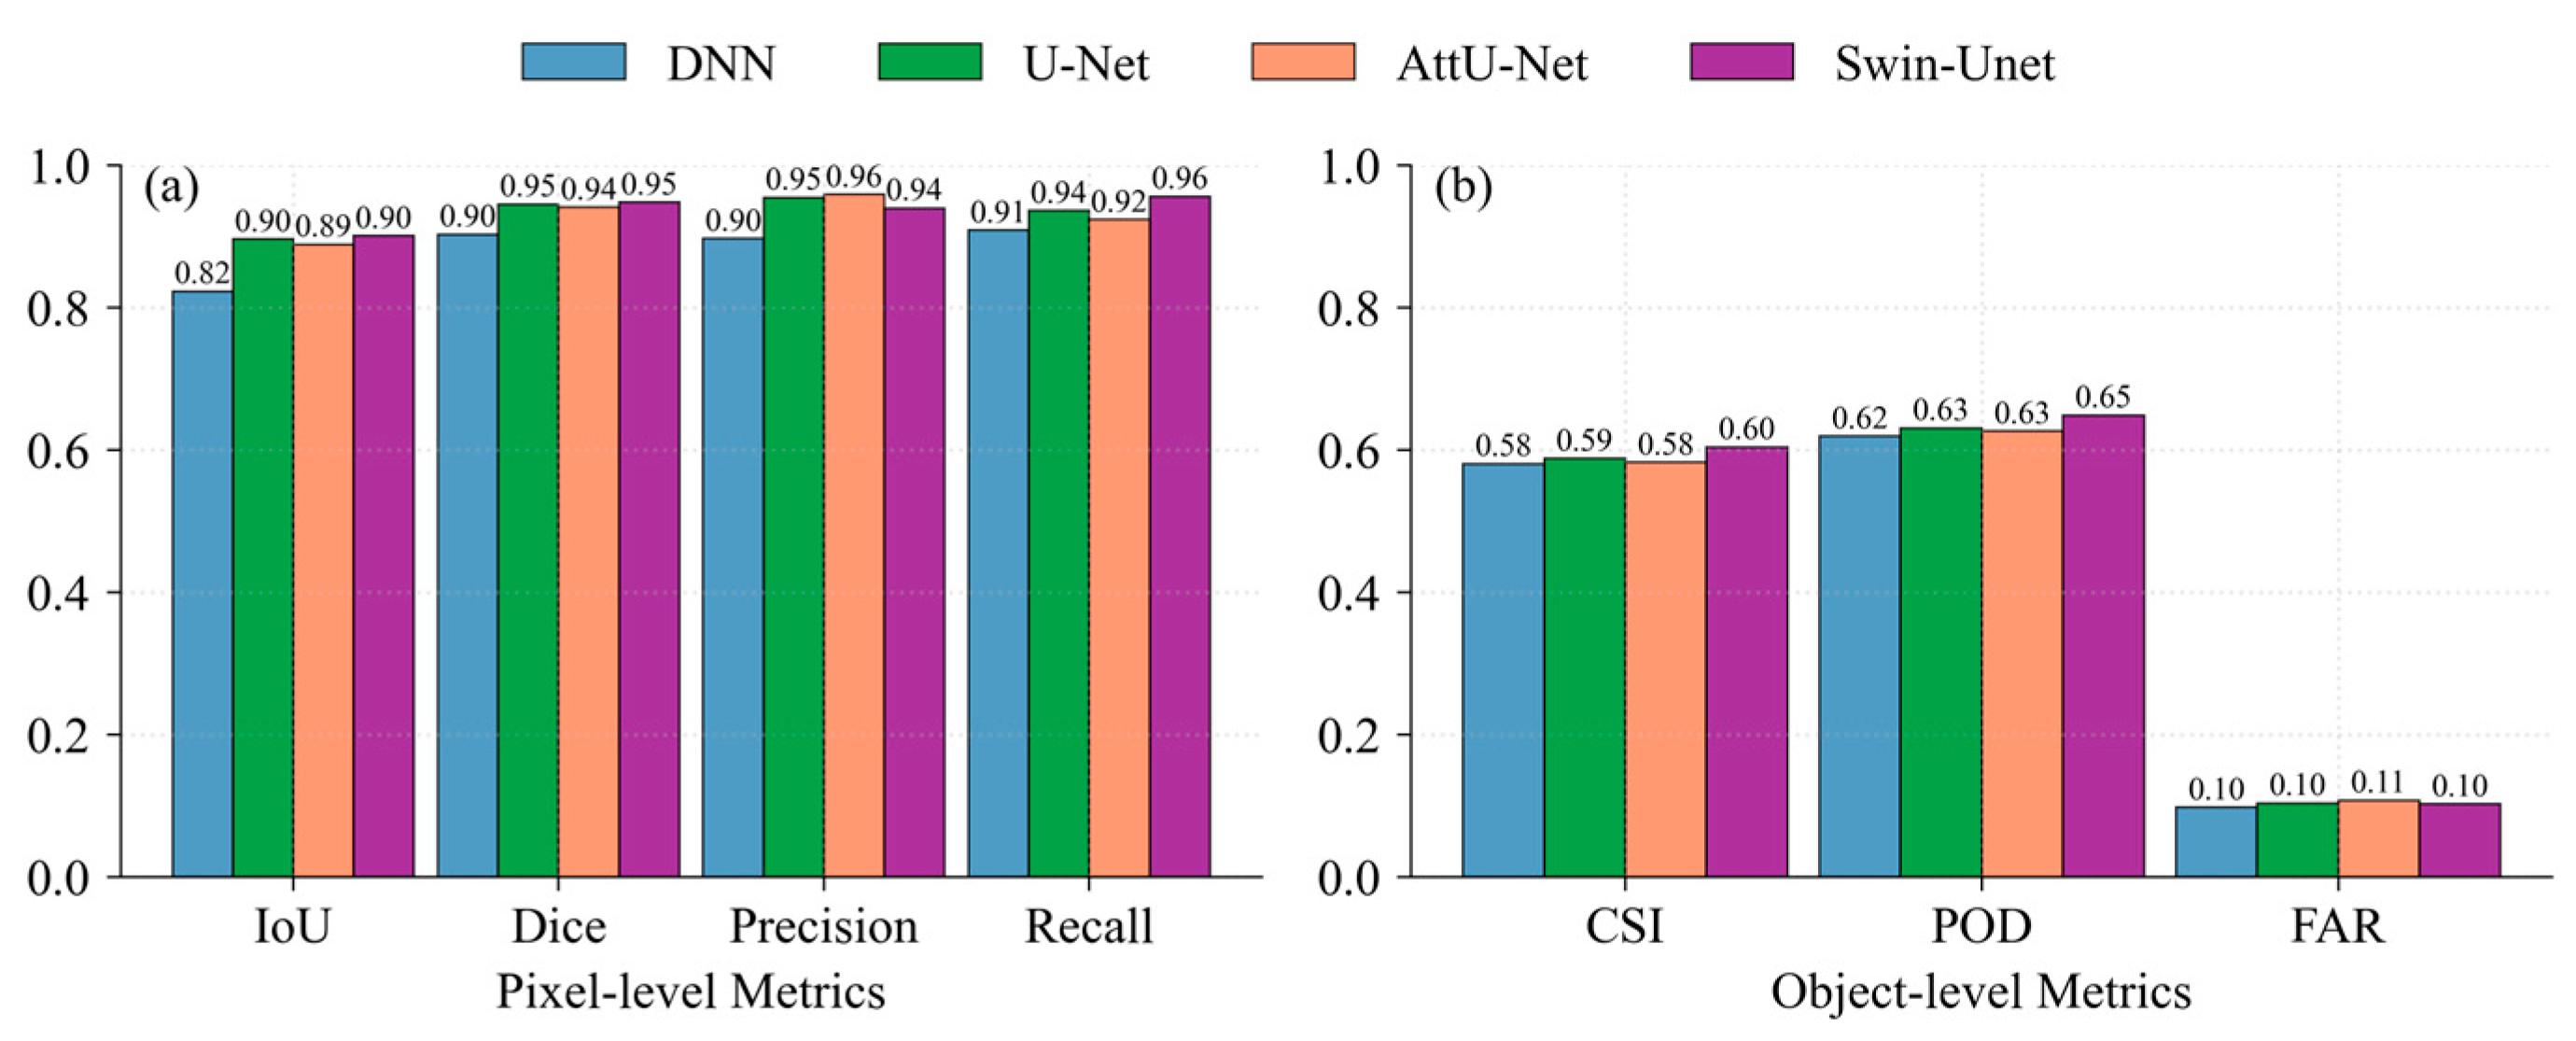
The pixel-level and object-level identification metrics of the four deep learning models on the test set (Figure 4) show a clear gradient among DNN, U-Net, Attention U-Net, and Swin-Unet. DNN achieves the lowest pixel-level IoU of 0.82. U-Net’s skip connections effectively preserve MCS boundary details, improving IoU by 9.8% and Dice by approximately 5.6%. Attention U-Net builds upon U-Net by introducing attention gates, effectively reducing false alarms in transition regions, with precision further improving to 0.96, the highest among the four models. Swin-Unet achieves IoU (0.90) and Dice (0.95), matching U-Net for the highest values, while its recall (0.96) exceeds the other three models. The shifted window self-attention mechanism of the Transformer more completely captures the spatial extent of MCSs, reducing missed detections.
Figure 4.
Comparison of identification accuracy among four models: (a) Pixel-level metrics (IoU, Dice, Precision, Recall); (b) Object-level metrics (CSI, POD, FAR).
Regarding object-level metrics, the differences in CSI, POD, and FAR among the four models are smaller than at the pixel level, but the trends remain consistent. U-Net’s CSI (0.59) and POD (0.63) are slightly higher than DNN. Attention U-Net’s CSI (0.58) is comparable to DNN, its POD (0.63) is on par with U-Net, and its FAR (0.11) is slightly higher than the other three models (all at 0.10). Swin-Unet’s CSI (0.60) and POD (0.65) are both the highest among the four models, and its FAR (0.10) is consistent with DNN and U-Net. Transformer’s global receptive field helps identify morphologically complete and larger-scale MCS objects, offering advantages in MCS object detection. To assess whether these differences are statistically significant, paired t-tests were conducted on the IoU and Dice values of the test set. The results show that Swin-Unet significantly outperforms DNN, U-Net, and Attention U-Net for both metrics (p < 0.05), confirming that the observed advantage of Swin-Unet is not due to chance.
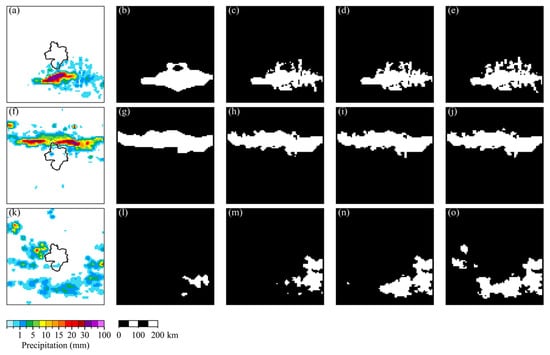
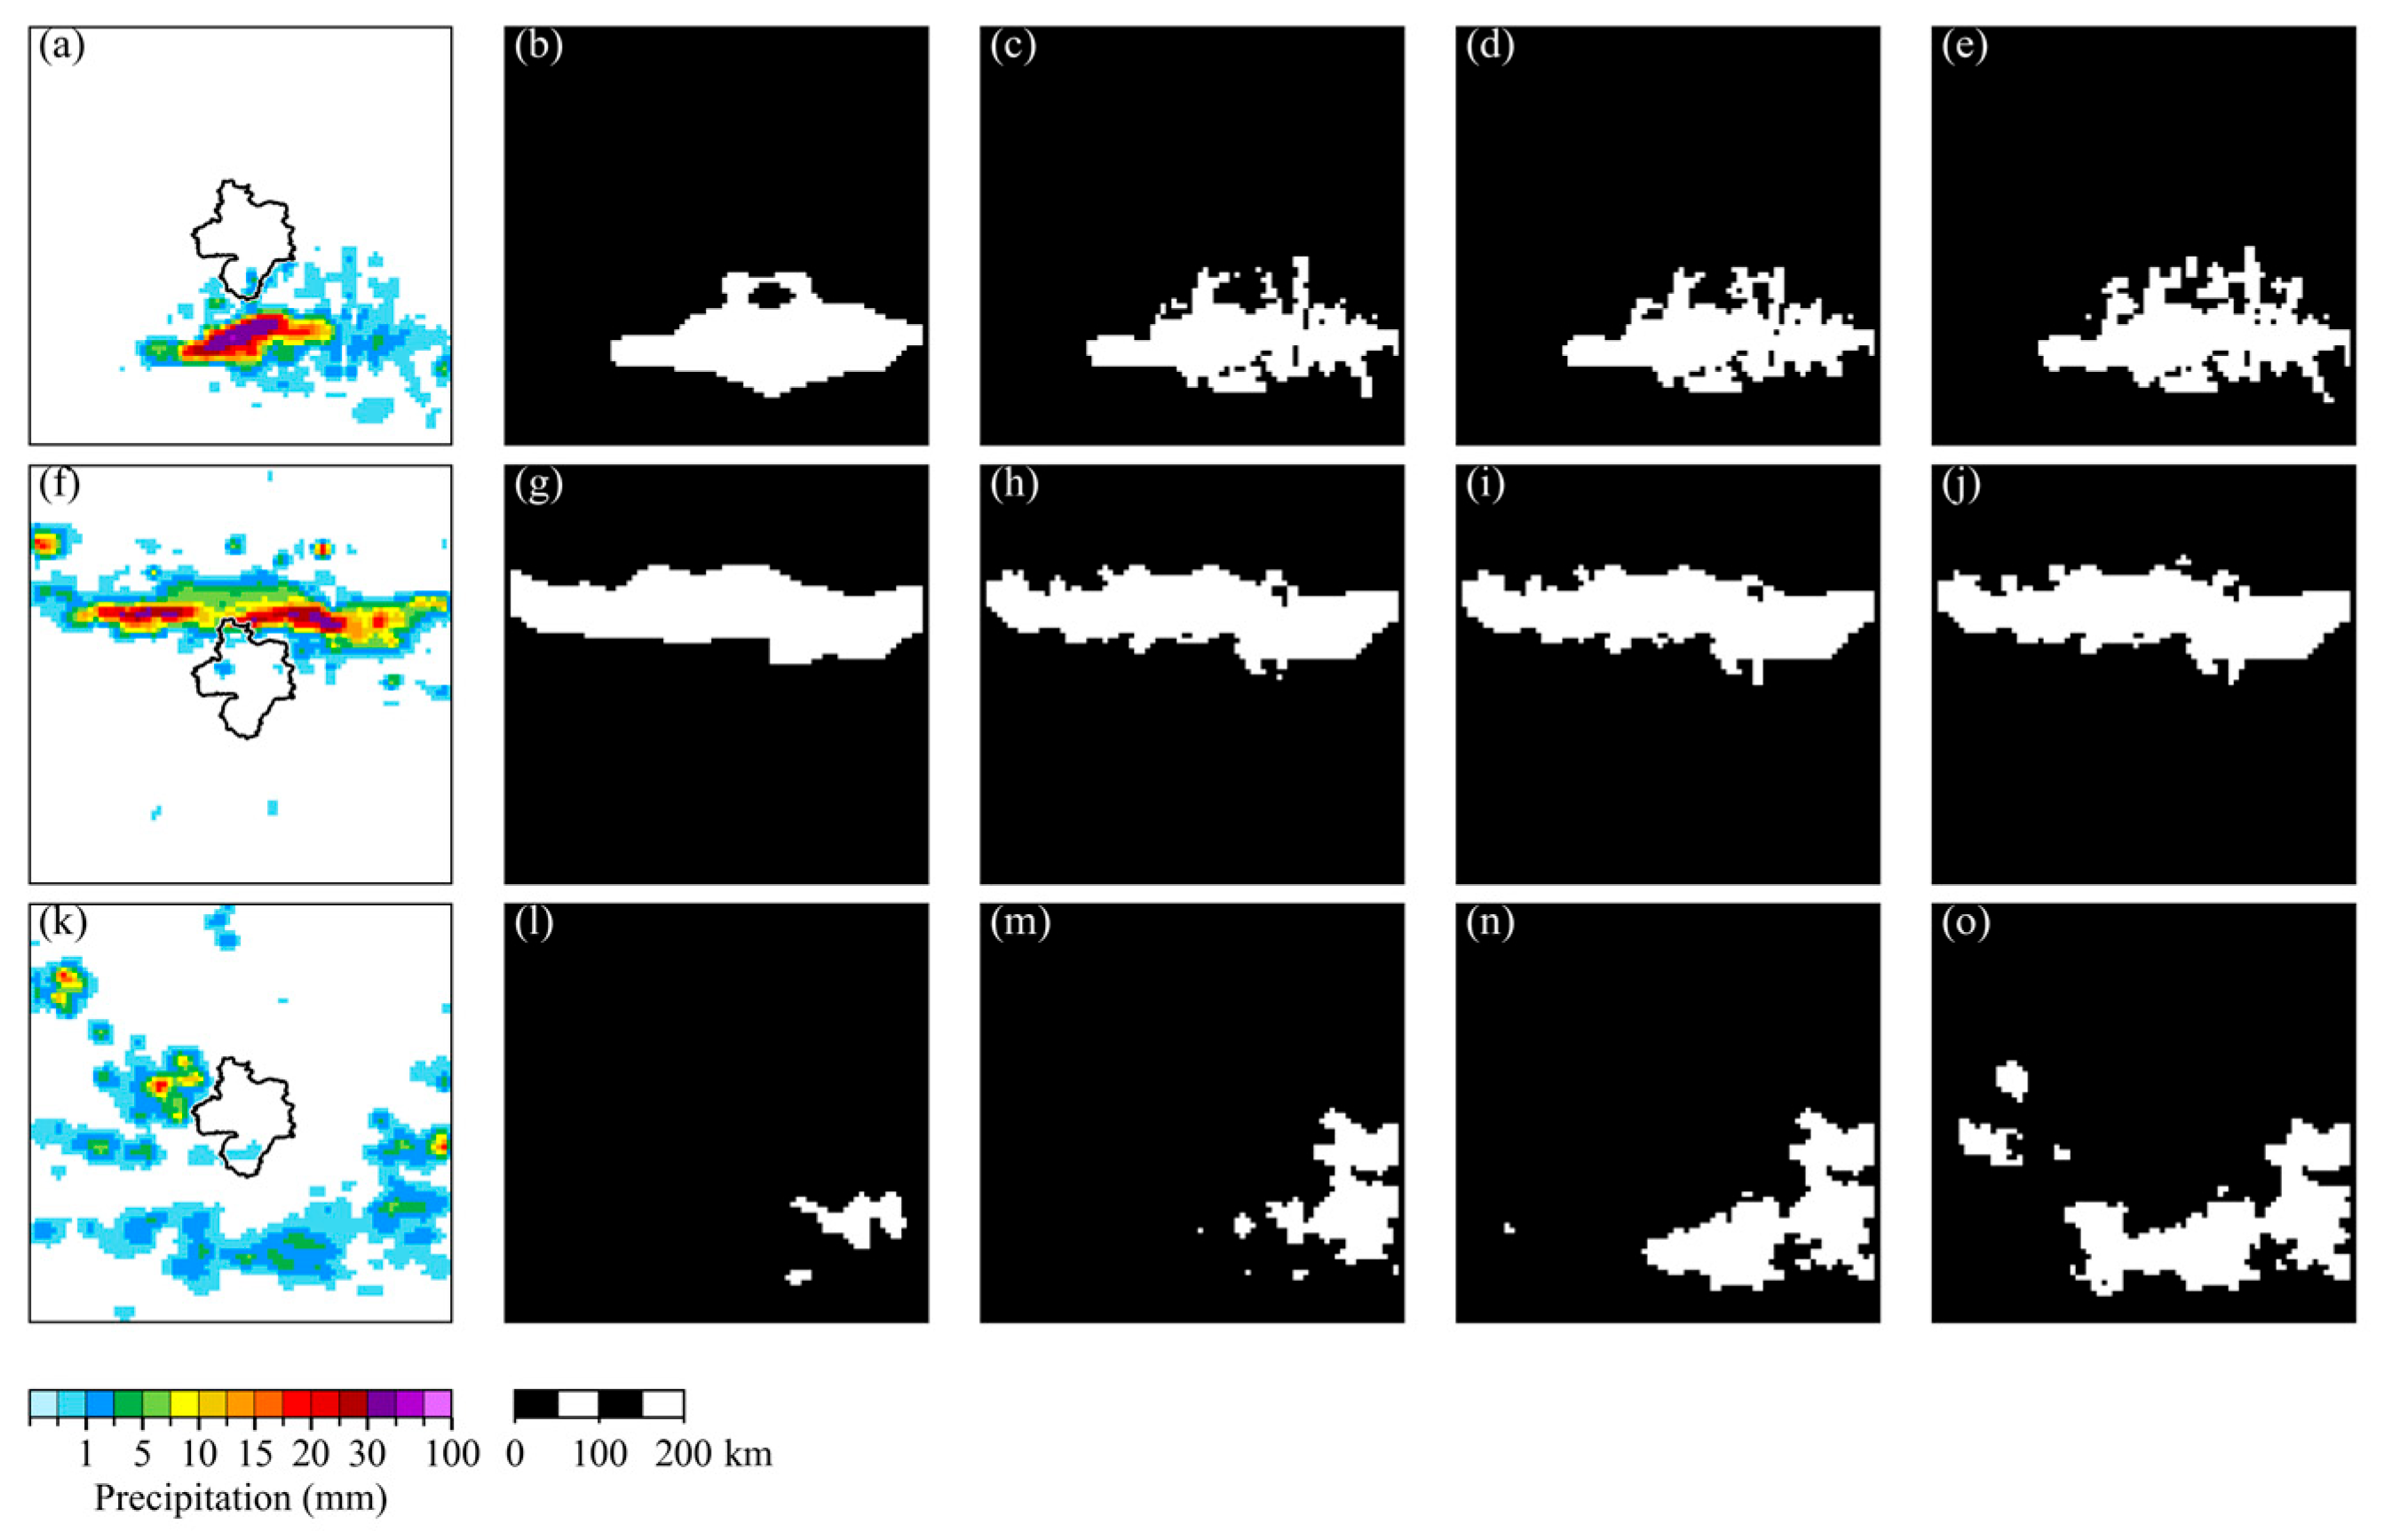
Three typical MCS cases were selected (Figure 5) to more intuitively compare the strengths and weaknesses of the four models alongside ground truth (GT) masks. The first row presents an isolated intense convective cell, where DNN results are overly smoothed and Swin-Unet provides the best boundary delineation. The second row shows a banded MCS, where all four models can identify the main body, but DNN incompletely identifies the tail. The third row displays discrete convective clusters (the most challenging scenario), where DNN and U-Net exhibit significant under-segmentation, while Swin-Unet performs optimally. Its global self-attention mechanism can model spatial associations among scattered convective cells, effectively reducing missed identifications, although some small cells are still omitted.
Figure 5.
Typical cases of MCS identification. The first row (a–e) shows an isolated intense convective cell; the second row (f–j) shows a banded MCS; the third row (k–o) shows a discrete convective cluster.
3.2. MCS Tracking Continuity Evaluation
3.2.1. Impact of Different Identification Models on Tracking
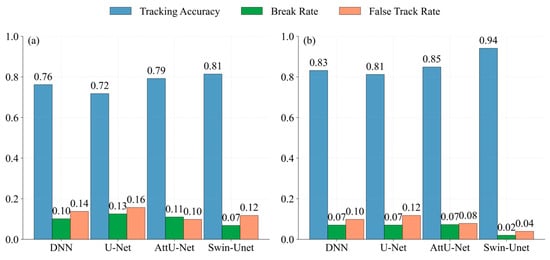
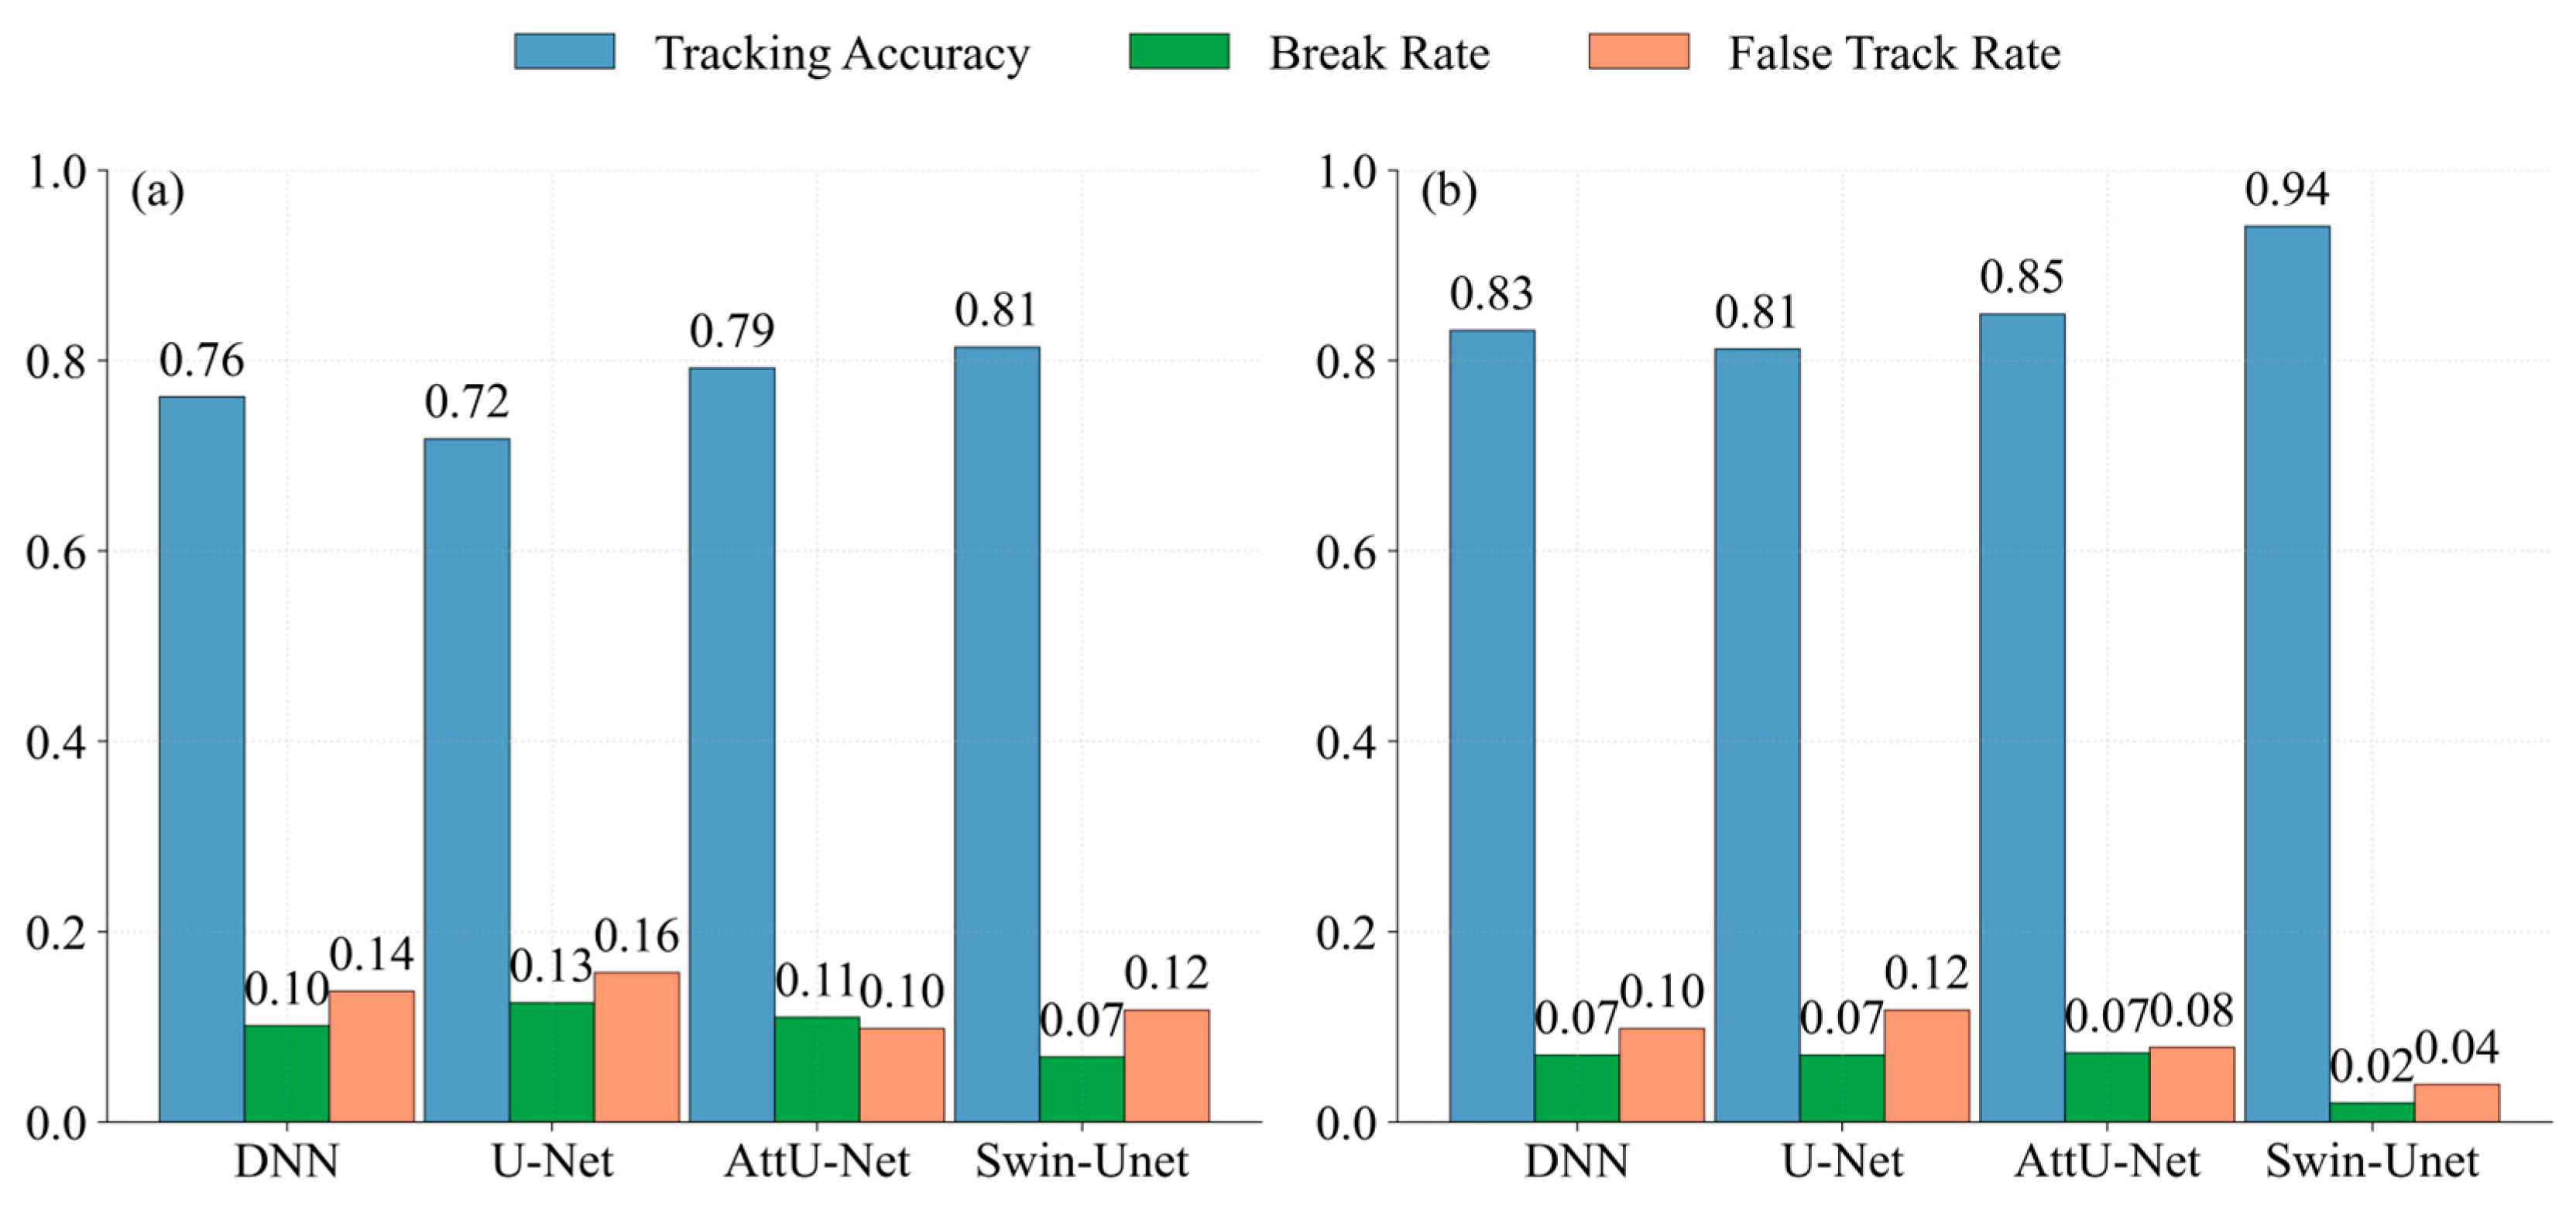
The tracking evaluation results of the four identification models using the area overlap method (Figure 6a) show that tracking accuracy and identification IoU do not follow a simple linear relationship. DNN has the lowest identification IoU (0.82), but its tracking accuracy (0.76) is actually higher than that of U-Net (0.72). Attention U-Net performs well in tracking accuracy (0.79) and false track rate (0.10), as accurate MCS boundaries reduce cross-system incorrect associations; this reflects the advantage of its high precision and low FAR in tracking. Swin-Unet achieves the highest tracking accuracy (0.81) and the lowest break rate (0.07), demonstrating the excellent performance of the Transformer in both identification and tracking accuracy.
Figure 6.
Comparison of tracking evaluation among the four identification models: (a) Area overlap method; (b) Hybrid-criterion tracking method.
Compared with the area overlap method, all four models achieve higher tracking accuracy under the hybrid-criterion tracking method (Figure 6b). Centroid distance constraints and feature similarity criteria effectively maintain tracking continuity, with generally lower break rates and false track rates, and consistent stability across different identification models. Among these combinations, Swin-Unet coupled with the hybrid-criterion tracking method achieves the highest tracking accuracy (0.94), the lowest break rate (0.02), and the lowest false track rate (0.04), outperforming all other model combinations.
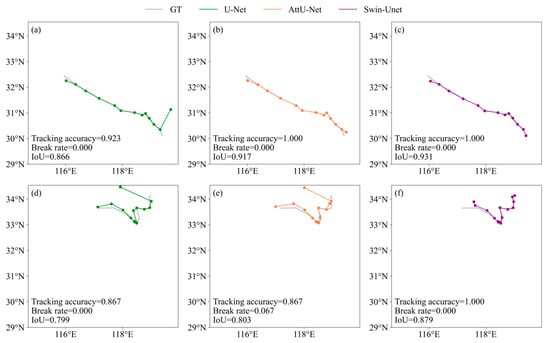
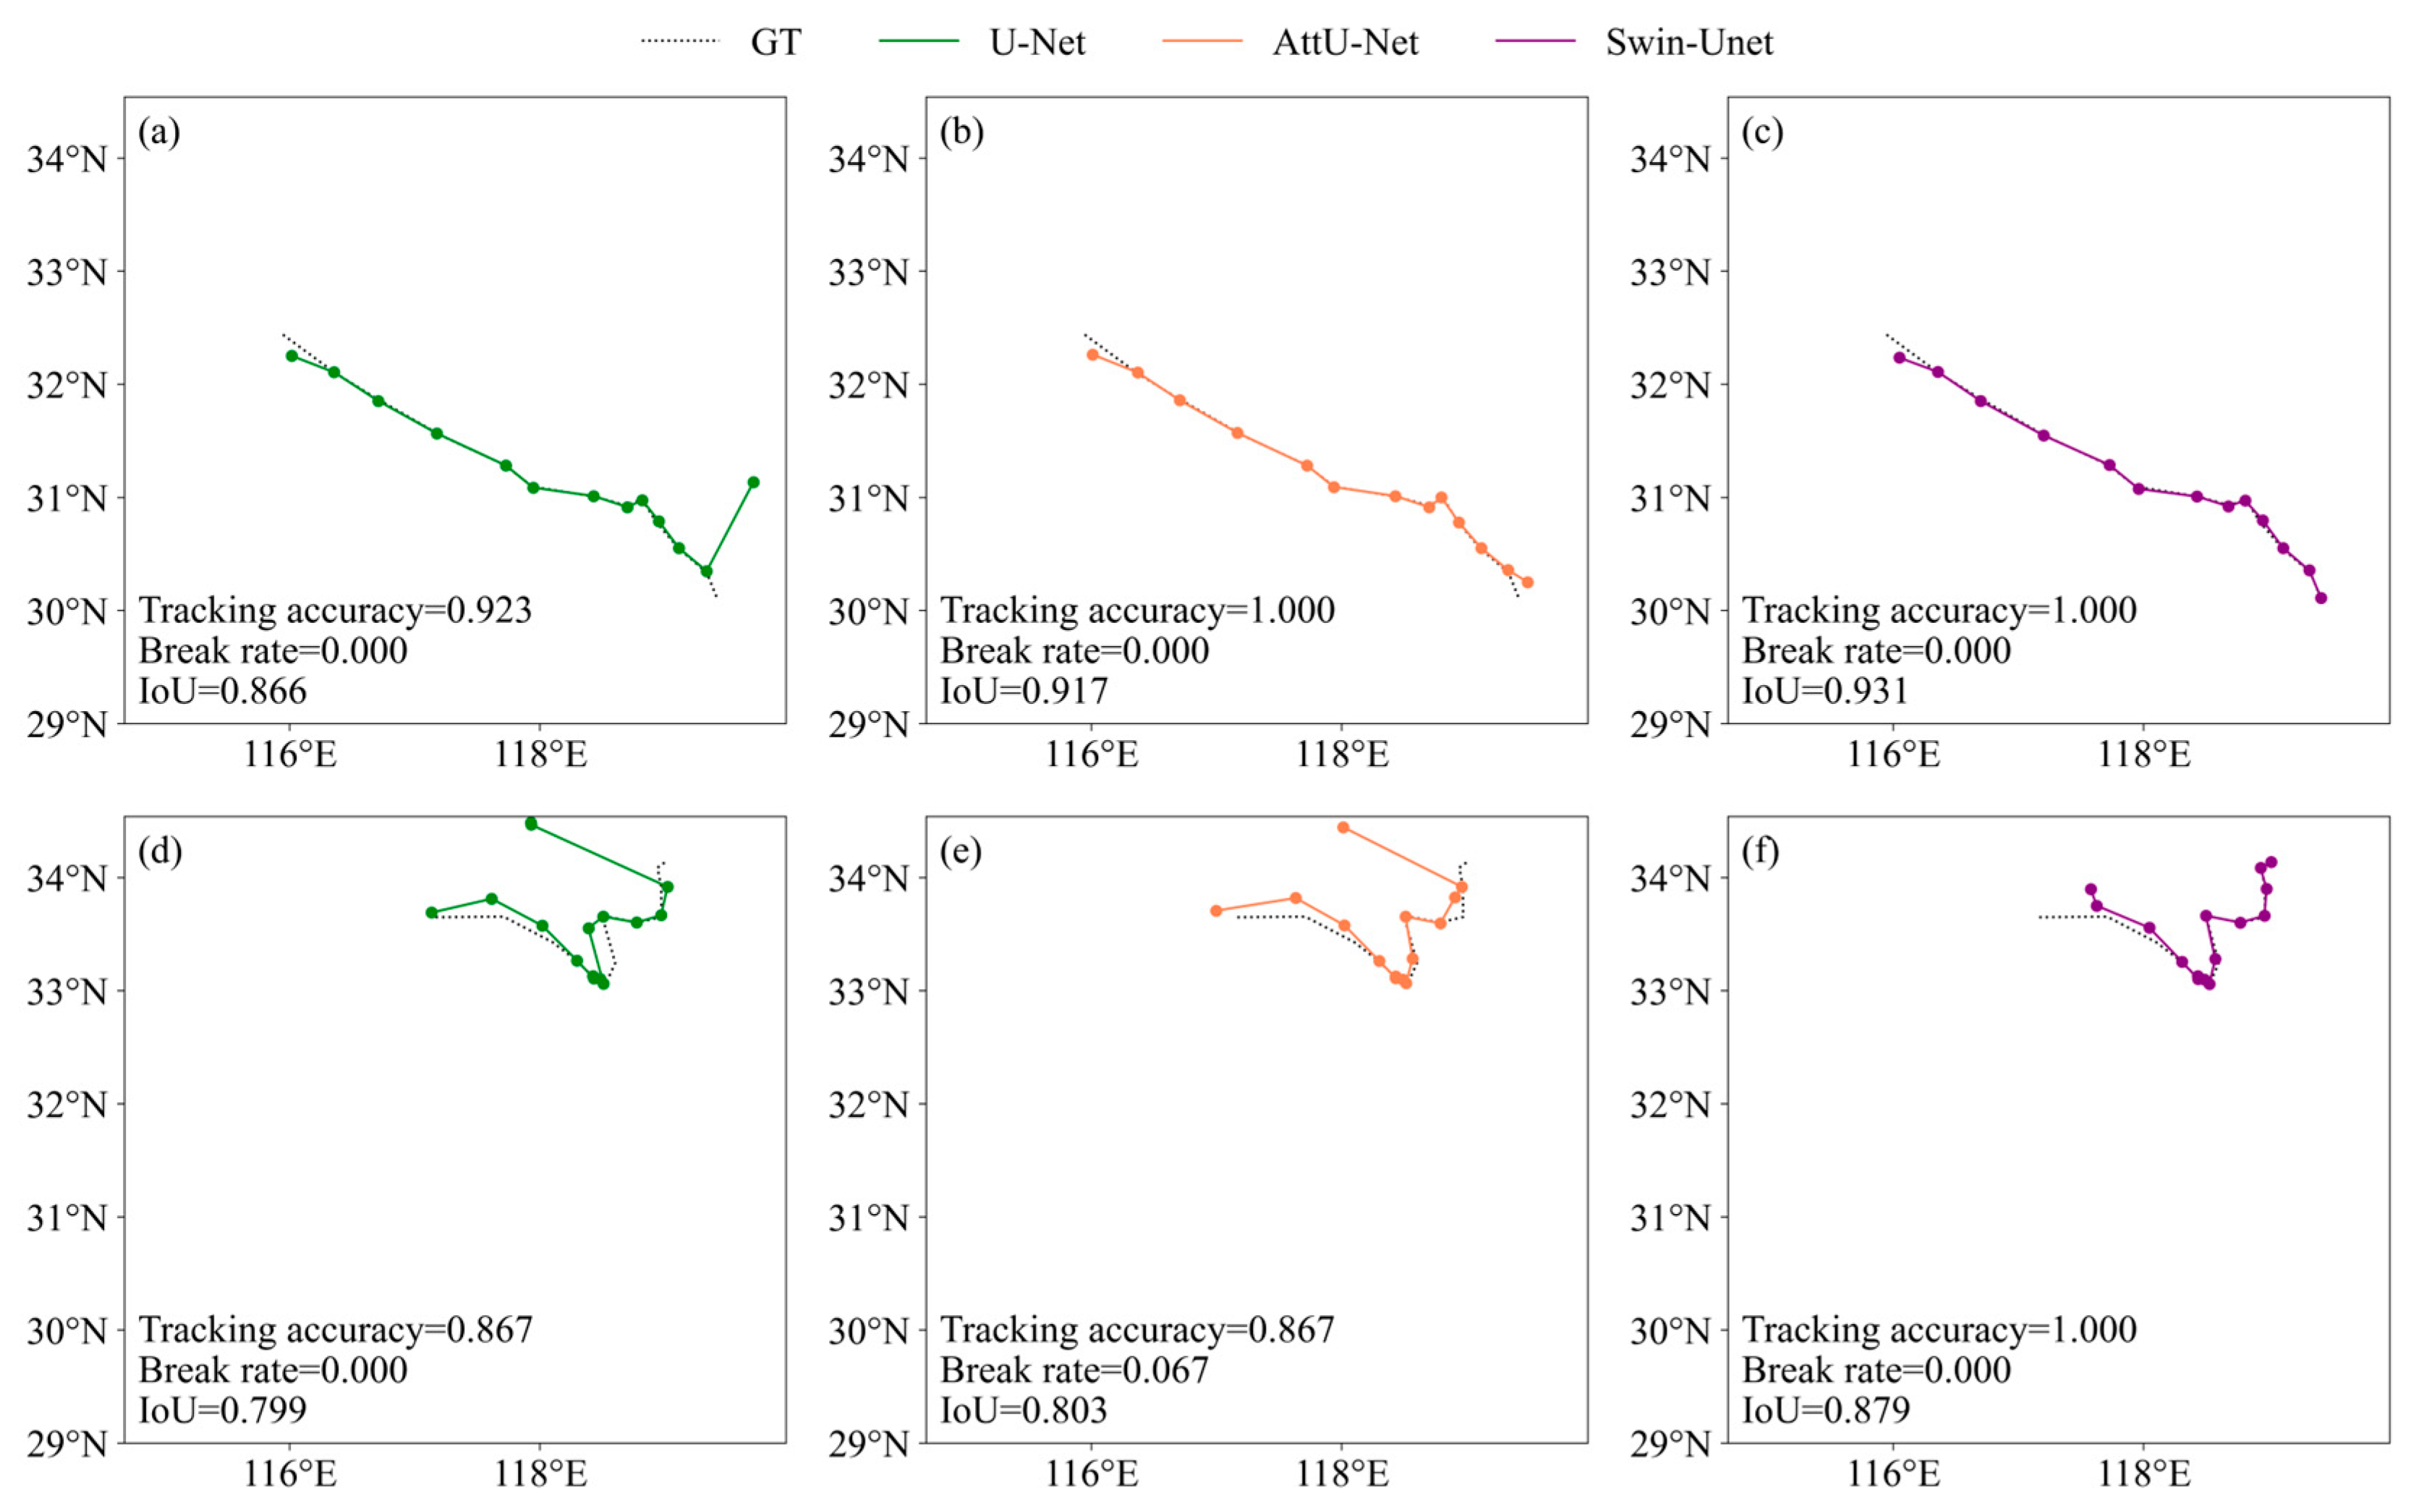
Two typical MCS tracking cases were selected (Figure 7). The first row shows a banded MCS tracking case, where the U-Net model exhibits a centroid mismatch at one time step, with a tracking accuracy of 0.923. The Attention U-Net and Swin-Unet models re-associate the preceding and subsequent frames through the hybrid-criterion tracking method, maintaining accurate tracking. The second row shows a cellular MCS case, where both U-Net and Attention U-Net achieve lower tracking accuracy than Swin-Unet. The Attention U-Net model exhibits breaks during tracking, while the Swin-Unet model maintains 100% tracking accuracy with zero break. This may be attributed to the global self-attention mechanism, which can model spatial associations among scattered convective cells, effectively reducing missed detections (IoU = 0.879).
Figure 7.
Typical cases of MCS tracking: (a–c) banded MCS; (d–f) cellular MCS.
3.2.2. Trajectory Duration Distribution
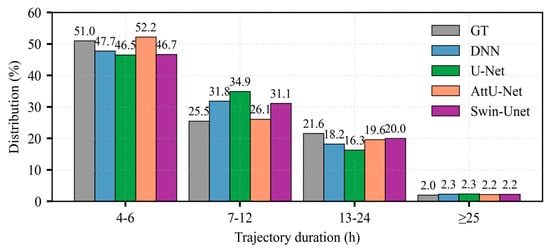
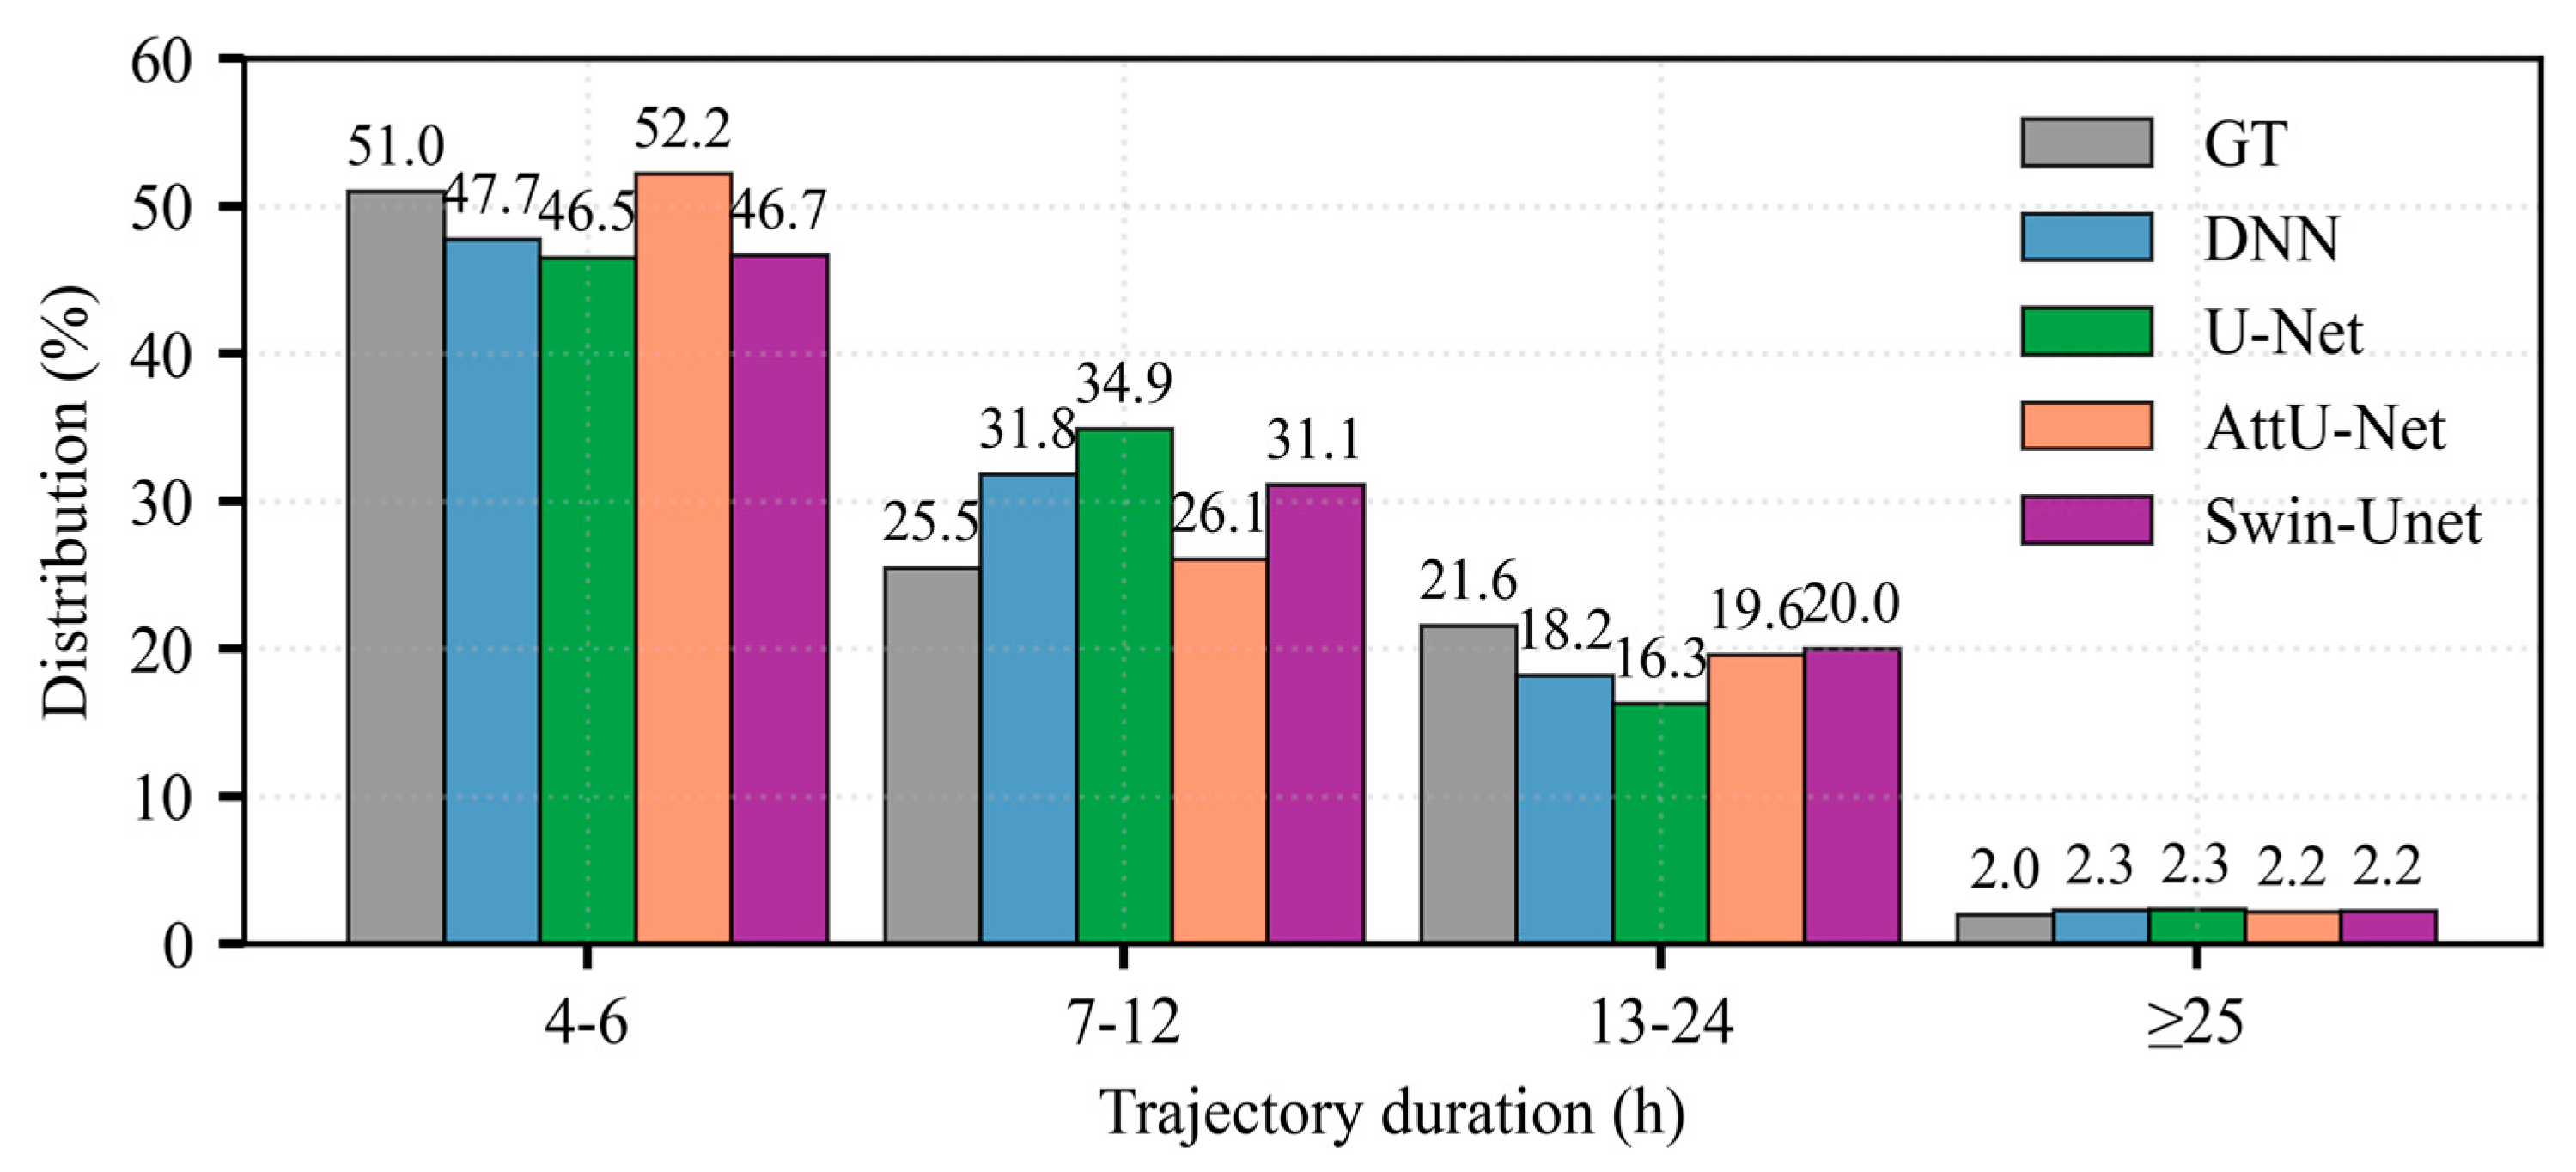
Comparing the predicted trajectory duration distributions of the four identification models under the area overlap method (Figure 8), all four models are consistent with the overall GT trend, exhibiting right-skewed distributions with peaks concentrated in the short lifetime interval of 4–6 h. DNN overestimates the 7–12 h fraction relative to GT, likely owing to a small number of over-continuous tracks produced by its blurred boundaries. This 7–12 h fraction is even higher for U-Net: its elevated break rate splits longer (>12 h) trajectories into multiple 7–12 h fragments, which counterintuitively raises, rather than lowers, the proportion of 7–12 h trajectories. The distributions predicted by Attention U-Net and Swin-Unet are more consistent with GT.
Figure 8.
Comparison of trajectory duration distributions of the four identification models under the area overlap method with ground truth (GT).
3.2.3. Spatial Distribution of MCS Tracks
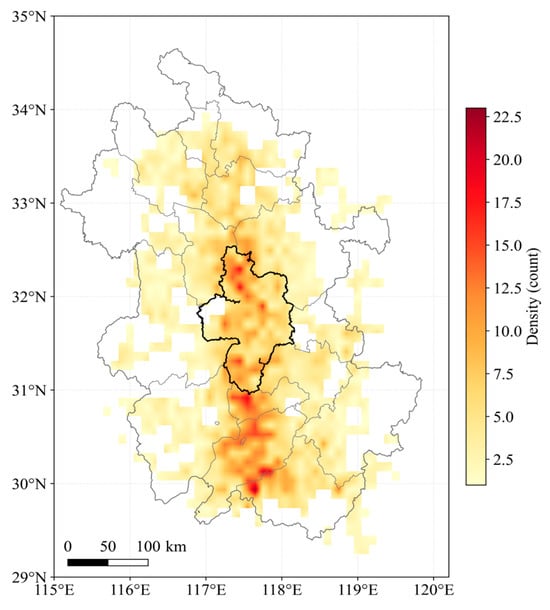
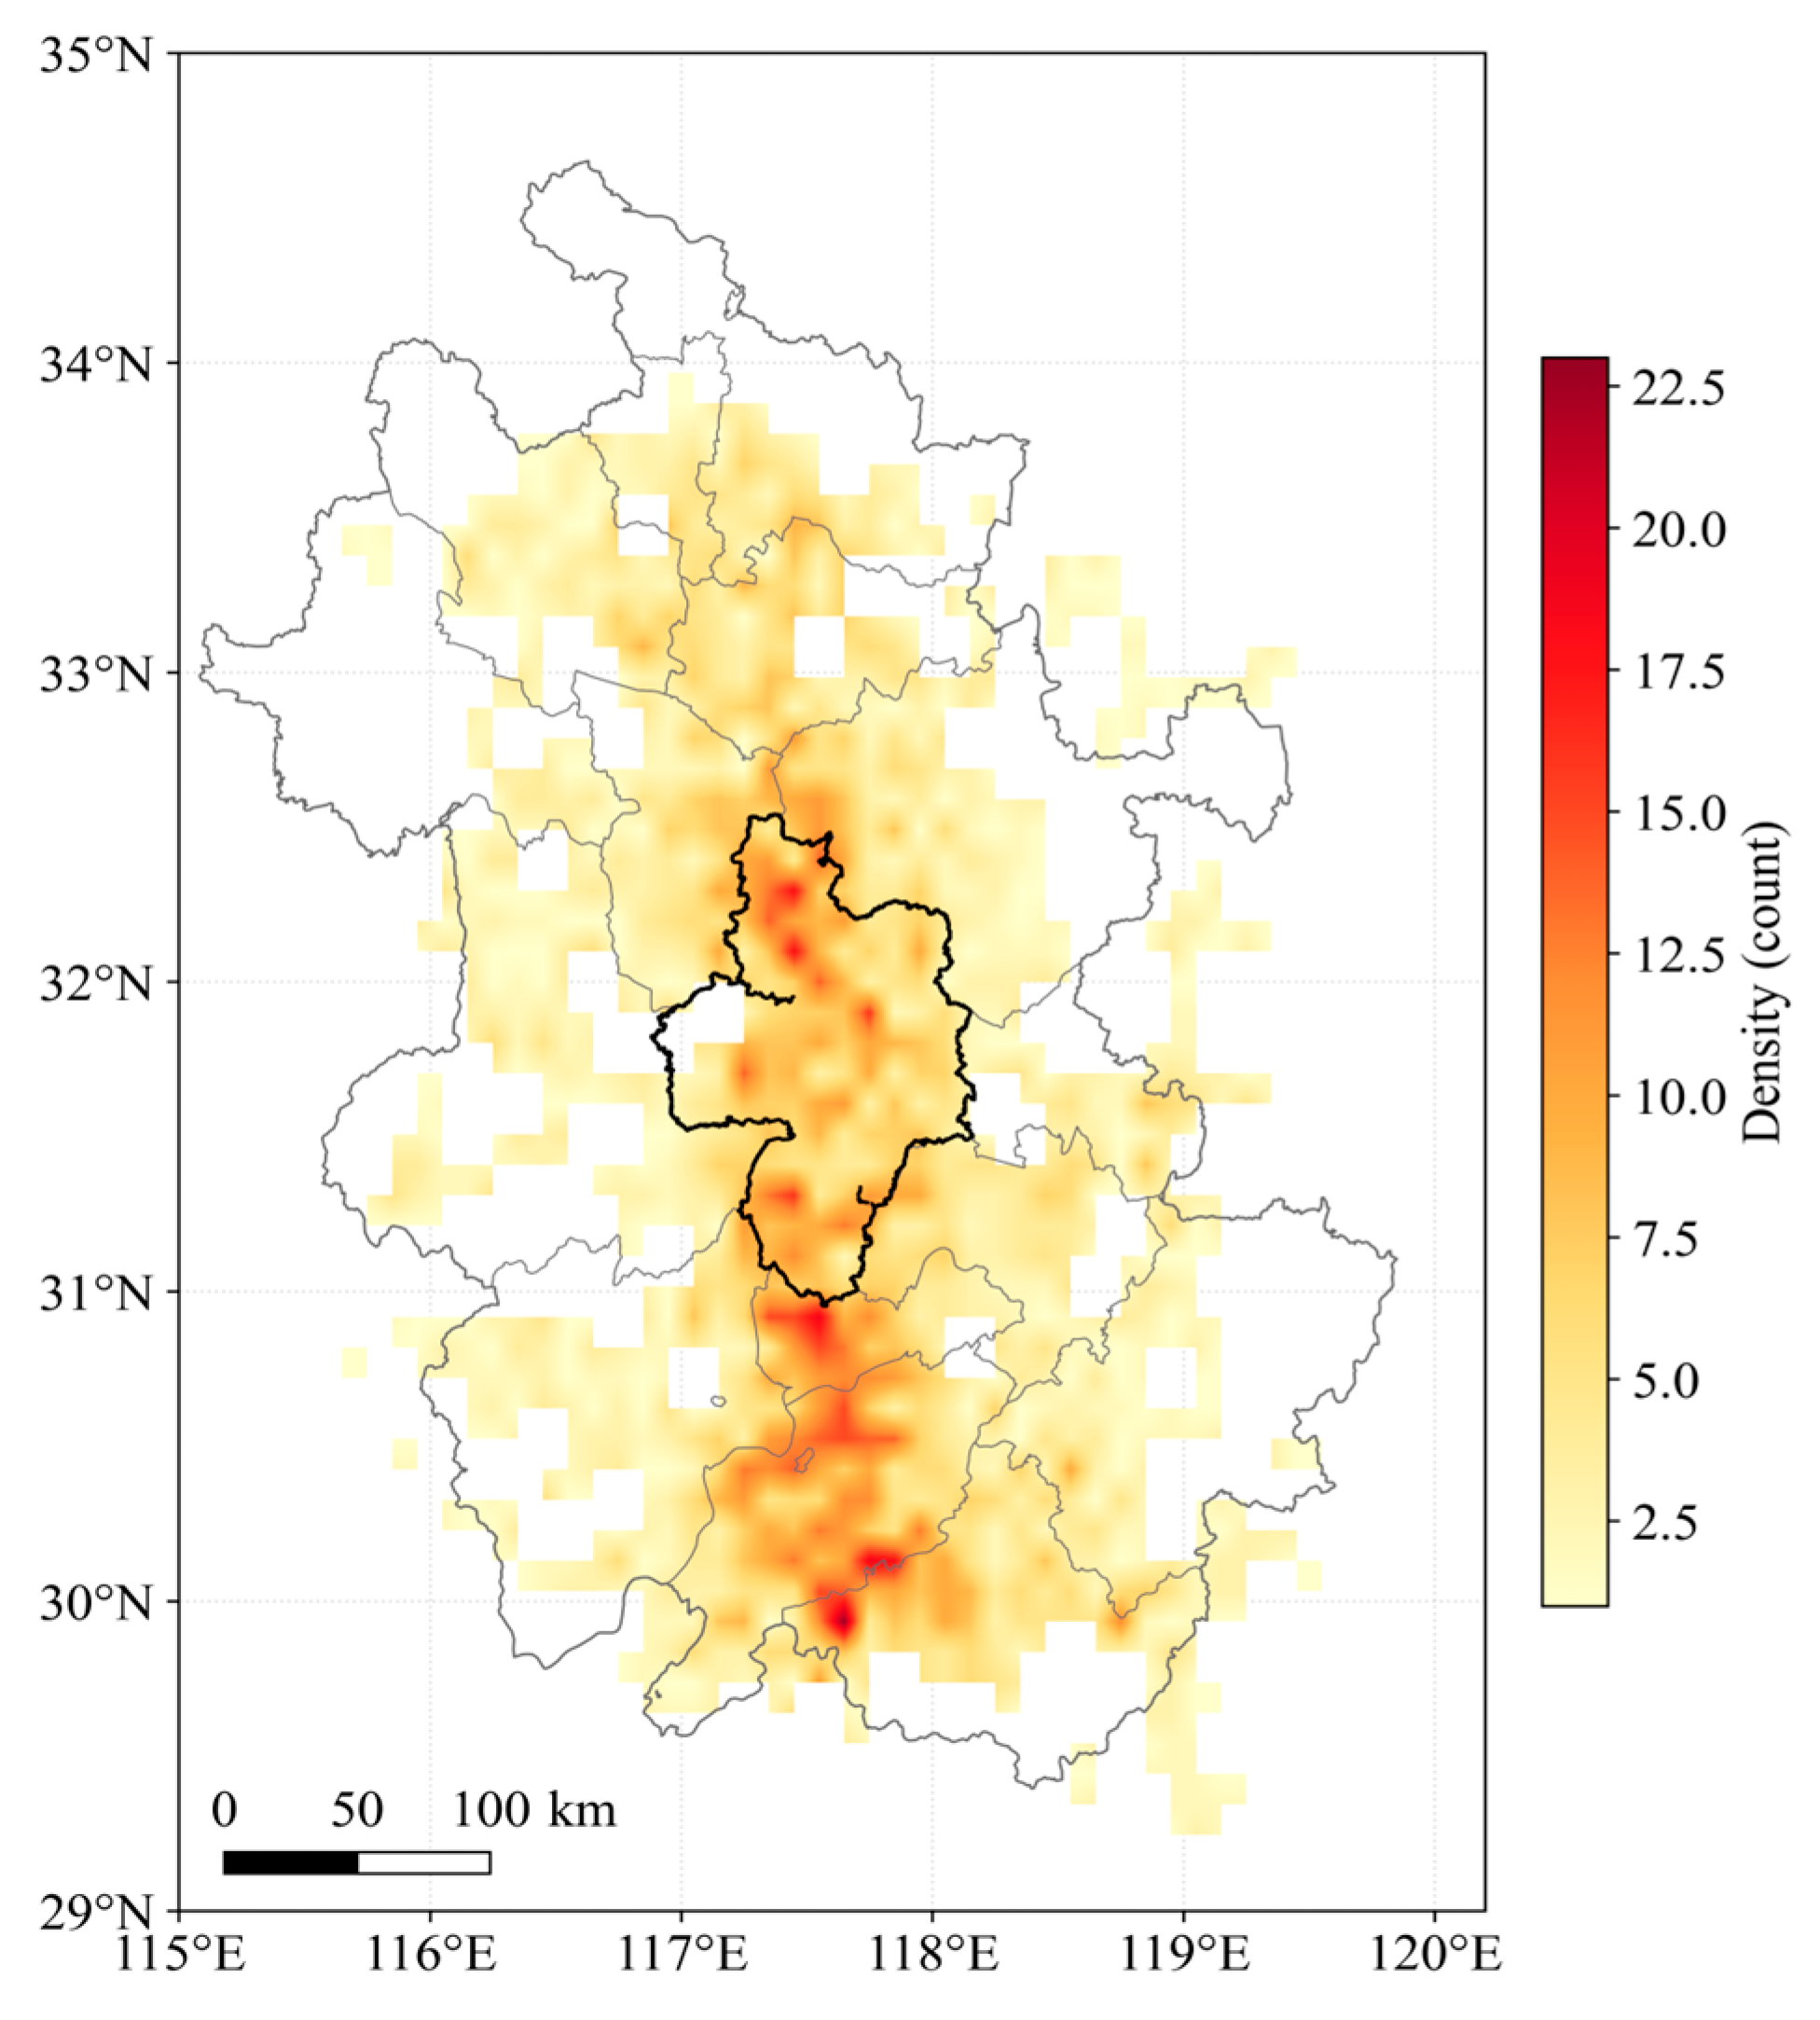
The spatial density of MCS tracks identified by Swin-Unet and the hybrid-criterion tracking method over the 18-year period is shown in Figure 9. MCS activity is not uniformly distributed but forms a quasi-meridional high-activity belt along the typical Meiyu-front pathway at 117–118° E, with the most active region concentrated at 30–32° N over the Jianghuai watershed and along the Yangtze River. This pattern reflects the combined influence of the Meiyu front, the low-level jet moisture channel, and orographic lifting.
Figure 9.
Spatial density of MCS tracks over the study area during 2008–2025, derived from Swin-Unet identification and hybrid-criterion tracking.
3.3. Representative Meiyu-Period MCS Case Study
A typical Meiyu-period MCS heavy rainfall event occurred in the study area from 02:00 to 15:00 on 7 June 2025, lasting 14 h, with accumulated precipitation exceeding 100 mm at over 120 stations. This event represents a typical Meiyu-front banded MCS persistent heavy rainfall process. For this case study, Swin-Unet was selected because it achieved the best overall performance among the four models in terms of both identification and tracking accuracy, making it suitable for demonstrating the practical application of the proposed framework.
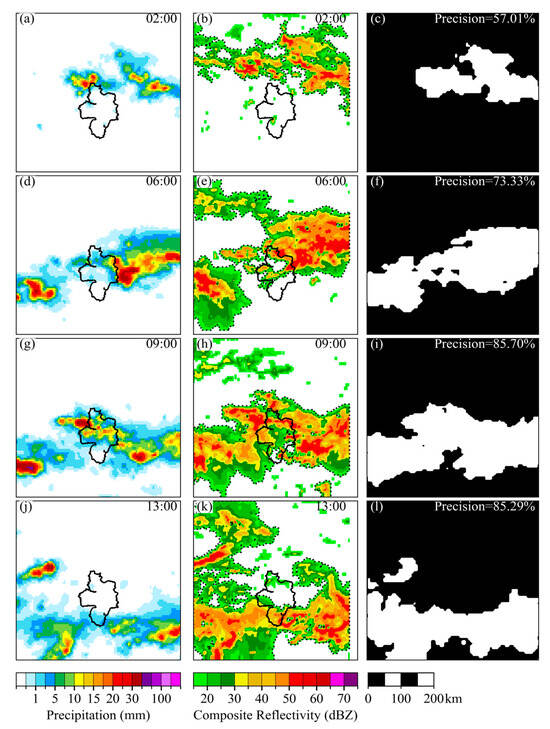
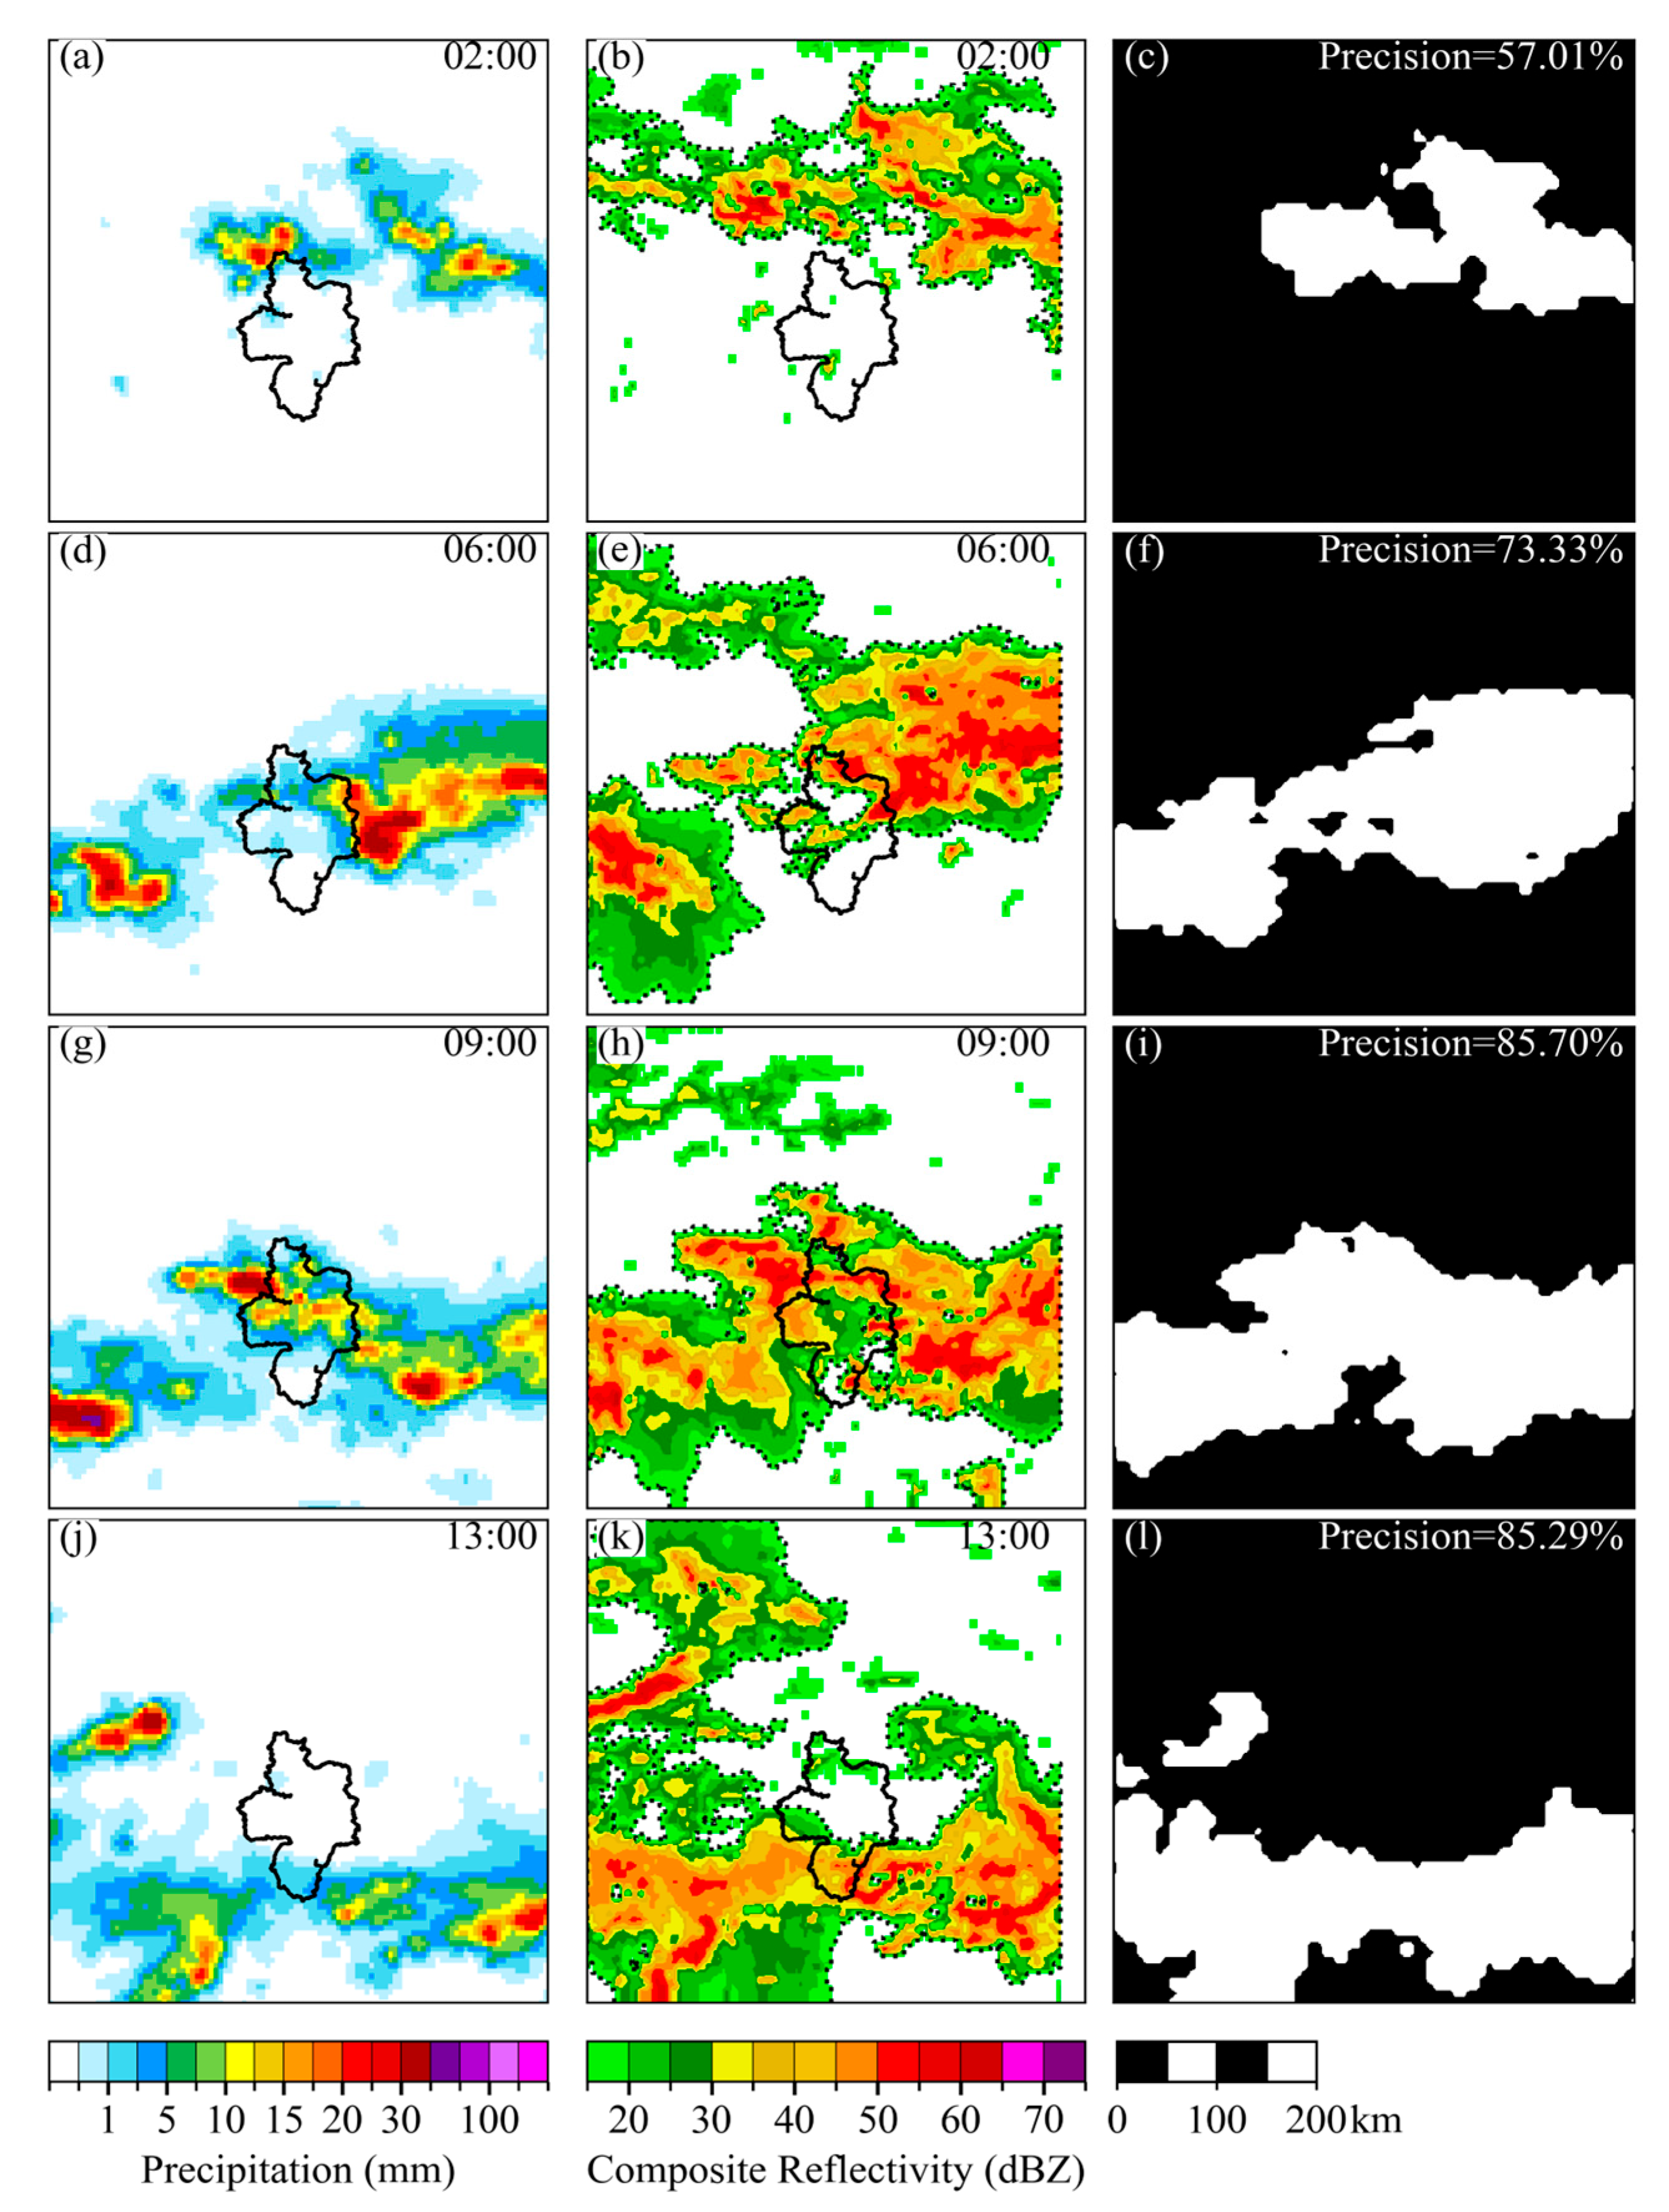
Four key time steps (02:00, 06:00, 09:00, and 13:00 LST) during the MCS movement were selected to compare the merged precipitation field, Swin-Unet MCS identification masks, and radar composite reflectivity MCS identification regions (Figure 10). At 02:00, during MCS initiation, the precipitation field exhibited a weak banded structure. Swin-Unet accurately identified the main extent of the MCS. Compared with the radar MCS mask, the identification accuracy reached 57.01%, and the identified region corresponded well with the radar ≥35 dBZ continuous region. At 06:00, as the MCS developed and moved eastward, the banded structure became more organized. The precipitation region identified by Swin-Unet showed further high agreement with the radar strong echo region. Since the upper-left radar echoes did not produce precipitation, Swin-Unet did not identify this region; compared with the radar MCS mask, the identification accuracy reached 73.33%. At 09:00, as the MCS further shifted southward, Swin-Unet completely identified the overall contour of the banded structure, with an identification accuracy of 85.7%. At 13:00, as precipitation intensity gradually weakened, the Swin-Unet model still maintained identification of the weakening MCS, achieving an identification accuracy of 85.29%.
Figure 10.
Comparison of MCS spatial morphology at key times during the Meiyu heavy rainfall event on 7 June 2025. Columns: (a,d,g,j) merged precipitation field; (b,e,h,k) Swin-Unet identification mask; (c,f,i,l) radar composite reflectivity MCS identification region. Rows: 02:00, 06:00, 09:00, and 13:00 LST. The solid line marks the administrative boundary of Hefei, and the dashed lines in the radar panels denote the MCS regions identified from composite reflectivity.
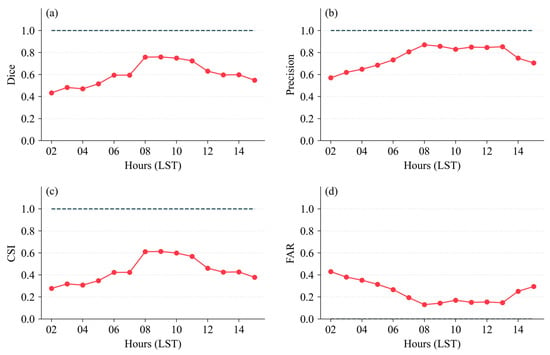
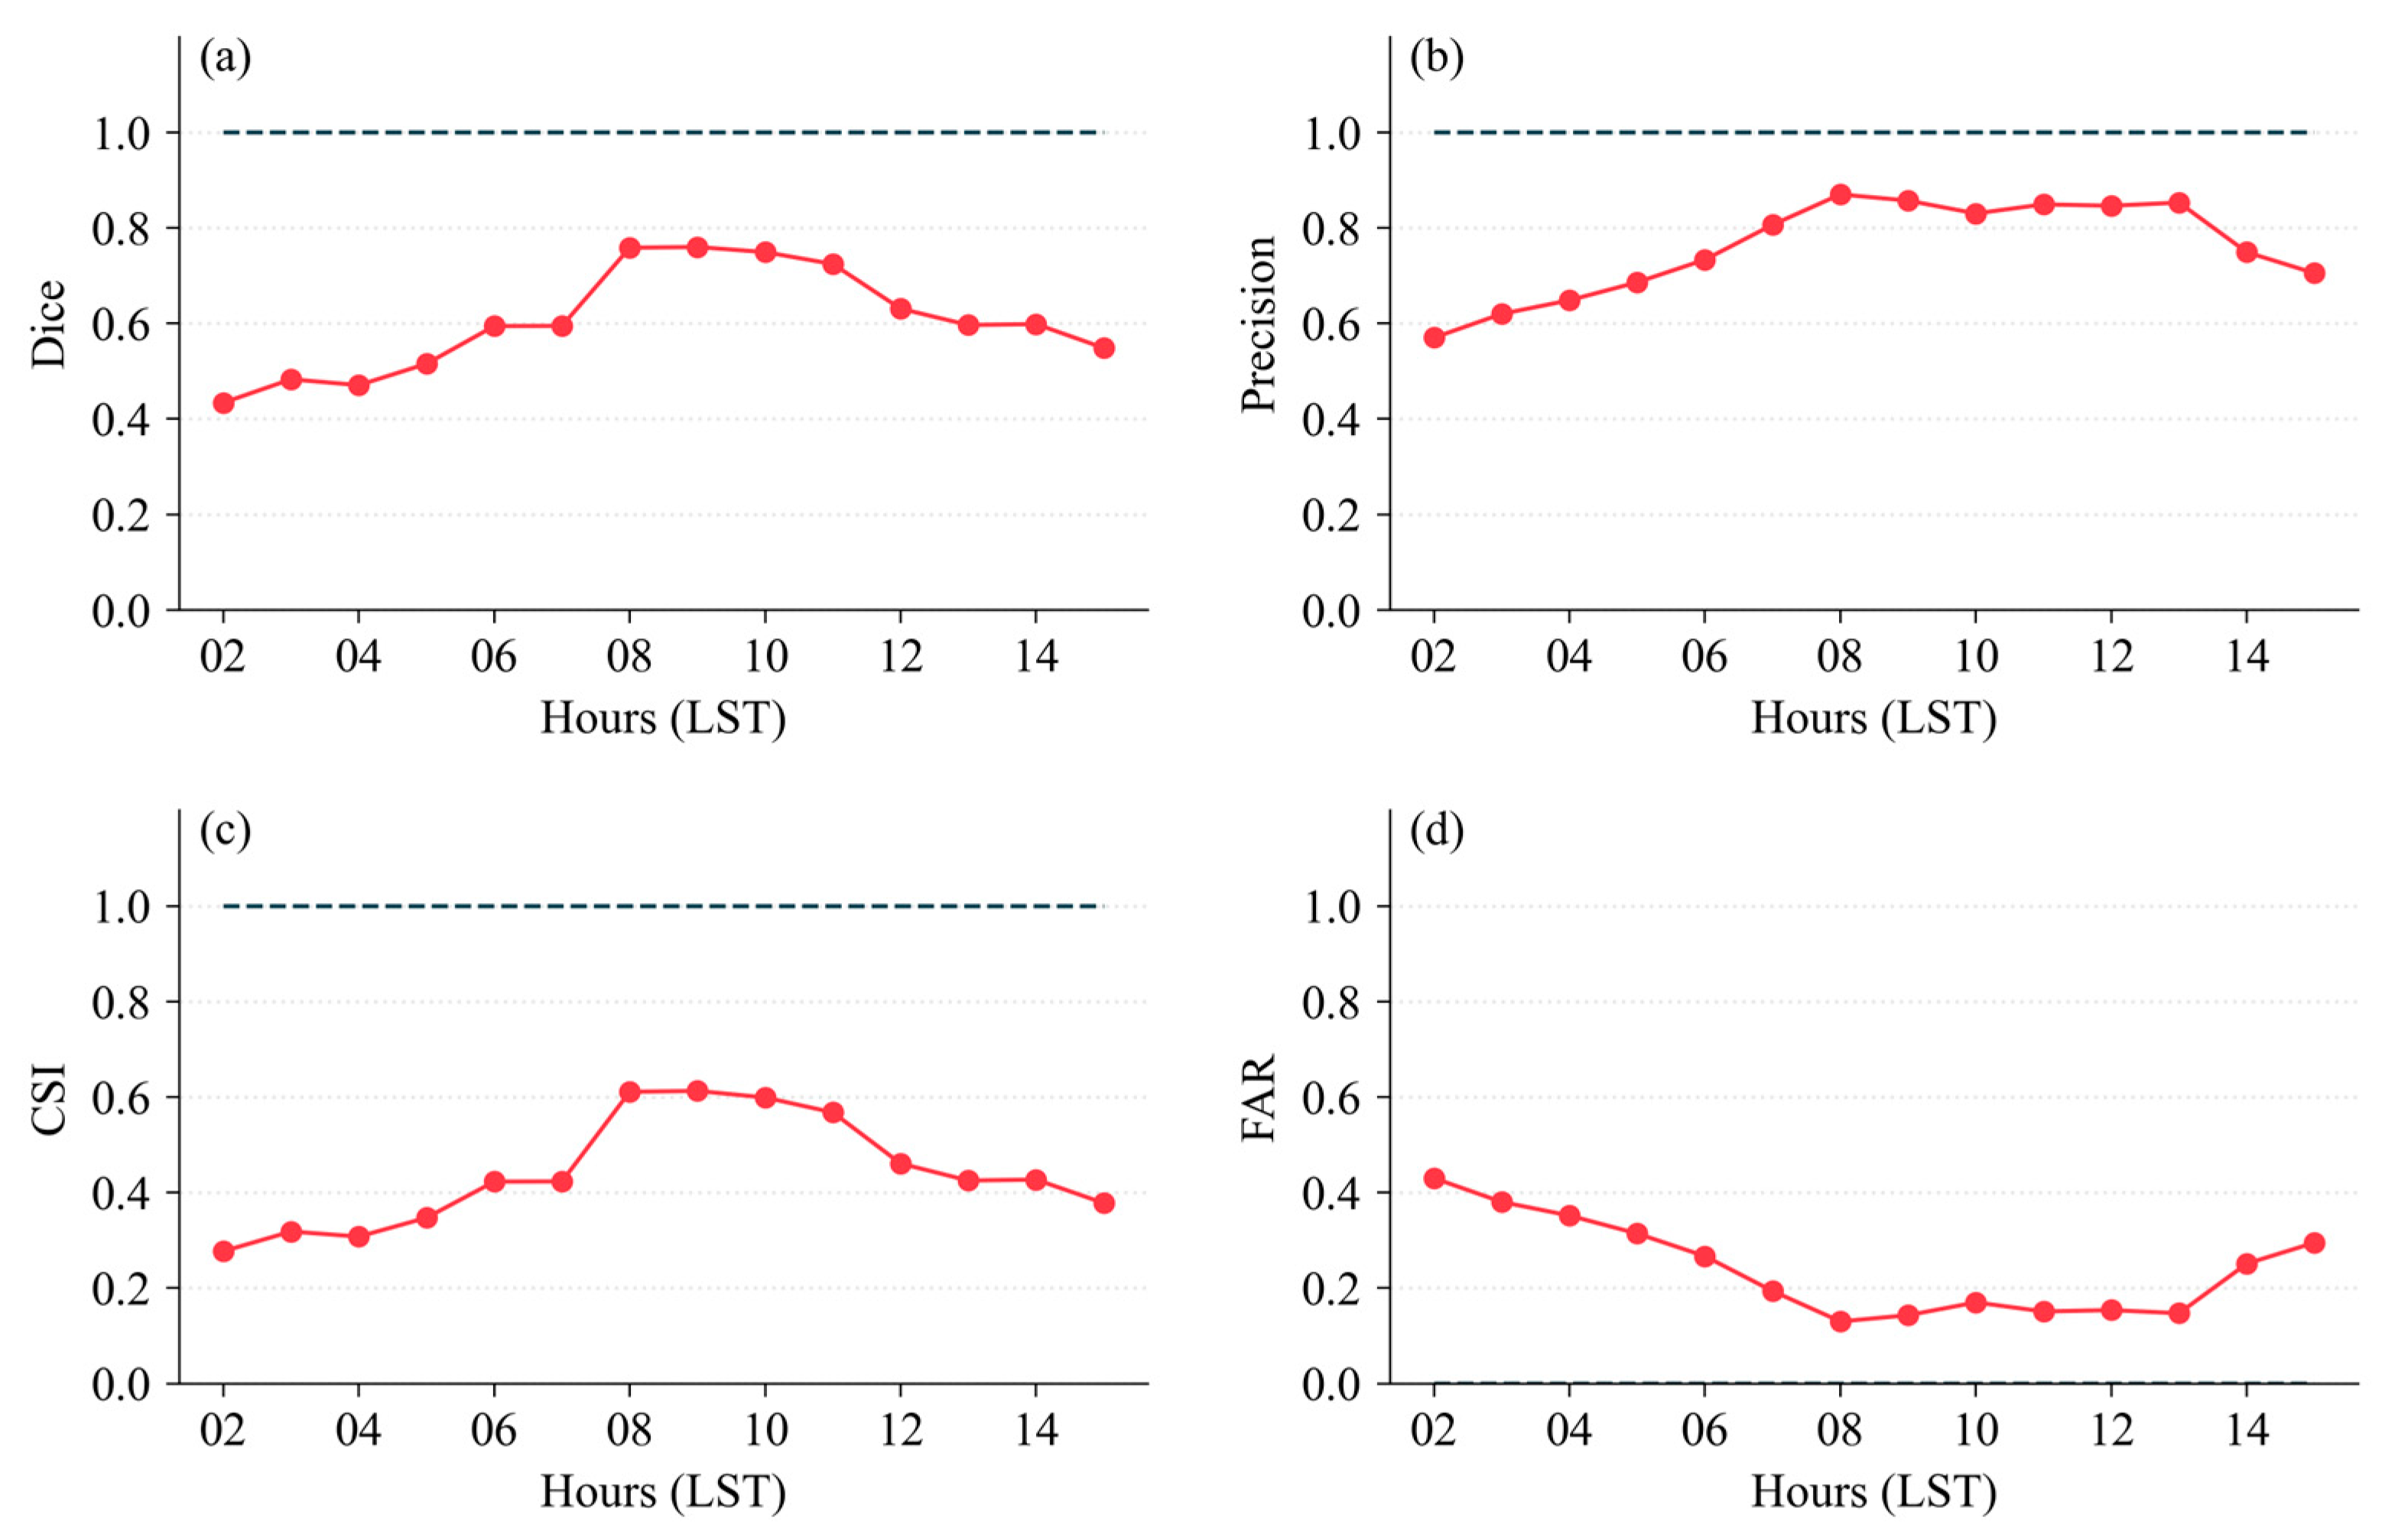
Hourly Swin-Unet identification accuracy evaluation (Figure 11) shows that the four metrics—Dice, Precision, CSI, and FAR—exhibit clear stage characteristics along with the MCS life cycle evolution, with overall means of Dice 0.62, Precision 0.78, CSI 0.45, and FAR 0.22.
Figure 11.
Hourly MCS identification accuracy of the Swin-Unet model during the Meiyu heavy rainfall event on 7 June 2025: (a) Dice coefficient; (b) Precision; (c) Critical Success Index (CSI); (d) False Alarm Ratio (FAR). The horizontal dashed line represents the ideal value (1.0) for reference.
During 02:00–05:00, the MCS structure was loose and the precipitation field signal was weak. The model had limited ability to identify weak precipitation boundaries, and all metrics were at their lowest levels during the event. Dice ranged from 0.44 to 0.53, CSI was only 0.28–0.35, and FAR was as high as 0.32–0.43. During 06:00–07:00, as the MCS became more organized and the precipitation field structure became clearer, the model’s identification capability improved significantly, with all metrics rising rapidly. Dice increased from 0.53 to 0.60, and FAR decreased from 0.32 to 0.20. During 08:00–10:00, the MCS banded structure was complete with clear convective cores, and the precipitation field morphology was most typical. Dice reached its peak of 0.76, Precision ranged from 0.83 to 0.87, CSI from 0.60 to 0.62, and FAR dropped to its lowest level of 0.13–0.18. During 11:00–15:00, Dice and CSI continuously declined, and FAR slowly rose. After the MCS weakened and dissipated, the precipitation field became fragmented, and blurred boundaries increased identification difficulty.
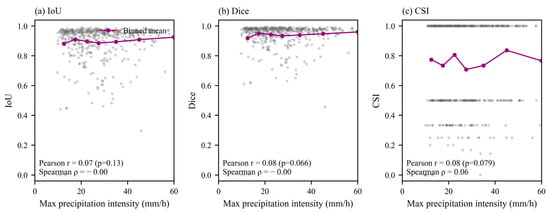
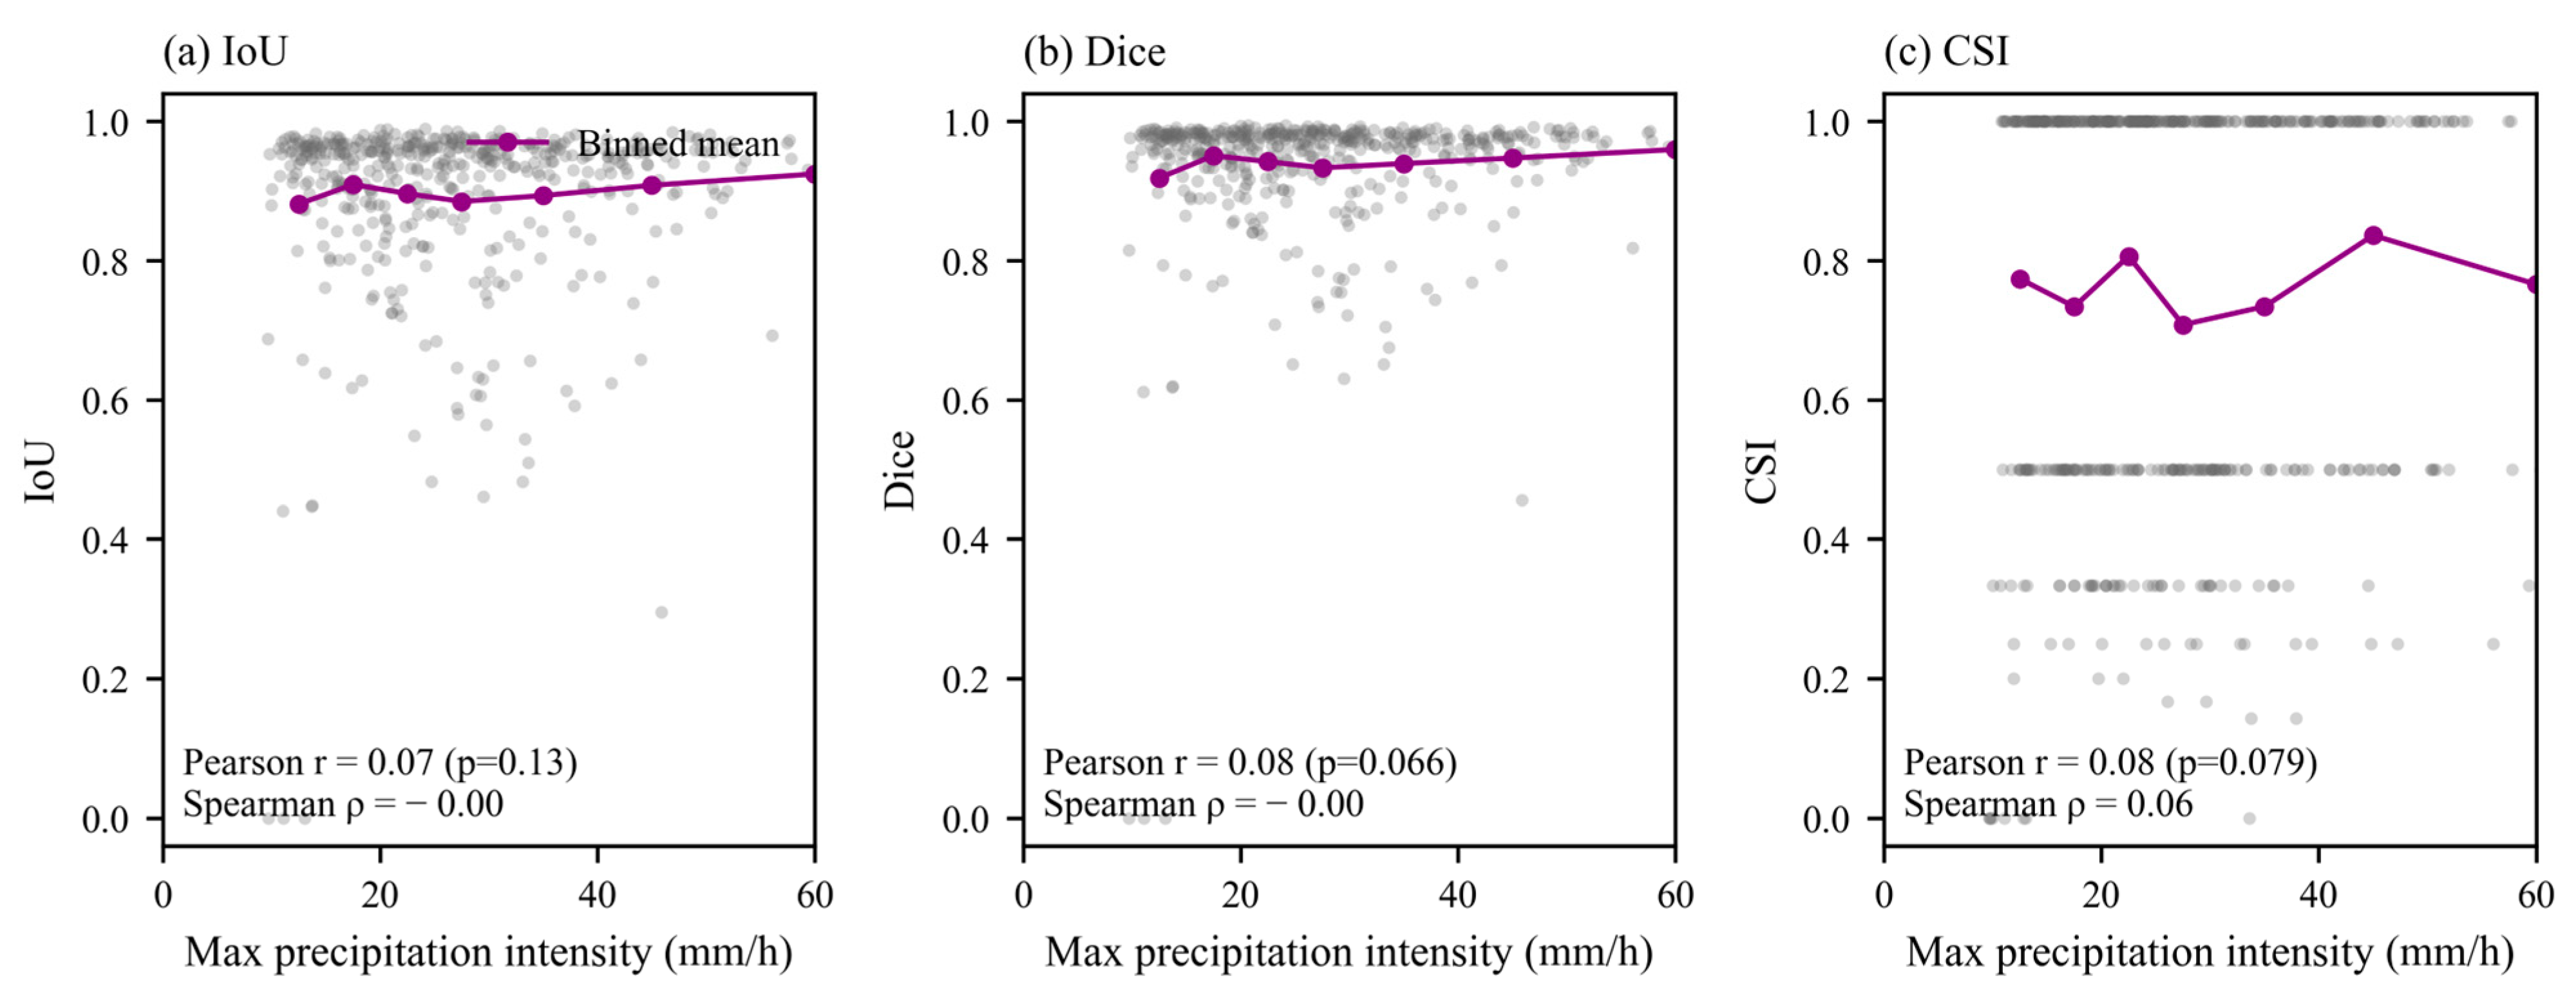
To further evaluate the influence of precipitation intensity on model performance for this Meiyu case, we analyzed the relationship between Swin-Unet identification accuracy (IoU, Dice, and CSI) and maximum precipitation intensity across the 14 hourly time steps (Figure 12). The model performance remains stable across the full intensity range, with IoU ranging from 0.88 to 0.93 and Dice from 0.92 to 0.96. A slight increase is observed at intensities >50 mm/h. The object-level CSI exhibits larger scatter among individual time steps, while the binned mean remains stable at 0.71–0.84. Correlation analysis indicates no significant relationship between identification accuracy and maximum precipitation intensity (Pearson r = 0.07, p = 0.13 for IoU; r = 0.08, p = 0.066 for Dice; r = 0.08, p = 0.079 for CSI). These results suggest that the Swin-Unet model maintains stable identification performance across different precipitation intensities for this Meiyu case.
Figure 12.
Relationship between Swin-Unet identification accuracy and maximum precipitation intensity for the 14 hourly time steps of the Meiyu-period MCS event on 7 June 2025: (a) IoU; (b) Dice; (c) CSI.
The hourly identification accuracy of Swin-Unet is further evaluated in terms of its operational applicability. As shown in Figure 11, the identification performance peaks during the mature stage of the MCS (08:00–10:00 BJT) and decreases during the initiation and dissipation stages. For operational MCS monitoring and nowcasting, the key requirement is to reliably identify the occurrence and approximate location of MCSs rather than achieving pixel-level precise boundary delineation. The model maintains stable identification performance throughout the MCS life cycle, with peak Dice and CSI values of 0.76 and 0.62 during the mature stage, which are sufficient to support real-time MCS monitoring and early warning. The 1 h temporal resolution is well aligned with the update cycle of operational nowcasting systems, which typically issue updated products at hourly or sub-hourly intervals.
From the evaluation results of the hybrid-criterion tracking method, the tracking accuracy reached 0.857, with a break rate of 0.071 and a false track rate of 0.071. Only one brief break occurred during the rapid weakening stage of the MCS, with no false tracking events, effectively depicting the entire life cycle of this MCS process.
4. Discussion
This study systematically evaluates the performance of four deep learning models and two tracking methods for MCS identification and tracking based on merged precipitation products. The results demonstrate that deep learning methods can effectively identify and track MCSs from precipitation fields, providing a new approach for MCS monitoring in regions with limited radar coverage.
4.1. Mechanism Analysis of Model Performance Differences
The performance differences among the four deep learning models reflect the distinct contributions of different architectural designs to MCS identification tasks. DNN, as the baseline encoder–decoder architecture, achieves the lowest IoU (0.82), primarily because its simple upsampling process loses fine-grained boundary information. U-Net’s skip connections directly transmit shallow high-resolution features to the decoder, effectively recovering MCS boundary spatial details and achieving a 9.8% IoU improvement. This confirms that for MCS identification tasks, accurate boundary localization is crucial, and multi-scale feature fusion significantly benefits segmentation performance.
Attention U-Net achieves the highest pixel-level precision (0.96) by introducing attention gating in skip connections, enabling the decoder to adaptively focus on task-relevant regions. This attention mechanism effectively suppresses false alarms in transition regions between precipitation and non-precipitation areas, which is particularly important for MCS boundary identification. However, Attention U-Net’s object-level POD is not superior to U-Net, indicating that the attention mechanism may be overly conservative in some cases, potentially sacrificing recall for higher precision.
Swin-Unet achieves the best overall performance, with the highest IoU (0.90), recall (0.96), CSI (0.60), and POD (0.65). The Transformer’s shifted window self-attention mechanism can capture long-range spatial dependencies, which is especially valuable for identifying large-scale MCSs and discrete convective clusters. In the third row of Figure 5 (discrete convective clusters), Swin-Unet significantly outperforms CNN-based models, demonstrating its advantage in modeling spatial associations among scattered convective elements. This finding is consistent with previous studies applying Swin-Unet to satellite cloud image-based MCS monitoring [16], further validating the effectiveness of Transformer architecture in mesoscale convective system identification.
The identification accuracy of Swin-Unet remains stable across the full range of precipitation intensities (Figure 12), with IoU and Dice showing no significant correlation with maximum precipitation intensity. This indicates that the model is robust to intensity variations and is suitable for operational MCS monitoring under diverse rainfall conditions.
4.2. Tracking Method Performance Analysis
The hybrid-criterion tracking method consistently outperforms the traditional area overlap method across all four identification models, with an average improvement of 7.2% in tracking accuracy and a 34% reduction in break rate. This improvement is achieved through the synergistic effect of three criteria: area overlap ratio, centroid distance, and deep feature similarity. The area overlap criterion ensures spatial correspondence, the centroid distance constraint prevents erroneous long-distance associations, and the deep feature similarity provides a semantic-level matching basis. The “at least two criteria satisfied” logic enhances the method’s robustness, avoiding tracking failures caused by the degradation of any single criterion during rapid MCS evolution.
Parameter sensitivity analysis reveals that the feature similarity threshold has the most significant impact on tracking performance. This indicates that deep features extracted by the encoder carry rich MCS morphological and structural information, which can serve as effective matching features for tracking. The optimal feature similarity threshold of 0.6 is relatively loose, suggesting that MCSs undergo substantial morphological changes between adjacent time steps, and requiring overly high feature similarity would lead to more breaks.
The optimal combination of Swin-Unet and hybrid-criterion tracking achieves a tracking accuracy of 0.94, which is comparable to or even exceeds tracking results based on radar reflectivity data reported in previous studies [8]. This result is remarkable considering that precipitation products have lower spatiotemporal resolution than radar data. It demonstrates that with appropriate deep learning methods, merged precipitation products can serve as an effective data source for MCS monitoring, providing valuable supplementary information for regions with insufficient radar coverage.
The spatial density of MCS tracks over the 18-year period (Figure 9) reveals a quasi-meridional high-activity belt along the Meiyu front at 117–118° E, with the most active region at 30–32° N. This pattern reflects the combined influence of the Meiyu front, the low-level jet moisture channel, and orographic lifting. The 18-year record provides a robust climatological context for MCS monitoring in the Yangtze–Huaihe River region.
4.3. Representative Case Analysis and Physical Interpretation
The Meiyu-period MCS case study on 7 June 2025 provides valuable insights into the practical performance of the proposed method under real weather conditions. The identification accuracy varies significantly across different stages of the MCS life cycle: it is lowest during the initiation stage (02:00–05:00), peaks during the mature stage (08:00–10:00), and gradually decreases during the dissipation stage (11:00–15:00). This pattern is closely related to the characteristics of the precipitation field itself. During the initiation stage, the MCS structure is loose and the precipitation intensity is weak, making it difficult to distinguish from scattered weak precipitation, resulting in higher FAR. During the mature stage, the banded structure is clear and the convective cores are well-defined, providing typical morphological features for model identification. During the dissipation stage, the precipitation field becomes fragmented and boundary ambiguity increases, leading to decreased identification performance.
Compared with radar composite reflectivity, Swin-Unet identification based on merged precipitation products shows good consistency, with identification accuracy ranging from 57.01% to 85.7% across different stages. Notably, some radar echo regions do not produce surface precipitation (such as the upper-left corner at 06:00), and Swin-Unet correctly does not identify these regions as MCSs. This highlights a fundamental difference between precipitation-based and radar-based MCS identification: the former identifies systems that actually produce surface precipitation, while the latter identifies systems with strong convective echoes aloft. Both perspectives are valuable and complementary for MCS monitoring.
4.4. Limitations and Future Work
This study has several limitations that should be acknowledged. First, MCSs dominated by strong storms but with weak surface precipitation may have insufficient signals on precipitation fields and could be missed. This is an inherent limitation of precipitation-product-based MCS identification and cannot be fully resolved by algorithmic improvements alone. Second, the MCS masks were labeled using the threshold method with manual quality inspection. Although the validation rate reached 98.7%, residual biases may still exist at the boundaries, potentially affecting model training. Third, this study focuses on a single city (Hefei) and its surrounding areas, and the generalizability of the findings to other climatic regions and geographic settings requires further investigation.
Future research will be conducted in the following directions: (1) introducing radar reflectivity and satellite cloud-top brightness temperature data to carry out multi-modal comparative verification and fusion identification, addressing the issue of missed detection of storm-dominated MCSs with weak surface precipitation; (2) developing more sophisticated labeling strategies, potentially incorporating unsupervised or weakly supervised learning approaches to reduce reliance on manual labeling; (3) expanding the study area to cover multiple climatic regions and validating the generalizability of the proposed method; and (4) exploring the application of the identification and tracking framework to real-time operational monitoring, including optimizing model inference speed and developing visualization tools.
5. Conclusions
Taking Hefei City as the study area and based on hourly multi-source merged precipitation products from 18 summer seasons (2008–2025), this study constructs a deep learning-based MCS identification and temporal tracking analysis framework. Through comparative experiments, the performance of four identification models and two tracking schemes is systematically evaluated, leading to the following main conclusions:
An MCS deep learning labeled dataset covering 18 summer seasons from 2008 to 2025 is constructed, validating the feasibility of using merged precipitation products to drive deep learning for MCS identification. This provides a new data perspective for MCS monitoring in regions with limited radar coverage.
Through independent experiments and case analyses, we found that U-Net skip connections effectively recover spatial details of MCS boundaries, achieving clear separation in multi-system coexistence scenarios. Attention U-Net’s gating mechanism suppresses false alarms, with pixel-level precision reaching 0.96. Swin-Unet’s self-attention mechanism performs optimally in recall and object-level CSI, more completely capturing MCS spatial extent. In addition, the Swin-Unet identification accuracy remains stable across different precipitation intensities, demonstrating the robustness of the proposed framework for operational MCS monitoring.
The hybrid-criterion tracking method is superior to the area overlap method. The multi-criterion logic effectively maintains tracking continuity under scenarios of rapid MCS movement and dramatic morphological changes, reduces long-distance false associations through feature similarity constraints, and demonstrates stronger robustness in complex evolution scenarios.
Transformer’s global modeling capability has advantages in tracking continuity maintenance. The combination of Swin-Unet and the hybrid-criterion tracking method achieves the optimal tracking accuracy of 0.94, effectively characterizing the complete MCS life cycle.
Author Contributions
Conceptualization, N.L. and X.J.; methodology, N.L.; software, N.L.; validation, N.L., G.C. and H.W.; formal analysis, N.L.; investigation, N.L.; resources, X.J. and G.C.; data curation, N.L. and H.W.; writing—original draft preparation, N.L.; writing—review and editing, N.L., X.J. and Y.L.; visualization, N.L. and H.W.; supervision, X.J.; project administration, X.J.; funding acquisition, X.J. and G.C. All authors have read and agreed to the published version of the manuscript.
Funding
This research was funded by the Innovation and Development Program of the Anhui Meteorological Bureau (CXM202403) and the Huaihe River Basin Meteorological Open Research Fund (HRM202605).
Institutional Review Board Statement
Not applicable.
Informed Consent Statement
Not applicable.
Data Availability Statement
The raw data supporting the conclusions of this article will be made available by the authors on request.
Conflicts of Interest
The authors declare no conflicts of interest.
Abbreviations
The following abbreviations are used in this manuscript:
| BCE | Binary Cross-Entropy |
| CLDAS | China Meteorological Administration Land Data Assimilation System |
| CMORPH | CPC MORPHing technique |
| CNN | Convolutional Neural Network |
| CSI | Critical Success Index |
| DNN | Deep Neural Network |
| FAR | False Alarm Ratio |
| GRAPES | Global/Regional Assimilation and Prediction System |
| GT | Ground Truth |
| IoU | Intersection over Union |
| MCS | Mesoscale Convective System |
| POD | Probability of Detection |
| QPE | Quantitative Precipitation Estimation |
| RMSE | Root Mean Square Error |
| STMAS | Space–Time Multiscale Analysis System |
References
- Houze, R.A. Cloud Dynamics, 2nd ed.; Academic Press: New York, NY, USA, 2014. [Google Scholar]
- Ai, Y.; Li, W.; Meng, Z.; Li, J. Life Cycle Characteristics of MCSs in Middle East China Tracked by Geostationary Satellite and Precipitation Estimates. Mon. Weather Rev. 2016, 144, 2517–2530. [Google Scholar] [CrossRef] [Scilit]
- Du, X.; Sun, T.; Oo, K.T. Spatiotemporal Characteristics of Mesoscale Convective Systems in the Yangtze River Delta Urban Agglomeration and Their Response to Urbanization. Atmosphere 2025, 16, 245. [Google Scholar] [CrossRef] [Scilit]
- Feng, Z.; Leung, L.R.; Liu, N.; Wang, J.; Houze, R.A., Jr.; Li, J.; Hardin, J.C.; Chen, D.; Guo, J. A Global High-Resolution Mesoscale Convective System Database Using Satellite-Derived Cloud Tops, Surface Precipitation, and Tracking. J. Geophys. Res. Atmos. 2021, 126, e2020JD034202. [Google Scholar] [CrossRef] [Scilit]
- Haberlie, A.M.; Ashley, W.S. A Method for Identifying Midlatitude Mesoscale Convective Systems in Radar Mosaics. Part II: Tracking. J. Appl. Meteorol. Climatol. 2018, 57, 1599–1621. [Google Scholar] [CrossRef] [Scilit]
- Yang, J.; Liu, L.; Li, G.; Wang, G.; He, H. A New Technique for Storm Cell and Mesoscale Convective Systems Identification, Tracking and Nowcasting Based on the Radar Mosaic Data. Acta Meteorol. Sin. 2012, 70, 1347–1355. (In Chinese) [Google Scholar] [CrossRef]
- Chen, M.; Li, G.; Li, S. Statistical Features of Mesoscale Convective Systems in Sichuan and Its Surrounding Areas during Warm Seasons from 2010 to 2022. Clim. Environ. Res. 2025, 30, 151–167. (In Chinese) [Google Scholar] [CrossRef]
- Nan, G.; Chen, M.; Qin, R.; Han, L.; Cao, W. Identification, Tracking and Classification Method of Mesoscale Convective System Based on Radar Composite Reflectivity Mosaic and Deep Learning. Acta Meteorol. Sin. 2021, 79, 1002–1021. (In Chinese) [Google Scholar] [CrossRef]
- Krinitskiy, M.; Sprygin, A.; Elizarov, S.; Narizhnaya, A.; Shikhov, A.; Chernokulsky, A. Towards the Accurate Automatic Detection of Mesoscale Convective Systems in Remote Sensing Data: From Data Mining to Deep Learning Models and Their Applications. Remote Sens. 2023, 15, 3493. [Google Scholar] [CrossRef] [Scilit]
- Rajagopal, M.; Russell, J.; Skok, G.; Zipser, E. Tracking Mesoscale Convective Systems in IMERG and Regional Variability of Their Properties in the Tropics. J. Geophys. Res. Atmos. 2023, 128, e2023JD038563. [Google Scholar] [CrossRef] [Scilit]
- Russell, J.; Rajagopal, M.; Veals, P.; Skok, G.; Zipser, E.; Tinoco-Morales, M. A Dataset of Tracked Mesoscale Precipitation Systems in the Tropics. Geosci. Data J. 2025, 12, e275. [Google Scholar] [CrossRef] [Scilit]
- Cui, W.; Dong, X.; Xi, B.; Feng, Z.; Fan, J. Can the GPM IMERG Final Product Accurately Represent MCSs’ Precipitation Characteristics over the Central and Eastern United States? J. Hydrometeorol. 2020, 21, 39–57. [Google Scholar] [CrossRef] [Scilit]
- Pan, Y.; Gu, J.; Xu, B.; Shen, Y.; Shi, C. Advances in Multi-Source Precipitation Merging Research and Its Applications. Adv. Meteorol. Sci. Technol. 2018, 8, 143–152. (In Chinese) [Google Scholar] [CrossRef]
- Gao, Z.; Tang, G.; Jing, W.; Hou, Z.; Yang, J.; Sun, J. Evaluation of Multiple Satellite, Reanalysis, and Merged Precipitation Products for Hydrological Modeling in the Data-Scarce Tributaries of the Pearl River Basin, China. Remote Sens. 2023, 15, 5349. [Google Scholar] [CrossRef] [Scilit]
- Cao, H.; Wang, Y.; Chen, J.; Jiang, D.; Zhang, X.; Tian, Q.; Wang, M. Swin-Unet: Unet-like Pure Transformer for Medical Image Segmentation. In Proceedings of the European Conference on Computer Vision Workshops (ECCVW), Cham, Switzerland, 23–27 October 2022; Springer: Cham, Switzerland, 2022; pp. 205–218. [Google Scholar] [CrossRef] [Scilit]
- Xiang, R.; Xie, T.; Bai, S.; Zhang, X.; Li, J.; Wang, M.; Wang, C. Monitoring Mesoscale Convective System Using Swin-Unet Network Based on Daytime True Color Composite Images of Fengyun-4B. Remote Sens. 2023, 15, 5572. [Google Scholar] [CrossRef] [Scilit]
- Zhang, X.; Zheng, Y.; Zhang, H.; Sheng, J.; Lu, B.; Feng, S. TGNet: Intelligent Identification of Thunderstorm Wind Gusts Using Multimodal Fusion. Adv. Atmos. Sci. 2025, 42, 146–164. [Google Scholar] [CrossRef] [Scilit]
- Kneidinger, D.; Schaffer, A.; Maraun, D. EMMA-Tracker v1.0: A Mesoscale Convective System Tracker and 27-Year European Observational Climatology. Geosci. Model Dev. 2026, 19, 5119–5137. [Google Scholar] [CrossRef] [Scilit]
- Sun, S.; Shi, C.; Pan, Y.; Bai, L.; Xu, B.; Zhang, T.; Han, S.; Jiang, L. Applicability Assessment of the 1998–2018 CLDAS Multi-Source Precipitation Fusion Dataset over China. J. Meteor. Res. 2020, 34, 879–892. [Google Scholar] [CrossRef] [Scilit]
- Joyce, R.J.; Janowiak, J.E.; Arkin, P.A.; Xie, P. CMORPH: A Method That Produces Global Precipitation Estimates from Passive Microwave and Infrared Data at High Spatial and Temporal Resolution. J. Hydrometeorol. 2004, 5, 487–503. [Google Scholar] [CrossRef] [Scilit]
- Shen, X.; Su, Y.; Hu, J.; Wang, J.; Sun, J.; Xue, J.; Han, W.; Zhang, H.; Lu, H.; Zhang, H.; et al. Development and Operation Transformation of GRAPES Global Middle-Range Forecast System. J. Appl. Meteorol. Sci. 2017, 28, 1–10. (In Chinese) [Google Scholar] [CrossRef]
- Shi, C.; Pan, Y.; Gu, J.; Xu, B.; Han, S.; Zhu, Z.; Zhang, L.; Sun, S.; Jiang, Z. A Review of Multi-Source Meteorological Data Fusion Products. Acta Meteorol. Sin. 2019, 77, 774–783. (In Chinese) [Google Scholar] [CrossRef]
- Pan, Y.; Gu, J.; Yu, J.; Shen, Y.; Shi, C.; Zhou, Z. Test of Merging Methods for Multi-Source Observed Precipitation Products at High Resolution over China. Acta Meteorol. Sin. 2018, 76, 755–766. (In Chinese) [Google Scholar] [CrossRef]
- Parker, M.D.; Johnson, R.H. Organizational Modes of Midlatitude Mesoscale Convective Systems. Mon. Weather Rev. 2000, 128, 3413–3436. [Google Scholar] [CrossRef] [Scilit]
- Li, Z.; Lu, Z.; Li, Y.; Liu, X. SwinNowcast: A Swin Transformer-Based Model for Radar-Based Precipitation Nowcasting. Remote Sens. 2025, 17, 1550. [Google Scholar] [CrossRef] [Scilit]
- Lee, Y.; Kummerow, C.D.; Ebert-Uphoff, I. Applying Machine Learning Methods to Detect Convection Using GOES-16 ABI Data. Atmos. Meas. Tech. 2021, 14, 2699–2716. [Google Scholar] [CrossRef] [Scilit]

Disclaimer/Publisher’s Note: The statements, opinions and data contained in all publications are solely those of the individual author(s) and contributor(s) and not of MDPI and/or the editor(s). MDPI and/or the editor(s) disclaim responsibility for any injury to people or property resulting from any ideas, methods, instructions or products referred to in the content. |
© 2026 by the authors. Licensee MDPI, Basel, Switzerland. This article is an open access article distributed under the terms and conditions of the Creative Commons Attribution (CC BY) license.