- Article

Wildfires in the Southern Amazon: Insights into Pyro-Convective Cloud Development from Two Case Studies in August 2021
- Katyelle Ferreira da Silva Bezerra,
- Flavio Tiago Couto and
- Fabrício Daniel dos Santos Silva
- + 14 authors
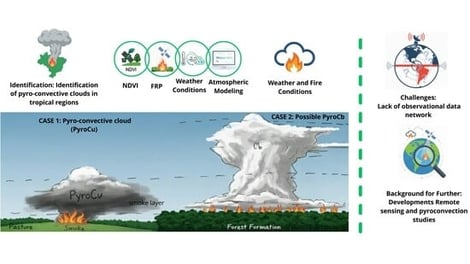
This study examines two wildfire events in the southern Amazon in August 2021, addressing the challenges in investigating the development of pyro-convective clouds in tropical regions. The analysis combines the Normalized Difference Vegetation Index, Fire Radiative Power derived from the Suomi-NPP and NOAA-20 satellites, and meteorological conditions from thermodynamic profiles and atmospheric modeling. The Meso-NH model was applied exploratorily with two simulations that allow convection, at a 2.5 km resolution. In the first case, a pyro-convective cloud (PyroCu) formed directly from active fires. In the second, a deep convective cloud developed over dispersed fire hotspots, exhibiting characteristics compatible with pyro-convective activity, although uncertainties remain regarding its classification as a true PyroCb. The results indicate that background thermodynamic instability primarily controls vertical plume development, modulating the influence of fire intensity. Incorporating high-resolution thermodynamic profiles into coupled atmospheric and chemical dispersion models can improve estimates of smoke injection height, complementing information on fire power. The results provide a basis for future developments related to understanding tropical pyro-convective clouds, showing how smoke dispersion may occur in the tropical region depending on the vertical structure of the atmosphere and fire intensity.
6 February 2026