


Abstract
Background/Objectives: Reported CWH43 variants in idiopathic normal-pressure hydrocephalus (iNPH) have been interpreted under differing inheritance models. Methods: We reassessed five previously reported variants (L533Ter, K696fs, A626V, I292T, and A469S) using gnomAD v4.1.1 population data, ancestry-stratified homozygote and gene-constraint analyses, published United States and Nordic cohorts, and structural/transcript annotation. Results: L533Ter and K696fs had allele frequencies of 1.72% and 0.725%, with 300 and 47 observed homozygotes and no obvious homozygote depletion relative to HWE expectation. CWH43 showed little evidence of heterozygous loss-of-function constraint. For carriage of either L533Ter or K696fs, the source-reported OR was 2.60 (95% CI 1.12–6.03) in the United States cohort and 1.23 (95% CI 0.849–1.717) in FinnGen; a random-effects sensitivity summary was OR 1.62 (95% CI 0.80–3.27; I2 = 61%). Eighty-two registry-defined FinnGen controls carried biallelic genotypes involving these variants without a recorded hydrocephalus diagnosis at a median age of 63 years. The two truncating variants also occupy distinct predicted transcript and structural contexts. Conclusions: Population-scale evidence does not support a simple uniformly high-penetrance interpretation of L533Ter and K696fs, while the biallelic observations specifically constrain a highly penetrant recessive model. The available case–control evidence is directionally positive but heterogeneous and does not establish a statistically conclusive common cross-cohort effect; an incompletely penetrant, context-dependent susceptibility contribution remains plausible but requires further investigation. The three missense variants provide population and molecular context but do not define a shared effect size or penetrance model.
1. Introduction
Idiopathic normal-pressure hydrocephalus (iNPH) is a late-onset clinical syndrome characterized by gait disturbance, cognitive decline, and urinary symptoms in association with ventriculomegaly and normal or intermittently normal cerebrospinal fluid pressure [1,2]. Because selected patients can improve after cerebrospinal fluid diversion, understanding disease mechanisms and genetic contributors may provide insight into disease heterogeneity. However, the syndrome overlaps with common neurodegenerative and vascular disorders, and its genetic architecture remains incompletely defined.
Increasing evidence suggests that genetic factors contribute to iNPH susceptibility, although the contribution of individual variants and their inheritance models remain incompletely understood [3,4]. CWH43 variants have been reported in familial and sporadic iNPH, including recurrent truncating and missense variants [5,6,7]. Experimental studies provide biological plausibility for CWH43 involvement in hydrocephalus-related biology: disruption of the orthologous gene produced ventricular enlargement and other hydrocephalus-related phenotypes, together with altered GPI-anchored protein trafficking [5]. However, experimental perturbation establishes biological relevance rather than the effect size, penetrance, or inheritance model of naturally occurring human variants. Because iNPH is a late-onset and clinically heterogeneous disorder, age, genetic background, ascertainment, and other disease modifiers may influence whether a susceptibility variant is clinically expressed. Broader genome-wide studies also support a genetically heterogeneous architecture for normal-pressure hydrocephalus rather than a model centered on a single gene [8].
Interpretation of reported variants requires integration of population frequency, inheritance model, gene-level constraint, and phenotype. Population frequency, homozygote occurrence, and constraint primarily reflect population tolerance and selection rather than penetrance; a late-onset susceptibility allele may therefore increase iNPH risk without strong depletion in population data [9,10,11,12]. Population observation does not establish clinical neutrality but can constrain deterministic or fully penetrant interpretations.
Here, we reassessed the genetic interpretation of previously reported CWH43 variants using an integrated population-aware framework. We combined population frequency and homozygote data, gene-level constraint, association estimates across cohorts, clinical and radiologic observations, and structural and transcript annotation to determine which inheritance and penetrance interpretations remain compatible with the accumulated evidence. Cross-cohort association analyses were restricted to the combined carrier burden defined as carriage of either L533Ter or K696fs, whereas population and molecular-context analyses included all five reported variants. The study was not designed as a new gene discovery or formal replication study.
2. Materials and Methods
2.1. Variant Selection, Nomenclature, and Analytical Framework
The analysis focused on five CWH43 variants previously reported in association with iNPH. Variant nomenclature followed the MANE Select RefSeq transcript NM_025087.3 and protein NP_079363.2. The reported variants were NM_025087.3:c.1596del [NP_079363.2:p.(Leu533Ter); L533Ter], NM_025087.3:c.2088del [NP_079363.2:p.(Lys696AsnfsTer23); K696fs], NM_025087.3:c.1877C>T [NP_079363.2:p.(Ala626Val); A626V], NM_025087.3:c.875T>C [NP_079363.2:p.(Ile292Thr); I292T], and NM_025087.3:c.1405G>T [NP_079363.2:p.(Ala469Ser); A469S] [5,6,7]. Population genetic analyses included all five variants. Cross-cohort burden analyses were restricted to the combined carrier burden defined as carriage of either L533Ter or K696fs because comparable case–control estimates were available across independent cohorts. Carriage of both variants was not required. The three missense variants were retained for population and structural-context analyses but were not included in the cross-cohort burden analysis. The analysis was restricted to these five previously reported variants and did not include discovery across the entire gene or prioritization of unreported variants. No new DNA sampling, genotyping, or variant calling was performed. Variant nomenclature was independently reverified using VariantValidator against the GRCh38 reference genome and the MANE Select transcript NM_025087.3. The recurrent L533Ter variant was confirmed as NM_025087.3:c.1596del, corresponding to NC_000004.12:g.49032653del on GRCh38 and NC_000004.11:g.49034670del on GRCh37, with the predicted protein consequence NP_079363.2:p.(Leu533Ter). The parentheses in p.(Leu533Ter) denote a predicted protein consequence and do not establish the presence or stability of the corresponding truncated protein in vivo. Although the underlying alteration is a single-nucleotide deletion, the predicted sequence terminates immediately at the first affected amino acid position; accordingly, the validated HGVS protein consequence is p.(Leu533Ter).
2.2. Population Genetic Analyses and Gene Constraint
Population allele frequencies, ancestry-stratified frequencies, homozygote counts, and gene-level constraint metrics were obtained from the Genome Aggregation Database (gnomAD) v4.1.1 using Genome Reference Consortium Human Build 38 (GRCh38), queried May 10 and 11, 2026 [9,13]. The gnomAD v4 resource includes data from 807,162 individuals overall, comprising 730,947 exomes and 76,215 genomes. For each reported variant, allele count (AC), allele number (AN), allele frequency (AF), observed homozygote count, and filter status were extracted from the joint exome/genome call set when available. Because callable sample size varies by locus, variant-level AN rather than the nominal cohort size was used as the denominator for frequency-based calculations. Exome- and genome-specific frequencies were examined as platform context. Variant coordinates were referenced to GRCh38 and the MANE Select CWH43 transcript ENST00000226432.9/NM_025087.3 [14]. All primary quantitative inputs were from gnomAD v4.1.1. After the release of v4.1.2, the corresponding browser pages were rechecked for quality control; variant frequency data and filtering status were unchanged, and corrected constraint rank/bin fields were not used in the present analysis.
Expected homozygotes were calculated under Hardy–Weinberg equilibrium (HWE) as AF2 × N, where N = AN/2. Observed/expected (O/E) ratios at the variant level compare observed homozygotes with HWE expectation and describe homozygote depletion or excess, not disease risk. Ratios near 1 were considered broadly compatible with expectation; ratios with very small expected counts were interpreted descriptively. Analyses were performed pooled and, when relevant, by ancestry because mixing groups with different allele frequencies can distort HWE expectations. A626V was therefore examined within ancestry strata, with small or bottlenecked groups interpreted separately. Exact HWE p values used a biallelic exact test on genotype counts reconstructed from AC, AN, and observed alternate homozygotes (heterozygotes = AC − 2 × alternate homozygotes; reference homozygotes = AN/2 − heterozygotes − alternate homozygotes) [15]. Pooled HWE p values were interpreted descriptively because the gnomAD joint call set combines ancestry groups. For ancestry-stratified analyses, AC, AN, AF, observed and expected homozygote counts, O/E ratios, and exact HWE p values are reported in Table S1a,b; variant-level filter status and QC cross-check information are provided in Table S1a. Pooled departures were interpreted cautiously because the gnomAD joint dataset combines ancestry groups with different allele frequencies.
Constraint at the gene level was summarized using probability of loss-of-function intolerance (pLI), loss-of-function (LoF) observed/expected ratio, loss-of-function observed/expected upper-bound fraction (LOEUF), and missense observed/expected ratio from gnomAD v4.1.1. These metrics are distinct from variant-level homozygote O/E ratios because they assess depletion of LoF or missense variation across CWH43. Higher pLI values and lower LoF observed/expected ratio or LOEUF values indicate greater inferred intolerance to heterozygous LoF variation; LOEUF is the upper bound of the 90% confidence interval for the LoF observed/expected estimate. These metrics were used as measures of population selection rather than direct estimates of variant pathogenicity or iNPH penetrance. Gene-level constraint was interpreted as evidence about population selection rather than a direct test of clinical effect: because iNPH is typically late onset, clinically relevant effects arising largely after the major reproductive period may produce limited detectable population depletion.
2.3. Expected and Observed Biallelic Genotype Analyses
To estimate the expected population frequency of biallelic genotypes involving the two reported truncating variants, the combined allele frequency within each ancestry stratum was approximated as q = AF(L533Ter) + AF(K696fs). Under Hardy–Weinberg equilibrium, q2 was used as an approximate expected frequency of individuals carrying at least one of these variants on each homologous chromosome. This approximation assumes negligible co-occurrence of L533Ter and K696fs in cis and no material distortion from population-specific linkage disequilibrium or haplotype structure. Individual-level phase and haplotype information was not available in the gnomAD aggregate dataset, so these assumptions could not be directly tested. The resulting q2 values were therefore used only to indicate approximate population scale and should not be interpreted as observed biallelic genotype frequencies or disease prevalence. Broader unreported CWH43 predicted loss-of-function variants were not included in this calculation.
FinnGen controls carrying biallelic genotypes involving L533Ter and K696fs were tabulated by genotype class, including L533Ter homozygotes, K696fs homozygotes, and L533Ter/K696fs compound heterozygotes (one copy of each reported variant) [7]. Recorded hydrocephalus diagnosis status and age were summarized descriptively. FinnGen control status was based on diagnoses recorded in registry data rather than prospective neurologic and imaging screening for iNPH. Accordingly, absence of a recorded diagnosis cannot be equated with confirmed absence of current or lifetime iNPH, particularly for a late-onset disorder. These observations were therefore used to evaluate compatibility with a fully penetrant recessive model expressed in early life or midlife and were not used to estimate lifetime penetrance. This biallelic-genotype analysis was distinct from the cross-cohort carrier-burden analysis, in which carrier status was defined by carriage of either L533Ter or K696fs. These biallelic observations primarily inform the plausibility of a highly penetrant recessive model and do not independently establish the penetrance of heterozygous carriers.
2.4. Cross-Cohort Association and Heterogeneity Analysis for Carriage of Either L533Ter or K696fs
Carrier counts for individuals carrying either L533Ter or K696fs were extracted from published United States and Nordic iNPH cohorts [5,6,7]. For case–control comparison across cohorts, the primary burden definition was carriage of either L533Ter or K696fs, and cohort-specific estimates were treated as the primary association evidence. Source-reported odds ratios (ORs) and 95% confidence intervals (CIs) were retained as reported. The Tipton estimate was derived from multivariable logistic regression adjusted for age at blood draw and sex, whereas the FinnGen source reported the association from carrier-frequency comparison without an equivalent covariate-adjusted model. The cohorts also differed in ascertainment, age structure, diagnostic and control definitions, ancestry composition, and genotyping approach. Accordingly, the two estimates were not assumed to represent an identical underlying effect, and their random-effects summary was used only as an exploratory heterogeneity/sensitivity analysis rather than as a precise common effect estimate across populations.
Only independent case–control estimates with comparable carrier definitions were included in the random-effects summary. Descriptive cohorts without independent controls or with potential dataset overlap were retained as context but not as separate inputs. The random-effects summary odds ratio was calculated on the log odds scale by inverse variance weighting with a DerSimonian–Laird model [16]. Standard errors were derived from 95% CIs as [ln(upper) − ln(lower)]/(2 × 1.96). Heterogeneity was summarized with Cochran’s Q, I2, and the heterogeneity p value [17]. With only two comparable estimates and nonidentical source-model adjustment, both the pooled effect and I2 are statistically imprecise; the analysis was treated as an exploratory heterogeneity/sensitivity summary, not a confirmatory meta-analysis. No prospective sample size calculation was performed. To assess robustness to differences in source-model adjustment, a secondary sensitivity analysis reconstructed crude 2 × 2 carrier counts for both cohorts and repeated the DerSimonian–Laird random-effects summary; this analysis could not remove other between-cohort design differences.
Where published genotype counts permitted, L533Ter and K696fs were additionally examined separately as descriptive analyses. These variant-specific comparisons were not included in the random-effects summary because comparable adjusted variant-specific estimates were not available across both cohorts. Their purpose was to assess whether the combined burden concealed obvious variant-specific differences, not to generate stable variant-specific cross-cohort effect estimates.
2.5. Illustrative OR-to-Risk Sensitivity Analysis
To illustrate how the random-effects summary OR would translate into absolute risk under different baseline assumptions, we applied the summary OR and its 95% confidence limits to assumed reference-group risks of 0.5–5%. Risk was calculated as OR × p0/(1 − p0 + OR × p0), where p0 represents the assumed reference-group risk. Because the summary OR was derived from only two nonidentically adjusted source estimates and its confidence interval crossed 1, this analysis was treated solely as an illustrative, assumption-dependent translation rather than as a fitted risk-prediction model, an observed carrier-risk estimate, or a measure of lifetime penetrance.
2.6. Exploratory Clinical and Radiologic Comparisons
Clinical and radiologic characteristics of variant carriers and noncarriers were extracted from the published source cohorts. The United States clinical and radiologic analysis included carriers of reported CWH43 coding variants and was therefore treated separately from the combined carrier-burden definition of carriage of either L533Ter or K696fs used in the cross-cohort association analysis [6]. Nordic clinical comparisons used the carrier definitions reported in the corresponding source cohorts [7].
Extracted variables included radiologic features, age at disease onset, sex, head circumference, and available measures of shunt response. Published counts, summary statistics, and p values were retained as reported. Comparisons were considered exploratory because carrier denominators were small and cohort ascertainment, diagnostic pathways, and imaging phenotyping were not uniform. No multiplicity adjustment was applied to published exploratory p values, which were reproduced as reported and interpreted descriptively. No individual-level dataset was available to perform harmonized multivariable adjustment for age, vascular factors, or other exposures across the source cohorts.
2.7. Structural and Transcript Annotation for Individual Variants
Structural and transcript context analyses were restricted to annotations used to provide context for the previously reported variants. For the present positional annotation, the C-terminal D3/core region was defined as residues 411–699; the structural core at residues 427–651 and candidate contextual residues H548 and R627 were retained from the cited structural analysis [18]. D3/core is used here as a positional structural annotation rather than as an established biochemical domain. The D3/core boundaries and candidate contextual residues derive from the cited recent structural analysis and are used solely as positional annotations; they should not be interpreted as independently validated biochemical domain boundaries, catalytic residues, or established functional mechanisms.
Variant positions were mapped relative to the D3/core annotation. Predicted susceptibility to nonsense-mediated messenger RNA (mRNA) decay (NMD) was assessed from transcript position using the canonical 50-nucleotide rule. For the MANE Select transcript NM_025087.3/ENST00000226432.9, the final coding exon–exon junction occurs after c.2021. Applying the canonical 50-nucleotide NMD rule places the approximate escape boundary at c.1971, corresponding to codon 657 (c.1969–c.1971) [19]. This boundary was used only as a transcript-context prediction and does not establish measured transcript fate. The prediction applies to the specified MANE Select transcript; alternative transcript usage could modify the predicted NMD consequence. These annotations were used to compare where L533Ter and K696fs occur and what transcript consequences are predicted. They were not treated as experimental evidence of transcript fate, protein function, a validated catalytic role of the annotated region, or a shared disease mechanism.
2.8. Analytical Reproducibility
ChatGPT (OpenAI; GPT-5.6 Sol, 2026) assisted with selected analytical verification and numerical consistency checks. All AI-assisted outputs were independently reviewed and verified by the authors. Final numerical verification was performed using custom Python 3.13.5 scripts, including an independent exact-HWE cross-check and consistency checks across reported analyses. J.W. and D.Y. were responsible for the statistical analysis and are accountable for the analytical methods and results. No separate study protocol or prespecified statistical analysis plan was generated for this secondary analysis.
3. Results
3.1. Population Genetic Profiles and Biallelic Genotypes
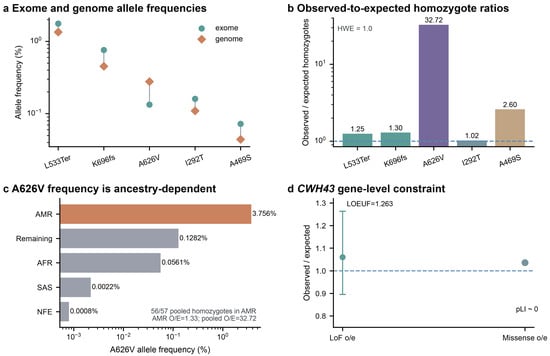
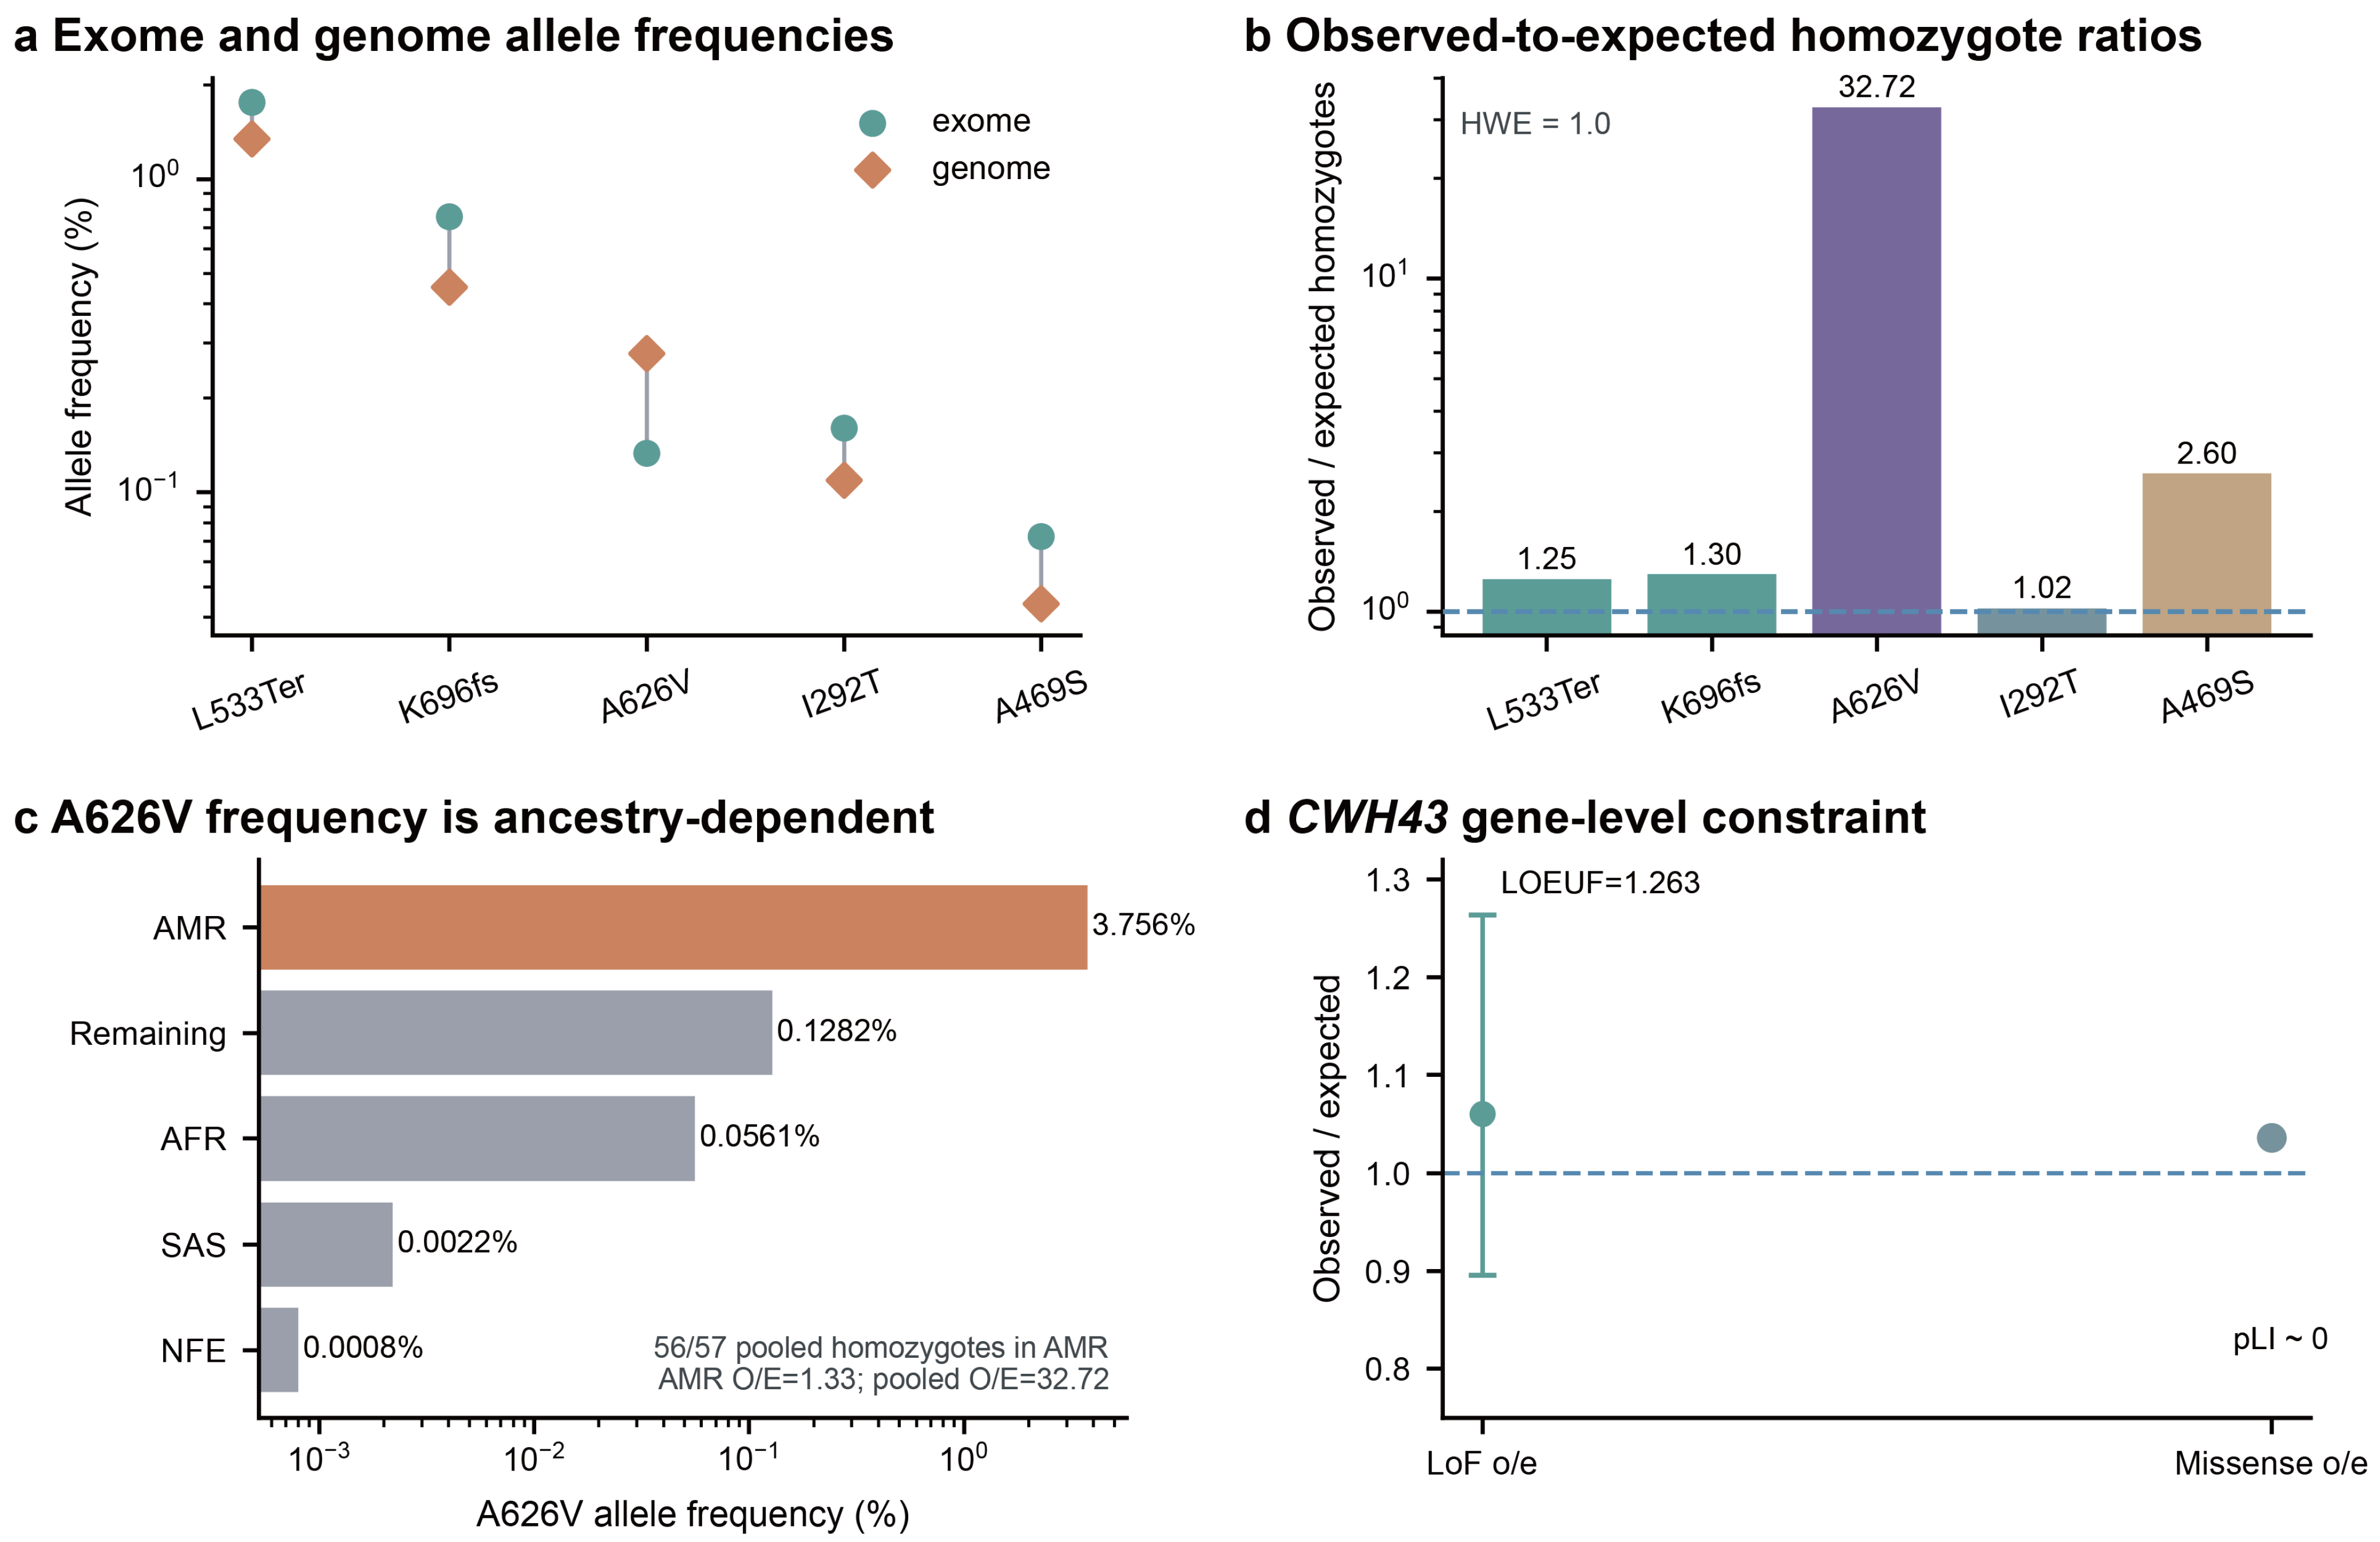
All five previously reported CWH43 variants were observed in gnomAD v4.1.1, a population resource comprising approximately 807,000 individuals overall (730,947 exomes and 76,215 genomes), although the number of callable alleles varied by locus [9,13]. L533Ter had an allele frequency of 1.72% with 300 observed homozygotes, whereas K696fs had an allele frequency of 0.725% with 47 homozygotes reported by gnomAD. Their observed/expected homozygote ratios for these variants were 1.25 and 1.30, respectively, indicating no obvious homozygote depletion relative to HWE expectation. Ratios near 1 indicate population compatibility with the HWE expectation and should not be interpreted as evidence of clinical neutrality. I292T and A469S were less frequent (0.156% and 0.0696%, respectively) but were also observed in homozygous form. All five variants were detected in both exome and genome subsets, although frequency differences between subsets were present (Figure 1a,b; Table S1a). For L533Ter, the pooled HWE departure reflected homozygote excess rather than depletion; within the large non-Finnish European group, 254 homozygotes were observed compared with approximately 230 expected (O/E approximately 1.11), with no significant HWE departure. This attenuation after ancestry stratification is consistent with a contribution from population mixture to the pooled deviation.
Figure 1.
Population genetic profiles of reported CWH43 variants: (a) Allele frequencies of L533Ter, K696fs, A626V, I292T, and A469S in Genome Aggregation Database (gnomAD) v4.1.1 exome and genome subsets. Primary estimates in the text and Table S1a are from the joint exome/genome call set. (b) Observed/expected (O/E) homozygote ratios calculated under Hardy–Weinberg equilibrium (HWE); the dashed line denotes O/E = 1. Ratios based on small expected counts are descriptive. (c) A626V allele frequencies across selected ancestry groups. AMR, Admixed American; AFR, African/African American; SAS, South Asian; NFE, non-Finnish European; Remaining, samples not assigned to one of the defined gnomAD v4 genetic ancestry groups. Ancestry-specific frequency and HWE results are provided in Table S1b. The orange bar highlights the Admixed American (AMR) ancestry group, in which 56 of the 57 pooled A626V homozygotes were observed; gray bars denote the other ancestry groups shown. (d) CWH43 gene-level constraint metrics, including loss-of-function (LoF) O/E, loss-of-function observed/expected upper-bound fraction (LOEUF), missense O/E, and probability of loss-of-function intolerance (pLI). Variant-level homozygote O/E in panel b and gene-level constraint O/E in panel d are distinct measures and do not directly measure iNPH penetrance. Points represent the gene-level observed/expected (O/E) estimates; the vertical interval for LoF O/E represents its 90% confidence interval, with the upper bound corresponding to LOEUF. The dashed horizontal line denotes O/E = 1.
A626V showed a marked pooled homozygote excess, with 57 observed homozygotes compared with approximately 1.74 expected under HWE (observed/expected ratio, 32.72). This pattern was strongly dependent on ancestry: 56 of the 57 homozygotes occurred in the Admixed American population, in which the allele frequency was 3.76%, and the observed/expected ratio within the ancestry group decreased to 1.33. Because allele frequencies differed markedly across ancestry groups, a single pooled HWE expectation did not adequately represent the genotype distribution within ancestry groups. Thus, the extreme pooled homozygote excess was markedly attenuated after ancestry stratification and was strongly influenced by population structure, rather than representing a uniform excess across ancestry groups (Figure 1c; Table S1a,b). Exact HWE testing showed departures in the pooled joint data for L533Ter and particularly A626V, whereas departures within ancestry groups were substantially attenuated; nominal deviations remained in some strata (Table S1a,b).
At the gene level, CWH43 showed little evidence of loss-of-function or missense constraint. The pLI was effectively zero, the loss-of-function observed/expected ratio at the gene level was 1.06 with an LOEUF of 1.26, and the missense observed/expected ratio was 1.04. These constraint metrics at the gene level are distinct from the homozygote O/E ratios for individual variants above. They do not support strong heterozygous loss-of-function depletion or a classic dominant haploinsufficiency model, in which loss of one functional gene copy is sufficient to cause disease. However, because these metrics primarily reflect population selection, they do not exclude clinically relevant late-onset or incompletely penetrant effects (Figure 1d; Table S1c).
Expected biallelic genotype frequencies involving L533Ter and K696fs varied across ancestry groups, ranging from approximately 1 in 1242 in non-Finnish Europeans to 1 in 33,227 in African/African American individuals among the populations displayed; the small Amish subgroup was tabulated separately (Figure S1a; Table S7).
Biallelic genotypes involving the two reported predicted truncating variants were also observed among FinnGen controls [7]. In total, 82 controls carried such genotypes, including 52 L533Ter homozygotes, 7 K696fs homozygotes, and 23 L533Ter/K696fs compound heterozygotes; none had a recorded hydrocephalus diagnosis at a median age of 63 years. This diagnosis-based observation is difficult to reconcile with a simple fully penetrant recessive phenotype presenting in early life or midlife. However, recorded diagnosis status is not equivalent to systematic absence of disease: these controls were not prospectively screened for iNPH, and the median age of 63 years limits inference about lifetime disease status. These data therefore do not provide a direct estimate of lifetime penetrance (Figure S1b; Table S7). Accordingly, these observations constrain a highly penetrant recessive interpretation but do not establish lifetime nonpenetrance and do not independently determine penetrance among heterozygous carriers.
3.2. Cross-Cohort Association for Carriage of Either L533Ter or K696fs
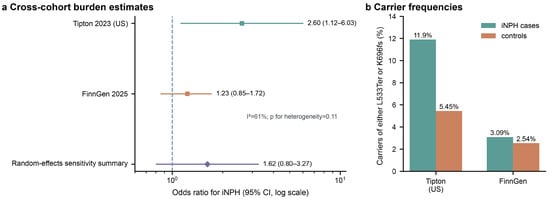
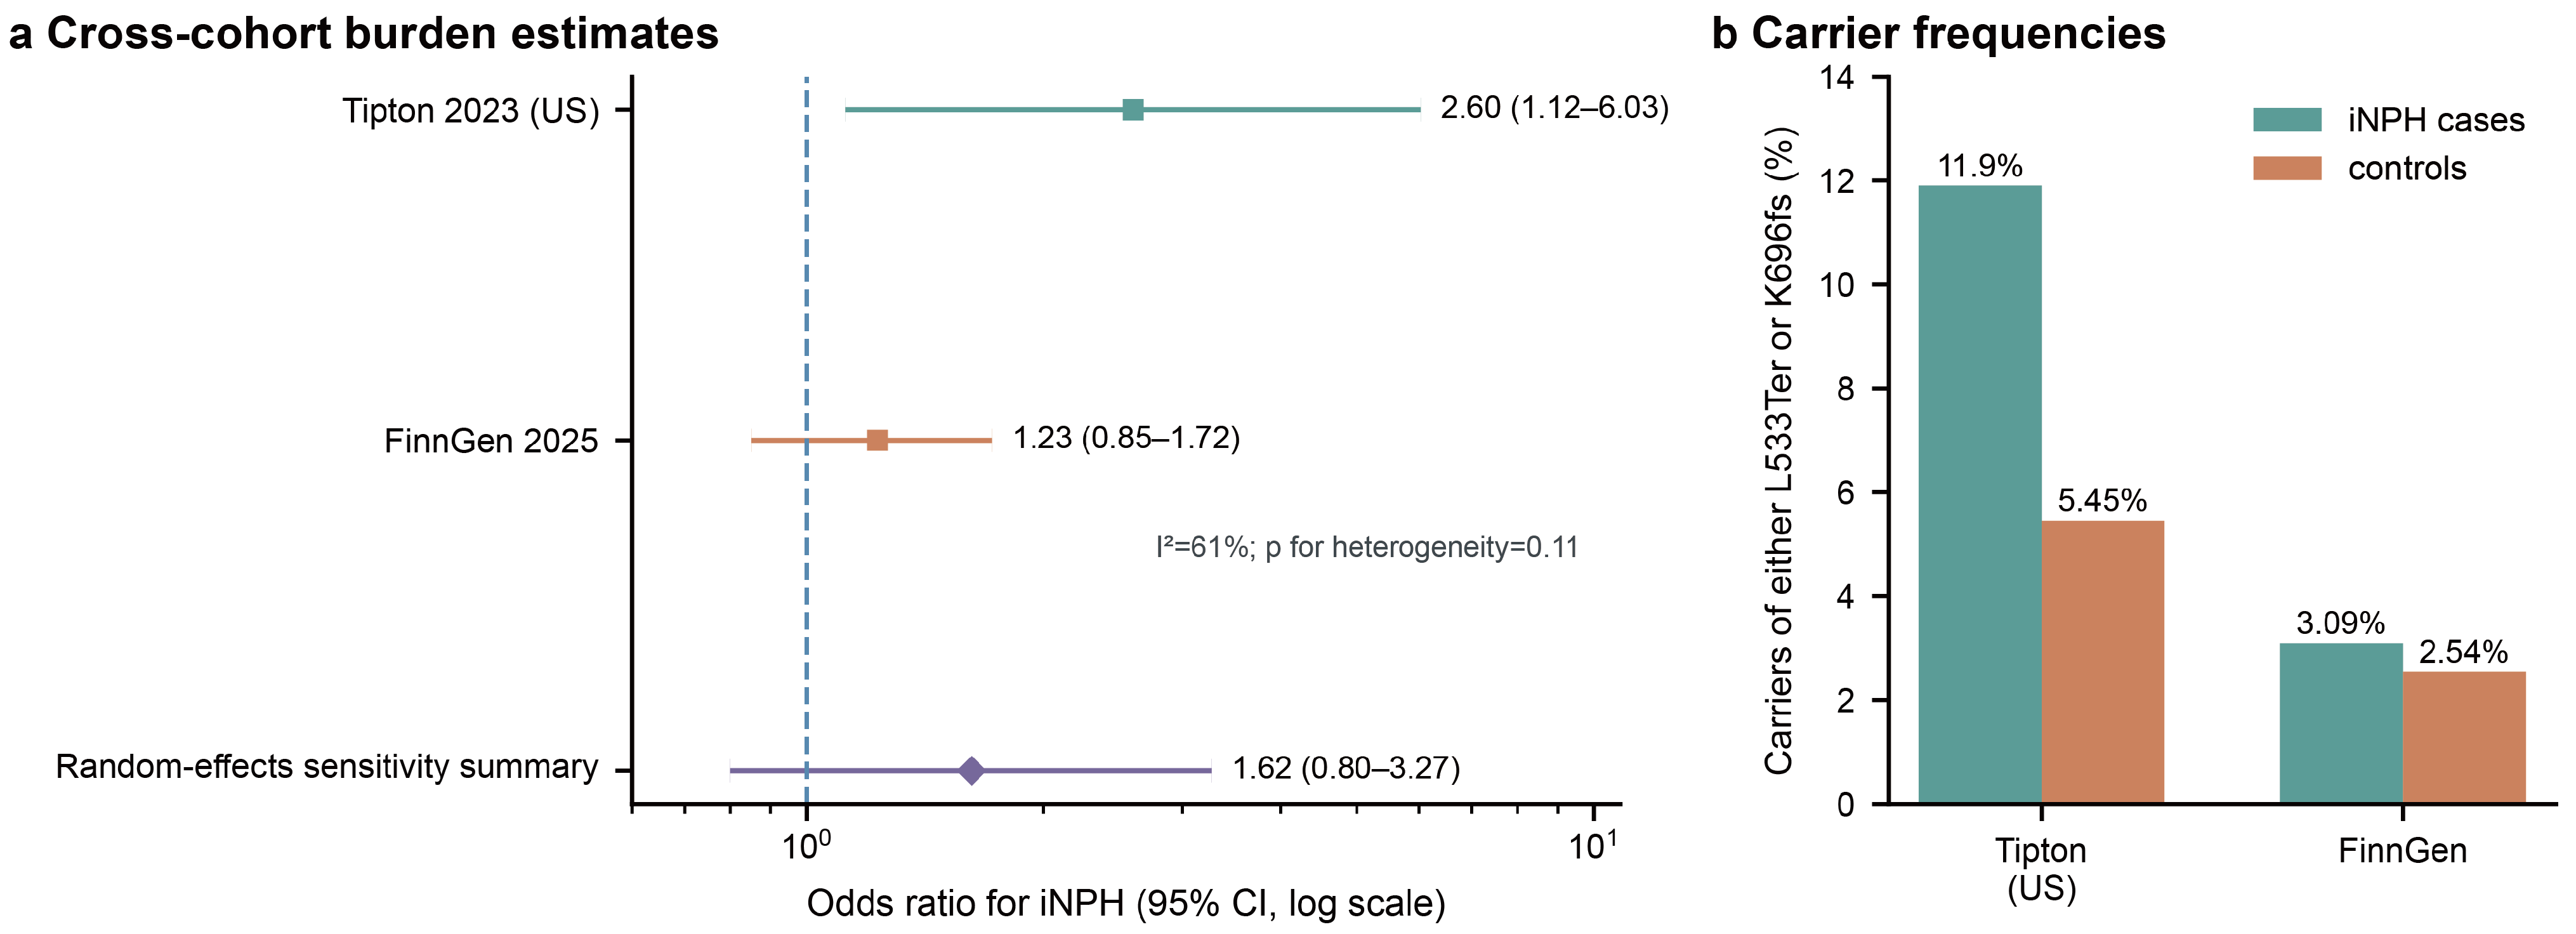
Cross-cohort analysis was restricted to the combined carrier burden defined as carriage of either L533Ter or K696fs. In the United States association cohort, 10 of 84 cases (11.9%) carried either variant compared with 29 of 532 controls (5.45%), corresponding to a reported odds ratio of 2.60 (95% CI 1.12–6.03; p = 0.027). In FinnGen, 35 of 1131 iNPH cases (3.09%) carried either variant compared with 12,572 of 495,400 controls (2.54%), with a reported odds ratio of 1.23 (95% CI 0.849–1.717; p = 0.219) [6,7]. Both point estimates were above 1, but their magnitude and statistical precision differed substantially between cohorts (Figure 2; Tables S2 and S3). Additional reported cohorts were retained as descriptive context but were not included as independent inputs to the random-effects summary because they lacked independent control groups or had potential dataset overlap (Table S2).
Figure 2.
Association of the combined carrier burden of either L533Ter or K696fs across cohorts. The combined carrier burden was defined as carriage of either L533Ter or K696fs; carriage of both variants was not required. (a) Forest plot of source-reported case–control odds ratios (ORs) in the United States cohort and FinnGen [6,7]. Squares represent cohort-specific OR estimates, horizontal lines indicate their 95% confidence intervals, and the diamond represents the DerSimonian–Laird random-effects sensitivity summary [16]. The dashed vertical line denotes OR = 1. The United States estimate was OR 2.60 (95% CI 1.12–6.03), and the FinnGen estimate was OR 1.23 (95% CI 0.849–1.717). The DerSimonian–Laird random-effects sensitivity summary was OR 1.62 (95% CI 0.80–3.27; I2 = 61%; p for heterogeneity = 0.11). The random-effects result is presented as a heterogeneity/sensitivity summary rather than as a precise common effect estimate. (b) Frequencies of carriers of either L533Ter or K696fs among cases and controls in the two cohorts. iNPH denotes idiopathic normal-pressure hydrocephalus. Colors are used for visual distinction and do not indicate statistical significance.
The DerSimonian–Laird random-effects sensitivity summary of the two source-reported case–control estimates was OR 1.62 (95% CI 0.80–3.27), with I2 = 61% and p for heterogeneity = 0.11. A secondary analysis using uniformly reconstructed crude 2 × 2 carrier counts yielded a similar random-effects summary (OR 1.54, 95% CI 0.84–2.84; I2 = 57.2%; p for heterogeneity = 0.126; Table S3). Thus, the two cohort-specific estimates were directionally positive but differed substantially in magnitude and precision. Because only two comparable estimates were available, the source models differed in covariate adjustment, and the summary confidence interval crossed 1, the pooled result is statistically imprecise and is presented only as an exploratory summary of direction and heterogeneity rather than as conclusive evidence of a common cross-cohort effect.
Variant-specific descriptive comparisons indicated that the combined carrier burden should not be interpreted as evidence of identical effects for L533Ter and K696fs. In the United States cohort, L533Ter was present in 8 of 84 cases and 22 of 532 controls, with a source-reported age- and sex-adjusted OR of 2.91 (95% CI 1.14–7.39), whereas K696fs was present in 2 of 84 cases and 7 of 532 controls, with an adjusted OR of 1.57 (95% CI 0.27–9.19). In FinnGen, L533Ter was observed in 29 of 1131 cases and 10,195 of 495,400 controls, whereas K696fs was observed in 6 of 1131 cases and 2401 of 495,400 controls. These variant-specific findings were descriptive and were not included in the random-effects summary; the combined carrier burden was retained for cross-cohort comparison because it provided the most directly comparable published carrier definition, not because the two variants were assumed to have equivalent effect sizes or molecular consequences.
3.3. Illustrative OR-to-Risk Translation
As an illustrative sensitivity analysis, the random-effects summary OR was translated across assumed baseline iNPH risks of 0.5–5% (Figure S2; Table S4). Because this translation depends on an imprecise summary estimate and assumed baseline risk, the resulting values are model-based illustrations rather than observed carrier incidence or directly measured penetrance.
3.4. Clinical and Radiologic Comparisons Across Cohorts
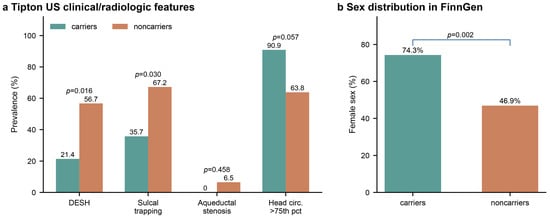
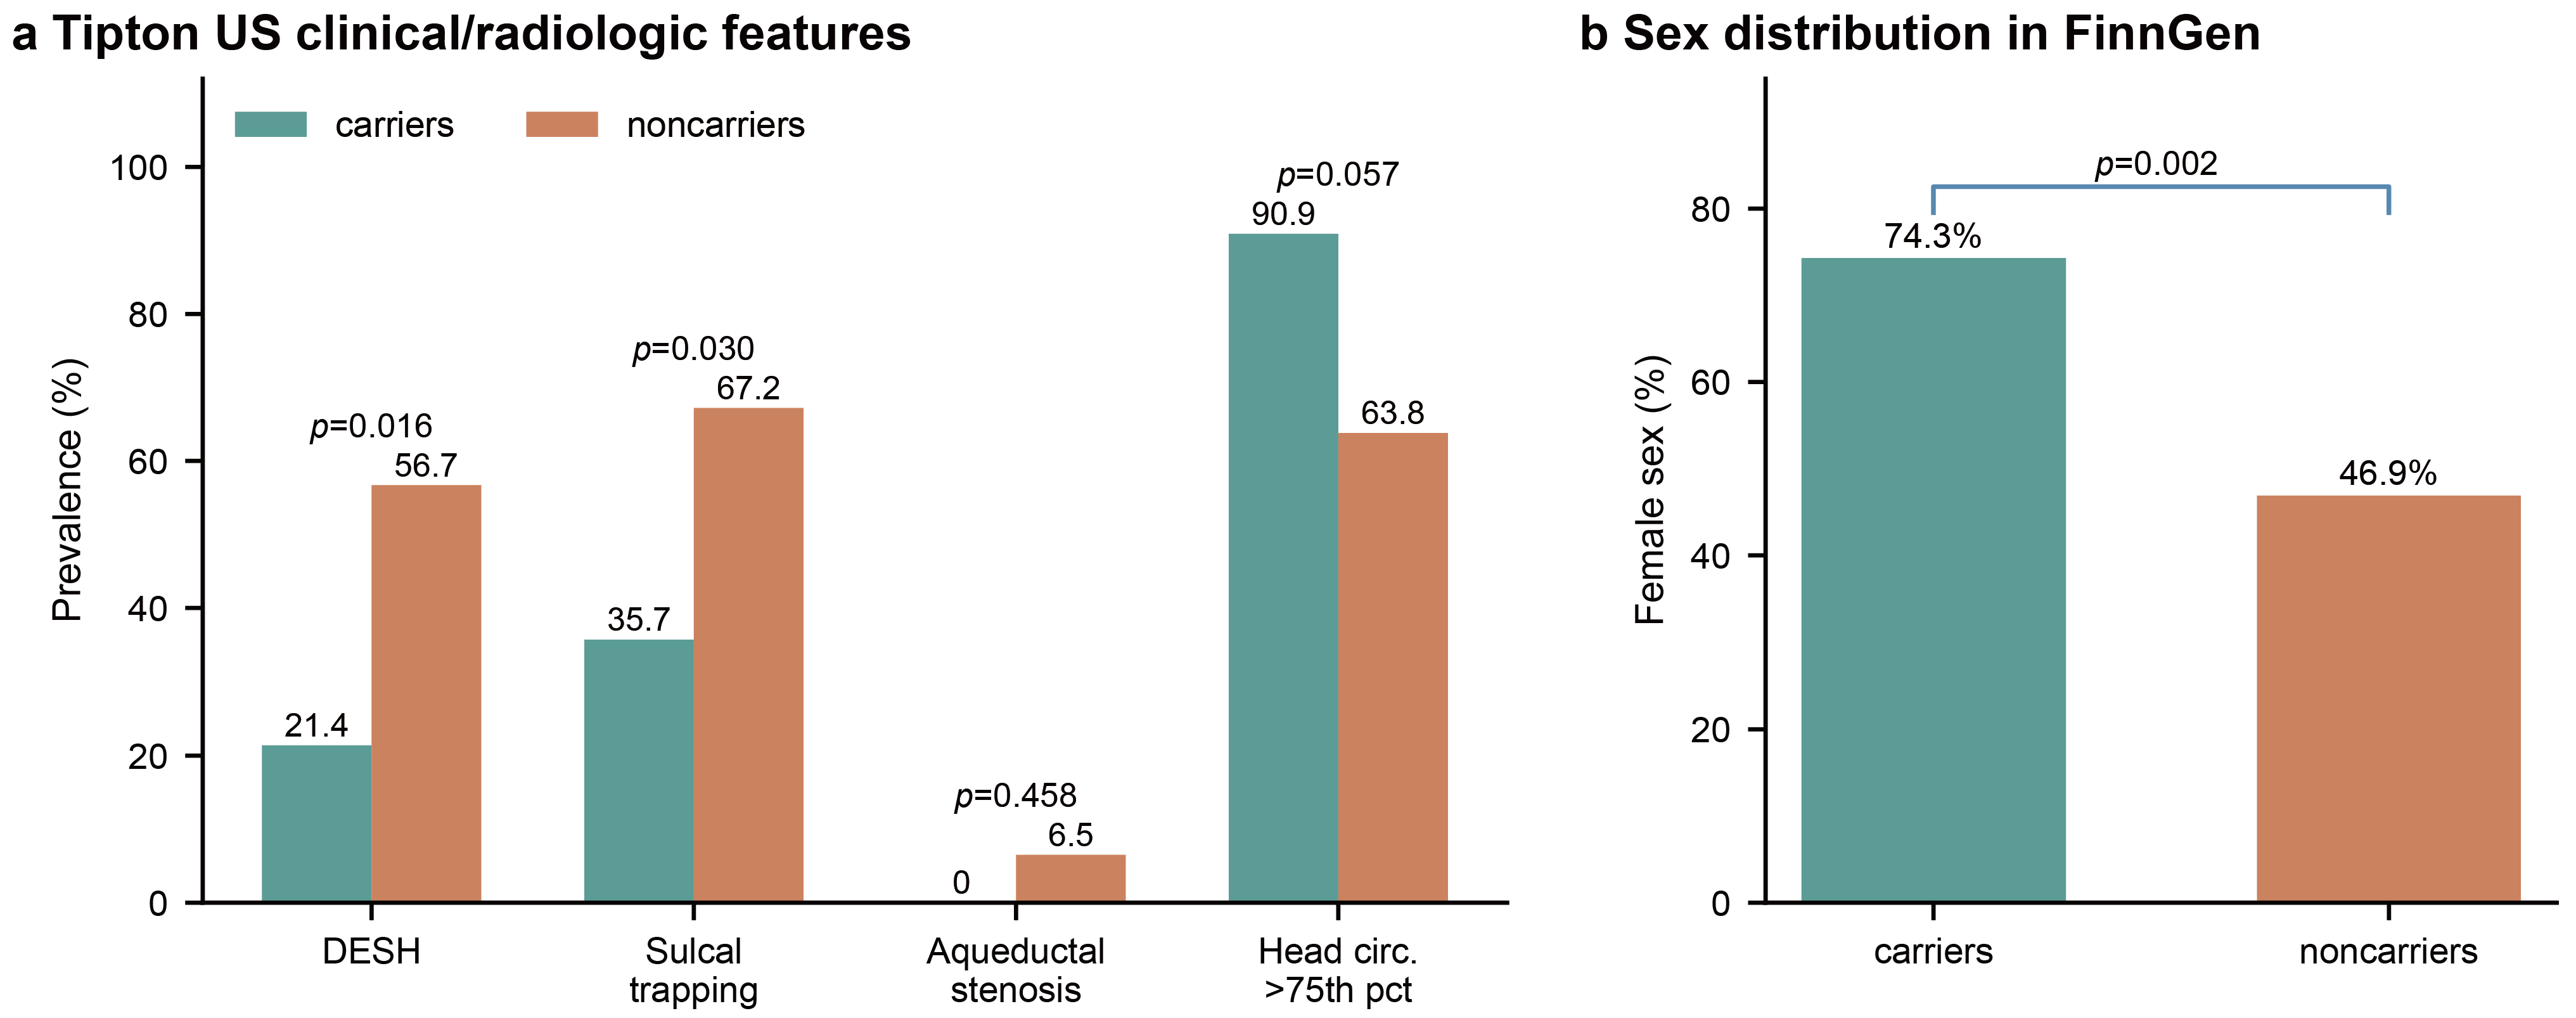
Clinical and radiologic associations varied across cohorts. In the United States clinical cohort, in which carrier status included any reported CWH43 coding variant, disproportionately enlarged subarachnoid space hydrocephalus (DESH) was present in 3 of 14 carriers (21.4%) compared with 38 of 67 noncarriers (56.7%; source Table 3 of the source publication [6] reports p = 0.016, whereas the narrative text reports a likelihood-ratio (LR) p value of 0.014.), and sulcal trapping was present in 5 of 14 carriers (35.7%) compared with 45 of 67 noncarriers (67.2%; p = 0.030). Head circumference above the 75th percentile was more frequent among carriers (10/11, 90.9%) than noncarriers (30/47, 63.8%), although the difference did not reach conventional statistical significance (p = 0.057). Aqueductal stenosis was uncommon in both groups (0/12 vs. 4/62; p = 0.458) (Figure 3a; Table S5) [6].
Figure 3.
Exploratory clinical and radiologic comparisons by CWH43 carrier status. (a) Selected clinical and radiologic features in the United States cohort. Carrier status in this analysis included reported CWH43 coding variants and therefore differs from the combined carrier-burden definition of carriage of either L533Ter or K696fs used in Figure 2. DESH and sulcal trapping differed between carriers and noncarriers, whereas aqueductal stenosis and head circumference above the 75th percentile did not meet conventional statistical significance. For DESH, Table 3 of the cited source publication [6] reports p = 0.016, and the narrative text reports a likelihood-ratio (LR) p value of 0.014. (b) Female sex frequencies among carriers and noncarriers in FinnGen. Clinical comparisons were exploratory and used cohort-specific carrier definitions. DESH, disproportionately enlarged subarachnoid space hydrocephalus; iNPH, idiopathic normal-pressure hydrocephalus. These source-reported comparisons were exploratory and were not subjected to new multiplicity correction; the sex-distribution difference observed in FinnGen was not reproduced in the Norwegian cohort.
Nordic cohorts did not show a consistent clinical pattern associated with carrier status. In Kuopio, mean age at onset was 67.6 years in carriers and 69.8 years in noncarriers (p = 0.165), while female sex showed a borderline difference reported in the source (77.8% vs. 52.4%; p = 0.052). In FinnGen, mean age at onset was similar between carriers and noncarriers (72.0 vs. 72.6 years; p = 0.528), whereas female sex was more frequent among carriers (74.3% vs. 46.9%; p = 0.002; Figure 3b). Female predominance was not observed among Norwegian carriers (37.5% vs. 49.7%; p = 0.444). Taken together, these exploratory findings were variable across cohorts and do not define a reproducible carrier-associated clinical pattern across the available datasets (Table S5). Other reported symptom and shunt response comparisons in the Nordic cohorts were also not statistically significant (Table S5) [7]. These comparisons were exploratory and were not subjected to new multiplicity correction; notably, the higher proportion of female carriers in FinnGen was not reproduced in the Norwegian cohort and therefore does not define a reproducible sex-dependent association.
3.5. Structural and Transcript Context and Integrated Interpretation
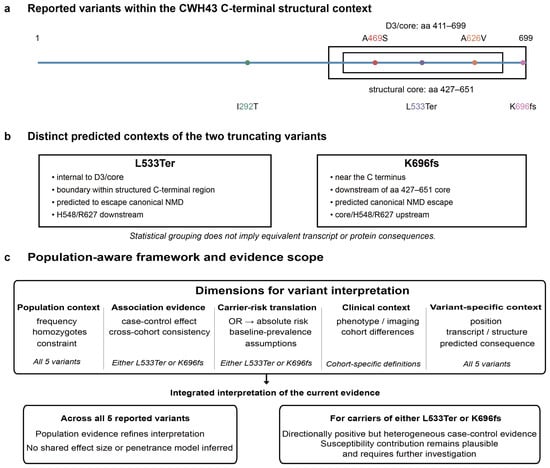
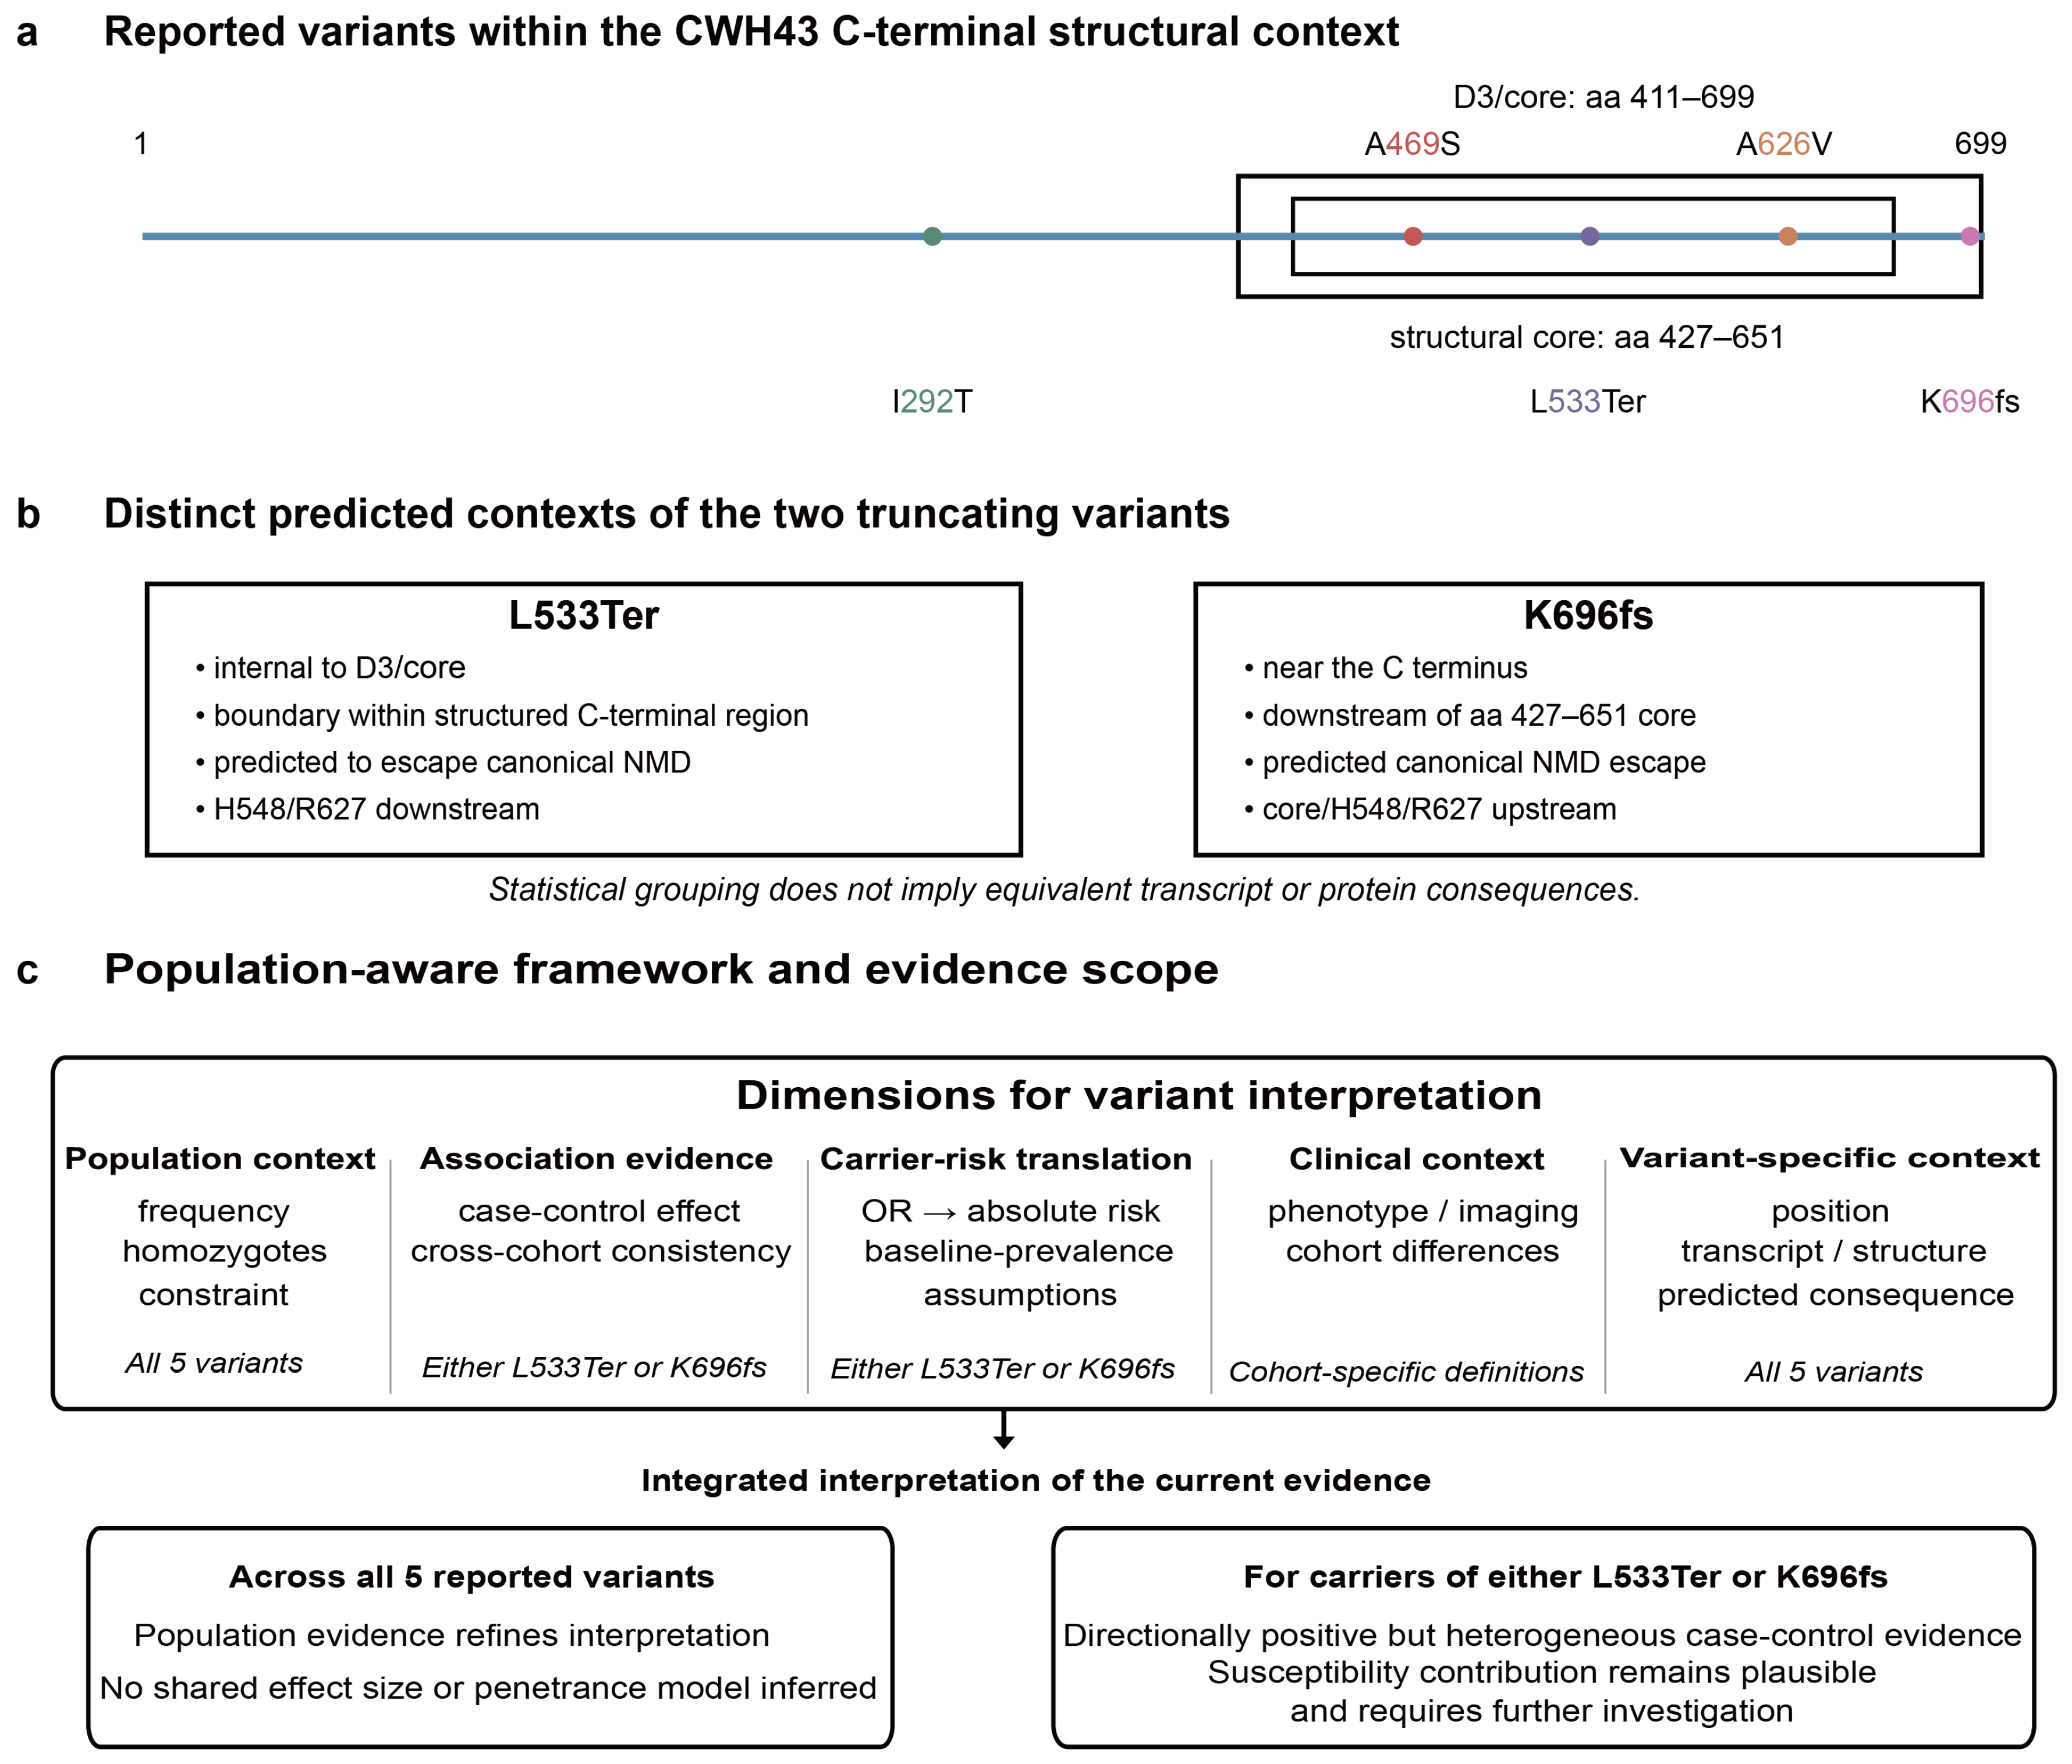
Among the reported missense variants, I292T lies outside the D3/core region, whereas A469S and A626V lie within it, with A626V positioned near the contextual residue R627 (Figure 4a; Table S6). Although L533Ter and K696fs were combined in the burden analyses, their predicted molecular consequences are not equivalent. In the structural annotation used here, the C-terminal D3/core region spans residues 411–699 and contains a structural core at residues 427–651. L533Ter lies within the D3/core region and is predicted to be sensitive to NMD; its truncation boundary is internal to the structured C-terminal region and lies upstream of the candidate residues H548 and R627. In contrast, K696fs occurs near the C-terminus, downstream of the defined core, and is predicted to escape canonical NMD, leaving the core and H548/R627 upstream of the frameshift. Thus, the two reported truncating variants share a statistical burden class but occupy distinct predicted transcript and structural contexts (Figure 4a,b; Table S6).
Figure 4.
Structural and transcript contexts and integrated interpretation of reported CWH43 variants. (a) Positions of the five previously reported variants relative to CWH43 protein architecture. The C-terminal D3/core annotation spans residues 411–699, with a structural core at residues 427–651. For the MANE Select transcript NM_025087.3/ENST00000226432.9, the approximate canonical nonsense-mediated decay (NMD) escape boundary is c.1971 (codon 657). Colored dots indicate the positions of the five reported CWH43 variants; colors are used only to distinguish individual variants and do not indicate statistical significance. Numbers 1 and 699 denote the N-terminal and C-terminal amino-acid positions, respectively, of the 699-residue CWH43 protein. (b) Distinct predicted transcript and structural contexts of L533Ter and K696fs. L533Ter lies within the D3/core region and is predicted to be NMD-sensitive, whereas K696fs occurs near the C-terminus, downstream of the structural core, and is predicted to escape canonical NMD. Statistical grouping of the two variants does not imply equivalent molecular consequences. (c) Population-aware framework and evidence scope. Variant interpretation incorporates population context, association evidence, carrier-risk translation, clinical context, and variant-specific context. Population and variant-specific analyses encompass all five reported variants; cross-cohort association and illustrative carrier-risk translation are restricted to carriage of either L533Ter or K696fs; clinical comparisons use cohort-specific carrier definitions. Across all five reported variants, population evidence refines interpretation without establishing a shared effect size or penetrance model. For carriers of either L533Ter or K696fs, case–control evidence is directionally positive but heterogeneous and statistically imprecise; a context-dependent susceptibility contribution remains plausible but requires further investigation. aa, amino acid residues.
Taken together, the population genetic analyses refine the interpretation of the five previously reported CWH43 variants but do not support assigning them a common effect size, penetrance model, or molecular consequence. For carriage of either L533Ter or K696fs specifically, population observations do not support a simple uniformly high-penetrance interpretation, while the biallelic observations specifically constrain a highly penetrant recessive model. The available case–control evidence is directionally positive but heterogeneous and statistically imprecise as a common cross-cohort effect. An incompletely penetrant, context-dependent susceptibility contribution therefore remains plausible but requires further investigation. The three reported missense variants provide population and positional context but were not included in the cross-cohort burden analysis. Structural placement and NMD predictions provide variant-specific context only and do not establish transcript fate, protein function, a validated catalytic mechanism, or disease mechanism (Figure 4c).
4. Discussion
The present study was designed to refine the genetic interpretation of previously reported CWH43 variants rather than to establish a new causal gene–disease relationship. For L533Ter and K696fs, the strongest conclusion from the integrated evidence is that appreciable population frequencies, no obvious homozygote depletion relative to HWE expectation, and limited gene-level loss-of-function constraint do not support a simple uniformly high-penetrance interpretation. The presence of biallelic genotypes among registry-defined controls more specifically constrains a highly penetrant recessive model. In contrast, the available case–control evidence is directionally positive but heterogeneous and statistically imprecise across cohorts; it therefore leaves an incompletely penetrant, context-dependent susceptibility contribution plausible, but does not establish a precise or statistically conclusive common cross-cohort effect. For I292T, A469S, and A626V, the available data provide population and molecular context but do not define a shared effect size or penetrance model.
Population genetic evidence and disease penetrance are related but distinct. Allele frequency, homozygote depletion, and gene-level constraint primarily reflect population selection rather than directly measuring clinical effect. This distinction is particularly important for iNPH because it is typically late-onset: a variant whose consequences emerge mainly after the major reproductive period may show little detectable negative selection despite contributing to late-life disease susceptibility. Conversely, the absence of a recorded diagnosis does not establish the absence of current or lifetime disease. Population data should therefore constrain plausible inheritance models rather than substitute for prospective penetrance measurement [9,10,11,12]. This is consistent with complex-disease susceptibility, in which variants can modify risk without behaving as deterministic high-penetrance alleles [20].
Experimental studies provide an important but distinct layer of evidence. The hydrocephalus-related phenotype observed in the orthologous Cwh43 Met533Ter mouse model, together with altered GPI-anchored protein trafficking following CWH43 disruption, supports the biological relevance of the gene [5]. However, experimental perturbation does not determine the penetrance or effect size of naturally occurring human variants. Differences in allelic consequence, genetic background, developmental timing, and experimental context can produce strong model-system phenotypes even when human population effects are moderate or incompletely penetrant. Conversely, heterogeneous human association estimates do not imply that CWH43 lacks biological function; the experimental and population evidence are therefore complementary rather than contradictory. These findings provide a plausible link to ventricular-interface biology, although the causal pathway from these cellular abnormalities to human iNPH remains unresolved.
The magnitude of the reported association varied substantially across cohorts. For carriage of either L533Ter or K696fs, the United States cohort showed an OR of 2.60 and FinnGen an OR of 1.23 [6,7]. Both cohort-specific point estimates were above 1, but the magnitude and statistical precision differed substantially. The difference should not be attributed to ancestry alone: the cohorts also differed in clinical ascertainment, diagnostic and control definitions, age structure, ancestry composition, genotyping approach, and covariate adjustment. The United States estimate was adjusted for age and sex, whereas no equivalent adjusted FinnGen odds-ratio model was available. The crude-count sensitivity analysis showed a similar overall direction, suggesting that the qualitative pattern was not solely dependent on the use of the source-reported adjusted estimates; however, other between-cohort design and confounding differences remain unresolved. Accordingly, the cohort-specific estimates are more informative than the two-study pooled value, which is retained only as an exploratory summary of direction and heterogeneity.
The heterozygous and biallelic observations address different genetic questions. Case–control enrichment of individuals carrying either L533Ter or K696fs informs the association between carrier status and iNPH, whereas homozygous and compound-heterozygous observations primarily test the plausibility of a highly penetrant recessive model. Eighty-two FinnGen controls carried biallelic genotypes involving L533Ter and K696fs, yet none had a recorded hydrocephalus diagnosis at a median age of 63 years [7]. This observation is difficult to reconcile with a fully penetrant recessive phenotype presenting in early life or midlife. However, FinnGen controls were defined by registry diagnoses rather than prospective neurologic and imaging screening for iNPH. Given the late onset and diagnostic heterogeneity of iNPH, individuals without a recorded diagnosis may include those who are presymptomatic, undiagnosed, or clinically misclassified. These observations therefore constrain a highly penetrant recessive interpretation but do not establish lifetime nonpenetrance and do not independently quantify penetrance among heterozygous carriers.
The available clinical and radiologic contrasts similarly point to heterogeneity rather than a reproducible carrier-associated pattern. United States carriers showed differences in DESH and sulcal trapping, whereas the strongest FinnGen clinical contrast involved sex distribution; neither pattern was consistently reproduced across the available cohorts [6,7]. Differences in referral pathways, diagnostic criteria, age structure, and imaging ascertainment may contribute to these differences between cohorts. The present data therefore do not support defining a reproducible carrier-associated clinical pattern across the available cohorts. These source-reported comparisons involved small carrier groups, used cohort-specific carrier definitions, and were not subjected to a harmonized multiplicity-adjusted analysis; the sex-distribution difference observed in FinnGen was not reproduced in the Norwegian cohort.
Structural and transcript context annotation provides context for why L533Ter and K696fs should not be assumed to have equivalent molecular consequences despite being grouped together statistically. L533Ter is a truncating variant within the D3/core region in a context predicted to be sensitive to NMD, whereas K696fs occurs near the C-terminus and is predicted to escape canonical NMD while leaving the 427–651 structural core upstream of the frameshift [18,19]. These NMD predictions are transcript-position based and apply to the specified MANE Select transcript; alternative transcript usage could modify the predicted consequences. The D3/core boundaries and candidate residues derive from the cited recent structural analysis and are used as positional annotations rather than independently validated biochemical domain boundaries or catalytic elements. Accordingly, the structural and transcript analyses do not establish experimentally measured transcript fate, protein function, or a common molecular mechanism linking CWH43 variation to iNPH.
A strength of this study is the integration of population frequency, ancestry, cross-cohort association, clinical phenotype, and variant-specific molecular context. Several limitations remain. gnomAD informs population distribution and selection rather than prospectively assessed iNPH status, and FinnGen controls were registry-defined rather than systematically screened neurologically and radiologically. Only two independent case–control estimates with comparable combined carrier definitions were available, and they differed in ascertainment, age structure, covariate adjustment, and other cohort characteristics; consequently, both the random-effects estimate and I2 are statistically imprecise. Combining L533Ter and K696fs may obscure variant-specific effects, and available data remain insufficient for stable cross-cohort estimation of each variant separately. The q2 biallelic-frequency calculations assume negligible cis co-occurrence and may be influenced by ancestry-specific linkage disequilibrium or haplotype structure in the absence of individual-level gnomAD phase data. Gene-level constraint metrics reflect population selection and cannot exclude clinically relevant late-onset or incompletely penetrant effects. The OR-to-risk analysis is assumption-dependent and is presented only as an illustrative translation, not observed incidence or measured penetrance. Clinical and radiologic comparisons were exploratory, used cohort-specific carrier definitions, involved small carrier groups, and were not subjected to a harmonized multiplicity-adjusted analysis. Structural placement and NMD annotations are predictive rather than experimental evidence of transcript fate or mechanism [18,19]. Future work requires harmonized cohorts across ancestries, prospective longitudinal genotype-phenotype assessment, and functional studies of individual variants.
The clinical relevance of these findings lies primarily in variant interpretation rather than immediate individual risk prediction. The present data do not support using carriage of a reported CWH43 variant alone as a deterministic diagnosis of iNPH or as a quantitative individual risk predictor. If such variants are identified clinically, their interpretation should consider age, ancestry, family history, phenotype, and other genetic or clinical context. Individual-level exposure data were not available consistently across the source cohorts and could not be modeled in this secondary analysis. At present, the results support caution against overinterpreting genotype alone while preserving CWH43 as a biologically plausible candidate for further prospective and mechanistic investigation.
5. Conclusions
Population-scale data substantially refine the interpretation of reported CWH43 variants in iNPH. For L533Ter and K696fs, appreciable population frequencies, no obvious homozygote depletion relative to HWE expectation, and limited gene-level loss-of-function constraint do not support a simple uniformly high-penetrance interpretation; the biallelic observations among registry-defined controls more specifically constrain a highly penetrant recessive model. Case–control estimates for carriage of either variant are directionally positive but differ substantially between cohorts, and the available two-study evidence does not establish a statistically conclusive common cross-cohort effect. An incompletely penetrant, context-dependent susceptibility contribution therefore remains plausible but requires confirmation in prospective, ancestry-diverse cohorts with harmonized phenotyping and variant-specific analyses. The three reported missense variants provide population and positional context but do not define a shared effect size or penetrance model. Statistical grouping of L533Ter and K696fs should likewise not be interpreted as evidence of equivalent molecular consequences.
Supplementary Materials
The following supporting information can be downloaded at https://www.mdpi.com/article/10.3390/genes17111365/s1: Table S1a: Population frequencies and homozygote observations for five reported CWH43 variants [9,13]; Table S1b: Ancestry-stratified frequencies of the five reported CWH43 variants [9,13]; Table S1c: Gene-level constraint metrics for CWH43 [9,13]; Table S2: Published cohort carrier counts, analysis roles, and cross-cohort comparability [5,6,7]; Table S3: Combined carrier-burden estimates, variant-specific descriptive comparisons, and cross-cohort heterogeneity/sensitivity analyses [6,7]; Table S4: Illustrative OR-to-risk translation for carriers of either L533Ter or K696fs across assumed baseline iNPH prevalences [6,7]; Table S5: Exploratory clinical and radiologic comparisons by CWH43 carrier status [6,7]; Table S6: Structural and transcript annotation of reported CWH43 variants [18,19]; Table S7: Expected and observed biallelic genotype analyses involving L533Ter and K696fs [7,9,13]; Figure S1: Expected and observed biallelic genotypes involving L533Ter and K696fs [7,9,13]; Figure S2: Illustrative OR-to-risk translation for carriers of either L533Ter or K696fs across assumed baseline iNPH prevalences [6,7].
Author Contributions
Conceptualization, D.Y.; methodology, J.W. and D.Y.; formal analysis, J.W. and D.Y.; validation, J.W. and D.Y.; investigation, J.W., Z.W., Z.Y., Y.L., Y.C. and H.C.; visualization, H.C. and D.Y.; writing—original draft preparation, J.W., H.C. and D.Y.; writing—review and editing, all authors; supervision, D.Y.; project administration, D.Y.; funding acquisition, H.C. and D.Y. All authors have read and agreed to the published version of the manuscript.
Funding
This research was funded by the National Natural Science Foundation of China, grant numbers 82171348 and 82571549 (to D.Y.), and the Research Foundation of Xuzhou Medical University (to H.C. and D.Y.). The funders had no role in study design, analysis, interpretation, or manuscript preparation.
Institutional Review Board Statement
Not applicable. This study was a secondary analysis of publicly available population data and published aggregate cohort-level data. No new participants were recruited, and no identifiable individual-level participant data were accessed. Ethics approvals for the source cohorts were reported in the original publications.
Informed Consent Statement
Not applicable. No new participants were recruited, and no identifiable individual-level participant data were accessed in the present secondary analysis. Consent procedures for the source cohorts were reported in the original publications.
Data Availability Statement
No individual participant-level data were generated or accessed in this study. Population data analyzed here are publicly available from gnomAD v4.1.1, and aggregate cohort data are available in the cited publications. Derived data supporting the analyses are provided in Tables S1a–c and S2–S7 and Figures S1 and S2. The reproducible calculation package, including locked analysis inputs, scripts, reference and generated outputs, independent HWE verification, and documentation, is available from the corresponding author upon reasonable request for purposes of reproducing or evaluating the reported analyses.
Acknowledgments
During the preparation of this manuscript, the authors used ChatGPT (OpenAI; GPT-5.6 Sol, 2026) to assist with English-language editing, sentence and paragraph restructuring, manuscript consistency checking, formatting of already verified references, and selected analytical verification/numerical consistency checks. All AI-assisted outputs were independently reviewed, edited, and verified by the authors, who take full responsibility for the content, analyses, interpretations, and conclusions of this work.
Conflicts of Interest
The authors declare no conflicts of interest.
References
- Carswell, C. Idiopathic normal pressure hydrocephalus: Historical context and a contemporary guide. Pract. Neurol. 2023, 23, 15–22. [Google Scholar] [CrossRef] [Scilit] [PubMed]
- Johnson, M.D.; Williams, M.A. Idiopathic normal-pressure hydrocephalus. N. Engl. J. Med. 2025, 393, 2243–2253. [Google Scholar] [CrossRef] [Scilit] [PubMed]
- Mehta, N.H.; Maury, E.A.; Buller, Z.; Duy, P.Q.; Fortes, C.; Alper, S.L.; Erson-Omay, E.Z. Genetics and molecular pathophysiology of normal pressure hydrocephalus. J. Neurosurg. 2025, 142, 346–352. [Google Scholar] [CrossRef] [Scilit] [PubMed]
- Piccinin, C.C.; Anis, S.; Yu, J.R.T.; Salles, P.A.; Chaparro-Solano, H.M.; Kundrick, A.; Ivary, S.; Liao, J.Y.; Nagel, S.J.; Mata, I.F. Genetic risk factors in normal pressure hydrocephalus: What we know and what is next. Mov. Disord. 2025, 40, 1233–1247. [Google Scholar] [CrossRef] [Scilit] [PubMed]
- Yang, H.W.; Lee, S.; Yang, D.; Dai, H.; Zhang, Y.; Han, L.; Zhao, S.; Zhang, S.; Ma, Y.; Johnson, M.F.; et al. Deletions in CWH43 cause idiopathic normal pressure hydrocephalus. EMBO Mol. Med. 2021, 13, e13249. [Google Scholar] [CrossRef] [Scilit] [PubMed]
- Tipton, P.W.; Atik, M.; Soto-Beasley, A.I.; Day, G.S.; Grewal, S.S.; Chaichana, K.; Fermo, O.P.; Ball, C.T.; Heckman, M.G.; White, L.J.; et al. CWH43 variants are associated with disease risk and clinical phenotypic measures in patients with normal pressure hydrocephalus. Neurol. Genet. 2023, 9, e200086. [Google Scholar] [CrossRef] [Scilit] [PubMed]
- Räsänen, J.; Helisalmi, S.; Heikkinen, S.; Raivo, J.; Korhonen, V.E.; Martiskainen, H.; Junkkari, A.; Grenier-Boley, B.; Bellenguez, C.; Oinas, M.; et al. Low prevalence of CWH43 variants among Finnish and Norwegian idiopathic normal pressure hydrocephalus patients: A cohort-based observational study. Fluids Barriers CNS 2025, 22, 17. [Google Scholar] [CrossRef] [Scilit] [PubMed]
- Räsänen, J.; Heikkinen, S.; Mäklin, K.; Lipponen, A.; Kuulasmaa, T.; Mehtonen, J.; Korhonen, V.E.; Junkkari, A.; Grenier-Boley, B.; Bellenguez, C.; et al. Risk variants associated with normal pressure hydrocephalus: Genome-wide association study in the FinnGen cohort. Neurology 2024, 103, e209694. [Google Scholar] [CrossRef] [Scilit] [PubMed]
- Karczewski, K.J.; Francioli, L.C.; Tiao, G.; Cummings, B.B.; Alföldi, J.; Wang, Q.; Collins, R.L.; Laricchia, K.M.; Ganna, A.; Birnbaum, D.P.; et al. The mutational constraint spectrum quantified from variation in 141,456 humans. Nature 2020, 581, 434–443, Correction in Nature 2021, 590, E53. https://doi.org/10.1038/s41586-020-03174-8. [Google Scholar] [CrossRef] [Scilit] [PubMed]
- Cooper, D.N.; Krawczak, M.; Polychronakos, C.; Tyler-Smith, C.; Kehrer-Sawatzki, H. Where genotype is not predictive of phenotype: Towards an understanding of the molecular basis of reduced penetrance in human inherited disease. Hum. Genet. 2013, 132, 1077–1130. [Google Scholar] [CrossRef] [Scilit] [PubMed]
- Richards, S.; Aziz, N.; Bale, S.; Bick, D.; Das, S.; Gastier-Foster, J.; Grody, W.W.; Hegde, M.; Lyon, E.; Spector, E.; et al. Standards and guidelines for the interpretation of sequence variants: A joint consensus recommendation of the American College of Medical Genetics and Genomics and the Association for Molecular Pathology. Genet. Med. 2015, 17, 405–424. [Google Scholar] [CrossRef] [Scilit] [PubMed]
- Whiffin, N.; Minikel, E.; Walsh, R.; O’Donnell-Luria, A.H.; Karczewski, K.J.; Ing, A.Y.; Barton, P.J.R.; Funke, B.; Cook, S.A.; MacArthur, D.; et al. Using high-resolution variant frequencies to empower clinical genome interpretation. Genet. Med. 2017, 19, 1151–1158. [Google Scholar] [CrossRef] [Scilit] [PubMed]
- Chen, S.; Francioli, L.C.; Goodrich, J.K.; Collins, R.L.; Kanai, M.; Wang, Q.; Alföldi, J.; Watts, N.A.; Vittal, C.; Gauthier, L.D.; et al. A genomic mutational constraint map using variation in 76,156 human genomes. Nature 2024, 625, 92–100, Correction in Nature 2024, 626, E1. https://doi.org/10.1038/s41586-024-07050-7. [Google Scholar] [CrossRef] [Scilit] [PubMed]
- Morales, J.; Pujar, S.; Loveland, J.E.; Astashyn, A.; Bennett, R.; Berry, A.; Cox, E.; Davidson, C.; Ermolaeva, O.; Farrell, C.M.; et al. A joint NCBI and EMBL-EBI transcript set for clinical genomics and research. Nature 2022, 604, 310–315. [Google Scholar] [CrossRef] [Scilit] [PubMed]
- Wigginton, J.E.; Cutler, D.J.; Abecasis, G.R. A note on exact tests of Hardy–Weinberg equilibrium. Am. J. Hum. Genet. 2005, 76, 887–893. [Google Scholar] [CrossRef] [Scilit] [PubMed]
- DerSimonian, R.; Laird, N. Meta-analysis in clinical trials. Control. Clin. Trials 1986, 7, 177–188. [Google Scholar] [CrossRef] [Scilit] [PubMed]
- Higgins, J.P.T.; Thompson, S.G.; Deeks, J.J.; Altman, D.G. Measuring inconsistency in meta-analyses. BMJ 2003, 327, 557–560. [Google Scholar] [CrossRef] [Scilit] [PubMed]
- Cao, H.; Yan, Z.; Wang, J.; Liu, Y.; Wei, Z.; Cheng, Y.; Hu, S.; Yang, D. Structure-guided reinterpretation of a disease-associated CWH43 residue-533 truncation identifies internal disruption of a conserved C-terminal module in idiopathic normal pressure hydrocephalus. bioRxiv 2026. [Google Scholar] [CrossRef] [Scilit]
- Kurosaki, T.; Popp, M.W.; Maquat, L.E. Quality and quantity control of gene expression by nonsense-mediated mRNA decay. Nat. Rev. Mol. Cell Biol. 2019, 20, 406–420, Correction in Nat. Rev. Mol. Cell Biol. 2019, 20, 384. https://doi.org/10.1038/s41580-019-0138-y. [Google Scholar] [CrossRef] [Scilit] [PubMed]
- Manolio, T.A.; Collins, F.S.; Cox, N.J.; Goldstein, D.B.; Hindorff, L.A.; Hunter, D.J.; McCarthy, M.I.; Ramos, E.M.; Cardon, L.R.; Chakravarti, A.; et al. Finding the missing heritability of complex diseases. Nature 2009, 461, 747–753. [Google Scholar] [CrossRef] [Scilit] [PubMed]
Disclaimer/Publisher’s Note: The statements, opinions and data contained in all publications are solely those of the individual author(s) and contributor(s) and not of MDPI and/or the editor(s). MDPI and/or the editor(s) disclaim responsibility for any injury to people or property resulting from any ideas, methods, instructions or products referred to in the content. |
© 2026 by the authors. Licensee MDPI, Basel, Switzerland. This article is an open access article distributed under the terms and conditions of the Creative Commons Attribution (CC BY) license.