


Abstract
Background: Mitochondrial and chloroplast genomes in plants have experienced distinct evolutionary trajectories due to differences in genomic organization, functional constraints, and genome maintenance mechanisms. However, comparative studies of their evolutionary dynamics in oaks remain limited. Methods: The complete mitochondrial and chloroplast genomes of Quercus arbutifolia were assembled and annotated using PacBio HiFi reads. Genome structure, repetitive sequences, codon usage, and mitochondrial plastid DNA transfers (MTPTs) were characterized. Evolutionary genomic and phylogenetic analyses were conducted across selected Quercus species to assess structural variation, sequence divergence, and phylogenetic relationships. Results: The mitochondrial genome of Q. arbutifolia was assembled as a 493,735 bp linear molecule, whereas the chloroplast genome was assembled as a 160,682 bp circular molecule. The mitochondrial genome exhibited lower coding density and a higher abundance of repetitive sequences than the chloroplast genome. Both organellar genomes preferentially used A/U-ending codons, with codon usage variation associated with mutation bias and selective constraints. Thirty-two MTPT regions were identified, predominantly representing plastid-to-mitochondrial transfers. Chloroplast genomes showed conserved inverted repeat boundaries among Quercus species, whereas mitochondrial genomes displayed extensive structural rearrangements, indicating contrasting evolutionary dynamics between the two organellar genomes. Nucleotide diversity analyses further revealed different sequence variation between organellar genomes, with chloroplast protein-coding genes (PCGs) generally exhibiting higher sequence divergence than mitochondrial PCGs. Phylogenetic analyses recovered largely consistent relationships among major Quercus lineages, with several lineage-specific conflicts. Conclusions: Overall, the mitochondrial and chloroplast genomes of Q. arbutifolia exhibit contrasting patterns of genome structure and sequence evolution. Their largely congruent but partially conflicting phylogenetic signals provide complementary information for investigating organellar genome evolution and diversification in Quercus.
1. Introduction
Plant organellar genomes, including mitochondrial and chloroplast genomes, provide valuable resources for investigating genome evolution, phylogenetic relationships, and adaptive diversification in plants [1,2,3]. Both organellar genomes originated from ancient endosymbiotic events and retained semi-autonomous genetic systems during the evolution of eukaryotic cells [4,5]. However, after their establishment in land plants, mitochondrial and chloroplast genomes have undergone strikingly different evolutionary trajectories [6]. Chloroplast genomes are generally characterized by highly conserved gene content and relatively stable genome structures, typically maintaining a circular quadripartite architecture consisting of a large single-copy region (LSC), a small single-copy region (SSC), and two inverted repeats (IRs) [7,8]. In contrast, plant mitochondrial genomes exhibit remarkable diversity in genome size, genome organization, non-coding sequence composition, and structural rearrangements [9,10]. Despite their extensive structural variation, plant mitochondrial genomes generally evolve much more slowly than chloroplast genomes at the sequence level. In seed plants, mitochondrial synonymous substitution rates are typically only one-third to one-ninth of those observed in chloroplast genomes [6,11,12]. This apparent contradiction, characterized by rapid structural evolution but slow sequence evolution, represents a central question in plant mitochondrial genome evolution [2].
The conserved features of the chloroplast genome have made its widespread application in plant phylogenetic reconstruction, species identification, and evolutionary studies [13,14]. However, investigations of plant mitochondrial genomes have historically lagged behind chloroplast genome studies because of the challenges associated with mitochondrial genome assembly [2,15]. Plant mitochondrial genomes often contain abundant repetitive sequences, complex rearrangement patterns, heterogeneous structures, and large amounts of foreign DNA, making complete reconstruction difficult using traditional short-read sequencing approaches [2,16,17]. Recent advances in long-read sequencing technologies, especially PacBio HiFi sequencing, have greatly improved the reconstruction of complex mitochondrial genomes by generating highly accurate reads capable of resolving repetitive regions and structural variations [18,19,20]. These approaches have enabled more comprehensive characterization of mitochondrial genome architecture and provided new opportunities to investigate the mechanisms shaping mitochondrial genome diversification.
Beyond investigating mitochondrial genomes alone, comparisons between mitochondrial and chloroplast genomes within the same evolutionary lineage provide an important framework for understanding asymmetric evolutionary patterns among plant organellar genomes [21,22]. Differences in genome structure, evolutionary rates, and sequence divergence between these two organellar genomes may reflect distinct evolutionary constraints and molecular mechanisms [23,24,25]. However, integrated analyses of mitochondrial and chloroplast genomes remain relatively limited, particularly in woody plant lineages, where comprehensive evaluations of organellar genome evolution are still lacking.
The family Fagaceae represents an important lineage of woody angiosperms, comprising economically and ecologically significant taxa distributed throughout the Northern Hemisphere [26,27]. Within Fagaceae, the genus Quercus (oaks) is one of the most species-rich and evolutionarily complex groups, characterized by extensive morphological variation, rapid diversification, and frequent historical introgression [28,29,30]. Previous phylogenetic studies based on nuclear and chloroplast markers have revealed complex evolutionary histories in Quercus, including lineage divergence, hybridization, and chloroplast capture events [31,32,33]. However, compared with nuclear and chloroplast genomes, mitochondrial genomes of Quercus remain poorly characterized, limiting our understanding of organellar genome evolution and the evolutionary processes shaping oak diversification [9,34,35].
Quercus arbutifolia is an evergreen oak species endemic to subtropical regions of East Asia distributed exclusively within highly fragmented montane cloud forests (MCFs) at elevations between 1000 and 2000 m [36,37]. Despite its ecological and evolutionary significance, genomic resources for this species remain limited, particularly regarding its mitochondrial genome. In this study, we assembled and characterized the complete mitochondrial and chloroplast genomes of Q. arbutifolia using PacBio HiFi sequencing. We performed comprehensive analyses focusing on genome structure, gene content, repetitive sequence landscapes, mitochondrial plastid DNA transfer, sequence divergence, and phylogenetic relationships between mitochondrial and chloroplast genomes. By integrating mitochondrial and chloroplast genomic data, this study aims to (1) characterize the structural organization, gene content, and evolutionary patterns of the two organellar genomes in Q. arbutifolia; (2) investigate the genomic factors contributing to mitochondrial genome complexity and structural diversification, including repetitive sequence accumulation and foreign DNA acquisition; and (3) compare evolutionary rates and phylogenetic signals between mitochondrial and chloroplast genomes to better understand organellar genome evolution within Quercus. This work advances our understanding of asymmetric evolutionary processes between mitochondrial and chloroplast genomes and provides valuable genomic resources for future comparative and evolutionary studies of Fagaceae.
2. Materials and Methods
2.1. Leaf Sampling and DNA Sequencing
Fresh and healthy leaves of Q. arbutifolia were collected from natural populations, and then cryopreserved using liquid nitrogen. Voucher specimens were deposited in the Chenshan Herbarium (CSH) at Shanghai Chenshan Botanical Garden for future reference. Genome DNA was extracted using an optimized cetyltrimethylammonium bromide (CTAB) method [38]. DNA quality was evaluated by electrophoresis on 0.75% agarose gels to assess fragment size and degradation. DNA purity was measured using a NanoDrop One spectrophotometer (Thermo Fisher Scientific, Waltham, MA, USA), and DNA concentration was accurately quantified using a Qubit 3.0 fluorometer (Life Technologies, Carlsbad, CA, USA).
For long-read sequencing, PCR-free SMRTbell libraries were constructed following PacBio standard protocols. The prepared libraries were sequenced on the PacBio Revio platform (Pacific Biosciences, Menlo Park, CA, USA) using single-molecule real-time (SMRT) sequencing technology. Raw sequencing data were generated in BAM format (subreads.bam). Low-quality reads were filtered out, and high-fidelity circular consensus sequencing (HiFi) reads were retained as clean data for subsequent organellar genome assembly.
2.2. Organellar Genome Assembly and Annotation
High-quality PacBio HiFi reads were used for the simultaneous assembly of the organellar genomes using HiMT v1.1.0 with default parameters [39]. Assembly completeness and structural integrity were evaluated based on read coverage consistency and assembly continuity. The mitochondrial and chloroplast genomes were annotated using PMGA v1.0 (http://www.1kmpg.cn/pmga/, accessed on 27 July 2026) and GeSeq v2.03 (https://chlorobox.mpimp-golm.mpg.de/geseq.html, accessed on 18 December 2025), respectively, and the resulting annotations were manually inspected and curated to ensure accuracy [40,41]. The genome maps of both organellar genomes were generated using OGDRAW v1.3.1 (https://chlorobox.mpimp-golm.mpg.de/OGDraw.html, accessed on 18 December 2025) [42].
2.3. Sequence-Based Descriptive Analyses
Basic genome features of both organellar genomes, including genome size, GC content, gene content, and gene category composition, were summarized using the platform JSHYCloud (http://cloud.genepioneer.com:9929, accessed on 27 July 2026). Identical parameter settings were applied to both organellar genomes for all repeat sequence analyses. Simple sequence repeats (SSRs) were identified using the MISA v2.1 perl script (https://webblast.ipk-gatersleben.de/misa/, accessed on 18 December 2025), with minimum repeat thresholds of 10, 5, 4, and 3 for mono-, di-, tri-, and tetra- to hexanucleotide repeats [43]. Tandem repeats were detected using Tandem Repeats Finder (TRF) v4.09 (https://tandem.bu.edu/trf/home, accessed on 18 December 2025) with standard parameters: match = 2, mismatch = 7, indels = 7, minimum alignment score = 50, and maximum period size = 500 [44]. Long repeats, including forward and palindromic repeats, were identified using Vmatch v2.3.1, with a minimum repeat length of 30 bp and a hamming distance of 3 [45]. Protein-coding genes (PCGs) from both organellar genomes were extracted for codon usage analysis. Codon usage bias was evaluated by calculating relative synonymous codon usage (RSCU), GC content at the first, second, and third codon positions (GC1, GC2, and GC3), and the effective number of codons (ENc) using CodonW v1.4.2 [46].
2.4. Mitochondrial Plastid DNA Transfer Analysis
To identify potential mitochondrial plastid DNA transfer events (MTPTs), the “transgenomes” R package v1.0 (https://github.com/Mordziarz/transgenomes, accessed on 1 September 2026) was used to detect and visualize homologous transfer events between the mitochondrial and chloroplast genomes of Q. arbutifolia [47]. The transfer_function() function was applied to perform BLASTN v2.17.0 comparisons between mitochondrial and chloroplast genomes, with BED annotation files incorporated for functional gene mapping. Significant homologous regions were retained using the following criteria: e-value ≤ 1 × 10⁻⁵, minimum length ≥ 50 bp, and sequence identity ≥ 80%. The extract_regions() and analyze_GC_content() functions enabled sequence extraction and statistical comparison of GC content between transfer groups. All statistical tests were performed with significance set at α = 0.05.
2.5. Evolutionary Genomic Analyses
Comparative genomics analyses were performed by aligning the organellar genomes of Q. arbutifolia with published sequences from related Quercus species (Table S1). Reference organellar genomes were selected according to the following criteria: (1) only species with available complete mitochondrial and chloroplast genomes were included; (2) when multiple mitochondrial genomes were available for the same species, the assembly with the largest genome size was preferentially selected to maximize the representation of mitochondrial genomic regions; and (3) when multiple chloroplast genomes were available for the same species, accessions beginning with “NC” were preferentially selected because these records generally correspond to complete RefSeq genomic entries with standardized annotation. To ensure consistency in gene annotation and minimize potential annotation discrepancies among published organellar genomes, all selected mitochondrial and chloroplast genomes were re-annotated using the same annotation pipeline prior to comparative analyses, particularly for sequences lacking complete or standardized annotations.
For mitochondrial genomes, whole-genome alignments and collinearity analyses were conducted using NGenomeSyn v1.41 to identify conserved syntenic blocks, genomic rearrangements, and inversion events, thereby assessing structural variation and evolutionary dynamics among Quercus mitochondrial genomes [48]. For chloroplast genomes, structural variations were evaluated by analyzing IR expansion and contraction patterns using CPJSdraw v1.0, with particular emphasis on the boundary regions between the single-copy regions (LSC and SSC) and IR regions [49]. To investigate evolutionary divergence patterns among organellar genes, nucleotide diversity (π) values for individual genes were calculated using CPStools v3.0 to identify genomic regions with elevated sequence variation across Quercus species [50].
2.6. Phylogenetic Analyses of Quercus
To reconstruct the phylogenetic relationships among the selected Quercus species, Fagus sylvatica was selected as outgroup for phylogenetic reconstruction (Table S1). Only shared PCGs present in all sampled taxa were retained for downstream phylogenetic analyses. The shared mitochondrial PCGs included atp1, atp6, atp8, atp9, ccmB, ccmC, ccmFC, ccmFN, cox1, cox2, cox3, mttB, nad1, nad2, nad4, nad5, nad6, nad7, nad9, rpl10, rpl16, rps19, rps3, rps4, sdh3, sdh4. However, the shared chloroplast PCGs include all 79 unique PCGs. The nucleotide sequences of each shared PCG were aligned independently using MAFFT v7.487 with the auto strategy [51]. The resulting alignments were subsequently filtered using trimAl v1.4 with the automated1 option to remove poorly aligned regions and ambiguous sites [52]. The filtered single-gene alignments were concatenated into a supermatrix, and gene-specific partition files were generated simultaneously for partitioned phylogenetic inference. Maximum likelihood (ML) phylogenetic analyses were conducted using IQ-Tree v3.0.1 [53]. The best-fit substitution models for each partition were selected automatically using ModelFinder based on the Bayesian Information Criterion (BIC). Branch support values were assessed using 1000 ultrafast bootstrap replicates and 1000 SH-aLRT replicates. The resulting phylogenetic trees were visualized and manually optimized using FigTree v1.4.4.
3. Results
3.1. General Features of Organellar Genomes
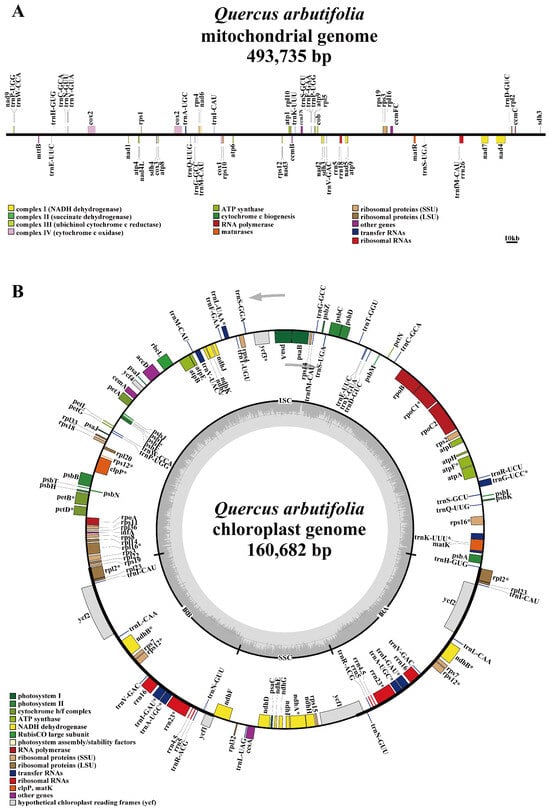
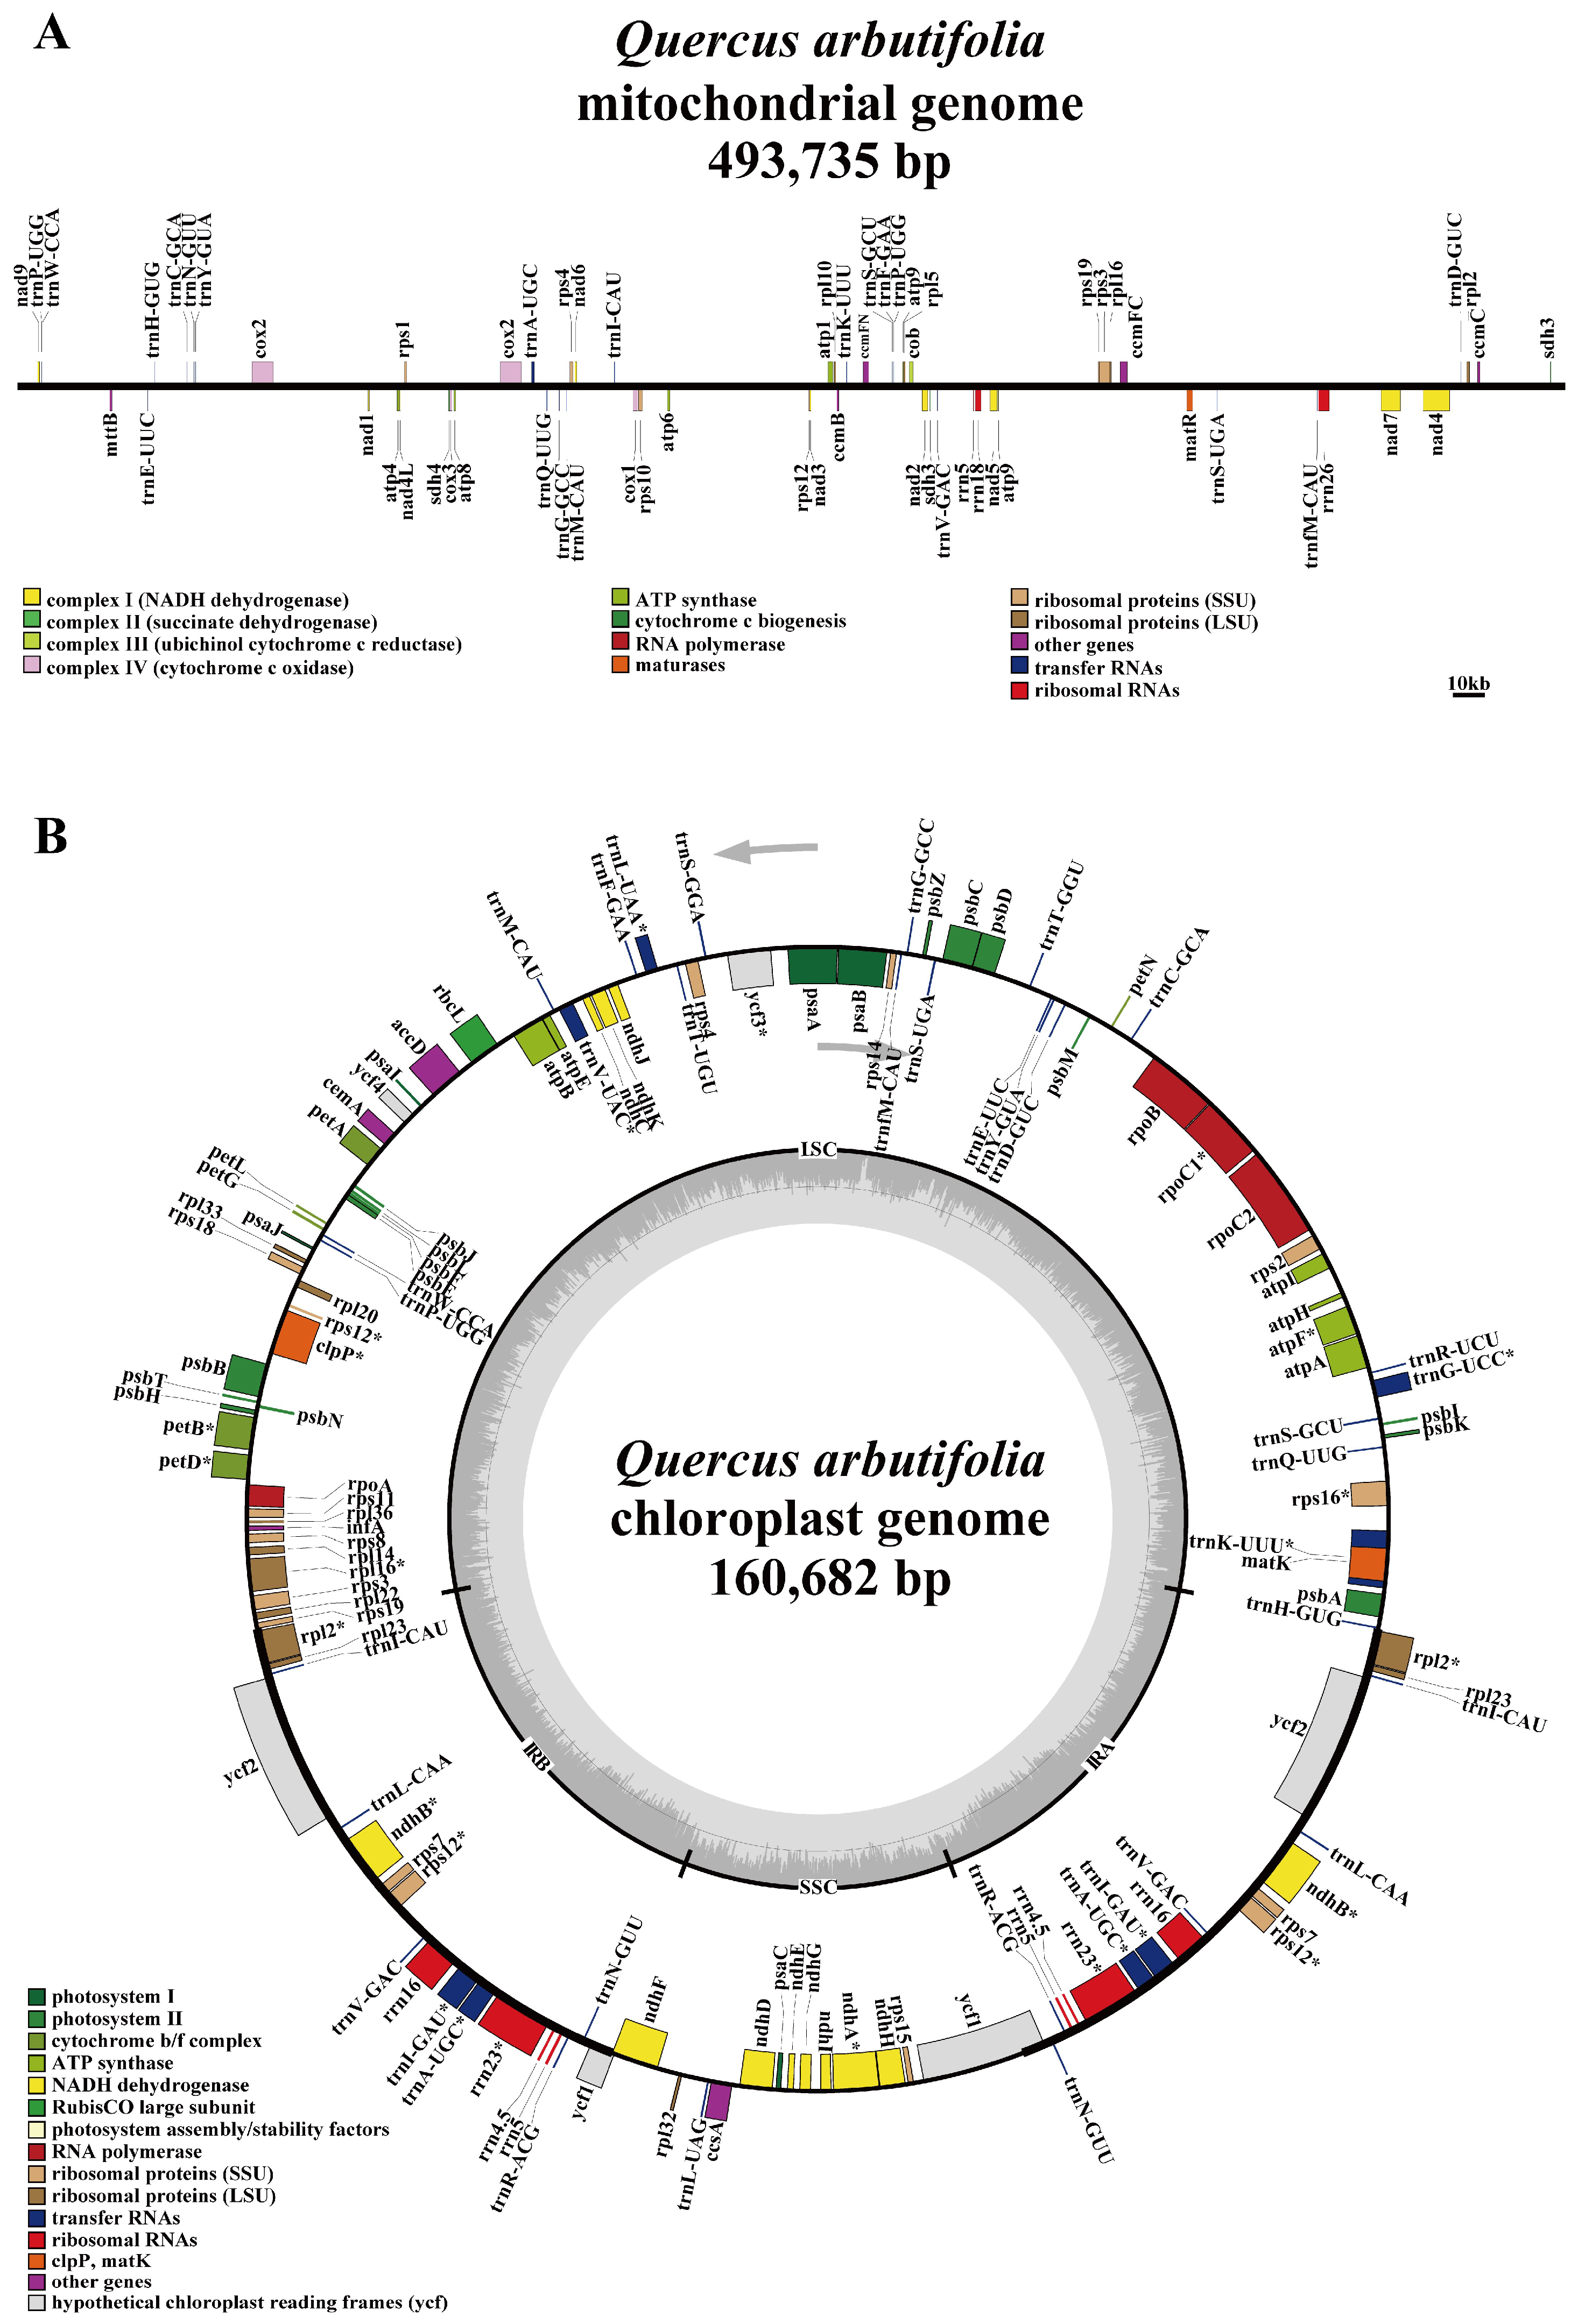
The mitochondrial and chloroplast genomes of Q. arbutifolia exhibited distinct differences in genome structure and composition (Figure 1 and Table 1). The mitochondrial genome assembly yielded a 493,735 bp linear sequence with a GC content of 45.81%. In contrast, the chloroplast genome was assembled as a 160,682 bp typical circular structure, with a lower GC content of 36.91%. The coding sequence (CDS) length of the mitochondrial genome was 29,495 bp, accounting for only 5.97% of the total genome size, whereas the chloroplast genome contained 79,786 bp of coding sequences, representing 49.78% of the genome.
Figure 1.
Organization and annotation of the mitochondrial and chloroplast genomes of Q. arbutifolia. (A) Linear map of the mitochondrial genome assembly of Q. arbutifolia (493,735 bp). Annotated mitochondrial genes are arranged according to their genomic positions. Different colors indicate functional categories. (B) Circular map of the chloroplast genome assembly of Q. arbutifolia (160,682 bp). The outer circle shows the distribution of annotated chloroplast genes, with genes located on the forward and reverse strands indicated separately. The inner gray circle represents GC content variation along the genome. Genes marked with an asterisk (*) contain introns, and arrows indicate the direction of transcription.
Table 1.
General features of the mitochondrial and chloroplast genomes.
Both organellar genomes contained conserved sets of PCGs, tRNA genes, and rRNA genes. A total of 62 mitochondrial genes were identified, including 39 PCGs, 20 tRNA genes, and three rRNA genes (Table S2). Among these, 58 genes were retained as unique genes after excluding duplicated copies. The mitochondrial genome contained 11 intron-containing genes, including eight cis-splicing genes and three trans-splicing genes. In comparison, the chloroplast genome harbored 131 genes, comprising 86 PCGs, 37 tRNA genes, and eight rRNA genes, with 113 unique genes identified (Table S3). Among the chloroplast genes, 23 genes contained introns, including 21 cis-splicing genes and two trans-splicing genes. Although both mitochondrial and chloroplast genomes encode genes essential for organelle function, there are still some differences in the number of genes they contain.
3.2. Repetitive Sequences
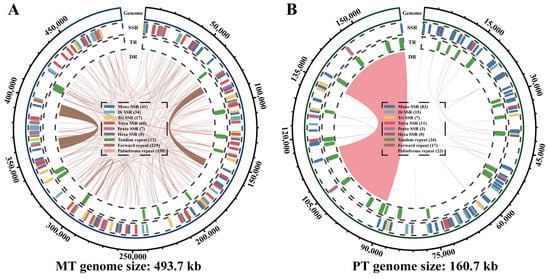
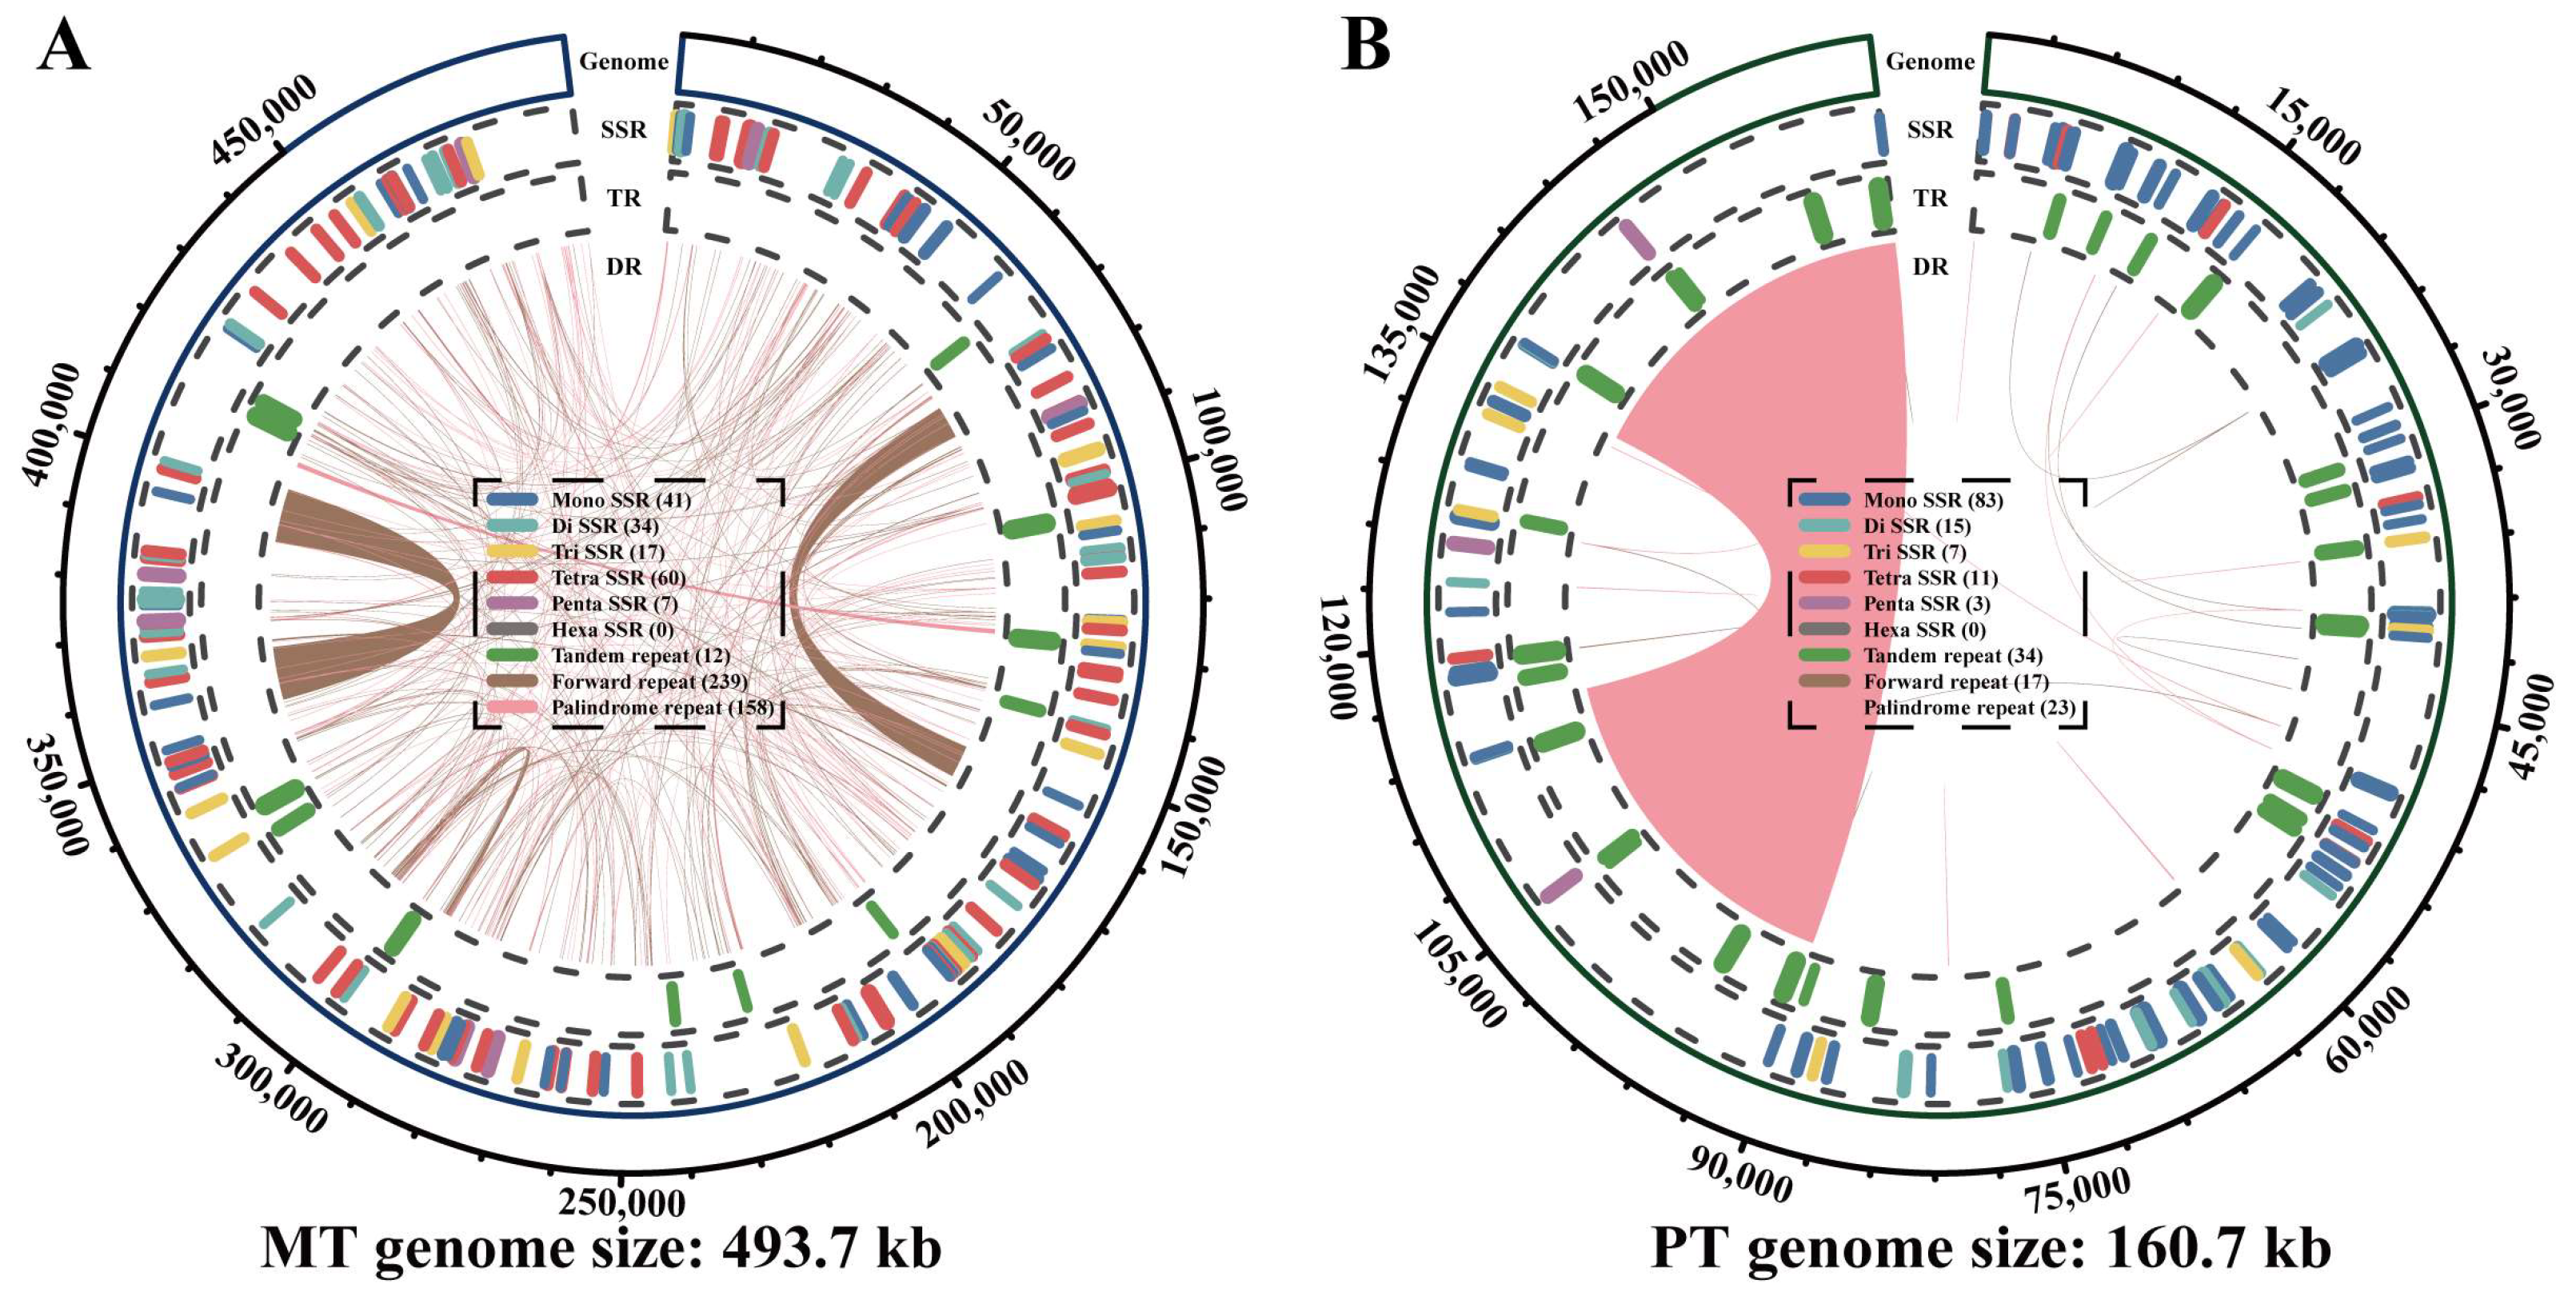
Given the pronounced differences in genome size and coding density between the two organellar genomes, we next characterized their repetitive sequences to further compare their genomic composition and structural features. The abundance and distribution patterns of repetitive sequences in both organellar genomes were investigated, including SSRs, tandem repeats, forward repeats, and palindromic repeats (Figure 2). The mitochondrial genome exhibited a substantially higher abundance of repetitive sequences than the chloroplast genome, particularly in terms of long repeats.
Figure 2.
Distribution and characterization of repetitive sequences in the mitochondrial and chloroplast genomes of Q. arbutifolia. (A) Repeat distribution in the mitochondrial genome of Q. arbutifolia (493,735 bp). (B) Repeat distribution in the chloroplast genome of Q. arbutifolia (160,682 bp). The outermost circle represents the genome coordinate scale. The second circle indicates the positions and types of SSRs, with different colors representing mono-, di-, tri-, tetra-, penta-, and hexa-nucleotide repeats. The third circle shows the distribution of tandem repeats. The innermost links represent long repeat sequences, including forward repeats and palindromic repeats, with connections indicating the relative positions of repeat pairs.
In the mitochondrial genome, a total of 159 SSRs were identified (Figure 2A). Among the different SSR types, tetra-nucleotide SSRs were the most abundant type (60), accounting for 37.7% of all mitochondrial SSRs, followed by mono-nucleotide SSRs (41, 25.8%) and di-nucleotide SSRs (34, 21.4%). These SSRs were widely distributed throughout the mitochondrial genome, with multiple repeat clusters observed in different genomic regions. Twelve tandem repeats were detected and were mainly distributed in several localized regions. In addition, 397 long repeats were identified, consisting of 239 forward repeats and 158 palindromic repeats. These long repeats were extensively distributed across the mitochondrial genome.
In contrast, the chloroplast genome contained fewer repetitive sequences, with a distinct SSR composition compared with the mitochondrial genome (Figure 2B). A total of 119 SSRs were identified, of which mono-nucleotide SSRs represented the dominant repeat type in the chloroplast genome, accounting for 69.7% of all chloroplast SSRs, whereas tetra-nucleotide SSRs were relatively rare (11, 9.2%). These SSRs were mainly distributed within the LSC and SSC regions, with relatively fewer SSRs located in the IR regions. Furthermore, 34 tandem repeats and 40 long repeats were detected in the chloroplast genome, including 17 forward repeats and 23 palindromic repeats. Compared with the mitochondrial genome, chloroplast long repeats were less abundant and exhibited a more restricted distribution pattern, mainly occurring in intergenic regions. The contrasting repeat profiles further highlighted differences in the genomic composition of the two organelles.
3.3. Codon Usage Patterns
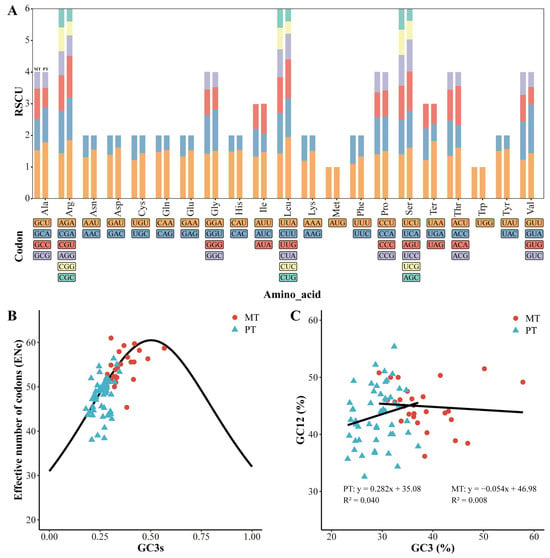
To complement the comparison of genome composition, we further examined codon usage bias in PCGs to characterize nucleotide composition and codon usage patterns in the two organellar genomes. The codon usage patterns of organellar PCGs were investigated based on RSCU, ENc, and GC content (Figure 3). Both mitochondrial and chloroplast genomes exhibited similar codon usage patterns, with a clear preference for A/U-ending synonymous codons (Figure 3A). In the mitochondrial genome, 29 synonymous codons exhibited preferential usage (RSCU > 1), with the highest values observed for GCU (Ala, 1.53), UAU (Tyr, 1.51), and CAU (His, 1.49). The chloroplast genome showed a stronger codon preference, with 31 codons displaying RSCU values > 1, particularly UUA (Leu, 1.95) and AGA (Arg, 1.85). The consistent preference for A/U-ending codons in both organellar genomes indicated a conserved pattern of nucleotide usage bias.
Figure 3.
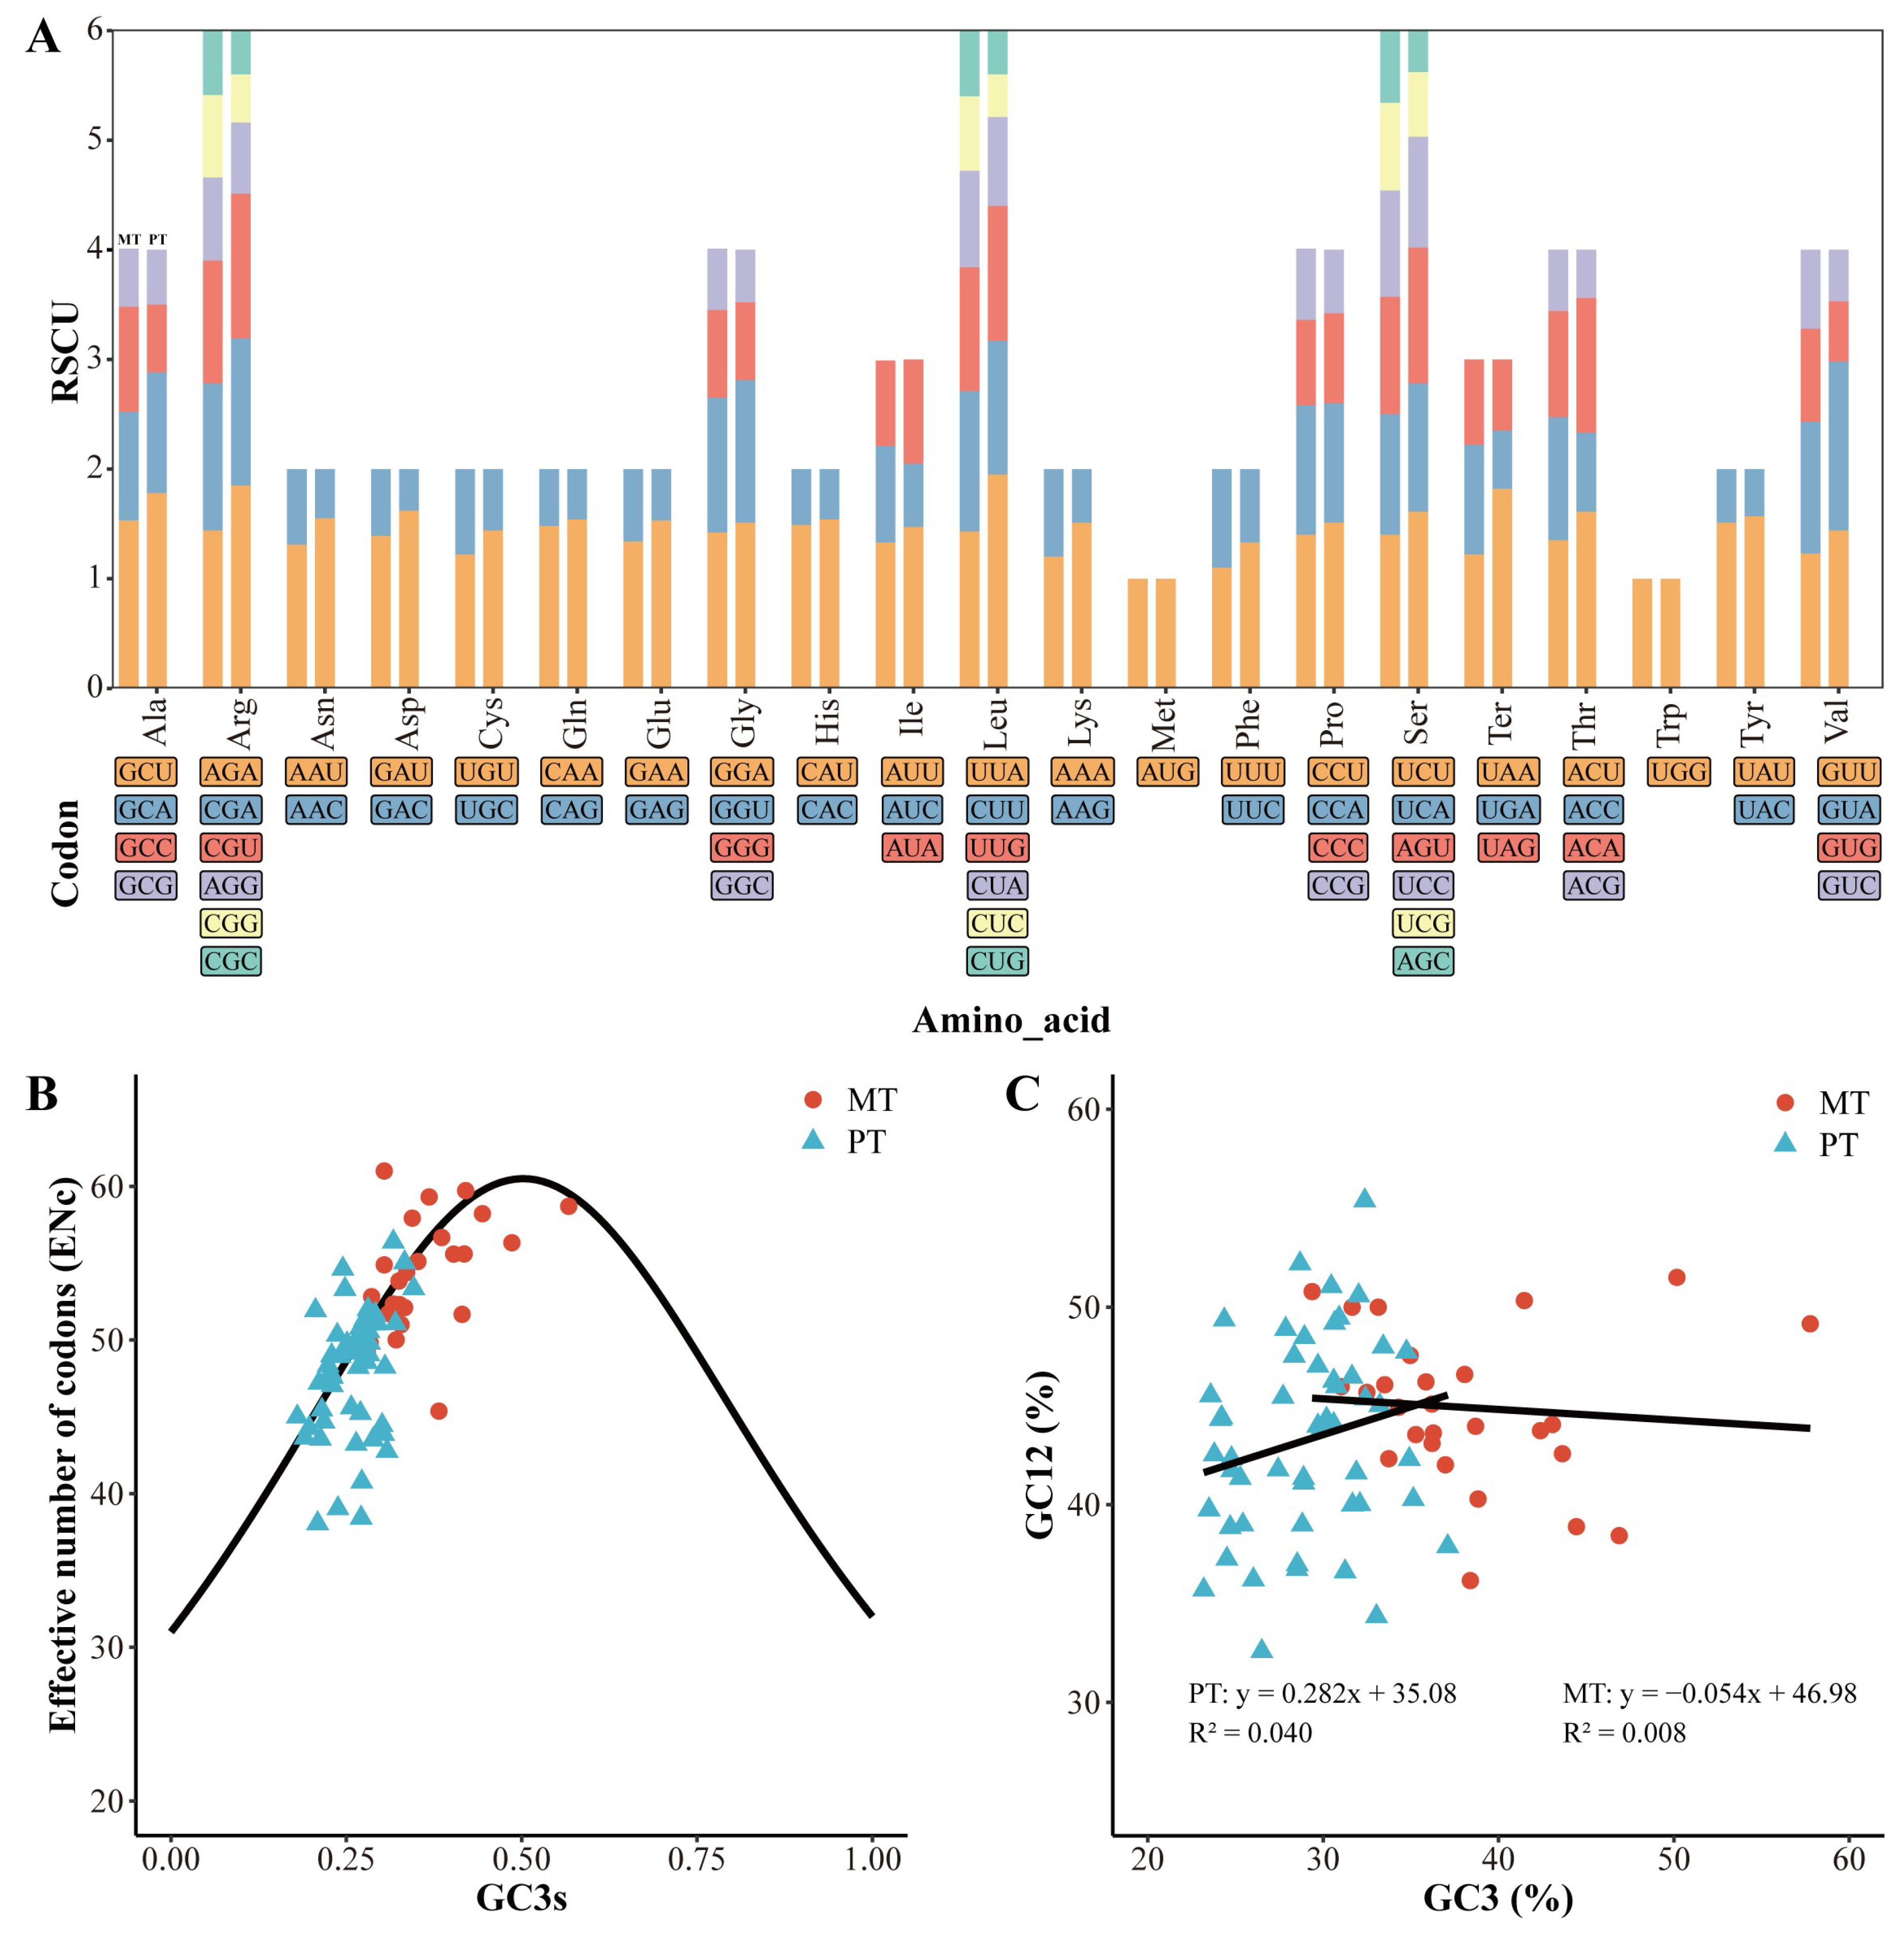
Codon usage patterns and potential determinants in the mitochondrial and chloroplast genomes of Q. arbutifolia. (A) Relative synonymous codon usage (RSCU) values of protein-coding genes in the mitochondrial (MT) and chloroplast (PT) genomes. (B) Relationship between the effective number of codons (ENc) and GC content at the third codon position (GC3s) for mitochondrial and chloroplast protein-coding genes. The curve represents the expected ENc values under no codon bias. (C) Correlation between GC content at the first two codon positions (GC12) and third codon position (GC3) in mitochondrial and chloroplast protein-coding genes. Regression equations and coefficients of determination (R2) are shown for each genome.
To further investigate the strength and potential factors contributing to these patterns, we examined ENc-plot analysis and Neutrality-plot analysis. When the ENC value is greater than 35, codon usage bias is considered weak. In the ENc-plot analysis, the ENc values of mitochondrial and chloroplast genes were mainly distributed between 40 and 60, indicating relatively weak codon usage bias (Figure 3B). Most genes exhibited deviations from the expected ENc-GC3s curve, suggesting that mutational bias alone could not fully explain the observed codon usage patterns and that selective constraints may also contribute. However, mitochondrial genes exhibited a broader range of GC3s variation and a more scattered distribution pattern compared with chloroplast genes, suggesting greater heterogeneity in nucleotide composition and codon usage patterns. In addition, we further evaluated potential factors influencing codon usage bias patterns by analyzing the correlation between GC3 and GC12 (Neutrality-plot analysis) (Figure 3C). A weak positive correlation was observed in the chloroplast genome (y = 0.282x + 35.08, R2 = 0.040), whereas the mitochondrial genome exhibited a weak negative correlation (y = −0.054x + 46.98, R2 = 0.008). The low correlation coefficients in both organellar genomes indicated that nucleotide variation at the third codon position had limited effects on the nucleotide composition of the first and second codon positions, and that codon usage was more influenced by selection. Taken together, all the results collectively suggested that multiple evolutionary factors, including base mutations and selective pressures, may have contributed to codon usage patterns in the two organellar genomes.
3.4. Mitochondrial Plastid DNA Transfer Events (MTPTs)
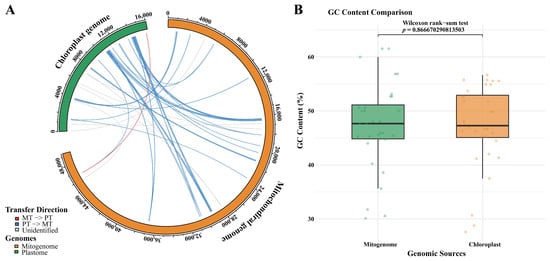
Given that mitochondrial and chloroplast genomes coexist within plant cells, we next investigated homologous sequences shared between the two genomes to characterize potential inter-organellar DNA transfer events. The potential DNA transfers between the mitochondrial and chloroplast genomes were investigated using the “transgenomes” R package. A total of 32 homologous transfer regions were identified, with the lengths ranging from 51 to 2393 bp and the sequence identities ranging from 81.25 to 99.79% (Table S4). The total length of the MTPTs was 13,771 bp, representing approximately 2.79% of the mitochondrial genome and 8.57% of the chloroplast genome (Table S4). Among them, two MTPTs Among these regions, 24 were classified as plastid-to-mitochondrial (PT→MT) transfer events, whereas only one was classified as mitochondrial-to-plastid (MT→PT) (Figure 4A). The remaining seven regions were categorized as unidentified, mainly involving highly conserved organellar genes or short homologous sequences. The PT→MT transfers were distributed across multiple regions of the mitochondrial and chloroplast genomes, whereas the single MT→PT event was detected in a short region involving ccmC and trnI-CAU.
Figure 4.
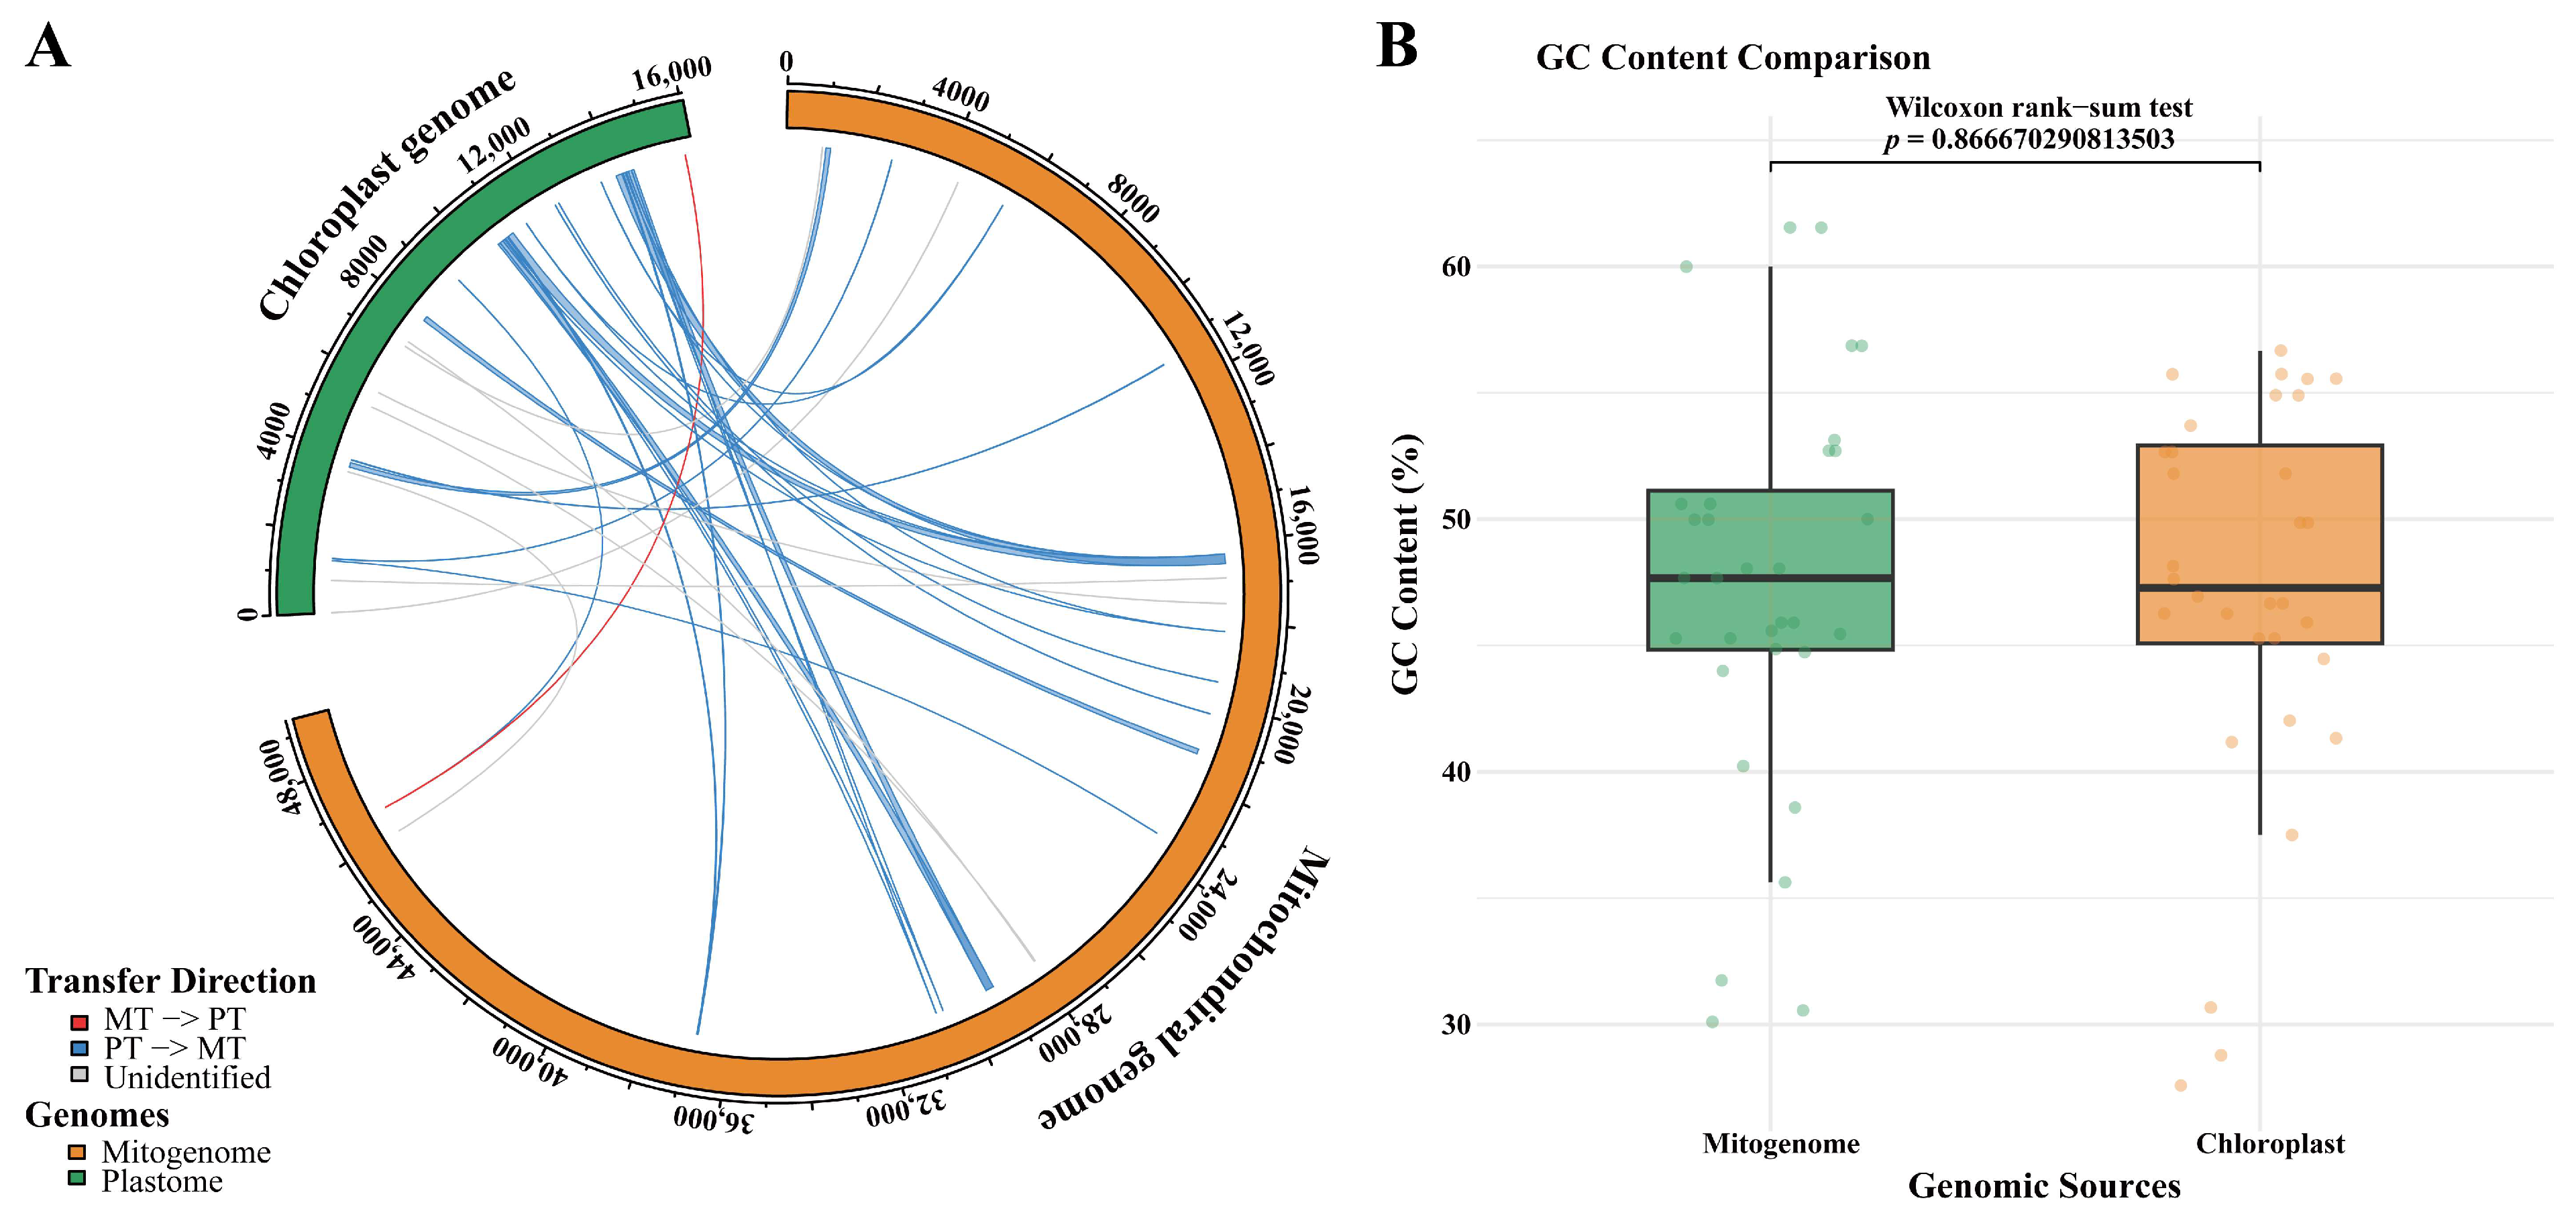
Comparative analysis of mitochondrial plastid DNA transfer events and GC content comparison between the mitochondrial and chloroplast genomes of Q. arbutifolia. (A) Circular visualization of DNA fragments transferred between the mitochondrial and chloroplast genomes. The outer circles indicate the chloroplast genome and mitochondrial genome, respectively. Colored ribbons represent homologous regions identified by sequence alignment, with blue, red, and gray ribbons corresponding to plastid-to-mitochondrial transfers, mitochondrial-to-plastid transfers, and undetermined transfer directions, respectively. (B) Comparison of GC content between the mitochondrial and chloroplast genomes. Colored dots represent the GC content of different MTPTs.
During PT→MT transfer, PCG transfers mainly involved fragments of rps12, atpA, atpF, psbB, psbC, psbD, psbT, ndhD, and ndhE. Extensive homologous regions were detected between rRNA genes, including mitochondrial rrn18 and plastid rrn16. Several tRNA sequences were also identified, including trnA-UGC, trnF-GAA, trnH-GUG, trnI-CAU, trnI-GAU, trnM-CAU, trnN-GUU, trnP-UGG, trnQ-UUG, and trnV-GAC, some of which exhibited extremely high sequence identities. The GC content of the transfer regions was further compared between mitochondrial- and chloroplast-derived sequences (Figure 4B). The two groups showed broadly similar GC-content distributions, and the Wilcoxon rank-sum test detected no significant difference between them (p = 0.867). These results suggested that the GC composition of the identified transferred sequences did not differ substantially between the two organellar genomic sources.
3.5. Comparative Structural Evolution
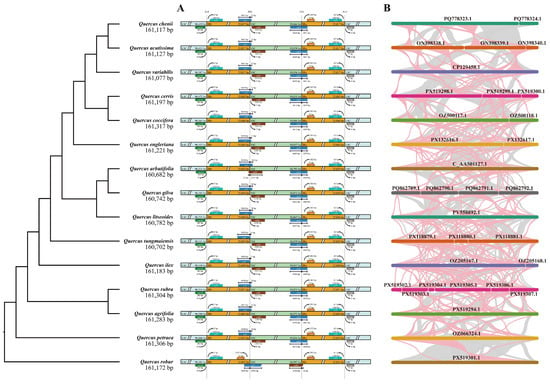
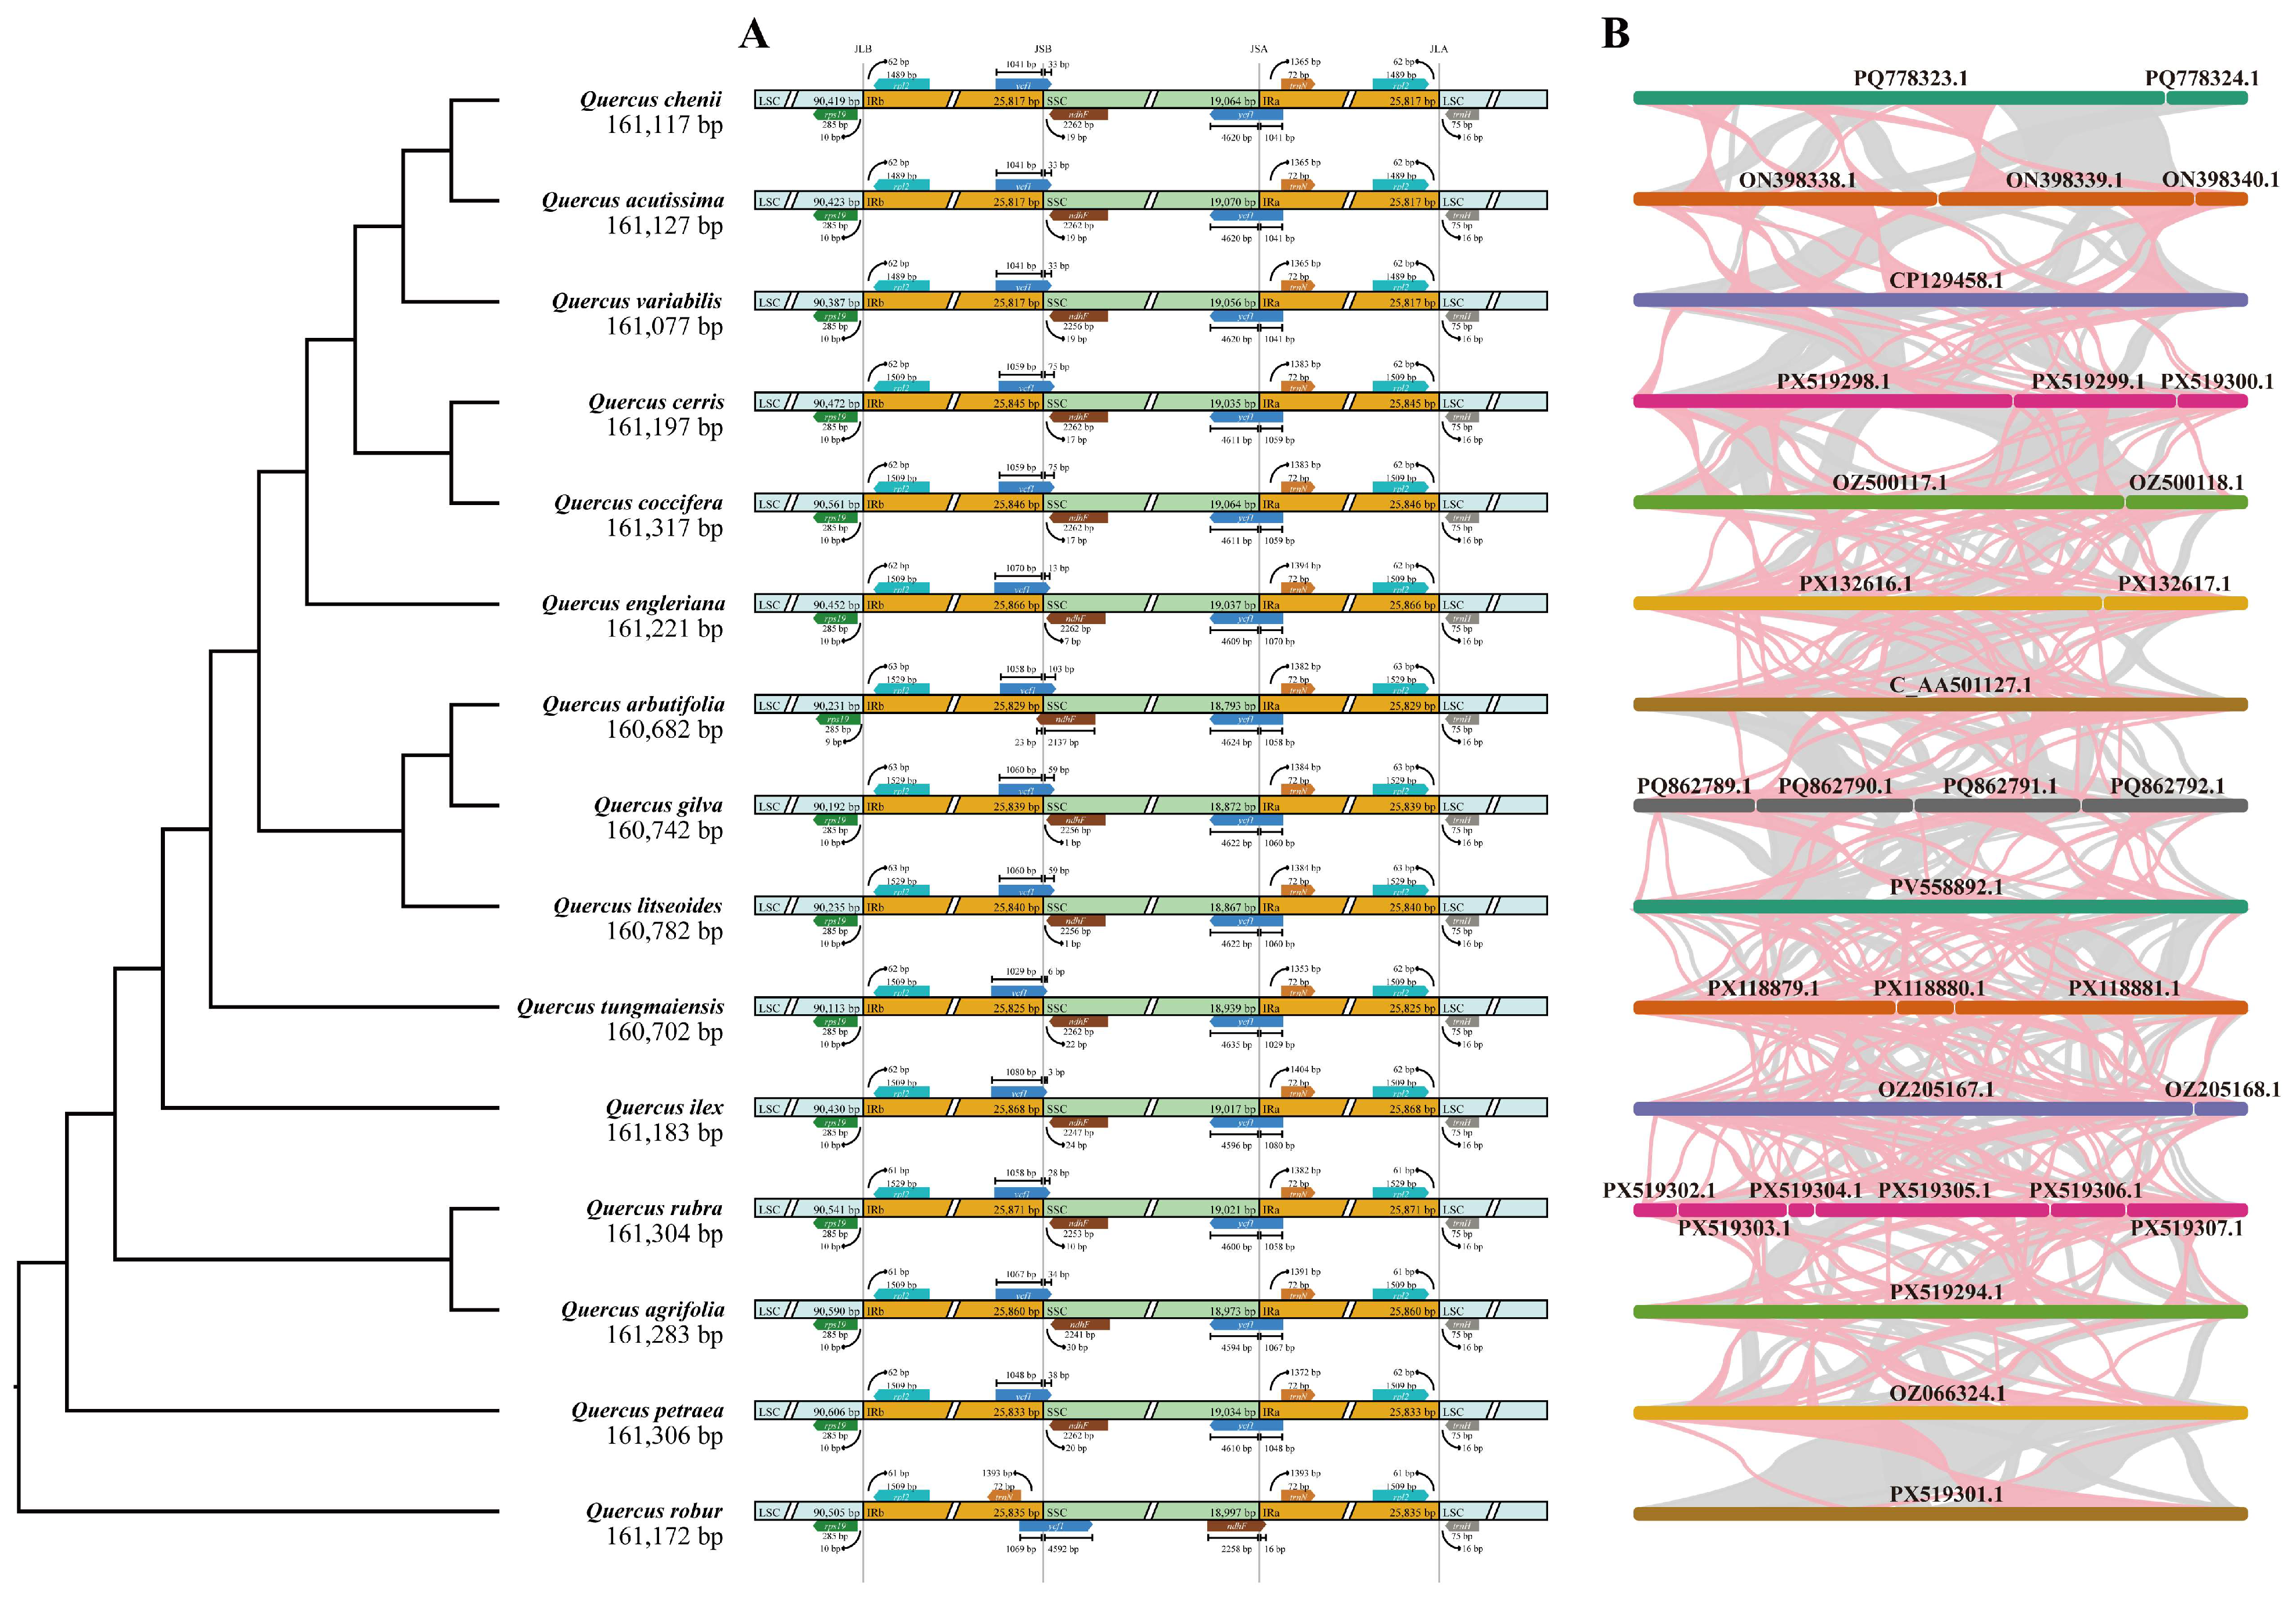
The analysis above illustrated the connection between these two organellar genomes from the perspective of a single species. To understand these findings within a broader comparative context, we further analyzed the variations in chloroplast inverted repeat (IR) boundaries and the synteny of mitochondrial genomes across different Quercus species, aiming to assess the structural conservation and degree of divergence of both organellar genomes (Figure 5). Comparative analyses of chloroplast genomes across Quercus species revealed generally conserved IR boundaries, with limited variation in IR length and the positions of adjacent genes (Figure 5A). Across the examined species, IR lengths ranged from 25,817 to 25,871 bp, representing a difference of 54 bp. In particular, the rps19, rpl2, trnN, trnH, ycf1, and ndhF genes located in the boundary regions displayed slight positional shifts (1–53 bp). These indicated limited structural divergence of chloroplast genomes during Quercus evolution.
Figure 5.
Comparative analysis of chloroplast genome structure and mitochondrial genome synteny among Quercus species. The phylogenetic relationships are shown on the left, and the corresponding comparative analysis results are displayed on the right. (A) Comparison of inverted repeat (IR) boundary regions among chloroplast genomes of Quercus species. (B) Whole-genome synteny analysis among mitochondrial genomes of Quercus species. Colored ribbons represent homologous syntenic regions between mitochondrial genomes, and the connecting lines indicate conserved genomic blocks and rearrangement events.
In contrast, mitochondrial genomes exhibited extensive structural rearrangements among Quercus species (Figure 5B). Whole-genome collinearity analysis revealed that mitochondrial genomes shared numerous homologous regions but displayed complex patterns of rearrangement, including fragmented syntenic blocks, inversions, and changes in the relative positions of conserved regions. Compared with the highly conserved chloroplast genomes, mitochondrial genomes showed substantially reduced collinearity, reflecting a much higher degree of structural plasticity. Overall, these results demonstrated contrasting evolutionary dynamics between the two organellar genomes.
3.6. Nucleotide Diversity of Organellar Genes
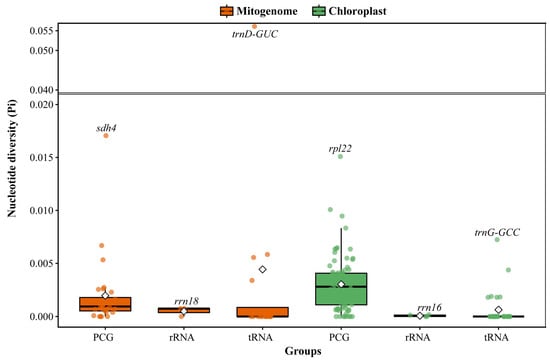
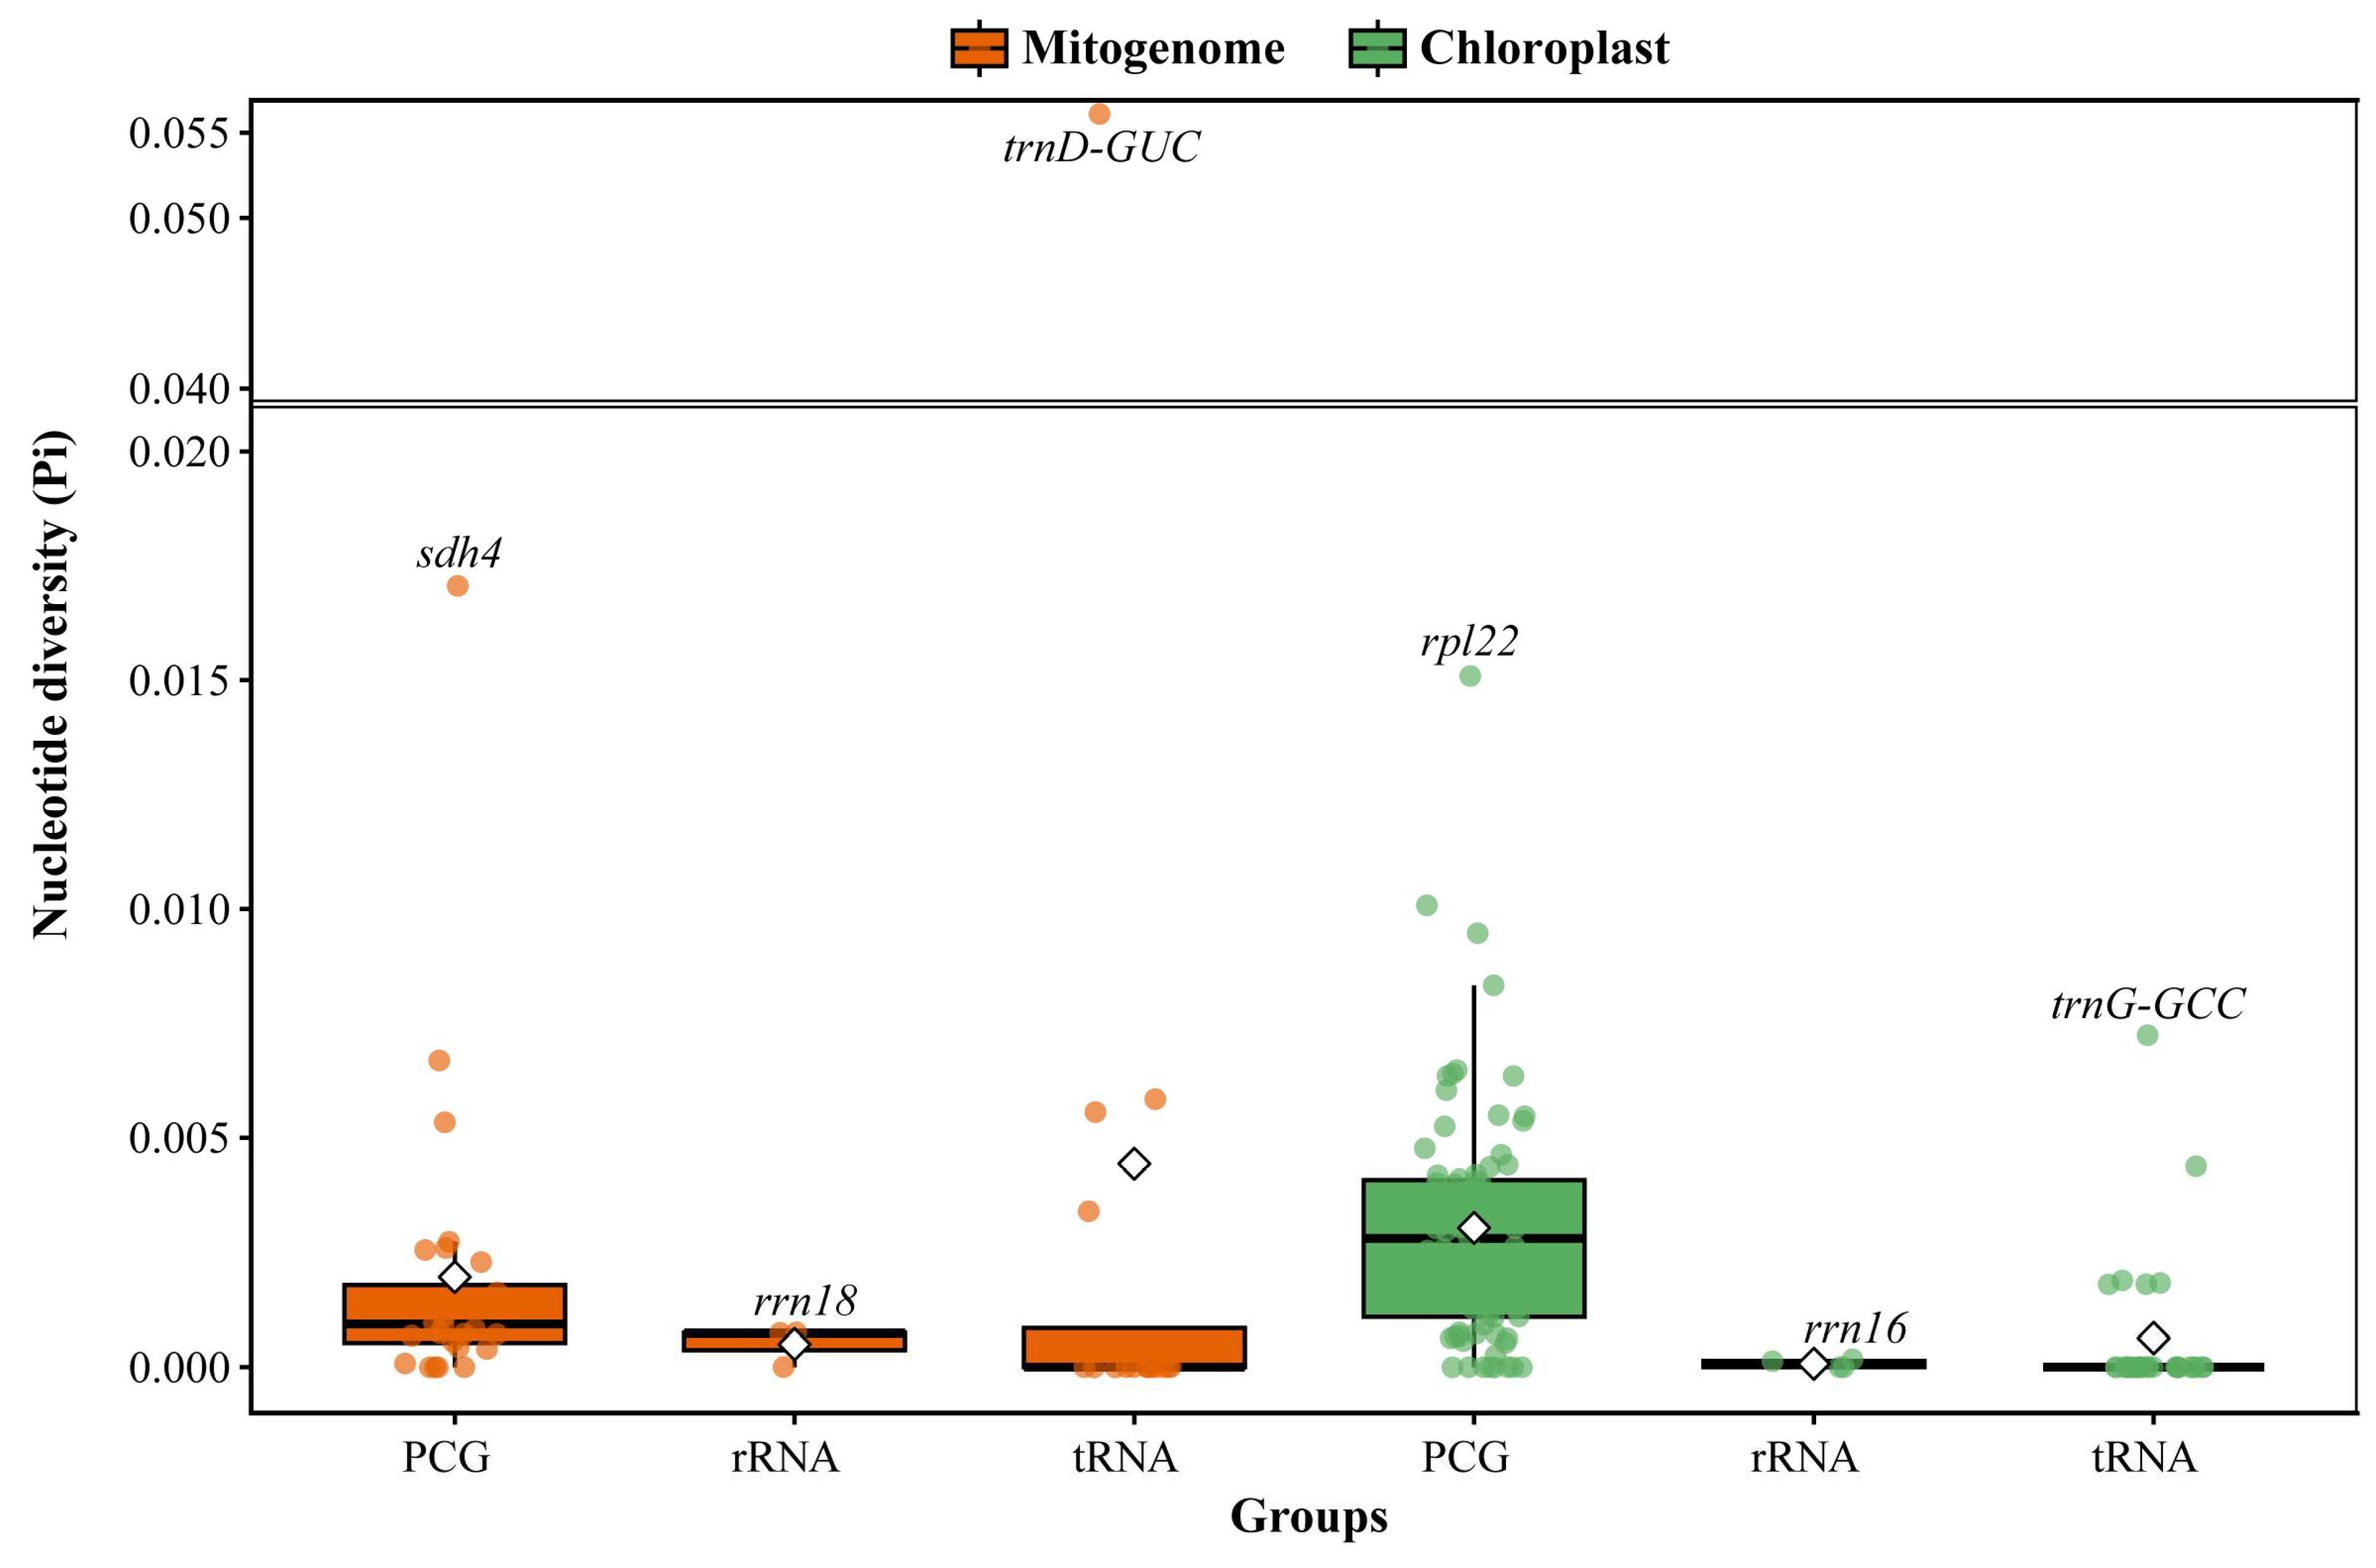
The contrasting structural patterns observed in mitochondrial and chloroplast genomes prompted us to further compare their sequence variation. The nucleotide diversity (Pi) values of PCGs, rRNA, and tRNA genes were compared between the mitochondrial and chloroplast genomes (Figure 6 and Table S5). Among PCGs, the mean Pi was higher in the chloroplast genome (0.0030) than in the mitochondrial genome (0.0020), indicating a higher mean nucleotide diversity among the sampled chloroplast PCGs. In contrast, rRNA genes showed consistently low nucleotide diversity in both organellar genomes, reflecting their strong evolutionary conservation. Overall, nucleotide diversity varied between the two organellar genomes, highlighting differences in the levels of sequence variation among Quercus species. These patterns provided a basis for comparing the phylogenetic signals of mitochondrial and chloroplast genes.
Figure 6.
Comparison of nucleotide diversity (Pi) across different genomic regions between the mitogenome and chloroplast genomes among Quercus species. Colored dots represent the Pi values of individual genes.
3.7. Phylogenetic Relationships Among Quercus Species
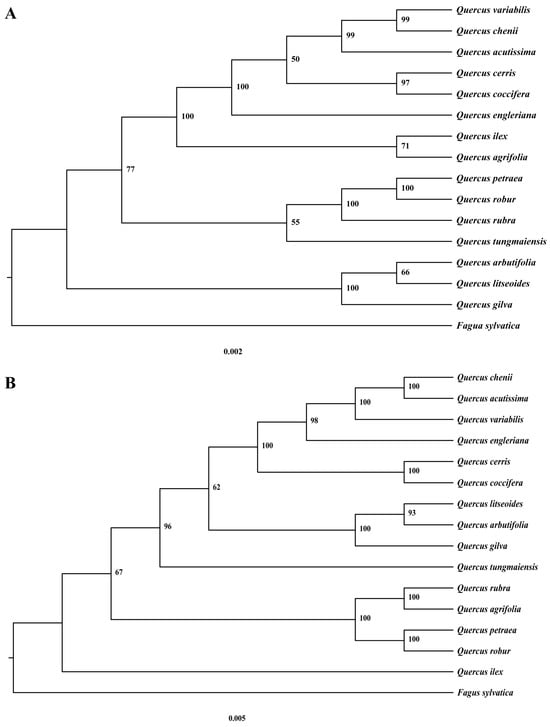
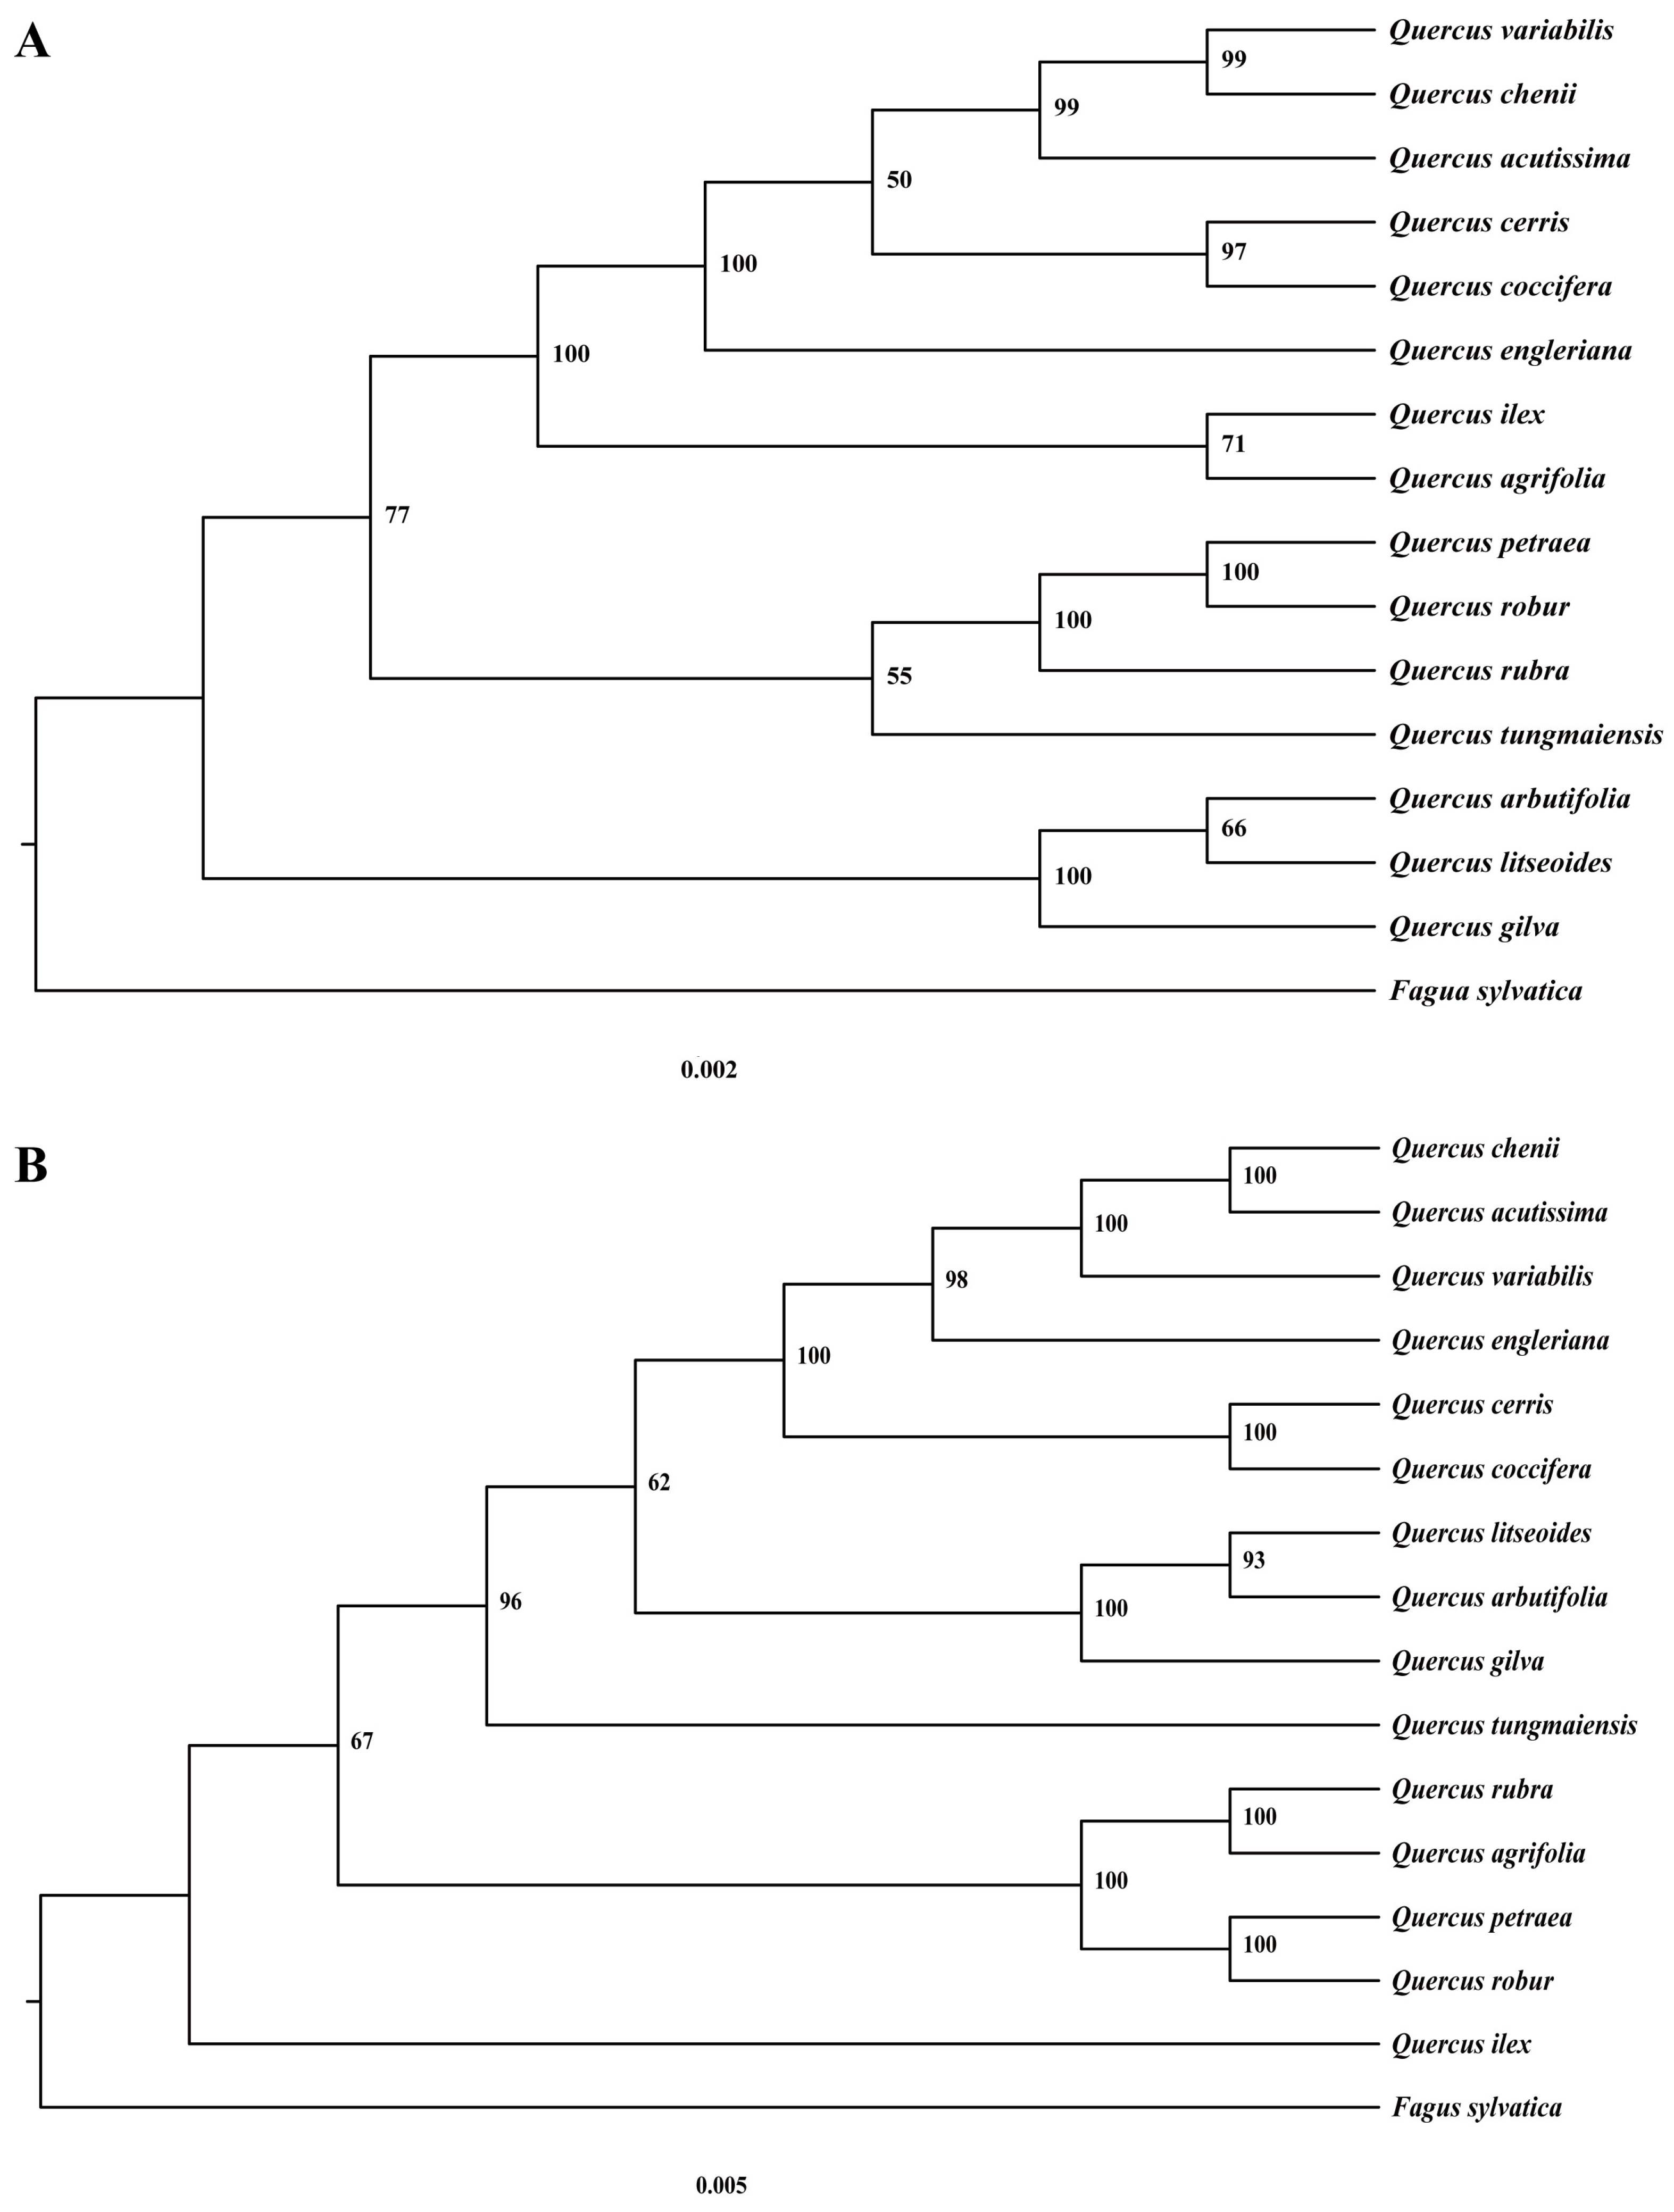
To evaluate the phylogenetic relationships and compare the evolutionary signals provided by mitochondrial and chloroplast genomes, maximum likelihood (ML) analyses were performed separately based on shared mitochondrial and chloroplast PCGs (Figure 7). Overall, the mitochondrial and chloroplast phylogenies exhibited highly similar topological patterns for several major lineages, largely consistent with the current classification of Quercus. Compared with the mitochondrial phylogeny, the chloroplast tree generally showed higher resolution and stronger support values for most internal branches.
Figure 7.
Maximum likelihood phylogenetic trees of Quercus species inferred from mitochondrial and chloroplast share protein-coding genes (PCGs), with F. sylvatica as the outgroup. (A) Phylogenetic tree reconstructed based on 26 shared mitochondrial PCGs. (B) Phylogenetic tree reconstructed based on 79 shared chloroplast PCGs. Numbers at nodes indicate branch support values based on 1000 ultrafast bootstrap replicates and 1000 SH-aLRT replicates.
Species belonging to section Cyclobalanopsis, including Q. gilva, Q. litseoides, and Q. arbutifolia, formed a distinct and strongly supported lineage in both mitochondrial and chloroplast trees. Within this lineage, Q. arbutifolia and Q. litseoides were consistently resolved as sister species, whereas Q. gilva represented the earliest-diverging lineage within this group. Similarly, the close relationships among Q. variabilis, Q. chenii, and Q. acutissima were supported by both organellar genome datasets, although their relative branching order differed slightly between the two trees. In addition, species belonging to section Quercus (Q. petraea and Q. robur) showed the most consistent relationship between mitochondrial and chloroplast phylogenies. Both analyses strongly supported Q. petraea and Q. robur as sister species (BS = 100), confirming their close evolutionary relationship.
Despite these overall similarities, several topological incongruences were observed between the mitochondrial and chloroplast trees. The most notable difference involved section Ilex. In the mitochondrial tree, Q. ilex and Q. agrifolia were recovered as sister taxa, whereas Q. ilex occupied an independent basal position among the sampled Quercus species in the chloroplast tree. In addition, Q. tungmaiensis and Q. engleriana showed different phylogenetic positions between the two datasets. These discrepancies indicate that mitochondrial and chloroplast genomes may retain different evolutionary histories for certain Quercus lineages.
4. Discussion
4.1. Repetitive Sequences and DNA Transfer Events Contribute to Mitochondrial Genome Complexity
In contrast to the highly conserved chloroplast genomes, mitochondrial genomes can tolerate extensive genome expansion and structural variation, largely driven by repetitive sequences and intracellular DNA transfer [6,54,55,56]. In this study, the mitochondrial genome of Q. arbutifolia exhibited abundant repetitive sequences (Figure 2A) and numerous plastid-derived sequences (Figure 4), highlighting the combined contribution of repeat-mediated recombination and inter-organellar DNA exchange to mitochondrial genome evolution.
Repetitive sequences represent one of the major drivers of plant mitochondrial genome evolution [57,58]. The mitochondrial genome of Q. arbutifolia contained substantially more repetitive elements than the chloroplast genome, particularly long repeats. A total of 397 long repeats were identified in the mitochondrial genome, including 239 forward repeats and 158 palindromic repeats, whereas chloroplast genomes contained considerably fewer long repeats. The accumulation of these repeats provides potential substrates for homologous recombination in the mitochondrial genome, which can generate genome rearrangements, alternative molecular configurations, and structural diversification [59,60]. Interestingly, the composition of SSRs also differed substantially between the two organellar genomes. Mitochondrial SSRs showed a higher proportion of tetra-nucleotide repeats, whereas chloroplast SSRs were dominated by mono-nucleotide repeats. Similar findings have been observed in other species, and these differences may reflect different mutational environments and selection constraints in the two organellar genomes [3,61,62]. SSRs may also serve as candidate molecular markers for future studies of genetic diversity, population structure, and phylogeographic relationships in Quercus. However, their polymorphism and suitability as markers require validation using multiple individuals and populations.
In addition to repetitive sequence accumulation, intracellular DNA transfer from chloroplasts represents another important source of mitochondrial genome complexity [63]. In Q. arbutifolia, 32 homologous transfer regions were identified between mitochondrial and chloroplast genomes, with a strong predominance of plastid-to-mitochondrial (PT→MT) transfers. Similar directional biases have been widely reported in angiosperm mitochondrial genomes, suggesting that mitochondrial genomes frequently act as recipients of foreign DNA acquired from other cellular compartments [47,64]. The transferred regions involved multiple functional categories, indicating that various types of plastid-derived sequences can be integrated into mitochondrial genomes during evolution [63,65]. Although most transferred sequences are unlikely to retain independent functions after insertion, their presence provides valuable evidence for historical interactions between organellar genomes [55,64,66].
Together, these findings suggest that mitochondrial genome complexity in Q. arbutifolia results from the combined effects of endogenous repeat expansion and continuous acquisition of foreign DNA. Repetitive sequences may promote genome rearrangement through recombination, whereas plastid-derived DNA transfer contributes additional genetic material and increases genomic complexity. The interaction between these two processes likely represents an important evolutionary mechanism driving mitochondrial genome diversification in Quercus.
4.2. Divergent Genomic Characteristics in Mitochondrial and Chloroplast Genome of Quercus
Mitochondrial and chloroplast genomes coexist within plant cells but differ in inheritance patterns, functional roles, genome maintenance mechanisms, and sequence variation in molecular evolution [67,68]. In the present study, these contrasting characteristics were reflected not only in genome size and coding density but also in codon usage patterns and nucleotide diversity, providing complementary perspectives on the genomic features of the two organelles in Quercus.
The mitochondrial genome of Q. arbutifolia exhibited a larger genome size (493,735 bp), lower coding density (5.97%), and greater structural complexity, whereas the chloroplast genome displayed a stable structure with a substantially higher coding proportion (49.78%) (Table 1). Similar differences have been widely observed among angiosperms, reflecting fundamentally different evolutionary mechanisms between mitochondrial and chloroplast genomes [69,70,71]. Unique gene counts reflect the diversity of genes retained in each organellar genome, whereas duplicated genes indicate the presence of multiple copies of particular genes. The numbers of unique and duplicated genes also differed between the two organellar genomes. In chloroplast genomes, duplicated genes are often associated with the IR regions, whereas duplicated genes in mitochondrial genomes may reflect their more complex genomic organization. Chloroplast genomes maintain a highly conserved genomic architecture due to strong functional constraints on gene order and genome integrity [14,72]. In contrast, mitochondrial genomes tolerate extensive genome expansion and structural variation [15,73]. The structural difference was further supported by comparative analyses among Quercus species. Chloroplast genomes of Quercus showed highly conserved IR boundaries with only minor expansions or contractions (1–53 bp), whereas mitochondrial genomes exhibited extensive rearrangements (Figure 5). Therefore, the mitochondrial and chloroplast genomes of Quercus provide a representative example of the divergent evolutionary strategies of plant organellar genomes.
Differences between the two organellar genomes were also reflected in nucleotide composition and codon usage patterns. Both organellar genomes displayed a preference for A/U-ending synonymous codons, representing a common feature of plant organellar genes [62,74,75]. However, ENc-plot analysis and Neutrality-plot analysis suggested that codon usage variation could not be explained solely by nucleotide mutation bias, implying that selective constraints also contribute to shaping codon preferences [46,62,76,77]. Compared with the chloroplast genome, mitochondrial genes exhibited broader variation in GC3 composition and a more scattered distribution pattern, suggesting greater heterogeneity in nucleotide evolution among mitochondrial genes. This difference may be associated with the more dynamic evolutionary environment of mitochondrial genomes [2,78]. Furthermore, nucleotide diversity analyses revealed contrasting sequence variation between mitochondrial and chloroplast genes. Chloroplast PCGs showed higher mean nucleotide diversity than mitochondrial PCGs, suggesting relatively faster sequence divergence in chloroplast genes among sampled Quercus species (Figure 6). Nevertheless, several genes displayed elevated variability (such as mitochondrial sdh4 and chloroplast rpl22) and could be developed as DNA barcodes for phylogenetic and population genetic studies of Quercus [79].
Together, these results highlight the distinct genomic characteristics of mitochondrial and chloroplast genomes in Quercus, including differences in genome organization, coding density, codon usage patterns, and nucleotide diversity. These contrasting patterns may be shaped by multiple interacting processes, including DNA repair and recombination, differences in functional constraints, and the effects of natural selection and genetic drift. As discussed by Wang et al., these mechanisms are not mutually exclusive, and no single hypothesis can fully explain the distinct mutation patterns of plant mitochondrial and chloroplast genomes [80]. Further studies integrating broader comparative genomic data are therefore needed to clarify how these processes contribute to organellar genome evolution in Quercus.
4.3. Mitochondrial and Chloroplast Genomes Provide Complementary Evolutionary Signals for Quercus
Organellar genomes have been widely used for plant phylogenetic reconstruction because of their relatively conserved inheritance patterns and abundant phylogenetic information [1,2,3,81]. However, differences in evolutionary histories between mitochondrial and chloroplast genomes may generate conflicting phylogenetic signals [82,83]. Therefore, comparisons between multiple organellar genomes provide an opportunity to investigate not only species relationships but also the complex evolutionary processes underlying lineage diversification.
In this study, mitochondrial and chloroplast phylogenies recovered largely consistent relationships among major Quercus lineages, but several topological incongruences were also detected (Figure 7). The strong support for relationships within section Cyclobalanopsis indicates that both organellar genomes retain reliable evolutionary signals for resolving closely related oak species. Similarly, the consistent placement of Q. petraea and Q. robur as sister species demonstrates the utility of organellar genomes in reconstructing evolutionary relationships within Quercus. These results are consistent with previous phylogenetic studies of Quercus, further confirming the reliability of organelle genomes as a valuable resource for investigating the evolutionary history of the genus [34,35]. However, differences observed in section Ilex and several other lineages suggest that mitochondrial and chloroplast genomes may preserve distinct evolutionary histories. Such incongruence may result from several evolutionary processes, including incomplete lineage sorting (ILS), introgression and hybridization, chloroplast capture, or differences in organellar inheritance patterns [83,84,85]. Given the complex evolutionary history of Quercus, these processes may have contributed to the observed incongruences, although their relative contributions remain unresolved. Organellar incongruence can provide valuable information about historical evolutionary events rather than simply representing phylogenetic uncertainty [86].
Overall, our findings demonstrate that mitochondrial and chloroplast genomes provide complementary perspectives on organellar evolution and species relationships in Quercus. Therefore, integrating organellar genomes provides a more comprehensive framework for understanding oak diversification and avoiding conclusions based solely on a single genomic compartment. Future investigations integrating mitochondrial, chloroplast, and nuclear genomic data, together with broader population-level sampling, will be essential for resolving the reticulate evolutionary history and adaptive diversification of Quercus species. This study demonstrates that mitochondrial and chloroplast genomes represent complementary rather than competing sources of evolutionary information. By combining the distinct evolutionary perspectives preserved in different organellar genomes, a more comprehensive understanding of organellar evolution, species diversification, and phylogenetic relationships within plants can be achieved.
5. Conclusions
In this study, we performed a comprehensive comparative analysis of the mitochondrial and chloroplast genomes of Q. arbutifolia and investigated their contrasting evolutionary patterns within Quercus. Our results demonstrate that the mitochondrial and chloroplast genomes of Q. arbutifolia demonstrate highly contrasting evolutionary dynamics. The chloroplast genome maintains a conserved architecture characterized by stable IR boundaries and relatively limited structural variation, whereas the mitochondrial genome exhibits extensive structural plasticity driven by repetitive sequences, genome rearrangements, and frequent plastid-derived DNA acquisition. The differential patterns of codon usage, nucleotide diversity, and phylogenetic signals further indicate that the two organellar genomes have experienced distinct evolutionary constraints. These findings provide new insights into organellar genome evolution in Quercus and highlight the importance of integrating mitochondrial and chloroplast genomic information for understanding plant evolutionary diversification.
Supplementary Materials
The following supporting information can be downloaded at: https://www.mdpi.com/article/10.3390/genes17111348/s1, Table S1. The mitochondrial and chloroplast genome information of Quercus released in the database (accessed on 26 August 2026); Table S2. Gene composition of the mitochondrial genome; Table S3. Gene composition of the chloroplast genome; Table S4. The potential mitochondrial plastid DNA transfer events identified by “transgenomes” R package; Table S5. The nucleotide diversity (Pi) of genes in the organellar genomes.
Author Contributions
Conceptualization, Y.L.; methodology, S.-N.F.; software, S.-N.F.; resources, Y.-G.S.; writing—original draft preparation, S.-N.F. and Y.L.; writing—review and editing, Y.-G.S. and Y.L.; supervision, Y.L.; project administration, Y.-G.S.; funding acquisition, Y.-G.S. All authors have read and agreed to the published version of the manuscript.
Funding
This research and APC were funded by the Special Fund for Scientific Research of Shanghai Landscaping & City Appearance Administrative Bureau (grant number G242414, G242416, and G252408), and the Special Fund for Scientific Research of National Botanical Gardens to benefit sustainable development (the year 2026).
Institutional Review Board Statement
Not applicable.
Informed Consent Statement
Not applicable.
Data Availability Statement
The data reported in this paper have been deposited in the GenBase in National Genomics Data Center (NGDC), Beijing Institute of Genomics, Chinese Academy of Sciences/China National Center for Bioinformation, under accession number C_AA501127.1 of mitochondrial genome and C_AA501128.1 of chloroplast genome that is publicly accessible at https://ngdc.cncb.ac.cn/genbase (accessed on 8 September 2026).
Conflicts of Interest
Si-Nuo Feng is employed by Guangzhou Landscape Architecture Co., Ltd. The company had no role in the study design, data collection, data analysis, interpretation of the results, manuscript preparation, or the decision to publish. The authors declare no conflicts of interest.
References
- Lee, S.; Chesters, D.; Vogler, A.P. Organelle genomes as universal standard for phylogenetics: A sociotechnical perspective. Trends Ecol. Evol. 2026, 41, 395–403. [Google Scholar] [CrossRef] [Scilit] [PubMed]
- Wang, J.; Kan, S.L.; Liao, X.Z.; Zhou, J.W.; Tembrock, L.R.; Daniell, H.; Jin, S.X.; Wu, Z.Q. Plant organellar genomes: Much done, much more to do. Trends Plant Sci. 2024, 29, 754–769. [Google Scholar] [CrossRef] [Scilit] [PubMed]
- Li, W.Q.; Wang, L.; Zuo, Y.W.; Zhang, H.; Zhang, X.; Yang, L.X.; Zhang, J.B.; Zheng, F.Y.; Deng, H.P. Organelle genomes reveal adaptive evolution and phylogenetic position of the endangered Primula mallophylla. Front. Plant Sci. 2025, 16, 1653128. [Google Scholar] [CrossRef] [Scilit] [PubMed]
- Gray, M.W. Evolution of organellar genomes. Curr. Opin. Genet. Dev. 1999, 9, 678–687. [Google Scholar] [CrossRef] [Scilit] [PubMed]
- Singh, S.; Naik, J.; Pandey, A. Genetics of plant organelles: Plastid and mitochondrial genomes. In Plant Genomics for Sustainable Agriculture; Singh, R.L., Mondal, S., Parihar, A., Singh, P.K., Eds.; Springer Nature: Singapore, 2022; pp. 313–330. [Google Scholar]
- Yan, R.R.; Wang, J.; Xu, Z.C.; Hu, J.D.; Meng, H.H.; Xiang, C.L.; Wu, Z.Q.; Hu, G.X. Mitogenome structural diversification accompanied by rapid repeat-family turnover: A comparative organellar perspective from Salvia. Plant Divers. 2026. [Google Scholar] [CrossRef] [Scilit]
- Li, Y.; Zheng, S.S.; Wang, T.R.; Liu, M.H.; Kozlowski, G.; Yi, L.T.; Song, Y.G. New insights on the phylogeny, evolutionary history, and ecological adaptation mechanism in cycle-cup oaks based on chloroplast genomes. Ecol. Evol. 2024, 14, e70318. [Google Scholar] [CrossRef] [Scilit] [PubMed]
- Samigullin, T.H.; Kuluev, A.R.; Vallejo-Roman, K.M.; Kuluev, B.R.; Chemeris, A.V. Pan-plastomes or con-plastomes—A novel sight on the genetic diversity of chloroplast genomes of higher plants for phylogenetic investigations. Biomics 2025, 17, 77–87. [Google Scholar] [CrossRef] [Scilit]
- Li, Y.; Zheng, S.S.; Kozlowski, G.; Song, Y.G. Comparative analysis of the mitogenomes of multiple species of Fagaceae, with special focus on Quercus gilva. BMC Plant Biol. 2025, 25, 1098. [Google Scholar] [CrossRef] [Scilit] [PubMed]
- Hao, Z.G.; Zhang, Z.P.; Zhang, J.N.; Cui, X.F.; Li, J.Q.; Luo, L.X.; Li, Y.B. The complete mitochondrial genome of Aglaia odorata, insights into its genomic structure and RNA editing sites. Front. Plant Sci. 2024, 15, 1362045. [Google Scholar] [CrossRef] [Scilit] [PubMed]
- Drouin, G.; Daoud, H.; Xia, J.N. Relative rates of synonymous substitutions in the mitochondrial, chloroplast and nuclear genomes of seed plants. Mol. Phylogenet. Evol. 2008, 49, 827–831. [Google Scholar] [CrossRef] [Scilit] [PubMed]
- Wolfe, K.H.; Li, W.H.; Sharp, P.M. Rates of nucleotide substitution vary greatly among plant mitochondrial, chloroplast, and nuclear DNAs. Proc. Natl. Acad. Sci. USA 1987, 84, 9054–9058. [Google Scholar] [CrossRef] [Scilit] [PubMed]
- Dong, S.S.; Wang, Y.L.; Xia, N.H.; Liu, Y.; Liu, M.; Lian, L.; Li, N.; Li, L.F.; Lang, X.A.; Gong, Y.Q.; et al. Plastid and nuclear phylogenomic incongruences and biogeographic implications of Magnolia s.l. (Magnoliaceae). J. Syst. Evol. 2022, 60, 1–15. [Google Scholar] [CrossRef] [Scilit]
- Daniell, H.; Lin, C.S.; Yu, M.; Chang, W.J. Chloroplast genomes: Diversity, evolution, and applications in genetic engineering. Genome Biol. 2016, 17, 134. [Google Scholar] [CrossRef] [Scilit] [PubMed]
- Wu, Z.Q.; Liao, X.Z.; Zhang, X.N.; Tembrock, L.R.; Broz, A. Genomic architectural variation of plant mitochondria—A review of multichromosomal structuring. J. Syst. Evol. 2020, 60, 160–168. [Google Scholar] [CrossRef] [Scilit]
- Bi, C.W.; Lu, N.; Xu, Y.Q.; He, C.P.; Lu, Z.H. Characterization and analysis of the mitochondrial genome of common bean (Phaseolus vulgaris) by comparative genomic approaches. Int. J. Mol. Sci. 2020, 21, 3778. [Google Scholar] [CrossRef] [Scilit] [PubMed]
- Ni, Y.; Li, J.L.; Tan, Y.H.; Shen, G.A.; Liu, C. Advance in the assembly of the plant mitochondrial genomes using high-throughput DNA sequencing data of total cellular DNAs. Plant Biotechnol. J. 2025, 23, 4944–4965. [Google Scholar] [CrossRef] [Scilit] [PubMed]
- Li, Z.W.; Liu, J.X.; Liang, M.T.; Guo, Y.B.; Chen, X.; Wu, H.Z.; Jin, S.L. De novo assembly of the complete mitochondrial genome of pepino (Solanum muricatum) using PacBio HiFi sequencing: Insights into structure, phylogenetic implications, and RNA editing. BMC Plant Biol. 2024, 24, 361. [Google Scholar] [CrossRef] [Scilit] [PubMed]
- Yu, J.X.; Bai, R.Z.; Chen, Y.P.; Ma, X.L.; Celep, F.; Xiang, C.L. Newly assembled mitochondrial genomes of Hypericum (Hypericaceae) provide insights into phylogenetic relationships and inter-organellar conflict. Front. Plant Sci. 2026, 17, 1763082. [Google Scholar] [CrossRef] [Scilit] [PubMed]
- Kong, J.L.; Wang, J.; Nie, L.Y.; Tembrock, L.R.; Zou, C.S.; Kan, S.L.; Ma, X.F.; Wendel, J.F.; Wu, Z.Q. Evolutionary dynamics of mitochondrial genomes and intracellular transfers among diploid and allopolyploid cotton species. BMC Biol. 2025, 23, 9. [Google Scholar] [CrossRef] [Scilit] [PubMed]
- Xu, H.; Han, S.; Niu, Y.; Han, Y.; Yu, J.Y.; Zheng, Q.Q.; Zhang, G.Y.; Chen, S.L.; Chi, X.F.; Zhang, F.Q. Assembly and comparison of organelle genomes for investigating the maternal inheritance in Peganum (Nitrariaceae). BMC Genom. 2026, 27, 683. [Google Scholar] [CrossRef] [Scilit] [PubMed]
- Shen, S.Y.; Xie, Y.N.; Hu, Z.J.; Wu, W.Q.; Li, Y.; Shen, W.W.; Wu, J.; Song, Y.S.; Zhang, X.; Lin, J.X. Complete mitochondrial and chloroplast genomes of Haematoxylum campechianum L. reveal insights into gene transfer and RNA editing events. Ind. Crops Prod. 2025, 236, 122050. [Google Scholar] [CrossRef] [Scilit]
- Long, J.; He, W.C.; Zhou, X.P.; Cao, G.L.; Peng, H.W.; Erst, T.V.; Erst, A.S.; Wang, W.; Xiang, K.L. Comparative organelle genome analysis of the sister genera Ceratocephala and Myosurus (Ranunculaceae) reveals fast evolutionary rates in arid and aquatic environments. BMC Plant Biol. 2025, 26, 143. [Google Scholar] [CrossRef] [Scilit] [PubMed]
- Zhang, R.X.; Liu, S.W.; Liu, Y.; Wei, P.; Xiang, N.Y.; Zhao, Y.M.; Gao, X.M.; Yin, Y.B.; Qin, L.J.; Yuan, T. Comparative analysis of the organelle genomes of seven Rosa species (Rosaceae): Insights into structural variation and phylogenetic position. Front. Plant Sci. 2025, 16, 1584289. [Google Scholar] [CrossRef] [Scilit] [PubMed]
- Meng, D.N.; Lu, T.X.; He, M.; Ren, Y.Z.; Fu, M.M.; Zhang, Y.X.; Yang, P.F.; Lin, X.Y.; Yang, Y.; Zhang, Y.; et al. Organelle genomes of two Scaevola species, S. taccada and S. hainanensis, provide new insights into evolutionary divergence between Scaevola and its related species. Front. Plant Sci. 2025, 16, 1587750. [Google Scholar] [CrossRef] [Scilit] [PubMed]
- Kremer, A.; Abbott, A.G.; Carlson, J.E.; Manos, P.S.; Plomion, C.; Sisco, P.; Staton, M.E.; Ueno, S.; Vendramin, G.G. Genomics of Fagaceae. Tree Genet. Genomes 2012, 8, 583–610. [Google Scholar] [CrossRef] [Scilit]
- Cannon, C.H.; Brendel, O.; Deng, M.; Hipp, A.L.; Kremer, A.; Kua, C.S.; Plomion, C.; Romero-Severson, J.; Sork, V.L. Gaining a global perspective on Fagaceae genomic diversification and adaptation. New Phytol. 2018, 218, 894–897. [Google Scholar] [CrossRef] [Scilit] [PubMed]
- Cavender-Bares, J. Diversification, adaptation, and community assembly of the American oaks (Quercus), a model clade for integrating ecology and evolution. New Phytol. 2019, 221, 669–692. [Google Scholar] [CrossRef] [Scilit] [PubMed]
- Kremer, A.; Hipp, A.L. Oaks: An evolutionary success story. New Phytol. 2020, 226, 987–1011. [Google Scholar] [CrossRef] [Scilit] [PubMed]
- Sork, V.L.; Riordan, E.; Gugger, P.F.; Fitz-Gibbon, S.; Wei, X.; Ortego, J. Phylogeny and introgression of California scrub white oaks (Quercus section Quercus). Int. Oaks 2016, 27, 61–74. [Google Scholar]
- Li, Y.; Wang, L.; Zhang, X.W.; Zhao, Y.; Liu, Q.L.; Zang, M.Y.; Zhang, W.X.; Fang, Y.M.; Mao, L.F. Strong phylogeographic structure in major plastid lineages of East Asian Cerris oaks (Quercus subsection Campylolepides, Fagaceae): Insights from a 761-plastome analysis. Ind. Crops Prod. 2025, 226, 120731. [Google Scholar] [CrossRef] [Scilit]
- Larson, D.A.; Staton, M.E.; Kapoor, B.; Islam-Faridi, N.; Zhebentyayeva, T.; Fan, S.; Stork, J.; Thomas, A.; Ahmed, A.S.; Stanton, E.C.; et al. A haplotype-resolved reference genome of Quercus alba sheds light on the evolutionary history of oaks. New Phytol. 2025, 246, 331–348. [Google Scholar] [CrossRef] [Scilit] [PubMed]
- Fu, R.R.; Zhu, Y.X.; Liu, Y.; Feng, Y.; Lu, R.S.; Li, Y.; Li, P.; Kremer, A.; Lascoux, M.; Chen, J. Genome-wide analyses of introgression between two sympatric Asian oak species. Nat. Ecol. Evol. 2022, 6, 924–935. [Google Scholar] [CrossRef] [Scilit] [PubMed]
- Song, Y.; Pan, S.J.; Chen, B.; Xiao, Z.T.; Huang, K.R.; Li, H.; Jiang, X.L. Structural variations and phylogenetic implications of mitochondrial genomes in oaks. Ind. Crops Prod. 2025, 235, 121817. [Google Scholar] [CrossRef] [Scilit]
- Shen, R.H.; Li, Y.; Yang, L.H.; Zheng, S.S.; Yan, X.; Kozlowski, G.; Dai, X.L.; Song, Y.G. Unraveling the mitochondrial genome of Quercus litseoides: A step towards conservation of an endangered species. Front. Plant Sci. 2025, 16, 1620373. [Google Scholar] [CrossRef] [Scilit] [PubMed]
- Song, Y.G.; Petitpierre, B.; Deng, M.; Wu, J.P.; Kozlowski, G. Predicting climate change impacts on the threatened Quercus arbutifolia in montane cloud forests in southern China and Vietnam: Conservation implications. For. Ecol. Manag. 2019, 444, 269–279. [Google Scholar] [CrossRef] [Scilit]
- Xu, J.; Jiang, X.L.; Deng, M.; Westwood, M.; Song, Y.G.; Zheng, S.S. Conservation genetics of rare trees restricted to subtropical montane cloud forests in southern China: A case study from Quercus arbutifolia (Fagaceae). Tree Genet. Genomes 2016, 12, 90. [Google Scholar] [CrossRef] [Scilit]
- Doyle, J.J. A rapid DNA isolation procedure for small quantities of fresh leaf tissue. Phytochem. Bull. 1987, 19, 11–15. [Google Scholar]
- Tang, S.Y.; Liang, Y.Y.; Wu, F.Q.; Wu, Y.; Li, J.W.; Lin, L.N.; Feng, J.T.; Luan, A.P.; Wang, Y.; Xu, C.X.; et al. HiMT: An integrative toolkit for assembling organelle genomes using HiFi reads. Plant Commun. 2025, 6, 101467. [Google Scholar] [CrossRef] [Scilit] [PubMed]
- Li, J.L.; Ni, Y.; Lu, Q.Q.; Chen, H.M.; Liu, C. PMGA: A plant mitochondrial genome annotator. Plant Commun. 2025, 6, 101191. [Google Scholar] [CrossRef] [Scilit] [PubMed]
- Tillich, M.; Lehwark, P.; Pellizzer, T.; Ulbricht-Jones, E.S.; Fischer, A.; Bock, R.; Greiner, S. GeSeq—Versatile and accurate annotation of organelle genomes. Nucleic Acids Res. 2017, 45, W6–W11. [Google Scholar] [CrossRef] [Scilit] [PubMed]
- Greiner, S.; Lehwark, P.; Bock, R. OrganellarGenomeDRAW (OGDRAW) version 1.3.1: Expanded toolkit for the graphical visualization of organellar genomes. Nucleic Acids Res. 2019, 47, W59–W64. [Google Scholar] [CrossRef] [Scilit] [PubMed]
- Beier, S.; Thiel, T.; Münch, T.; Scholz, U.; Mascher, M. MISA-web: A web server for microsatellite prediction. Bioinformatics 2017, 33, 2583–2585. [Google Scholar] [CrossRef] [Scilit] [PubMed]
- Benson, G. Tandem repeats finder: A program to analyze DNA sequences. Nucleic Acids Res. 1999, 27, 573–580. [Google Scholar] [CrossRef] [Scilit] [PubMed]
- Kurtz, S. The Vmatch large scale sequence analysis software—A manual. Cent. Bioinform. 2010, 170, 391–392. [Google Scholar]
- Wright, F. The ‘effective number of codons’ used in a gene. Gene 1990, 87, 23–29. [Google Scholar] [CrossRef] [Scilit] [PubMed]
- Mazdziarz, M.; Krawczyk, K. Transgenomes: Automated detection and characterization of mitochondrial-plastid DNA transfers. J. Plant Res. 2026, 139, 615–627. [Google Scholar] [CrossRef] [Scilit] [PubMed]
- He, W.M.; Yang, J.; Jing, Y.; Xu, L.; Yu, K.; Fang, X.D. NGenomeSyn: An easy-to-use and flexible tool for publication-ready visualization of syntenic relationships across multiple genomes. Bioinformatics 2023, 39, btad121. [Google Scholar] [CrossRef] [Scilit] [PubMed]
- Li, H.E.; Guo, Q.Q.; Xu, L.; Gao, H.D.; Liu, L.; Zhou, X.Y. CPJSdraw: Analysis and visualization of junction sites of chloroplast genomes. PeerJ 2023, 11, e15326. [Google Scholar] [CrossRef] [Scilit] [PubMed]
- Huang, L.J.; Yu, H.X.; Wang, Z.; Xu, W.B. CPStools: A package for analyzing chloroplast genome sequences. iMetaOmics 2024, 1, e25. [Google Scholar] [CrossRef] [Scilit] [PubMed]
- Katoh, K.; Standley, D.M. MAFFT multiple sequence alignment software version 7: Improvements in performance and usability. Mol. Biol. Evol. 2013, 30, 772–780. [Google Scholar] [CrossRef] [Scilit] [PubMed]
- Capella-Gutiérrez, S.; Silla-Martínez, J.M.; Gabaldón, T. trimAl: A tool for automated alignment trimming in large-scale phylogenetic analyses. Bioinformatics 2009, 25, 1972–1973. [Google Scholar] [CrossRef] [Scilit] [PubMed]
- Wong, T.K.F.; Ly-Trong, N.; Ren, H.Y.; Demotte, P.; Baños, H.; Roger, A.J.; Susko, E.; Bielow, C.; De Maio, N.; Goldman, N.; et al. IQ-TREE 3: Phylogenomic inference software using complex evolutionary models. Mol. Biol. Evol. 2026, 43, msag117. [Google Scholar] [CrossRef] [Scilit] [PubMed]
- Feng, S.B.; Wu, Z.N.; Tian, C.Y.; Yang, Y.T.; Gong, W.L.; Li, Z.Y. Assembly and comparative analysis of the complete mitochondrial genome of Bromus inermis. Genes 2025, 16, 652. [Google Scholar] [CrossRef] [Scilit] [PubMed]
- Wang, D.; Wu, Y.W.; Shih, A.C.C.; Wu, C.S.; Wang, Y.N.; Chaw, S.M. Transfer of chloroplast genomic DNA to mitochondrial genome occurred at least 300 MYA. Mol. Biol. Evol. 2007, 24, 2040–2048. [Google Scholar] [CrossRef] [Scilit] [PubMed]
- Wang, H.C.; Wang, D.Y.; Shao, B.Y.; Li, J.R.; Li, Z.H.; Chase, M.W.; Li, J.W.; Feng, Y.L.; Wen, Y.Y.; Qin, S.Y.; et al. Unequally abundant chromosomes and unusual collections of transferred sequences characterize mitochondrial genomes of Gastrodia (Orchidaceae), one of the largest mycoheterotrophic plant genera. Mol. Biol. Evol. 2025, 42, msaf082. [Google Scholar] [CrossRef] [Scilit] [PubMed]
- Wynn, E.L.; Christensen, A.C. Repeats of unusual size in plant mitochondrial genomes: Identification, incidence and evolution. G3 Genes Genomes Genet. 2019, 9, 549–559. [Google Scholar] [CrossRef] [Scilit] [PubMed]
- Cai, Y.S.; Chen, H.M.; Ni, Y.; Li, J.L.; Zhang, J.H.; Liu, C. Repeat-mediated recombination results in complex DNA structure of the mitochondrial genome of Trachelospermum jasminoides. BMC Plant Biol. 2024, 24, 966. [Google Scholar] [CrossRef] [Scilit] [PubMed]
- Sheng, W.T. The complete mitochondrial genome of Cenchrus fungigraminus indicates structural dynamics and sequence divergences in Poaceae family. Front. Plant Sci. 2025, 16, 1589847. [Google Scholar] [CrossRef] [Scilit] [PubMed]
- Cole, L.W.; Guo, W.H.; Mower, J.P.; Palmer, J.D. High and variable rates of repeat-mediated mitochondrial genome rearrangement in a genus of plants. Mol. Biol. Evol. 2018, 35, 2773–2785. [Google Scholar] [CrossRef] [Scilit] [PubMed]
- Yong, Y.S.; Wang, Y.L.; Wang, D.W.; Yuan, X.F.; Zhang, Q.S. The organelle genomes of the endangered seagrass Zostera caespitosa reveal sequence divergences, massive gene transfer, and uncommon RNA editing types. Front. Plant Sci. 2025, 16, 1550467. [Google Scholar] [CrossRef] [Scilit] [PubMed]
- Ran, Z.H.; Li, Z.; Xiao, X.; Gu, W.H.; An, M.T.; Xu, J.; Guo, Z.X. Organellar genome evolution in Camellia tianeensis (Theaceae): Comparative insights into RNA editing, codon usage, and DNA transfer between chloroplast and mitochondrion. BMC Genom. 2026, 27, 270. [Google Scholar] [CrossRef] [Scilit] [PubMed]
- Nhat Nam, N.; Pham Anh Thi, N.; Do, H.D.K. New insights into the diversity of mitochondrial plastid DNA. Genome Biol. Evol. 2024, 16, evae184. [Google Scholar] [CrossRef] [Scilit] [PubMed]
- Gandini, C.L.; Sanchez-Puerta, M.V. Foreign plastid sequences in plant mitochondria are frequently acquired via mitochondrion-to-mitochondrion horizontal transfer. Sci. Rep. 2017, 7, 43402. [Google Scholar] [CrossRef] [Scilit] [PubMed]
- Wang, X.C.; Chen, H.M.; Yang, D.; Liu, C. Diversity of mitochondrial plastid DNAs (MTPTs) in seed plants. Mitochondrial DNA Part A 2018, 29, 635–642. [Google Scholar] [CrossRef] [Scilit] [PubMed]
- Notsu, Y.; Masood, S.; Nishikawa, T.; Kubo, N.; Akiduki, G.; Nakazono, M.; Hirai, A.; Kadowaki, K. The complete sequence of the rice (Oryza sativa L.) mitochondrial genome: Frequent DNA sequence acquisition and loss during the evolution of flowering plants. Mol. Genet. Genom. 2002, 268, 434–445. [Google Scholar] [CrossRef] [Scilit] [PubMed]
- Smith, D.R.; Keeling, P.J. Mitochondrial and plastid genome architecture: Reoccurring themes, but significant differences at the extremes. Proc. Natl. Acad. Sci. USA 2015, 112, 10177–10184. [Google Scholar] [CrossRef] [Scilit] [PubMed]
- Palmer, J.D. Contrasting modes and tempos of genome evolution in land plant organelles. Trends Genet. 1990, 6, 115–120. [Google Scholar] [CrossRef] [Scilit] [PubMed]
- Zhang, T.W.; Fang, Y.J.; Wang, X.M.; Deng, X.; Zhang, X.W.; Hu, S.N.; Yu, J. The complete chloroplast and mitochondrial genome sequences of Boea hygrometrica: Insights into the evolution of plant organellar genomes. PLoS ONE 2012, 7, e30531. [Google Scholar] [CrossRef] [Scilit] [PubMed]
- Pan, L.; Cai, L.R.; Lu, Y.; Zhao, J.M.; Yan, X.B.; Wang, X.S. Genomic insights into Paspalum vaginatum: Mitochondrial and chloroplast genome mapping, evolutionary insights, and organelle-nucleus communication. Genomics 2025, 117, 110975. [Google Scholar] [CrossRef] [Scilit] [PubMed]
- Zhang, S.; Chang, S.X.; Lin, X.G.; Xu, S.S.; Leng, Q.Y.; Li, H.Y.; Lopez, H.A.; Yin, J.M.; Wu, Z.Q.; Niu, J.H. Comparative genomics uncovers organellar genome structural divergence in Caryophyllales and reveals widespread non-coding transcription in Bougainvillea glabra organellar genomes. BMC Genom. 2025, 26, 722. [Google Scholar] [CrossRef] [Scilit] [PubMed]
- Wicke, S.; Schneeweiss, G.M.; Depamphilis, C.W.; Müller, K.F.; Quandt, D. The evolution of the plastid chromosome in land plants: Gene content, gene order, gene function. Plant Mol. Biol. 2011, 76, 273–297. [Google Scholar] [CrossRef] [Scilit] [PubMed]
- Gualberto, J.M.; Newton, K.J. Plant mitochondrial genomes: Dynamics and mechanisms of mutation. Annu. Rev. Plant Biol. 2017, 68, 225–252. [Google Scholar] [CrossRef] [Scilit] [PubMed]
- Kim, S.C.; Kang, E.S.; Kim, T.H.; Choi, Y.R.; Kim, H.J. Report on the complete organelle genomes of Orobanche filicicola Nakai ex Hyun, Y.S. Lim & H.C. Shin (Orobanchaceae): Insights from comparison with Orobanchaceae plant genomes. BMC Genom. 2025, 26, 157. [Google Scholar] [CrossRef] [Scilit] [PubMed]
- Liu, D.L.; Zhang, Z.H.; Hao, Y.L.; Li, M.G.; Yu, H.L.; Zhang, X.R.; Mi, H.Y.; Cheng, L.; Zhao, Y.Y. Decoding the complete organelle genomic architecture of Stewartia gemmata: An early-diverging species in Theaceae. BMC Genom. 2024, 25, 114. [Google Scholar] [CrossRef] [Scilit] [PubMed]
- Zhou, M.; Long, W.; Li, X. Patterns of synonymous codon usage bias in chloroplast genomes of seed plants. For. Stud. China 2008, 10, 235–242. [Google Scholar] [CrossRef] [Scilit]
- Lyu, Z.Y.; Yang, G.M.; Zhou, X.L.; Wang, S.Q.; Zhang, R.; Shen, S.K. Deciphering the complex organelle genomes of two Rhododendron species and insights into adaptive evolution patterns in high-altitude. BMC Plant Biol. 2024, 24, 1054. [Google Scholar] [CrossRef] [Scilit] [PubMed]
- Burger, G.; Gray, M.W.; Lang, B.F. Mitochondrial genomes: Anything goes. Trends Genet. 2003, 19, 709–716. [Google Scholar] [CrossRef] [Scilit] [PubMed]
- Li, Q.; Wei, R. Complete plastome and mitogenome assembly of endangered tree Karpatiosorbus bristoliensis reveals phylogenetic architecture for Sorbus sensu lato (Rosaceae). Front. Plant Sci. 2025, 16, 1619267. [Google Scholar] [CrossRef] [Scilit] [PubMed]
- Wang, J.; Zou, Y.; Mower, J.P.; Reeve, W.; Wu, Z.Q. Rethinking the mutation hypotheses of plant organellar DNA. Genom. Commun. 2024, 1, e003. [Google Scholar] [CrossRef] [Scilit]
- Lin, D.L.; Shao, B.Y.; Gao, Z.Y.; Li, J.W.; Li, Z.H.; Li, T.Y.; Huang, W.C.; Zhong, X.; Xu, C.; Chase, M.W.; et al. Phylogenomics of angiosperms based on mitochondrial genes: Insights into deep node relationships. BMC Biol. 2025, 23, 45, Correction in BMC Biol. 2025, 23, 77. [Google Scholar] [CrossRef] [Scilit] [PubMed]
- Wang, Y.H.; Qin, G.J.; He, B.Y.; Xue, Y.T.; Li, H.Y.; Zhang, S.M.; Li, S.M.; Deng, H.; Hu, X.; Wu, Y.L.; et al. Comparative organellar genomics of four Jasminum accessions reveals adaptive divergence and phylogenomic conflicts in Oleaceae. Ind. Crops Prod. 2025, 234, 121544. [Google Scholar] [CrossRef] [Scilit]
- Kao, T.T.; Wang, T.H.; Ku, C. Rampant nuclear–mitochondrial–plastid phylogenomic discordance in globally distributed calcifying microalgae. New Phytol. 2022, 235, 1394–1408. [Google Scholar] [CrossRef] [Scilit] [PubMed]
- Steenwyk, J.L.; Li, Y.N.; Zhou, X.F.; Shen, X.X.; Rokas, A. Incongruence in the phylogenomics era. Nat. Rev. Genet. 2023, 24, 834–850. [Google Scholar] [CrossRef] [Scilit] [PubMed]
- Folk, R.A.; Mandel, J.R.; Freudenstein, J.V. Ancestral gene flow and parallel organellar genome capture result in extreme phylogenomic discord in a lineage of angiosperms. Syst. Biol. 2017, 66, 320–337. [Google Scholar] [CrossRef] [Scilit] [PubMed]
- Tyszka, A.S.; Bretz, E.C.; Robertson, H.M.; Woodcock-Girard, M.D.; Ramanauskas, K.; Larson, D.A.; Stull, G.W.; Walker, J.F. Characterizing conflict and congruence of molecular evolution across organellar genome sequences for phylogenetics in land plants. Front. Plant Sci. 2023, 14, 1125107. [Google Scholar] [CrossRef] [Scilit] [PubMed]

Disclaimer/Publisher’s Note: The statements, opinions and data contained in all publications are solely those of the individual author(s) and contributor(s) and not of MDPI and/or the editor(s). MDPI and/or the editor(s) disclaim responsibility for any injury to people or property resulting from any ideas, methods, instructions or products referred to in the content. |
© 2026 by the authors. Licensee MDPI, Basel, Switzerland. This article is an open access article distributed under the terms and conditions of the Creative Commons Attribution (CC BY) license.