


Highlights
What are the main findings?
- RNA-seq analysis of human cumulus cells identified angiogenesis-related pathways as a major source of transcriptomic differences between oocyte donors and infertile patients.
- Several genes involved in vascular regulation (ANGPT1, ANGPT2, E2F7, ANKRD22, NRP2, and THBS1) showed coordinated expression changes, suggesting altered angiogenic signaling within the cumulus–oocyte complex.
- Among the validated genes, ANKRD22 and E2F7 displayed statistically significant differences, supporting their potential relevance in the follicular microenvironment.
What are the implications of the main findings?
- These results suggest that angiogenesis-related pathways may contribute to the molecular differences associated with infertility at the follicular level.
- Angiogenesis-related genes in cumulus cells may represent candidate markers for future studies aimed at improving the non-invasive assessment of oocyte competence.
- The findings provide a framework for further research exploring the role of follicular vascular dynamics in reproductive outcomes and ART success.
Abstract
Non-invasive assessment of oocyte quality remains a challenge in assisted reproductive technology (ART). Through their bidirectional communication with the gamete, cumulus cells (CCs) act as a functional mirror of oocyte competence; however, the specific angiogenic signature within this microenvironment is still poorly understood. In the present study, we performed RNA-seq on CCs from healthy oocyte donors and infertile patients, utilizing a multi-pipeline bioinformatic approach (STAR-Cufflinks, TopHat-HTSeq, and HISAT2-StringTie) to establish a high-confidence, exploratory transcriptomic profile. A set of 234 differentially expressed genes (DEGs) consistently identified across pipelines was obtained, with functional enrichment highlighting blood vessel morphogenesis and angiogenesis as primary drivers of transcriptomic divergence between groups. RT-qPCR validation in individual samples confirmed statistically significant differences for ANKRD22 (upregulated) and E2F7 (downregulated) in infertile patients, while other angiogenesis-related genes, including ANGPT1, ANGPT2 and THBS1, showed consistent but non-significant expression trends, suggesting alterations in angiogenesis-related processes within the follicular microenvironment. These findings support the presence of coordinated angiogenesis-related alterations in cumulus cells and provide a basis for future studies exploring their potential relevance in oocyte competence and ART outcomes.
1. Introduction
Recent advances in assisted reproductive technology (ART) have leveraged transcriptomic profiling to identify non-invasive biomarkers of oocyte competence. In this context, RNA sequencing (RNA-seq) of granulosa cells (GCs) has emerged as a particularly powerful approach. GCs, which are routinely discarded during follicular aspiration, offer unique and ethically non-invasive access to the follicular microenvironment, enabling researchers to uncover molecular signatures associated with oocyte quality and embryo developmental potential without compromising the gamete itself [1].
Granulosa cells play multifaceted roles in oocyte development through various mechanisms, including paracrine communication [2], gap-junctional coupling [3], and the regulation of key follicular processes. Their gene expression profiles reflect critical pathways such as cell cycle regulation, apoptosis, extracellular matrix remodelling, and notably, angiogenesis—all of which collectively dictate oocyte quality [4]. Accordingly, GCs are considered valuable indicators of follicular health and oocyte developmental competence.
While several transcriptomic studies of granulosa cells in both human [5,6] and animal models [7,8,9] have identified key gene signatures associated with reproductive outcomes, recent advances have further refined this landscape. For instance, Cadenas et al. [10] and Gan et al. [11] have identified specific transcriptomic fingerprints in CCs that serve as reliable predictors of oocyte developmental competence and clinical pregnancy success. However, a significant knowledge gap remains. Relatively few studies have specifically examined angiogenesis-related genes and their potential role in oocyte development and female infertility [12]. This gap is notable given the physiological importance of angiogenesis in ovarian function.
Angiogenesis—the formation of new blood vessels from existing ones—is a tightly regulated process that exhibits exceptional dynamism within the female reproductive system [13]. Unlike most adult tissues where angiogenesis occurs infrequently, the ovaries undergo cyclical waves of vascular growth and regression that are essential for follicular development, ovulation, and corpus luteum formation [14]. As follicles progress from the early to late stages of development, they transition from relying on passive diffusion [13] to requiring active neovascularization to meet their increasing metabolic and structural demands [15,16]. The extent of follicular vascularization not only influences follicular health, with insufficient angiogenesis being associated with follicular atresia [17], but also appears to contribute to the selection of the dominant follicle [18]. Thus, controlled angiogenesis emerges as a fundamental determinant of ovarian function and reproductive success.
Despite its biological relevance and the growing interest in GC transcriptomics, angiogenesis-related pathways remain underexplored in RNA-seq studies of human granulosa cells. To address this gap, we performed a comparative transcriptomic analysis of GCs from two clinically distinct groups: proven-fertile oocyte donors and infertile women undergoing ART.
The objectives of this study were twofold: first, to characterize global gene expression differences between fertile and infertile women; and second, to evaluate the differential expression of angiogenesis-related genes between these groups.
By investigating angiogenesis-related transcriptional patterns in GCs, this research aims not only to advance our understanding of how the granulosa cell transcriptome reflects the vascular dynamics of the ovarian follicle, but also to provide a basis for future development of clinically relevant tools in ART.
As suggested by recent profiling studies [10,19], the CC transcriptome is highly sensitive to the functional state of the oocyte. This study reinforces the potential of these cells as non-invasive diagnostic tools, specifically by characterizing how a suboptimal angiogenic niche may underline the reduced reproductive potential in infertile cohorts. Specifically, angiogenesis-related gene expression patterns may represent potential candidates for non-invasive assessment of oocyte quality, with possible implications for clinical decision-making, such as oocyte selection for vitrification or fertilization. such as oocyte selection for vitrification or fertilization. Ultimately, this work seeks to contribute to the development of more personalized and effective strategies in reproductive medicine.
2. Materials and Methods
2.1. Study Population and Ethical Statement
The study included a cohort of 30 women undergoing controlled ovarian stimulation for in vitro fertilization (IVF) at GINEFIV Assisted Reproduction Centre in Madrid. Participants were stratified into two groups: Oocyte donors (n = 15) (30.9 ± 3.7 years) and infertile women undergoing IVF due to unexplained infertility (n = 15) (36.3 ± 5.1 years).
The study protocol was approved by the Ethics Committee of the Autonomous University of Madrid (CEI-106-2075) and conducted following the Declaration of Helsinki. All participants provided written informed consent.
2.2. Inclusion and Exclusion Criteria
All women included in the study were clinically healthy, with a normal body mass index and no known metabolic, endocrine, or gynecological disorders. For the infertile group, patients were included based on the failure to achieve pregnancy after at least 12 months of unprotected intercourse, without a specific diagnosis of female factor infertility (unexplained infertility). All participants reported no unhealthy lifestyle habits, including smoking or excessive alcohol consumption.
2.3. Sample Collection and Processing
Women received treatment to induce multiple follicle development, with either ovarian stimulation with GnRH agonist long protocol or antagonist short protocol and using recombinant follicle-stimulating hormone (FSH) or human menopausal gonadotropin (hMG). Stimulation was monitored using the ultrasound measurement of follicle number and diameter. When at least two follicles presented a diameter greater than 17 mm, ovulation was induced with 250 µg of recombinant human chorionic gonadotrophin (rhCG). Transvaginal ultrasound-guided follicular puncture was performed 36 h after rhCG injection.
Cumulus cells (CCs) were retrieved mechanically during oocyte denudation at the time of oocyte collection. Immediately following recovery, CCs were preserved in 1 mL of TRIzol reagent (15596018, Life Technologies, Carlsbad, CA, USA) and stored at −80 °C for subsequent molecular analysis.
2.4. RNA Purification
Total RNA was purified using the PureLink™ RNA Mini Kit (Invitrogen, Carlsbad, CA, USA) following the manufacturer’s instructions. RNA was eluted in 60 µL of RNase-free water. RNA concentration and purity were determined using a NanoDrop™ 1000 spectrophotometer (Thermo Scientific, Braunschweig, Germany), and RNA integrity was assessed with an Agilent 2100 Bioanalyzer using the RNA 6000 Pico Chip (5067-1513, Agilent Technologies, Santa Clara, CA, USA). RNA integrity numbers (RINs) were within the acceptable range for downstream transcriptomic analyses and are provided in the Supplementary Material.
2.5. Library Preparation and Sequencing
Due to the limited amount of RNA obtained from individual cumulus cell samples and the exploratory nature of the study, RNA samples were pooled prior to library preparation to ensure sufficient RNA input. Pools were generated by combining equal amounts of high-quality RNA from each individual to ensure balanced contribution and minimize bias. Each pool therefore represents the average transcriptomic profile of the corresponding group. Each pool was generated by combining equal amounts of RNA from 3 individuals, a strategy commonly used in exploratory RNA-seq studies to ensure sufficient RNA input while maintaining biological representativeness [20].
RNA library preparation and sequencing were conducted at the Genomics Unit, Madrid Science Park, Cantoblanco Campus (Madrid, Spain). For each pool, 500 ng of RNA was used to generate libraries with the Illumina TruSeq Stranded mRNA Sample Preparation Kit (Illumina, San Diego, CA, USA). Single-end sequencing (1 × 76 bp) was conducted on a NextSeq500 sequencer (Illumina, San Diego, CA, USA).
2.6. Bioinformatic Analysis
To ensure robustness of differential expression analysis, multiple independent bioinformatic pipelines were applied. Only differentially expressed genes (DEGs) identified by at least two pipelines were considered for downstream analysis.
Read quality was assessed using FastQC (v0.11.9) [21]. Illumina adapters were removed using Trimmomatic (v0.39) [22] with default parameters. Trimmed reads were aligned to the Homo sapiens reference genome (GRCh38.p13) [23], and analysed using the following three pipelines:
- STAR-Cufflinks Pipeline: Reads were aligned using STAR (v2.7.10a) [24] with default settings. Gene quantification was performed with Cufflinks (v2.2.1) [25], followed by normalization and differential expression analysis using Cuffdiff (v2.2.1) [25].
- TopHat-HTSeq-DESeq2 Pipeline: Reads were aligned using TopHat (v2.2.1) [26], quantified with HTSeq (v0.13.5) [27], and analysed for differential expression using DESeq2 (v1.36.0) [28].
- HISAT2-StringTie-DESeq2 Pipeline: Reads were aligned using HISAT2 (v2.2.1) [29], assembled with StringTie (v2.2.1) [30], and analysed with DESeq2 (v1.36.0) [28].
Differentially expressed genes (DEGs) were identified using a Benjamini–Hochberg false discovery rate (FDR)-adjusted p-value threshold of <0.05. DEGs common to at least two pipelines were subjected to enrichment analysis using Gene Ontology (GO; release 2023) [31,32] and STRING (v12.0) [33]. The top 20 enriched GO terms were visualized using RStudio with R (v2023.09.1) [34]. Key findings were subsequently validated by RT-qPCR using individual samples.
2.7. RT-qPCR
To provide independent biological validation of the transcriptomic findings, RT-qPCR was performed using a separate cohort of individual samples (n = 9 oocyte donors and n = 9 infertile patients) that were not included in the original sequencing pools.
Ten genes were selected based on their involvement in blood vessel development, biological significance in CCs, and fold-change. For each sample, RNA (0.5 µg) was reverse-transcribed to cDNA using the iScript Advanced cDNA Synthesis Kit (BioRad Laboratories, Hercules, CA, USA) in a 20 µL reaction containing 4 µL 5× iScript Advanced Reaction Mix, 1 µL iScript Advanced Reverse Transcriptase, and nuclease-free water. Reverse transcription was performed at 46 °C for 20 min, followed by 95 °C for 1 min.
Quantitative PCR (qPCR) was performed in duplicate using a QuantStudio 1 Real-Time PCR System (Applied Biosystems, Waltham, MA, USA). Each 10 µL reaction contained 5 µL PowerUp SYBR Green Master Mix (A25742, Applied Biosystems, Vilnius, Lithuania), 2 µL cDNA, 1 µL primer pair (10 µM each), and 2 µL nuclease-free water. (Primer sequences are listed in Supplementary Table S1). GAPDH and B2M were used as housekeeping genes, and their expression stability was verified using geNorm. Cycling conditions were: 50 °C for 2 min, 95 °C for 2 min, followed by 40 cycles of 95 °C for 15 s and 56 °C for 30 s. A melt curve analysis (95 °C for 15 s, 60 °C for 1 min, 95 °C for 15 s) confirmed primer specificity.
Gene expression was quantified using the ΔΔCt method [35]. Ct values were normalized to the geometric mean of GAPDH and B2M. Normalised Ct values considered outliers (values < Q1 − 1.5 × IQR and values > Q3 + 1.5 × IQR) were excluded from the analysis. Valid normalised Ct values were relativised to the control average and represented in a box-and-whisker plot using RStudio. Significant differences (p-value < 0.05) were determined using the Mann–Whitney U test in SPSS (IBM, Armonk, NY, USA).
3. Results
3.1. Transcriptomic Profiling of Cumulus Cells
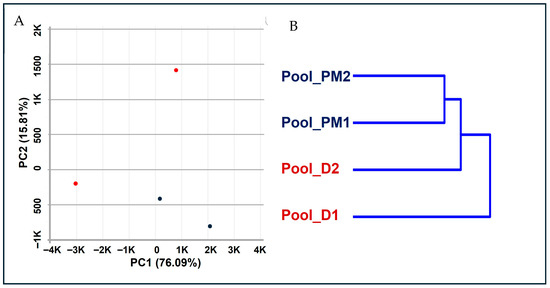
Cumulus cells (CCs) were collected from six oocyte donors and six women undergoing in vitro fertilisation (IVF) and each group was pooled into two biological replicates (Pool_D1 and Pool_D2 for oocyte donors; Pool_PM1 and Pool_PM2 for IVF patients) to enable RNA-seq analysis. This pooling strategy was implemented to obtain sufficient RNA input and is consistent with exploratory transcriptomic approaches aimed at identifying robust group-level expression patterns. Unsupervised hierarchical clustering and principal component analysis (PCA) were performed to assess transcriptomic relationships between samples.
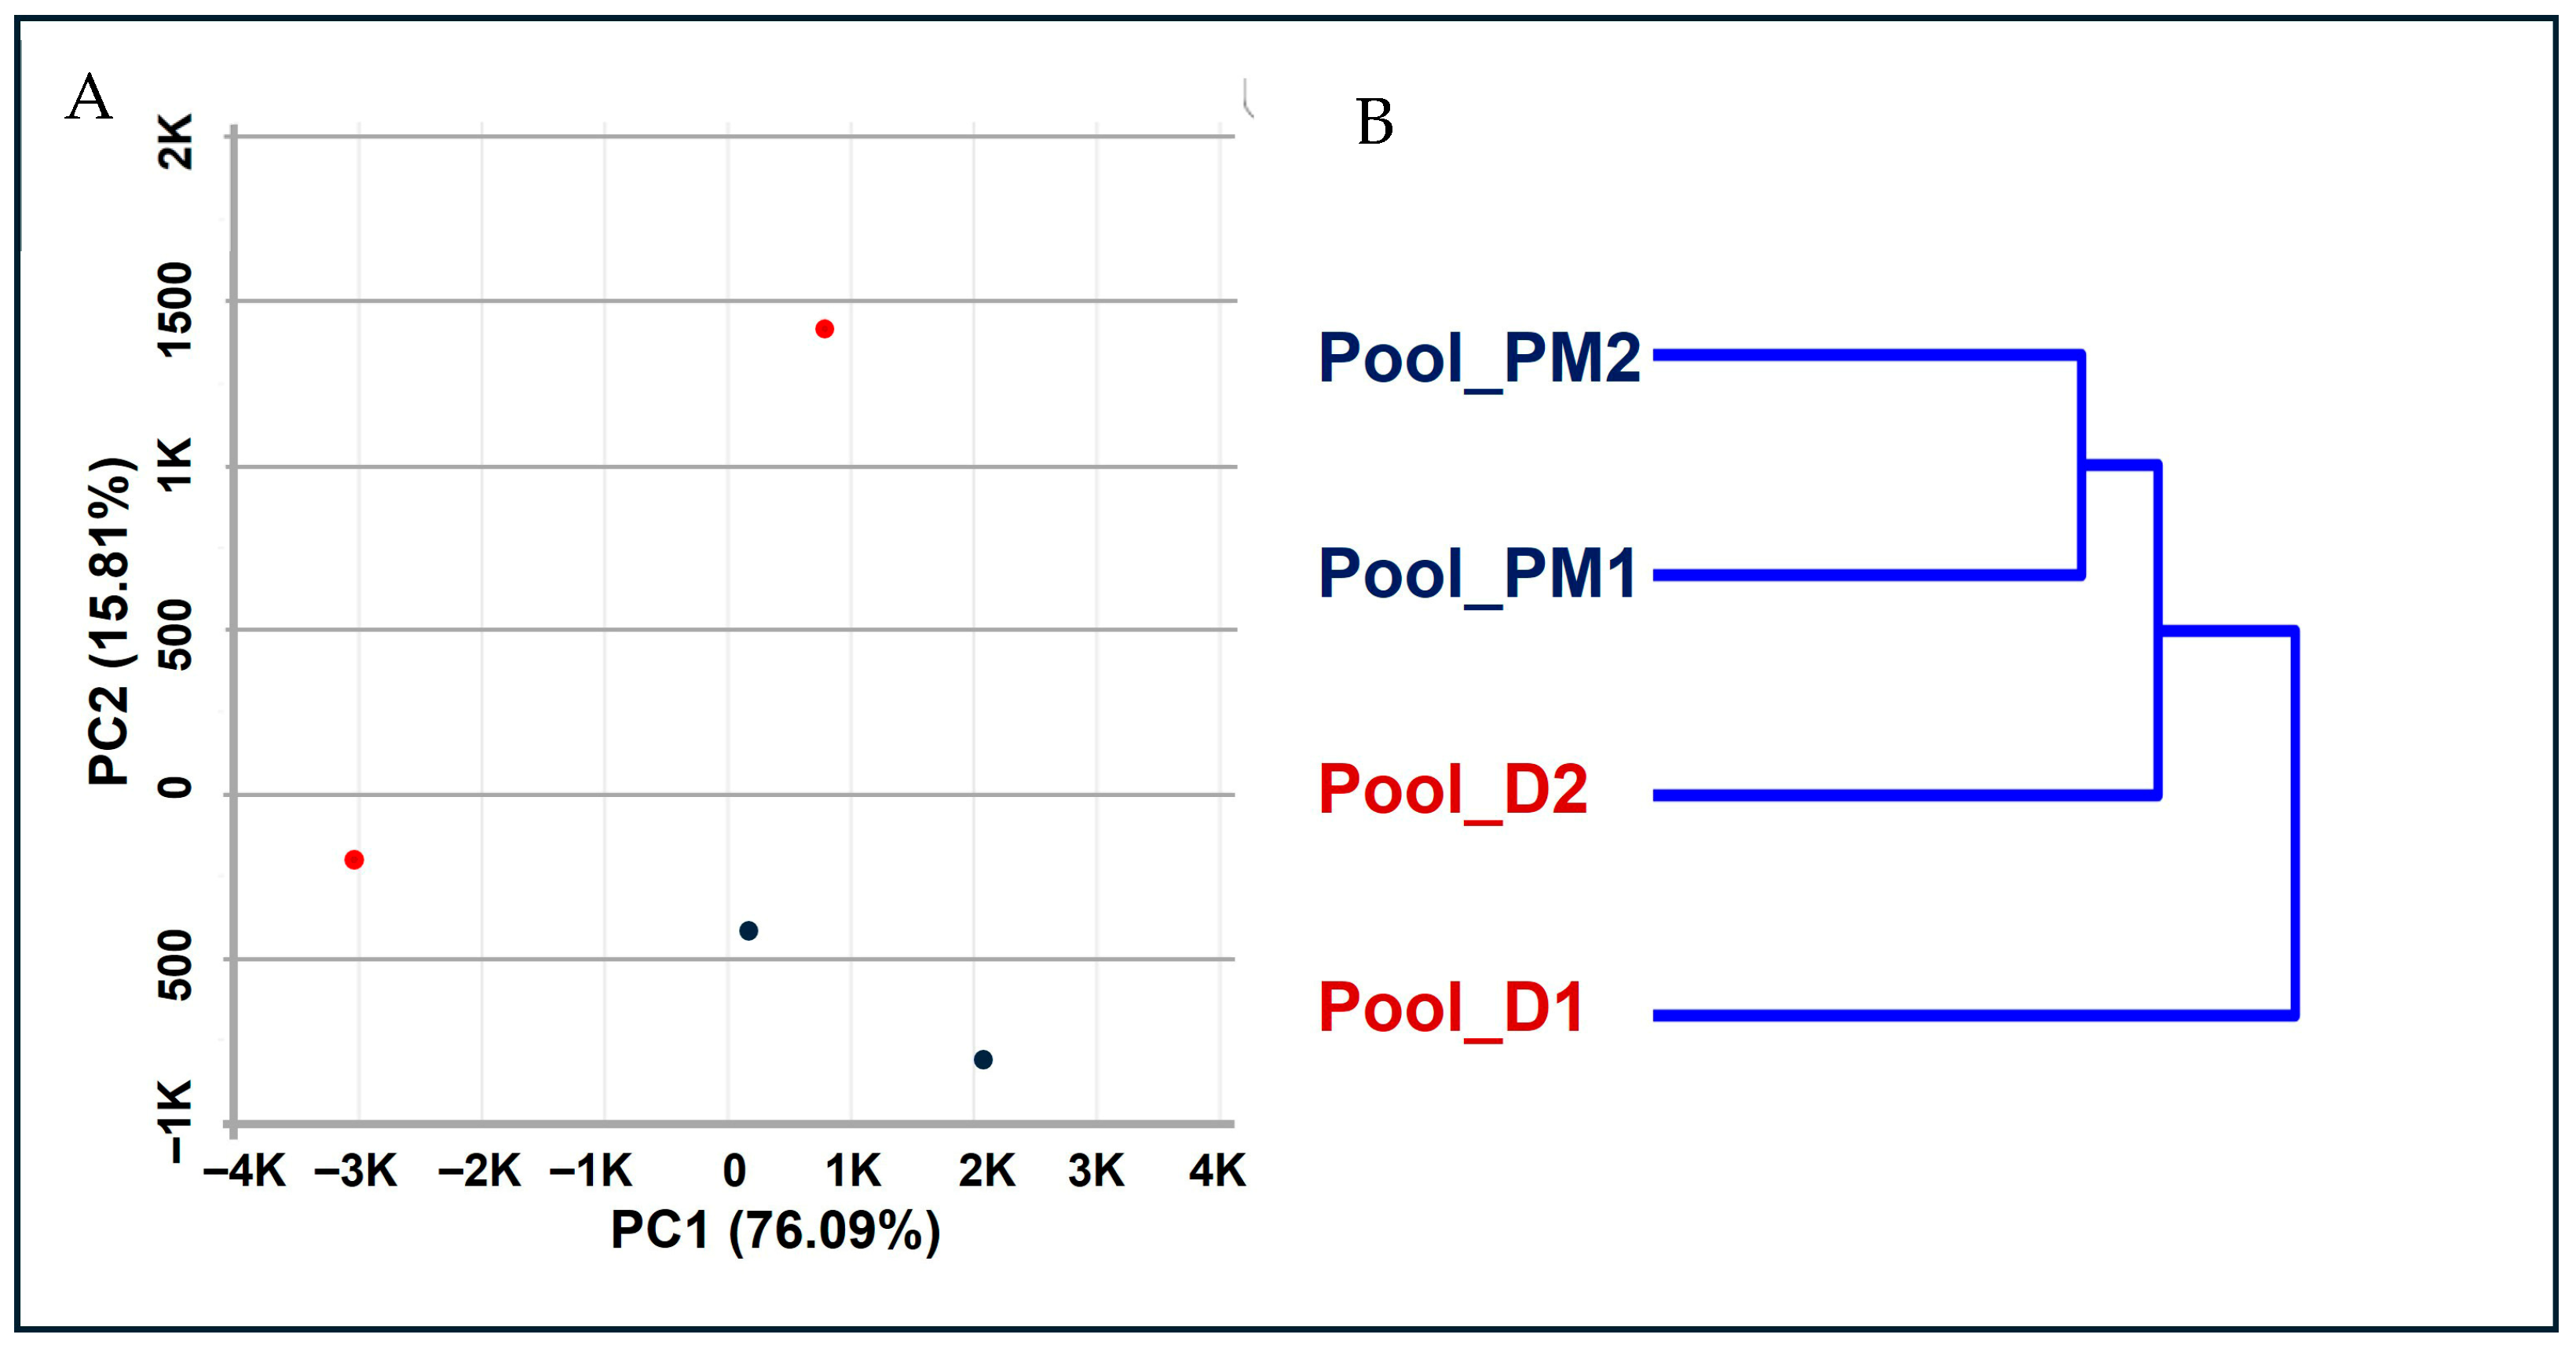
Hierarchical clustering revealed greater grouping by clinical category, with oocyte donor pools (Pool_D1 and Pool_D2) clustering together, and IVF patient pools (Pool_PM1 and Pool_PM2) (Figure 1B) forming a separate cluster. PCA showed that the first two principal components explained 91.9% of the total variance (PC1: 76.09%, PC2: 15.81%), indicating that the major sources of variability in the dataset were effectively captured (Figure 1A). Principal component analysis demonstrated clear transcriptomic differences between donors and IVF patients, consistent with distinct transcriptomic profiles. Although some intra-group variability was observed, it was more pronounced among donor pools, whereas patient samples exhibited comparatively tighter clustering.
Figure 1.
Global transcriptomic analysis of cumulus cells. (A) Principal component analysis (PCA) showing separation between oocyte donor (red) and IVF patient (blue) transcriptomes, with the first two components explaining 91.9% of the total variance. (B) Unsupervised hierarchical clustering of samples based on gene expression profiles showing grouping according to clinical group, with donor pools (Pool_D1, Pool_D2) and patient pools (Pool_PM1, Pool_PM2) forming distinct clusters.
3.2. Differential Gene Expression Analysis
To account for the limited number of pooled replicates, differential expression analysis was conducted three independent bioinformatic pipelines (see Section 2). This multi-pipeline strategy was adopted to increase robustness and reduce method-specific bias in DEG identification.
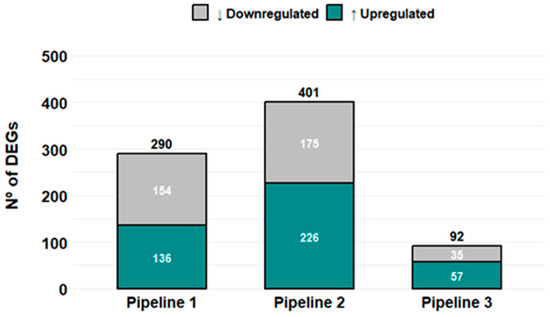
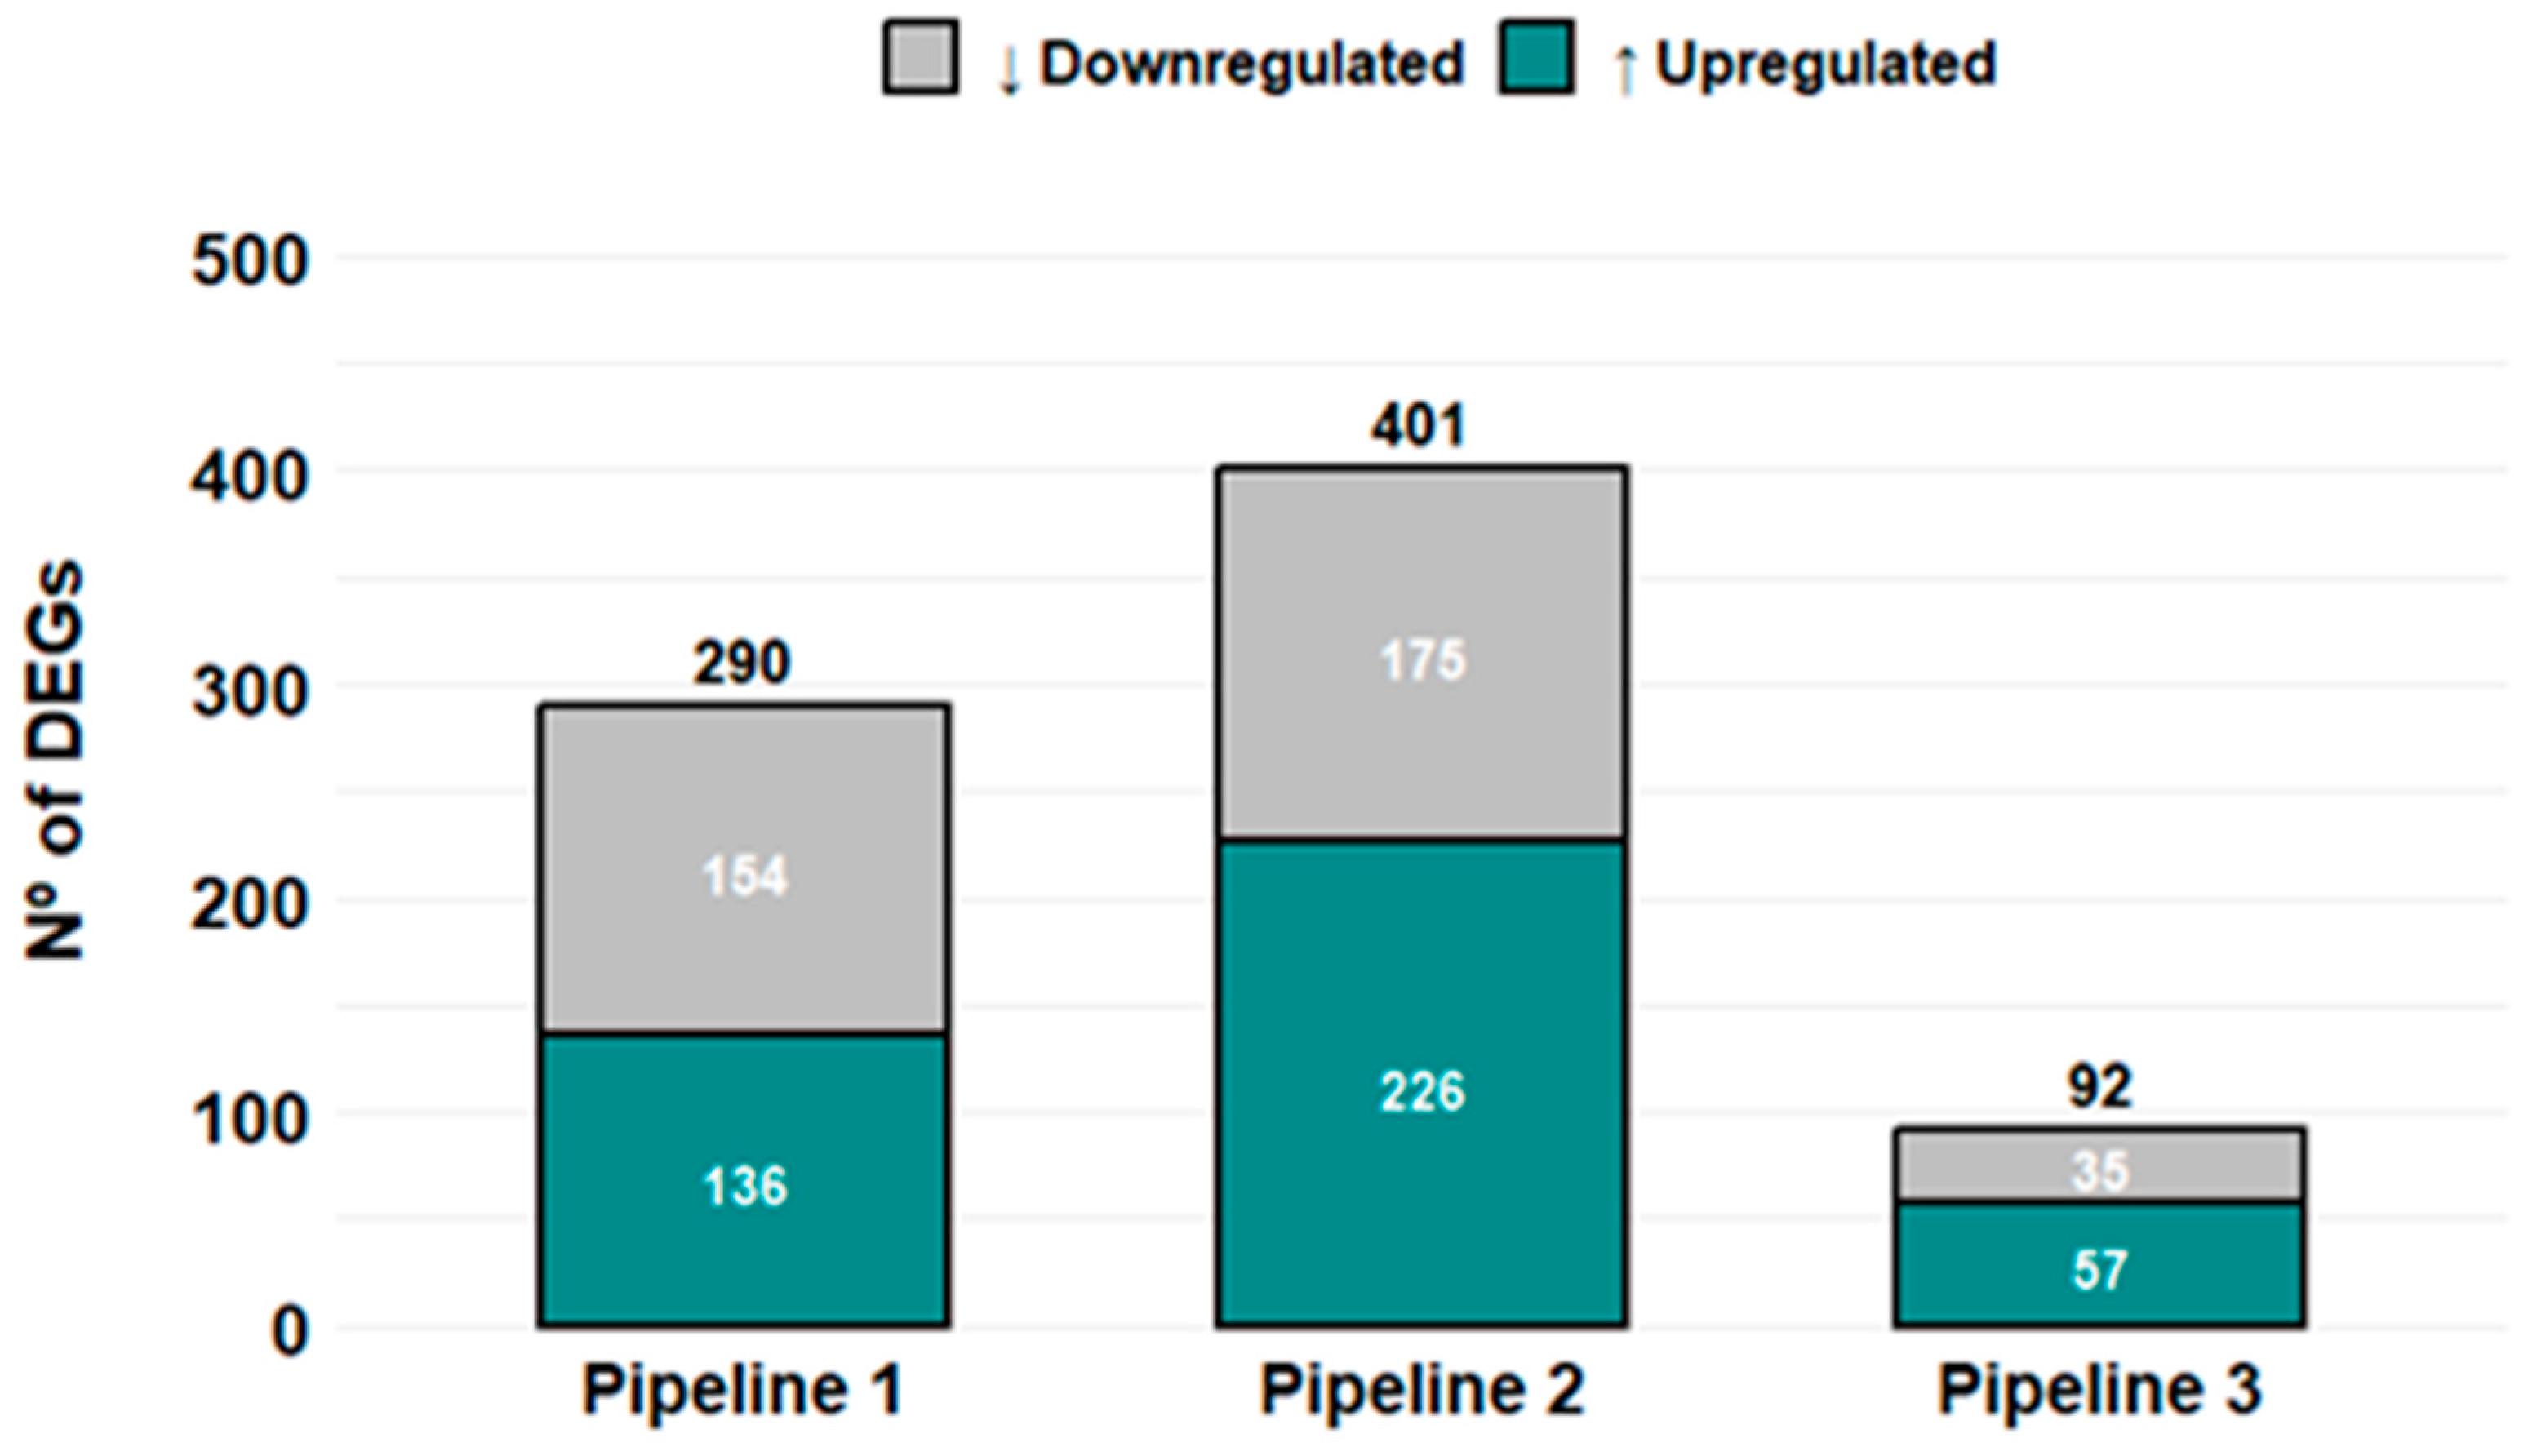
All pipelines achieved >90% read alignment to the Homo sapiens reference genome (hg38) (Supplementary Table S2). The number of differentially expressed genes (DEGs, adjusted p < 0.05) varied across pipelines: Pipeline 2 identified 401 DEGs (56% upregulated), Pipeline 1 identified 290 DEGs (46% upregulated), and Pipeline 3 identified 92 DEGs (61% upregulated) (Figure 2).
Figure 2.
Pipeline-specific detection of differentially expressed genes. Bar plot showing the number of upregulated (↑) and downregulated (↓) DEGs identified by each of the three bioinformatic pipelines comparing oocyte donors and infertile patients. Pipeline 2 detected the highest number of DEGs (n = 401), followed by Pipeline 1 (n = 290) and Pipeline 3 (n = 92). DEGs were defined according to the statistical thresholds specified in the Section 2.
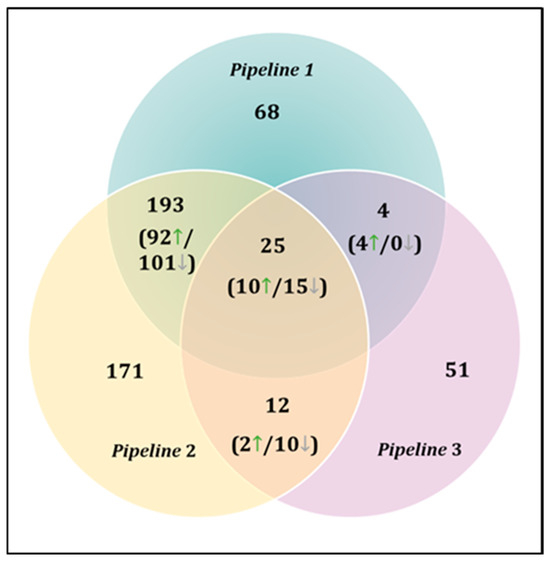
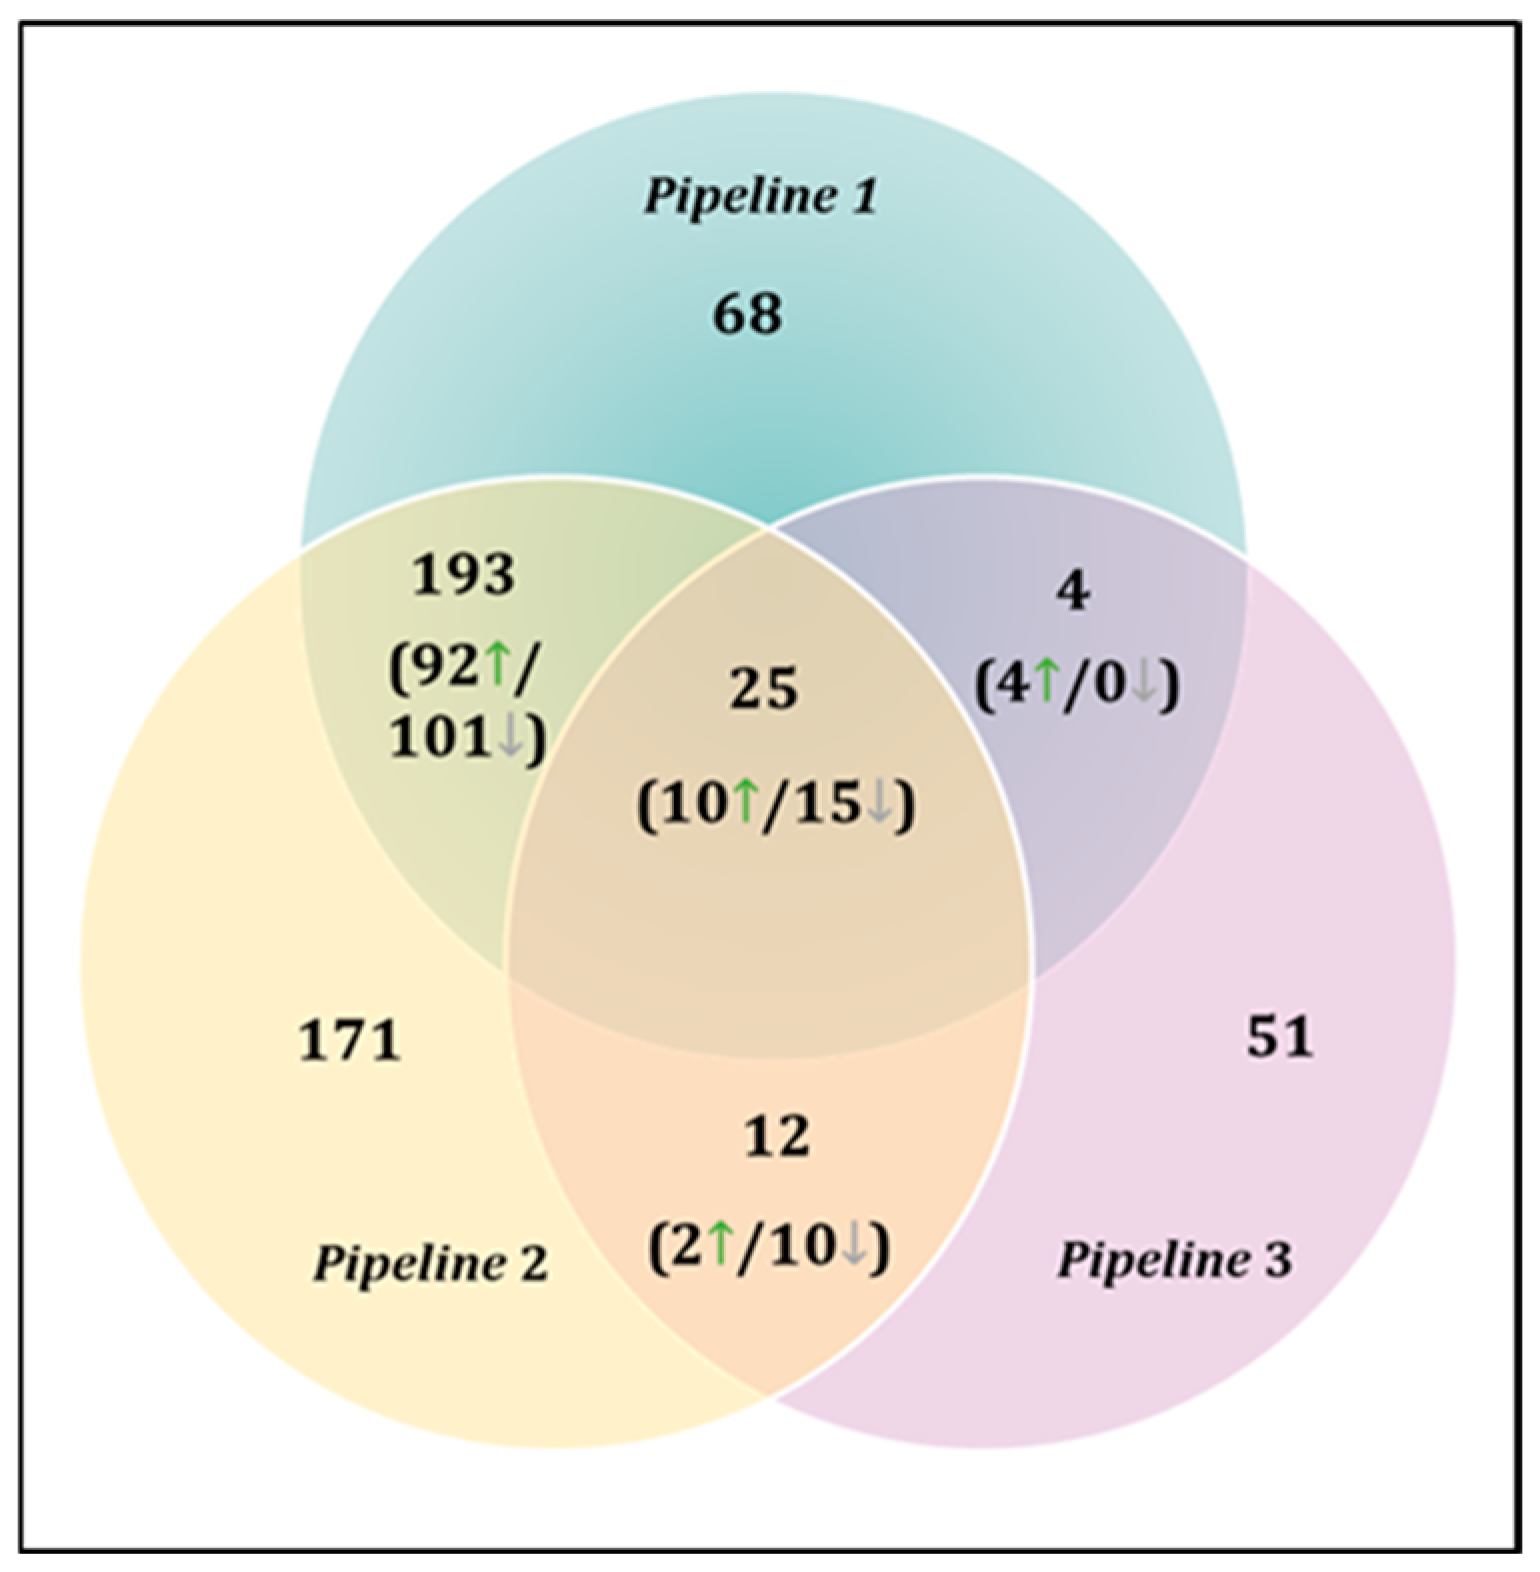
To enhance confidence in DEG selection, only genes identified in at least two pipelines were retained for downstream analyses. This consensus approach yielded 234 DEGs, including 25 genes consistently detected across all three pipelines (Figure 3).
Figure 3.
Overlap of differentially expressed genes across bioinformatic pipelines. Venn diagram illustrating the consensus of 234 DEGs identified in at least two pipelines, with 25 genes common to all three. The highest concordance was observed between Pipeline 1 and 2 (193 shared DEGs). Numbers in parentheses indicate the distribution of upregulated and downregulated genes within each overlap. Green arrows (↑) denote upregulated genes, whereas grey arrows (↓) indicate downregulated genes in infertile patients relative to oocyte donors.
The highest overlap was observed between Pipelines 1 and 2 (193 shared DEGs), while smaller overlaps were detected between Pipelines 1 and 3 (4 DEGs) and Pipelines 2 and 3 (12 DEGs). This strategy prioritizes reproducible transcriptional signals and is particularly relevant in exploratory datasets with limited biological replication.
3.3. Functional Enrichment Analysis
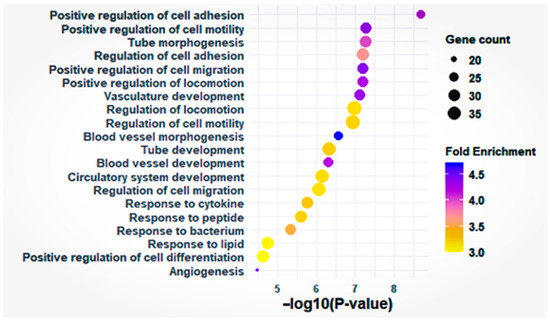
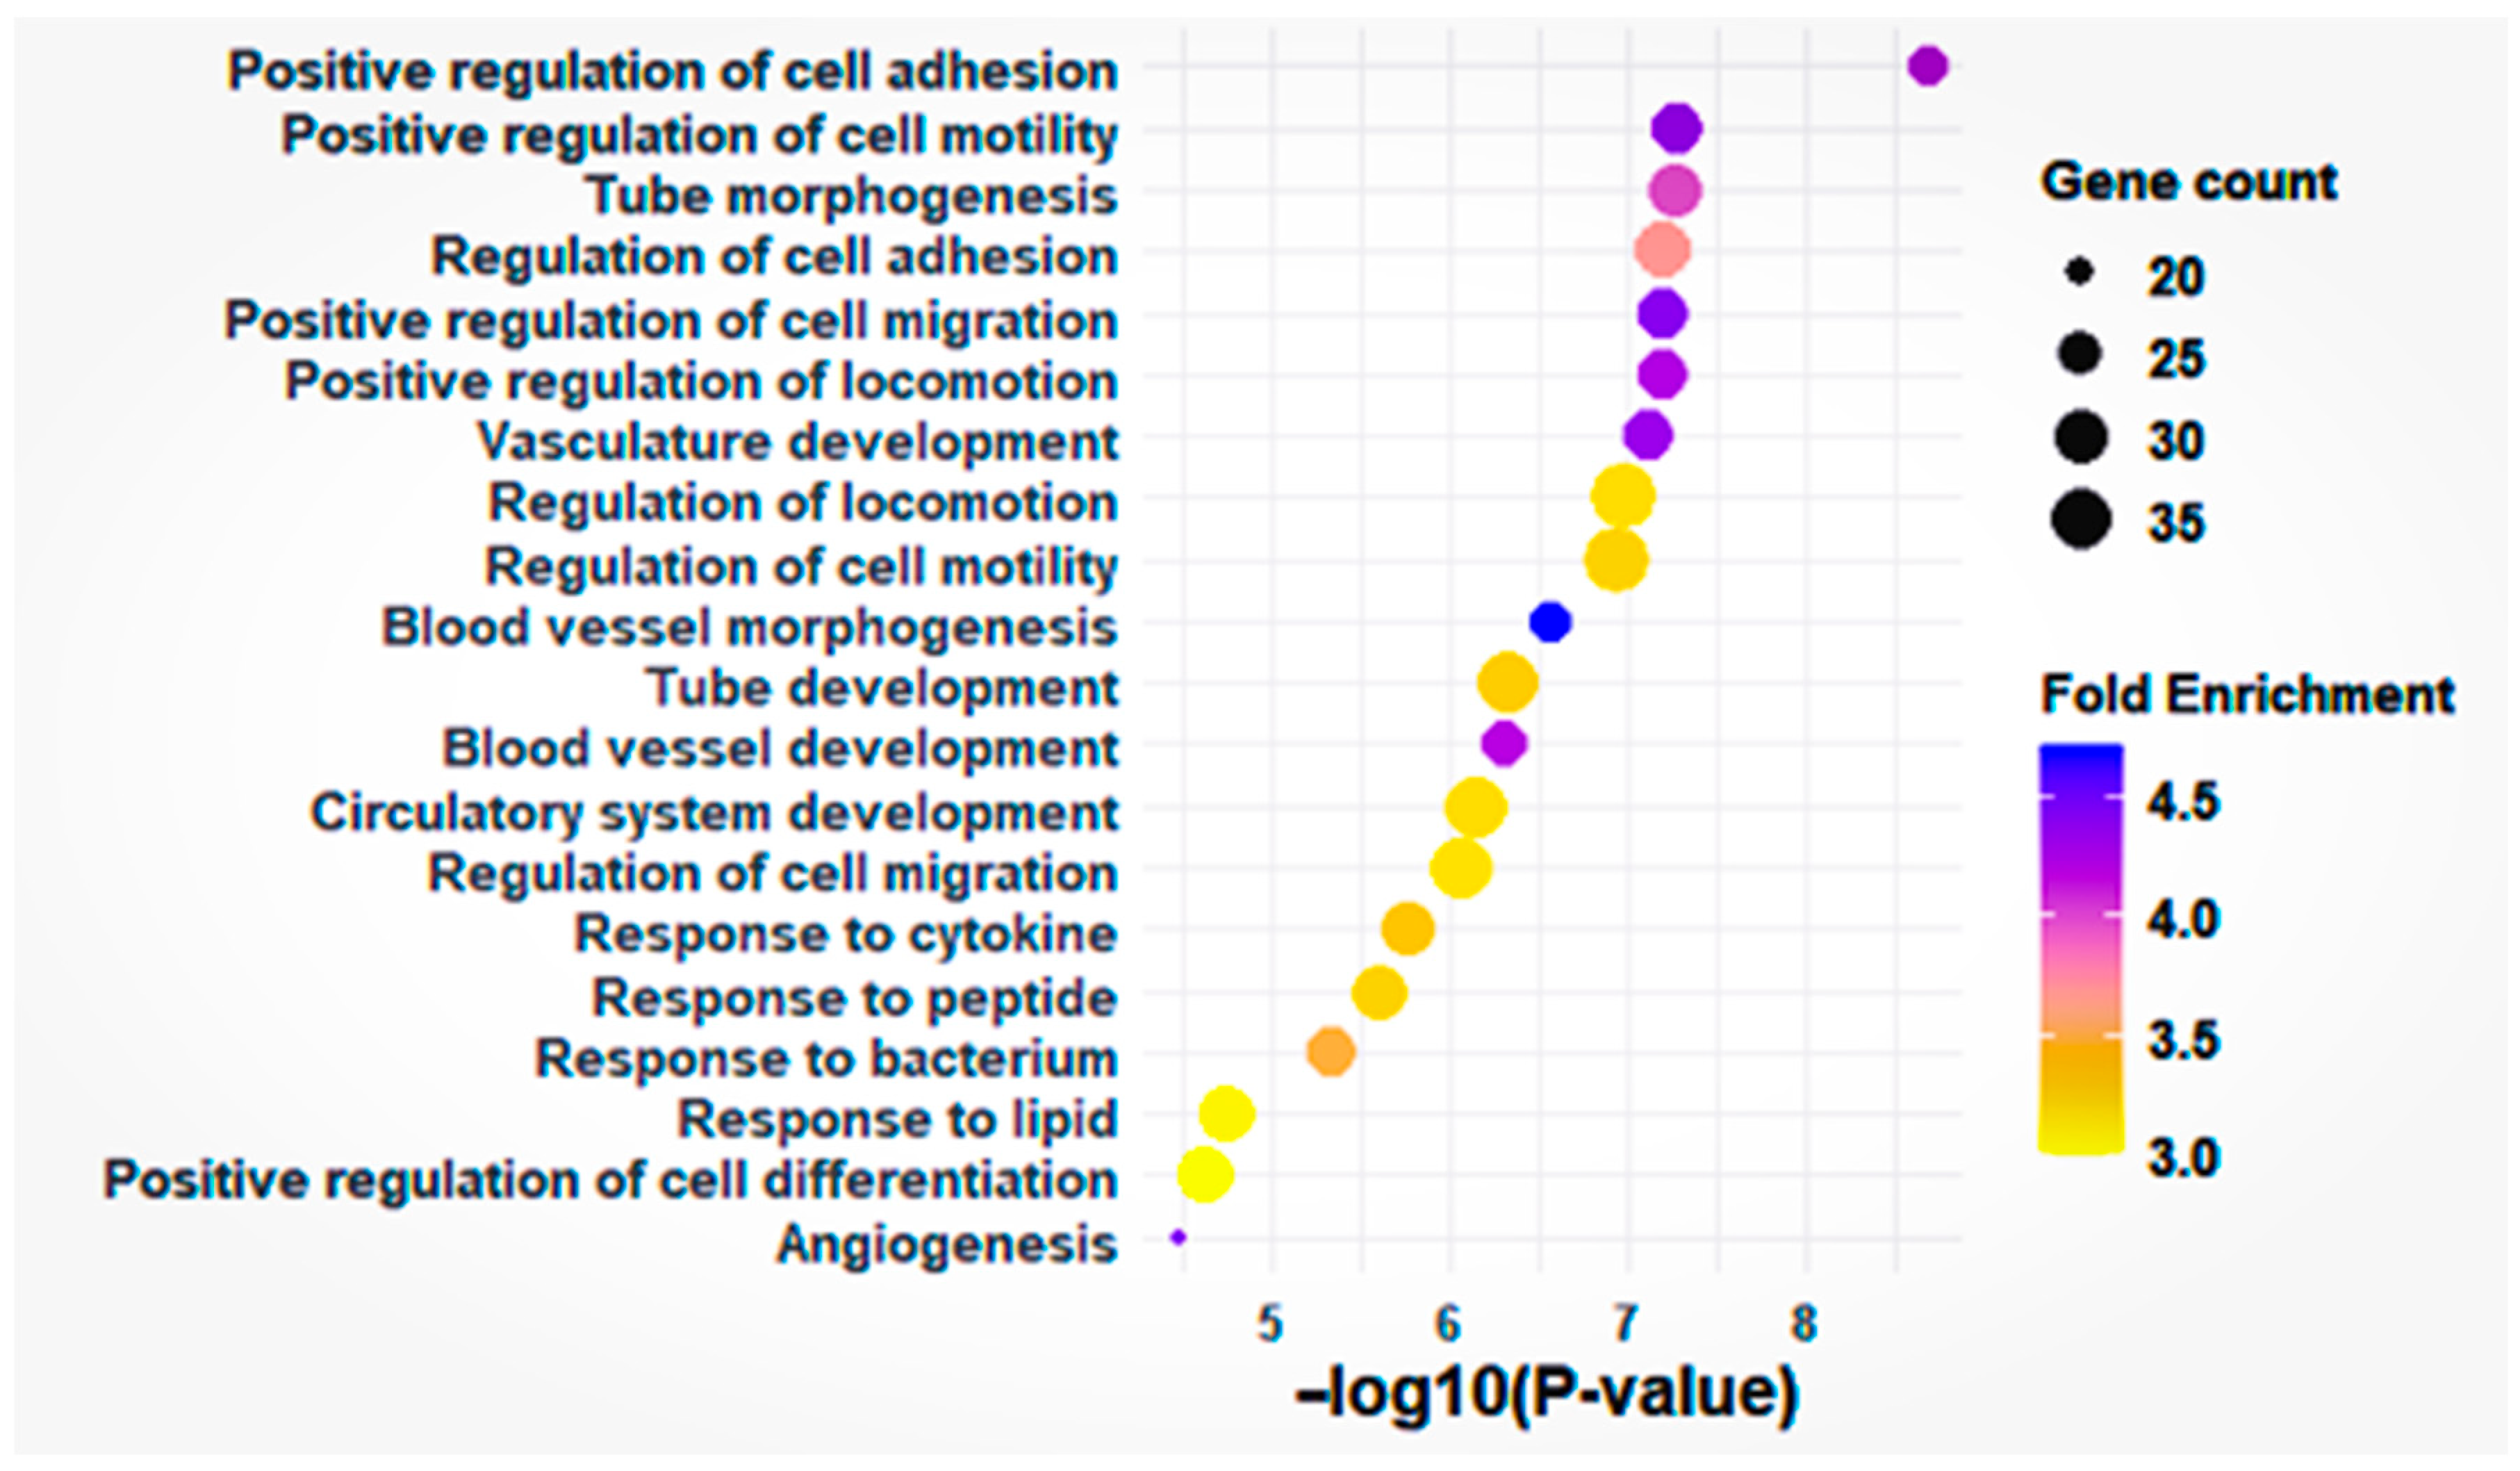
Gene Ontology (GO) analysis of the 234 DEGs revealed significant enrichment in biological processes related to cell motility, vasculature development, and responses to external stimuli (Figure 4). The most significant pathways were associated with cell migration, including Positive regulation of cell motility (GO:2000147; p = 5.22 × 10⁻⁸, fold enrichment = 4.35, 29 DEGs), Positive regulation of cell migration (GO:0030335; p = 6.32 × 10⁻⁸, fold enrichment = 4.40, 28 DEGs), and “Regulation of locomotion” (GO:0040012; p = 1.04 × 10⁻⁷, fold enrichment = 3.20, 39 DEGs) (Figure 4). Pathways related to vasculature development showed the highest fold enrichment, including Blood vessel morphogenesis (GO:0048514; p = 2.76 × 10⁻⁷, fold enrichment = 4.72, 24 DEGs) and Angiogenesis (GO:0001525; p = 3.19 × 10⁻⁵, fold enrichment = 4.45, 18 DEGs).
Figure 4.
Enrichment analysis of Gene Ontology biological processes. Scatter plot of the top 20 significantly enriched GO terms among the 234 consensus DEGs. Point size refers to the number of genes per term, color indicates fold enrichment (purple: high, yellow: low). Enriched terms include processes related to angiogenesis, blood vessel development, and cell migration.
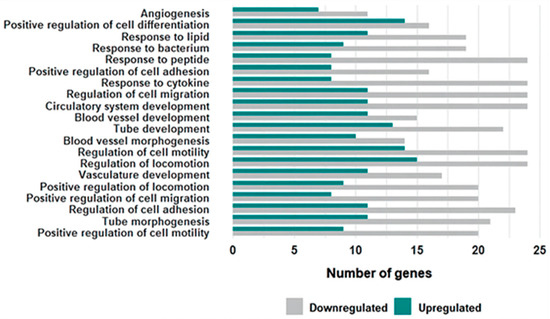
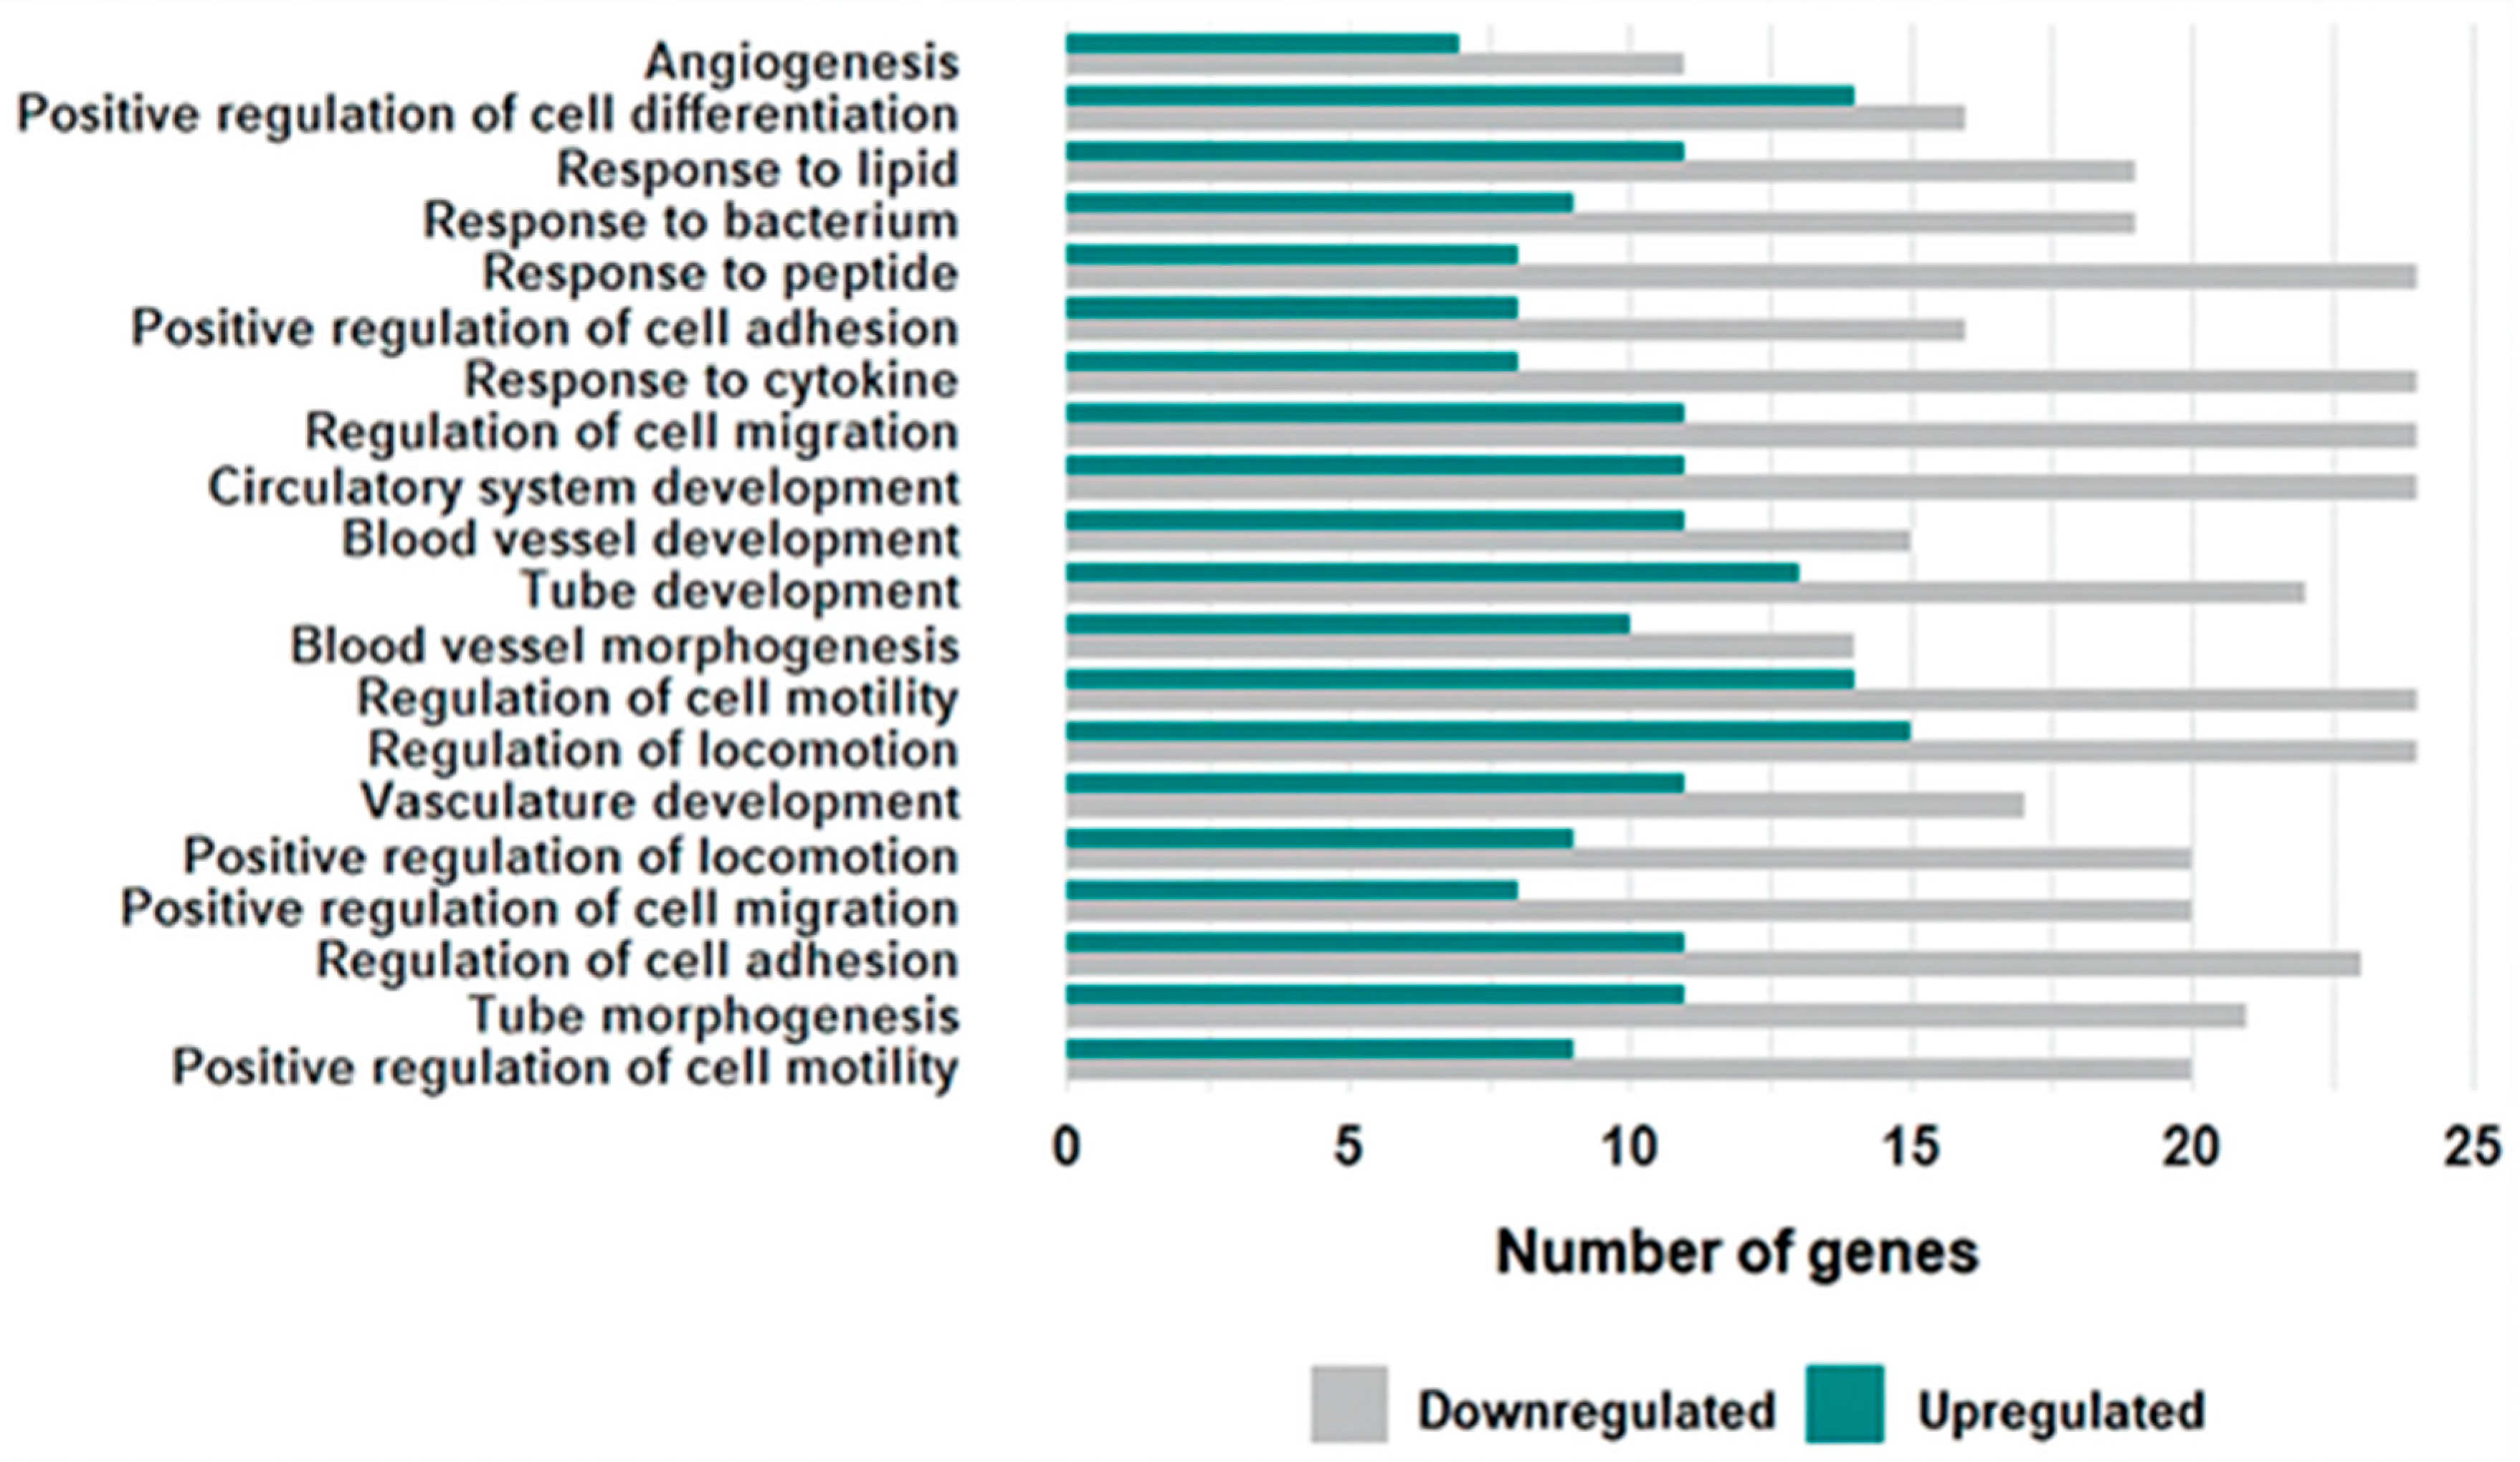
Notably, downregulated genes predominated in the top 20 enriched GO terms (Figure 5). The genes involved in the 20 pathways are shown in Supplementary Table S3. Focus on angiogenesis-related pathways, ANGPT1 and CALCRL were upregulated, while E2F7, NRP2, NRXN3, and THBS1 were downregulated in IVF patients compared to oocyte donors (Supplementary Table S3).
Figure 5.
Directional enrichment of biological pathways. Bar plot showing the 20 most significantly enriched GO biological pathways comparing infertile patients and oocyte donors. Gray bars represent downregulated genes in patients; green bars represent upregulated genes in patients. Several angiogenesis-related terms are predominantly associated with genes downregulated in patients.
Complementary network analysis using the STRING platform, based on the 234 DEGs mentioned above, identified a large core involving genes related to angiogenesis (e.g., ANGPT1, THBS1, BMP4, GLUL) and endothelial-associated factors (e.g., VCAM1, ICAM1, LIF) (Supplementary Figure S1).
3.4. qPCR Validation
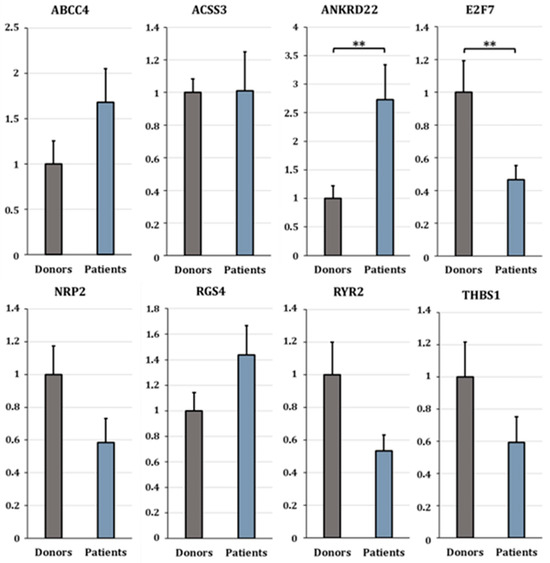
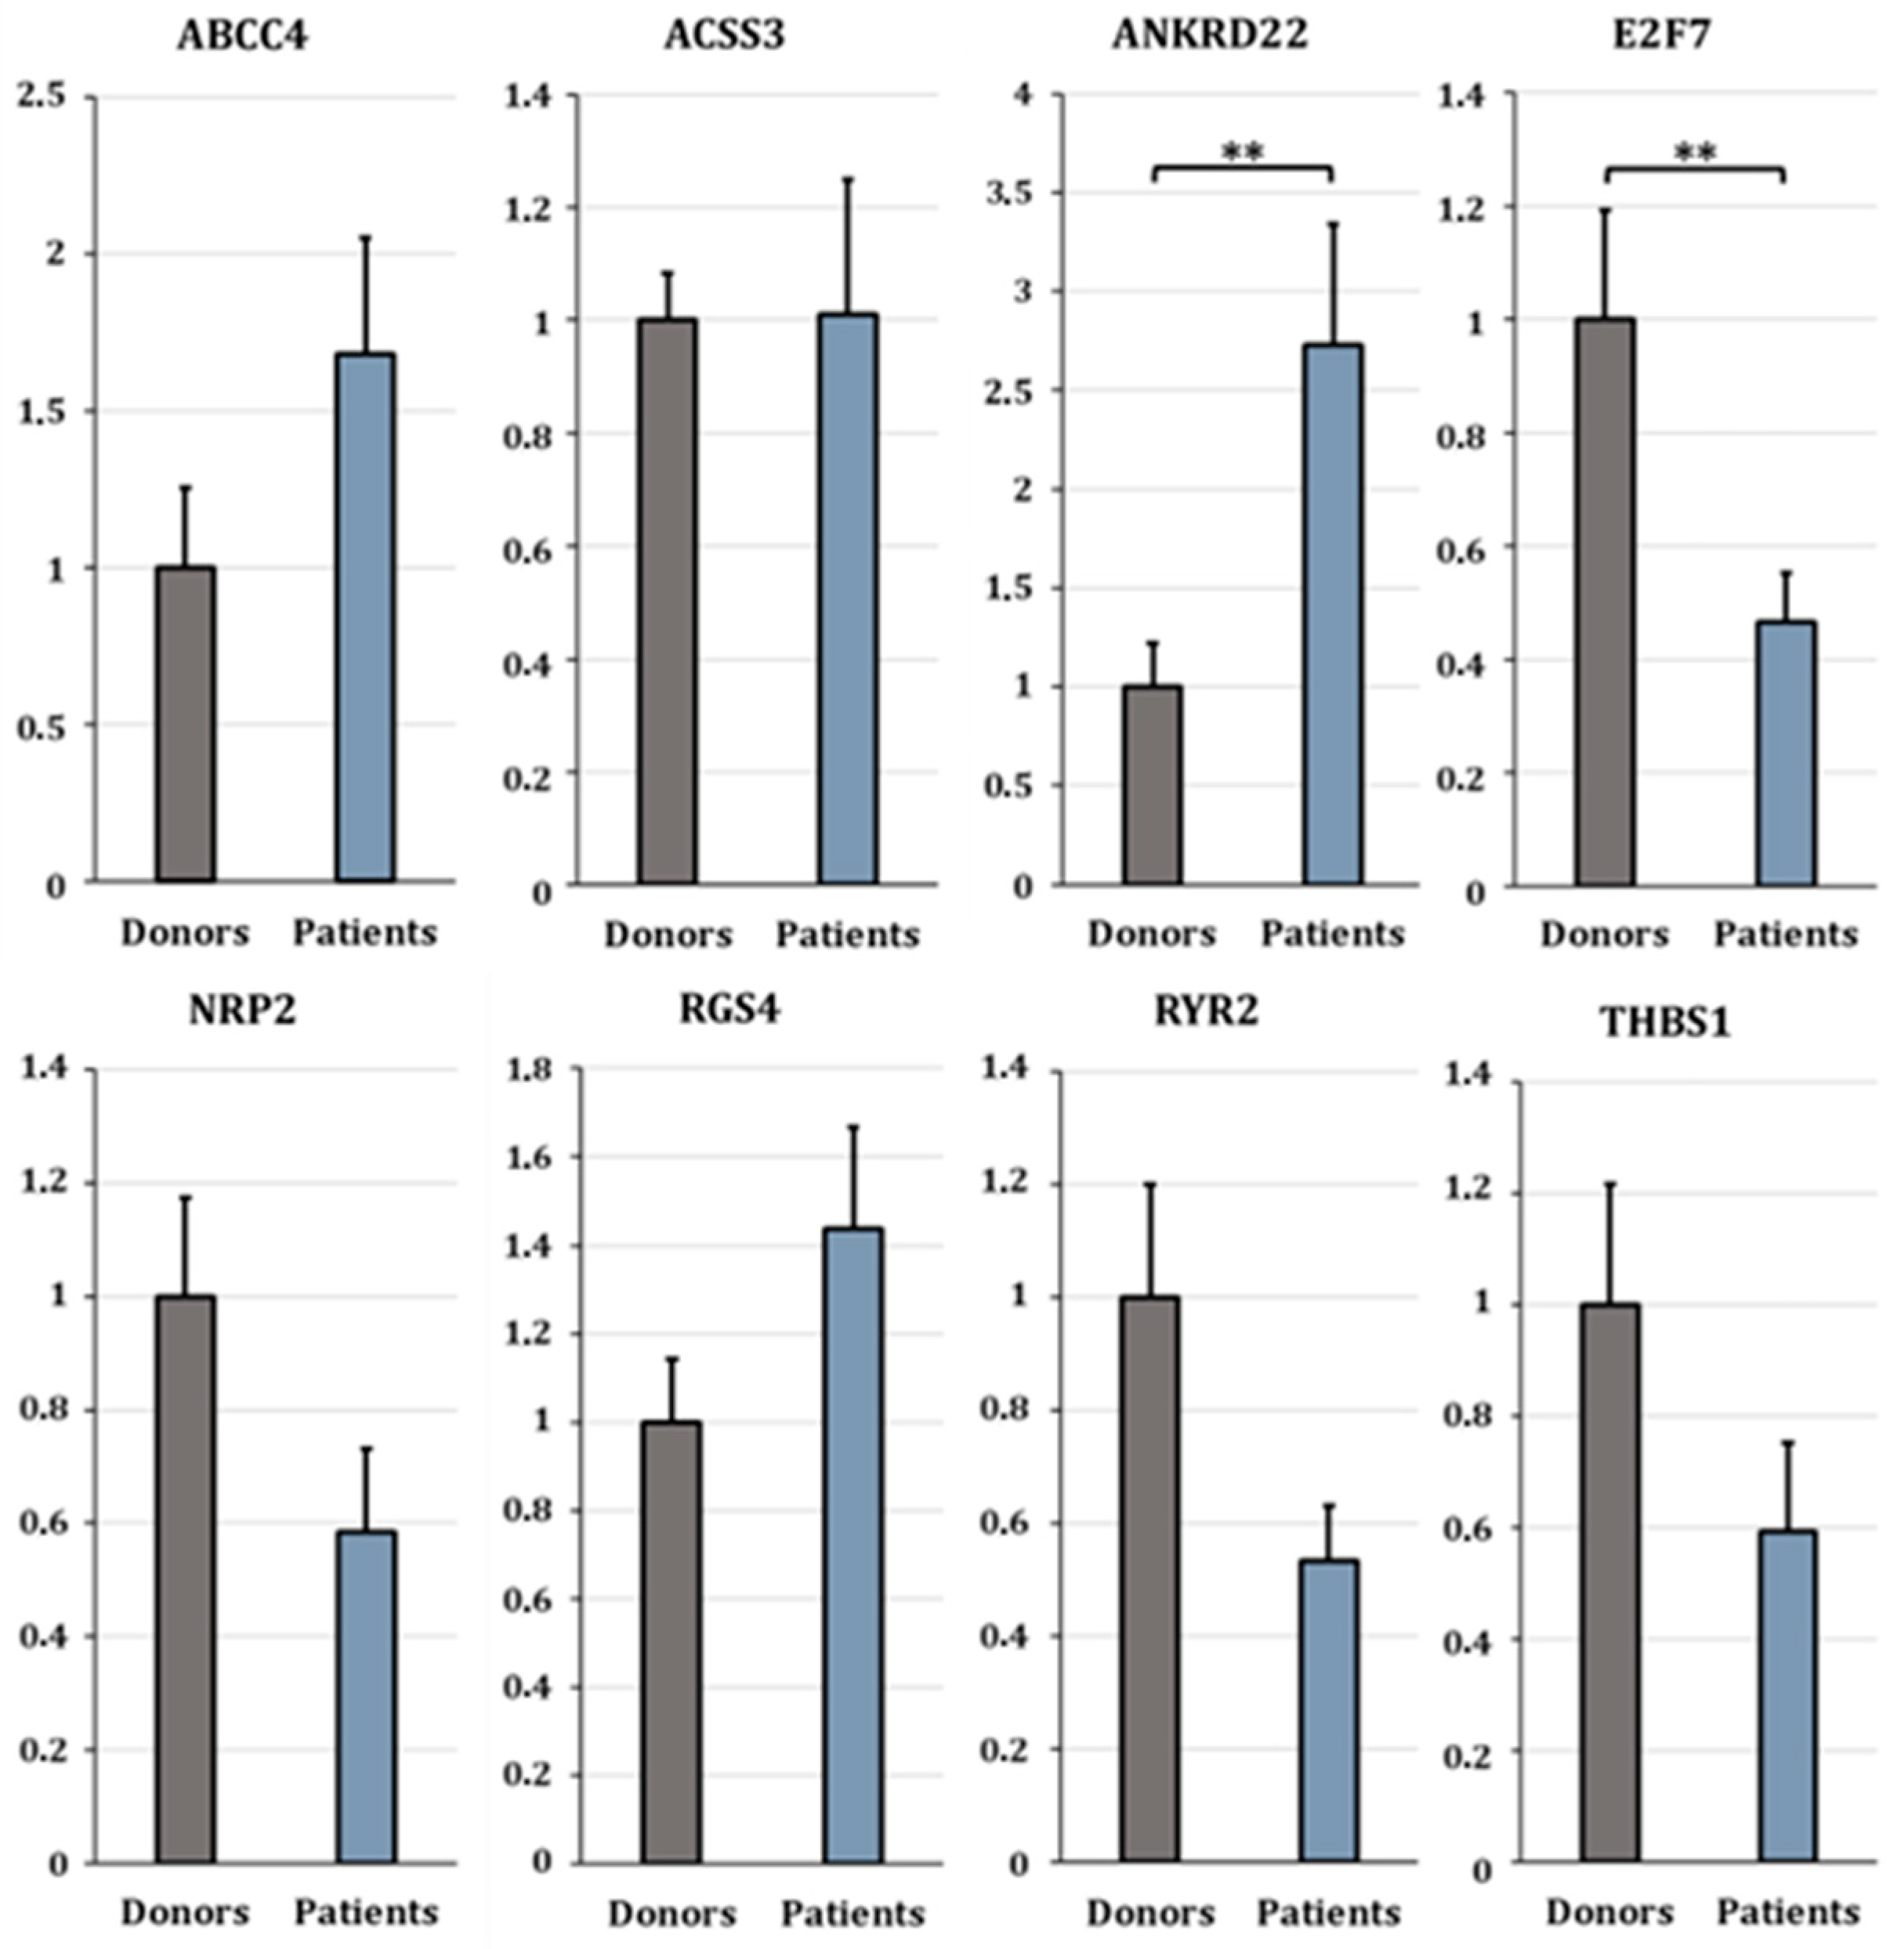
To validate the transcriptomic findings, ten differentially expressed genes (DEGs) were selected for RT-qPCR analysis based on three criteria: (1) involvement in angiogenesis (ANGPT1, E2F7, NRP2, THBS1), (2) established relevance in cumulus cell biology (ABCC4, ANKRD22, RYR2), and (3) strong and consistent differential expression across pipelines (fold-change > 2; RGS4, ACSS3). Additionally, ANGPT2—a known regulator of vascular stability—was included, although it was only detected in Pipeline 2 (Figure 6 and Figure 7 and Table 1).
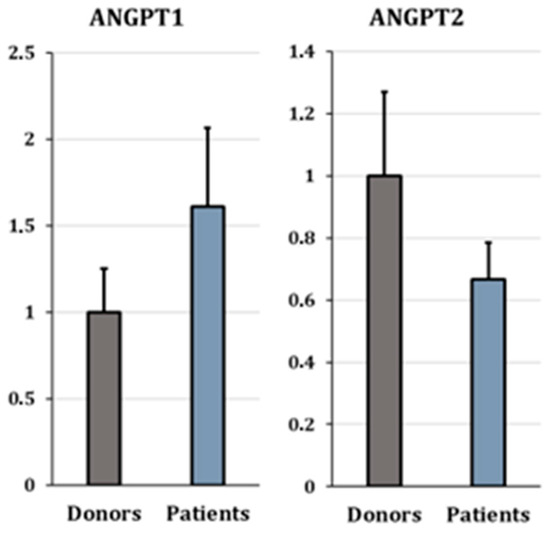
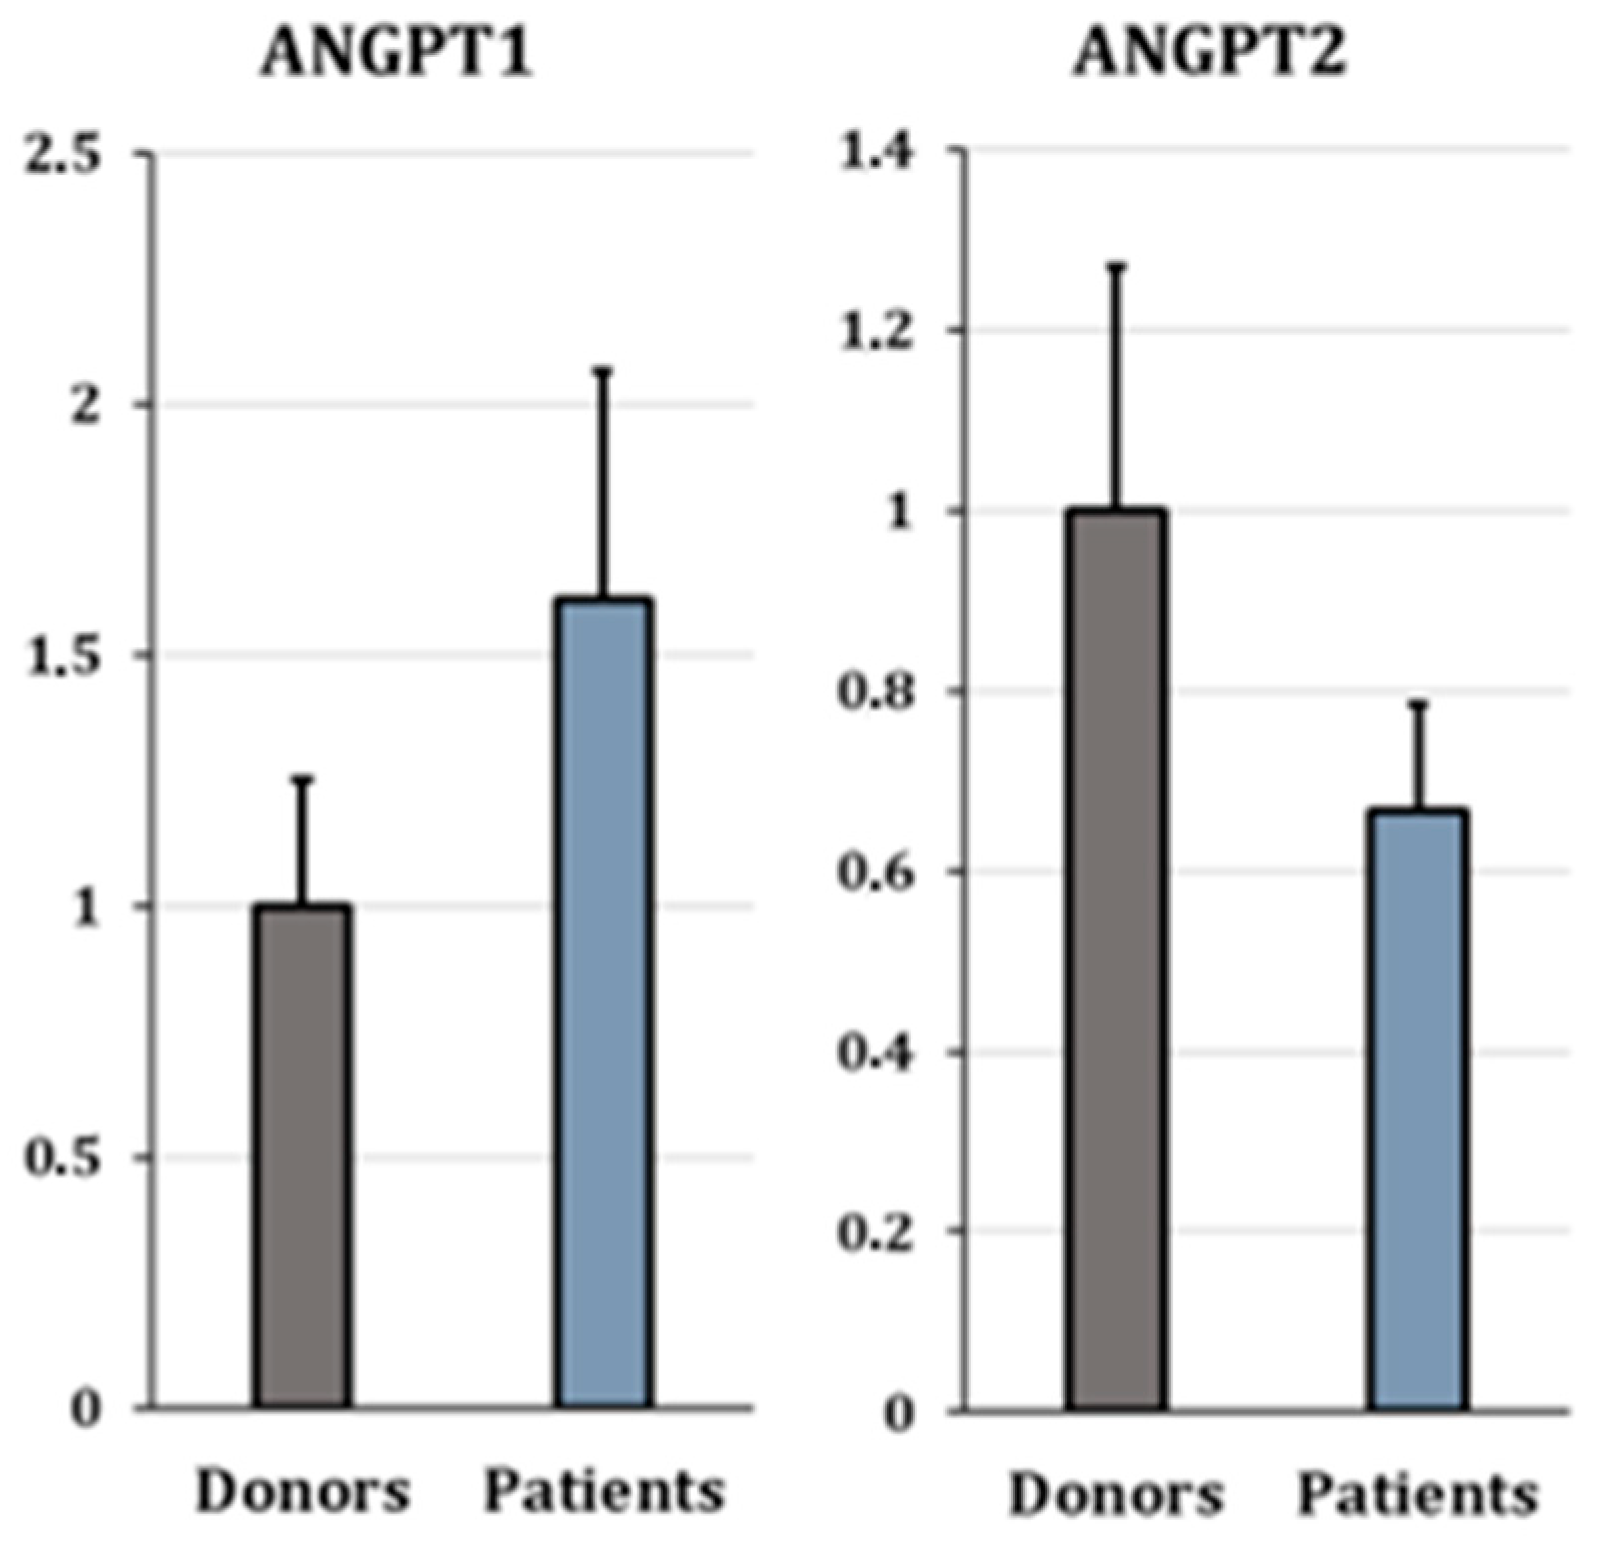
Figure 6.
Expression analysis of ANGPT1 and ANGPT2. Bar plots showing relative mRNA levels (ΔΔCt method) of ANGPT1 and ANGPT2 in cumulus cells from oocyte donors (gray) and infertile patients (blue). Bar plots showing mean ± SEM (Standard Error of the Mean). Expression levels were normalized to the selected reference gene(s) as described in the Section 2.
Figure 7.
RT-qPCR validation of selected differentially expressed genes. Boxplots showing relative expression levels (ΔΔCt) of ABCC4, ACSS3, ANKRD22, E2F7, NRP2, RGS4, RYR2, and THBS1 in cumulus cells from oocyte donors (grey) and infertile patients (blue) cumulus cells. Asterisks indicate statistically significant differences (** p < 0.05). Only ANKRD22 and E2F7 reached statistical significance, while the remaining genes showed consistent but non-significant expression trends.
Table 1.
Differentially expressed genes (DEGs) were selected for RT-qPCR analysis based on their relation with angiogenesis. Genes shown in red indicate downregulated expression, whereas genes shown in green indicate upregulated expression.
Validation was performed in an independent cohort of individual samples, providing complementary evidence at the biological level. RT-qPCR analysis confirmed the direction of change for 9 out of 10 genes, with RGS4 being the only gene showing a discordant trend relative to RNA-seq results (Table 1). Differences in fold-change magnitude between RNA-seq and RT-qPCR are expected and may reflect methodological differences in normalization, sensitivity, and the use of pooled versus individual samples.
The expression of ANGPT1 (Figure 6) was slightly higher in patients compared to donors, though this difference was not statistically significant (log2 fold change = 0.69, p > 0.05). In contrast, ANGPT2 (Figure 6) expression was slightly lower in patients (fold-change = −0.58, p > 0.05).
Among other angiogenesis-related genes, ANKRD22 was significantly upregulated in patients (log2 fold change = 1.45, p = 0.033), while E2F7 was significantly downregulated (log2 fold change = −1.04, p = 0.024) (Figure 7). NRP2 and THBS1 were also downregulated in patients, consistent with the RNA-seq results, though these differences did not reach statistical significance in the qPCR cohort.
Expression trends for the remaining genes (ABCC4, ACSS3, RYR2) were also consistent with RNA-seq data, albeit without statistical significance. Only RGS4 displayed a discordant expression pattern, showing slight upregulation by qPCR despite being downregulated in all three RNA-seq pipelines (Figure 7 and Table 1).
Overall, the concordance in expression trends between RNA-seq and qPCR for most genes (9/10) supports the consistency of the observed angiogenesis-related transcriptional patterns.
4. Discussion
The cellular transcriptome serves as a direct reflection of a cell’s functionality and physiological state. In the context of human reproduction, and more specifically in fertilization through assisted reproductive technologies (ART), the interaction between the two gametes—the spermatozoon and the oocyte—is paramount. However, the molecular study of the oocyte itself presents an unavoidable practical limitation: the analysis of its transcriptome necessitates its destruction, thereby precluding any subsequent assessment of its developmental competence. To circumvent this obstacle, our investigation focused on the cumulus cells (CCs) that intimately surround the oocyte, and form a tightly a coordinated functional unit with it [36].
To explore the female contribution to reproductive outcomes, we compared the transcriptome profile of CCs from two well-defined cohorts: oocyte donors (with proven fertility) and infertile patients undergoing ART. This approach provides a framework to investigate transcriptomic differences potentially associated with oocyte quality and the follicular microenvironment, although causality cannot be directly inferred.
4.1. Global Transcriptomic Landscape Reveals Conserved Identity with Specific Dysregulation in Infertile Patients
Our initial global transcriptomic profiling yielded important insights. Principal component analysis (PCA) showed that the first two components explained 91.9% of the total variance, with separation between donor and patient CCs primarily captured along the main axis of variation. This suggests the presence of measurable inter-group transcriptomic differences, while preserving the shared cellular identity of cumulus cells. Consistently, unsupervised hierarchical clustering demonstrated grouping by clinical category, supporting the presence of group-specific gene expression patterns. RNA-seq was performed on two pools of three donors and two pools of three infertile patients, an approach frequently used in exploratory transcriptomic studies when biological material is limited and the aim is to identify robust group-level signals [20,37]. While this pooling strategy limits the assessment of inter-individual variability and statistical power, it is suitable for exploratory analyses aimed at identifying consistent transcriptional trends.
It is also worth noting that the age difference between donors and patients could have contributed to some of the observed transcriptional variation, as age has been associated with changes in follicular gene expression. However, the clear clustering by clinical group suggests that the main transcriptomic patterns identified are primarily linked to reproductive status.
Together, these findings suggest that infertility-associated molecular alterations may occur within a conserved cellular framework rather than reflecting a complete transcriptional reprogramming. This observation is consistent with previous transcriptomic studies of granulosa and cumulus cells, which have shown that oocyte competence is often associated with subtle pathway-specific alterations rather than large-scale transcriptomic changes [38].
4.2. Angiogenesis and Vascular Development Pathways Are Differentially Regulated in Infertile Patients
To identify transcriptomic differences between groups, we performed RNA-seq and analysed differential expression using three independent bioinformatic pipelines. This robust, multi-method approach identified a set of 234 differentially expressed genes (DEGs) common to at least two pipelines—including 25 DEGs shared across all three. Given the limited number of pooled samples, this consensus-based strategy was used to prioritize genes showing consistent signals across analytical methods rather than relying on single-pipeline outputs.
The variation in the number of DEGs identified across pipelines likely reflects methodological differences at multiple analytical stages. At the alignment level, STAR [24], HISAT2 [29], and TopHat [26] employ distinct splice-aware algorithms and strategies for handling multi-mapped reads and junction detection, which can subtly influence the composition of gene-level count matrices. During quantification, HTSeq [27] performs strict gene-level counting, whereas StringTie [30] reconstructs transcripts and redistributes reads across isoforms, and Cufflinks [25] estimates expression using FPKM normalization; these approaches differ in how ambiguously assigned reads and low-abundance transcripts are modelled. Finally, downstream statistical analysis introduces further variability: DESeq2 [28] applies a negative binomial framework with gene-specific dispersion estimation and log2 fold-change shrinkage, while Cuffdiff [25] relies on alternative variance modelling and normalization strategies. These methodological differences may influence significance thresholds, particularly in datasets with limited biological replication. Thus, even when starting from identical raw sequencing reads, alternative bioinformatic processing strategies can yield variable DEG counts, underscoring the importance of consensus-based approaches to identify the most robust and reproducible transcriptional signals.
Functional characterization of these 234 consensus DEGs using Gene Ontology enrichment and STRING network analysis indicated that the transcriptomic divergence between donors and patients were enriched in pathways related to angiogenesis, cell migration, and vascular development.
Specifically, we observed significant enrichment in terms such as Blood vessel morphogenesis (GO:0048514), Angiogenesis (GO:0001525), and Positive regulation of cell migration (GO:0030335). Functional enrichment analysis of these consensuses differentially expressed genes revealed a striking overrepresentation of biological processes related to vascular remodeling and endothelial dynamics.t. These observations are consistent with the known role of follicular vascularization in supporting oocyte growth, steroidogenesis, and metabolic exchange [39].
To further explore these findings, a subset of 10 genes was selected for qPCR validation based on their consistent identification across all three RNA-seq pipelines (Table 1) and their involvement in complementary aspects of angiogenesis (Table 1). Importantly, validation was performed using individual samples not included in the RNA-seq pools, providing additional biological support for the observed expression patterns and partially addressing limitations associated with pooling strategies [40].
RT-qPCR analysis confirmed the direction of expression changes for most genes, although only a subset reached statistical significance. Specifically, ANKRD22 and E2F7 showed statistically significant differences between groups, whereas other genes displayed consistent but non-significant trends. Differences in fold-change magnitude between RNA-seq and qPCR are expected and may reflect differences in normalization methods, sensitivity, and the use of pooled versus individual samples. Importantly, the consistent direction of change across platforms supports the presence of consistent expression patterns across platforms.
4.3. Dysregulation of the Angiopoietin–Tie Axis and Other Genes Involved in Vascular Remodeling
This study integrates RNA-seq discovery with independent RT-qPCR validation to characterize angiogenesis-related transcriptional alterations in CCs from oocyte donors and infertile women. Together, these analyses suggest that infertility may be associated with a coordinated dysregulation of angiogenic signaling, affecting both the angiopoietin–Tie axis and multiple downstream genes involved in vascular remodeling, endothelial signaling, metabolic adaptation, and follicular microenvironment homeostasis.
The combined results suggest that infertility is not associated with a global loss of cumulus cell identity, but rather with more subtle alterations in pathways regulating vascular plasticity and follicular support. Among the analyzed genes, ANKRD22 and E2F7 showed statistically significant differences between donors and patients, while ANGPT1 and ANGPT2, together with NRP2, THBS1, ABCC4, RYR2, ACSS3, and RGS4, provided additional context through consistent but non-significant expression patterns (Table 2).
Table 2.
Differentially expressed genes (DEGs) were selected for RT-qPCR analysis based on their relationship with angiogenesis and vascular plasticity.
4.3.1. Dysregulation of the ANGPT–Tie Axis in Patients
ANGPT1 and ANGPT2 are central regulators of ovarian angiogenesis, acting through the Tie2 receptor to balance vascular stability and remodeling. ANGPT1 promotes vessel maturation and stabilization, whereas ANGPT2 facilitates vascular plasticity by loosening endothelial–pericyte interactions and sensitizing vessels to VEGF signaling [51,52].
In our study, ANGPT1 expression showed a trend toward higher levels in infertile patients, while ANGPT2 was relatively higher in donors. This pattern is consistent with previous observations showing that ANGPT2 predominates in larger, developmentally competent follicles, whereas ANGPT1 is associated with smaller or less mature follicles [53,54].
The significance of ANGPT2 as a marker of follicular progression is further supported by Cadenas et al. [10], who identified it as one of the most highly upregulated genes (over 100-fold increase) during the transition from immature germinal vesicle (GV) oocytes to mature metaphase II (MII) stages. Their findings highlight ANGPT2 as a critical transcriptomic signature of oocyte maturation and developmental competence.
Because CCs in this study were collected from pre-ovulatory follicles, the observed shift toward a more destabilized angiogenic profile in infertile patients may reflect premature or dysregulated vascular remodeling. Such alterations could potentially influence oxygen and nutrient delivery to the oocyte, thereby compromising developmental competence [13].
4.3.2. E2F7 and ANKRD22: Transcriptional and Stress-Related Regulators
Among the validated genes, E2F7 and ANKRD22 showed the most consistent and biologically meaningful differences between donors and patients.
E2F7 was significantly downregulated in infertile patients. Members of the E2F family are key regulators of cell-cycle progression, proliferation, and apoptosis, and have also been implicated in endothelial cell function and angiogenic signaling [55,56]. In particular, E2F7 has been shown to regulate VEGF-responsive pathways and endothelial proliferation [46]. Reduced E2F7 expression may suggest reduced proliferative and angiogenic capacity in cumulus cells, potentially affecting follicular support functions.
In contrast, ANKRD22 was significantly upregulated in infertile patients. Although this gene has been primarily studied in oncological contexts, recent evidence indicates that ANKRD22 is responsive to microenvironmental stress and participates in cellular adaptation to altered metabolic and immune changes [57]. Its increased expression in infertile CCs may therefore an association with altered follicular conditions, possibly linked to changes in vascular or metabolic homeostasis.
Taken together, these findings are consistent with a potential shift toward reduced proliferative activity and altered stress-related signaling in infertile follicles. However, given the exploratory nature of the study, these interpretations should be considered preliminaries.
4.3.3. Additional Angiogenesis-Related Genes
Several additional genes analyzed in this study provide further context for the angiogenesis-related alterations observed. Among them, NRP2, a VEGF co-receptor involved in endothelial guidance and vascular patterning, was downregulated in patients, suggesting potentially reduced responsiveness to VEGF-driven angiogenic cues and impaired vascular plasticity within the follicle [58]. In parallel, THBS1, an endogenous inhibitor of angiogenesis that contributes to vascular stabilization and homeostasis, showed higher expression in donors. Given its role in restraining excessive angiogenic activation [52,59], reduced THBS1 levels in patients may be consistent with a less tightly regulated vascular environment.
In addition to these vascular regulators, genes involved in intracellular signaling and follicular communication were also altered. RYR2, which mediates intracellular Ca2+ release, was more highly expressed in donors. Calcium signaling plays a central role in cumulus–oocyte communication and oocyte maturation, and RYR2 expression has previously been associated with oocyte competence and coordinated follicular signaling [60]. Its reduced expression in infertile patients may be associated with altered signaling dynamics in infertile follicles. ABCC4, which was more highly expressed in infertile patients, encodes a transporter involved in the efflux of prostaglandin E2 (PGE2), a key mediator of cumulus expansion, angiogenesis, and ovulatory processes. Altered ABCC4 expression may be associated which dysregulated prostaglandin within the follicle, potentially contributing to abnormal paracrine signaling between granulosa cells, endothelial cells, and the oocyte [61,62]. Although ABCC4 is not a primary angiogenic factor, its upregulation in patients supports the concept of disrupted communication between metabolic and vascular pathways in the infertile follicular environment.
Finally, ACSS3 and RGS4, while included among the validated genes, showed limited discriminatory value. ACSS3 exhibited similar expression levels in donors and patients, suggesting that acetate-dependent metabolic pathways are not major drivers of the observed phenotype. RGS4 displayed inconsistent trends between RNA-seq and qPCR analyses, indicating a context-dependent or secondary role. Nevertheless, given its known inhibitory effects on VEGF-mediated signaling and endothelial tubulogenesis [63], its inclusion could supports the presence of multilayered regulation of angiogenic signaling in cumulus cells.
Taken together, these genes suggest the involvement of a coordinated network in which angiogenic signaling, vascular regulation, and intracellular communication contribute to the follicular microenvironment. The consistency of expression trends across multiple genes supports a pathway-level alteration, despite limited statistical significance at the individual gene level.
4.4. Integrated Interpretation and Clinical Implications
Collectively, these findings support a model in which fertile follicles maintain a finely regulated angiogenic balance characterized by appropriate vascular plasticity, controlled endothelial activation, and coordinated metabolic support. In contrast, infertile follicles may display a transcriptional profile suggestive of excessive vascular stabilization, reduced angiogenic responsiveness, and altered stress adaptation.
This molecular divergence may have direct implications for ART outcomes, as a suboptimal vascular network is inherently linked to impaired follicular oxygenation. Reduced oxygen tension and the resulting oxidative stress are known to disrupt oocyte mitochondrial biogenetics and redox balance, as well as induce oxidative DNA damage. These factors impair oocyte in vitro maturation and embryo development, leading to poor pregnancy out- comes in IVF [64]
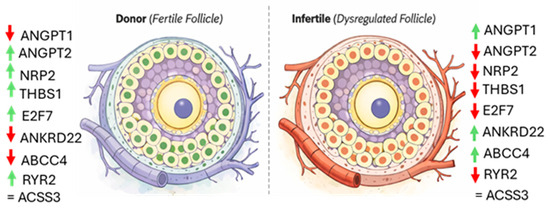
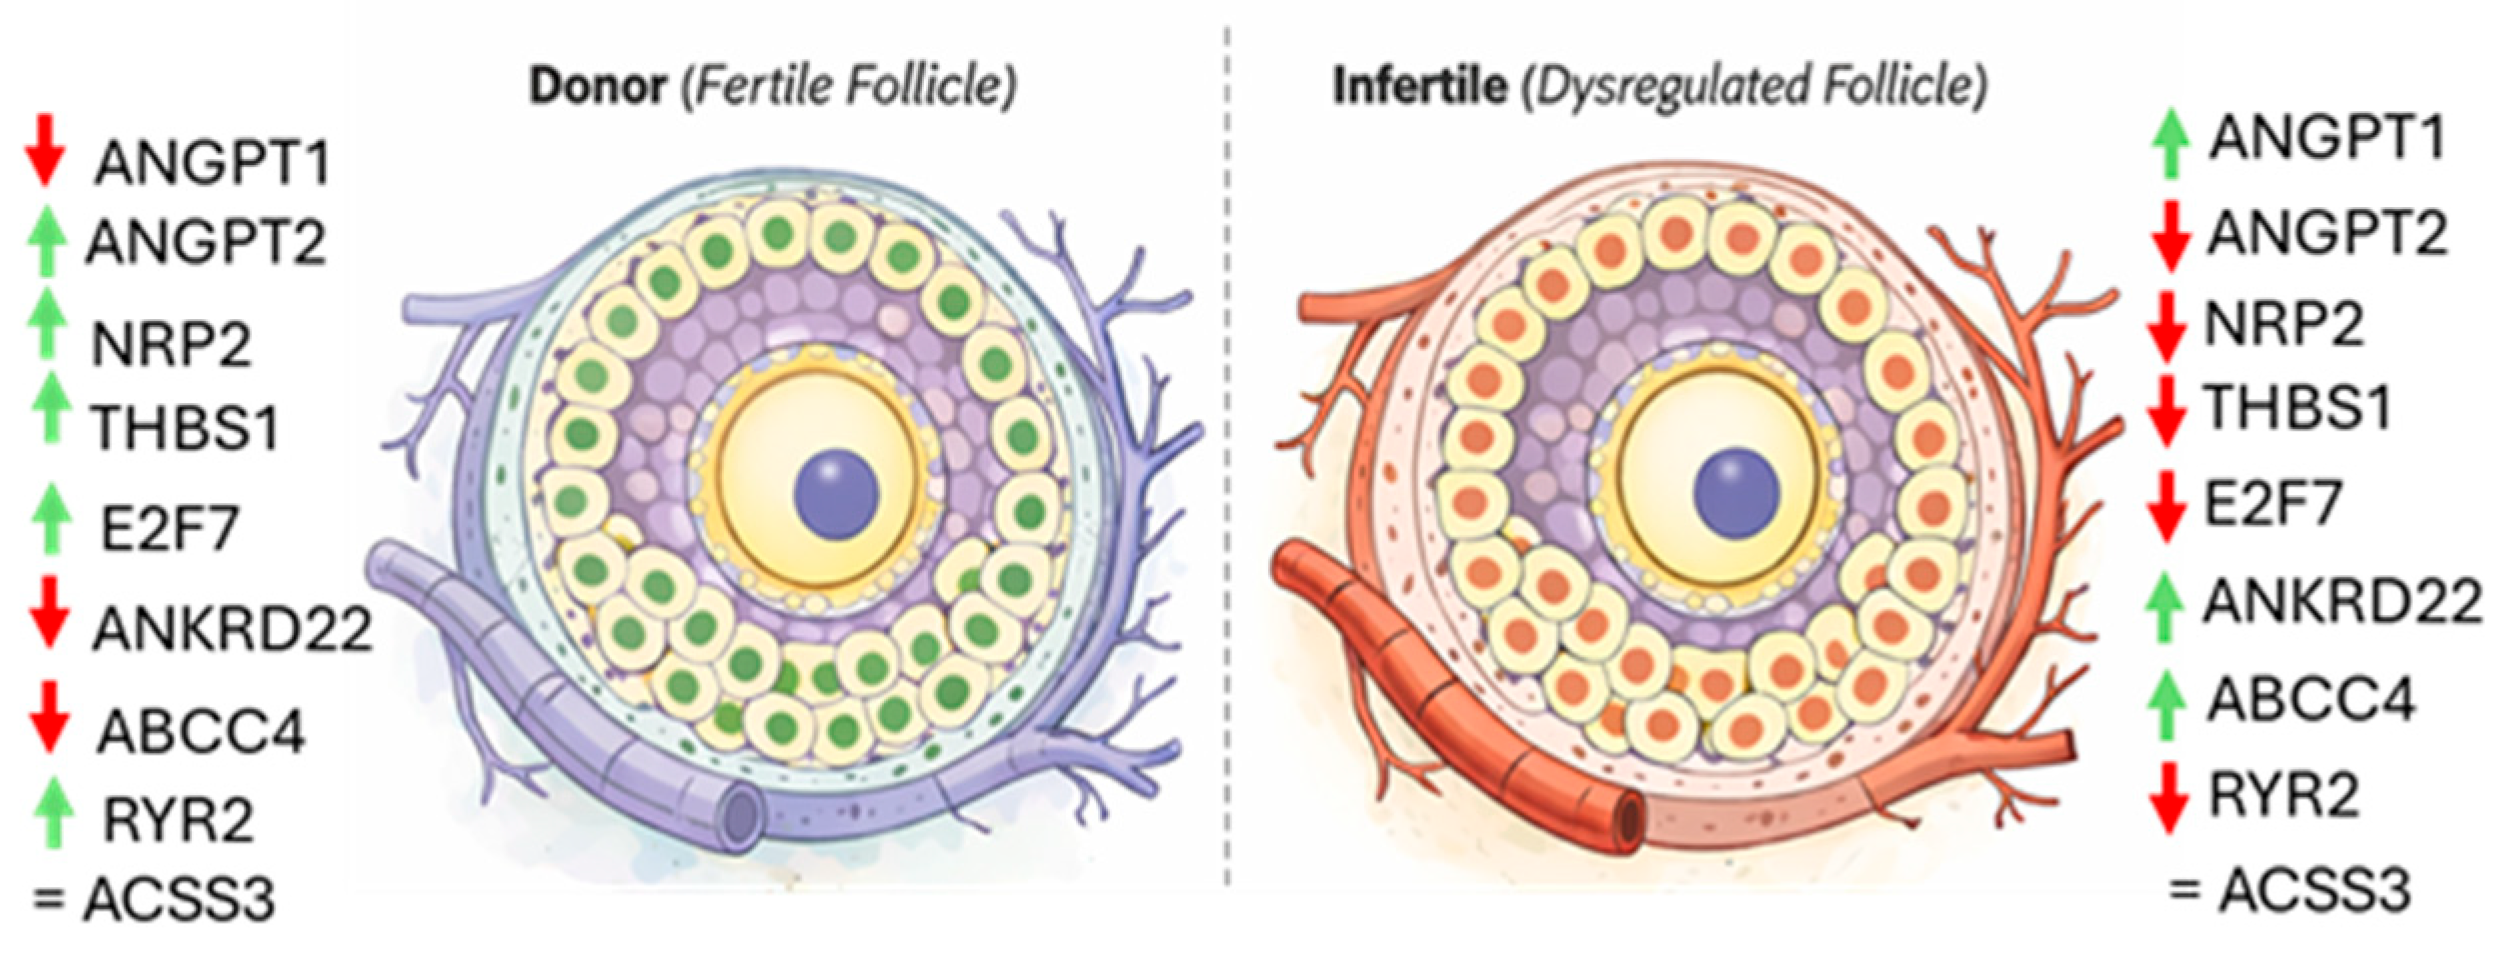
The coordinated dysregulation of E2F7, ANKRD22, NRP2, and THBS1 suggests that impaired angiogenic signaling could represent a central molecular feature of infertility at the follicular level. Rather than isolated defects, these alterations likely reflect a systemic failure in the ‘angiogenic switch’ required for proper follicular maturation. In a clinical context, such a compromised microenvironment may explain why some patients, despite producing morphologically ‘normal’ oocytes, experience poor blastocyst development or repeated implantation failure [65]. Importantly, these alterations were detected in cumulus cells, which are accessible during ART procedures and reflect the functional state of the oocyte microenvironment (Figure 8).
Figure 8.
Schematic representation of angiogenesis-related gene expression patterns in cumulus cells. Diagram illustrates relative gene expression differences in cumulus cells from oocyte donors and infertile patients. The schematic summarizes trends observed in RNA-seq and RT-qPCR analyses and is intended as a conceptual representation. Green arrows represent increased gene expression, whereas red arrows indicate decreased gene expression.
These angiogenesis-related genes may represent potential candidates for future biomarker development. By quantifying the expression of these vascular regulators, clinicians could move beyond morphology-based selection towards a more objective, molecular-based assessment of developmental potential.
Further studies are required to determine whether these markers could support decision-making] in assisted reproduction, including oocyte selection and treatment optimization. Validation in larger, independent, and age-matched cohorts will be necessary before clinical application.
Limitations and Future Directions
This study provides a transcriptomic characterization of cumulus cells from oocyte donors and infertile patients, identifying angiogenesis-related pathways as distinguishing features between groups. While the sample size was limited, the use of pooled samples enabled the generation of high-quality RNA-seq data with sufficient depth to capture consistent group-level transcriptional patterns, albeit at the expense of inter-individual resolution.
To complement this approach, selected genes were evaluated by RT-qPCR in an independent cohort of individual samples. This analysis confirmed the directionality of expression changes for most genes, although only a subset reached statistical significance. These findings support the interpretation of the RNA-seq data primarily at the pathway level and underscore the exploratory nature of the transcriptomic analysis.
Pooling strategies are widely employed in exploratory RNA-seq studies when biological material is limited and are particularly useful for identifying reproducible molecular signatures across groups [49]. In this context, the convergence between RNA-seq trends and RT-qPCR validation reinforces the biological consistency of the angiogenesis-related alterations observed.
Future studies should aim to extend these findings by incorporating larger cohorts and ideally age-matched cohorts and higher-resolution approaches, such as individual-sample or single-cell transcriptomics, to better capture follicular heterogeneity and refine the identification of clinically relevant molecular signatures.
Taken together, the coherence of the angiogenesis-related pathways identified, combined with the cross-platform consistency of expression trends, provides a strong conceptual framework for further investigation into the role of follicular vascular dynamics in oocyte competence and its potential relevance in assisted reproductive technologies.
5. Conclusions
Our transcriptomic analysis of human cumulus cells identifies angiogenesis-related pathways as key molecular features distinguishing infertile patients from oocyte donors and underscores the relevance of the follicular microenvironment in supporting oocyte developmental competence. The observed expression patterns in genes such as ANGPT1, ANGPT2, E2F7, ANKRD22, NRP2, and THBS1 suggest that alterations in angiogenic signaling may contribute to differences in follicular function. These findings provide novel insight into the molecular mechanisms linking follicular vascular dynamics with reproductive potential and highlight cumulus cells as a valuable, non-invasive source of molecular information.
From a clinical perspective, these angiogenesis-related genes may represent potential candidates for non-invasive assessment of oocyte quality and follicular competence. Given that cumulus cells are a direct window into the oocyte’s microenvironment and are readily accessible during ART procedures, further validation is required to determine their potential utility in clinical decision-making.
Ultimately, these results provide a foundation for future studies aimed at refining oocyte selection strategies and exploring the role of follicular angiogenesis in reproductive outcomes.
Supplementary Materials
The following supporting information can be downloaded at: https://www.mdpi.com/article/10.3390/cells15080677/s1. Table S1: Primer sequences for RT-qPCR validation; Table S2: RNA-seq alignment statistics per pool; Table S3: Gene lists for the top 20 enriched GO biological processes. Figure S1: Protein–protein interaction network of consensus DEGs.
Author Contributions
Conceptualization: R.R., A.B. and V.P.-Q.; Validation: A.B., M.A. and R.P.; Software: A.B. and M.S.; Methodology: A.B., V.P.-Q., R.P., M.A., M.d.l.C. and Y.F.-I.; Formal analysis: A.B., V.P.-Q. and M.S.; Investigation: A.B., V.P.-Q., M.A. and R.P.; Resources and clinical sample management: M.d.l.C. and Y.F.-I.; Data curation: A.B. and V.P.-Q.; Writing—original draft preparation: A.B., R.R. and V.P.-Q.; Writing—review and editing: all authors; Supervision: R.R.; Project administration: R.R. All authors have read and agreed to the published version of the manuscript.
Funding
This research was funded by CAM, Consejeria de Educación Ciencia y Universidades (No. IND2024/bio-34751) and Biology Department at Universidad Autonoma de Madrid (No. BIOUAM07-2021).
Institutional Review Board Statement
The study was conducted in accordance with the Declaration of Helsinki and approved by the Institutional Review Board (or Ethics Committee) of Universidad Autonoma de Madrid (CEI-106-2075).
Informed Consent Statement
Informed consent was obtained from all subjects involved in the study.
Data Availability Statement
The original contributions presented in this study are included in the article/Supplementary Material. Further inquiries can be directed to the corresponding author.
Conflicts of Interest
The authors declare no conflicts of interest.
Abbreviations
| ABCC4 | ATP Binding Cassette Subfamily C Member 4 |
| ACSS3 | Acyl-CoA Synthetase Short Chain Family Member 3 |
| ANGPT1 | Angiopoietin 1 |
| ANGPT2 | Angiopoietin 2 |
| ANKRD22 | Ankyrin Repeat Domain 22 |
| ART | Assisted Reproductive Technology |
| B2M | Beta-2-Microglobulin |
| BMP4 | Bone Morphogenetic Protein 4 |
| CALCRL | Calcitonin Receptor Like |
| CCs | Cumulus Cells |
| Ct | Cycle Threshold |
| DEGs | Differentially Expressed Genes |
| DESeq2 | Differential Expression Sequence 2 |
| E2F7 | E2F Transcription Factor 7 |
| FDR | False Discovery Rate |
| GAPDH | Glyceraldehyde 3-phosphate dehydrogenase |
| GCs | Granulosa Cells |
| GLUL | Glutamate-Ammonia Ligase |
| GO | Gene Ontology |
| GRCh38 | Human Genome build 38 |
| HIF1 | Hypoxia Inducible Factor 1 |
| HISAT2 | Hierarchical Spliced Alignments to Transcriptomes 2 |
| HTSeq | High-Throughput Sequence Analysis |
| ICAM1 | Intercellular Adhesion Molecule 1 |
| IQR | Interquartile Range |
| IVF | In Vitro Fertilization |
| LIF | Leukemia Inhibitory Factor |
| NRP2 | Neuropilin 2 |
| NRXN3 | Neurexin 3 |
| PC1/PC2 | Principal Component 1 and 2 |
| PCA | Principal Component Analysis |
| PCR | Polymerase Chain Reaction |
| PGE2 | Prostaglandin E2 |
| qPCR | Quantitative Polymerase Chain Reaction |
| RGS4 | Regulator of G Protein Signaling 4 |
| RIN | RNA Integrity Number |
| RNA-seq | RNA sequencing |
| RT | Room Temperature |
| RT-qPCR | Reverse Transcription Quantitative PCR |
| RYR2 | Ryanodine Receptor 2 |
| SD | Standard Deviation |
| STAR | Spliced Transcripts Alignment to a Reference |
| STRING | Search Tool for the Retrieval of Interacting Genes |
| THBS1 | Thrombospondin 1 |
| Tie | Tyrosine Kinase with Immunoglobulin and EGF homology Domains 2 |
| VCAM1 | Vascular cell Adhesion Molecule 1 |
| VEGF | Vascular endothelial growth factor |
References
- Wang, H. The role of granulosa cells in oocyte development and aging: Mechanisms and therapeutic opportunities. Semin. Cell Dev. Biol. 2025, 171, 103614. [Google Scholar] [CrossRef] [Scilit]
- Sugiura, K.; Maruyama, N.; Akimoto, Y.; Matsushita, K.; Endo, T. Paracrine regulation of granulosa cell development in the antral follicles in mammals. Reprod. Med. Biol. 2023, 22, e12538. [Google Scholar] [CrossRef] [Scilit]
- Kidder, G.M.; Mhawi, A.A. Gap junctions and ovarian folliculogenesis. Reproduction 2002, 123, 613–620. [Google Scholar] [CrossRef]
- Zhang, Y.; Yan, Z.; Qin, Q.; Nisenblat, V.; Chang, H.M.; Yu, Y.; Wang, T.; Lu, C.; Yang, M.; Yang, S.; et al. Transcriptome Landscape of Human Folliculogenesis Reveals Oocyte and Granulosa Cell Interactions. Mol. Cell 2018, 72, 1021–1034.e4. [Google Scholar] [CrossRef] [Scilit]
- Tan, H.J.; Deng, Z.H.; Shen, H.; Deng, H.W.; Xiao, H.M. Single-cell RNA-seq identified novel genes involved in primordial follicle formation. Front. Endocrinol. 2023, 14, 1285667. [Google Scholar] [CrossRef] [Scilit] [PubMed]
- Shi, W.; Lin, H.; Di, W.; He, C.; Shen, Y. Granulosa cell RNA-Seq insights into senescence and sphingolipid metabolism disorder in PCOS: Aspirin as a potential therapeutic drug. Reprod. Biol. Endocrinol. RBE 2025, 23, 61. [Google Scholar] [CrossRef] [Scilit] [PubMed]
- Fang, X.; Xia, W.; Qi, Y.; Yu, Y.; Sun, Q.; Zhang, D.; Zhou, Z.; Qin, T.; Tao, C.; Li, J. SIRT2 regulates apoptosis by inducing mitophagy in sheep cumulus cells. Theriogenology 2024, 218, 163–173. [Google Scholar] [CrossRef] [Scilit]
- Martínez-Moro, Á.; González-Brusi, L.; Lamas-Toranzo, I.; O’Callaghan, E.; Esteve-Codina, A.; Lonergan, P.; Bermejo-Álvarez, P. RNA-sequencing reveals genes linked with oocyte developmental potential in bovine cumulus cells. Mol. Reprod. Dev. 2022, 89, 399–412. [Google Scholar] [CrossRef] [Scilit]
- Jiang, R.; Su, J.; Xu, L.; Yang, L.; Sui, S. Screening of key regulatory factors in apoptosis of granulosa cells in healthy and atretic pig follicles based on RNA-seq. Gene 2025, 959, 149514. [Google Scholar] [CrossRef] [Scilit]
- Cadenas, J.; Adrados, C.S.; Kristensen, S.G.; Macklon, K.T.; Greve, V.H.; Fedder, J.; Mamsen, L.S.; Andersen, C.Y. Transcriptional changes in cumulus cells during in vitro maturation of human oocytes. Mol. Reprod. Dev. 2025, 92, e70035. [Google Scholar] [CrossRef] [Scilit] [PubMed]
- Gan, S.; Li, Y.; Yin, L.; Yang, X.; Lou, C.; Li, S.; Lin, M.; Li, X.; Xu, W.; Zhou, J.; et al. Characterization and therapy of fertilization failure in murine and human models with HNRNPR mutations. EMBO Mol. Med. 2026, 18, 916–942. [Google Scholar] [CrossRef] [Scilit]
- Jo, M.; Brännström, M.; Akins, J.W.; Curry, T.E., Jr. New insights into the ovulatory process in the human ovary. Hum. Reprod. Update 2025, 31, 21–47. [Google Scholar] [CrossRef] [Scilit]
- Robinson, R.S.; Woad, K.J.; Hammond, A.J.; Laird, M.; Hunter, M.G.; Mann, G.E. Angiogenesis and vascular function in the ovary. Reproduction 2009, 138, 869–881. [Google Scholar] [CrossRef] [Scilit]
- Rizov, M.; Andreeva, P.; Dimova, I. Molecular regulation and role of angiogenesis in reproduction. Taiwan. J. Obstet. Gynecol. 2017, 56, 127–132. [Google Scholar] [CrossRef] [Scilit]
- Suzuki, T.; Sasano, H.; Takaya, R.; Fukaya, T.; Yajima, A.; Nagura, H. Cyclic changes of vasculature and vascular phenotypes in normal human ovaries. Hum. Reprod. 1998, 13, 953–959. [Google Scholar] [CrossRef] [Scilit] [PubMed]
- Hazzard, T.M.; Stouffer, R.L. Angiogenesis in ovarian follicular and luteal development. Bailliere’s Best Pract. Res. Clin. Obstet. Gynaecol. 2000, 14, 883–900. [Google Scholar] [CrossRef] [Scilit] [PubMed]
- Wulff, C.; Wilson, H.; Wiegand, S.J.; Rudge, J.S.; Fraser, H.M. Prevention of thecal angiogenesis, antral follicular growth, and ovulation in the primate by treatment with vascular endothelial growth factor Trap R1R2. Endocrinology 2002, 143, 2797–2807. [Google Scholar] [CrossRef]
- Zeleznik, A.J.; Schuler, H.M.; Reichert, L.E., Jr. Gonadotropin-binding sites in the rhesus monkey ovary: Role of the vasculature in the selective distribution of human chorionic gonadotropin to the preovulatory follicle. Endocrinology 1981, 109, 356–362. [Google Scholar] [CrossRef] [Scilit] [PubMed]
- Zhou, G.; Gu, Y.; Zhou, F.; Zhang, H.; Zhang, M.; Zhang, G.; Wu, L.; Hua, K.; Ding, J. Adipocytes-derived extracellular vesicle-miR-26b promotes apoptosis of cumulus cells and induces polycystic ovary syndrome. Front. Endocrinol. 2022, 12, 789939. [Google Scholar] [CrossRef] [Scilit] [PubMed]
- Ko, B.; Van Raamsdonk, J.M. RNA Sequencing of Pooled Samples Effectively Identifies Differentially Expressed Genes. Biology 2023, 12, 812. [Google Scholar] [CrossRef] [Scilit]
- Babraham Bioinformatics—FastQC. A Quality Control Tool for High Throughput Sequence Data. Available online: https://www.bioinformatics.babraham.ac.uk/projects/fastqc/ (accessed on 19 January 2026).
- Bolger, A.M.; Lohse, M.; Usadel, B. Trimmomatic: A flexible trimmer for Illumina sequence data. Bioinformatics 2014, 30, 2114–2120. [Google Scholar] [CrossRef] [Scilit]
- National Center for Biotechnology Information. Genome Assembly and Annotation Report: Homo Sapiens (Human) GRCh38.p13 (GCF_000001405.39). U.S. National Library of Medicine. 2021. Available online: https://www.ncbi.nlm.nih.gov/datasets/genome/GCF_000001405.39/ (accessed on 19 January 2025).
- Dobin, A.; Davis, C.A.; Schlesinger, F.; Drenkow, J.; Zaleski, C.; Jha, S.; Batut, P.; Chaisson, M.; Gingeras, T.R. STAR: Ultrafast universal RNA-seq aligner. Bioinformatics 2013, 29, 15–21. [Google Scholar] [CrossRef] [Scilit]
- Trapnell, C.; Williams, B.A.; Pertea, G.; Mortazavi, A.; Kwan, G.; van Baren, M.J.; Salzberg, S.L.; Wold, B.J.; Pachter, L. Transcript assembly and quantification by RNA-Seq reveals unannotated transcripts and isoform switching during cell differentiation. Nat. Biotechnol. 2010, 28, 511–515. [Google Scholar] [CrossRef] [Scilit] [PubMed]
- Kim, D.; Pertea, G.; Trapnell, C.; Pimentel, H.; Kelley, R.; Salzberg, S.L. TopHat2: Accurate alignment of transcriptomes in the presence of insertions, deletions and gene fusions. Genome Biol. 2013, 14, R36. [Google Scholar] [CrossRef] [Scilit]
- Putri, G.H.; Anders, S.; Pyl, P.T.; Pimanda, J.E.; Zanini, F. Analysing high-throughput sequencing data in Python with HTSeq 2.0. Bioinformatics 2022, 38, 2943–2945. [Google Scholar] [CrossRef] [Scilit] [PubMed]
- Love, M.I.; Huber, W.; Anders, S. Moderated estimation of fold change and dispersion for RNA-seq data with DESeq2. Genome Biol. 2014, 15, 550. [Google Scholar] [CrossRef] [Scilit]
- Kim, D.; Langmead, B.; Salzberg, S.L. HISAT: A fast spliced aligner with low memory requirements. Nat. Methods 2015, 12, 357–360. [Google Scholar] [CrossRef] [Scilit] [PubMed]
- Pertea, M.; Pertea, G.M.; Antonescu, C.M.; Chang, T.C.; Mendell, J.T.; Salzberg, S.L. StringTie enables improved reconstruction of a transcriptome from RNA-seq reads. Nat. Biotechnol. 2015, 33, 290–295. [Google Scholar] [CrossRef] [Scilit]
- Ashburner, M.; Ball, C.A.; Blake, J.A.; Botstein, D.; Butler, H.; Cherry, J.M.; Davis, A.P.; Dolinski, K.; Dwight, S.S.; Eppig, J.T.; et al. Gene ontology: Tool for the unification of biology. Gene Ontol. Consortium. Nat. Genet. 2000, 25, 25–29. [Google Scholar] [CrossRef] [Scilit] [PubMed]
- Gene Ontology Consortium; Aleksander, S.A.; Balhoff, J.; Carbon, S.; Cherry, J.M.; Drabkin, H.J.; Ebert, D.; Feuermann, M.; Gaudet, P.; Harris, N.L.; et al. The Gene Ontology knowledgebase in 2023. Genetics 2023, 224, iyad031. [Google Scholar] [CrossRef] [Scilit]
- Szklarczyk, D.; Kirsch, R.; Koutrouli, M.; Nastou, K.; Mehryary, F.; Hachilif, R.; Gable, A.L.; Fang, T.; Doncheva, N.T.; Pyysalo, S.; et al. The STRING database in 2023: Protein-protein association networks and functional enrichment analyses for any sequenced genome of interest. Nucleic Acids Res. 2023, 51, D638–D646. [Google Scholar] [CrossRef] [Scilit] [PubMed]
- Posit Team. RStudio: Integrated Development Environment for R, Posit Software 2025; PBC: Boston, MA, USA, 2025. Available online: http://www.posit.co/ (accessed on 29 January 2026).
- Livak, K.J.; Schmittgen, T.D. Analysis of relative gene expression data using real-time quantitative PCR and the 2−ΔΔCt method. Methods 2001, 25, 402–408. [Google Scholar] [CrossRef] [Scilit]
- Cavalcante, M.B.; Sampaio, O.G.M.; Câmara, F.E.A.; Schneider, A.; de Ávila, B.M.; Prosczek, J.; Masternak, M.M.; Campos, A.R. Ovarian aging in humans: Potential strategies for extending reproductive lifespan. GeroScience 2023, 45, 2121–2133. [Google Scholar] [CrossRef] [Scilit] [PubMed]
- Takele Assefa, A.; Vandesompele, J.; Thas, O. On the utility of RNA sample pooling to optimize cost and statistical power in RNA sequencing experiments. BMC Genom. 2020, 21, 312. [Google Scholar] [CrossRef] [Scilit] [PubMed]
- Kaur, S.; Kurokawa, M. Regulation of Oocyte Apoptosis: A View from Gene Knockout Mice. Int. J. Mol. Sci. 2023, 24, 1345. [Google Scholar] [CrossRef] [Scilit]
- Fraser, H.M. Regulation of the ovarian follicular vasculature. Reprod. Biol. Endocrinol. RBE 2006, 4, 18. [Google Scholar] [CrossRef] [Scilit]
- Todd, E.V.; Black, M.A.; Gemmell, N.J. The power and promise of RNA-seq in ecology and evolution. Mol. Ecol. 2016, 25, 1224–1241. [Google Scholar] [CrossRef] [Scilit]
- Fukuhara, S.; Sako, K.; Noda, K.; Zhang, J.; Minami, M.; Mochizuki, N. Angiopoietin-1/Tie2 receptor signaling in vascular quiescence and angiogenesis. Histol. Histopathol. 2010, 25, 387–396. [Google Scholar] [CrossRef] [Scilit]
- Akwii, R.G.; Sajib, M.S.; Zahra, F.T.; Mikelis, C.M. Role of Angiopoietin-2 in Vascular Physiology and Pathophysiology. Cells 2019, 8, 471. [Google Scholar] [CrossRef] [Scilit]
- Tagami, M.; Kusuhara, S.; Imai, H.; Uemura, A.; Honda, S.; Tsukahara, Y.; Negi, A. MRP4 knockdown enhances migration, suppresses apoptosis, and produces aggregated morphology in human retinal vascular endothelial cells. Biochem. Biophys. Res. Commun. 2010, 400, 593–598. [Google Scholar] [CrossRef] [Scilit] [PubMed]
- Wong, B.W.; Marsch, E.; Treps, L.; Baes, M.; Carmeliet, P. Endothelial cell metabolism in health and disease: Impact of hypoxia. EMBO J. 2017, 36, 2187–2203. [Google Scholar] [CrossRef] [Scilit]
- Zhou, L.; Ma, D.; Li, X.; Jin, J.; Zheng, T.; Zhang, N. Macrophage M2 polarization induced by ANKRD22 in lung adenocarcinoma facilitates tumor angiogenesis. Cent.-Eur. J. Immunol. 2025, 50, 38–51. [Google Scholar] [CrossRef] [Scilit]
- Weijts, B.G.; Bakker, W.J.; Cornelissen, P.W.; Liang, K.H.; Schaftenaar, F.H.; Westendorp, B.; de Wolf, C.A.; Paciejewska, M.; Scheele, C.L.; Kent, L.; et al. E2F7 and E2F8 promote angiogenesis through transcriptional activation of VEGFA in cooperation with HIF1. EMBO J. 2012, 31, 3871–3884. [Google Scholar] [CrossRef] [Scilit]
- Shimizu, T.; Jayawardana, B.C.; Nishimoto, H.; Kaneko, E.; Tetsuka, M.; Miyamoto, A. Hormonal regulation and differential expression of neuropilin (NRP)-1 and NRP-2 genes in bovine granulosa cells. Reproduction 2006, 131, 555–559. [Google Scholar] [CrossRef] [Scilit]
- Albig, A.R.; Schiemann, W.P. Identification and characterization of regulator of G protein signaling 4 (RGS4) as a novel inhibitor of tubulogenesis: RGS4 inhibits mitogen-activated protein kinases and vascular endothelial growth factor signaling. Mol. Biol. Cell 2005, 16, 609–625. [Google Scholar] [CrossRef] [Scilit]
- Moccia, F.; Negri, S.; Shekha, M.; Faris, P.; Guerra, G. Endothelial Ca2+ Signaling, Angiogenesis and Vasculogenesis: Just What It Takes to Make a Blood Vessel. Int. J. Mol. Sci. 2019, 20, 3962. [Google Scholar] [CrossRef] [Scilit]
- Nör, J.E.; Mitra, R.S.; Sutorik, M.M.; Mooney, D.J.; Castle, V.P.; Polverini, P.J. Thrombospondin-1 induces endothelial cell apoptosis and inhibits angiogenesis by activating the caspase death pathway. J. Vasc. Res. 2000, 37, 209–218. [Google Scholar] [CrossRef] [Scilit]
- Goede, V.; Schmidt, T.; Kimmina, S.; Kozian, D.; Augustin, H.G. Analysis of blood vessel maturation processes during cyclic ovarian angiogenesis. Lab. Investig. J. Tech. Methods Pathol. 1998, 78, 1385–1394. [Google Scholar]
- Thomas, M.; Augustin, H.G. The role of the Angiopoietins in vascular morphogenesis. Angiogenesis 2009, 12, 125–137. [Google Scholar] [CrossRef] [Scilit] [PubMed]
- Hazzard, T.M.; Molskness, T.A.; Chaffin, C.L.; Stouffer, R.L. Vascular endothelial growth factor (VEGF) and angiopoietin regulation by gonadotrophin and steroids in macaque granulosa cells during the peri-ovulatory interval. Mol. Hum. Reprod. 1999, 5, 1115–1121. [Google Scholar] [CrossRef] [Scilit] [PubMed]
- Nishigaki, A.; Okada, H.; Tsuzuki, T.; Cho, H.; Yasuda, K.; Kanzaki, H. Angiopoietin 1 and angiopoietin 2 in follicular fluid of women undergoing a long protocol. Fertil. Steril. 2011, 96, 1378–1383. [Google Scholar] [CrossRef] [Scilit] [PubMed]
- Dimova, D.K.; Dyson, N.J. The E2F transcriptional network: Old acquaintances with new faces. Oncogene 2005, 24, 2810–2826. [Google Scholar] [CrossRef] [Scilit]
- DeGregori, J.; Johnson, D.G. Distinct and Overlapping Roles for E2F Family Members in Transcription, Proliferation and Apoptosis. Curr. Mol. Med. 2006, 6, 739–748. [Google Scholar] [CrossRef] [Scilit]
- Chen, H.; Yang, K.; Pang, L.; Fei, J.; Zhu, Y.; Zhou, J. ANKRD22 is a potential novel target for reversing the immunosuppressive effects of PMN-MDSCs in ovarian cancer. J. Immunother. Cancer 2023, 11, e005527. [Google Scholar] [CrossRef] [Scilit]
- Soker, S.; Takashima, S.; Miao, H.Q.; Neufeld, G.; Klagsbrun, M. Neuropilin-1 is expressed by endothelial and tumor cells as an isoform-specific receptor for vascular endothelial growth factor. Cell 1998, 92, 735–745. [Google Scholar] [CrossRef] [Scilit]
- Greenaway, J.; Lawler, J.; Moorehead, R.; Bornstein, P.; Lamarre, J.; Petrik, J. Thrombospondin-1 inhibits VEGF levels in the ovary directly by binding and internalization via the low-density lipoprotein receptor-related protein-1 (LRP-1). J. Cell. Physiol. 2007, 210, 807–818. [Google Scholar] [CrossRef] [Scilit]
- Grøndahl, M.L.; Andersen, C.Y.; Bogstad, J.; Borgbo, T.; Boujida, V.H.; Borup, R. Specific genes are selectively expressed between cumulus and granulosa cells from individual human pre-ovulatory follicles. Mol. Hum. Reprod. 2012, 18, 572–584. [Google Scholar] [CrossRef] [Scilit] [PubMed]
- Duffy, D.M. Novel contraceptive targets to inhibit ovulation: The prostaglandin E2 pathway. Hum. Reprod. Update 2015, 21, 652–670. [Google Scholar] [CrossRef] [Scilit]
- Trau, H.A.; Davis, J.S.; Duffy, D.M. Angiogenesis in the primate ovulatory follicle is stimulated by luteinizing hormone via prostaglandin E2. Biol. Reprod. 2015, 92, 15. [Google Scholar] [CrossRef] [Scilit] [PubMed]
- Albig, A.R.; Schiemann, W.P. Fibulin-5 function during tumorigenesis. Future Oncol. 2005, 1, 23–35. [Google Scholar] [CrossRef] [Scilit]
- Kobayashi, H.; Yoshimoto, C.; Matsubara, S.; Shigetomi, H.; Imanaka, S. Altered energy metabolism, mitochondrial dysfunction, and redox imbalance influencing reproductive performance in granulosa cells and oocyte during aging. Reprod. Sci. 2024, 31, 906–916. [Google Scholar] [CrossRef] [Scilit] [PubMed]
- Jankowska-Ziemak, H.; Kulus, M.; Partynska, A.; Kulus, J.; Data, K.P.; Domagala, D.; Niebora, J.; Gorska, A.; Podralska, M.; Podhorska-Okolow, M.; et al. The role of growth factors and signaling pathways in ovarian angiogenesis. Cells 2025, 14, 1555. [Google Scholar] [CrossRef] [Scilit] [PubMed]

Disclaimer/Publisher’s Note: The statements, opinions and data contained in all publications are solely those of the individual author(s) and contributor(s) and not of MDPI and/or the editor(s). MDPI and/or the editor(s) disclaim responsibility for any injury to people or property resulting from any ideas, methods, instructions or products referred to in the content. |
© 2026 by the authors. Licensee MDPI, Basel, Switzerland. This article is an open access article distributed under the terms and conditions of the Creative Commons Attribution (CC BY) license.