


Highlights
What are the main findings?
- Multiple inflammatory, epigenetic, metabolic, and bone-related biomarkers were consistently associated with AIS severity, particularly with higher Cobb angles and altered skeletal metabolism.
- Only a limited number of longitudinal studies identified potential predictive biomarkers for curve progression, including specific circulating miRNA signatures and reduced spermidine levels.
What are the implications of the main findings?
- Biomarkers may improve early risk stratification and support more personalized management of AIS by complementing current clinical and radiographic assessment tools.
- Further large-scale prospective studies with standardized methodologies are required to validate clinically applicable biomarkers for predicting AIS progression and guiding treatment decisions.
Abstract
Adolescent idiopathic scoliosis (AIS) is a multifactorial spinal deformity with variable progression patterns, making early risk stratification challenging. Circulating and tissue biomarkers, including inflammatory, metabolic, endocrine, epigenetic, and bone-related markers, have recently been investigated as potential predictors of disease severity and progression. This systematic review evaluated the current evidence on circulating and tissue biomarkers associated with AIS severity and progression. PubMed, Scopus, and Web of Science were searched for studies published between April 2016 and April 2026. Studies assessing circulating or tissue-based inflammatory, metabolic, epigenetic, and bone-related biomarkers in AIS patients were included. Data on study design, biomarker type, analytical methods, and associations with curve severity or progression were extracted. Twenty-nine studies involving more than 4000 participants were included. Biomarkers identified included inflammatory cytokines, microRNAs, metabolic hormones, and bone metabolism markers. Most studies reported significant associations between biomarkers and curve severity, particularly for inflammatory mediators, epigenetic regulators, and bone-related markers. However, few studies evaluated longitudinal progression, and only a limited number of studies identified predictive biomarkers, including circulating miRNA panels and spermidine levels. ROBINS-I assessment showed substantial risk of bias, mainly related to confounding and selective reporting. Heterogeneity was observed across study designs and outcome definitions. Current evidence supports associations between biomarkers and AIS severity, but predictive value for progression remains limited.
1. Introduction
Scoliosis is a three-dimensional deformity of the spine and trunk, defined by a lateral curvature with a major coronal curve measuring ≥10° using the Cobb method on radiographs [1]. Curve severity is commonly stratified into mild (<20°), moderate (20–40°), and severe (>40–50°), with the latter frequently requiring surgical correction [2,3]. In skeletally immature patients, curves exceeding 20° typically prompt closer surveillance and, when indicated, brace treatment to mitigate the risk of progression [3]. Notably, curve progression is highly variable and tends to accelerate during periods of rapid growth, representing a critical window for clinical management [1,3].
Adolescent idiopathic scoliosis (AIS) is the most prevalent form of structural spinal deformity, accounting for approximately 80% of cases [4]. It arises during the pubertal growth phase and may progress until skeletal maturity [1]. Epidemiological data indicate a global prevalence ranging from 1% to 4% among adolescents [1,5,6], with meta-analytic estimates of 1.34% for curves ≥10° [7]. Longitudinal evidence further suggests that up to 2.5% of adolescents develop measurable spinal curvature during growth [8].
Despite its high prevalence, the etiology of AIS remains incompletely understood and is widely considered multifactorial, involving genetic susceptibility alongside environmental, hormonal, metabolic, and biomechanical influences [6,7,8,9]. Disease expression is strongly modulated by sex and growth status, with females exhibiting a markedly higher risk of curve progression and severe deformity. Reported female-to-male ratios range from 1.5:1 to 11:1, depending on curve magnitude and study characteristics [10,11,12].
Current clinical management relies on physical examination and radiographic assessment, including quantification of the major coronal curve using the Cobb method, classification of curve patterns, and assessment of skeletal maturity (e.g., Risser stage or Sanders classification) [13,14]. However, while radiography remains the diagnostic gold standard, it offers limited insight into the biological mechanisms underlying disease progression and provides suboptimal prognostic accuracy [15]. This limitation is clinically relevant, as only a subset of patients will experience significant curve progression. Existing risk stratification approaches, based on age, skeletal maturity, and baseline curve magnitude, lack sufficient precision to reliably identify high-risk individuals at an early stage [16,17,18,19,20,21].
Consequently, treatment decisions are often based on currently available clinical risk estimates rather than individualized biological predictors. Repeated radiographic monitoring also exposes patients to cumulative radiation, while long-term bracing can negatively affect quality of life and psychological well-being [22]. Furthermore, progressive scoliosis may impose a substantial clinical and socioeconomic burden, including aesthetic deformity, chronic pain, functional limitations, reduced quality of life, and pulmonary complications [21,22,23]. Surgical correction, although effective for severe curves, is associated with considerable risks, including neurological, cardiopulmonary, gastrointestinal, and infectious complications, as well as implant-related issues and fusion failure [24,25,26,27].
These limitations highlight the need for objective, minimally invasive tools to improve early risk stratification and disease monitoring. In this context, circulating biomarkers measurable in accessible biological samples have emerged as promising candidates. Among these, inflammatory mediators, including cytokines, interleukins, and other immune-related factors, as well as metabolic and bone-related markers, are increasingly being investigated for their potential role in AIS pathophysiology and progression [28,29,30,31]. These biomarkers may reflect underlying biological processes such as low-grade inflammation, altered bone metabolism, and dysregulated energy balance, which have been associated with scoliosis onset and progression. Although a growing body of literature has explored the relationship between biological biomarkers and AIS, the available evidence remains heterogeneous in terms of study design, patient selection, biomarker assessment, and outcome measures. In particular, the distinction between biomarkers associated with disease severity and those predictive of progression is not always clearly defined [28]. Longitudinal studies provide stronger evidence for predictive value, whereas cross-sectional studies mainly contribute to understanding underlying biological mechanisms.
Therefore, this systematic review aims to comprehensively evaluate the current evidence on circulating and tissue biomarkers associated with disease severity and progression in AIS, highlighting their potential clinical utility and identifying gaps for future research.
2. Materials and Methods
2.1. PICOS and Eligibility Criteria
This systematic review was designed using the PICOS framework (Population, Intervention, Comparison, Outcomes, Study design) [32]. Specifically, studies were considered if they met the following criteria: P (Population): patients diagnosed with AIS, typically adolescents aged between 10 and 18 years, diagnosed according to standard clinical and radiographic criteria, including Cobb angle measurement; I (Intervention): the exposure of interest consisted of circulating and tissue biomarkers assessed in biological samples from AIS patients. These include circulating biomarkers measured in blood, tissue biomarkers, when available, and non-coding RNAs; C (Comparison): When available, comparisons included differences according to disease severity, curve progression, or non-progressive versus progressive within the AIS population. Comparisons with healthy controls were also considered when reported; O (Outcomes): the primary outcomes were disease severity, assessed through measurements of the major coronal curve using the Cobb method, defined as a significant increase in Cobb angle during follow-up (e.g., ≥5° or ≥10°). Secondary outcomes included the risk of progression, the need for surgical intervention, and associations with growth and skeletal maturity indicators, such as the Risser stage. S (Study design): Eligible studies included observational designs, such as prospective or retrospective cohort studies, case–control studies, and cross-sectional studies in human subjects. Case reports, reviews, editorials, and non-peer-reviewed articles were excluded. Animal and in vitro studies were not considered.
2.2. Information Sources and Search Strategy
A systematic search was conducted in March 2026 across three databases (PubMed®, Scopus, and Web of Science™), following the Preferred Reporting Items for Systematic Reviews and Meta-Analyses (PRISMA) guidelines [33]. The search strategy is reported in the Supplementary Materials (Table S1).
Filters were used to restrict the results to studies published in English between 2016 and 2026. Duplicate records were removed using EndNote® 2025, and titles and abstracts were independently assessed by four authors (FV, FS, LB, and GT). Studies that did not satisfy the inclusion criteria were excluded. Any discrepancies were resolved through discussion or, when necessary, by consulting a fifth reviewer (DC).
Full-text versions of the remaining studies were then evaluated for eligibility, and their reference lists were also checked for additional relevant publications. Data extraction was carried out independently by FV and FS using a standardized form. The protocol was registered in PROSPERO (Registration number: CRD420261389875).
2.3. Risk of Bias Assessment
The risk of bias of the included studies was evaluated using the ROBINS-I (Risk Of Bias In Non-randomized Studies of Interventions) tool [34]. This instrument assesses potential bias across seven domains covering different stages of the study process: bias due to confounding and selection of participants (pre-intervention), classification of interventions (at intervention), deviations from intended interventions and missing data (post-intervention), as well as measurement of outcomes and selection of the reported results. Each domain was judged as having low, moderate, or serious (high) risk of bias, according to the ROBINS-I guidance. Two independent reviewers (FV and FS) performed the assessment, and any discrepancies were resolved through discussion or consultation with a third reviewer (DC) when necessary. The overall risk of bias for each study was determined by the highest level of bias identified in any domain.
3. Results
3.1. Study Selection
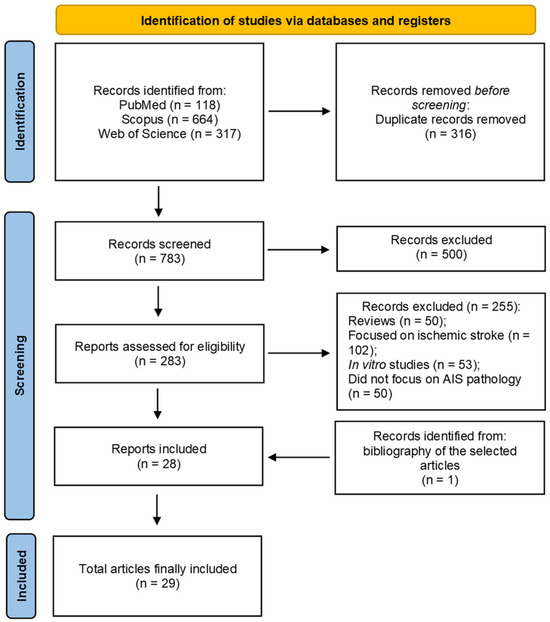
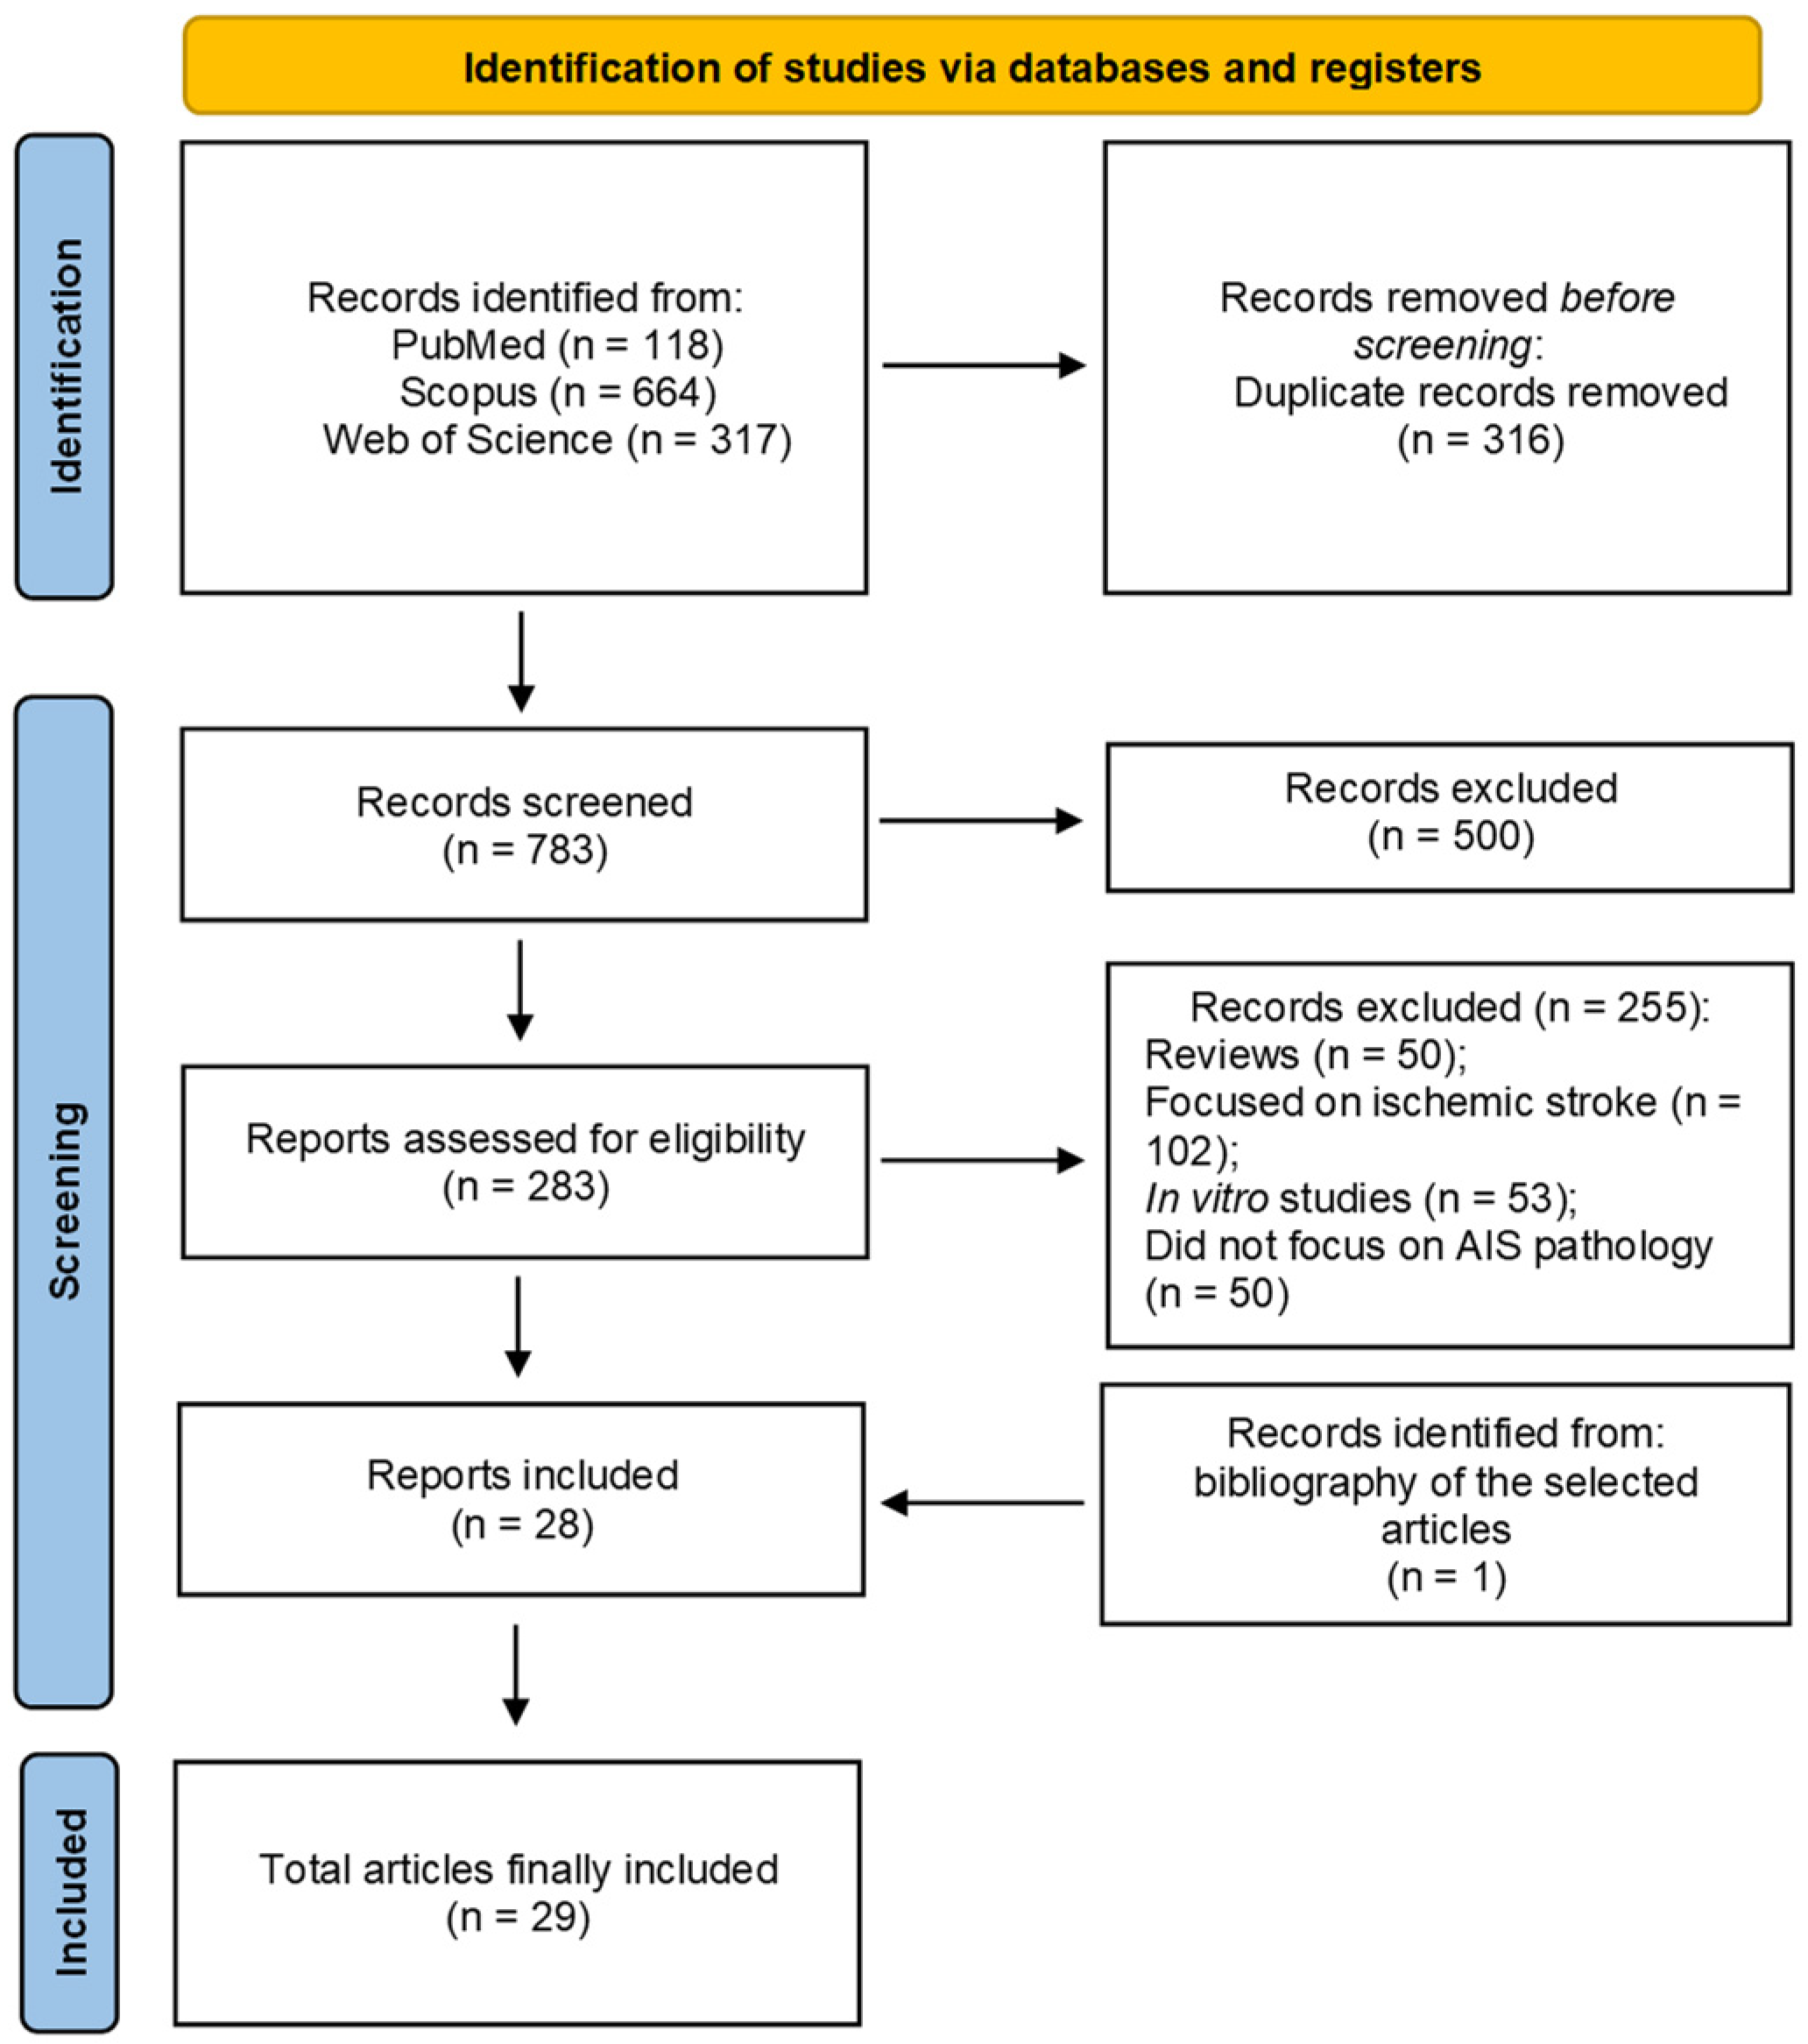
The initial database search identified a total of 1099 articles, 118 from PubMed, 317 from Web of Science, and 664 from Scopus. After removing 316 duplicates, 783 studies were screened by title and abstract (Figure 1). Of these, 500 were excluded for not being inherent to the topic. The remaining 283 were assessed for their eligibility and 255 were further excluded for various reasons: 50 were review articles, 102 regarded ischemic stroke, 53 were in vitro studies, and 50 did not focus on AIS pathology. Ultimately, 28 studies met the inclusion criteria, and 1 additional study was identified from reference screening, resulting in a total of 29 studies included in this systematic review [35,36,37,38,39,40,41,42,43,44,45,46,47,48,49,50,51,52,53,54,55,56,57,58,59,60,61,62,63] (Figure 1).
Figure 1.
PRISMA flowchart. Search strategy on PubMed, Web of Science and Scopus databases.
3.2. Data Synthesis
The included studies involved over 4000 participants, including both patients with AIS and health controls (Table 1 and Table 2). Study designs were heterogeneous and included cross-sectional [35,36,37,38,39,40,41], case–control [42,43,44,45,46,47,48,49,50,51,52,53,54], prospective [55,56,57], and translational [58,59] approaches. Sample sizes ranged from small exploratory cohorts to large multicenter populations, with most studies showing a predominance of female participants, consistent with the epidemiology of AIS.
Table 1.
Study design and demographic characteristics of the included studies.
Table 2.
Clinical characteristics of study populations included in the review.
A broad spectrum of biomarkers was analyzed across the studies, including inflammatory mediators, epigenetic regulators, metabolic and hormonal factors, and bone-related markers, assessed in serum, plasma, and tissue samples using a variety of analytical techniques (Table 3). Most studies investigated associations between biomarkers and disease severity, typically quantified by the Cobb angle, whereas only a limited number of studies evaluated longitudinal outcomes related to disease progression (Table 4 and Table 5).
Table 3.
Summary of inflammatory and metabolic biomarkers associated with disease severity and progression in AIS.
Table 4.
Association between inflammatory biomarkers and curve severity (Cobb Angle) in patients with AIS.
Table 5.
Association between inflammatory biomarkers and risk of disease progression in AIS.
Overall, the available evidence is largely derived from cross-sectional analyses, and only a small subset of studies incorporated follow-up data to assess progression. Correlation analyses further highlighted complex interactions between biomarkers and clinical, anthropometric, and metabolic parameters (Table 6). However, substantial heterogeneity in study design, biomarker selection, and outcome definitions was observed across the included studies, limiting direct comparability of findings and the identification of clinically validated biomarkers.
Table 6.
Correlations between inflammatory biomarkers and clinical, anthropometric, and metabolic parameters in AIS.
3.2.1. Inflammatory Biomarkers
Several studies investigated the role of inflammatory mediators in AIS, highlighting their association with disease severity. Increased expression of pro-inflammatory cytokines and matrix-degrading enzymes, including interleukin-1β (IL-1β), matrix metalloproteinase-3 (MMP-3), and MMP-13, was observed in association with higher Cobb angles, particularly in severe curves exceeding 70° [35]. Similarly, systemic inflammatory indices derived from routine blood parameters, such as the neutrophil-to-lymphocyte ratio (NLR) and the C-reactive protein/albumin ratio (CAR), were positively correlated with curve severity, indicating a potential role of low-grade systemic inflammation in more advanced deformities [60].
At the molecular level, inflammatory signaling pathways were also implicated. Activation of Toll-like receptor (TLRs) pathways and increased expression of cytokines, including IL-1, IL-6, IL-8, and Tumor Necrosis Factor alpha (TNF-α), were associated with enhanced osteoclastogenesis and tissue degeneration [61]. In addition, immune-related biomarkers such as CD23 and β2-microglobulin were reduced in AIS and showed associations with disease severity [49].
Postoperative increases in inflammatory markers, including IL-6 and C-reactive protein, were observed but were related to surgical stress rather than disease severity or progression [56].
3.2.2. Epigenetic Biomarkers
Epigenetic regulators represented a major class of biomarkers in AIS. Multiple studies identified altered expression of circulating and tissue-specific microRNAs (miRNAs) associated with disease severity. Increased levels of miR-96-5p were associated with AIS and contributed to predictive models including clinical variables [43]. Similarly, elevated expression of miR-941, miR-151a-3p, and miR-148b-5p was observed in more severe cases [51].
Additional studies identified broader miRNA signatures associated with AIS diagnosis and severity. A four-miRNA panel demonstrated high diagnostic accuracy in distinguishing AIS patients from controls [45], while other studies identified multiple miRNA panels associated with severe phenotypes [37,55].
Epigenetic regulation at the DNA and chromatin level was also implicated. Increased estrogen receptor 1 (ESR1) methylation was positively associated with curve severity [36], while histone modifications involving SUV39H1 and H3K9me3 were linked to increased chondrocyte proliferation and AIS severity [46]. Furthermore, altered expression of regulatory genes involved in inflammatory signaling was reported, including reduced SOCS3 expression and genetic variants associated with increased curve severity [62].
Finally, circulating microRNAs such as miR-130b-3p were associated with reduced bone mass and increased disease severity, supporting a link between epigenetic regulation and skeletal metabolism [41].
In addition, extracellular vesicle-associated microRNAs were also shown to be significantly altered in AIS. In particular, members of the miR-30 family were upregulated in severe AIS and were associated with impaired osteogenic differentiation. Functional analyses demonstrated that extracellular vesicles enriched in these miRNAs reduced osteogenic marker expression and mineralization capacity, supporting a mechanistic link between circulating epigenetic factors and disease severity [63].
3.2.3. Metabolic and Hormonal Biomarkers
Metabolic and hormonal alterations were consistently reported across studies. Elevated leptin levels were positively associated with curve severity, while reduced levels of osteocalcin and N-terminal telopeptide indicated impaired bone turnover [38].
Alterations in leptin signaling were also observed, with reduced free leptin index and increased soluble leptin receptor levels in AIS patients [50]. Increased ghrelin levels were associated with disease severity and osteopenia [53,57], while adiponectin levels were linked to reduced bone mineral density [54].
Metabolic enzymes were also involved. Reduced Dipeptidyl peptidase-4 (DPP-4) activity was observed in AIS and showed associations with metabolic parameters, although its relationship with curve severity was inconsistent [44,48].
In addition, mitochondrial and nuclear circulating DNA levels were altered in AIS, although their predictive value for disease progression remained limited [47].
3.2.4. Bone Metabolism and Signaling Pathways
Markers of bone metabolism and osteogenesis were strongly associated with AIS severity. Reduced osteogenic activity, reflected by decreased RUNX2 expression and altered RANKL/OPG balance, was observed in more severe cases [53]. Increased osteoclast activity and bone resorption markers, such as TRAP5b, further supported a state of enhanced bone turnover [40]. Chen et al. [42] further supported the involvement of bone metabolism alterations in AIS. In this study, abnormal osteocyte lacuno-canalicular network structure was observed in AIS bone tissue, together with reduced canalicular number and length, increased lacunar volume and surface, and lower bone mechanical properties. In a parallel serological cohort, serum osteocalcin was negatively correlated with Cobb angle, supporting an association between impaired osteocyte function, altered bone formation, and curve severity.
At the signaling level, dysregulation of multiple pathways was reported. Activation of IL-6/STAT3 signaling was associated with cartilage degradation and increased MMP13 expression [52]. Similarly, Wnt/β-catenin signaling and associated regulators, including miR-145, were linked to impaired osteocyte function and disease severity [58].
Gene expression studies further highlighted alterations in pathways involved in extracellular matrix organization, muscle regulation, and inflammatory signaling, including Wnt-related genes and structural proteins [39]. These findings are consistent with evidence showing that epigenetic and extracellular vesicle-mediated mechanisms may directly impair osteogenic function and contribute to disease severity [63].
3.2.5. Biomarkers Associated with Disease Progression
Only a limited number of studies directly assessed disease progression using longitudinal or follow-up data. Among these, lower circulating spermidine levels were associated with increased risk of progression, defined as a significant increase in Cobb angle or progression to severe curves [59]. Similarly, specific circulating miRNA panels demonstrated high predictive accuracy for progression to severe AIS, with some models achieving high sensitivity and specificity [37,55].
However, most studies relied on surrogate measures such as baseline Cobb angle or bone metabolic status to infer progression risk, rather than directly measuring longitudinal changes. Other investigations focused on disease presence, molecular mechanisms, or postoperative inflammatory responses without evaluating progression [47,56].
As a result, no biomarker has yet been consistently validated as a reliable predictor of AIS progression, highlighting the need for further longitudinal studies.
3.3. Risk of Bias Assessment
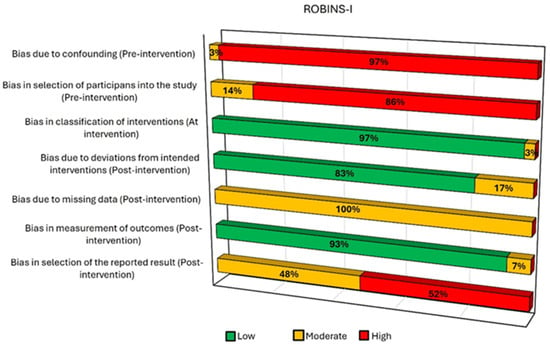
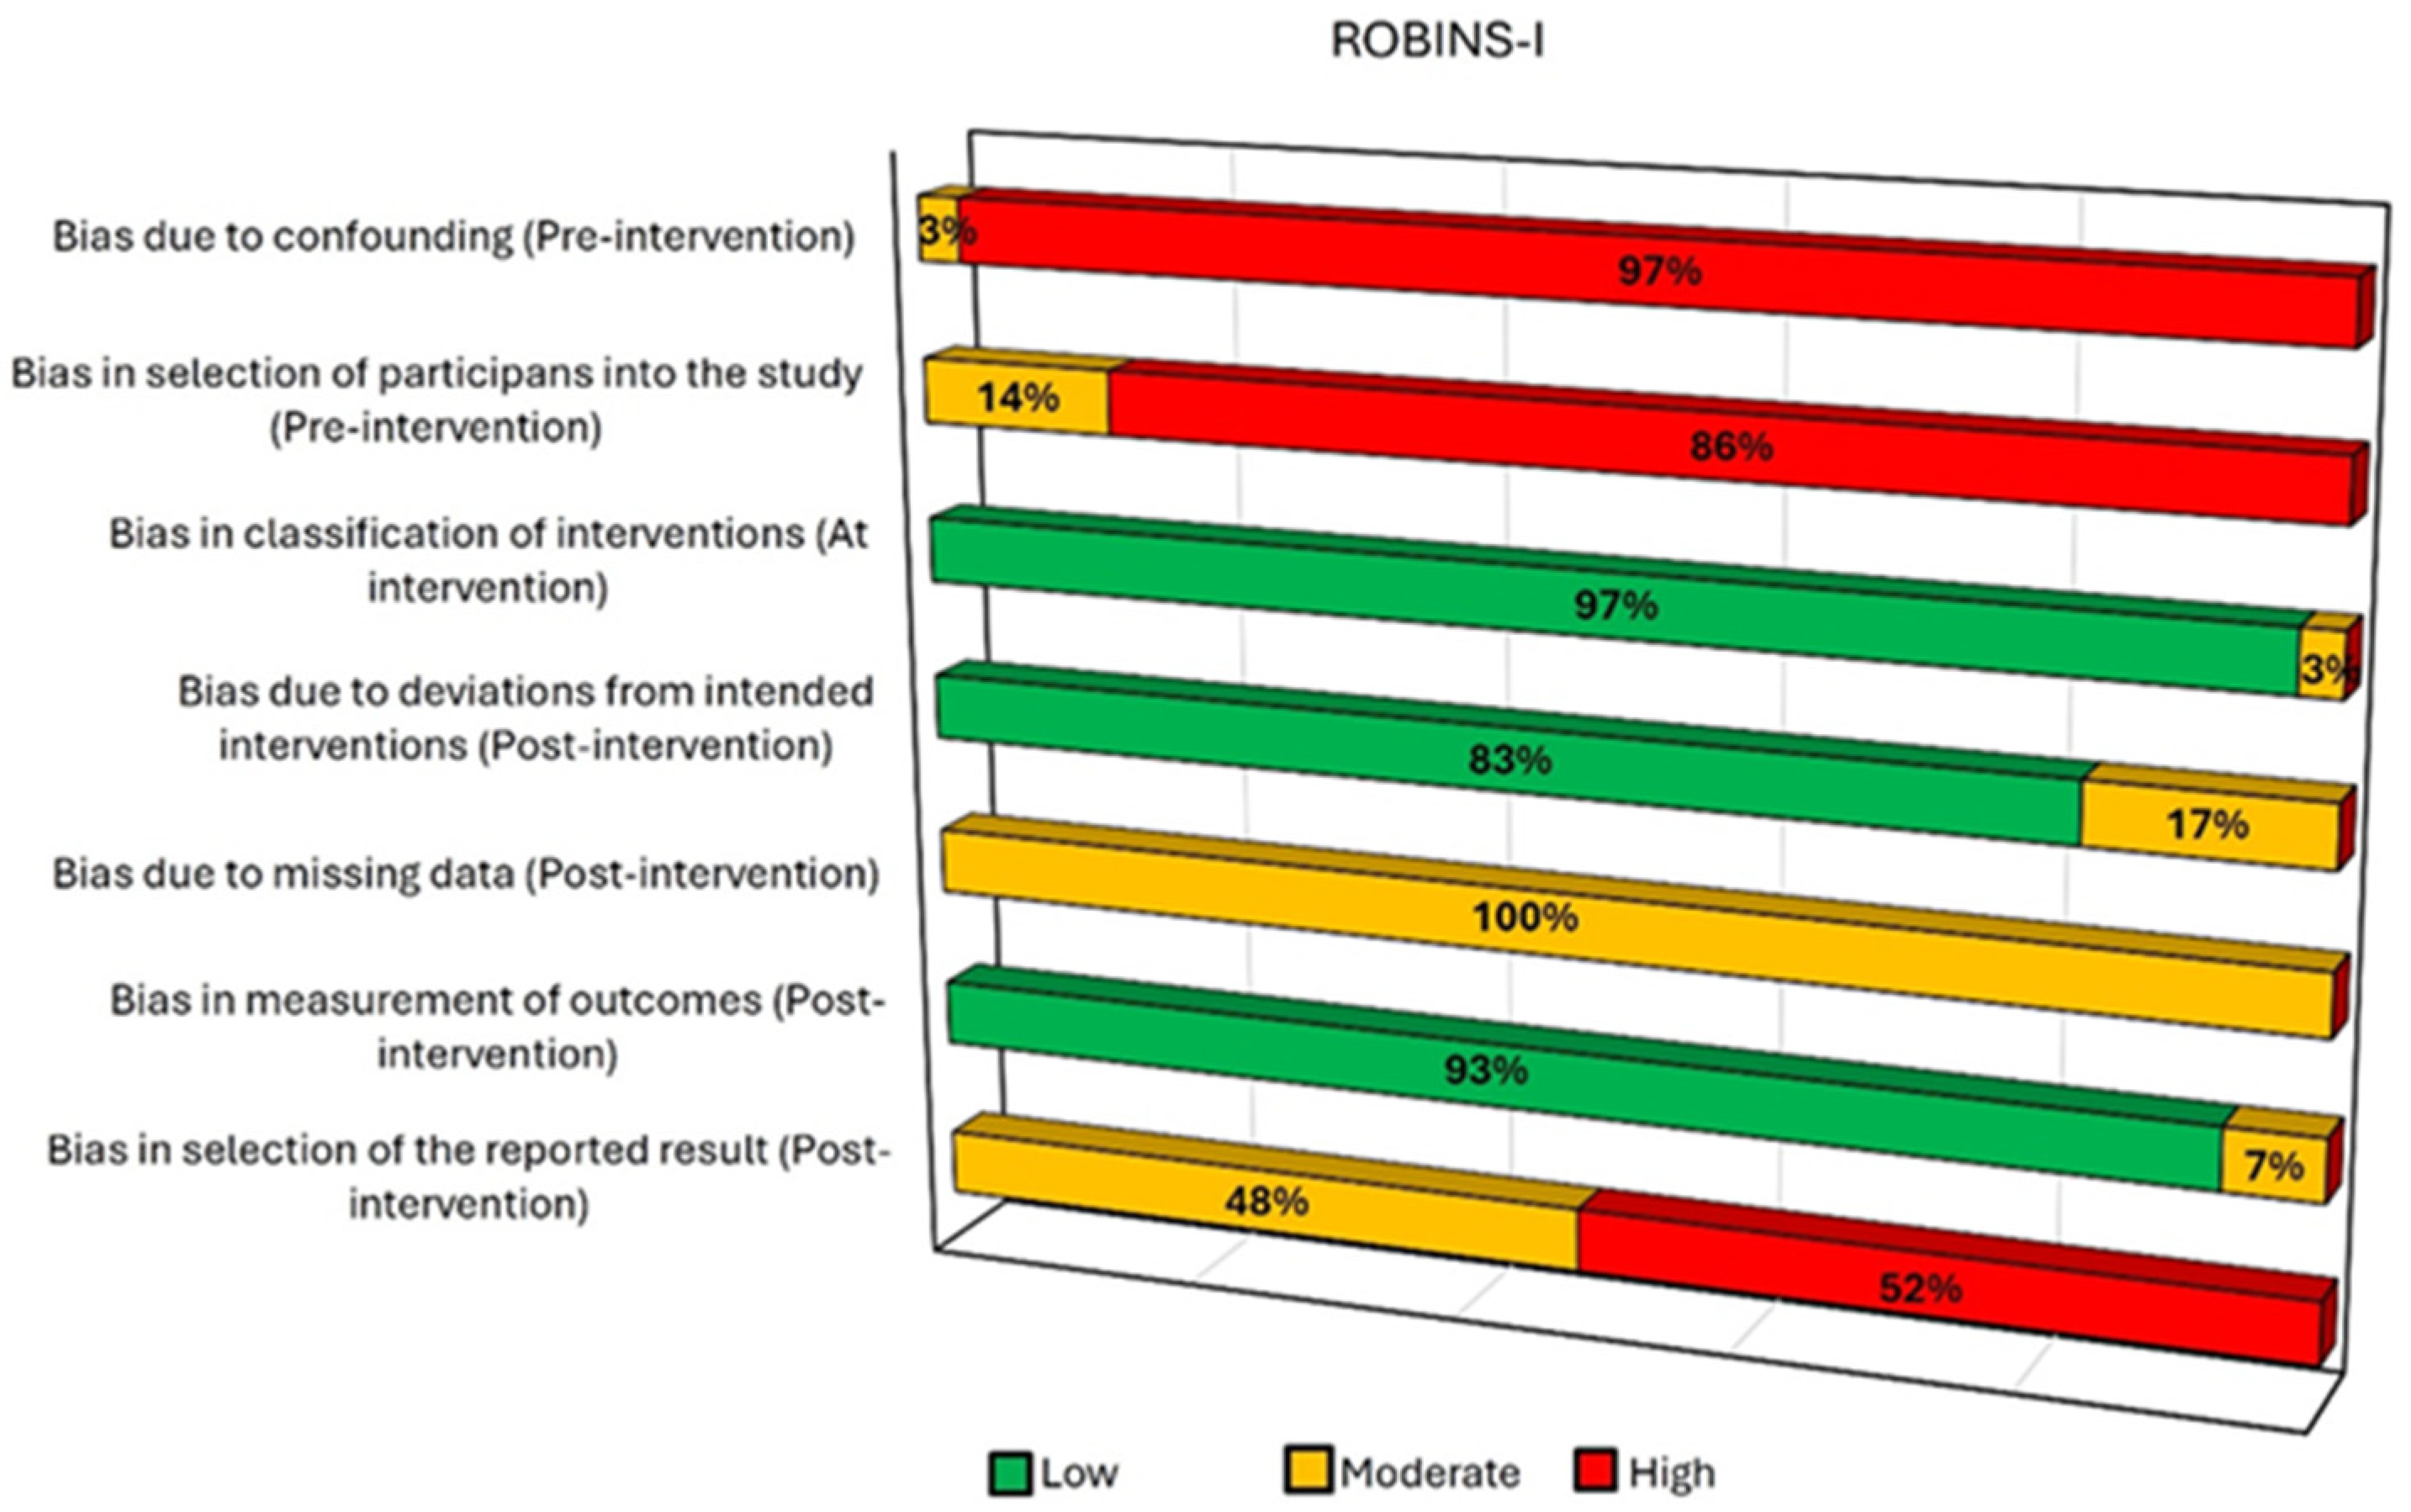
The risk of bias assessment using the ROBINS-I tool revealed substantial variability across domains (Figure 2). A high risk of bias was predominantly observed in pre-intervention domains, particularly due to confounding (97%) and selection of participants (86%), with only a small proportion of studies rated as moderate risk in these areas (respectively 3% and 14%). In contrast, most studies showed a low risk of bias in domains related to intervention classification (97%) and deviations from intended interventions (83%), with a minority rated as moderate (respectively 3% and 17%). Missing data was consistently rated as moderate risk across all studies (100%). Post-intervention domains generally demonstrated favorable assessments, with low risk of bias reported for outcome measurement (93%) and a small proportion of moderate risk (7%). However, bias in the selection of reported results remained a concern, with over half of the studies (52%) rated at high risk and the remainder (48%) at moderate risk. Overall, the findings indicate that while post-intervention methodological quality was generally acceptable, significant concerns persist in pre-intervention domains and selective reporting.
Figure 2.
Risk of bias assessment of the included studies according to the ROBINS-I tool. The figure summarizes the proportion of studies rated as low, moderate, or serious risk of bias across the seven ROBINS-I domains, including confounding, participant selection, intervention classification, deviations from intended interventions, missing data, outcome measurement, and selection of reported results.
4. Discussion
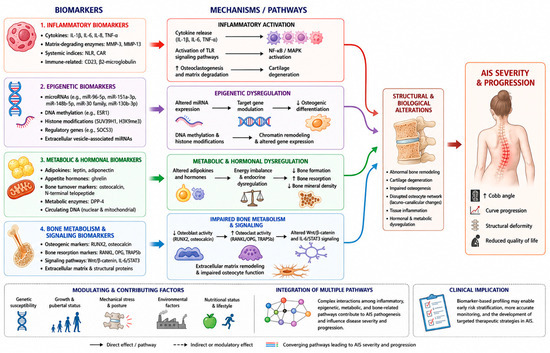
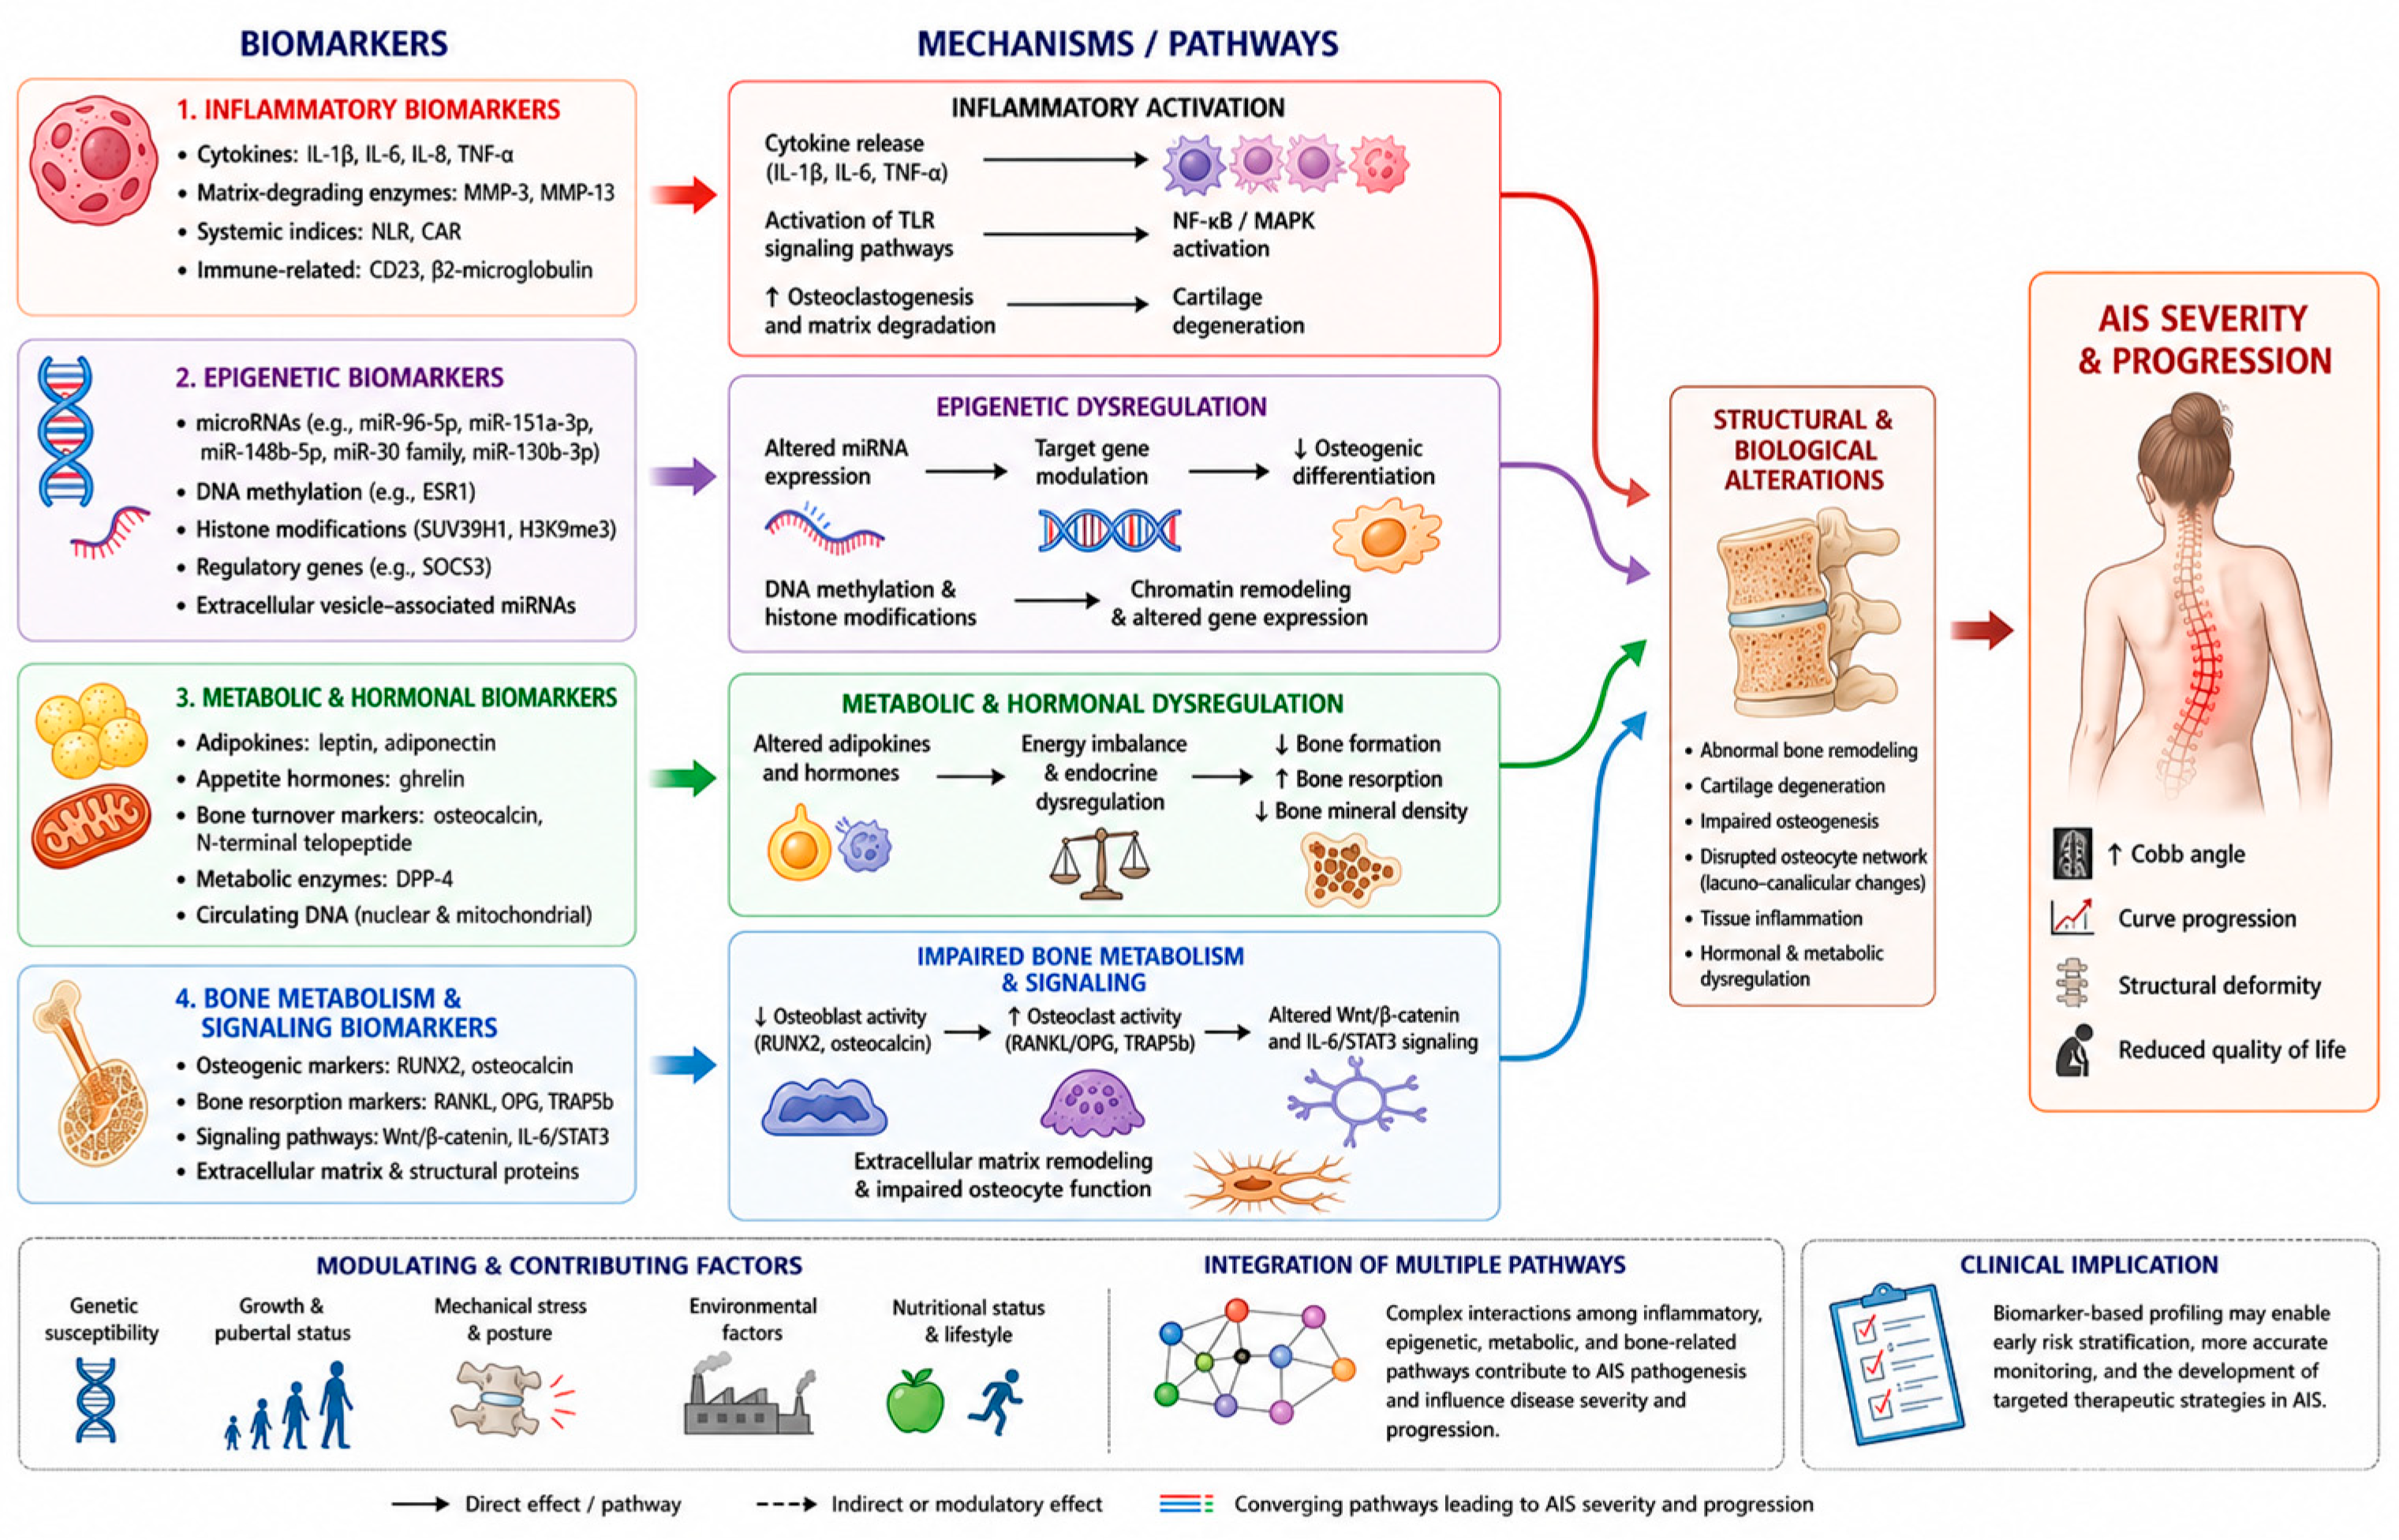
This systematic review provides a comprehensive synthesis of current evidence on circulating and tissue biomarkers associated with disease severity and progression in AIS. Overall, the findings support a multifactorial biological framework in which inflammatory, epigenetic, metabolic, and bone-related markers may be involved in biological processes associated with disease severity (Figure 3). However, only a limited subset of studies has evaluated their role in predicting disease progression. An additional challenge in interpreting progression-related biomarkers is the lack of standardization in progression definitions across studies. Thresholds for progression varied, commonly including increases of ≥5° or ≥10° in the major curve, and were often assessed over different follow-up durations. These differences are particularly relevant given the inherent variability of radiographic measurements and the influence of skeletal maturity, growth velocity, and treatment interventions on curve evolution. Consequently, heterogeneity in progression endpoints may have affected the comparability of findings and the identification of reliable predictive biomarkers.
Figure 3.
Schematic model illustrates circulating and tissue biomarkers, their underlying mechanisms, and their contribution to structural alterations and clinical outcomes in AIS, as identified in this review. The figure was created by the authors using Microsoft PowerPoint.
In particular, a consistent association was observed between several biomarkers, particularly inflammatory cytokines [37,41,43,45,46,51,55,62,63], miRNAs [36,37,41,43,45,46,51,55,62,63], markers of bone metabolism [39,40,42,52,53,58,63], and curve severity, typically measured by the Cobb angle. These results support the hypothesis that AIS is not solely a structural deformity but also involves systemic biological alterations, including low-grade inflammation, dysregulated osteogenesis, and altered energy metabolism.
In contrast, evidence supporting their predictive value for longitudinal progression remains scarce [37,47,55,56,59]. This discrepancy reflects the predominance of cross-sectional study designs and represents a major limitation in the current literature.
The consistent association between inflammatory mediators and higher Cobb angles suggests a potential role of low-grade systemic inflammation in structural remodeling processes observed in AIS, particularly through cartilage degradation and extracellular matrix breakdown [64,65,66].
At the molecular level, the involvement of pathways such as TLR signaling and IL-6/STAT3 activation further strengthens the biological plausibility of inflammation-driven skeletal alterations [44,52,61]. These pathways are known to regulate osteoclastogenesis and tissue degeneration, suggesting that similar mechanisms may be involved in curve progression in AIS [67,68]. However, the distinction between disease-related inflammation and secondary responses remains critical, as postoperative elevations in inflammatory markers likely reflect acute physiological stress rather than intrinsic disease activity [56,69].
Similarly, epigenetic regulators, particularly circulating miRNAs, emerged as promising biomarkers, with several studies identifying specific signatures associated with disease severity [37,41,43,45,51,55,63] and, in some cases, progression risk [37,55].
Epigenetic regulation emerges as a particularly promising area, providing a potential link between genetic susceptibility and environmental influences. The identification of miRNA signatures associated with disease severity suggests that post-transcriptional regulation may play a key role in modulating skeletal growth and remodeling [70,71,72]. Notably, functional evidence from studies on extracellular vesicle-associated miRNAs indicates that these molecules have been shown in experimental models to influence osteogenic differentiation, providing biological plausibility for their association with AIS severity [73,74]. Nevertheless, the lack of external validation and the predominance of exploratory analyses currently limit their clinical applicability.
In parallel, metabolic and hormonal alterations, such as changes in leptin, ghrelin, and adipokines, highlight the interplay between energy balance and skeletal development in AIS [38,44,47,48,50,53,54,57]. This perspective aligns with emerging evidence linking AIS to broader metabolic phenotypes.
Bone metabolism markers further support this concept [39,40,42,52,53,58,63], suggesting that impaired osteogenic activity and increased bone resorption may be associated with curve progression [75,76]. Consistent evidence of altered bone metabolism reinforces the hypothesis of intrinsic skeletal fragility in AIS [77]. Indeed, impaired osteogenic activity, increased bone resorption, and structural abnormalities in the osteocyte network suggest that defective bone quality, rather than bone quantity alone, may be associated with greater disease severity. Dysregulation of key signaling pathways, including Wnt/β-catenin, provides a plausible mechanistic framework that may link molecular alterations to macroscopic deformity [78,79].
Despite growing interest in biomarker-based prediction, only a limited number of studies directly evaluated disease progression using longitudinal designs. Only a small subset of studies employed longitudinal designs, and among these, few identified biomarkers with potential prognostic value, such as specific miRNA panels or spermidine levels [37,55,59]. However, most studies relied on cross-sectional analyses, which, while useful for understanding biological mechanisms, do not allow causal inference or reliable prediction of disease trajectory. This represents a critical gap in the literature, as the clinical utility of biomarkers in AIS lies primarily in their ability to predict progression and guide early intervention.
The interpretation of these findings must also consider the methodological limitations identified through the risk of bias assessment. The ROBINS-I analysis revealed substantial concerns, particularly in pre-intervention domains. A high risk of bias due to confounding and participant selection was observed in most studies, reflecting the observational nature of the evidence and the frequent lack of adjustment for key clinical variables such as age, sex, skeletal maturity, and baseline curve severity. Furthermore, although ROBINS-I provided a standardized framework for assessing methodological quality across the heterogeneous study designs included in this review, it was originally developed for non-randomized intervention studies and may not fully capture all sources of bias relevant to observational biomarker research. Therefore, the risk-of-bias findings should be interpreted considering this methodological limitation. These factors are well-known determinants of AIS progression and may have influenced the reported associations, thereby limiting the internal validity of the findings.
In contrast, domains related to intervention classification and post-intervention processes generally showed lower risk of bias, suggesting that biomarker measurement and outcome assessment were relatively consistent and methodologically sound across studies. However, the presence of a moderate risk of bias due to missing data in all studies indicates potential issues with incomplete datasets and follow-up, which may affect the robustness of the results. Furthermore, the high proportion of studies with a serious risk of bias in the selection of reported results raises concerns about selective reporting and publication bias, potentially leading to an overrepresentation of statistically significant findings.
To provide a more structured synthesis of the available evidence, biomarker categories were classified according to the consistency and replication of findings reported across the included studies (Table 7). Overall, inflammatory cytokines, miRNAs, and bone metabolism markers showed the most consistent associations with AIS severity, whereas evidence for progression-related biomarkers remains limited and largely exploratory. Most candidate biomarkers still require independent validation before they can be considered clinically useful predictors of disease progression.
Table 7.
Summary of evidence strength for biomarker categories associated with AIS severity and progression.
Several limitations should be considered when interpreting these findings. First, the predominance of cross-sectional designs limits the ability to establish causal relationships or predictive value. Second, substantial heterogeneity was observed in study design, patient populations, biomarker selection, and analytical methods. Third, sample sizes were often small, particularly in translational and tissue-based studies, reducing statistical power. Finally, differences in outcome definitions, especially regarding disease progression, further limit comparability across studies.
The identification of reliable biomarkers for AIS progression remains a key unmet clinical need. An additional emerging area of interest involves biomarkers of skeletal growth and maturity. Although not included in the present systematic review because they did not meet the predefined eligibility criteria, recent studies have investigated circulating biomarkers associated with residual growth potential rather than curve severity or progression. For example, Welborn et al. identified Collagen X Biomarker (CXM) as a promising indicator of longitudinal bone growth, demonstrating strong correlations with established measures of skeletal maturity, including Sanders score, Risser stage, bone age, and peak height velocity [80]. Such biomarkers may complement traditional radiographic assessments and could potentially contribute to more individualized prediction of progression risk in AIS. However, further studies are needed to clarify their direct relationship with curve progression and clinical outcomes. Ideally, such biomarkers should be measurable in accessible biological samples, reflect underlying disease mechanisms, and enable early and accurate risk stratification.
Future research should prioritize large-scale, longitudinal studies integrating multi-omics approaches, including transcriptomics, metabolomics, and proteomics. Standardization of study design, biomarker assessment, and outcome definitions will be essential to facilitate comparison across studies and enable clinical translation. In addition, combining biomarkers with clinical and radiographic parameters may improve predictive models and support personalized management strategies in AIS.
5. Conclusions
Taken together, the current evidence suggests that multiple circulating and tissue biomarkers are associated with AIS severity, but their role in predicting disease progression remains insufficiently established. Future research should prioritize well-designed prospective longitudinal studies with standardized definitions of progression, adequate control of confounding variables, and rigorous methodological approaches. The integration of multi-omics strategies and advanced analytical models may further improve the identification of robust biomarker signatures. Ultimately, improving study quality and reducing bias will be essential to translate biomarker research into clinically useful tools for early risk stratification and personalized management of AIS.
Supplementary Materials
The following supporting information can be downloaded at: https://www.mdpi.com/article/10.3390/cells15121044/s1, Table S1: Combination of free-vocabulary and/or Medical Subject Headings (MeSH) terms for the identification of studies.
Author Contributions
Conceptualization, F.S., F.V.; methodology, F.S., F.V., D.C.; validation, L.B., G.T., C.G., A.G.; formal analysis, F.S., F.V., D.C., G.G.; investigation, F.S., F.V., D.C.; data curation, F.S., F.V., D.C.; writing—original draft preparation, F.S., F.V., D.C.; writing—review and editing, F.S., F.V., D.C., G.C., C.G., G.G.; visualization, F.S., F.V., D.C., G.C., L.B., G.T., C.G., A.G., G.G.; supervision, A.G., G.G. All authors have read and agreed to the published version of the manuscript.
Funding
This research was supported by the 5 × 1000 project 2023 (redditi 2022) 5M-2023-23687106 “Nuove Prospettive Traslazionali per la Diagnosi, Prevenzione e Trattamento delle Malattie Muscoloscheletriche Rare e Complesse”.
Institutional Review Board Statement
Not applicable.
Informed Consent Statement
Not applicable.
Data Availability Statement
The original contributions presented in this study are included in the article/Supplementary Materials. Further inquiries can be directed to the corresponding author(s).
Conflicts of Interest
The authors declare no conflicts of interest.
Abbreviations
The following abbreviations are used in this manuscript:
| AIS | Adolescent idiopathic scoliosis |
| PICOS | Population, Intervention, Comparison, Outcomes, Study design |
| PRISMA | Preferred Reporting Items for Systematic Reviews and Meta-Analyses |
| MeSH | Medical Subject Headings |
| ROBINS-I | Risk Of Bias In Non-randomized Studies of Interventions |
| IL | interleukin |
| MMP | matrix metalloproteinase |
| NLR | neutrophil-to-lymphocyte ratio |
| CAR | C-reactive protein/albumin ratio |
| TNF-α | Tumor Necrosis Factor alpha |
| DPP-4 | Dipeptidyl peptidase-4 |
| TLRs | Toll-like receptors |
| miRNAs | microRNAs |
| ESR1 | estrogen receptor 1 |
| SUV39H1 | Histone-lysine N-methyltransferase |
| H3K9me3 | Histone H3 Lysine 9 trimethylation |
| SOCS3 | Suppressor of Cytokine Signaling 3 |
| RUNX2 | Runt-related transcription factor 2 |
| RANKL | Receptor Activator of Nuclear Factor kappa-B Ligand |
| OPG | Osteoprotegerin |
| TRAP5b | Tartrate-resistant acid phosphatase 5b |
| STAT3 | Signal Transducer and Activator of Transcription 3 |
References
- Weinstein, S.L.; Dolan, L.A.; Cheng, J.C.; Danielsson, A.; Morcuende, J.A. Adolescent idiopathic scoliosis. Lancet 2008, 371, 1527–1537. [Google Scholar] [CrossRef] [Scilit] [PubMed]
- Richards, B.S.; Bernstein, R.M.; D’Amato, C.R.; Thompson, G.H. Standardization of criteria for adolescent idiopathic scoliosis brace studies: SRS Committee on Bracing and Nonoperative Management. Spine 2005, 30, 2068–2075, discussion 2076-7. [Google Scholar] [CrossRef] [Scilit]
- Weinstein, S.L.; Dolan, L.A.; Wright, J.G.; Dobbs, M.B. Effects of bracing in adolescents with idiopathic scoliosis. N. Engl. J. Med. 2013, 369, 1512–1521. [Google Scholar] [CrossRef] [Scilit]
- Giampietro, P.F. Genetic aspects of congenital and idiopathic scoliosis. Scientifica 2012, 2012, 152365. [Google Scholar] [CrossRef] [Scilit]
- Li, Z.; Li, X.; Shen, J.; Zhang, L.; Chan, M.; Wu, W.K. Emerging roles of non-coding RNAs in scoliosis. Cell Prolif. 2020, 53, e12736. [Google Scholar] [CrossRef] [Scilit]
- Silva, F.E.; Lenke, L.G. Adult degenerative scoliosis: Evaluation and management. Neurosurg. Focus 2010, 28, E1. [Google Scholar] [CrossRef] [Scilit] [PubMed]
- Fong, D.Y.; Lee, C.F.; Cheung, K.M.; Cheng, J.C.; Ng, B.K.; Lam, T.P.; Mak, K.H.; Yip, P.S.; Luk, K.D. A meta-analysis of the clinical effectiveness of school scoliosis screening. Spine 2010, 35, 1061–1071. [Google Scholar] [CrossRef] [Scilit]
- Luk, K.D.; Lee, C.F.; Cheung, K.M.; Cheng, J.C.; Ng, B.K.; Lam, T.P.; Mak, K.H.; Yip, P.S.; Fong, D.Y. Clinical effectiveness of school screening for adolescent idiopathic scoliosis: A large population-based retrospective cohort study. Spine 2010, 35, 1607–1614. [Google Scholar] [CrossRef] [Scilit] [PubMed]
- Stirling, A.J.; Howel, D.; Millner, P.A.; Sadiq, S.; Sharples, D.; Dickson, R.A. Late-onset idiopathic scoliosis in children six to fourteen years old. A cross-sectional prevalence study. J. Bone Jt. Surg. 1996, 78, 1330–1336. [Google Scholar] [CrossRef] [Scilit]
- Asher, M.A.; Burton, D.C. Adolescent idiopathic scoliosis: Natural history and long term treatment effects. Scoliosis 2006, 1, 2. [Google Scholar] [CrossRef] [Scilit]
- Ueno, M.; Takaso, M.; Nakazawa, T.; Imura, T.; Saito, W.; Shintani, R.; Uchida, K.; Fukuda, M.; Takahashi, K.; Ohtori, S.; et al. A 5-year epidemiological study on the prevalence rate of idiopathic scoliosis in Tokyo: School screening of more than 250,000 children. J. Orthop. Sci. 2011, 16, 1–6. [Google Scholar] [CrossRef] [Scilit]
- de Souza, F.I.; Di Ferreira, R.B.; Labres, D.; Elias, R.; de Sousa, A.P.; Pereira, R.E. Epidemiology of adolescent idiopathic scoliosis in students of the public schools in Goiânia-GO. Acta Ortop. Bras. 2013, 21, 223–225. [Google Scholar] [CrossRef] [Scilit] [PubMed]
- Cobb, J.R. Outline for the study of scoliosis. Am. Acad. Orthop. Surg. Instr. Course Lect. 1984, 5, 261–275. [Google Scholar]
- Hacquebord, J.H.; Leopold, S.S. In brief: The Risser classification: A classic tool for the clinician treating adolescent idiopathic scoliosis. Clin. Orthop. Relat. Res. 2012, 470, 2335–2338. [Google Scholar] [CrossRef] [Scilit]
- Oh, C.H.; Kim, C.G.; Lee, M.S.; Yoon, S.H.; Park, H.-C.; Park, C.O. Usefulness of chest radiographs for scoliosis screening: A comparison with thoraco-lumbar standing radiographs. Yonsei Med. J. 2012, 53, 1183–1189. [Google Scholar] [CrossRef] [Scilit]
- Cheng, J.C.; Castelein, R.M.; Chu, W.C.; Danielsson, A.J.; Dobbs, M.B.; Grivas, T.B.; Gurnett, C.A.; Luk, K.D.; Moreau, A.; Newton, P.O.; et al. Adolescent idiopathic scoliosis. Nat. Rev. Dis. Primers 2015, 1, 15030. [Google Scholar] [CrossRef] [Scilit] [PubMed]
- Negrini, S.; Donzelli, S.; Aulisa, A.G.; Czaprowski, D.; Schreiber, S.; de Mauroy, J.C.; Diers, H.; Grivas, T.B.; Knott, P.; Kotwicki, T.; et al. 2016 SOSORT guidelines: Orthopaedic and rehabilitation treatment of idiopathic scoliosis during growth. Scoliosis Spinal Disord. 2018, 13, 3. [Google Scholar] [CrossRef] [Scilit] [PubMed]
- Koumbourlis, A.C. Scoliosis and the respiratory system. Paediatr. Respir. Rev. 2006, 7, 152–160. [Google Scholar] [CrossRef] [Scilit]
- Lee, C.F.; Fong, D.Y.; Cheung, K.M.; Cheng, J.C.; Ng, B.K.; Lam, T.P.; Yip, P.S.; Luk, K.D. A new risk classification rule for curve progression in adolescent idiopathic scoliosis. Spine J. 2012, 12, 989–995. [Google Scholar] [CrossRef] [Scilit]
- Parent, E.C.; Donzelli, S.; Yaskina, M.; Negrini, A.; Rebagliati, G.; Cordani, C.; Zaina, F.; Negrini, S. Prediction of future curve angle using prior radiographs in previously untreated idiopathic scoliosis: Natural history from age 6 to after the end of growth (SOSORT 2022 award winner). Eur. Spine J. 2023, 32, 2171–2184. [Google Scholar] [CrossRef] [Scilit]
- Dunn, J.; Henrikson, N.B.; Morrison, C.C.; Blasi, P.R.; Nguyen, M.; Lin, J.S. Screening for adolescent idiopathic scoliosis: Evidence report and systematic review for the US preventive services task force. JAMA 2018, 319, 173–187. [Google Scholar] [CrossRef] [Scilit] [PubMed]
- Ronckers, C.M.; Land, C.E.; Miller, J.S.; Stovall, M.; Lonstein, J.E.; Doody, M.M. Cancer mortality among women frequently exposed to radiographic examinations for spinal disorders. Radiat. Res. 2010, 174, 83–90. [Google Scholar] [CrossRef] [Scilit]
- Simony, A.; Hansen, E.J.; Christensen, S.B.; Carreon, L.Y.; Andersen, M.O. Incidence of cancer in adolescent idiopathic scoliosis patients treated 25 years previously. Eur. Spine J. 2016, 25, 3366–3370. [Google Scholar] [CrossRef] [Scilit]
- Menger, R.P.; Kalakoti, P.; Pugely, A.J.; Nanda, A.; Sin, A. Adolescent idiopathic scoliosis: Risk factors for complications and the effect of hospital volume on outcomes. Neurosurg. Focus 2017, 43, E3. [Google Scholar] [CrossRef] [Scilit] [PubMed]
- Carreon, L.Y.; Puno, R.M.; Lenke, L.G.; Richards, B.S.; Sucato, D.J.; Emans, J.B.; Erickson, M.A. Non-neurologic complications following surgery for adolescent idiopathic scoliosis. J. Bone Jt. Surg. —Ser. A 2007, 89, 2427–2432. [Google Scholar] [CrossRef] [Scilit]
- Cook, S.; Asher, M.; Lai, S.M.; Shobe, J. Reoperation after primary posterior instrumentation and fusion for idiopathic scoliosis: Toward defining late operative site pain of unknown cause. Spine 2000, 25, 463–468. [Google Scholar] [CrossRef] [Scilit]
- Weiss, H.R.; Goodall, D. Rate of complications in scoliosis surgery—A systematic review of the Pub Med literature. Scoliosis 2008, 3, 9. [Google Scholar] [CrossRef] [Scilit] [PubMed]
- Raimondi, L.; Colombini, A.; Ruffilli, A.; Perna, F.; Negrini, S.; Toscano, A.; Giavaresi, G. Current insights into circulating biomarkers and their potential for predicting adolescent idiopathic scoliosis progression. Front. Cell Dev. Biol. 2026, 14, 1760636. [Google Scholar] [CrossRef] [Scilit]
- Zhang, Y.; Deng, Y.; Sui, W.; Zhang, T.; Yang, J. Blood Biomarker Profiles in Adolescent Idiopathic Scoliosis: A Literature Review of Pathophysiological Insights and Clinical Implications. Glob. Spine J. 2026, 16, 1575–1587. [Google Scholar] [CrossRef] [Scilit]
- Sun, D.; Ding, Z.; Hai, Y.; Cheng, Y. Advances in epigenetic research of adolescent idiopathic scoliosis and congenital scoliosis. Front. Genet. 2023, 14, 1211376. [Google Scholar] [CrossRef] [Scilit]
- Pérez-Machado, G.; Berenguer-Pascual, E.; Bovea-Marco, M.; Rubio-Belmar, P.A.; García-López, E.; Garzón, M.J.; Mena-Mollá, S.; Pallardó, F.V.; Bas, T.; Viña, J.R.; et al. From genetics to epigenetics to unravel the etiology of adolescent idiopathic scoliosis. Bone 2020, 140, 115563. [Google Scholar] [CrossRef] [Scilit]
- Schardt, C.; Adams, M.B.; Owens, T.; Keitz, S.; Fontelo, P. Utilization of the PICO framework to improve searching PubMed for clinical questions. BMC Med. Inform. Decis. Mak. 2007, 7, 16. [Google Scholar] [CrossRef] [Scilit]
- Page, M.J.; McKenzie, J.E.; Bossuyt, P.M.; Boutron, I.; Hoffmann, T.C.; Mulrow, C.D.; Shamseer, L.; Tetzlaff, J.M.; Akl, E.A.; Brennan, S.E.; et al. The PRISMA 2020 statement: An updated guideline for reporting systematic reviews. BMJ 2021, 372, n71. [Google Scholar] [CrossRef] [Scilit]
- Sterne, J.A.; Hernán, M.A.; Reeves, B.C.; Savović, J.; Berkman, N.D.; Viswanathan, M.; Henry, D.; Altman, D.G.; Ansari, M.T.; Boutron, I.; et al. ROBINS-I: A tool for assessing risk of bias in non-randomised studies of interventions. BMJ 2016, 355, i4919. [Google Scholar] [CrossRef] [Scilit]
- Bisson, D.G.; Lama, P.; Abduljabbar, F.; Rosenzweig, D.H.; Saran, N.; Ouellet, J.A.; Haglund, L. Facet joint degeneration in adolescent idiopathic scoliosis. JOR Spine 2018, 1, e1016. [Google Scholar] [CrossRef] [Scilit]
- Janusz, P.; Chmielewska, M.; Andrusiewicz, M.; Kotwicka, M.; Kotwicki, T. Methylation of Estrogen Receptor 1 Gene in the Paraspinal Muscles of Girls with Idiopathic Scoliosis and Its Association with Disease Severity. Genes 2021, 12, 790. [Google Scholar] [CrossRef] [Scilit]
- Khatami, N.; Caraus, I.; Rahaman, M.; Nepotchatykh, E.; Elbakry, M.; Elremaly, W.; Franco, A.; Beauséjour, M.; Laberge, A.M.; Parent, S.; et al. Genome-wide profiling of circulating microRNAs in adolescent idiopathic scoliosis and their relation to spinal deformity severity, and disease pathophysiology. Sci. Rep. 2025, 15, 5305. [Google Scholar] [CrossRef] [Scilit] [PubMed]
- Matusik, E.; Durmala, J.; Olszanecka-Glinianowicz, M.; Chudek, J.; Matusik, P. Association between Bone Turnover Markers, Leptin, and Nutritional Status in Girls with Adolescent Idiopathic Scoliosis (AIS). Nutrients 2020, 12, 2657. [Google Scholar] [CrossRef] [Scilit] [PubMed]
- Neri, S.; Ruffilli, A.; Assirelli, E.; Manzetti, M.; Viroli, G.; Traversari, M.; Ialuna, M.; Naldi, S.; Ciaffi, J.; Ursini, F.; et al. Local Expression of Epigenetic Candidate Biomarkers of Adolescent Idiopathic Scoliosis Progression. Int. J. Mol. Sci. 2025, 26, 8453. [Google Scholar] [CrossRef] [Scilit]
- Tanabe, H.; Aota, Y.; Nakamura, N.; Saito, T. A histomorphometric study of the cancellous spinal process bone in adolescent idiopathic scoliosis. Eur. Spine J. 2017, 26, 1600–1609. [Google Scholar] [CrossRef] [Scilit] [PubMed]
- Xiang, G.; Xie, J.; Wang, Y.; Jiang, Z.; He, S.; Li, J.; Zhang, H. miRNA-130b-3p upregulation impairs osteogenic differentiation in AIS patients by inhibiting the IGF1/ERK pathway. Cell. Mol. Life Sci. 2025, 82, 350. [Google Scholar] [CrossRef] [Scilit]
- Chen, H.; Zhang, J.; Wang, Y.; Cheuk, K.Y.; Hung, A.L.H.; Lam, T.P.; Qiu, Y.; Feng, J.Q.; Lee, W.Y.W.; Cheng, J.C.Y. Abnormal lacuno-canalicular network and negative correlation between serum osteocalcin and Cobb angle indicate abnormal osteocyte function in adolescent idiopathic scoliosis. FASEB J. 2019, 33, 13882–13892. [Google Scholar] [CrossRef] [Scilit]
- Chen, H.; Yang, K.G.; Zhang, J.; Cheuk, K.Y.; Nepotchatykh, E.; Wang, Y.; Hung, A.L.H.; Lam, T.P.; Moreau, A.; Lee, W.Y.W. Upregulation of microRNA-96-5p is associated with adolescent idiopathic scoliosis and low bone mass phenotype. Sci. Rep. 2022, 12, 9705. [Google Scholar] [CrossRef] [Scilit] [PubMed]
- Dai, Z.; Xue, B.; Xu, L.; Feng, Z.; Wu, Z.; Qiu, Y.; Zhu, Z. Dipeptidyl peptidase-4 is associated with myogenesis in patients with adolescent idiopathic scoliosis possibly via mediation of insulin sensitivity. J. Orthop. Surg. Res. 2022, 17, 82. [Google Scholar] [CrossRef] [Scilit]
- García-Giménez, J.L.; Rubio-Belmar, P.A.; Peiró-Chova, L.; Hervás, D.; González-Rodríguez, D.; Ibañez-Cabellos, J.S.; Bas-Hermida, P.; Mena-Mollá, S.; García-López, E.M.; Pallardó, F.V.; et al. Circulating miRNAs as diagnostic biomarkers for adolescent idiopathic scoliosis. Sci. Rep. 2018, 8, 2646. [Google Scholar] [CrossRef] [Scilit]
- Li, J.; Yang, G.; Liu, S.; Wang, L.; Liang, Z.; Zhang, H. Suv39h1 promotes facet joint chondrocyte proliferation by targeting miR-15a/Bcl2 in idiopathic scoliosis patients. Clin. Epigenetics 2019, 11, 107. [Google Scholar] [CrossRef] [Scilit] [PubMed]
- Li, J.; Wang, L.; Yang, G.; Wang, Y.; Guo, C.; Liu, S.; Gao, Q.; Zhang, H. Changes in circulating cell-free nuclear DNA and mitochondrial DNA of patients with adolescent idiopathic scoliosis. BMC Musculoskelet. Disord. 2019, 20, 479. [Google Scholar] [CrossRef] [Scilit]
- Normand, E.; Franco, A.; Moreau, A.; Marcil, V. Dipeptidyl Peptidase-4 and Adolescent Idiopathic Scoliosis: Expression in Osteoblasts. Sci. Rep. 2017, 7, 3173. [Google Scholar] [CrossRef] [Scilit]
- Shao, Z.; Zhang, Z.; Tu, Y.; Huang, C.; Chen, L.; Sun, A.; Sheng, S.; Zhang, X.; Wu, Y. A targeted antibody-based array reveals a serum protein signature as biomarker for adolescent idiopathic scoliosis patients. BMC Genom. 2023, 24, 522. [Google Scholar] [CrossRef] [Scilit]
- Tam, E.M.S.; Liu, Z.; Lam, T.P.; Ting, T.; Cheung, G.; Ng, B.K.W.; Lee, S.K.M.; Qiu, Y.; Cheng, J.C.Y. Lower Muscle Mass and Body Fat in Adolescent Idiopathic Scoliosis Are Associated With Abnormal Leptin Bioavailability. Spine 2016, 41, 940–946. [Google Scholar] [CrossRef] [Scilit] [PubMed]
- Wang, Y.; Zhang, H.; Yang, G.; Xiao, L.; Li, J.; Guo, C. Dysregulated Bone Metabolism Is Related to High Expression of miR-151a-3p in Severe Adolescent Idiopathic Scoliosis. Biomed. Res. Int. 2020, 2020, 4243015. [Google Scholar] [CrossRef] [Scilit]
- Wu, Y.T.; Tang, M.X.; Wang, Y.J.; Li, J.; Wang, Y.X.; Deng, A.; Guo, C.F.; Zhang, H.Q. Lower androgen levels promote abnormal cartilage development in female patients with adolescent idiopathic scoliosis. Ann. Transl. Med. 2021, 9, 784. [Google Scholar] [CrossRef] [Scilit] [PubMed]
- Xiao, L.; Zhang, H.; Wang, Y.; Li, J.; Yang, G.; Wang, L.; Liang, Z. Dysregulation of the ghrelin/RANKL/OPG pathway in bone mass is related to AIS osteopenia. Bone 2020, 134, 115291. [Google Scholar] [CrossRef] [Scilit]
- Zhang, H.Q.; Wang, L.J.; Liu, S.H.; Li, J.; Xiao, L.G.; Yang, G.T. Adiponectin regulates bone mass in AIS osteopenia via RANKL/OPG and IL6 pathway. J. Transl. Med. 2019, 17, 64. [Google Scholar] [CrossRef] [Scilit] [PubMed]
- Orlickova, J.; Lujc, M.; Galko, M.; Tukmachi, D.A.; Slaby, O.; Repko, M. Circulating microRNA signatures for diagnosis and prediction of curve progression in pediatric patients with idiopathic scoliosis. J. Orthop. Surg. Res. 2026, 21, 88. [Google Scholar] [CrossRef] [Scilit]
- Salamanna, F.; Tedesco, G.; Sartori, M.; Contartese, D.; Asunis, E.; Cini, C.; Veronesi, F.; Martikos, K.; Fini, M.; Giavaresi, G.; et al. Clinical Outcomes and Inflammatory Response to the Enhanced Recovery After Surgery (ERAS) Protocol in Adolescent Idiopathic Scoliosis Surgery: An Observational Study. Int. J. Mol. Sci. 2025, 26, 3723. [Google Scholar] [CrossRef] [Scilit] [PubMed]
- Yu, H.G.; Zhang, H.Q.; Zhou, Z.H.; Wang, Y.J. High Ghrelin Level Predicts the Curve Progression of Adolescent Idiopathic Scoliosis Girls. Biomed. Res. Int. 2018, 2018, 9784083. [Google Scholar] [CrossRef] [Scilit]
- Zhang, J.; Chen, H.; Leung, R.K.K.; Choy, K.W.; Lam, T.P.; Ng, B.K.W.; Qiu, Y.; Feng, J.Q.; Cheng, J.C.Y.; Lee, W.Y.W. Aberrant miR-145-5p/β-catenin signal impairs osteocyte function in adolescent idiopathic scoliosis. FASEB J. 2018, 32, 6537–6549. [Google Scholar] [CrossRef] [Scilit]
- Zhang, Z.; Wang, Y.; Hu, Z.; Tian, W.; Li, M.; Tang, Z.; Chang, L.; Tang, H.H.; Tang, G.; Li, J.; et al. LBX1 alters polyamine pathway in adolescent idiopathic scoliosis—A new therapeutic target to mitigate curve progression. J. Orthop. Transl. 2026, 57, 101063. [Google Scholar] [CrossRef] [Scilit]
- Karakılıç, G.D.; Bakırcı, E.S. The onset inflammatory parameters and the Cobb angle in adolescent idiopathic scoliosis: A case-control study. Croat. Med. J. 2025, 66, 352–359. [Google Scholar] [CrossRef] [Scilit]
- Sheng, K.; Bisson, D.G.; Saran, N.; Bourdages, J.; Coluni, C.; Upshaw, K.; Tiedemann, K.; Komarova, S.V.; Ouellet, J.A.; Haglund, L. The TLR-M-CSF axis is implicated in increased bone turnover and curve progression in adolescent idiopathic scoliosis. Arthritis Res. Ther. 2025, 27, 68. [Google Scholar] [CrossRef] [Scilit]
- Qiao, J.; Xiao, L.; Xu, L.; Qian, B.; Zhu, Z.; Qiu, Y. Genetic Variant of SOCS3 Gene is Functionally Associated With Lumbar Adolescent Idiopathic Scoliosis. Clin. Spine Surg. 2018, 31, E193–E196. [Google Scholar] [CrossRef] [Scilit] [PubMed]
- Raimondi, L.; De Luca, A.; Gallo, A.; Perna, F.; Cuscino, N.; Cordaro, A.; Costa, V.; Bellavia, D.; Faldini, C.; Scilabra, S.D.; et al. Investigating the Differential Circulating microRNA Expression in Adolescent Females with Severe Idiopathic Scoliosis: A Proof-of-Concept Observational Clinical Study. Int. J. Mol. Sci. 2024, 25, 570. [Google Scholar] [CrossRef] [Scilit] [PubMed]
- Cifuentes, M.; Verdejo, H.E.; Castro, P.F.; Corvalan, A.H.; Ferreccio, C.; Quest, A.F.G.; Kogan, M.J.; Lavandero, S. Low-Grade Chronic Inflammation: A Shared Mechanism for Chronic Diseases. Physiology 2025, 40, 4–25. [Google Scholar] [CrossRef] [Scilit] [PubMed]
- Robinson, W.H.; Lepus, C.M.; Wang, Q.; Raghu, H.; Mao, R.; Lindstrom, T.M.; Sokolove, J. Low-grade inflammation as a key mediator of the pathogenesis of osteoarthritis. Nat. Rev. Rheumatol. 2016, 12, 580–592. [Google Scholar] [CrossRef] [Scilit]
- Arnbak, B.; Jensen, T.S.; Schiøttz-Christensen, B.; Pedersen, S.J.; Østergaard, M.; Weber, U.; Hendricks, O.; Zejden, A.; Manniche, C.; Jurik, A.G. What Level of Inflammation Leads to Structural Damage in the Sacroiliac Joints? A Four-Year Magnetic Resonance Imaging Follow-Up Study of Low Back Pain Patients. Arthritis Rheumatol. 2019, 71, 2027–2033. [Google Scholar] [CrossRef] [Scilit]
- Liu, X.; Zhou, Z.; Zeng, W.N.; Zeng, Q.; Zhang, X. The role of toll-like receptors in orchestrating osteogenic differentiation of mesenchymal stromal cells and osteoimmunology. Front. Cell Dev. Biol. 2023, 11, 1277686. [Google Scholar] [CrossRef] [Scilit]
- Chang, P.Y.; Wu, H.K.; Chen, Y.H.; Hsu, Y.P.; Cheng, M.T.; Yu, C.H.; Chen, S.K. Interleukin-6 transiently promotes proliferation of osteoclast precursors and stimulates the production of inflammatory mediators. Mol. Biol. Rep. 2022, 49, 3927–3937. [Google Scholar] [CrossRef] [Scilit]
- Chachkhiani, I.; Gürlich, R.; Maruna, P.; Frasko, R.; Lindner, J. The postoperative stress response and its reflection in cytokine network and leptin plasma levels. Physiol. Res. 2005, 54, 279–285. [Google Scholar] [CrossRef] [Scilit]
- Loh, H.Y.; Norman, B.P.; Lai, K.S.; Cheng, W.H.; Nik Abd Rahman, N.M.A.; Mohamed Alitheen, N.B.; Osman, M.A. Post-Transcriptional Regulatory Crosstalk between MicroRNAs and Canonical TGF-β/BMP Signalling Cascades on Osteoblast Lineage: A Comprehensive Review. Int. J. Mol. Sci. 2023, 24, 6423. [Google Scholar] [CrossRef] [Scilit]
- Bravo Vázquez, L.A.; Moreno Becerril, M.Y.; Mora Hernández, E.O.; León Carmona, G.G.; Aguirre Padilla, M.E.; Chakraborty, S.; Bandyopadhyay, A.; Paul, S. The Emerging Role of MicroRNAs in Bone Diseases and Their Therapeutic Potential. Molecules 2021, 27, 211. [Google Scholar] [CrossRef] [Scilit] [PubMed]
- Sharma, A.R.; Lee, Y.H.; Lee, S.S. Recent advancements of miRNAs in the treatment of bone diseases and their delivery potential. Curr. Res. Pharmacol. Drug Discov. 2022, 4, 100150. [Google Scholar] [CrossRef] [Scilit] [PubMed]
- Liu, R.; Wu, S.; Liu, W.; Wang, L.; Dong, M.; Niu, W. microRNAs delivered by small extracellular vesicles in MSCs as an emerging tool for bone regeneration. Front. Bioeng. Biotechnol. 2023, 11, 1249860. [Google Scholar] [CrossRef] [Scilit] [PubMed]
- Ghorbani Shemshadsara, F.; Mohamadnia, A.; Bayat, M.; Ebrahimi, A.; Shafaghi, S.; Ahmadinia, M.; Bahrami, N. Exosomal mRNAs/microRNAs in Osteogenesis and Bone Regeneration: From Signaling to Therapeutic Roles. Tissue Eng. Part B Rev. 2026. [Google Scholar] [CrossRef] [Scilit]
- Barbour, K.E.; Zmuda, J.M.; Boudreau, R.; Strotmeyer, E.S.; Horwitz, M.J.; Evans, R.W.; Kanaya, A.M.; Harris, T.B.; Cauley, J.A. Health ABC Study. The effects of adiponectin and leptin on changes in bone mineral density. Osteoporos. Int. 2012, 23, 1699–1710. [Google Scholar] [CrossRef] [Scilit]
- Jürimäe, J.; Jürimäe, T.; Leppik, A.; Kums, T. The influence of ghrelin, adiponectin, and leptin on bone mineral density in healthy postmenopausal women. J. Bone Miner. Metab. 2008, 26, 618–623. [Google Scholar] [CrossRef] [Scilit]
- Newton Ede, M.M.; Jones, S.W. Adolescent idiopathic scoliosis: Evidence for intrinsic factors driving aetiology and progression. Int. Orthop. 2016, 40, 2075–2080. [Google Scholar] [CrossRef] [Scilit]
- Xu, L.; Dai, Z.; Xia, C.; Wu, Z.; Feng, Z.; Sun, X.; Liu, Z.; Qiu, Y.; Cheng, J.C.; Zhu, Z. Asymmetric Expression of Wnt/B-catenin Pathway in AIS: Primary or Secondary to the Curve? Spine 2020, 45, E677–E683. [Google Scholar] [CrossRef] [Scilit]
- Zhu, Z.; Xu, L.; Leung-Sang Tang, N.; Qin, X.; Feng, Z.; Sun, W.; Zhu, W.; Shi, B.; Liu, P.; Mao, S.; et al. Genomewide association study identifies novel susceptible loci and highlights Wnt/beta-catenin pathway in the development of adolescent idiopathic scoliosis. Hum. Mol. Genet. 2017, 26, 1577–1583. [Google Scholar] [CrossRef] [Scilit]
- Welborn, M.C.; Coghlan, R.; Sienko, S.; Horton, W. Correlation of collagen X biomarker (CXM) with peak height velocity and radiographic measures of growth in idiopathic scoliosis. Spine Deform. 2021, 9, 645–653. [Google Scholar] [CrossRef] [Scilit]

Disclaimer/Publisher’s Note: The statements, opinions and data contained in all publications are solely those of the individual author(s) and contributor(s) and not of MDPI and/or the editor(s). MDPI and/or the editor(s) disclaim responsibility for any injury to people or property resulting from any ideas, methods, instructions or products referred to in the content. |
© 2026 by the authors. Licensee MDPI, Basel, Switzerland. This article is an open access article distributed under the terms and conditions of the Creative Commons Attribution (CC BY) license.