


Abstract
In this study, we evaluated the use of five different ML algorithms (CatBoost, XGBoost, random forest, gradient boosting, and support vector regression [SVR]) to estimate daily ET0 based only on four independent variables: 2 m air temperature, vapor pressure deficit, 10 m wind speed, and sunshine duration. We used a total of 9132 daily values (2000–2025) from the Open-Meteo Historical Weather API (2000–2025) at 10 stations in the Tlemcen province of northwest Algeria. The dataset was divided into training, validation, and testing sets using a chronological split of 70/15/15. We estimated the performance of each algorithm by using several statistics (RMSE, MAE, R2, NSE, RSR, and Willmott Index) as well as some statistics to evaluate the potential of overfitting and the ability to reproduce the behavior observed during the training phase. CatBoost had the highest overall accuracy and the most generalized performance, with an RMSE of approximately 0.292 mm day−1, MAE of approximately 0.208 mm day−1, R2 of 0.971, and NSE of 0.971 in the test set, suggesting an extremely low risk of overfitting. The optimal CatBoost model was also used to estimate the spatial and temporal variations of monthly ET0. The results showed high interannual variability (changes from year to year from −12.815 to +8.707 mm month−1) in the semi-arid region of Tlemcen but no significant long-term trends (cumulative net change of approximately −0.021 mm month−1 over 2000–2025). Therefore, the use of CatBoost is recommended as a robust, efficient, and reliable emulator of the FAO-56 Penman–Monteith equation (ET0) for estimating ET0 in semi-arid environments with limited climate data availability, and could be particularly useful in northwestern Algeria and other semi-arid Mediterranean regions.
1. Introduction
Reference evapotranspiration (ET0) represents the evapotranspiration rate from a hypothetical reference crop under standard conditions and serves as a fundamental parameter in hydrological modeling, agricultural water management, and irrigation scheduling [1]. In semi-arid and arid regions, where water resources are scarce and precipitation is limited and variable, accurate ET0 estimation is critical for optimizing irrigation practices, minimizing water losses, and supporting sustainable agriculture amid increasing climate variability and drought frequencies [2,3]. The FAO-56 Penman–Monteith Equation is widely regarded as the most physically sound and accurate method for computing ET0, as it integrates aerodynamic and energy balance components using meteorological variables, such as air temperature, relative humidity (or vapor pressure), wind speed, and solar radiation [1]. However, its application is often constrained in data-scarce environments, particularly in developing regions with sparse meteorological networks, where complete datasets are unavailable or unreliable [3,4]. This limitation has prompted the development of alternative approaches, including empirical temperature- or radiation-based equations and data-driven machine learning (ML) models, that can achieve high accuracy even with reduced inputs [5,6]. Machine learning techniques have gained prominence in ET0 estimation owing to their ability to capture complex, nonlinear relationships among meteorological variables without requiring explicit physical assumptions [7,8]. Common models include support vector regression (SVR), which excels in generalization from limited data through structural risk minimization [9,10], and tree-based ensemble methods, such as random forest (RF), gradient boosting (GB), XGBoost, and CatBoost. Ensemble approaches often mitigate overfitting and improve predictive stability by aggregating multiple weak learners [11,12,13]. Recent studies have demonstrated the superior performance of boosting algorithms in diverse climates: XGBoost and CatBoost have shown low errors in humid and arid settings [7,14], whereas hybrid optimizations further enhance accuracy [15,16,17]. In North Africa, particularly Algeria’s semi-arid northwestern regions, such as Tlemcen Province, characterized by complex topography, hot-summer Mediterranean climate (Csa), and marked seasonal precipitation variability [18,19], ET0 estimation faces additional challenges from data gaps and spatial heterogeneity. Previous Algerian studies have applied Machine Learning models such as ANN, SVR, and XGBoost hybrids, reporting RMSE values typically in the 0.1–0.5 mm day−1 range for daily ET0 with limited inputs [15,20,21]. However, comprehensive comparisons, including CatBoost, a gradient boosting algorithm with ordered boosting and categorical feature handling advantages, remain limited in Mediterranean semi-arid contexts, especially with four inputs (temperature, vapor pressure deficit, wind speed, and sunshine duration), and multi-station spatiotemporal analysis. Advanced approaches, including quantile regression hybrids and forecasting in aquifer systems, have also shown promise in related hydrological applications [22,23,24]. Despite these advancements, a critical gap remains in systematically evaluating the robustness of these models against potential biases introduced by reliance on reanalysis data, particularly in regions with sparse ground-truth observations. Furthermore, while individual models have been tested, a comprehensive multi-station assessment that rigorously quantifies the trade-offs between model complexity, prediction stability, and overfitting risk under limited-input scenarios is still lacking.
While empirical and physically based models (such as Hargreaves–Samani or Priestley–Taylor) also utilize these four meteorological variables, machine learning techniques offer distinct advantages in this context. The primary advantage of ML models lies in their superior ability to capture complex, non-linear, and non-stationary relationships between meteorological inputs and ET0 without requiring rigid physical assumptions or local calibration of empirical coefficients. Consequently, ML approaches often demonstrate enhanced generalization capabilities across diverse microclimates and significantly reduce estimation errors (e.g., lower RMSE and higher R2) compared to traditional empirical equations, particularly when dealing with the inherent noise and variability of limited meteorological datasets in semi-arid regions.
This study addresses these gaps by comparing the performances of CatBoost, XGBoost, random forest, gradient boosting, and SVR for daily ET prediction using only four meteorological variables from the Open-Meteo Historical Weather API (2000–2025) across 10 stations in the Tlemcen Province. The objectives were to (i) evaluate model accuracy and generalization using multiple metrics (RMSE, MAE, R2, NSE, RSR, and Willmott index) and overfitting/stability indicators, (ii) identify the most effective model, and (iii) apply the optimal model for spatiotemporal mapping of monthly ET0 trends and variability. The results aim to provide a reliable and data-efficient tool for irrigation planning in data-limited semi-arid Mediterranean environments.
2. Materials and Methods
2.1. Study Area and Data Source
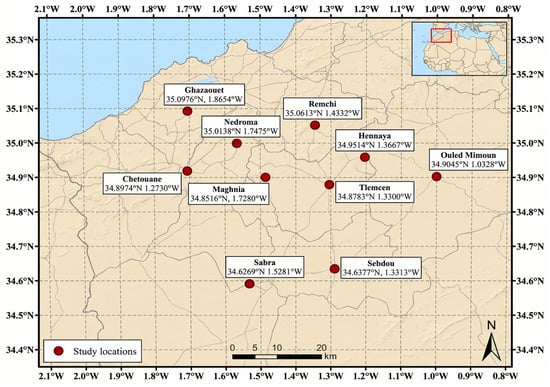
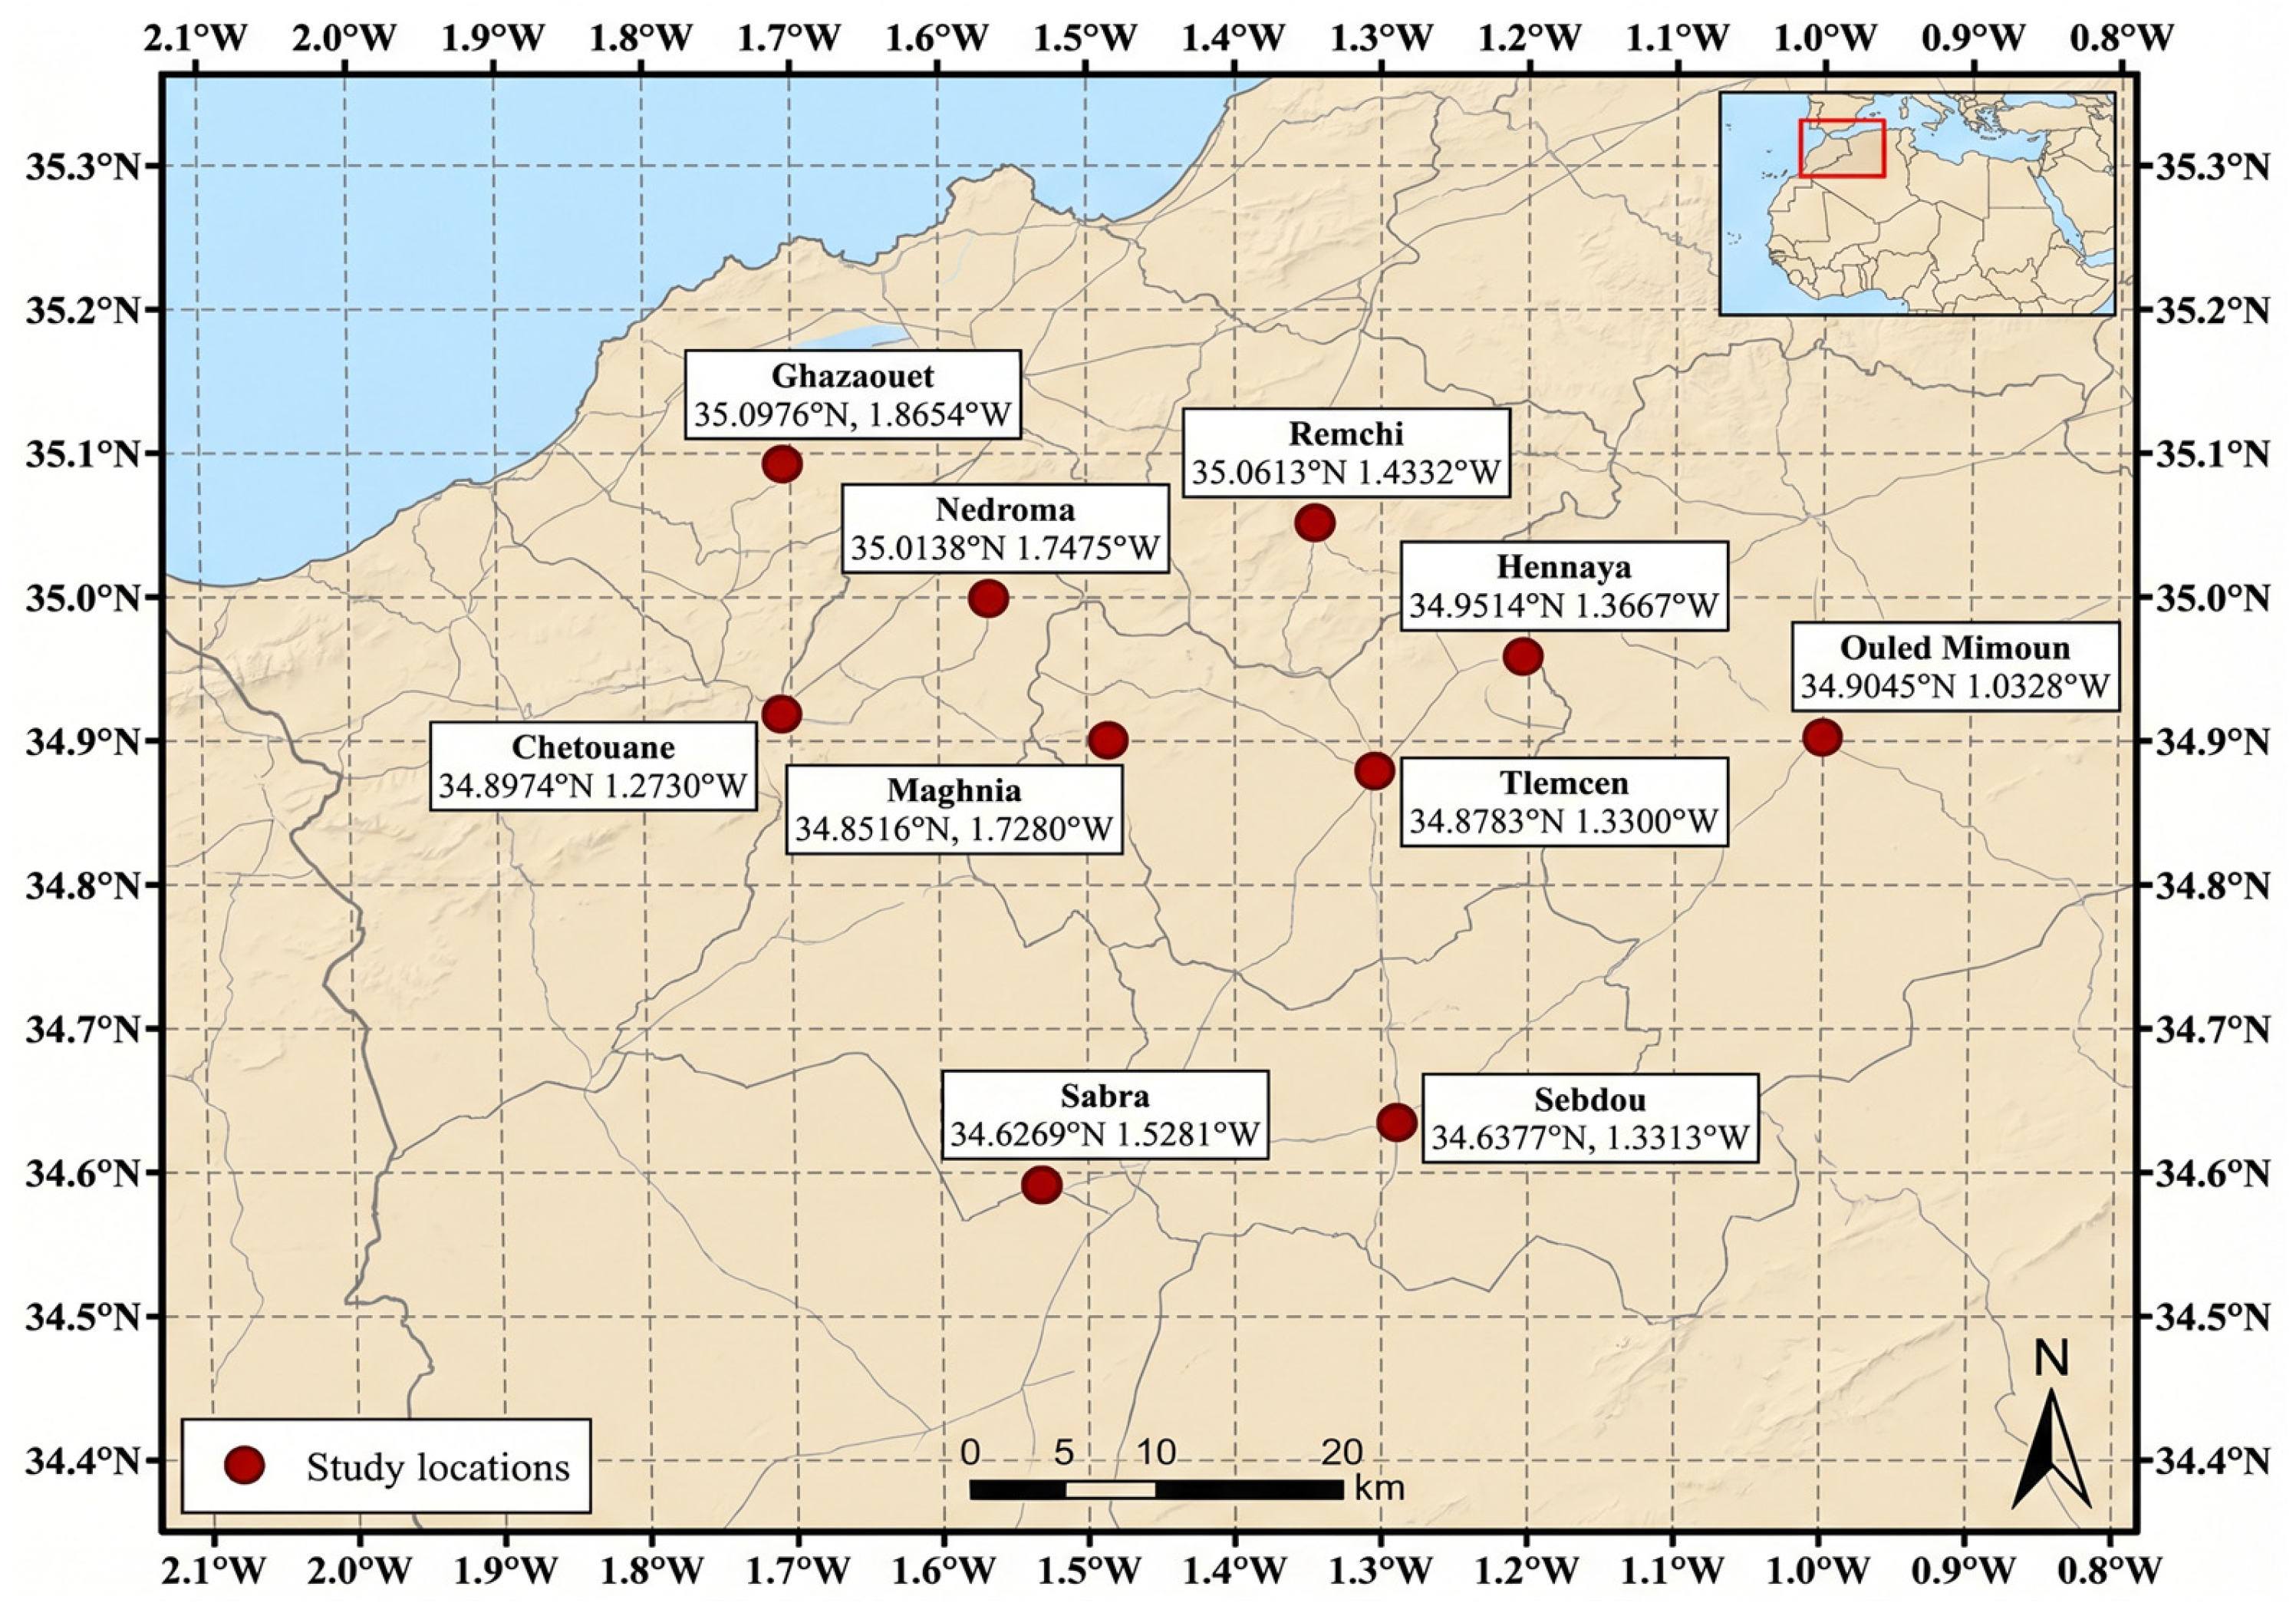
This study was conducted in Tlemcen Province in northwestern Algeria (Figure 1). The location is approximately 34°52′58″ N, 1°19′00″ W, with an elevation ranging from approximately 800 to 842 m.
Figure 1.
Location of the ten study meteorological stations in Tlemcen region, northwestern Algeria.
The region features complex topography, including steep slopes, mountainous terrain dominated by Mount Tawraniya to the north, and variations in altitude that contribute to a diverse landscape shaped by geological and anthropogenic influences. The climate is classified as hot summer Mediterranean (Csa) according to the Köppen–Geiger classification [18], although it exhibits transitional semi-arid characteristics in some classifications. The mean annual temperature is approximately 18.1–18.4 °C, and the mean annual precipitation is approximately 325–336 mm, concentrated primarily in winter with a pronounced summer minimum [19]. This pattern results in high interannual variability, and regional studies have indicated a drying trend with an increased drought frequency since the 1990s [2].
Hydrologically, steep slopes and sparse vegetation promote significant water erosion and sediment transport, leading to substantial siltation of regional dams, which is a persistent challenge for water resource management in Algeria [25,26]. In this semi-arid context, potential evapotranspiration (PET) markedly exceeds precipitation, with annual reference evapotranspiration (ET0) estimates of 1200–1600 mm [1]. This yields a high aridity index (PET/P > 4), intensifying water deficits, limiting actual evapotranspiration to precipitation-dependent levels, and increasing vulnerability to drought, soil moisture depletion, and stress in agricultural and natural systems [2]. The vegetation is dominated by Mediterranean matorral shrublands and maquis adapted to semi-arid conditions, which support biodiversity and climate resilience. Sparse cover on steep slopes transitions to more fertile zones at higher elevations, where walnut (Juglans regia) and other fruit trees thrive, whereas halophytic and salt-tolerant species occur in saline depressions, reflecting geological and hydrological constraints [27].
To ensure the independence of the predictor variables and avoid potential issues related to multicollinearity, we performed a Variance Inflation Factor (VIF) analysis and evaluated the Pearson correlation coefficients among the four input features (air temperature, vapor pressure deficit, wind speed, and sunshine duration). The Pearson correlation matrix (in the Section 2.2) revealed moderate correlations, with the highest correlation observed between air temperature and vapor pressure deficit (r = 0.78). However, the VIF values for all variables were well below the commonly accepted threshold of 5 (VIF values ranged from 1.2 to 3.1). These results confirm that multicollinearity is not a significant concern in our dataset, and all four variables provide sufficiently independent information for the machine learning models.
Data were collected from 10 meteorological stations distributed across the province to capture topographic and climatic gradients: Tlemcen (34.8783° N, 1.3300° W), Chetouane (34.8974° N, 1.2730° W), Ghazaouet (35.0976° N, 1.8654° W), Hennaya (34.9514° N, 1.3667° W), Maghnia (34.8516° N, 1.7280° W), Nedroma (35.0138° N, 1.7475° W), Ouled Mimoun (34.9045° N, 1.0328° W), Remchi (35.0613° N, 1.4332° W), Sabra (34.8269° N, 1.5281° W), and Sebdou (34.6377° N, 1.3313° W). Daily meteorological data from 1 January 2000, to 31 December 2025 (9132 days), were acquired from the Open-Meteo Historical Weather API [28], which provides gridded reanalysis-based variables primarily from the ERA5 and ERA5-Land models. The data were queried at the exact coordinates of the 10 stations listed above. The four input features for the machine learning models were as follows: air temperature at 2 m (°C), vapor pressure deficit (kPa), wind speed at 10 m (km h−1), and sunshine duration (s day−1). The target variable, daily reference evapotranspiration ET0 (mm day−1), was obtained as the pre-computed parameter ETo_from the Open-Meteo Historical Weather (API, 2026). This parameter was calculated using the Penman–Monteith Equation [1] from the full suite of required reanalysis-derived inputs (ERA5/ERA5-Land), including air temperature at 2 m, humidity/vapor pressure, wind speed at 10 m, and shortwave solar radiation, assuming unlimited soil water for a reference grass surface. No further preprocessing (e.g., unit conversion, gap filling, or independent FAO-56 computation) was applied because of the completeness and consistency of the API data.
2.2. Climatic Variables Relationships, and Evapotranspiration Analysis
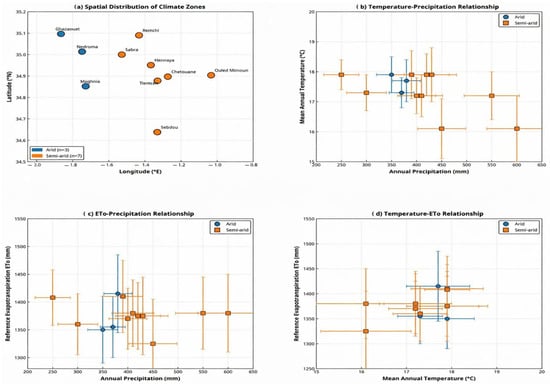
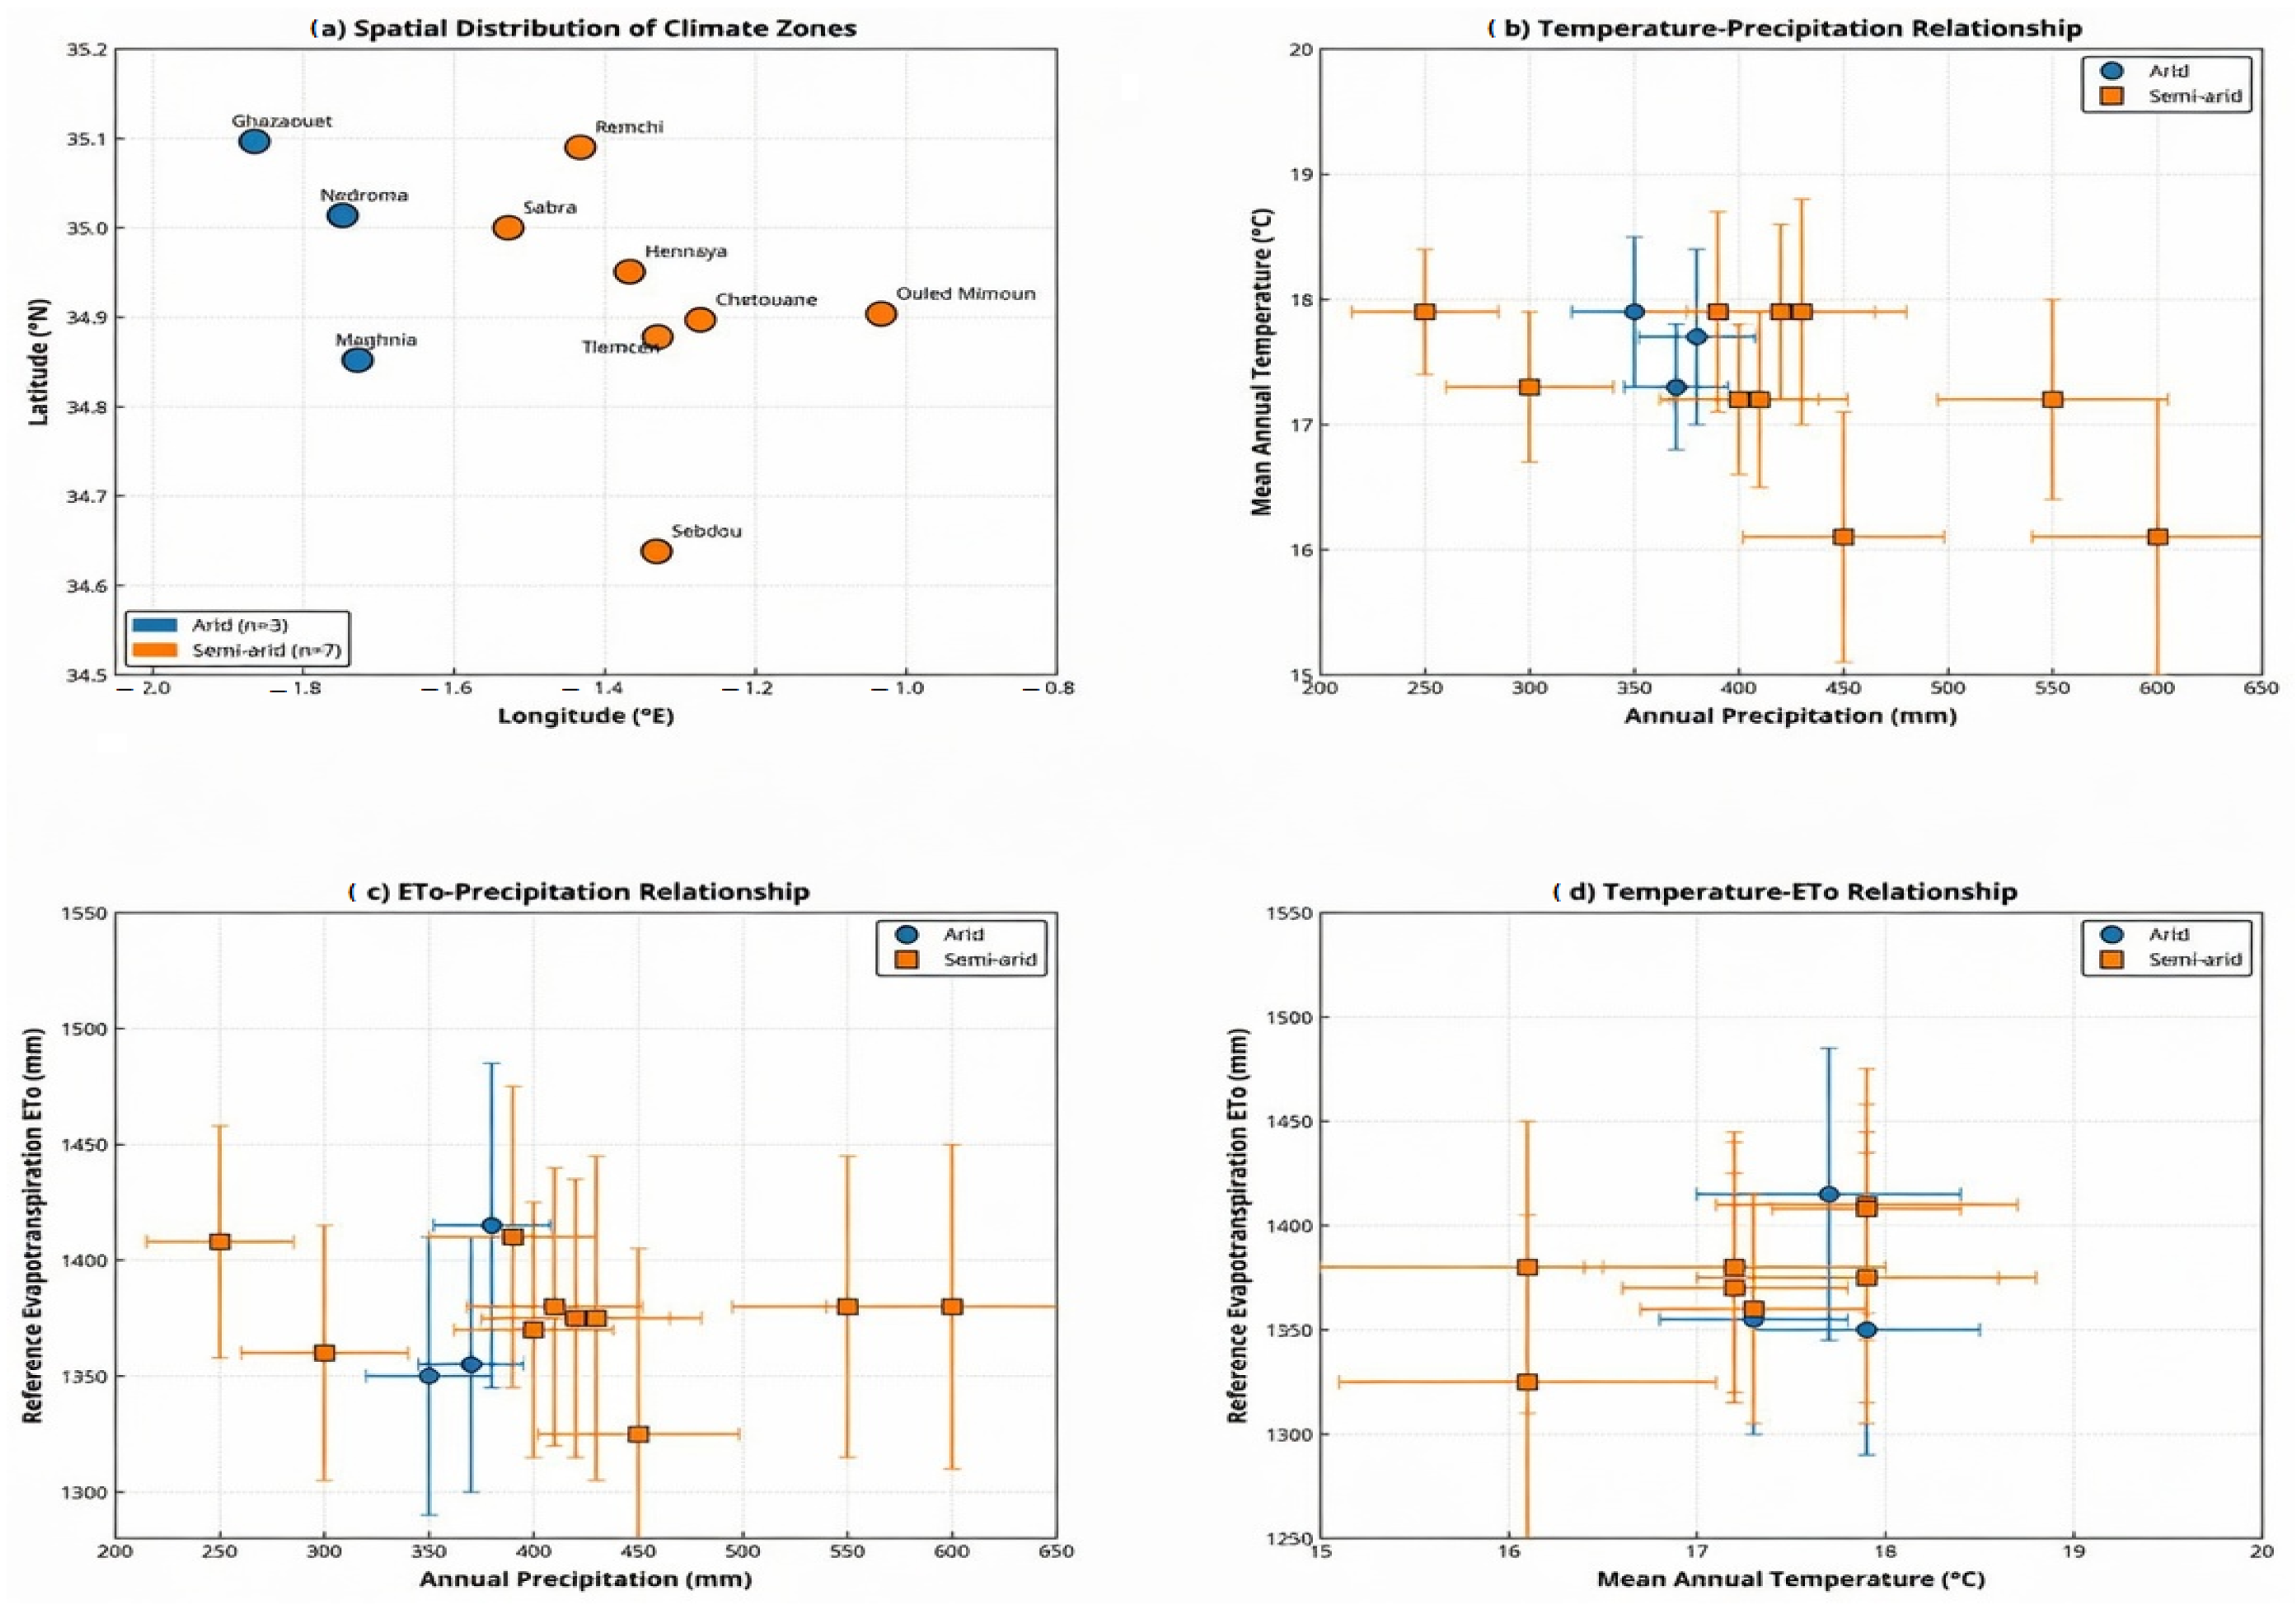
The climatic characteristics of the Tlemcen region were analyzed using both statistical and spatial methods at ten meteorological stations from 2000 to 2025. The results show that the Tlemcen region is characterized by a semiarid Mediterranean climate with two distinct zones: an arid zone (n = 3, <400 mm/year) and a semiarid zone (n = 7, 400–500 mm/year), with a significant precipitation gradient from the west to the east (Figure 2a). The relationship between temperature and precipitation was negatively correlated (r = −0.67, p < 0.05), indicating that locations with higher elevations received approximately 15% more rain than those with lower elevations (Figure 2b). All ten stations demonstrated a large deficit in water availability, as indicated by the fact that reference evapotranspiration (ET0) was consistently three to four times larger than precipitation (annual averages for ET0 were 1307–1415 mm, while annual averages for precipitation were 357–474 mm). Thus, this three- to four-fold difference in ET0 and precipitation indicates that precipitation is insufficient to support natural plant growth and human consumption needs without additional supplemental water resources, such as groundwater recharge, surface water reservoirs, and/or other external supplies. The consistency of ET0 values among zones (coefficient of variation = 2.4–2.5%) suggests that the atmospheric forcing responsible for ET0 is consistent across different topographies (Figure 2c,d).
Figure 2.
Spatial distribution of climate zones across ten meteorological stations in the Tlemcen region of Algeria and relationships between temperature, precipitation, and reference evapotranspiration.
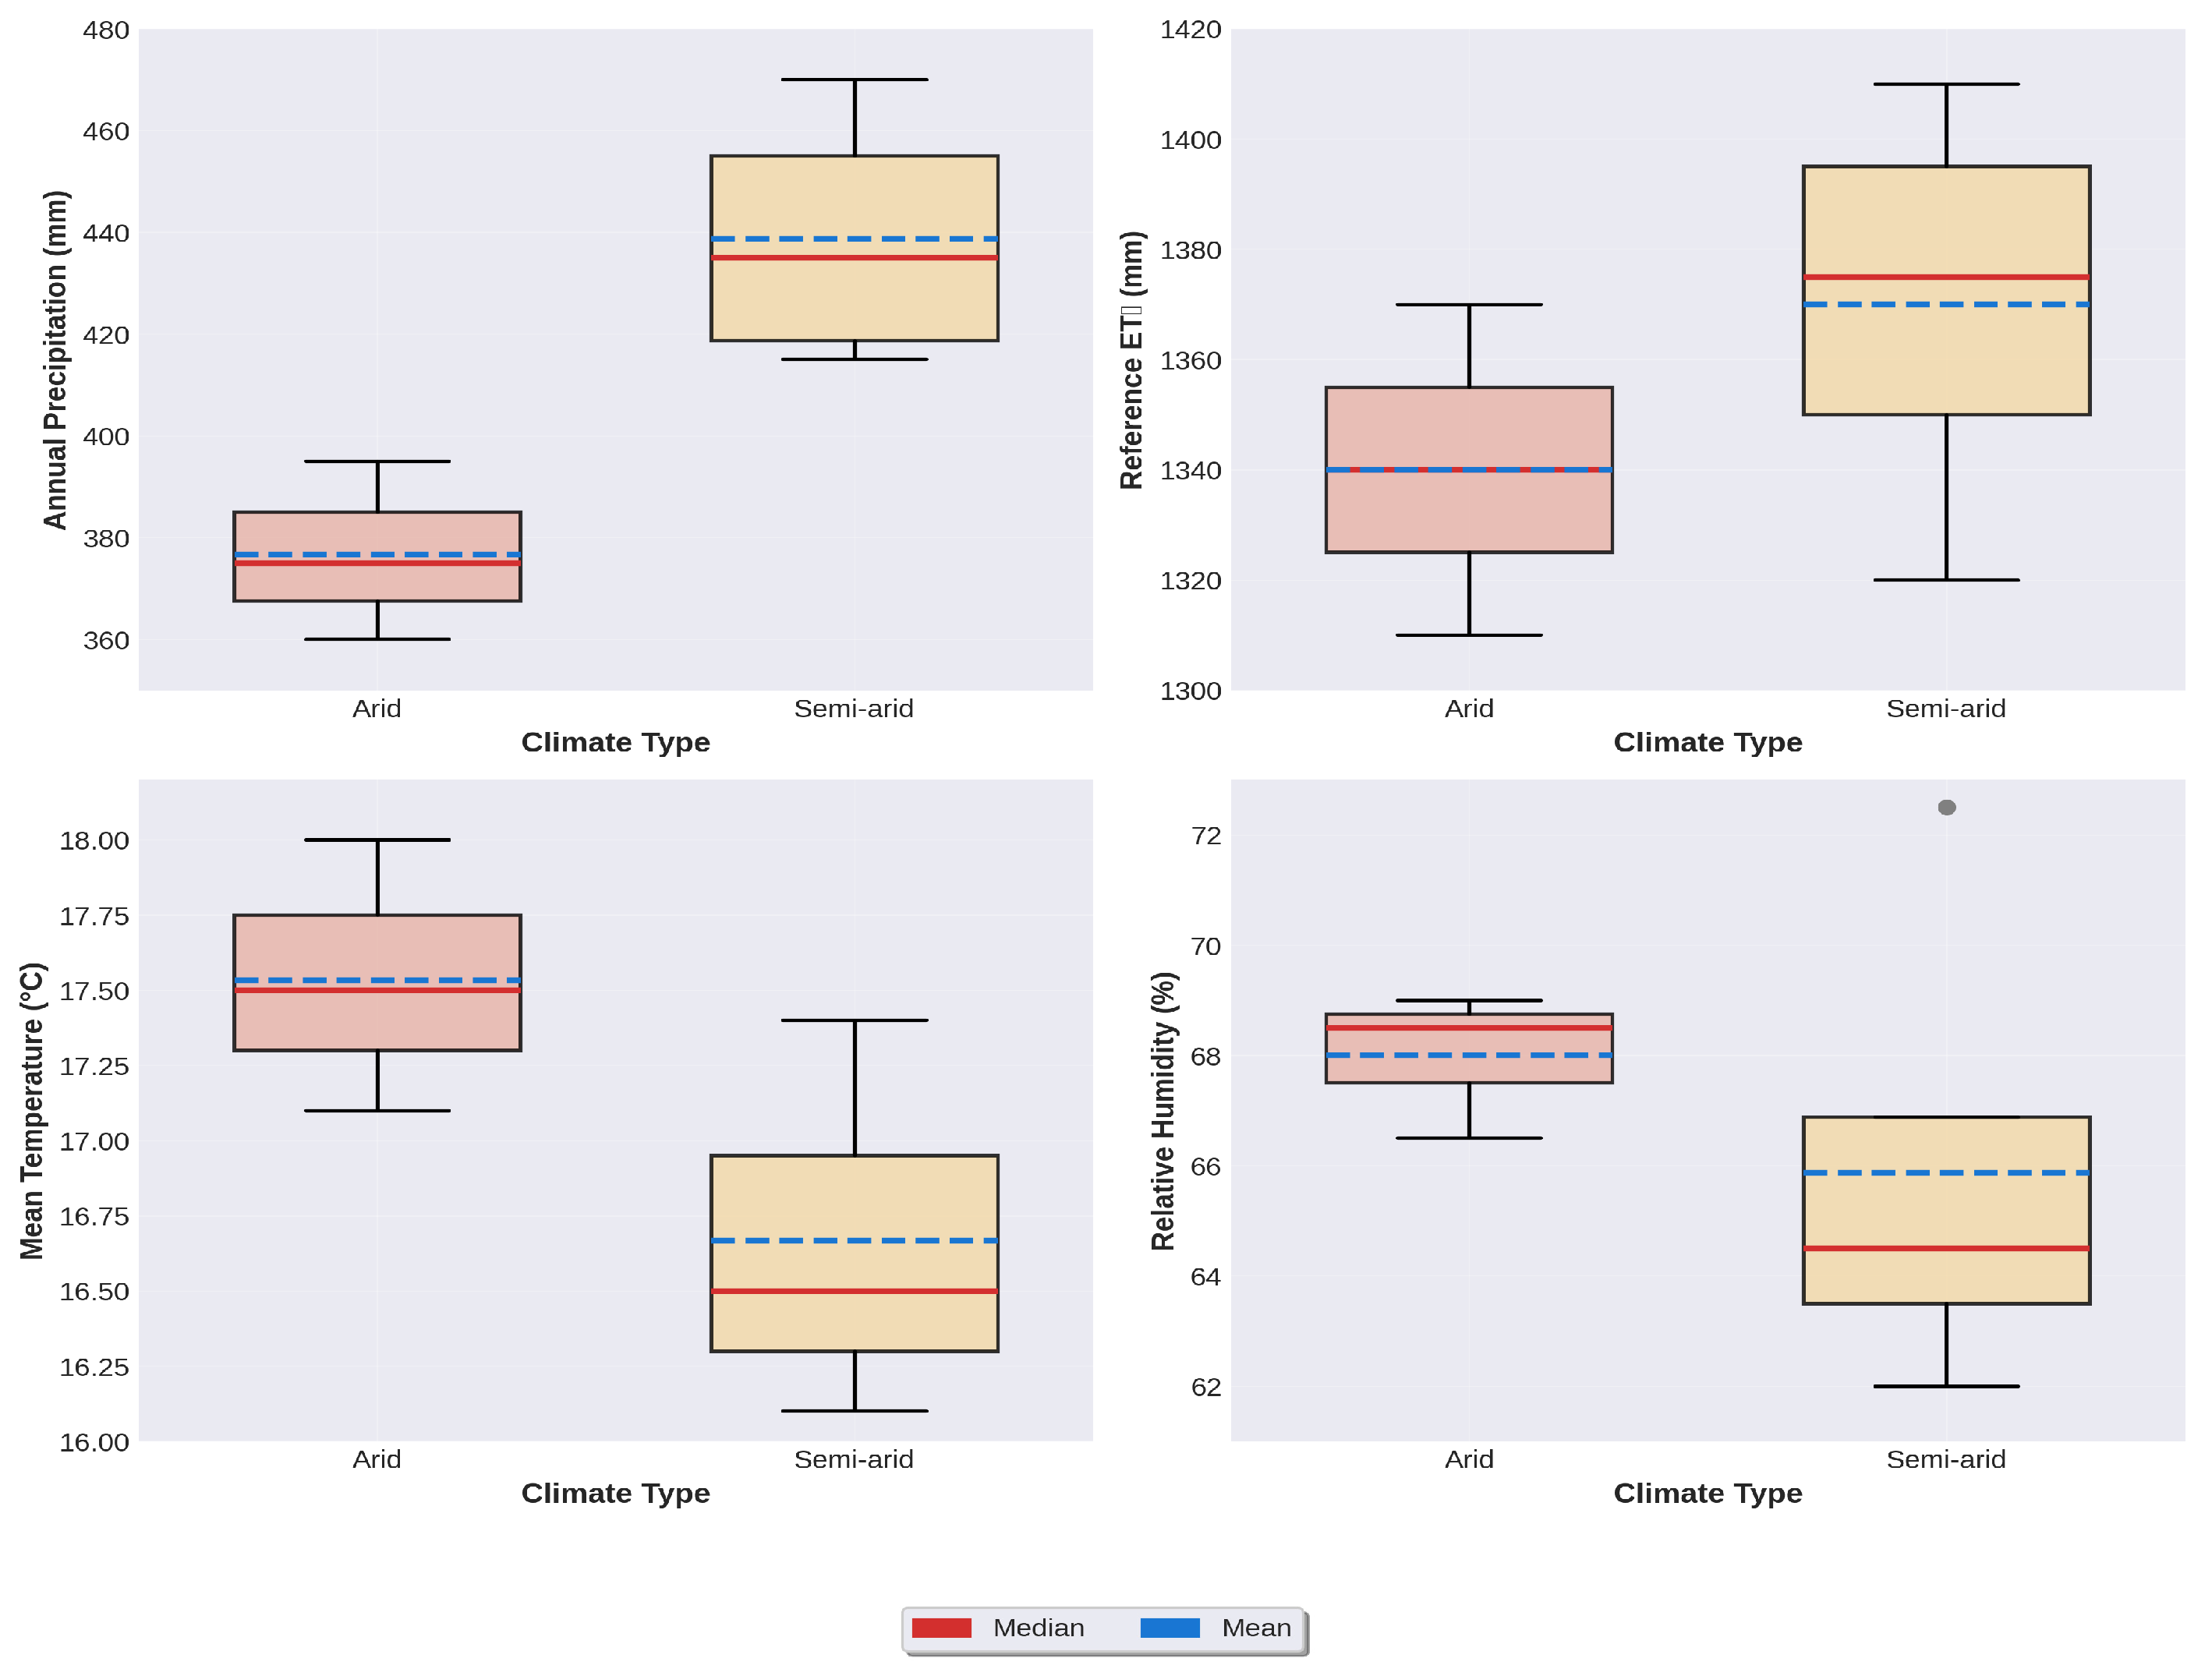
Statistical analysis confirmed precipitation as the primary discriminating variable (F = 42.3, p < 0.001), with secondary temperature distinction (Δ = 0.47 °C), whereas humidity (64–66%) and ET0 showed regional homogeneity (Table 1).
Table 1.
Climate statistics summary of Tlemcen Region, Algeria (Data period: 2000–2025).
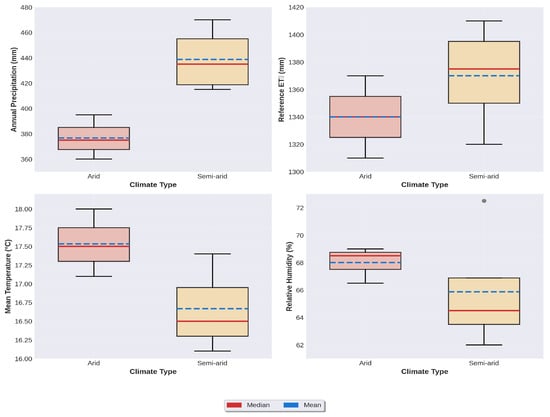
The box plot distribution within the semidry zone showed a much larger amount of variability for each zone owing to the variable topography, and the box plots from the dry zone were extremely consistent (Figure 3). These results demonstrate the high risk of this area to climate change due to current drought conditions (ET0/P = 3.2–3.6) and the requirement for significant amounts of irrigation, with little room for error given a projected 10–20% decline in Mediterranean precipitation by 2050.
Figure 3.
Box plot analysis by climate type in the Tlemcen region, Algeria (Data period: 2000–2025).
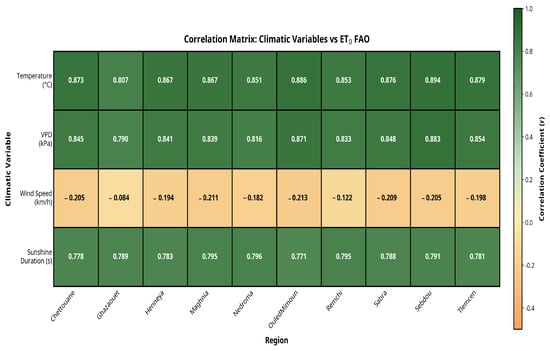
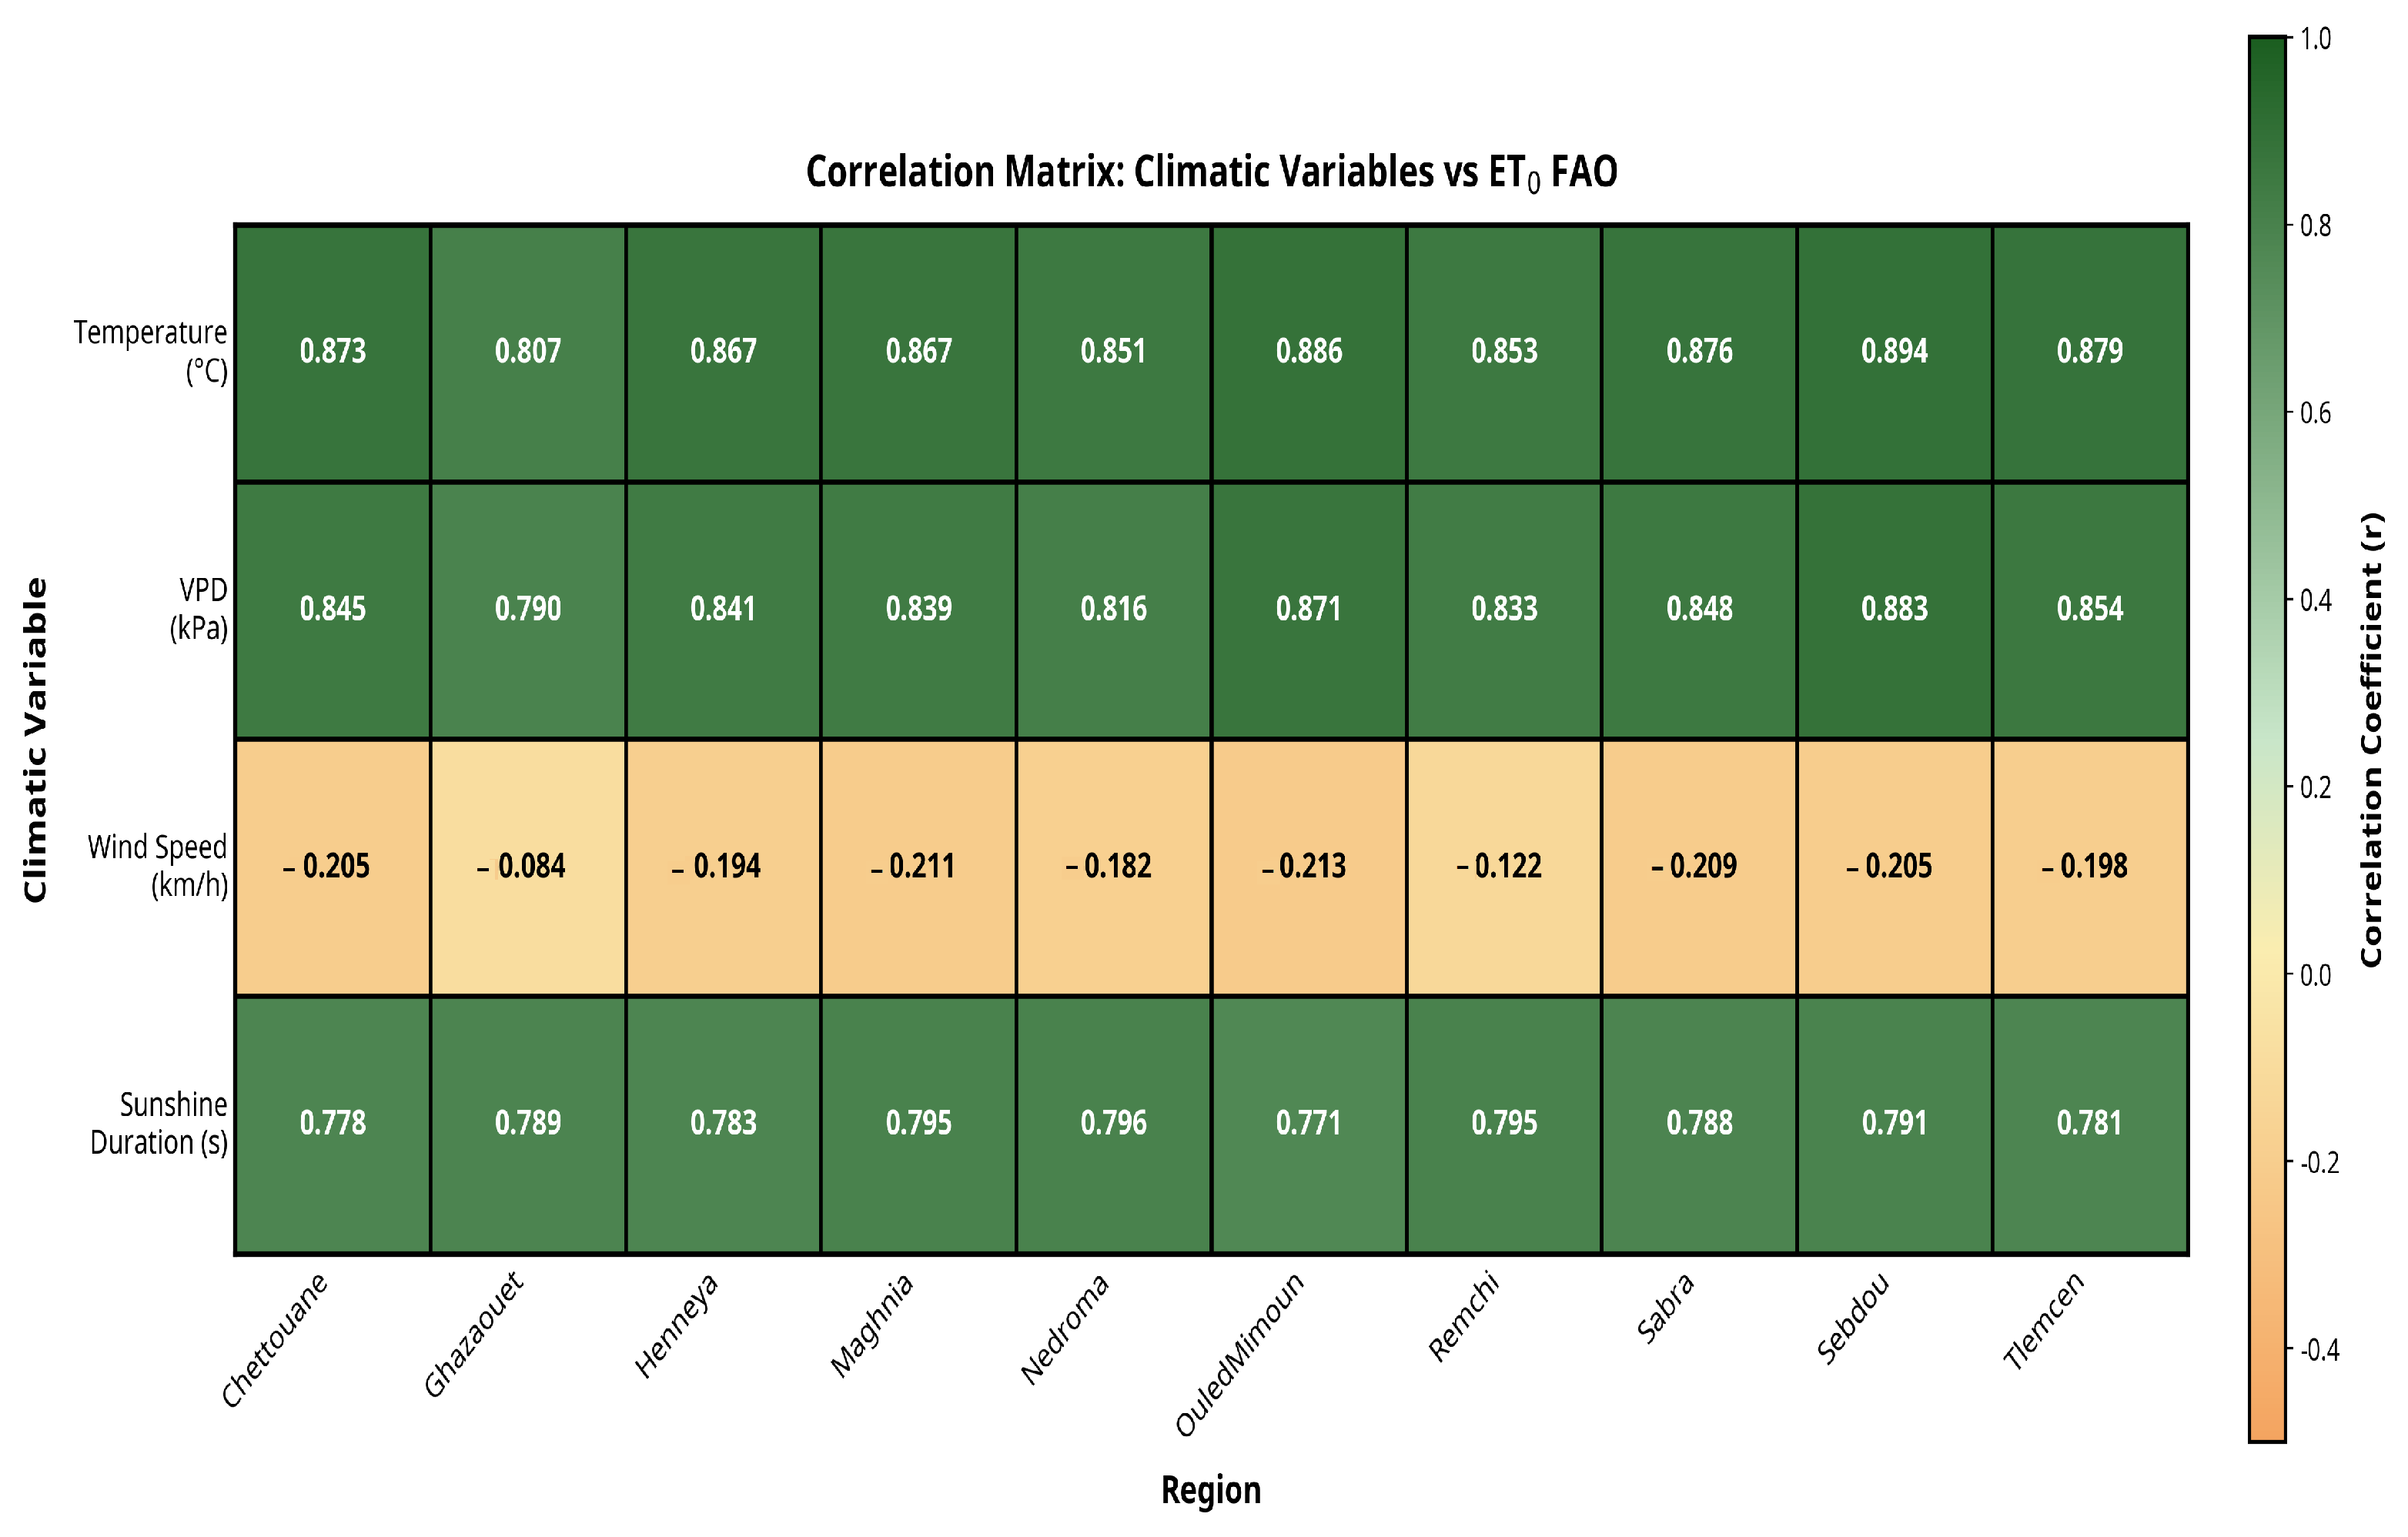
Sunshine duration accounted for approximately 59–63% of the variation in ET0 FAO (r2 = 0.59–0.63), as shown by the correlation matrix (Figure 4). A consistent positive correlation existed among all locations (range: 0.7714–0.7957), indicating that solar radiation is an essential component in determining ET 0 values. Although the correlation was significantly lower than that with temperature and VPD, it can be inferred that although radiation is necessary to sustain ET, atmospheric conditions (temperature and VPD) are likely more closely related to the measured ET0 values.
Figure 4.
Correlation matrix of air temperature, vapor pressure deficit, wind speed, and sunshine duration at all stations.
2.3. Model Architectures and Implementation
Five supervised machine learning regression models were evaluated (Figure 4) to predict daily reference evapotranspiration (ET0) from four input meteorological variables: air temperature at 2 m (°C), vapor pressure deficit (kPa), wind speed at 10 m (km h−1), and sunshine duration (s day−1).
We briefly characterize the five machine learning models (Table 2, Figure 5) used in this study as follows:
- -
- CatBoost (Categorical Boosting): This is a gradient boosting algorithm that implements ordered boosting to reduce overfitting, supports efficient handling of numerical features, and includes built-in regularization and categorical feature processing [29]. CatBoost employs a novel approach to combat prediction shift and overfitting through ordered boosting, making it particularly effective for datasets with categorical variables [29,30].
- -
- XGBoost (Extreme Gradient Boosting): An optimized distributed gradient boosting library known for its high performance, sparsity awareness, and parallel tree construction with regularization terms to control complexity [31]. XGBoost implements a scalable tree-boosting system that combines gradient boosting with the second-order Taylor expansion of the loss function, thereby enabling efficient computation and superior predictive performance [31,32].
- -
- Random Forest (RF): RF is an ensemble of decision trees trained on bootstrapped subsets of the data using random feature selection at each split to reduce variance and improve generalization [33]. RF combines multiple decision tree predictors, wherein each tree depends on the values of a random vector sampled independently, resulting in robust and accurate predictions with reduced overfitting [33,34].
- -
- Gradient boosting (GBM): A sequential tree-based ensemble that builds models iteratively by minimizing a loss function (here, the squared error) using gradient descent [35]. Gradient boosting machines implement the gradient boosting framework by sequentially fitting new models to the residuals of previous models, thereby effectively reducing bias while maintaining a low variance [35,36].
- -
- Support Vector Regression (SVR): SVR is a regression variant of support vector machines that uses kernel methods to map input features into a higher-dimensional space and find the optimal hyperplane that minimizes prediction errors within a specified margin [37]. SVR is particularly effective for nonlinear regression problems and provides robust predictions based on structural risk minimization principles [37,38].
- -
- All models were implemented using their respective Python libraries: CatBoost (version 1.2+), XGBoost (version 2.0+), and scikit-learn (for RF, GBM, and SVR). Hyperparameter selection was guided by minimizing the validation RMSE while monitoring the overfitting (Table 2).
Table 2.
Machine Learning Models: Hyperparameters Configuration Reference Evapotranspiration (ET0) Prediction Study.
Figure 5.
Flowchart of the methodology used to predict evapotranspiration (ET0).
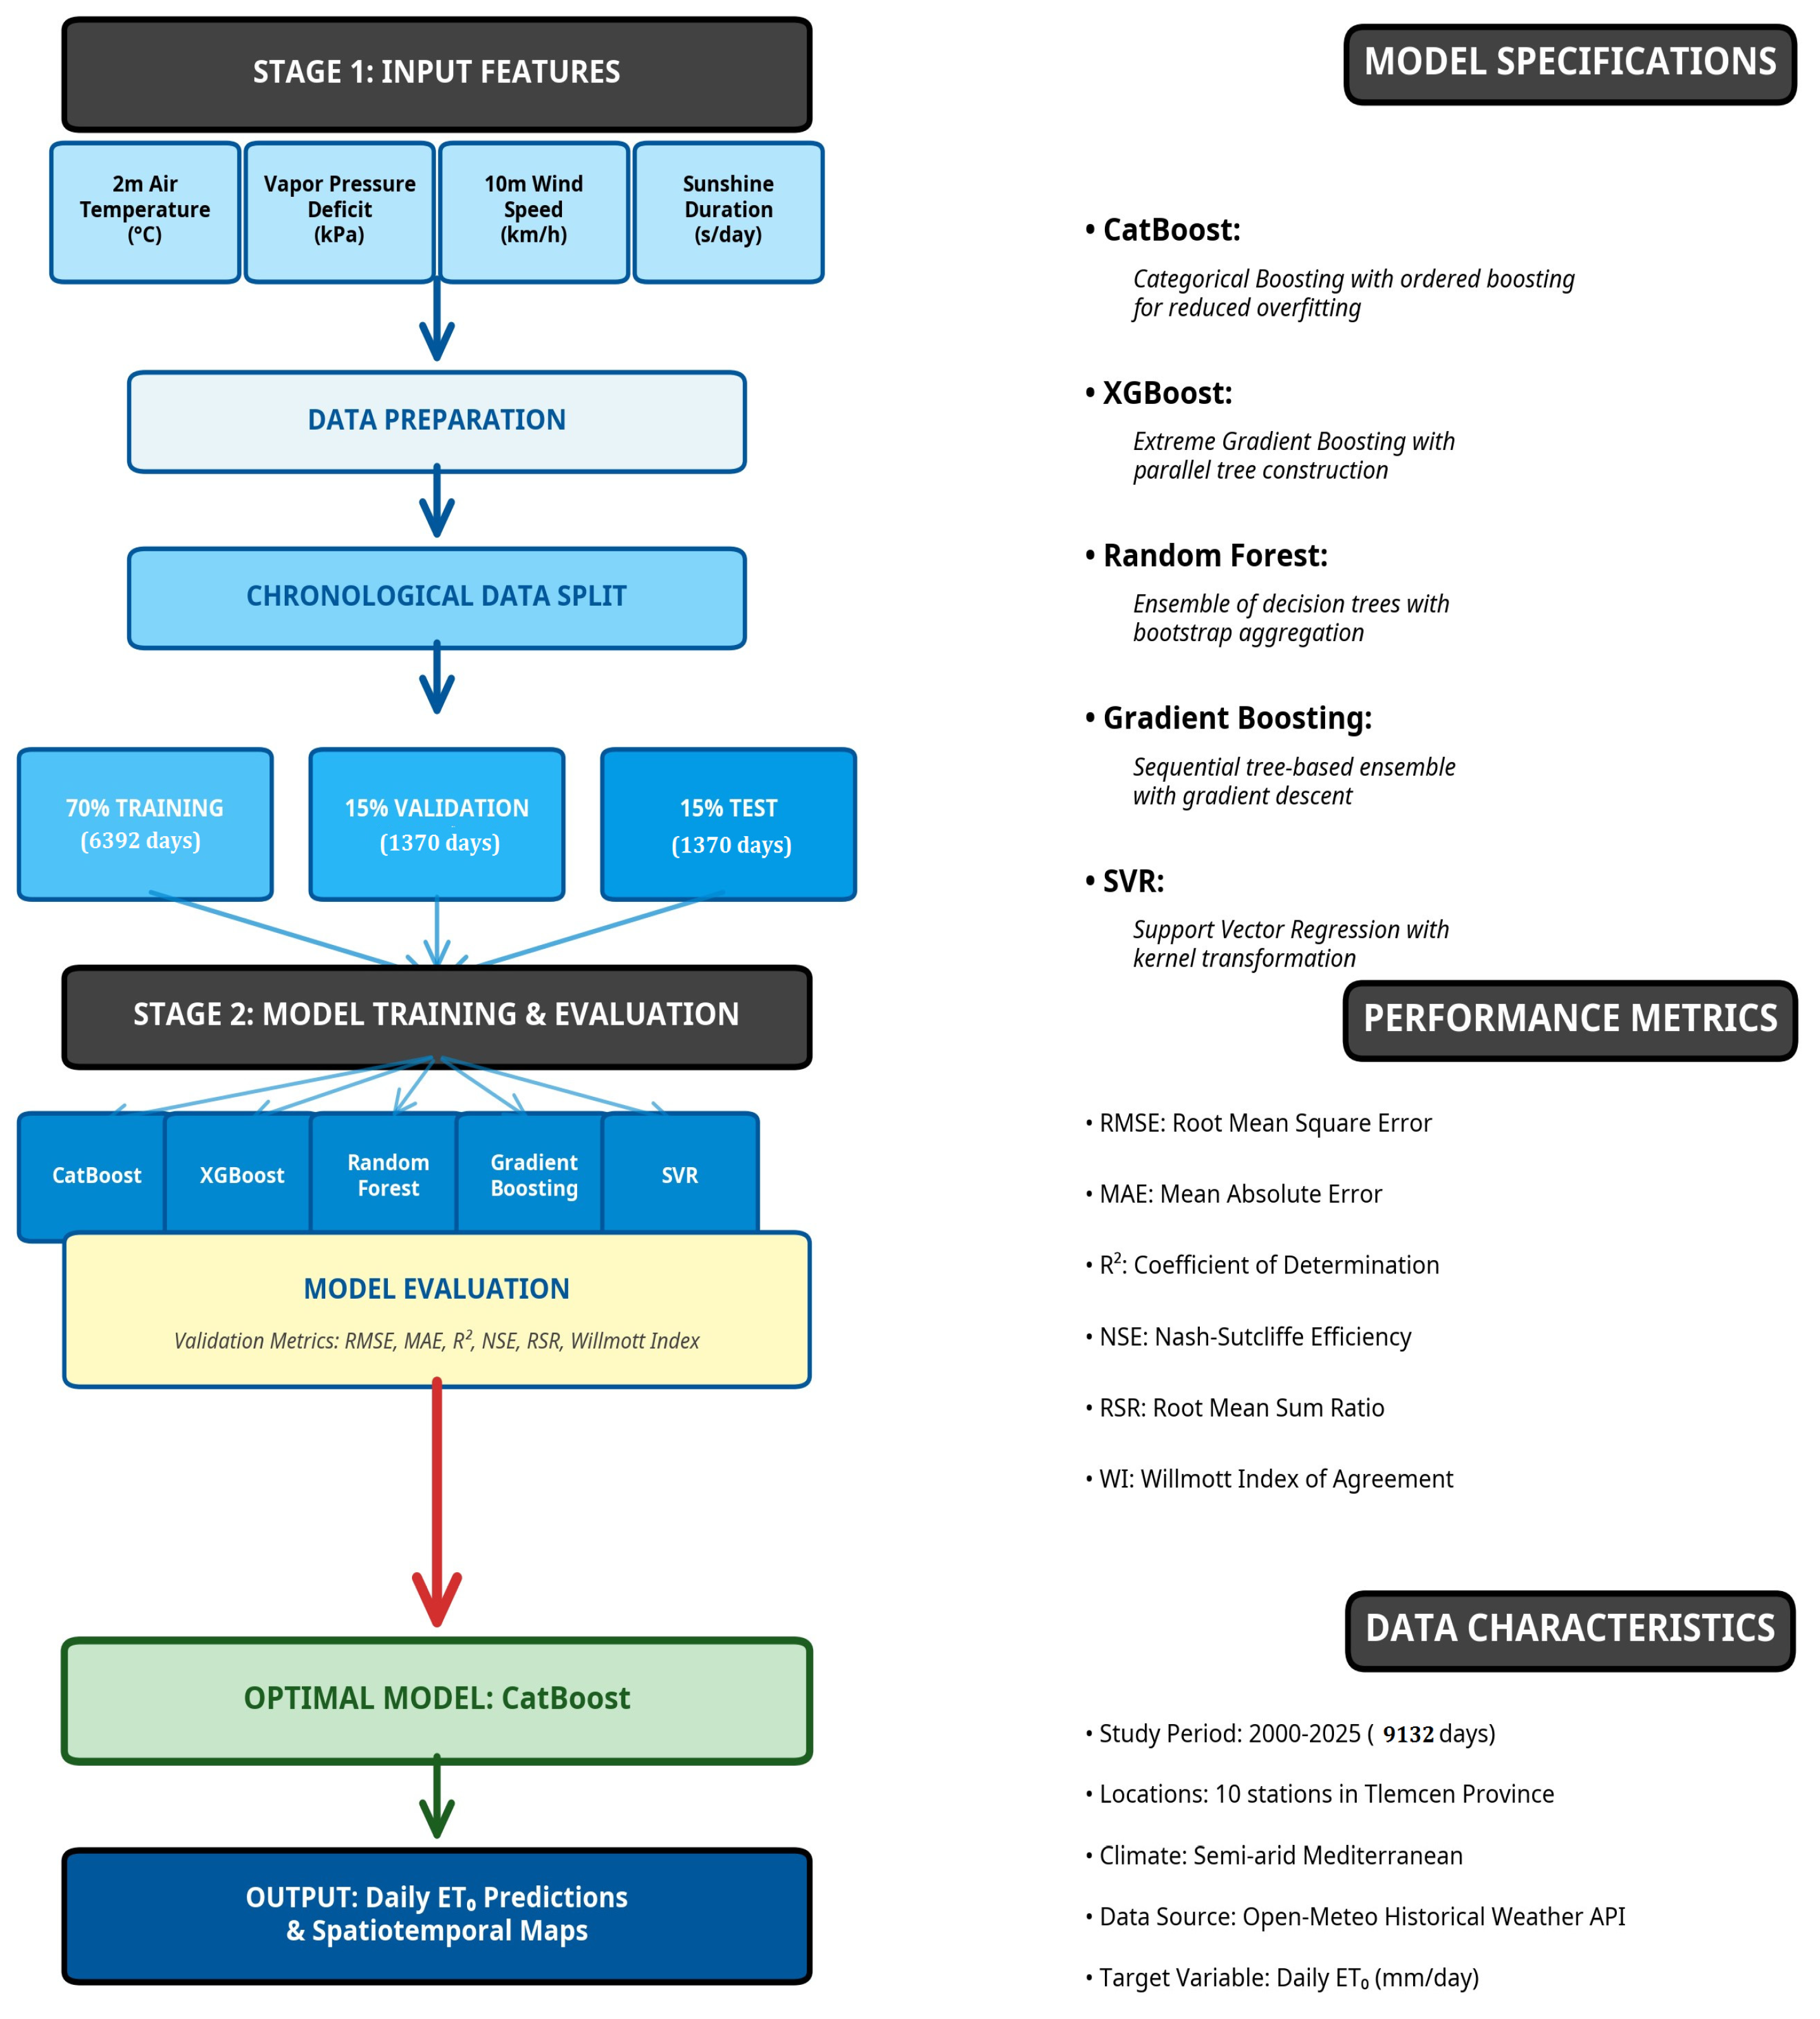
The dataset (9132 daily records per station) was split chronologically into 70% training (≈6392 days), 15% validation (≈1370 days), and 15% testing (≈1370 days) to preserve the temporal order and avoid data leakage in the time-series prediction. No spatial cross-validation was applied because the focus was on temporal generalization across stations. Models were trained separately for each station to account for local climatic differences and then aggregated for regional analysis. We note that all results and maps presented in this study were generated using Python (version 3.11.2). The analysis and visualization were performed using freely available open-source libraries, ensuring reproducibility and accessibility of the methodology.
2.4. Performance Metrics
Model evaluation used standard hydrological and regression metrics on the training, validation, and test sets: root mean square error (RMSE, mm day−1), mean absolute error (MAE, mm day−1), coefficient of determination (R2), Nash–Sutcliffe efficiency (NSE), root mean sum ratio (RSR), and Willmott index of agreement (WI). The overfitting risk was quantified using the overfit gap (validation RMSE—training RMSE) and overfit ratio (training RMSE/validation RMSE). Prediction stability was assessed using the mean and maximum standard deviations of the model outputs in the test set.
2.5. Spatiotemporal Analysis
The superior model (CatBoost) was selected for regional application. Monthly ET0 predictions were generated at each meteorological station and spatially interpolated across the Tlemcen Province using ordinary kriging to produce gridded maps. Kriging was chosen for its ability to incorporate spatial autocorrelation via variogram modeling, providing unbiased estimates with quantified uncertainty in heterogeneous terrains. Yearly monthly changes (ΔET0, mm month−1) were computed as differences between consecutive years, and long-term trends were assessed via linear regression over the period 2000–2025. Spatial patterns were visualized as contour maps, highlighting the interannual variability and emerging climatic signals.
3. Results and Discussion
3.1. Scatter Plots
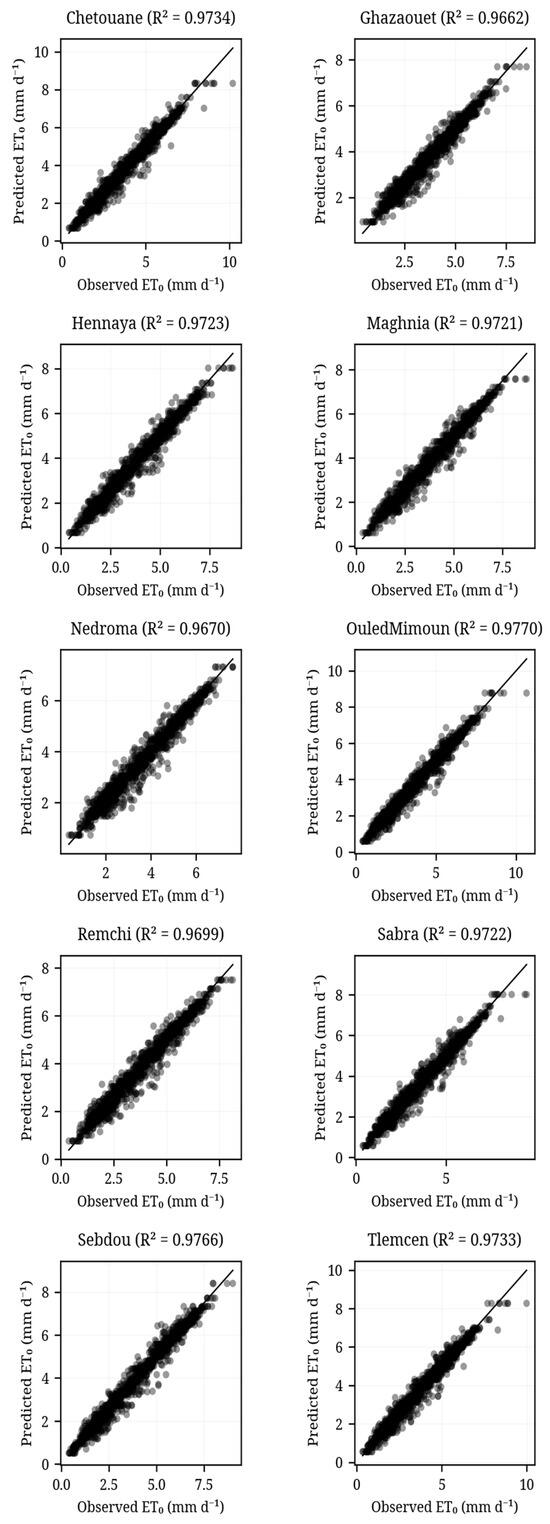
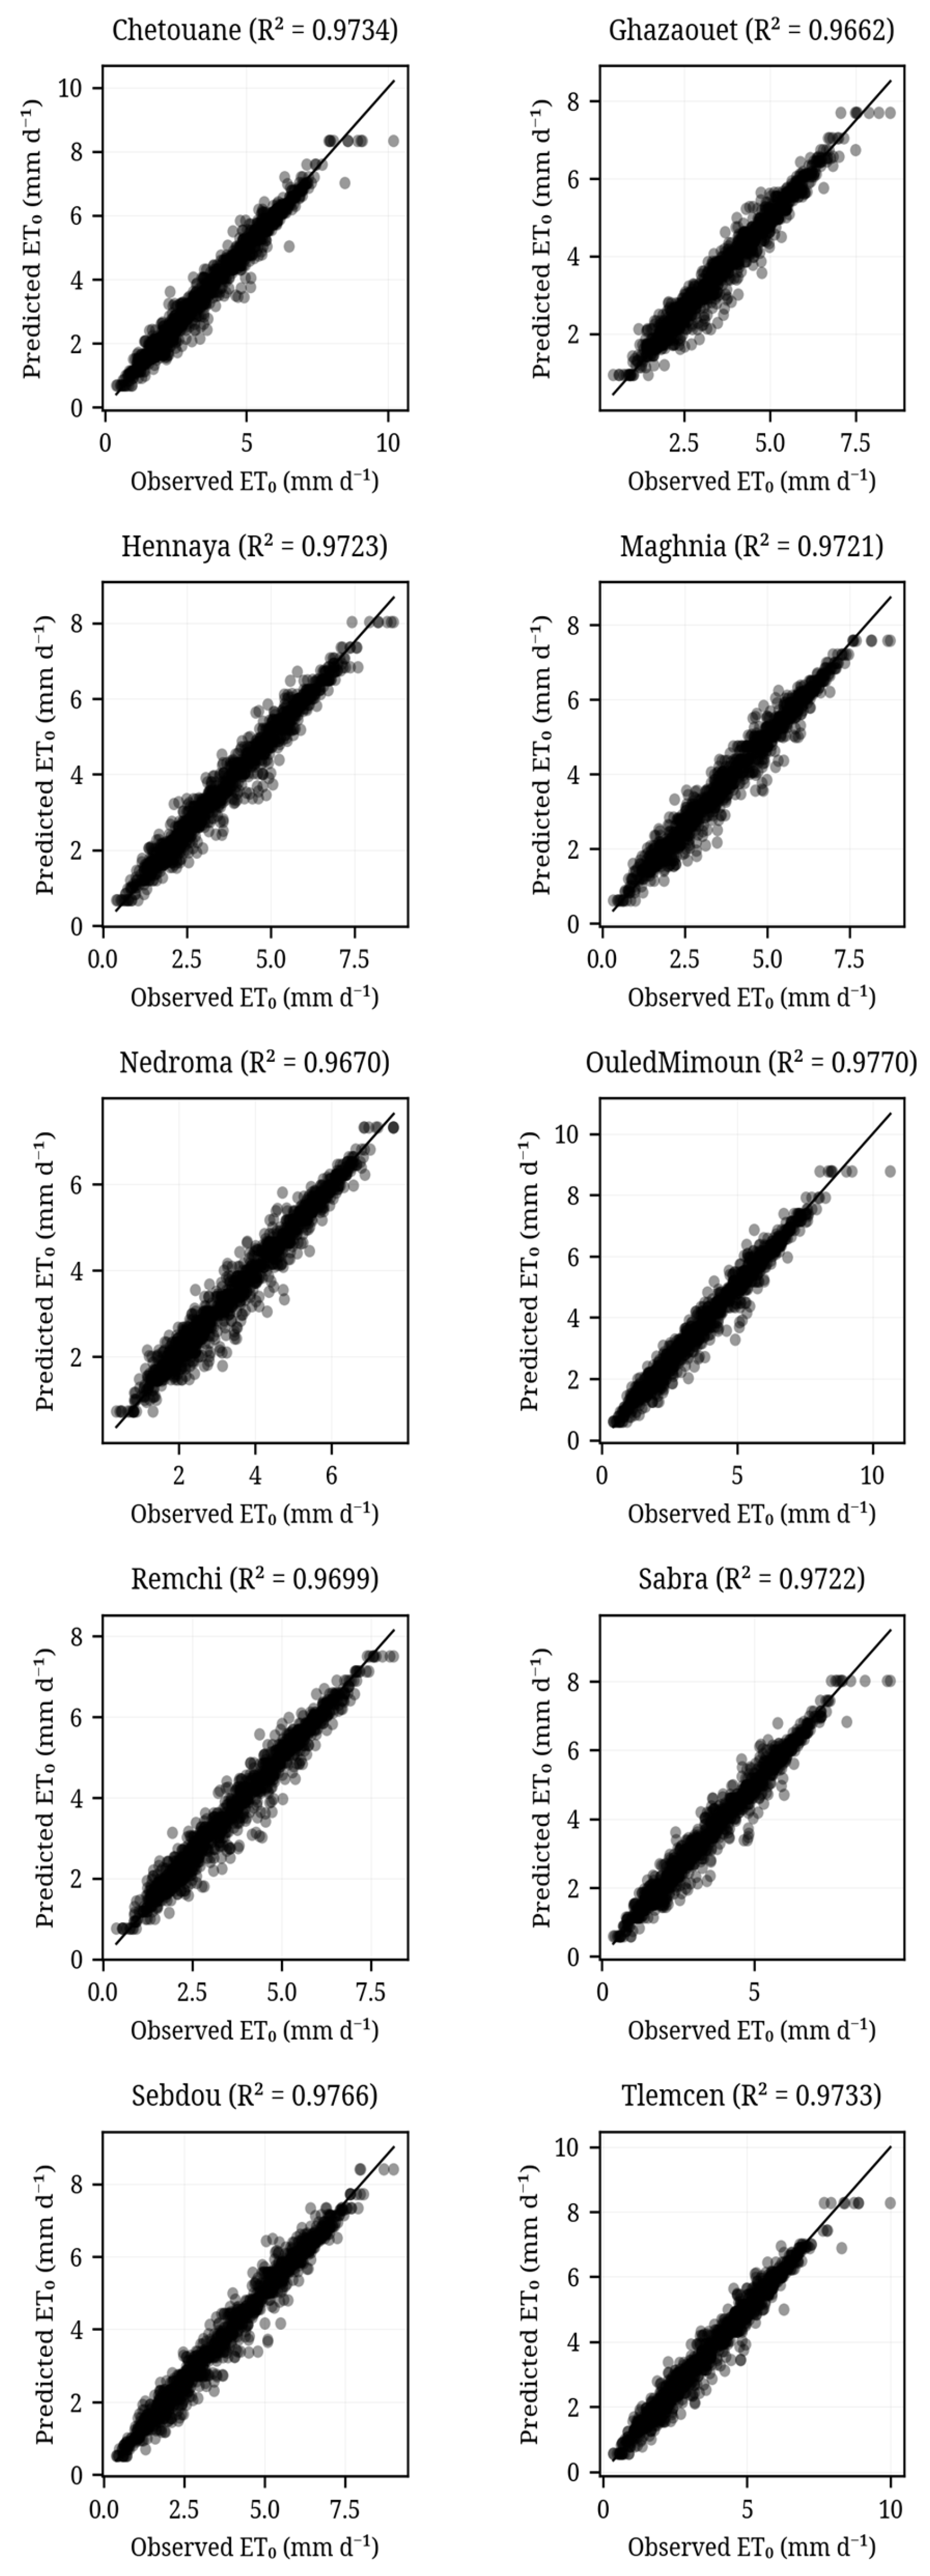
The CatBoost regression model was highly successful in predicting weather conditions at each of the ten stations in the study area. The R2 values of the CatBoost models ranged from 0.9662 to 0.9770 (the mean R2 was 0.9720 ± 0.0036), indicating that they explained a large portion of the variation in ET0 (Figure 6). There was also a strong relationship between the predicted and measured ET0 values. This is demonstrated by the cluster of data points on the scatter plot that are close to the 1:1 reference line. This suggests that there was little or no systematic error in the predictions made by the CatBoost model, and that it was accurate. Additionally, the fact that the R2 values for the CatBoost models were consistent (only a standard deviation of 0.0036) across all stations shows that the CatBoost model was robust and generalizable. It appears that the CatBoost model captured the relationships between meteorological factors and ET0 in a manner that was valid across the entire study area. Although there was some random variation in the data that caused the CatBoost model to make slightly imperfect predictions, the overall trend of the data points on the scatter plot shows that the CatBoost model is an extremely reliable tool for making ET0 predictions and will be useful in the operation of irrigation systems, hydrological modeling, and water resource planning in this region.
Figure 6.
Scatterplots for ten stations of the predicted ETo by the CatBoost model (Best model) at ten stations.
3.2. Model Performances Comparison
In this study, we investigated the performance of five different machine learning methods for estimating evapotranspiration (ET0) in the Tlemcen region, Algeria. This was done using the four input variables used to train the machine learning methods: air temperature, vapor pressure deficit, wind speed, and daily sunshine hours. The performance of each of the five machine learning methods was evaluated using three separate datasets (training, validation, and test sets), as shown in Table 3 and Table 4. As can be seen from these tables, CatBoost had the best overall generalization performance in the region, achieving the lowest or almost lowest root mean square error (RMSE) at most stations (i.e., typically 0.27–0.30 mm/day), and a very high predictive accuracy (R2 ≈ 0.96–0.98, NSE ≈ 0.96–0.98).
Table 3.
Training performance of five ML models across the regions covered in this study (RMSE, NSE, and RSR). (Primary metrics: MAE, R2; Willmott index in Supplementary Table S1).
Table 4.
Test performance metrics of the five ML models across the regions covered in this study (RMSE, NSE, and RSR) (Primary metrics: MAE, R2; Willmott index in Supplementary Table S2).
The other two gradient boosting algorithms, XGBoost and Gradient Boosting, performed similarly to CatBoost in terms of their performance during validation and testing, although they had a slightly higher RMSE than CatBoost at some of the stations studied. However, they had Pearson r values that were very similar to those achieved by CatBoost (all values > 0.98). The random forest algorithm performed extremely well when trained at all stations (training R2 values up to ~0.99); however, its performance decreased substantially when validated and tested at the studied stations, indicating mild overfitting. SVR also performed extremely well at all stations in terms of stability and consistency, with a relatively low mean absolute error (MAE) (approximately 0.19–0.21 mm/day), although its RMSE values were much larger than those obtained using the gradient boosting techniques. Overall, these results show that gradient boosting techniques, especially CatBoost, provide an accurate and robust method for estimating ET0 across various climate regimes in the Tlemcen region with limited input data. At all the studied stations, the CatBoost model achieved a test RMSE of 0.292 mm/day, MAE of 0.208 mm/day, R2 = 0.971, and NSE = 0.971, indicating excellent prediction capability under the pooled regional assessment.
Furthermore, the magnitude of the error values of CatBoost is clearly within, and in many instances lower than, the range of values reported for limited-input machine learning models in semi-arid North Africa (e.g., RMSE ≈ 0.17–0.68 mm/day in Elbeltagi et al. [8,15]), illustrating the advantages of combining consistent reanalysis forcing data with CatBoost’s ordered boosting strategy. The good performance of CatBoost is also consistent with the findings of other studies conducted in arid and semi-arid regions. For example, Sharafi et al. found that combination-based machine learning models provided the most reliable estimates in Iran’s diverse climate zones. Similarly, temperature-driven methods provide the best estimates under data limitations [39]. Despite only being able to use four meteorological input parameters (air temperature, vapor pressure deficit, wind speed, and sunshine duration) within a gradient boosting framework, the accuracy of the predictions made by CatBoost (RMSE ≈ 0.29 mm/day) is clearly better than the typical accuracy benchmarks reported in the literature (typically 0.3–0.5 mm/day).
To enhance clarity and focus on the most critical performance indicators, Table 3 and Table 4 present the three primary metrics (RMSE, NSE, and RSR) for the training and test phases. Additional metrics (MAE, R2, and Willmott Index) are provided in the Supplementary Material for comprehensive model’s evaluation.
3.3. Overfitting Risk and Assessment
Overfitting remains a significant challenge for hydrological modelling, as models learn random variations in the data rather than the underlying physical relationships of semi-arid Mediterranean climates. The Overfitting Gap (Validation RMSE—Training RMSE) and Overfit Ratio are commonly used indicators of this risk. The results of all stations are summarized in Table 5, which provides a summary of the performance metrics of each machine learning model assessed for the meteorological stations located within the Tlemcen region. The metrics include the overfitting gap (validation RMSE–training RMSE), overfitting ratio (training RMSE/validation RMSE), and stability (mean and maximum standard deviation of predictions on the test set).
Table 5.
Overfitting risk and prediction stability of machine learning models across ten study locations.
The model with the most balanced performance across all stations was CatBoost. For example, at the Chetouane station, CatBoost had a relatively small overfitting gap of 0.0467 and an overfitting ratio of 0.829. Both values were better than those of random forest (gap = 0.0916; ratio = 0.683) and XGBoost (gap = 0.0721; ratio = 0.747). CatBoost’s ability to naturally handle categorical features, along with its use of ordered boosting mechanisms, helped reduce the amount of over-memorization of the training data. The random forest demonstrated the greatest susceptibility to overfitting, with the lowest training RMSE value, but a large increase in both validation and test errors. SVR, while having almost zero (and in some cases negative) gaps (for example, −0.0014 at Chetouane), also had the largest overall RMSE values, suggesting a tendency towards underfitting or a lack of sensitivity to complex nonlinear patterns relative to the gradient-boosted tree models. CatBoost’s robustness can be seen again at the Ghazaouet station, as it has the highest overfitting ratio (0.863), showing that 86.3% of the model training accuracy was successfully applied to unseen validation data.
3.4. Stability and Predictive Consistency
Inaccurate and unstable predictions are costly in terms of wasted water resources. A measure of stability was calculated by computing the standard deviation of the predictions (pred. std.) of each model in the test set. This indicates the sensitivity of the model to variations in either the input data or the stochastic process within the model. We observed a complex relationship between increasing model complexity and decreasing stability.
CatBoost exhibited very good and stable behavior. Consequently, the average pred. std. is typically between 0.026 and 0.031 mm/day. However, there were a few instances when the maximum. pred. std. at certain stations exceeded 0.116 mm/day. These values fell within the acceptable range for the ET0 models. In addition, it guaranteed that the model would not generate outlier values under different meteorological conditions.
Gradient boosting (GBM) exhibited the worst stability among all the ensembles tested. At one point, the max. pred. std. at the Maghnia station reached 0.2979 mm/day. The high variability in the predictions indicates that the GBM may be overly sensitive to individual data points. Therefore, the reliability of the forecast is questionable under extreme weather conditions.
Both XGBoost and SVR resulted in a mean prediction. std. = 0.0. This indicates a completely deterministic output for the test instances. Although it provides an indication of perfect internal consistency, it does not provide the “softness” or probabilistic robustness associated with CatBoost regularization method.
CatBoost appears to be a better solution than the other architectures studied in the Tlemcen region. It represents a balance between high-precision mapping and avoiding overfitting while maintaining a stable output for predicting water resources necessary for management in drought-prone areas in Algeria.
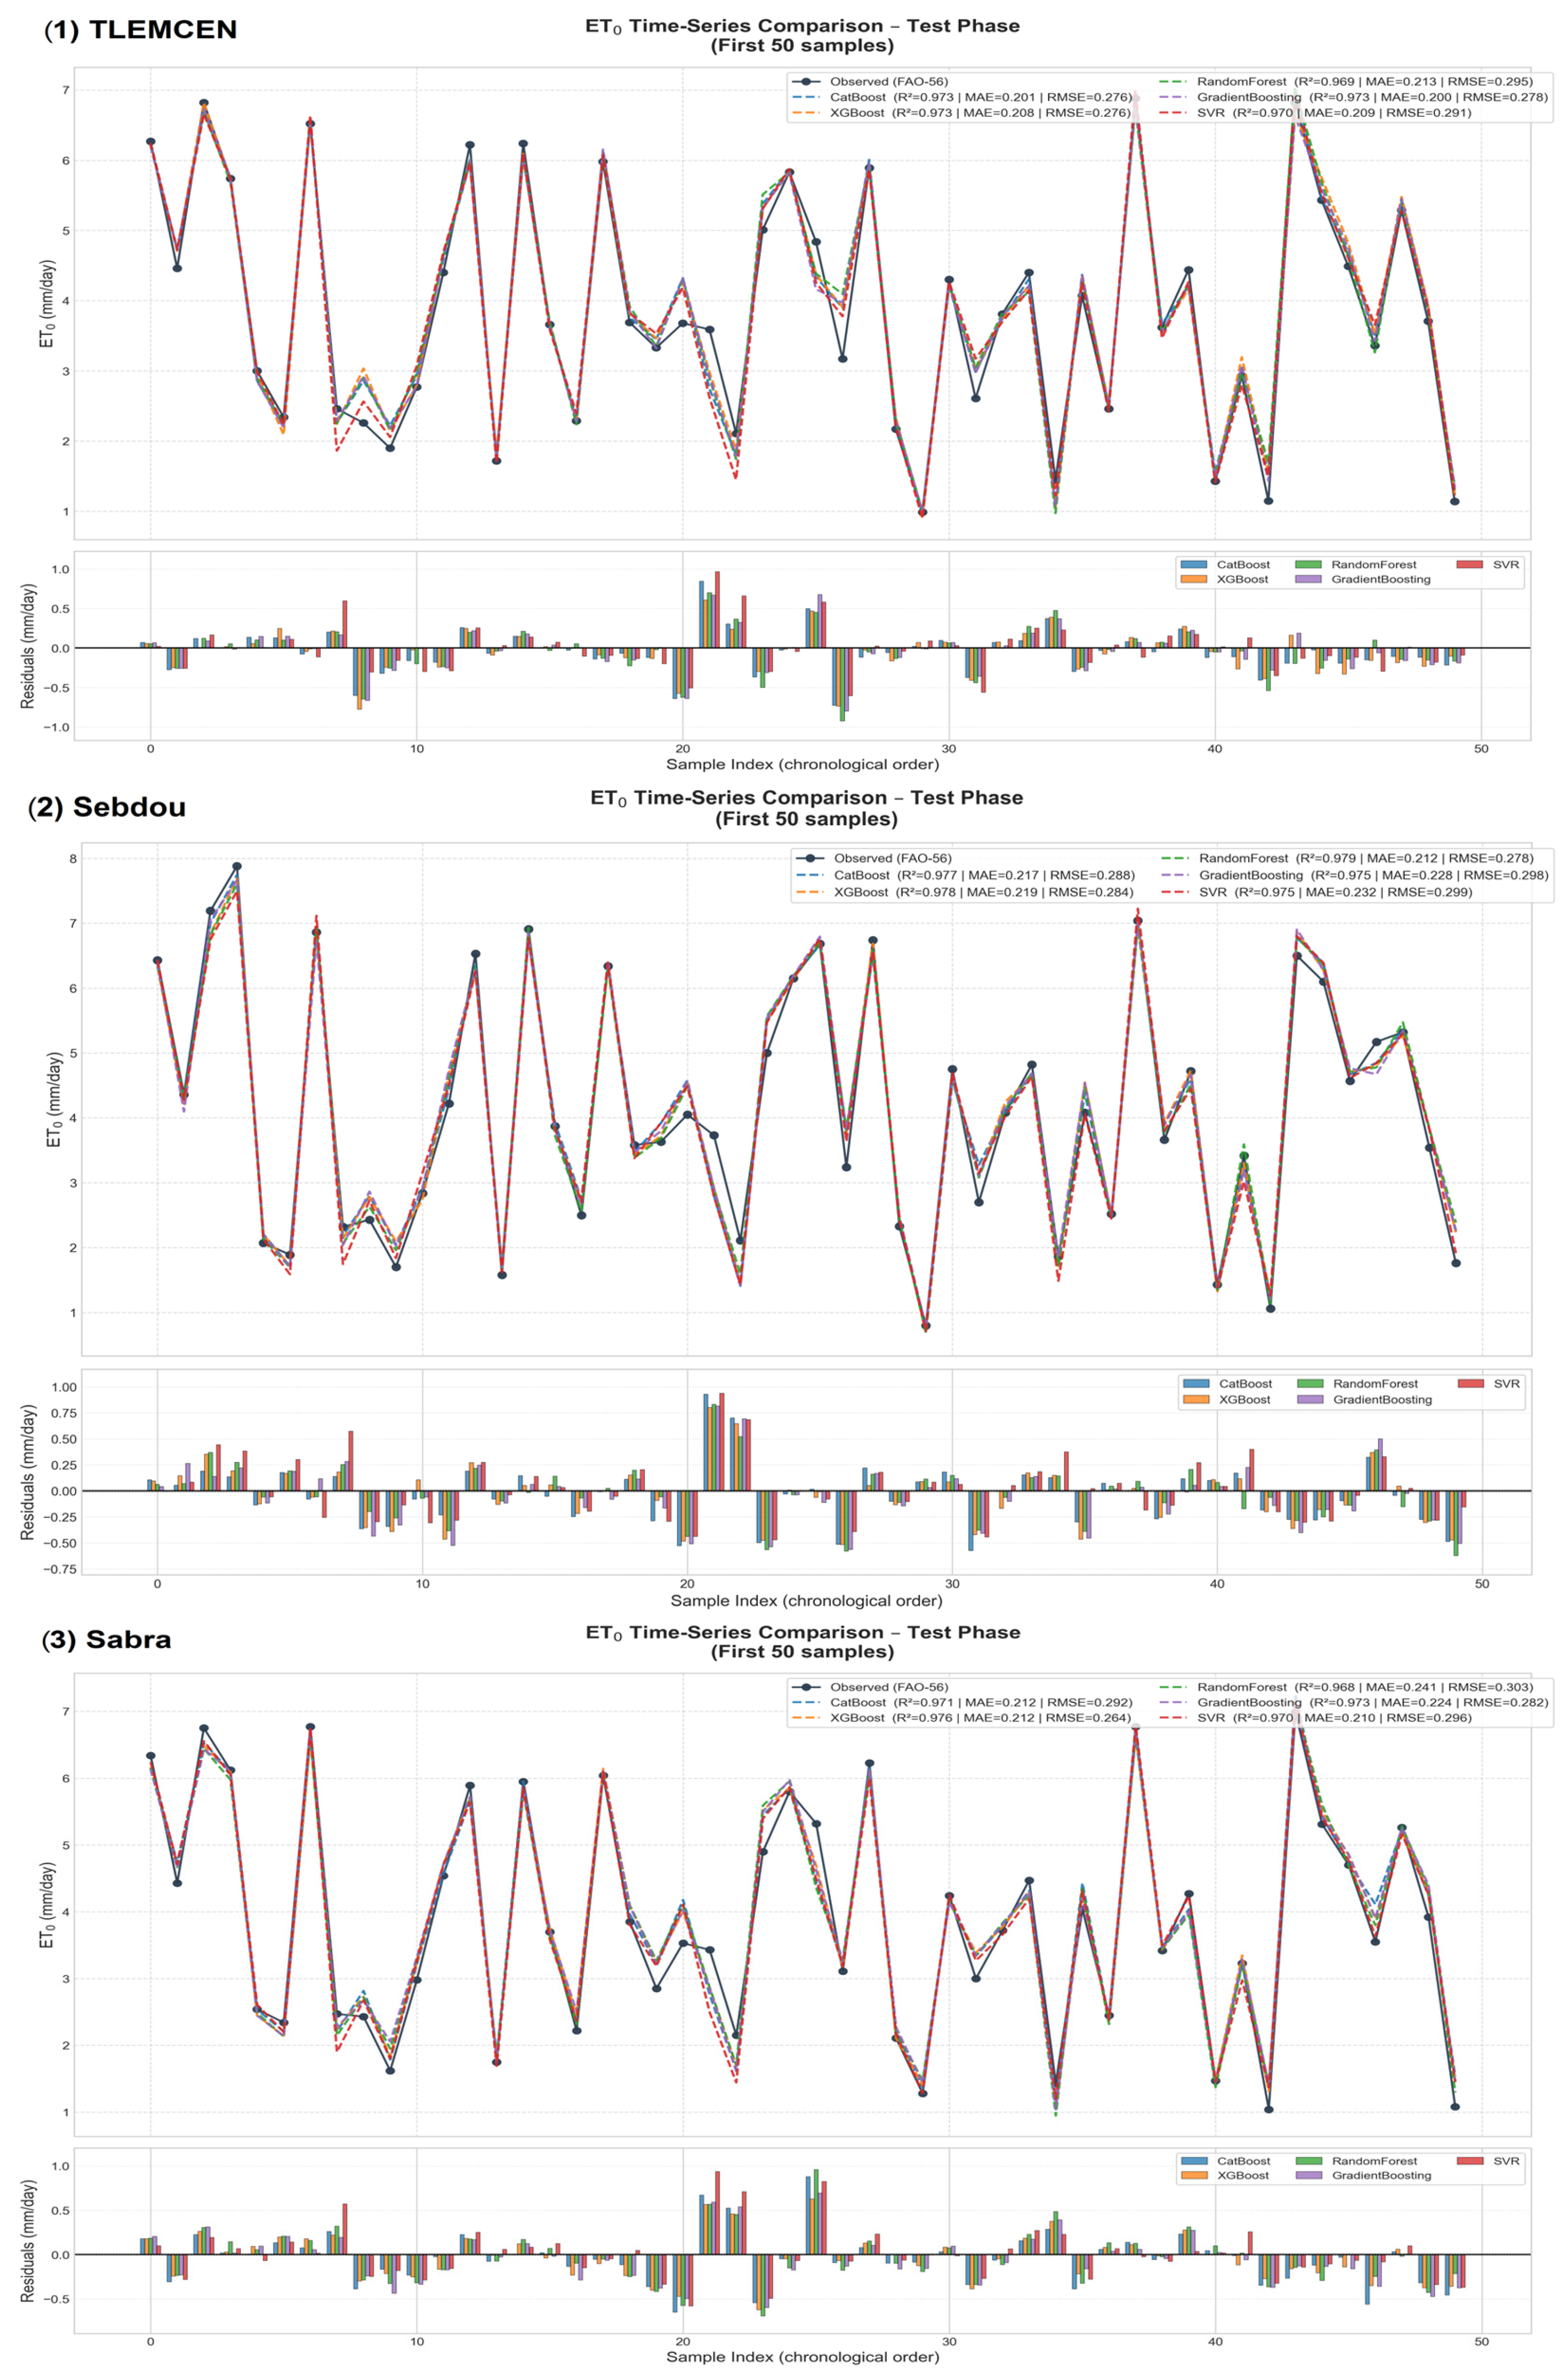
3.5. Evaluation ET0 Time-Series Predictions Across Ten Locations
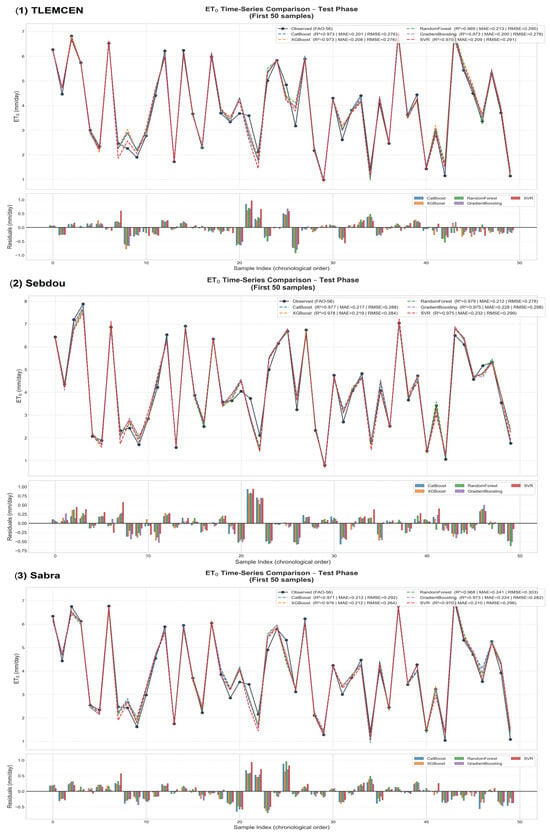
A comparison of the time series of ET0 for the ten regions (Henneya, Ghazaouet, Tlemcen, Ouled Mimoun, Sabra, Chettouane, Remchi, Sebdou, Nedroma, and Maghnia) is presented as a graphical representation (Figure 7) of the performance of the five ML models (SVR, CatBoost, XGBoost, random forest, and gradient boosting) in predicting the reference evapotranspiration over the test period. The evaluation of the validity of these models showed a consistently high level of model performance over all ten regions, with a mean R2 of 0.9710, indicating that the models accounted for approximately 97.1% of the variability in the measured ET0. The mean RMSE of 0.2872 mm/d and MAE of 0.2050 mm/d indicate a high degree of predictive accuracy by the models. Finally, the NSE of 0.9710 indicates that the models are reliable. There were some minor differences among the regions, with Ghazaouet having the smallest RMSE (0.2729 mm/d), Ouled Mimoun having the largest R2 (0.9750), Sebdou having the largest RMSE (0.2973 mm/d), and Nedroma having the smallest R2 (0.9663).
Figure 7.
Time-series comparison of five ML models for ET0 prediction across three locations: Tlemcen, Sebdou and Sabra (test set). Time-series predictions for the remaining seven stations are provided in the Supplementary Material (Supplementary Figure S1).
To improve visualization clarity and reduce information overload, Figure 7 presents the time-series comparison of the five ML models for four representative stations (Tlemcen, Sebdou, and Sabra) that span the geographic and climatic range of the study area. Time-series predictions for the remaining six stations are provided in the Supplementary Material (Supplementary Figure S1).
3.6. Long-Term Spatial Patterns and Interannual Changes in ET0
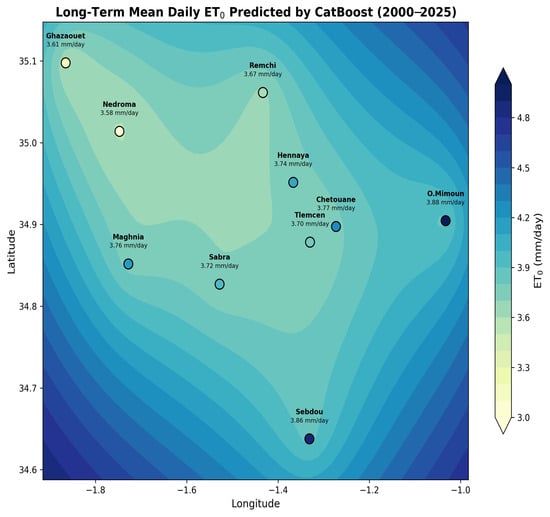
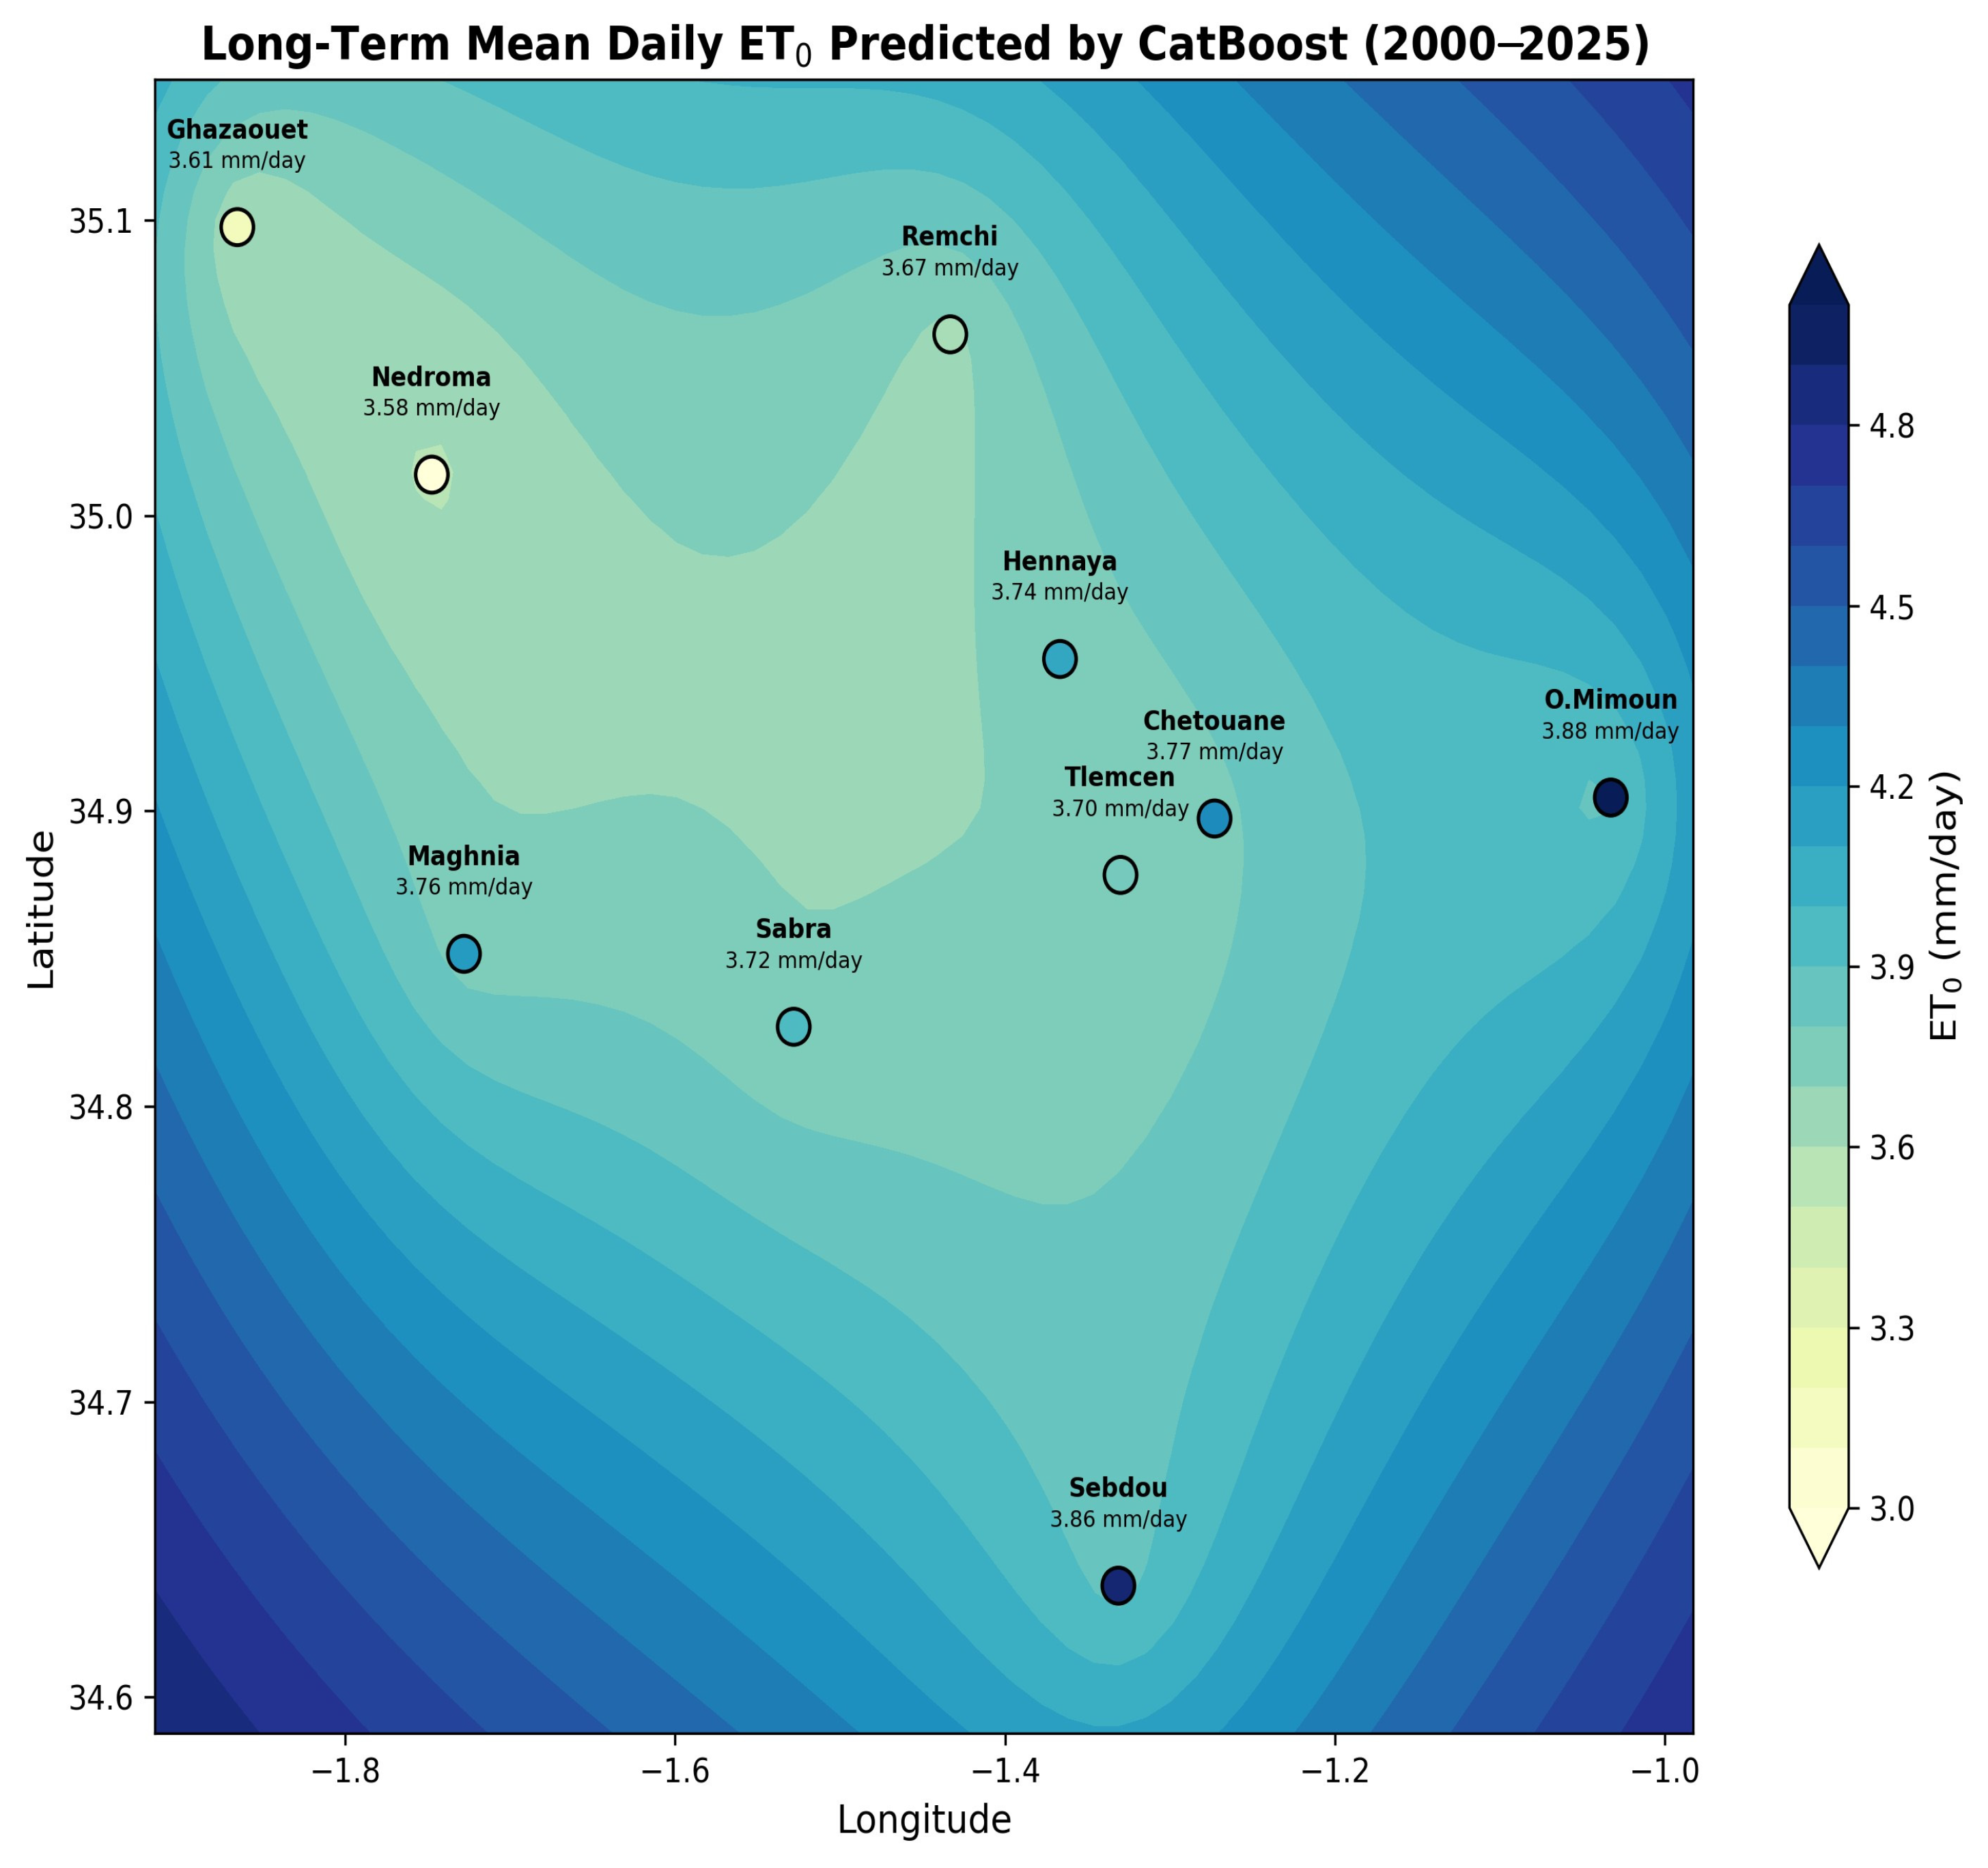
The long-term average daily evapotranspiration (ET0) was estimated using the CatBoost model (Figure 8) to range from approximately 3.58 to 3.88 mm/day at each of the ten locations studied (approximately 3.73 mm/day for the region as a whole). A distinct spatial gradient existed for ET0; that is, it was generally lower near the northern coastal regions (Nedroma, 3.58 mm/day; Ghazaouet, 3.61 mm/day), which are characterized by relatively high humidity levels and marine influences, and higher inland regions to the southeast (O. Mimoun, 3.88 mm/day; Sebdou, 3.86 mm/day), which are characterized by higher levels of solar radiation, lower humidity, and topographic effects of the Tell Atlas Mountain range. The intermediate locations of Remchi (3.67 mm/day), Hennaya (3.74 mm/day), Chetouane (3.77 mm/day), Tlemcen (3.70 mm/day), Maghnia (3.76 mm/day), and Sabra (3.72 mm/day) exhibited values that fell in the middle of this range. These values reflect the semi-arid Mediterranean climate conditions of the Tlemcen Province and indicate an upward trend over time of approximately 0.01–0.02 mm/day/year on a multidecadal basis, which is most likely related to regional warming.
Figure 8.
Long-term mean daily reference evapotranspiration (ET0) map predicted by the optimized CatBoost model over the period 2000–2025 in the Tlemcen Province, northwestern Algeria. Station-specific values (mm day−1) are indicated next to each location. The color gradient (yellow to dark blue) represents increasing ET0 from coastal (lower) to inland southeastern zones (higher), highlighting the spatial gradient driven by climatic and topographic factors.
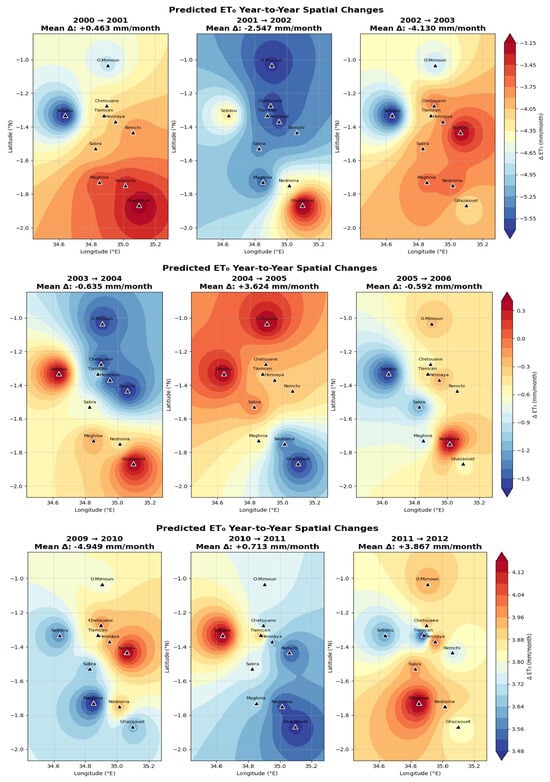
The overall residual values are extremely low in all the Error Analysis Maps (Figure 9, Figure 10 and Figure 11; time period 2000–2025), with a Mean Bias Error (MBE) equal to approximately +0.005 mm/day. Some small systematic trends can be observed: a small positive bias in the inland southeast stations (for example, Sebdou and Ouled Mimoun: +0.03 to +0.05 mm/day) and a small negative bias along the coast (for example, Ghazaouet and Nedroma: −0.02 to −0.04 mm/day). The small errors demonstrate that the CatBoost model is reliable for spatial prediction in semi-arid environments with limited data.
Figure 9.
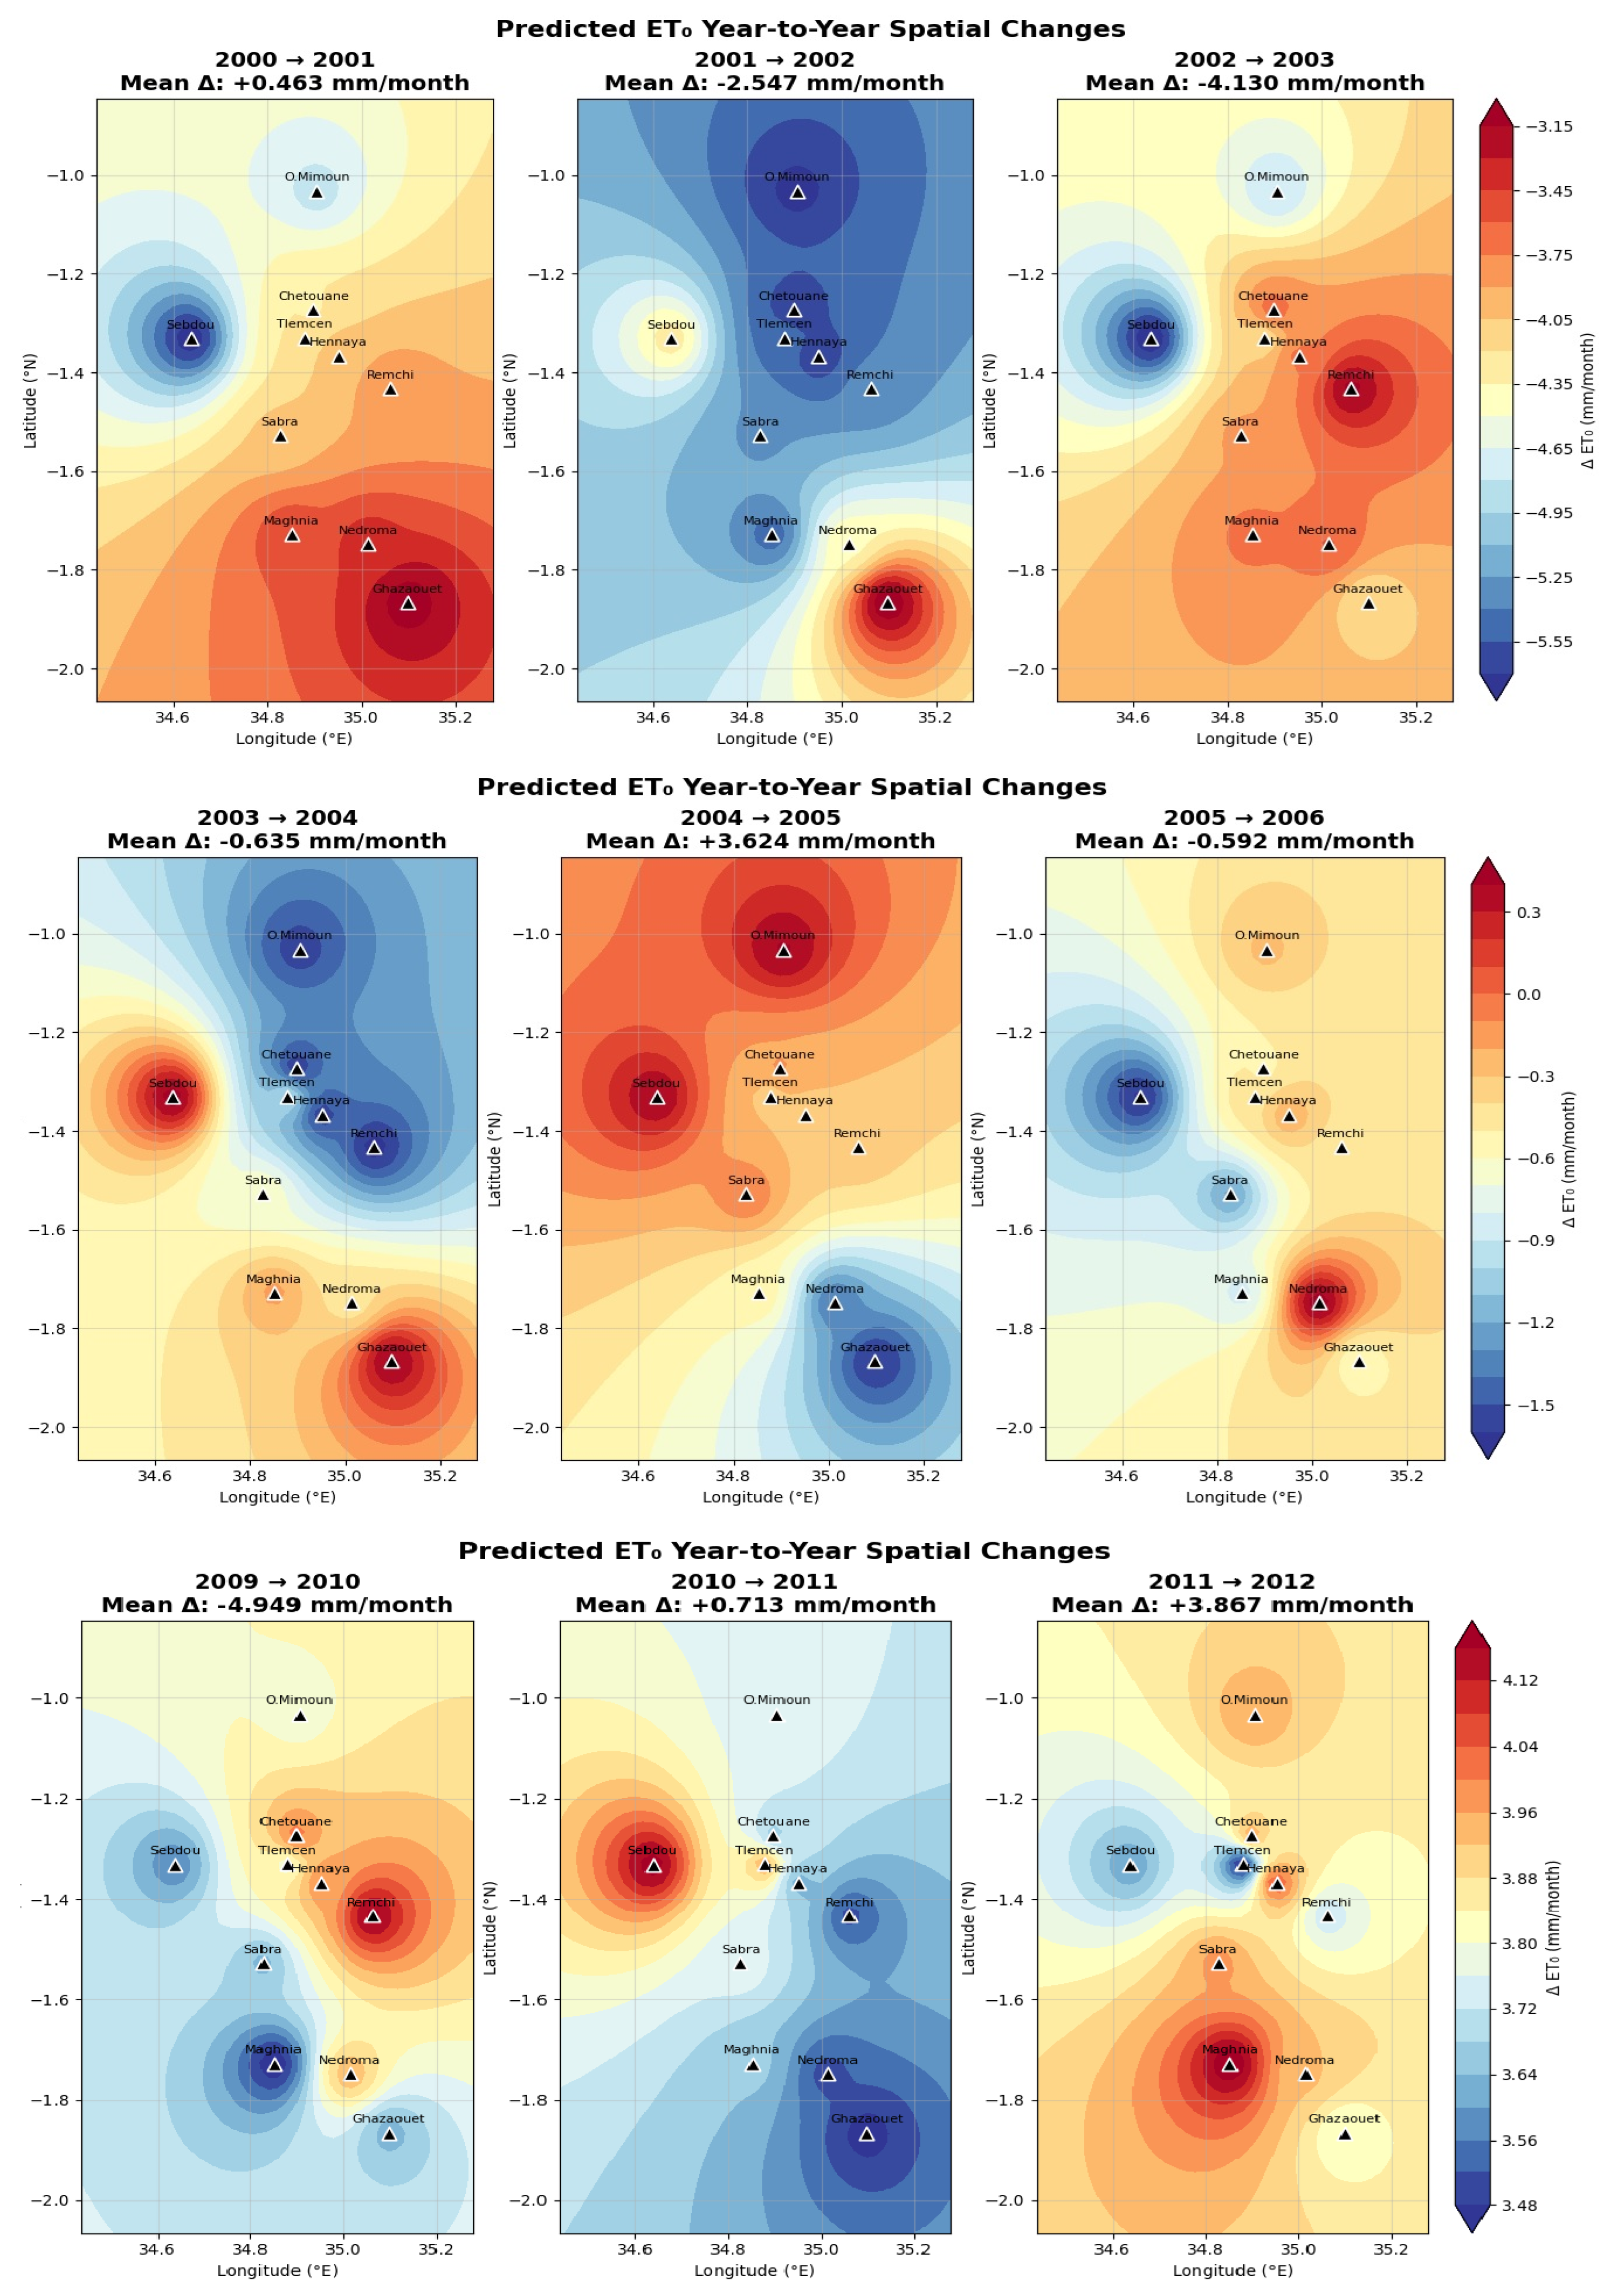
Predicted Year-to-year ΔET0 by CatBoost for selected periods (2000–2012).
Figure 10.
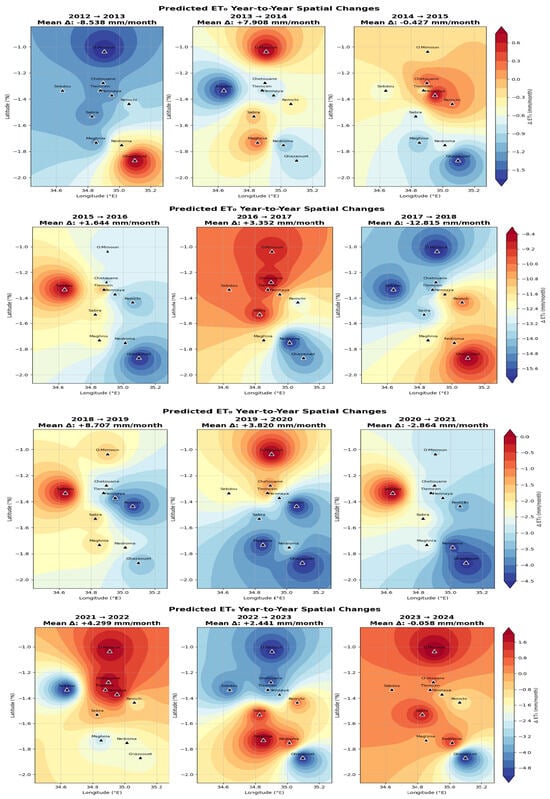
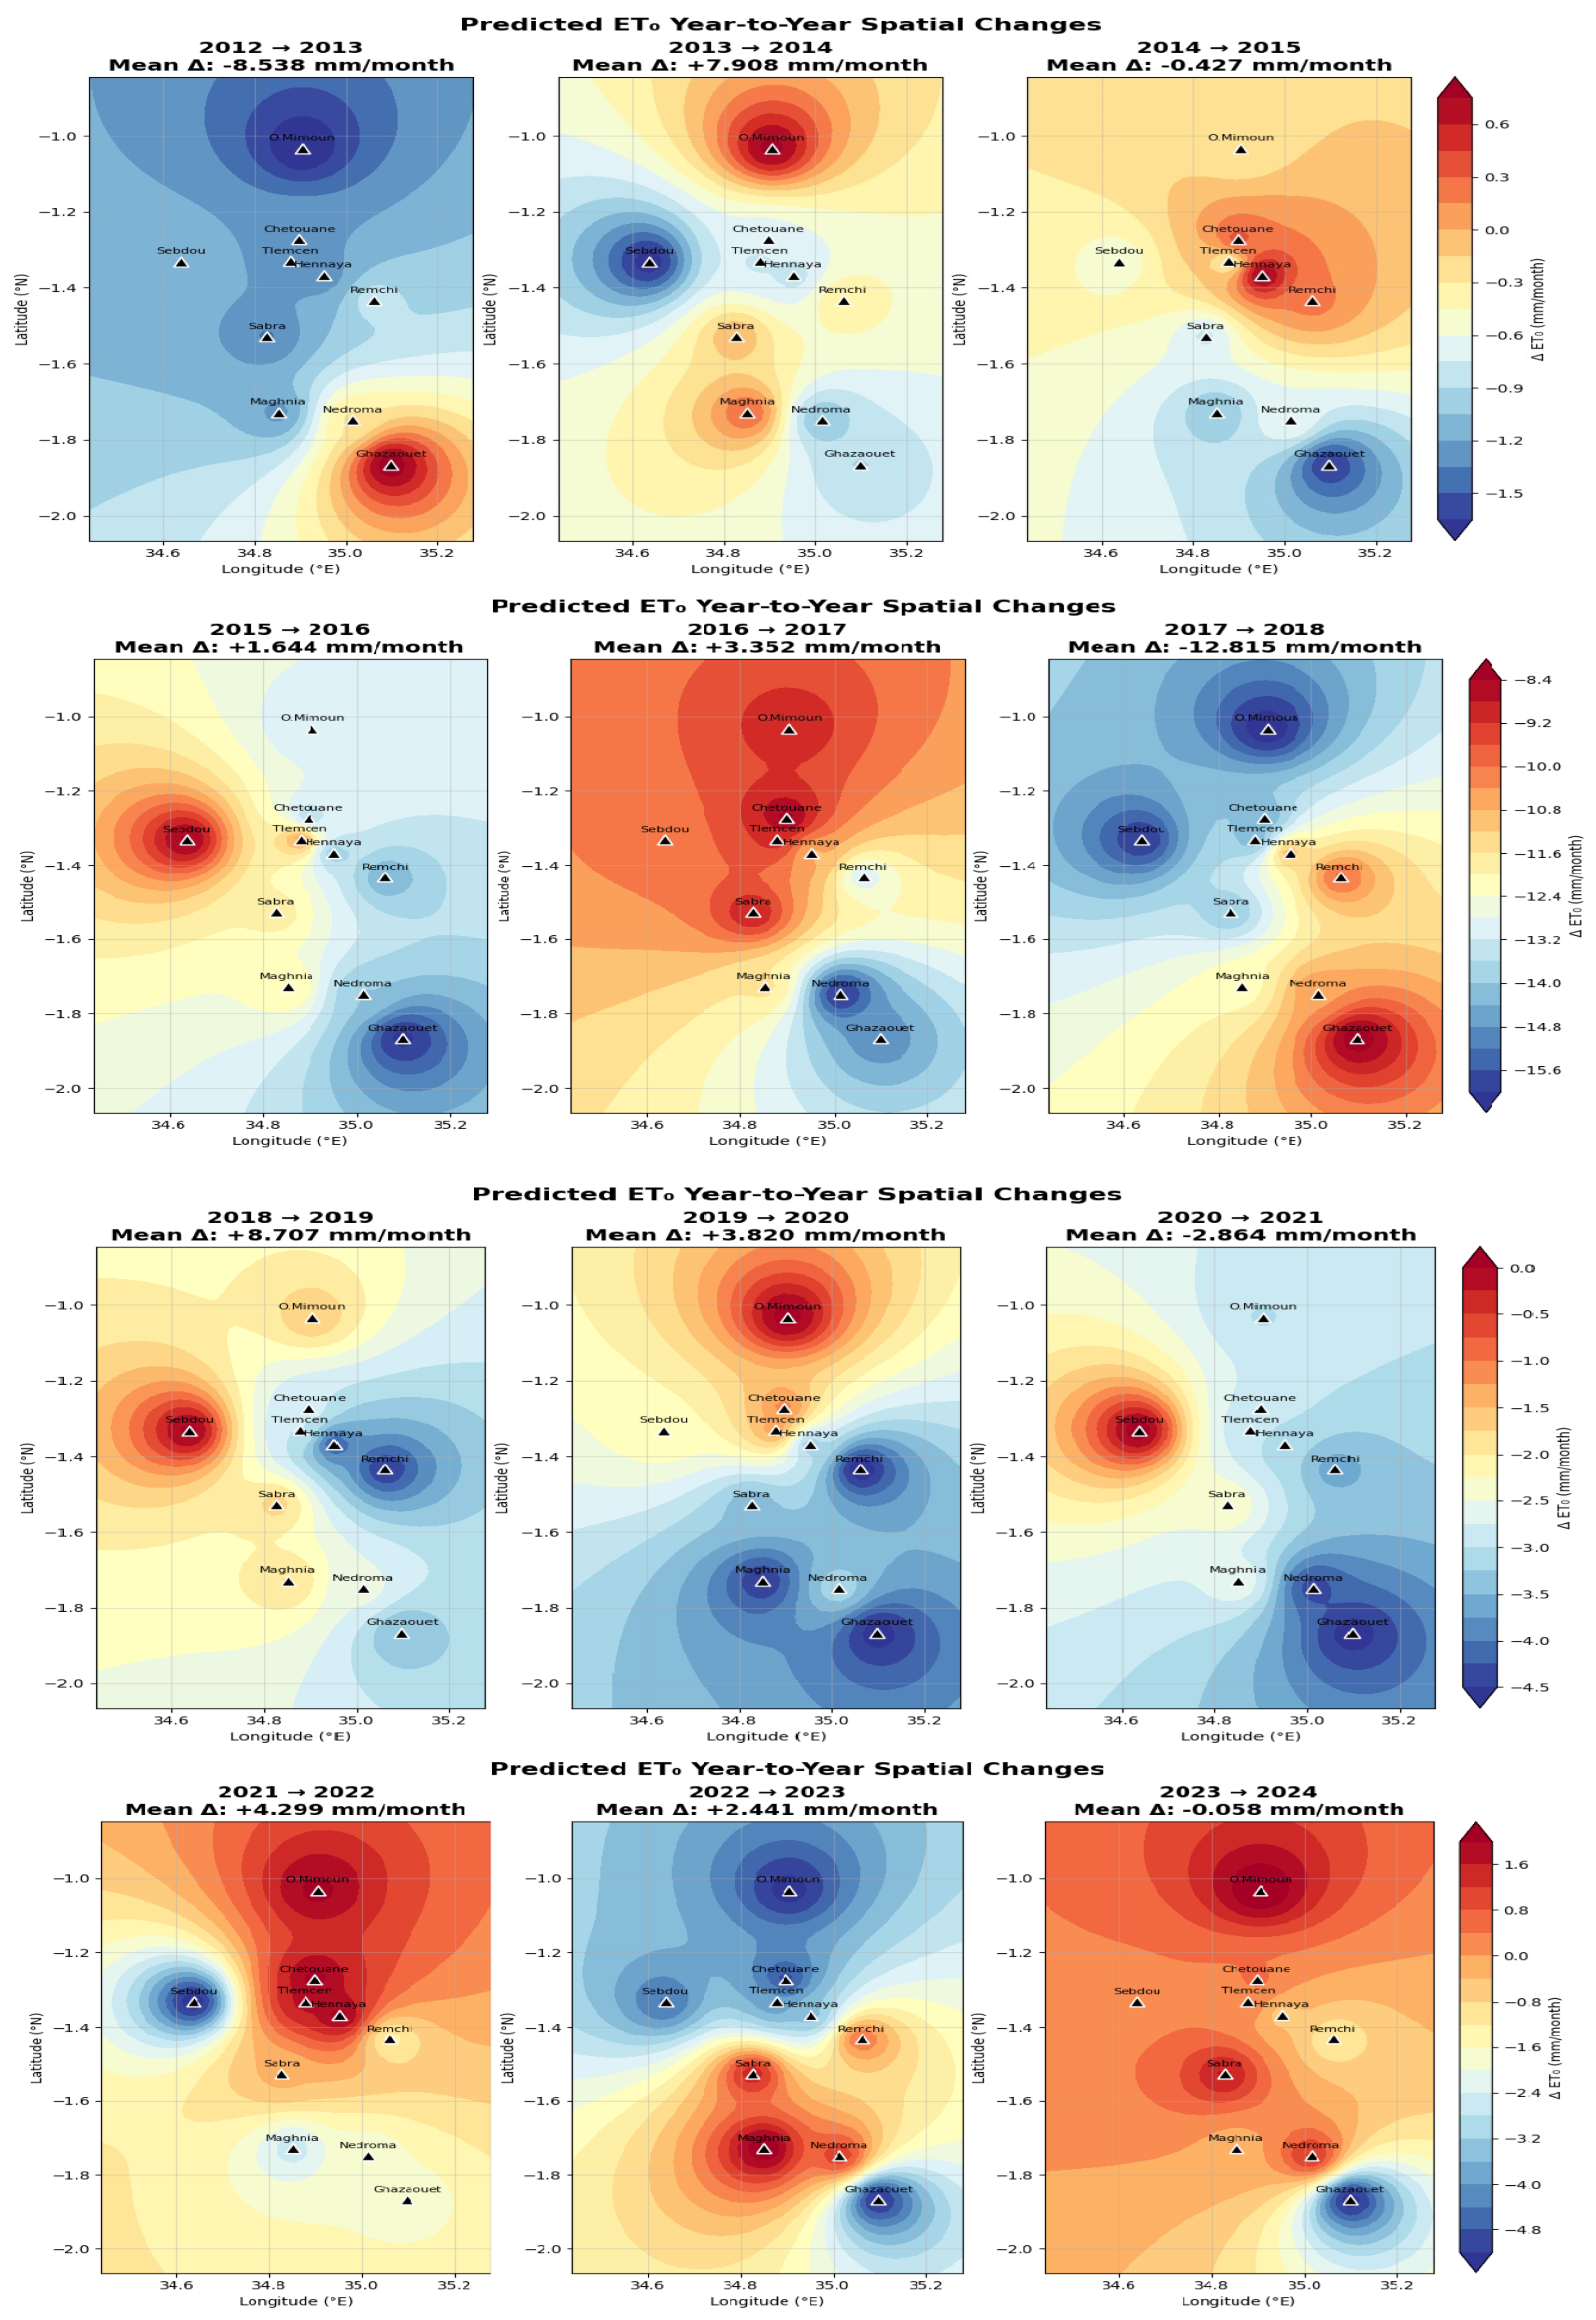
Predicted Year-to-year ΔET0 by CatBoost for selected periods (2012–2024).
Figure 11.
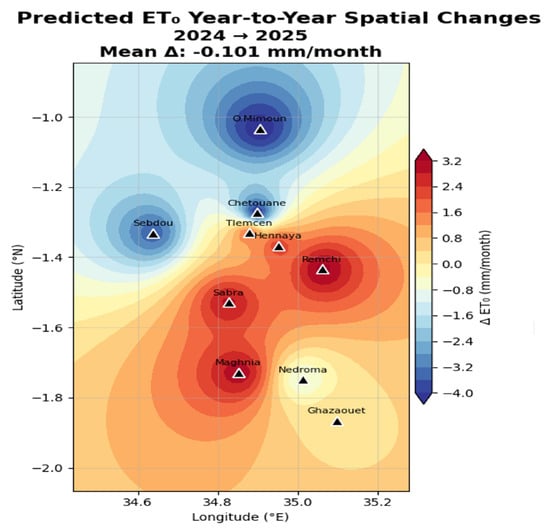
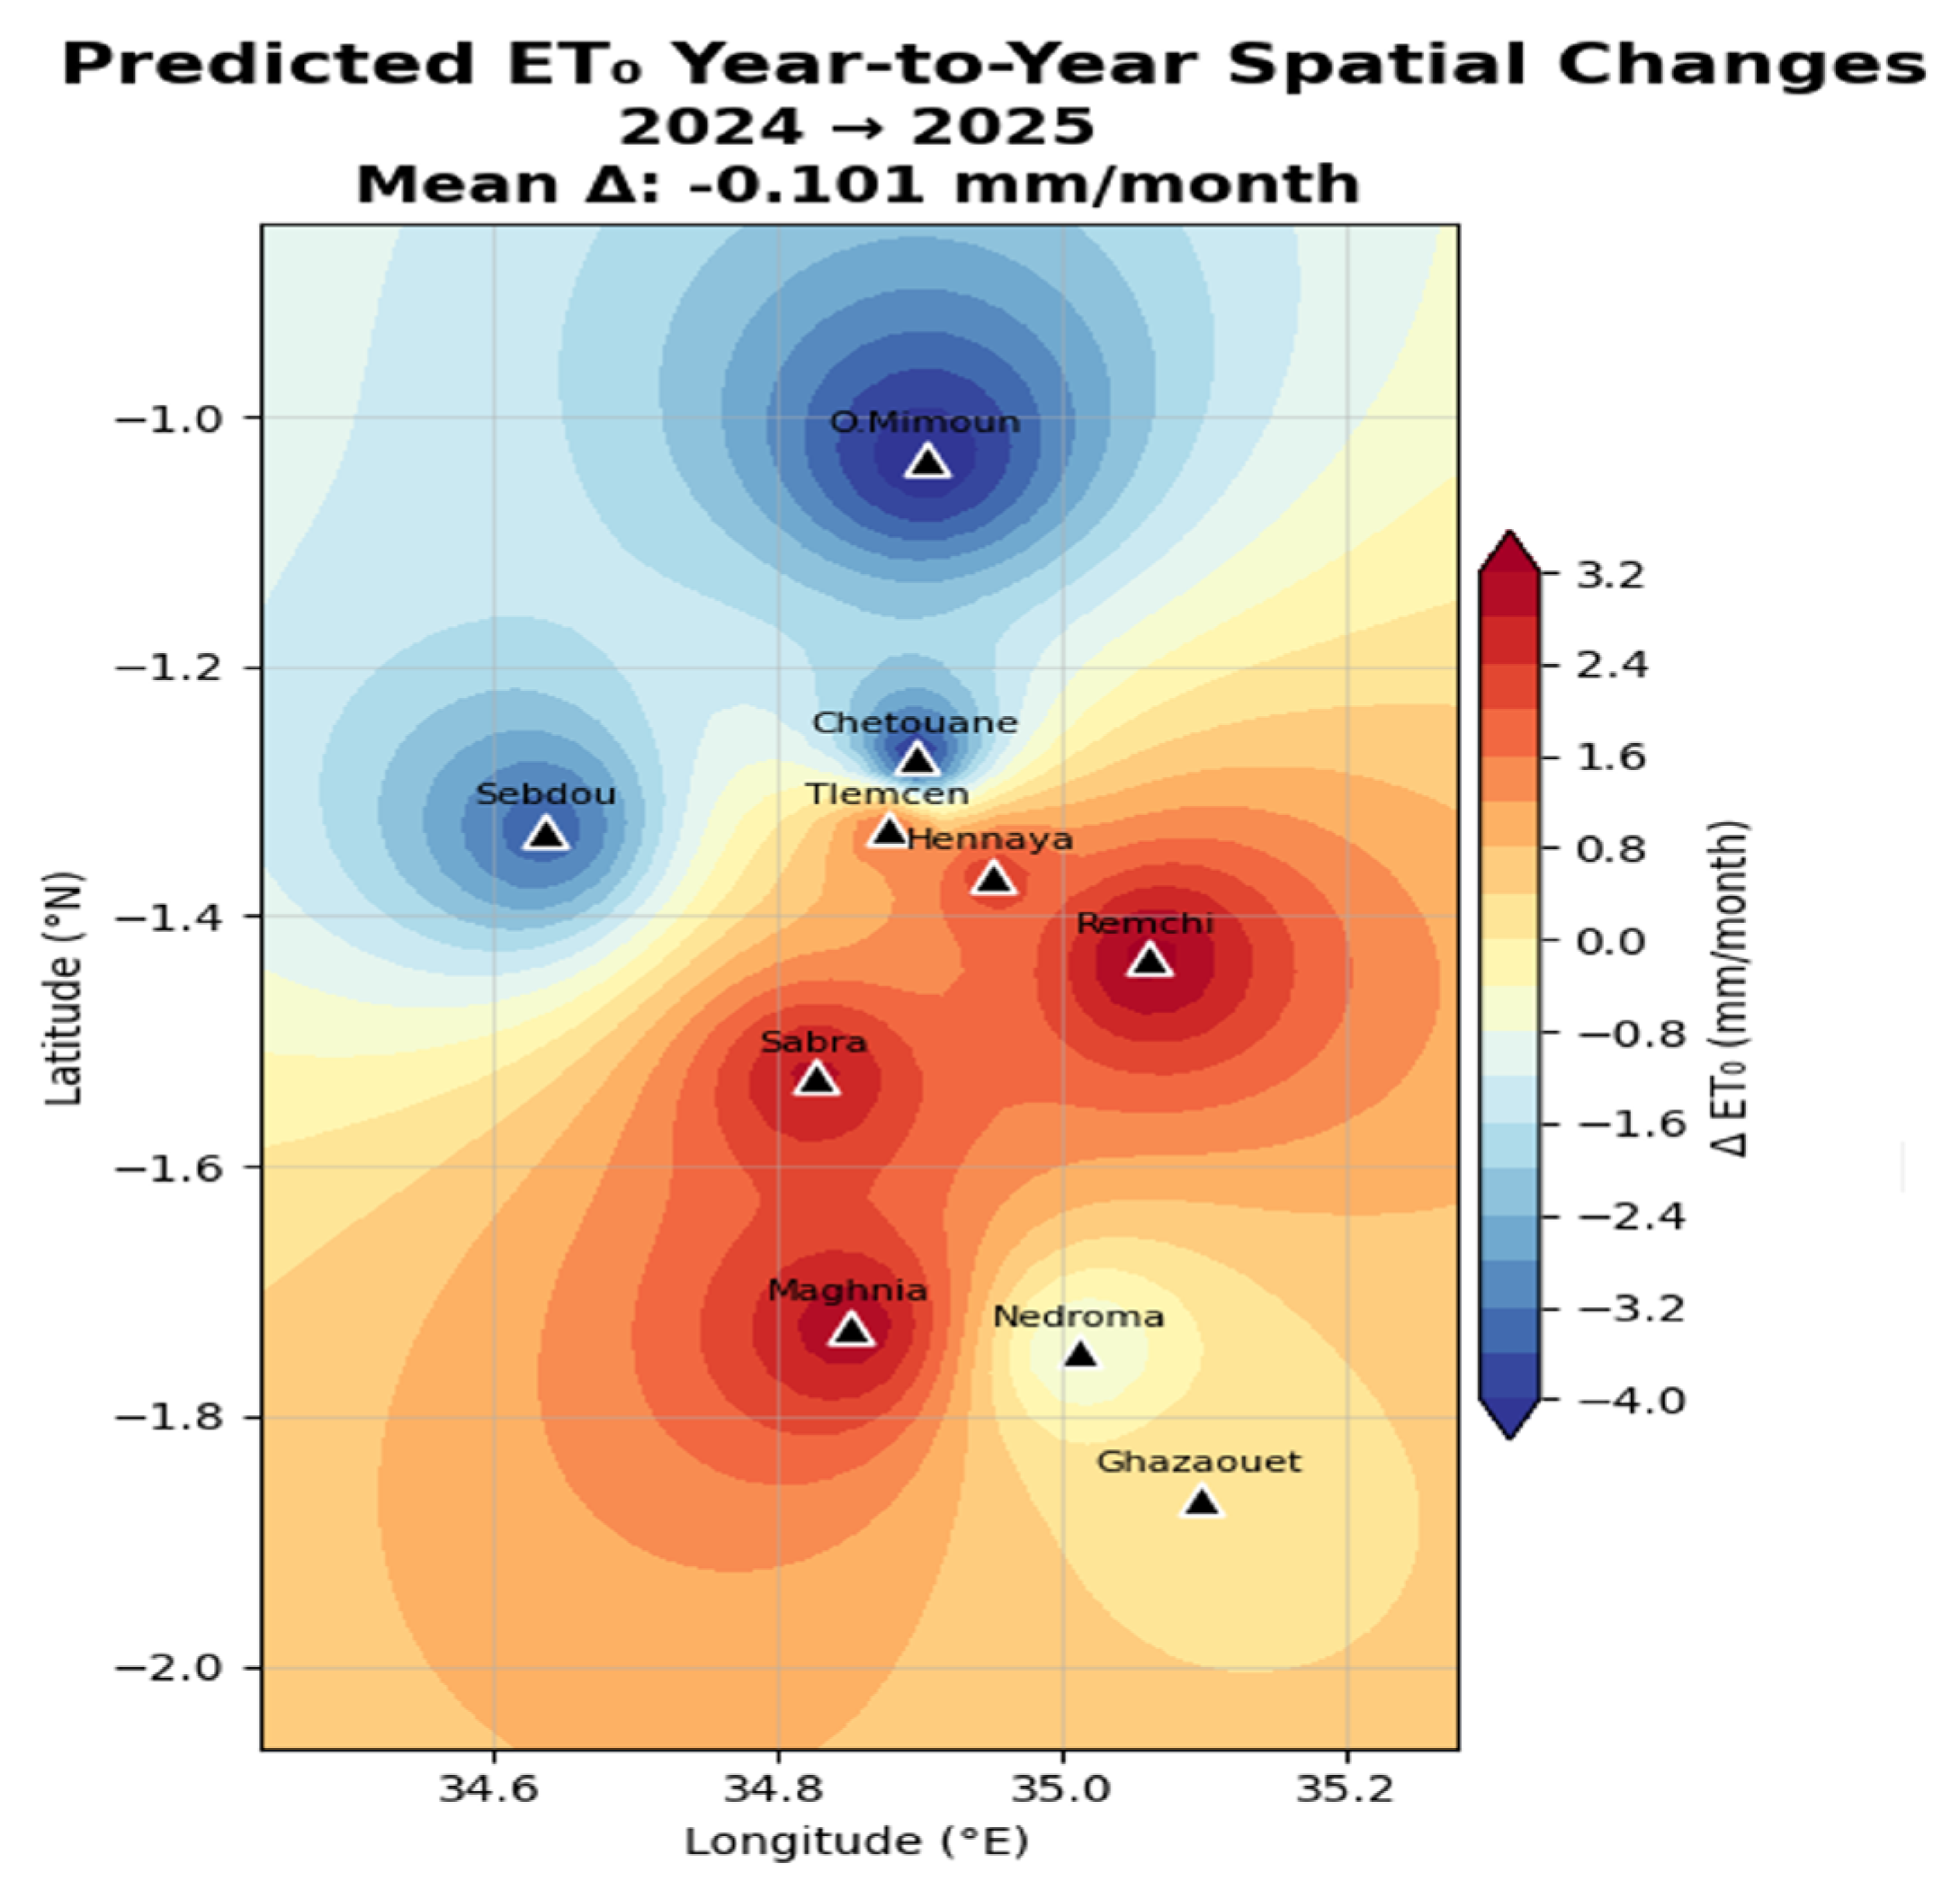
Predicted year-to-year ΔET0 by CatBoost for the selected period (2024–2025).
Year-to-year ΔET0 maps (Figure 9, Figure 10 and Figure 11) demonstrated high spatial and temporal variability (ΔET0 range = −12.815 to +8.707 mm month−1) due to oscillatory variations in the NAO/Mediterranean oscillation and climate variability, which did not demonstrate a significant trend (net −0.021 mm month−1; p > 0.05). Therefore, it can be inferred that interannual variability dominated the change in ET0 for the Tlemcen region.
Figure 9, Figure 10 and Figure 11 show large interannual variability of ΔET0 and no general monotonic trend over the time series, but rather alternating phases of wetting (decrease in evapotranspirative demand) and drying (increase in evapotranspirative demand). These patterns match the documented climate variability in Northwestern Algeria. Climate variability was likely due to oscillations of the Mediterranean oscillation, North Atlantic Oscillation (NAO), and potential signals of climate change, including warmer temperatures increasing ET0 in some years. Key Observations:
- -
- High inter-annual variability in changes of ΔET0: Changes were typically ±5–10 mm/month (regionally); for example, +8.707 mm/month in 2018–2019, −12.815 mm/month in 2017–2018, and −8.538 mm/month in 2012–2013. These large monthly mean changes in ΔET0 would have considerable impacts on crop water demands and irrigation needs for rain-fed or irrigated agricultural systems, as well as on drought risks.
- -
- Spatial heterogeneity: Spatial patterns of ΔET0 often include dipole-like or multi-lobed configurations, in which different regions exhibit opposite trends. Such spatial patterns may indicate local factors that control climate variables (such as temperature, humidity, wind, and radiation), including the influence of regional topography (such as elevation), proximity to the Mediterranean Sea (coastal moderation), land cover, and orographic effects on climate drivers.
- -
- The northern and central areas (such as Ouled Mimoun, Chetouane, Sebdou, Remchi, and Hennaya) showed contrasting anomaly patterns compared with the southern and coastal areas (Maghnia, Nedroma, and Ghazaouet). Ghazaouet commonly served as an anchor point for large positive (red) or negative (blue) centers, which could be related to its coastal location, which influences humidity and wind regimes.
There is no apparent long-term trend in these selected pairs; although there are some indications of recent periods (such as 2018–2023) displaying a greater frequency of positive ΔET0 (higher demand), there are also periods that display increases and decreases. This agrees with many studies in Algeria that found a highly variable upward ET0 trend in summer and at southern/eastern stations.
While the machine learning models, particularly CatBoost, demonstrated high accuracy in estimating ET0, several limitations and potential biases must be critically acknowledged. A primary limitation of this study is the reliance on reanalysis data (ERA5/ERA5-Land) from the Open-Meteo API rather than direct ground-based meteorological observations. Although reanalysis datasets provide continuous and spatially comprehensive data, they are inherently model-derived and can introduce systematic biases, especially in regions with complex topography like the Tlemcen Province. The models trained on this data may inadvertently learn and propagate these underlying biases, leading to an overestimation of their true predictive performance in real-world, ground-truth scenarios. Furthermore, the use of only four meteorological variables, while practical for data-scarce regions, oversimplifies the complex physical processes driving evapotranspiration. The omission of variables such as net radiation and soil heat flux may limit the models’ ability to capture extreme or anomalous ET0 events accurately. Additionally, the lack of spatial cross-validation in our methodology means that the models’ transferability to entirely unobserved locations within or outside the region remains partially untested. Future research should prioritize validating these models against high-quality, ground-based lysimeter or eddy covariance data to quantify the true extent of reanalysis-induced biases and ensure the robustness of the proposed approach for operational irrigation management.
3.7. Limitations and Potential Biases
While the machine learning models, particularly CatBoost, demonstrated high accuracy in estimating ET0, several limitations and potential biases must be critically acknowledged. A primary limitation of this study is the reliance on reanalysis data (ERA5/ERA5-Land) from the Open-Meteo API rather than direct ground-based meteorological observations. Although reanalysis datasets provide continuous and spatially comprehensive data, they are inherently model-derived and can introduce systematic biases, especially in regions with complex topography like the Tlemcen region. The models trained on this data may inadvertently learn and propagate these underlying biases, leading to an overestimation of their true predictive performance in real-world, ground-truth scenarios. Furthermore, the use of only four meteorological variables, while practical for data-scarce regions, oversimplifies the complex physical processes driving evapotranspiration. The omission of variables such as net radiation and soil heat flux may limit the models’ ability to capture extreme or anomalous ET0 events accurately. Additionally, the lack of spatial cross-validation in our methodology means that the models’ transferability to entirely unobserved locations within or outside the region remains partially untested. Future research should prioritize validating these models against high-quality, ground-based lysimeter or eddy covariance data to quantify the true extent of reanalysis-induced biases and ensure the robustness of the proposed approach for operational irrigation management.
4. Conclusions
This study demonstrates the effectiveness of advanced machine learning techniques, particularly CatBoost, as a robust and accurate emulator of the FAO-56 Penman–Monteith equation for estimating daily reference evapotranspiration (ET0) in data-limited semi-arid environments. Using only four readily available meteorological variables—air temperature at 2 m, vapor pressure deficit, wind speed at 10 m, and sunshine duration—CatBoost achieved superior performance across ten meteorological stations in the Tlemcen Province, northwestern Algeria, over the 26-year period (2000–2025). The model consistently delivered excellent predictive accuracy on the independent test set, with pooled metrics of RMSE ≈ 0.292 mm day−1, MAE ≈ 0.208 mm day−1, R2 = 0.971, and NSE = 0.971, while exhibiting minimal overfitting and high predictive stability compared to XGBoost, Gradient Boosting, Random Forest, and Support Vector Regression.
The spatial analysis revealed a clear gradient in long-term mean daily ET0, ranging from approximately 3.58 mm day−1 in coastal-influenced northern stations to 3.88 mm day−1 in inland southeastern areas, reflecting the combined effects of topography, marine influence, and regional climatic conditions. Temporal analysis indicated substantial interannual variability in monthly ET0 (year-to-year changes ranging from −12.815 to +8.707 mm month−1), primarily driven by large-scale atmospheric oscillations such as the North Atlantic Oscillation (NAO) and Mediterranean Oscillation. However, no statistically significant long-term trend was detected over the 2000–2025 period (net cumulative change ≈ −0.021 mm month−1; p > 0.05), although a subtle multidecadal increase of 0.01–0.02 mm day−1 per year was observed at several locations, consistent with gradual regional warming.
These findings highlight CatBoost as a highly reliable, computationally efficient, and data-frugal alternative to the full FAO-56 Penman–Monteith model in semi-arid Mediterranean regions where complete meteorological datasets are often unavailable. Its strong generalization capability and low sensitivity to overfitting make it particularly suitable for operational applications in irrigation scheduling, hydrological modeling, and water resources planning under climate variability and water scarcity.
The proposed CatBoost-based approach offers significant practical value for agricultural water management in northwestern Algeria and similar semi-arid environments across the Mediterranean basin. Future research could explore the integration of remote sensing data, the development of hybrid physics-informed models, and the extension of this framework to crop-specific evapotranspiration estimation and real-time forecasting systems.
Supplementary Materials
The following supporting information can be downloaded at: https://www.mdpi.com/article/10.3390/agronomy16090905/s1, Figure S1: Time-series predictions for the remaining six stations; Table S1: Training Performance—Additional Metrics; Table S2: Test Performance—Additional Metrics.
Author Contributions
A.M. (Conceptualization, methodology, software, formal analysis, investigation, data curation, writing—original draft preparation, visualization); A.C.D. (Conceptualization, validation, writing—review and editing, supervision). All authors have read and agreed to the published version of the manuscript.
Funding
This research received no external funding.
Data Availability Statement
The datasets used in this study comprised daily reference evapotranspiration (ET0) observations and predictions from ten meteorological stations located in the study region: Chetouane, Ghazaouet, Hennaya, Maghnia, Nedroma, Ouled Mimoun, Remchi, Sabra, Sebdou, and Tlemcen. The data encompassed 9497 daily records per station spanning from 1 January 2000 to 31 December 2025, with each record containing three variables: date, observed ET0 values, and predicted ET0 values (measured in mm/day). Raw meteorological data and observed evapotranspiration measurements were obtained from the National Meteorological Service and regional water resource management agencies. Predicted ET0 values were generated using standard reference ET0 calculation methods based on meteorological variables, including temperature, humidity, wind speed, and solar radiation.
Conflicts of Interest
The authors declare no conflicts of interest.
References
- Allen, R.G.; Pereira, L.S.; Raes, D.; Smith, M. Crop Evapotranspiration: Guidelines for Computing Crop Water Requirements (FAO Irrigation and Drainage Paper No. 56); Food and Agriculture Organization of the United Nations: Rome, Italy, 1998; Available online: https://www.fao.org/4/X0490E/X0490E00.htm (accessed on 25 November 2025).
- Meddi, M.; Assani, A.A.; Meddi, H. Temporal variability of annual rainfall in the Macta and Tafna catchments in northwestern Algeria. Water Resour. Manag. 2010, 24, 3817–3833. [Google Scholar] [CrossRef] [Scilit]
- Acharki, S.; Raza, A.; Alshehri, F.; Tegos, A.; Amharref, M.; Bernoussi, A.S.; Singh, S.K.; Elbeltagi, A. Comparative Assessment of Eight Empirical and Four Hybrid Machine Learning Models for Estimating Daily Reference Evapotranspiration in Sub-Humid and Semi-Arid Climates. Research Square. 2023. Available online: https://www.researchsquare.com/article/rs-3709117/v1 (accessed on 5 March 2026).
- Rajput, J.; Singh, M.; Lal, K.; Khanna, M.; Sarangi, A.; Mukherjee, J.; Singh, S. Assessment of data intelligence algorithms in modeling daily reference evapotranspiration under input data limitation scenarios in semi-arid climatic conditions. Water Sci. Technol. 2023, 87, 2504. [Google Scholar] [CrossRef] [Scilit] [PubMed]
- Yong, S.L.S.; Ng, J.L.; Huang, Y.F.; Ang, C.K. Estimation of reference crop evapotranspiration with three different machine learning models and limited meteorological variables. Agronomy 2023, 13, 1048. [Google Scholar] [CrossRef] [Scilit]
- Taheri, M.; Bigdeli, M.; Imanian, H.; Mohammadian, A. An overview of evapotranspiration estimation models utilizing artificial intelligence. Water 2025, 17, 1384. [Google Scholar] [CrossRef] [Scilit]
- Huang, G.; Wu, L.; Ma, X.; Zhang, H.; Fan, J.; Song, X.; Yang, C.; Wang, H. Evaluation of CatBoost method for prediction of reference evapotranspiration in humid regions. J. Hydrol. 2019, 574, 1029–1041. [Google Scholar] [CrossRef] [Scilit]
- Elbeltagi, A.; Srivastava, A.; Cao, X.; Gautam, V.K.; Zerouali, B.; Aslam, M.R.; Salem, A.; Emami, H.; Elsadek, E.A. Bayesian-optimized machine learning boosts actual evapotranspiration prediction in water-stressed agricultural regions of China. Sci. Rep. 2025, 15, 22130. [Google Scholar] [CrossRef] [Scilit]
- Sattari, M.T.; Apaydin, H.; Band, S.S.; Mosavi, A. Comparative analysis of kernel-based versus ANN and deep learning methods in monthly reference evapotranspiration estimation. Hydrol. Earth Syst. Sci. 2021, 25, 603–618. [Google Scholar] [CrossRef] [Scilit]
- Amani, S.; Shafizadeh-Moghadam, H.; Zakeri-Nejad, R. A review of machine learning models and influential factors for estimating evapotranspiration using remote sensing and ground-based data. Agric. Water Manag. 2024, 284, 108234. [Google Scholar] [CrossRef] [Scilit]
- Baichou, A.; Zegoumou, A.; Benhlima, S.; Bekr, M.A. Daily reference evapotranspiration estimation utilizing deep learning models with varied combinations of weather data. E3S Web Conf. 2024, 492, 1002. [Google Scholar] [CrossRef] [Scilit]
- Jayashree, T.R.; Reddy, N.V.S.; Acharya, U.D. Modeling Daily Reference Evapotranspiration from Climate Variables: Assessment of Bagging and Boosting Regression Approaches. Water Resour. Manag. 2023, 37, 1013–1032. [Google Scholar] [CrossRef] [Scilit]
- Nayak, A.K.; Sarangi, A.; Pradhan, S.K.; Panda, R.K.; Jeepsa, N.M.; Satpathy, B.; Kumar, M. Estimation of Daily Reference Evapotranspiration Using Machine Learning and Deep Learning Techniques with Sparse Meteorological Data. Preprint. Research Square. Posted 3 September 2024. Available online: https://www.researchsquare.com/article/rs-4853172/v1.pdf (accessed on 5 March 2026).
- Zhang, Y.; Zhao, Z.; Zheng, J. CatBoost: A new approach for estimating daily reference crop evapotranspiration in arid and semi-arid regions of Northern China. J. Hydrol. 2020, 588, 125087. [Google Scholar] [CrossRef] [Scilit]
- Achite, M.; Nasiri, H.; Katipoğlu, O.M.; Abdallah, M.; Moazenzadeh, R.; Mohammadi, B. A coupled extreme gradient boosting–MPA approach for estimating daily reference evapotranspiration. Theor. Appl. Climatol. 2025, 156, 113. [Google Scholar] [CrossRef] [Scilit]
- Aly, M.S.; Darwish, S.M.; Aly, A.A. High-performance machine learning approach for reference evapotranspiration estimation. Stoch. Environ. Res. Risk Assess. 2023, 37, 4863–4879. [Google Scholar] [CrossRef] [Scilit]
- Coutinho, E.R.; de Souza, J.C.S.; da Silva, J.A. Genetic algorithms applied to optimize neural network models for monthly reference evapotranspiration estimation in northern Algeria. Rev. Bras. Meteorol. 2025, 40, e40240009. [Google Scholar] [CrossRef] [Scilit]
- Hadria, R.; Benabdelouahab, T.; Elmansouri, L.; El-Haddad, M. Derivation of air temperature of agricultural areas of Morocco from remotely sensed land surface temperature based on the updated Köppen-Geiger climate classification. Model. Earth Syst. Environ. 2019, 5, 1645–1658. [Google Scholar] [CrossRef] [Scilit]
- Achir, M.; Senhadji, A.A.Z.; Taibi, W.; Yassine, B. Identification and characterization of common age in the wilaya of Tlemcen. Genet. Biodivers. J. 2021, 5, 63–71. [Google Scholar] [CrossRef] [Scilit]
- Tikhamarine, Y.; Soulaiman, D.; Kisi, O.; Karami, H. Estimation of monthly reference evapotranspiration using novel hybrid machine learning approaches. Hydrol. Sci. J. 2020, 65, 1824–1841. [Google Scholar] [CrossRef] [Scilit]
- Zereg, S.; Belouz, K. Modeling daily reference evapotranspiration using an SVR machine learning algorithm with limited meteorological data. Acta Geophys. 2023, 72, 2009–2023. [Google Scholar] [CrossRef] [Scilit]
- Sharafi, S.; Ghaleni, M.M. Revealing accuracy in climate dynamics: Enhancing evapotranspiration estimation using advanced quantile regression and machine learning models. Appl. Water Sci. 2024, 14, 141. [Google Scholar] [CrossRef] [Scilit]
- Lahkim-Bennani, M.-A.; Bonaccorso, B.; Tribak, A.A.; Rossi, A. Reference evapotranspiration forecasting in the North Etna aquifer: A comparative analysis of statistical, deep learning, and machine learning models. Theor. Appl. Climatol. 2025, 156, 492. [Google Scholar] [CrossRef] [Scilit]
- Považanová, B.; Čistý, M.; Bajtek, Z. Using feature engineering and machine learning in FAO reference evapotranspiration estimation. J. Hydrol. Hydromech. 2023, 71, 425–436. [Google Scholar] [CrossRef] [Scilit]
- Diab Djeffal, I. L’envasement dans les Barrages de l’Algérie. Master’s Thesis, Université Kasdi Merbah Ouargla, Ouargla, Algeria, 2019. Available online: https://dspace.univ-ouargla.dz/jspui/bitstream/123456789/12740/1/123.pdf (accessed on 16 November 2025).
- Bensaoula, F.; Adjim, M. Problématique de l’envasement des barrages (Cas de la Wilaya de Tlemcen). Rev. Sci. L’eau 2008, 21, 365–378. [Google Scholar]
- Henaoui, S.E.A.; Bouazza, M. The current state of the plant diversity in the Tlemcen region (Northwest Algeria). Open J. Ecol. 2012, 2, 244–255. [Google Scholar] [CrossRef]
- Open-Meteocom 2025 Historical Weather, A.P.I. Available online: https://open-meteo.com (accessed on 1 September 2025).
- Prokhorenkova, L.; Gusev, G.; Vorobev, A.; Dorogush, A.V.; Gulin, A. CatBoost: Unbiased boosting with categorical features. Adv. Neural Inf. Process. Syst. 2018, 31, 6638–6648. [Google Scholar]
- Hancock, J.T.; Khoshgoftaar, T.M. CatBoost for big data: An interdisciplinary review. J. Big Data 2020, 7, 94. [Google Scholar] [CrossRef] [Scilit]
- Chen, T.; Guestrin, C. XGBoost: A scalable tree boosting system. In Proceedings of the 22nd ACM SIGKDD International Conference on Knowledge Discovery and Data Mining, San Francisco, CA, USA, 13–17 August 2016; ACM: New York, NY, USA, 2016; pp. 785–794. [Google Scholar] [CrossRef] [Scilit]
- Chen, T.; He, T.; Benesty, M.; Khotimskiy, V.; Tang, Y. XGBoost: Extreme Gradient Boosting, (Version 2.0.0). R Package. CRAN: Vienna, Austria, 2023. Available online: https://cran.r-project.org/web/packages/xgboost/ (accessed on 5 March 2025).
- Breiman, L. Random forests. Mach. Learn. 2001, 45, 5–32. [Google Scholar] [CrossRef] [Scilit]
- Breiman, L.; Friedman, J.H.; Olshen, R.A.; Stone, C.J. Classification and Regression Trees; Chapman and Hall/CRC: New York, NY, USA, 1984. [Google Scholar] [CrossRef] [Scilit]
- Friedman, J.H. Greedy function approximation: A gradient boosting machine. Ann. Stat. 2001, 29, 1189–1232. [Google Scholar] [CrossRef] [Scilit]
- Friedman, J.H.; Hastie, T.; Tibshirani, R. Additive logistic regression: A statistical view of boosting. Ann. Stat. 2000, 28, 337–407. [Google Scholar] [CrossRef]
- Vapnik, V.N. The Nature of Statistical Learning Theory; Springer: New York, NY, USA, 1995. [Google Scholar] [CrossRef] [Scilit]
- Smola, A.J.; Schölkopf, B. A tutorial on support vector regression. Stat. Comput. 2004, 14, 199–222. [Google Scholar] [CrossRef] [Scilit]
- Sharafi, S.; Omidvari, F.; Mottaghi, F. Enhancing the predictive accuracy of daily reference evapotranspiration (ET0) in diverse climates: A comparative analysis of simplified algorithms and model performance. Appl. Water Sci. 2026, 16, 14. [Google Scholar] [CrossRef] [Scilit]

Disclaimer/Publisher’s Note: The statements, opinions and data contained in all publications are solely those of the individual author(s) and contributor(s) and not of MDPI and/or the editor(s). MDPI and/or the editor(s) disclaim responsibility for any injury to people or property resulting from any ideas, methods, instructions or products referred to in the content. |
© 2026 by the authors. Licensee MDPI, Basel, Switzerland. This article is an open access article distributed under the terms and conditions of the Creative Commons Attribution (CC BY) license.