


Abstract
Spectral remote sensing enables efficient acquisition of large-scale land surface information and is a key approach for monitoring soil salinity content (SSC). However, surface mulching significantly alters the spectral reflectance responses of croplands, increasing the uncertainty of SSC retrieval using remote sensing. This study aimed to systematically identify SSC-sensitive spectral features under different mulching conditions and to evaluate the effects of spatial resolution on SSC–spectral relationships. Multi-resolution datasets were constructed based on plastic mulch geometric parameters, and SSC–spectral relationships were analyzed using correlation methods and recursive feature elimination (RFE). Results indicate that under near-ground ultra-high-resolution conditions, the correlation between inter-mulch bare soil spectral features and SSC was weakly influenced by mulch type, and distinguishing mulch types provides limited improvement in inter-variable relationships. Pearson’s r exceeded 0.40 for both white- and black-mulched samples, and distinguishing mulch types provided only marginal gains in model accuracy (RFR–RFE R2 = 0.9524 for white-mulched and 0.9252 without distinguishing; R2 = 0.9387 for black-mulched). In contrast, under multi-resolution settings at the field scale, separating black-mulched, white-mulched, and non-mulched fields significantly enhanced the correlation between spectral indices (SIs) and SSC, with the coefficient of determination (R2) based on the recursive feature elimination (RFE) algorithm increasing by up to 0.28. The highly sensitive SIs of non-mulched farmland are generally consistent with those of white-mulched farmland but differ markedly from those of black-mulched farmland. Scale optimization analysis further indicated that the optimal spatial resolution was 1.35 m for white-mulched and non-mulched farmland. Black-mulched farmland performed best at 5.4 m, likely because stronger spectral masking by black mulch increases mixed-pixel dominance and benefits from spatial aggregation. These findings provide methodological guidance and practical approaches to accurately retrieve SSC in plastic-mulched croplands and to determine the optimal image spatial resolution.
1. Introduction
Soil salinization is one of the major forms of land degradation worldwide [1,2] and can be classified into primary (natural) salinization and secondary (anthropogenic) salinization [3]. Primary salinization develops through long-term climatic, geological, and hydrological processes [4,5]. In contrast, secondary salinization is mainly driven by inappropriate irrigation practices and inefficient water management during agricultural cultivation [6,7]. Plastic film mulching is widely adopted in salt-affected farmlands to increase soil moisture and temperature, reduce salt accumulation, and suppress weed growth, thereby improving crop yield [8]. Nevertheless, mulching alters soil water–salt transport [9,10] and modifies surface spectral reflectance responses, which reduces the accuracy of SSC retrieval methods that rely on bare-soil imagery during mulching periods [11,12].
Plastic film is heterogeneously distributed in mulched farmlands. With decreasing spatial resolution, the proportion of mixed pixels (soil–mulch) increases. Consequently, each pixel contains more complex surface information, and SSC–spectral relationships may change with scale. Previous studies have shown that spectral response of the same target can differ markedly across spatial resolutions [13,14]. However, multi-resolution comparisons of SSC-related spectral responses under different mulch types (e.g., black and white mulch) remain limited. This gap constrains the accuracy and generalization of remote sensing-based soil salinity monitoring in agricultural areas.
Previous studies indicate that SSC and spectral features can exhibit both linear and nonlinear relationships [15,16], and these relationships may change with spatial resolution due to altered spectral patterns in mulched farmland. Feature selection is therefore method-dependent, and relying on a single approach may introduce selection bias. Correlation-based methods (e.g., Pearson, Spearman, and Kendall) are widely used to screen SSC-sensitive features [17,18,19], whereas model-based approaches (e.g., RFE coupled with random forest) can further capture nonlinear effects and variable interactions [20]. Accordingly, when spectral patterns shift across scales, it is necessary to re-examine SSC–spectral relationships and the suitability of different feature selection methods.
To address these issues, we integrate near-ground ultra-high-resolution from controlled experiments with multi-resolution in situ UAV observations and SSC measurements. Specifically, we aim to: (1) quantify how spectral reflectance responses in mulched farmland vary across spatial resolutions; (2) compare the applicability of different feature selection methods for identifying SSC-sensitive spectral features in mulched farmlands; and (3) determine mulch-type-dependent optimal spatial resolutions for SSC retrieval, with the aim of providing methodological references for spectral feature selection and soil salinity monitoring in both mulched and non-mulched farmlands.
2. Materials and Methods
2.1. Study Area Description and Experimental Design
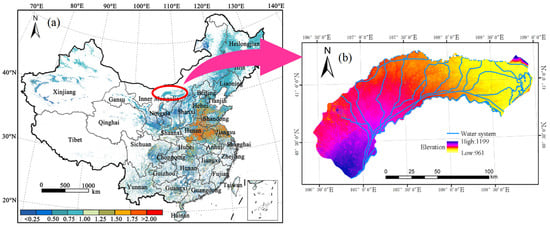
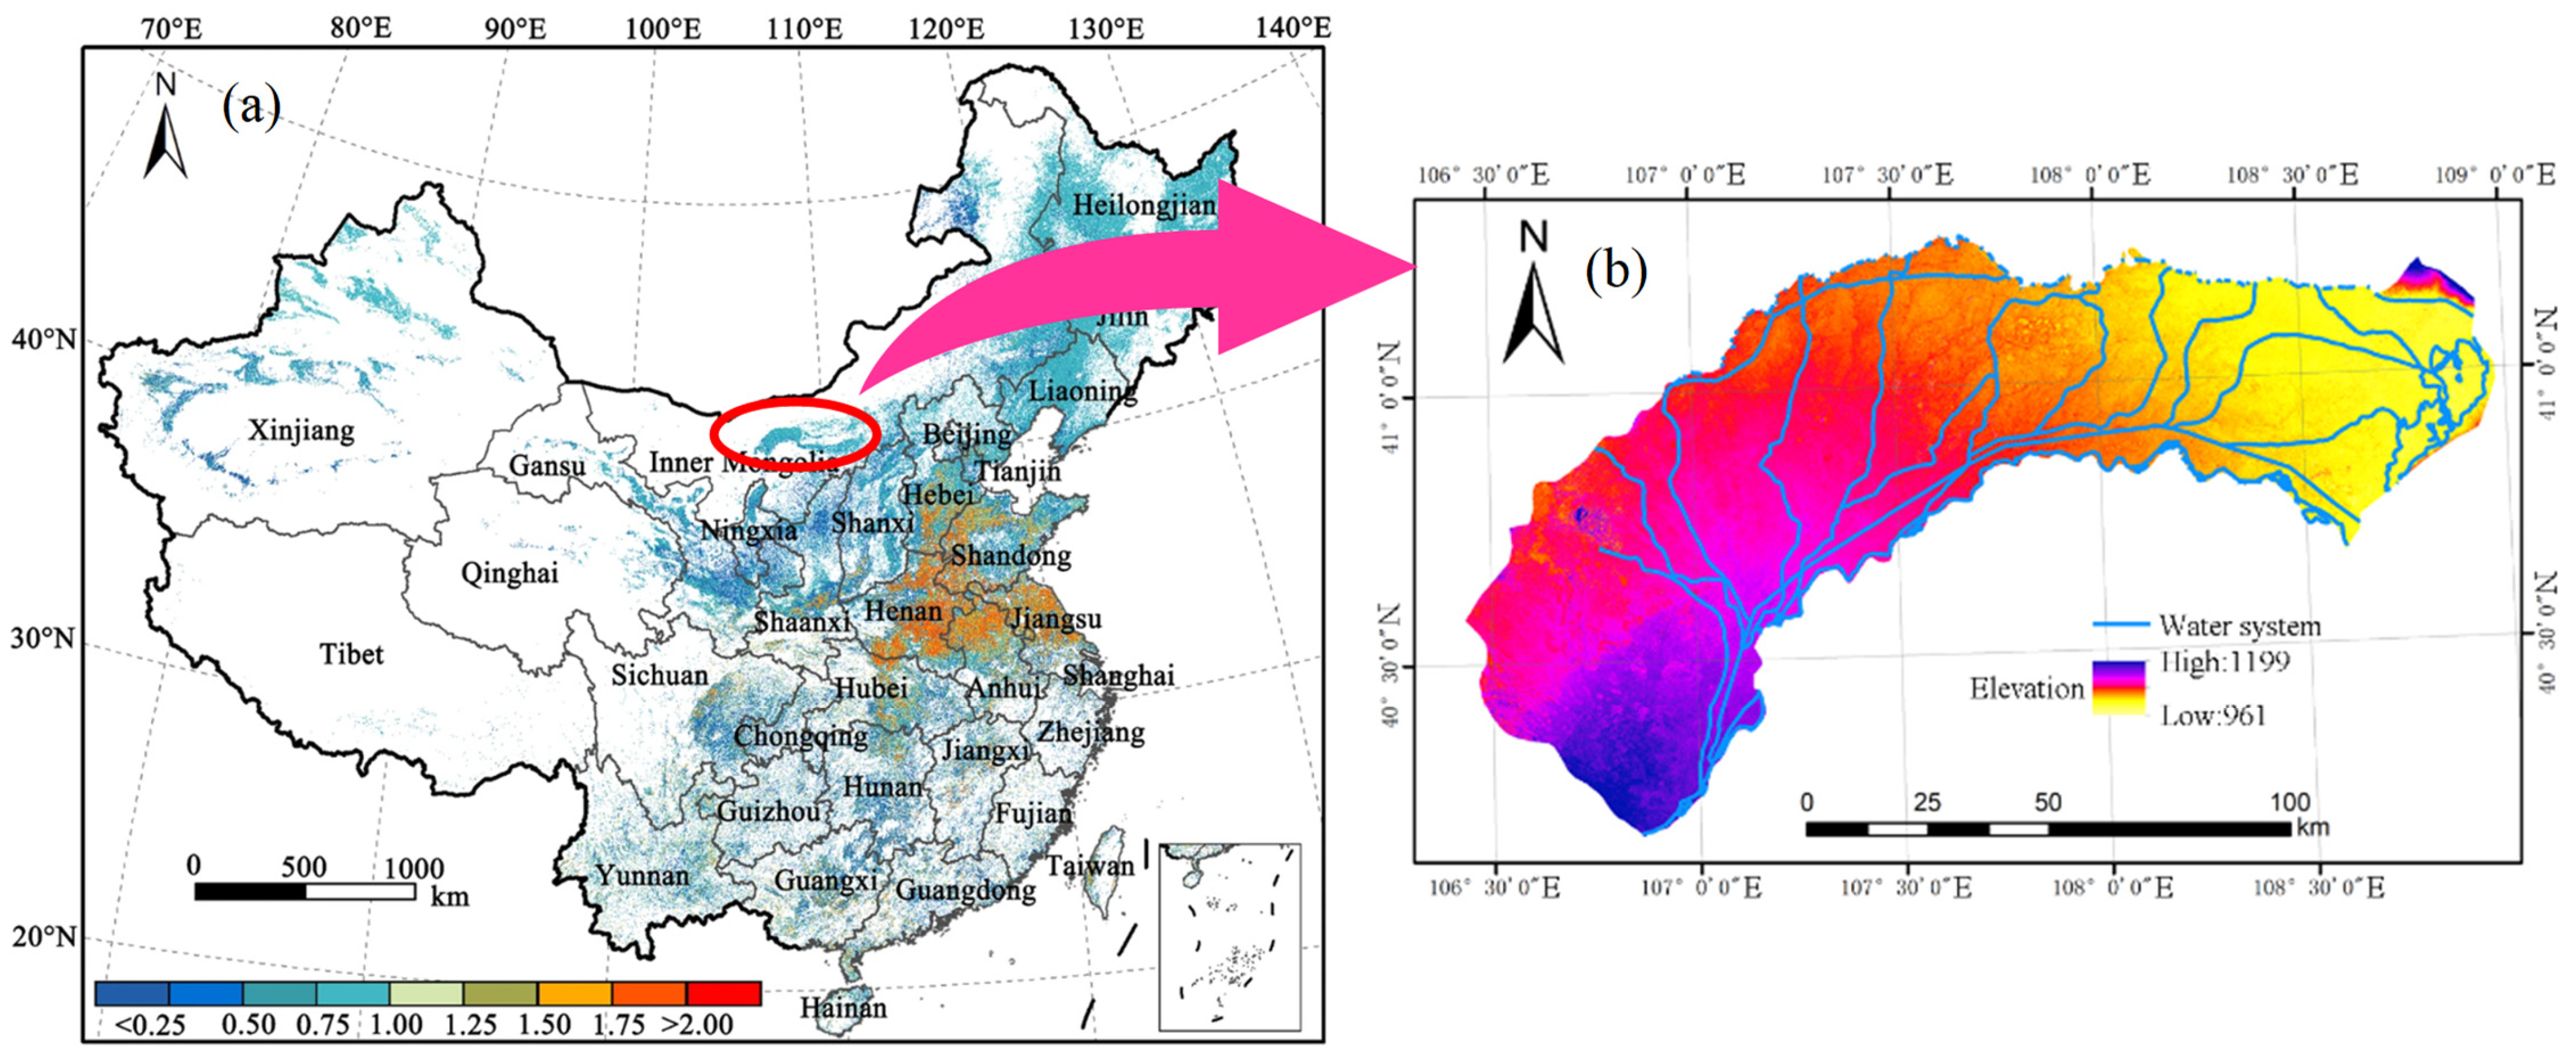
The Hetao Irrigation Area is strongly influenced by its climatic conditions and geographical setting, and agricultural water supply in this region relies entirely on irrigation from the Yellow River. As a result, secondary soil salinization has become a severe and widespread problem. Farmland affected by varying degrees of salinization accounts for approximately two-thirds of the total cultivated area, with lightly, moderately, and severely salinized farmlands comprising 45.5%, 16.0%, and 3.1% of the total area, respectively [15]. To improve crop growing conditions and increase yields, plastic film mulching is widely adopted throughout the irrigation area to enhance soil moisture and temperature, reduce salt accumulation, and suppress weed growth [8,21,22]. According to statistical records, the planting areas of maize and sunflower in this region are approximately 23.5 × 10⁴ ha and 22.9 × 10⁴ ha, respectively, with an annual plastic film consumption reaching 2 × 10⁴ t [23] (Figure 1).
Figure 1.
Research area information: (a) spatial distribution of average arable land intensity in China [24]; (b) digital elevation model (DEM) and water system distribution of the Hetao Irrigation Area.
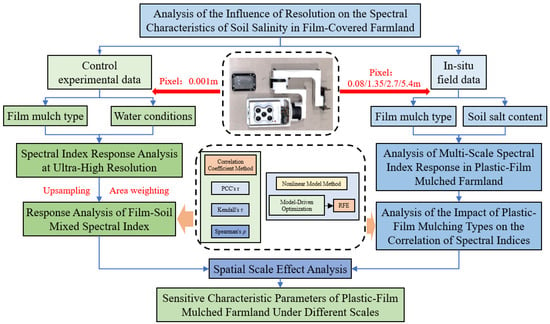
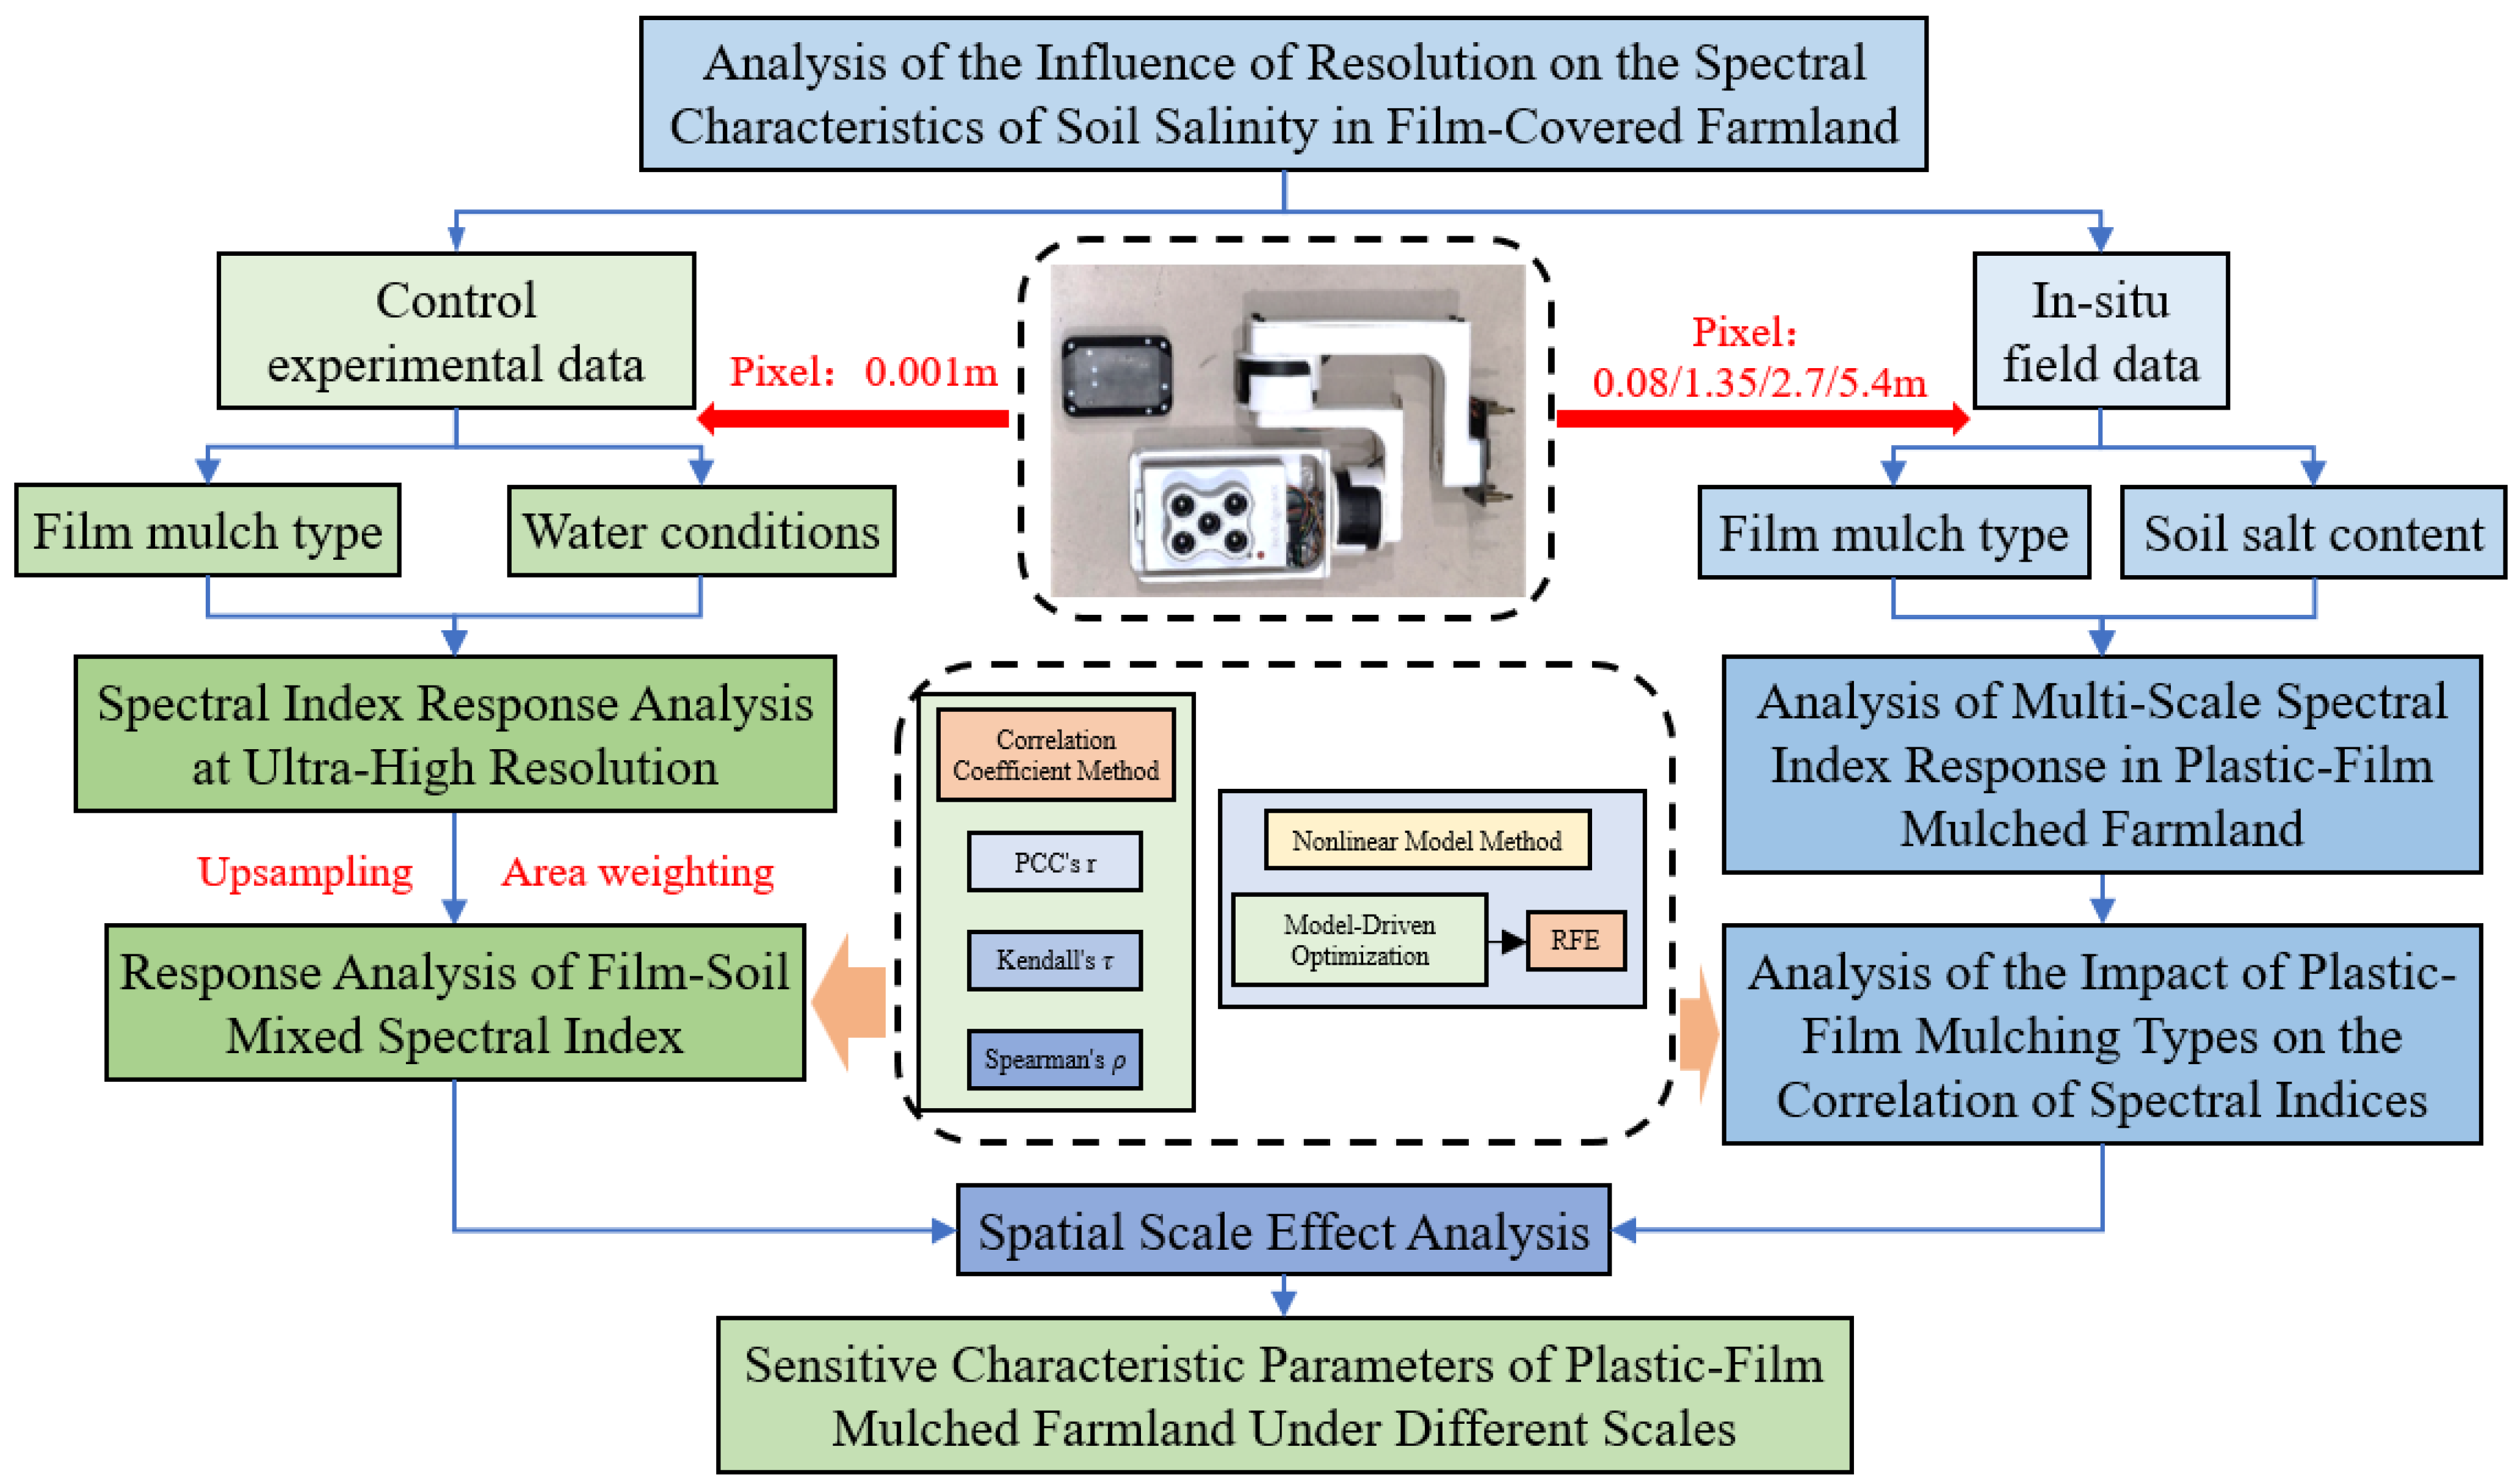
The multiscale analytical framework for spectral responses under plastic mulching is illustrated in Figure 2. First, near-ground ultra-high-resolution spectral data acquired from controlled experiments were used to analyze the sensitivity of SIs for bare soil between mulch strips. An area-weighted method was then applied for spectral mixing and scale upscaling to investigate the spectral responses of mixed pixels. Subsequently, in situ UAV-based remote sensing data were employed to examine the differences in the relationships between spectral features and soil salt content (SSC) across multiple spatial resolutions for farmlands covered with different types of plastic mulch. The influence of mulch type differentiation was further explored, and sensitive spectral parameters under varying spatial scales and environmental conditions were identified through cross-scale comparisons.
Figure 2.
Multiscale analytical framework for spectral responses under plastic mulching.
2.2. Multiscale Remote Sensing and Soil Salt Content Data Acquisition
Based on field investigations and an analysis of irrigation practices in the study area, two sampling periods were determined (Table 1). Ground-based controlled experiments and unmanned aerial vehicle (UAV) surveys were designed to represent small-scale and farmland-scale observations.
Table 1.
Data collection periods for controlled experiments and in situ UAV surveys in agricultural fields.
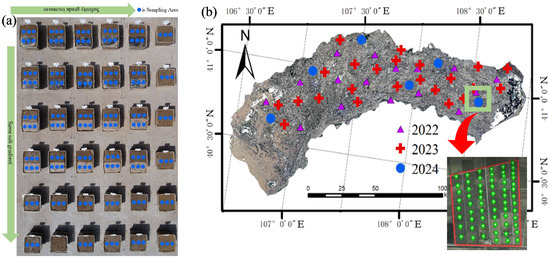
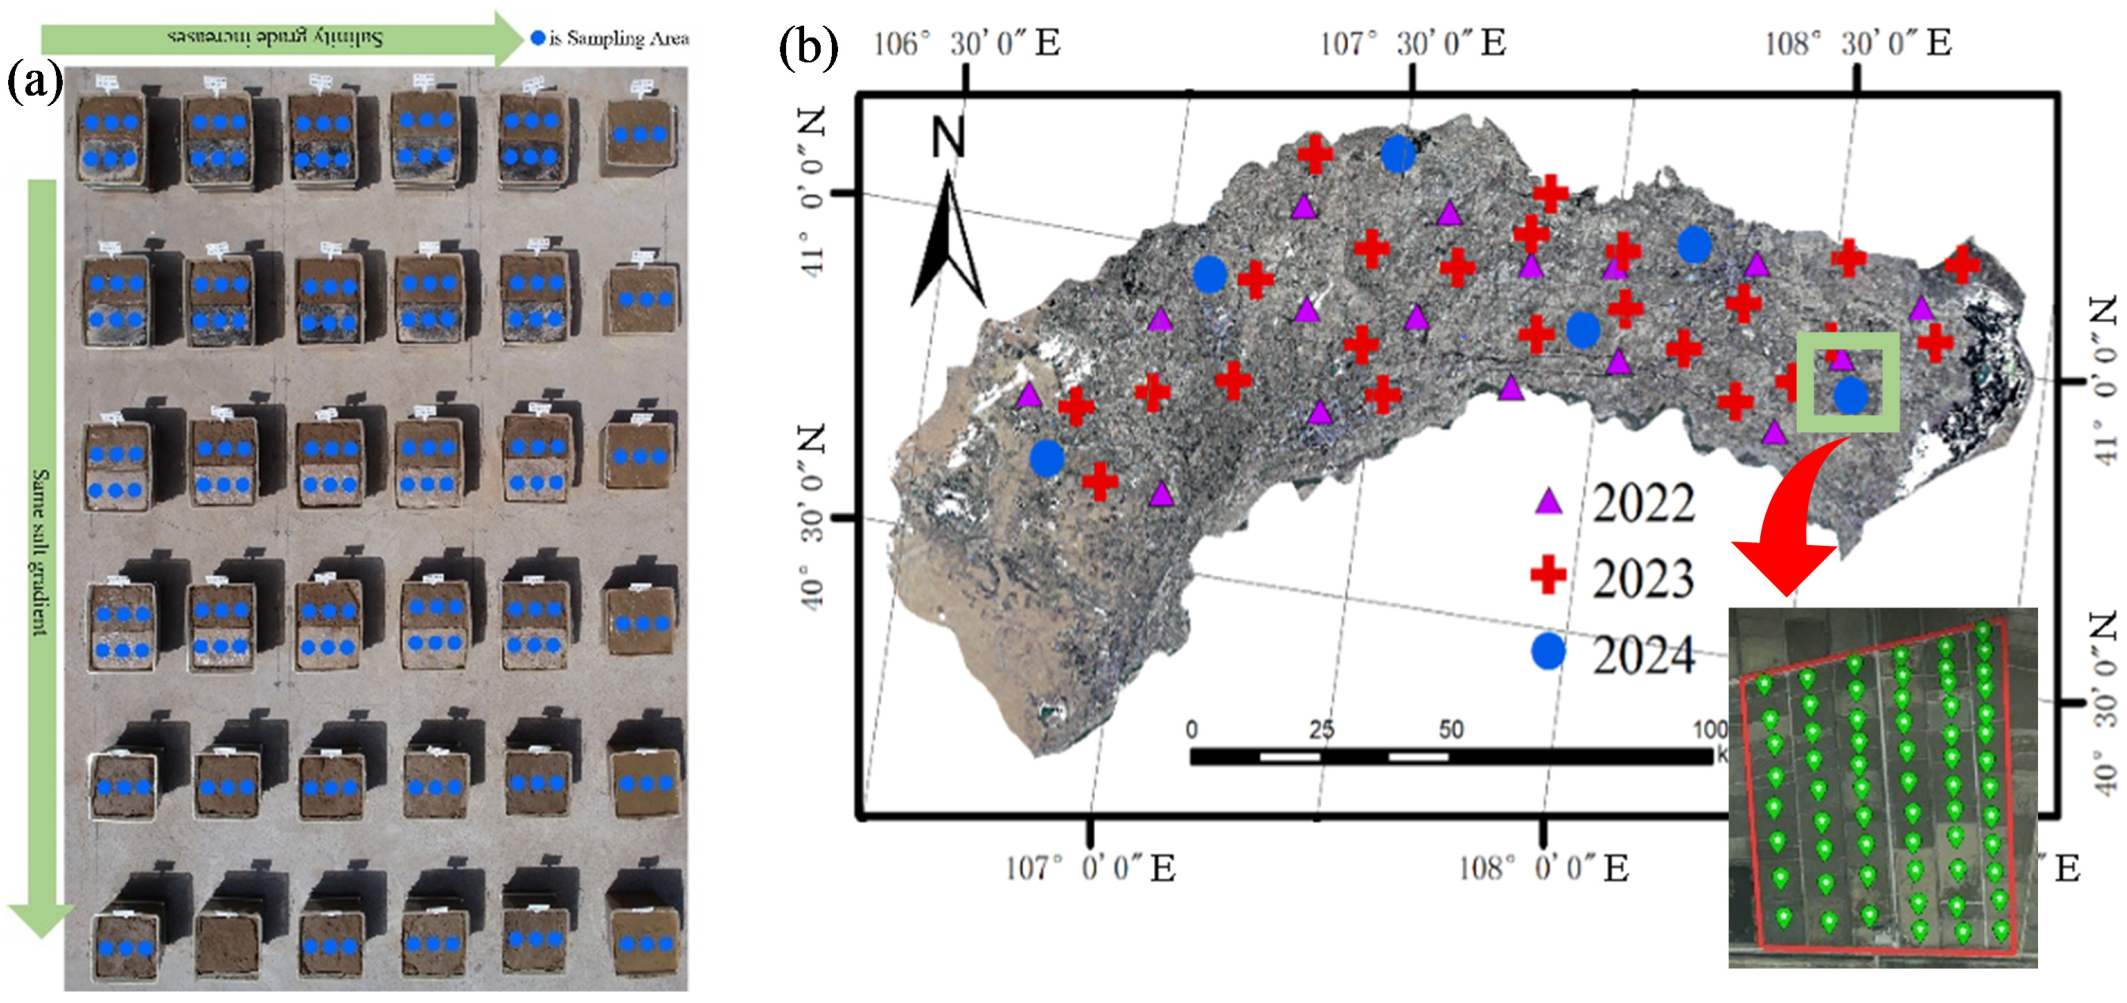
Soil samples used in the ground-based controlled experiments were uniformly collected from the 0–20 cm surface layer of the study area and artificially prepared according to standardized salinity levels. The prepared samples were in a powdered granular form, which differs from the physical condition of actual farmland soils. To better simulate field conditions, the soil samples were first irrigated and allowed to undergo natural evaporation until reaching moisture levels comparable to those of farmland soils, after which plastic film mulching and irrigation were applied. Soil electrical conductivity (EC) was determined using the 1:5 soil–water extraction method, in which soil samples were mixed with distilled water at a soil-to-water ratio of 1:5, thoroughly stirred, allowed to settle, and the electrical conductivity of the supernatant (EC1:5, dS/m) was measured using a conductivity meter. SSC was then estimated using a regionally validated empirical conversion equation between EC and soil salt content, expressed as SSC = 0.2882 × EC1:5 + 0.0183. In the 2023 experiment, five mulched salinity levels were established, and multispectral data were collected under different soil moisture conditions (Figure 3a).
Figure 3.
Experimental setup: (a) salinity gradient arrangement, mulching conditions, and sampling points for the 2023 controlled experiment; (b) in situ UAV flight and sampling configuration during 2022–2023.
UAV-based remote sensing data collection was conducted at the farmland scale. From 2022 to 2024, a total of 45 representative sampling sites were established in the study area, including 16 sites in 2022, 23 sites in 2023, and 6 sites in 2024. Each UAV flight site covered 20–30 sampled fields, within which 30–40 soil sampling points were uniformly distributed (Figure 3b).
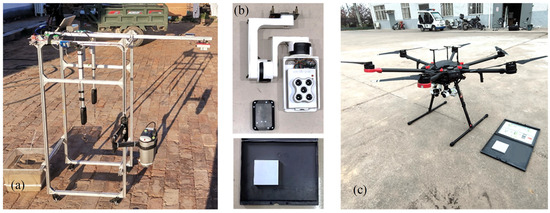
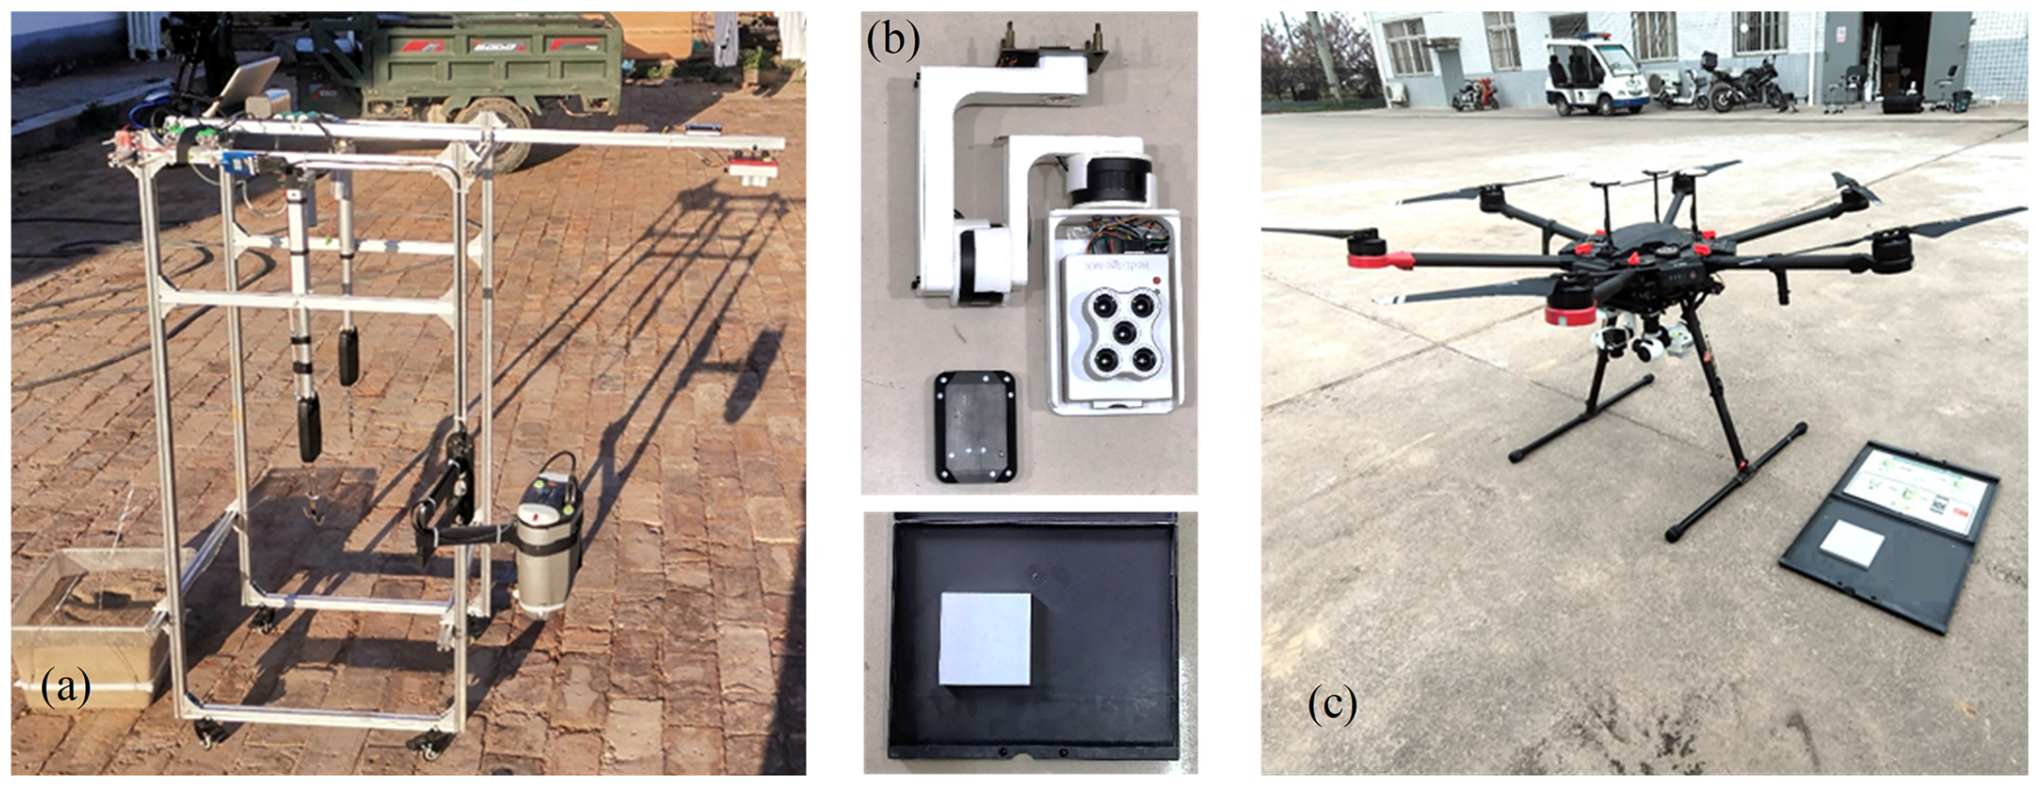
Ground-based remote sensing data were acquired using a self-developed ground object spectral data acquisition system (Figure 4a). The system mainly consisted of a multispectral camera for collecting planar spectral data in five bands (MicaSense RedEdge-MX, Seattle, WA, USA; Figure 4b). To minimize environmental interference, data collection was conducted under clear and cloud-free conditions between 10:30 and 14:00. The multispectral camera was maintained in a horizontal position at a height of 1 m above the soil surface. Prior to data acquisition, calibration panel images were captured for radiometric correction. Orthomosaic images were collected for each plot and the surrounding inter-plot areas to increase image overlap for subsequent mosaicking. Based on the camera field-of-view parameters, the forward and side overlap rates were set to 70% and 60%, respectively. Individual images were radiometrically calibrated, georeferenced, and mosaicked using Python (3.8.6) and the GDAL library.
Figure 4.
Remote sensing data acquisition systems: (a) ground-based spectral data acquisition system; (b) multispectral camera system; (c) UAV-based integrated (“three-in-one”) remote sensing system.
UAV remote sensing data were collected using a self-developed integrated UAV “three-in-one” remote sensing system (Figure 4c). The flight platform was a DJI M600 Pro equipped with the same multispectral camera system as the ground-based setup (Figure 4b), including a RedEdge-MX multispectral camera, a DLS2 downwelling light sensor (MicaSense, Inc., Seattle, WA, USA), and a stabilized gimbal. UAV data acquisition was also conducted under clear and cloud-free conditions between 10:30 and 14:00. Flight routes were planned using DJI GS Pro software (v2.0.17), with a flight altitude of 100 m and forward and side overlap rates set to 88% and 84%, respectively. Before each flight, calibration panel images were captured for radiometric correction to ensure data consistency. At a flight altitude of 100 m, the spatial resolution of the imagery was approximately 8 cm per pixel. Each flight lasted 20–25 min and covered an operational area of approximately 150 mu. Three ground control points (2 × 2 m) were deployed within each data acquisition area, and their center coordinates were measured using real-time kinematic (RTK) positioning to improve the geometric accuracy of UAV image mosaicking.
2.3. Simulation of Soil–Mulch Mixed Pixels and Construction of Spectral Indices
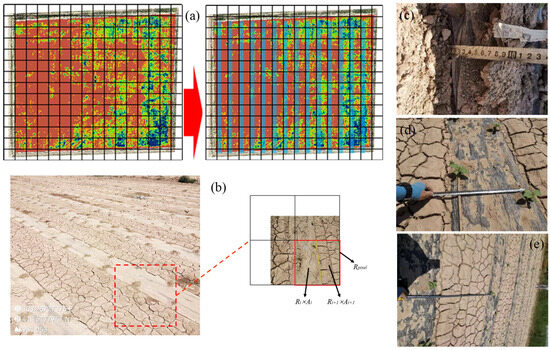
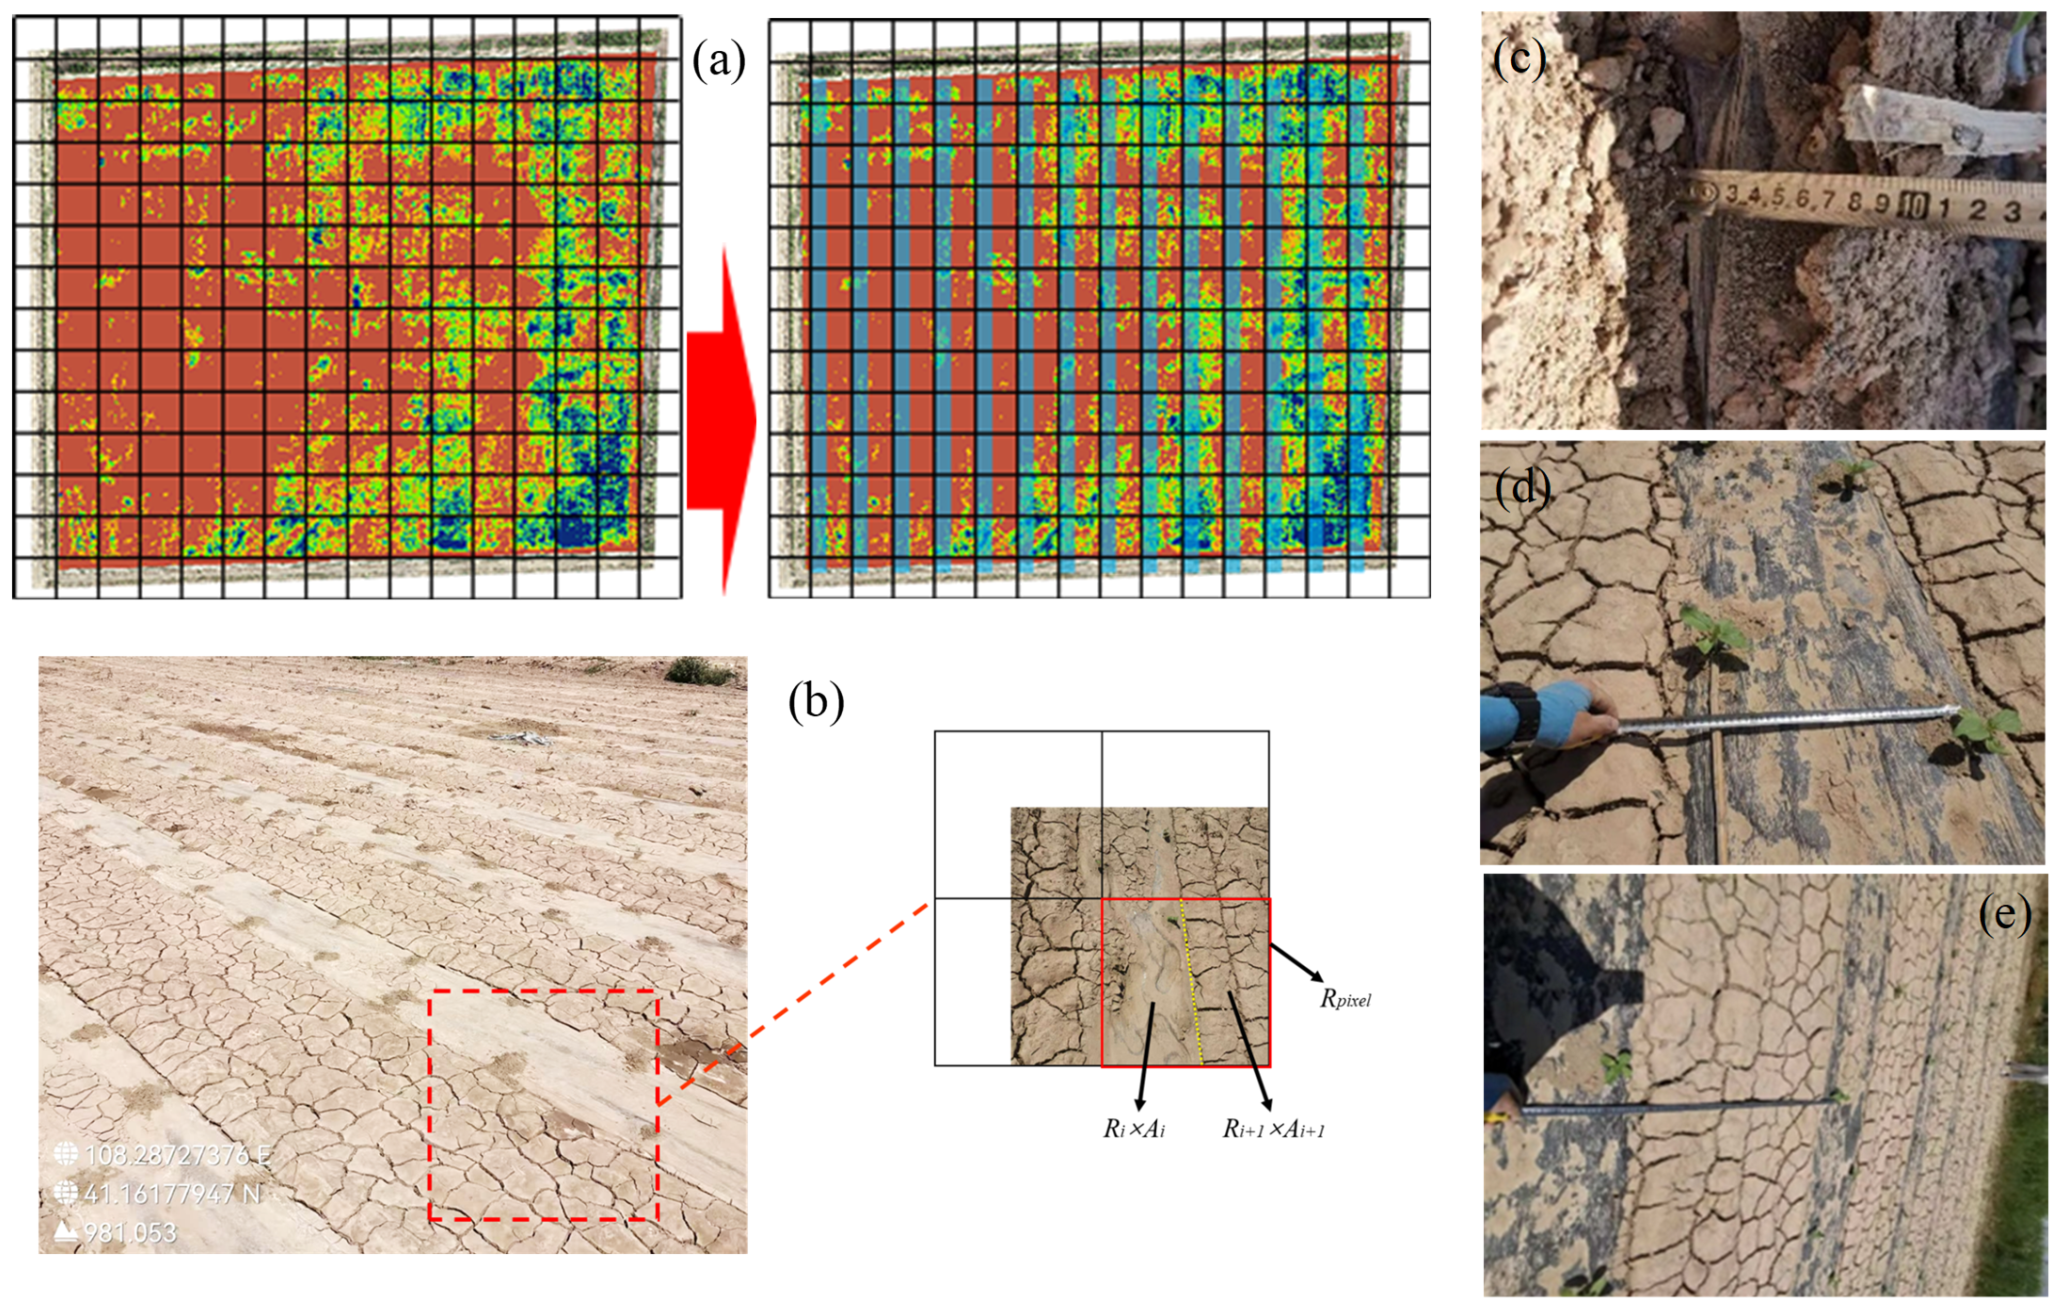
Plastic mulch in agricultural fields is typically arranged in a relatively regular and spatially structured pattern at fine scales, and its reflectance within individual mulch strips tends to be locally consistent [25] (Figure 5a). Nevertheless, changes in spatial resolution can substantially alter the proportion of soil–mulch mixed pixels within the sensor footprint. The phenomenon of “mixed pixels” is ubiquitous in large-scale remote sensing observations (Figure 5b). The reflectance recorded by a single sensor pixel can therefore be approximated as the area-weighted contribution of different land-cover components within the pixel [26,27], which is expressed as a first-order linear areal mixing model (Equation (1)). It should be noted that this formulation represents a simplified approximation for scale-related analysis and does not explicitly account for potential nonlinear radiative interactions such as transmission through semi-transparent mulch, internal reflections, or adjacency effects.
where Rpixel denotes the pixel reflectance, Ri represents the reflectance of the i land-cover component, Ai is the proportion of the area occupied by the i component within the pixel (Ai ∈ [0, 1]), and ΣAi = 1.
Figure 5.
Schematic diagram of mixed pixels: (a) effects of uniformly distributed objects on spectral responses; (b) mixed-pixel structure in mulched farmland; (c–e) schematic illustrations of plastic mulch geometric parameters, including burial depth, exposed film width, and inter-row bare soil width. The red dashed box in (a) marks the area enlarged in (b), and the red box in (b) indicates the region selected for detailed analysis.
The study area is dominated by maize and sunflower cultivation, accounting for approximately 76% of the total cultivated area [15,28]. Field measurements indicate that both crops employ plastic mulch with a width of 70 cm (black or white film), with the film edges buried to a depth of 10 cm. The exposed film width at the surface is 45 cm, while the inter-row bare soil width is 90 cm, corresponding to a bare soil-to-exposed film width ratio of 2:1. In large-scale remote sensing observations, as the pixel footprint increases, the area ratio of bare soil to plastic mulch within a pixel tends to approach this 2:1 proportion. Based on this geometric relationship, spectral data of bare soil and plastic mulch obtained from mulched soil samples were combined using an area-weighted approach to construct a soil–mulch mixed spectral dataset. This dataset was used to simulate the spectral responses of mixed pixels in large-scale remote sensing, thereby supporting subsequent UAV- and satellite-based soil salinity monitoring.
Previous studies have demonstrated that various salinity indices exhibit strong correlations with soil salt content (SSC) [24,29]. Accordingly, based on reflectance data from five spectral bands (blue, green, red, red edge, and near-infrared) acquired by the RedEdge camera, this study constructed 11 salinity indices (SI1–SI9, the normalized difference salinity index (NDSI), and the canopy response salinity index (CRSI)) for estimation modeling. The mathematical formulations of these indices are summarized in Table 2. Spectral indices were calculated by applying band operations to the mean reflectance values within a 2 × 2 pixel window (for each spatial resolution) centered on each sampling location, corresponding to the coordinates at which soil samples were collected. It should be noted that the physical ground area represented by this window varies with spatial resolution. This is consistent with the objective of our study, which is to investigate how spectral reflectance and SSC–spectral relationships change under realistic resolution variations.
Table 2.
Spectral indices used in this study.
Based on data sources and whether plastic mulch types were distinguished, the spectral feature datasets were divided into two categories. The first category comprised controlled experiment datasets, including bare-soil areas of white-mulched soil samples (B_L), bare-soil areas of black-mulched soil samples (H_L), bare-soil areas of mixed mulched soil samples (B+H_L), white mulch–soil mixed spectra (B+L), and black mulch–soil mixed spectra (H+L). The second category consisted of in situ field datasets, including non-mulched farmlands (L), black-mulched farmlands (H), white-mulched farmlands (B), and aggregated farmland data without distinguishing mulch types (W).
2.4. Feature Selection Methods for Soil Salt Content Estimation
Both correlation-based methods and nonlinear variable selection algorithms were employed for feature selection in SSC estimation for mulched farmlands. Correlation-based methods include the Pearson correlation coefficient (PCC’s r), Kendall’s τ, and Spearman’s ρ [36,37,38]. PCC’s r was used to characterize linear associations between SSC and spectral variables, whereas Spearman’s ρ and Kendall’s τ were used as nonparametric rank-based measures to assess monotonic relationships that may not be strictly linear. The closer the absolute value of the correlation coefficient is to 1, the stronger the association between variables. Statistical significance was evaluated using p < 0.05.
In addition to correlation-based methods, RFE algorithms were applied to capture nonlinear relationships and potential interactions among variables [39,40,41]. Specifically, we adopted an RFR–RFE model based on random forest regression [42,43], which can model nonlinear response patterns without requiring a predefined functional form. Using correlation methods and RFR–RFE in parallel allowed us to compare SSC-sensitive features identified under linear/monotonic assumptions versus those supported by nonlinear model learning. The dataset was randomly divided into three independent folds; in each iteration, two folds were used as the training set and one fold as the validation set. This procedure was repeated three times, and the final results were reported as the average performance across the three folds. Model performance was assessed using the coefficient of determination (R2) and the root mean square error (RMSE), which are calculated as follows:
where yi represents the observed value of the i sample, ŷ denotes the predicted value, ȳ is the mean of the observed values, and n is the number of samples.
3. Results and Discussion
3.1. Spectral Sensitivity Analysis at Ultra-High Spatial Resolution
3.1.1. Correlation Analysis Between Spectral Indices and Soil Salt Content in Non-Mulched Areas
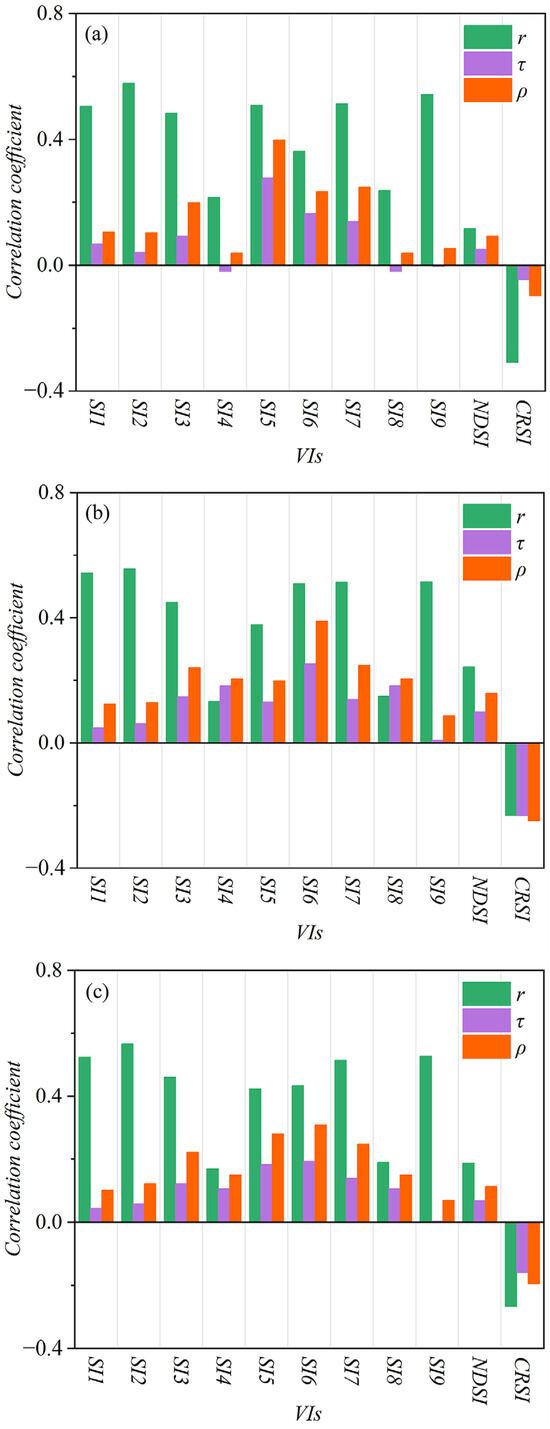
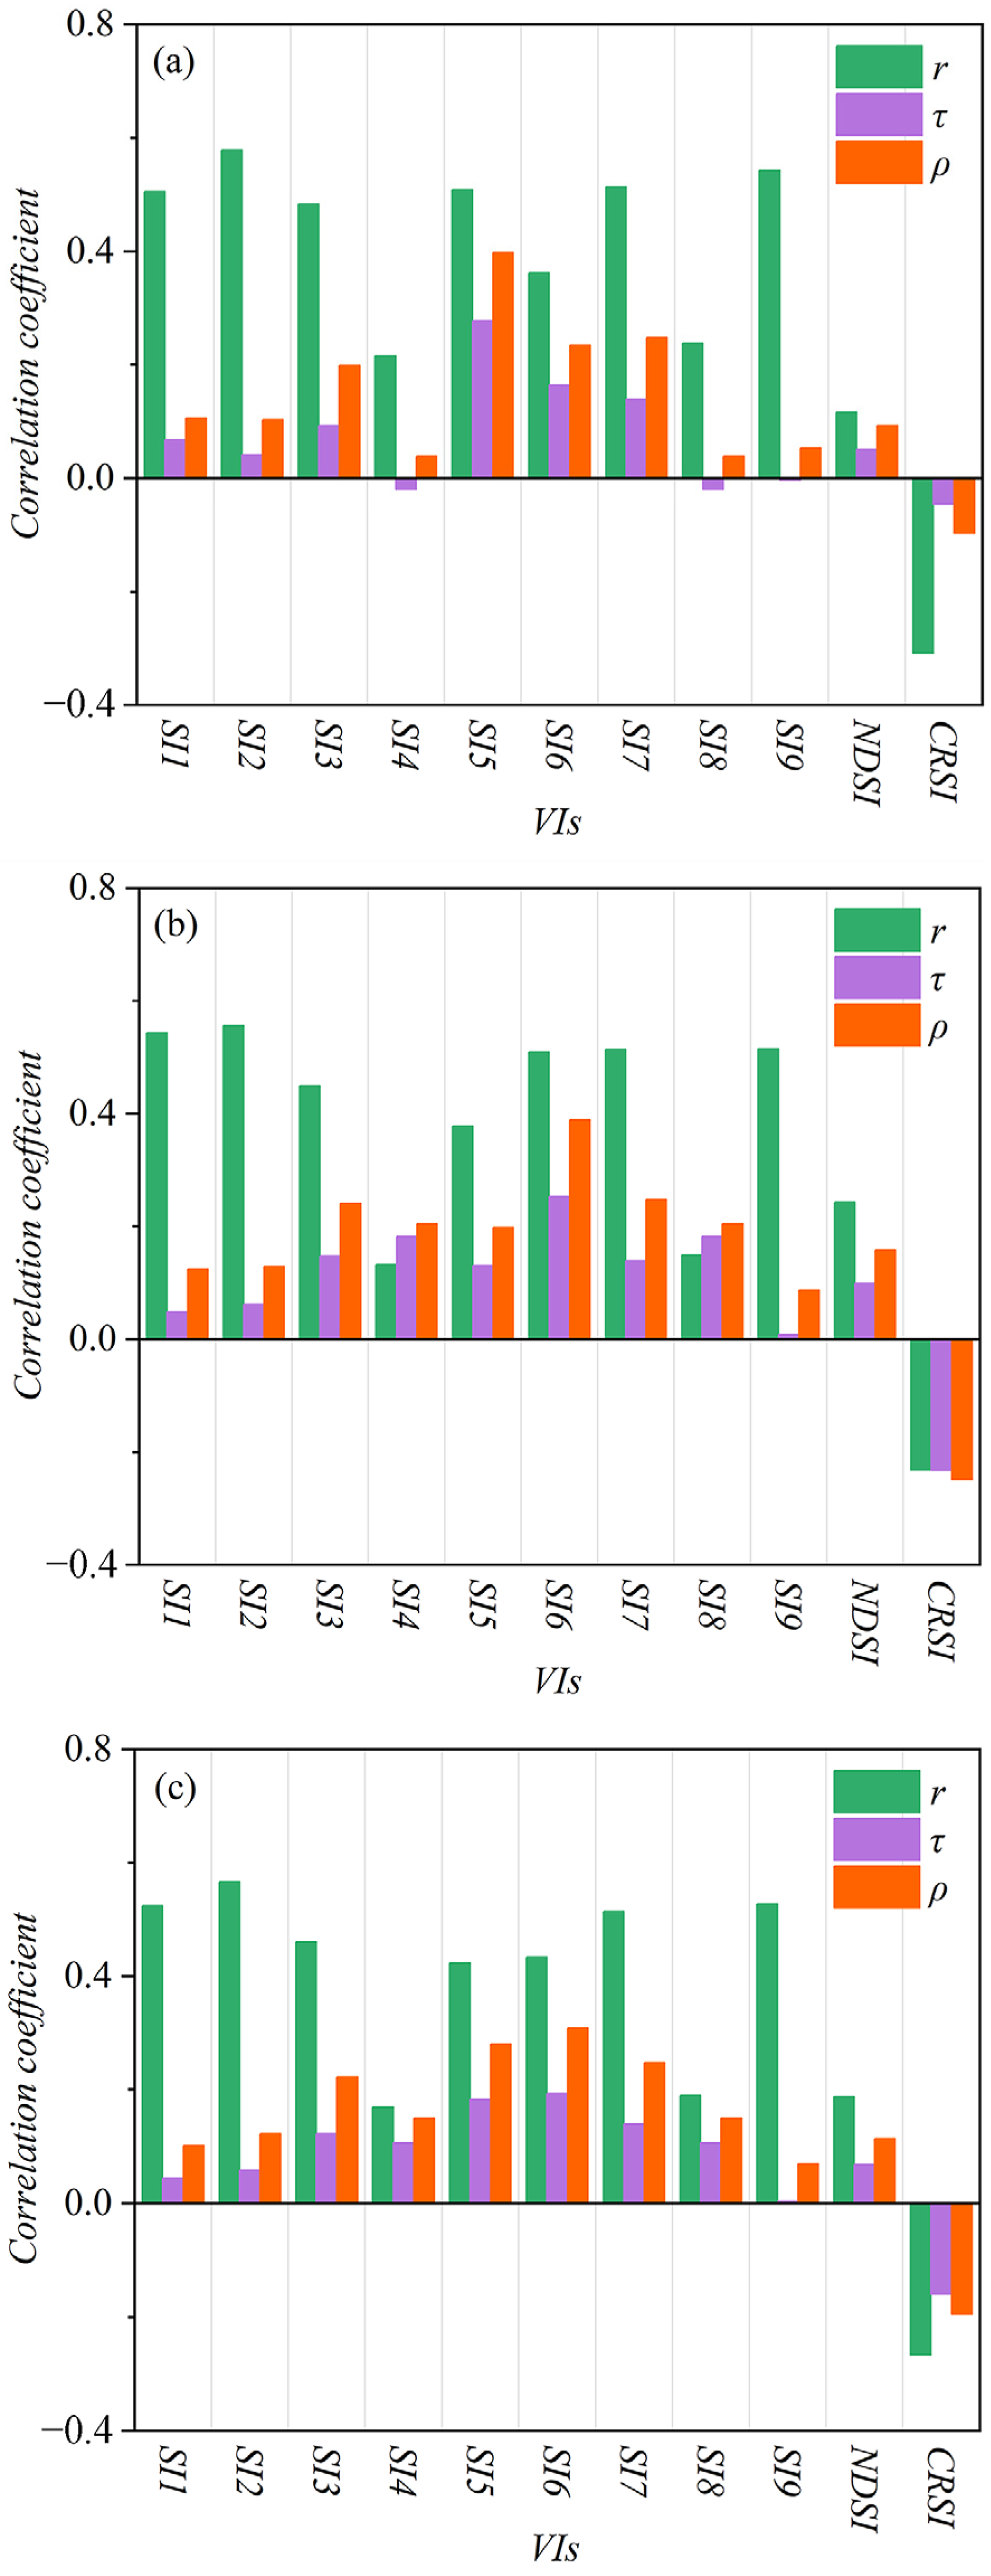
The analysis of non-mulched areas in white-mulched soil samples (Figure 6a) revealed noticeable differences among the three correlation coefficient methods. Pearson’s correlation coefficient yielded the highest variable correlations, with six spectral indices exhibiting correlation coefficients exceeding 0.4. For the same index, the overall magnitude of correlation coefficients followed the trend: PCC’s r > Spearman’s ρ > Kendall’s τ. Moreover, the most strongly correlated features identified varied across methods. Results for non-mulched areas in black-mulched soil samples were similar to those observed for white-mulched samples (Figure 6b), with most indices showing positive correlations, except for CRSI, which exhibited a negative correlation. Under the PCC’s r method, the majority of indices again showed the strongest correlations. Consistent with the B_L dataset, six indices (SI1, SI2, SI3, SI6, SI7, and SI9) displayed correlation coefficients greater than 0.4 under PCC’s r, indicating that they are stable variables for estimating SSC across different mulching types at ultra-high spatial resolution. After merging data from both mulch types (Figure 6c), the correlation characteristics derived from PCC’s r remained unchanged and were still notably higher than those obtained using the other two methods. Compared with datasets that distinguished mulch types, no significant improvement in correlation strength was observed for Kendall’s τ or Spearman’s ρ.
Figure 6.
Correlation coefficients between spectral indices and soil salt content (SSC) for inter-mulch bare soil at near-ground ultra-high spatial resolution: (a) non-mulched areas of white-mulched soil samples; (b) non-mulched areas of black-mulched soil samples; (c) inter-mulch bare soil areas without distinguishing mulch types.
These results indicate that the PCC’s r exhibited stronger sensitivity in quantifying linear SSC–spectral relationships compared with Spearman’s ρ and Kendall’s τ. It should be noted that Spearman’s ρ and Kendall’s τ are nonparametric, rank-based measures that can be applied to continuous variables and are particularly suitable for assessing monotonic relationships [44,45]. In contrast, PCC’s r is commonly used to quantify linear associations between variables [46]. Given that the objective of this analysis was to evaluate linear SSC–spectral relationships across spatial scales, PCC’s r was considered appropriate for this comparison. Nevertheless, the correlation coefficients obtained using PCC’s r in this experiment did not exceed 0.6, suggesting potential instability. This may be attributed to the experimental gradient design and the relatively limited sample size [47].
Therefore, when monitoring SSC in non-mulched areas of mulched farmlands, the presence of plastic mulch does not eliminate the linear relationship between soil salinity and spectral responses. Salts themselves exhibit no distinct absorption features in the visible–near-infrared–shortwave-infrared (VIS–NIR–SWIR; approximately 350–2500 nm) range and instead indirectly influence spectral responses by altering the physicochemical properties of soils [48], thereby enabling linear relationships between soil salinity and remote sensing spectral features [49]. In the continuous visible (VIS) to near-infrared (NIR) spectral range—particularly in the red to red-edge region (600–800 nm)—soil reflectance is commonly positively and linearly correlated with salinity [50]. Moreover, as soil salinity increases, surface crusting becomes more pronounced, and the salt-induced whitening effect renders the soil surface smoother and brighter, resulting in higher reflectance [51]. Given the linear relationship between soil salinity and spectral reflectance, spectral features selected using the PCC’s r method can be effectively applied to SSC monitoring [52].
3.1.2. Nonlinear Analysis Between Spectral Indices and Soil Salt Content in Non-Mulched Areas
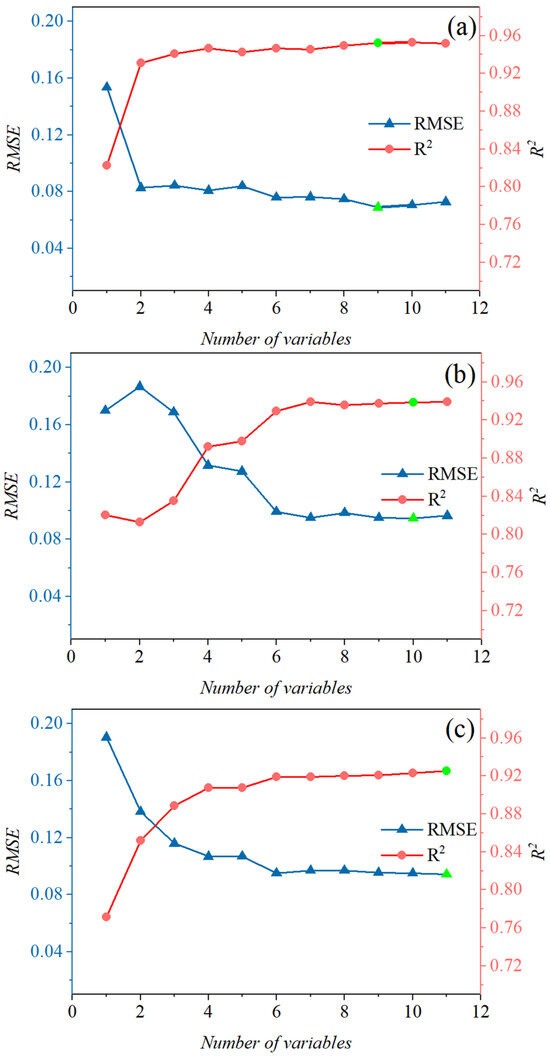
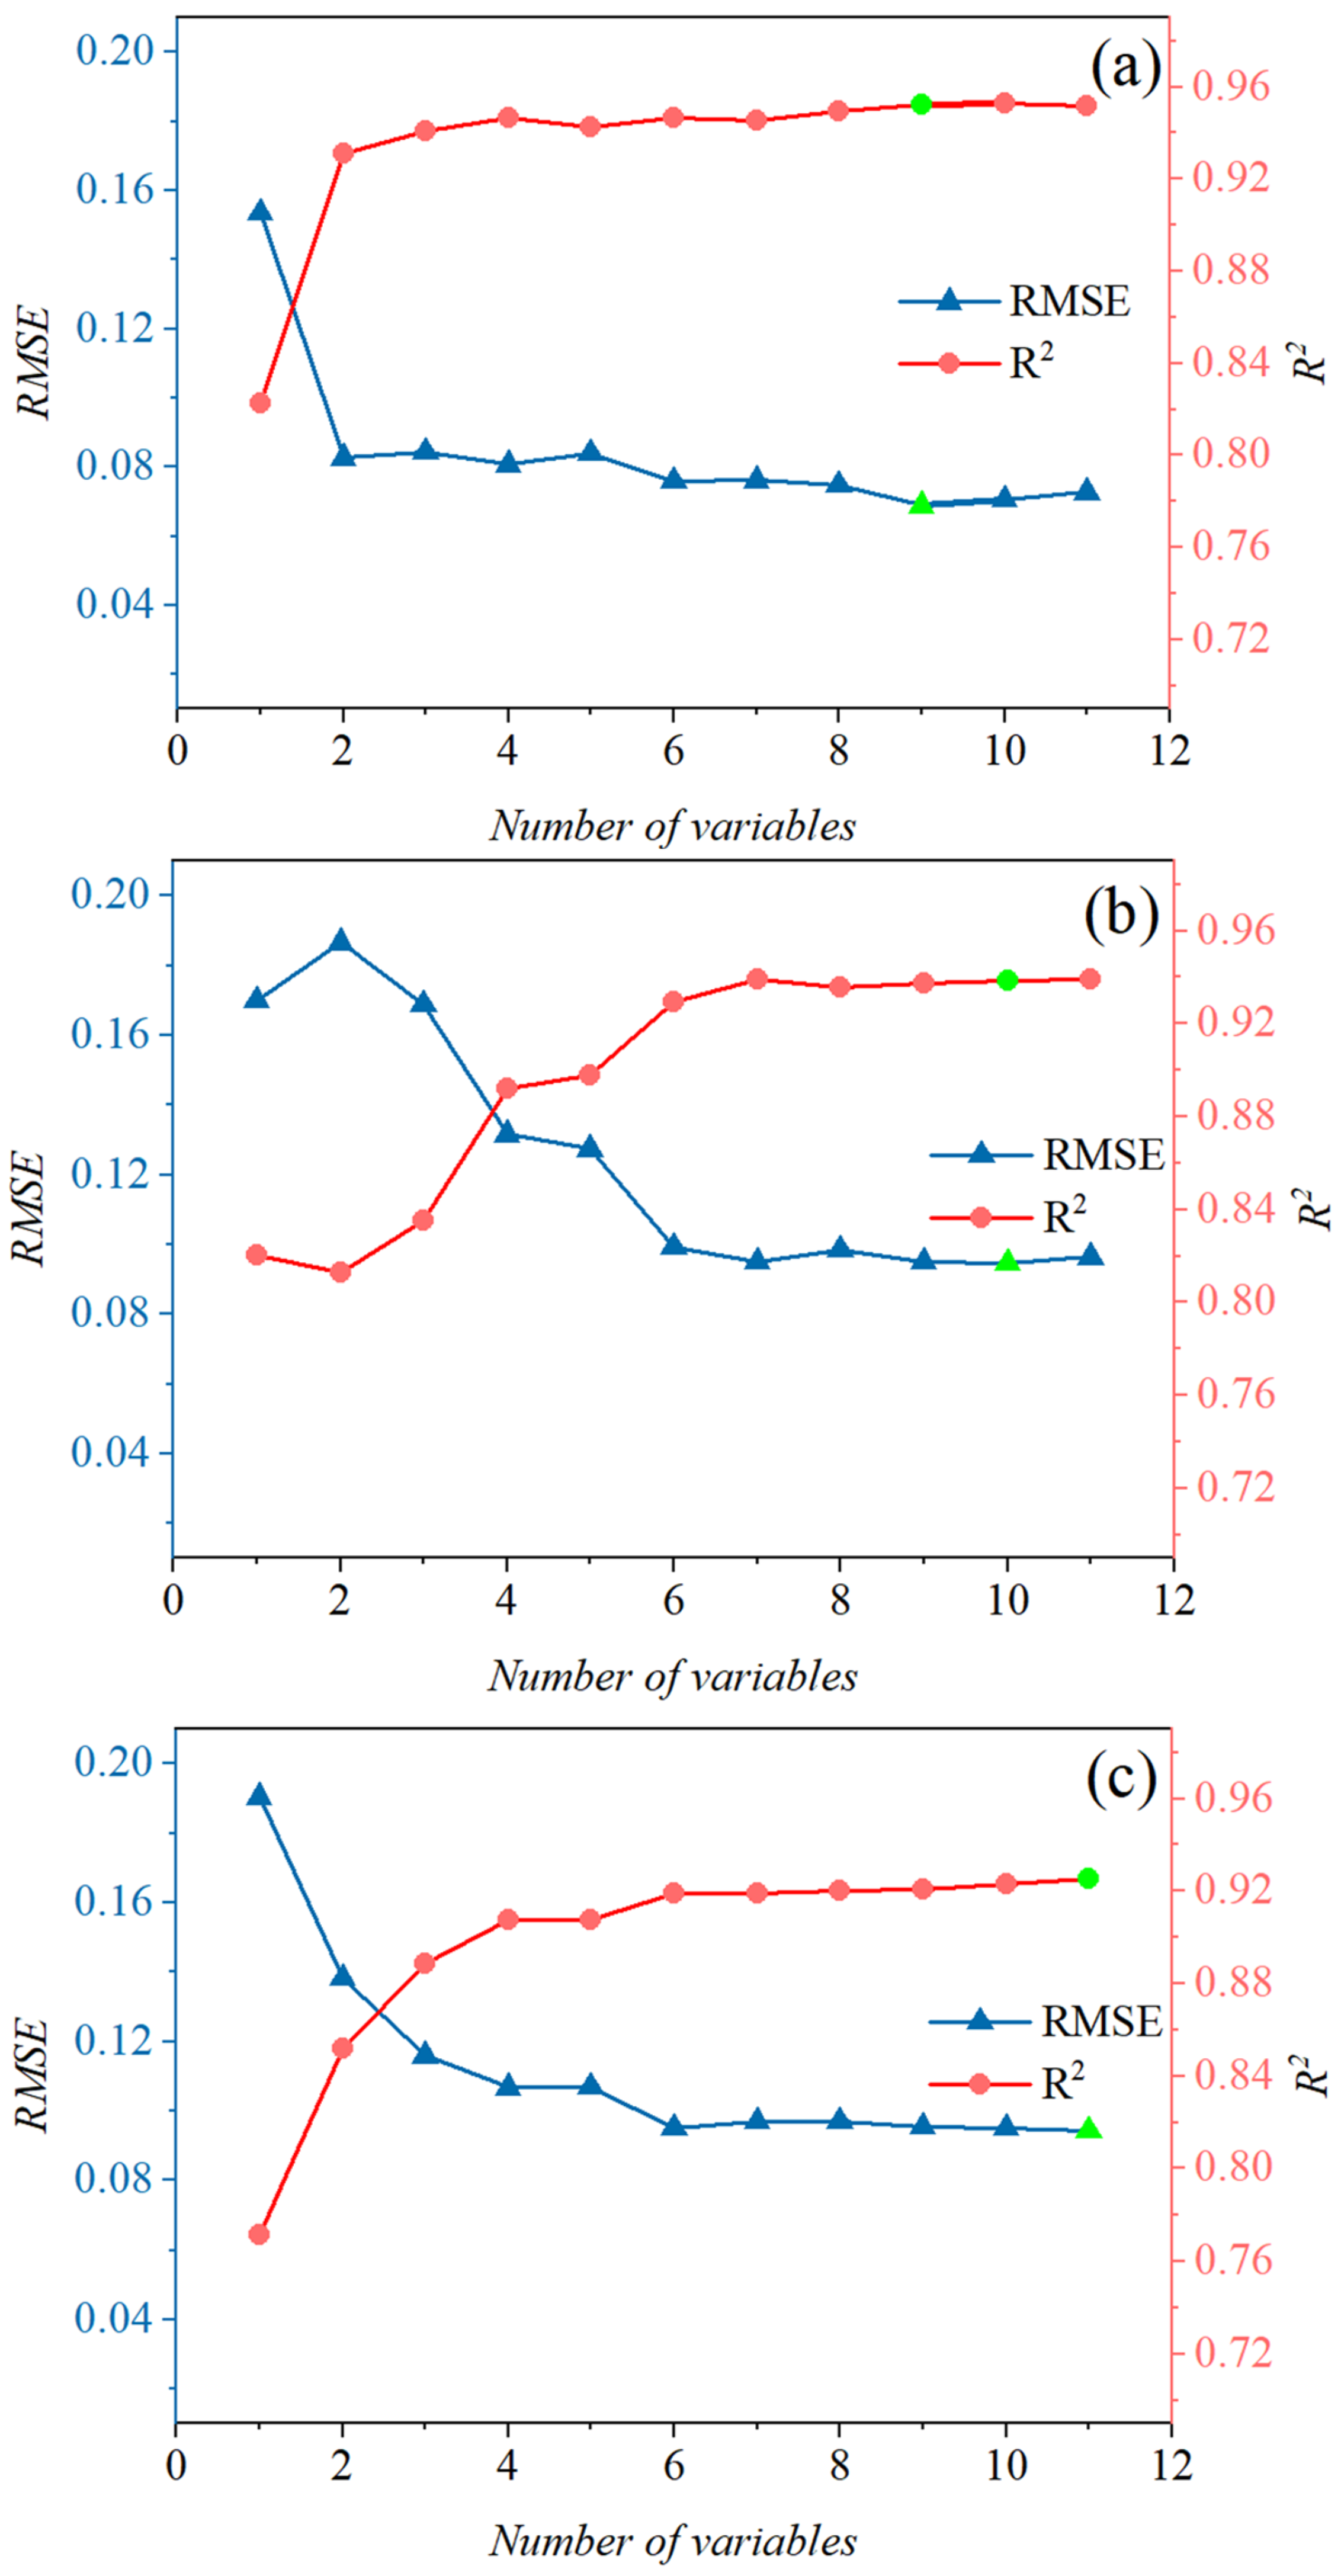
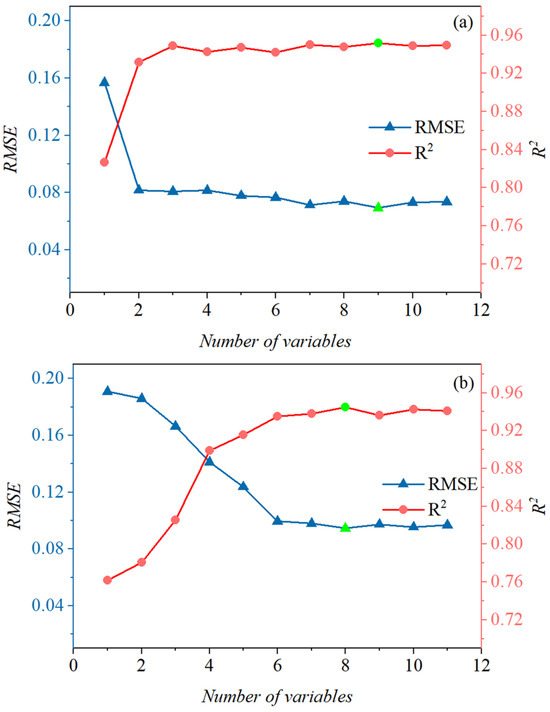
The RFR–RFE algorithm was applied to analyze non-mulched areas of mulched soil samples, and the results are presented in Table 3. Although distinguishing mulch types reduced the number of selected variables, it provided only marginal improvements in model accuracy, which is consistent with the conclusions drawn from the PCC’s r analysis. The performance of RFR–RFE was sensitive to the number of features, indicating that a larger number of variables does not necessarily lead to better model performance (Figure 7). For all groups, model accuracy exhibited a fluctuating upward trend with increasing feature numbers; however, once the optimal feature combination was reached, further inclusion of variables could result in decreased accuracy or overfitting [53].
Table 3.
Optimal feature combinations for inter-mulch bare soil areas.
Figure 7.
Variation in RFR–RFE model accuracy with the number of selected features for inter-mulch bare soil areas: (a) white-mulched soil samples; (b) black-mulched soil samples; (c) mixed mulched soil samples. Note: The unit of RMSE is the same as that of SSC, expressed as soil salt content percentage on a mass basis (% w/w). Green dots indicate the optimal R2 and RMSE values.
Although different types of plastic mulch exhibit distinct radiative properties [54], and thermal differences can influence water-mediated salt transport [55], thereby altering the strength of spectral correlations [56], the impacts of different mulch types on surface soil hydraulic properties are relatively limited [57]. Soil hydraulic characteristics, such as saturated hydraulic conductivity and capillary action, primarily govern soil water movement and distribution [58]. Consequently, variations in mulch type exert only a minor influence on spectral features used for SSC estimation in inter-mulch bare soil areas.
3.1.3. Nonlinear Analysis Between Soil–Mulch Mixed Spectra and Soil Salt Content
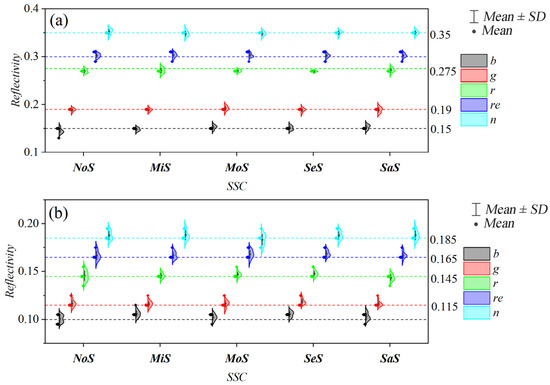
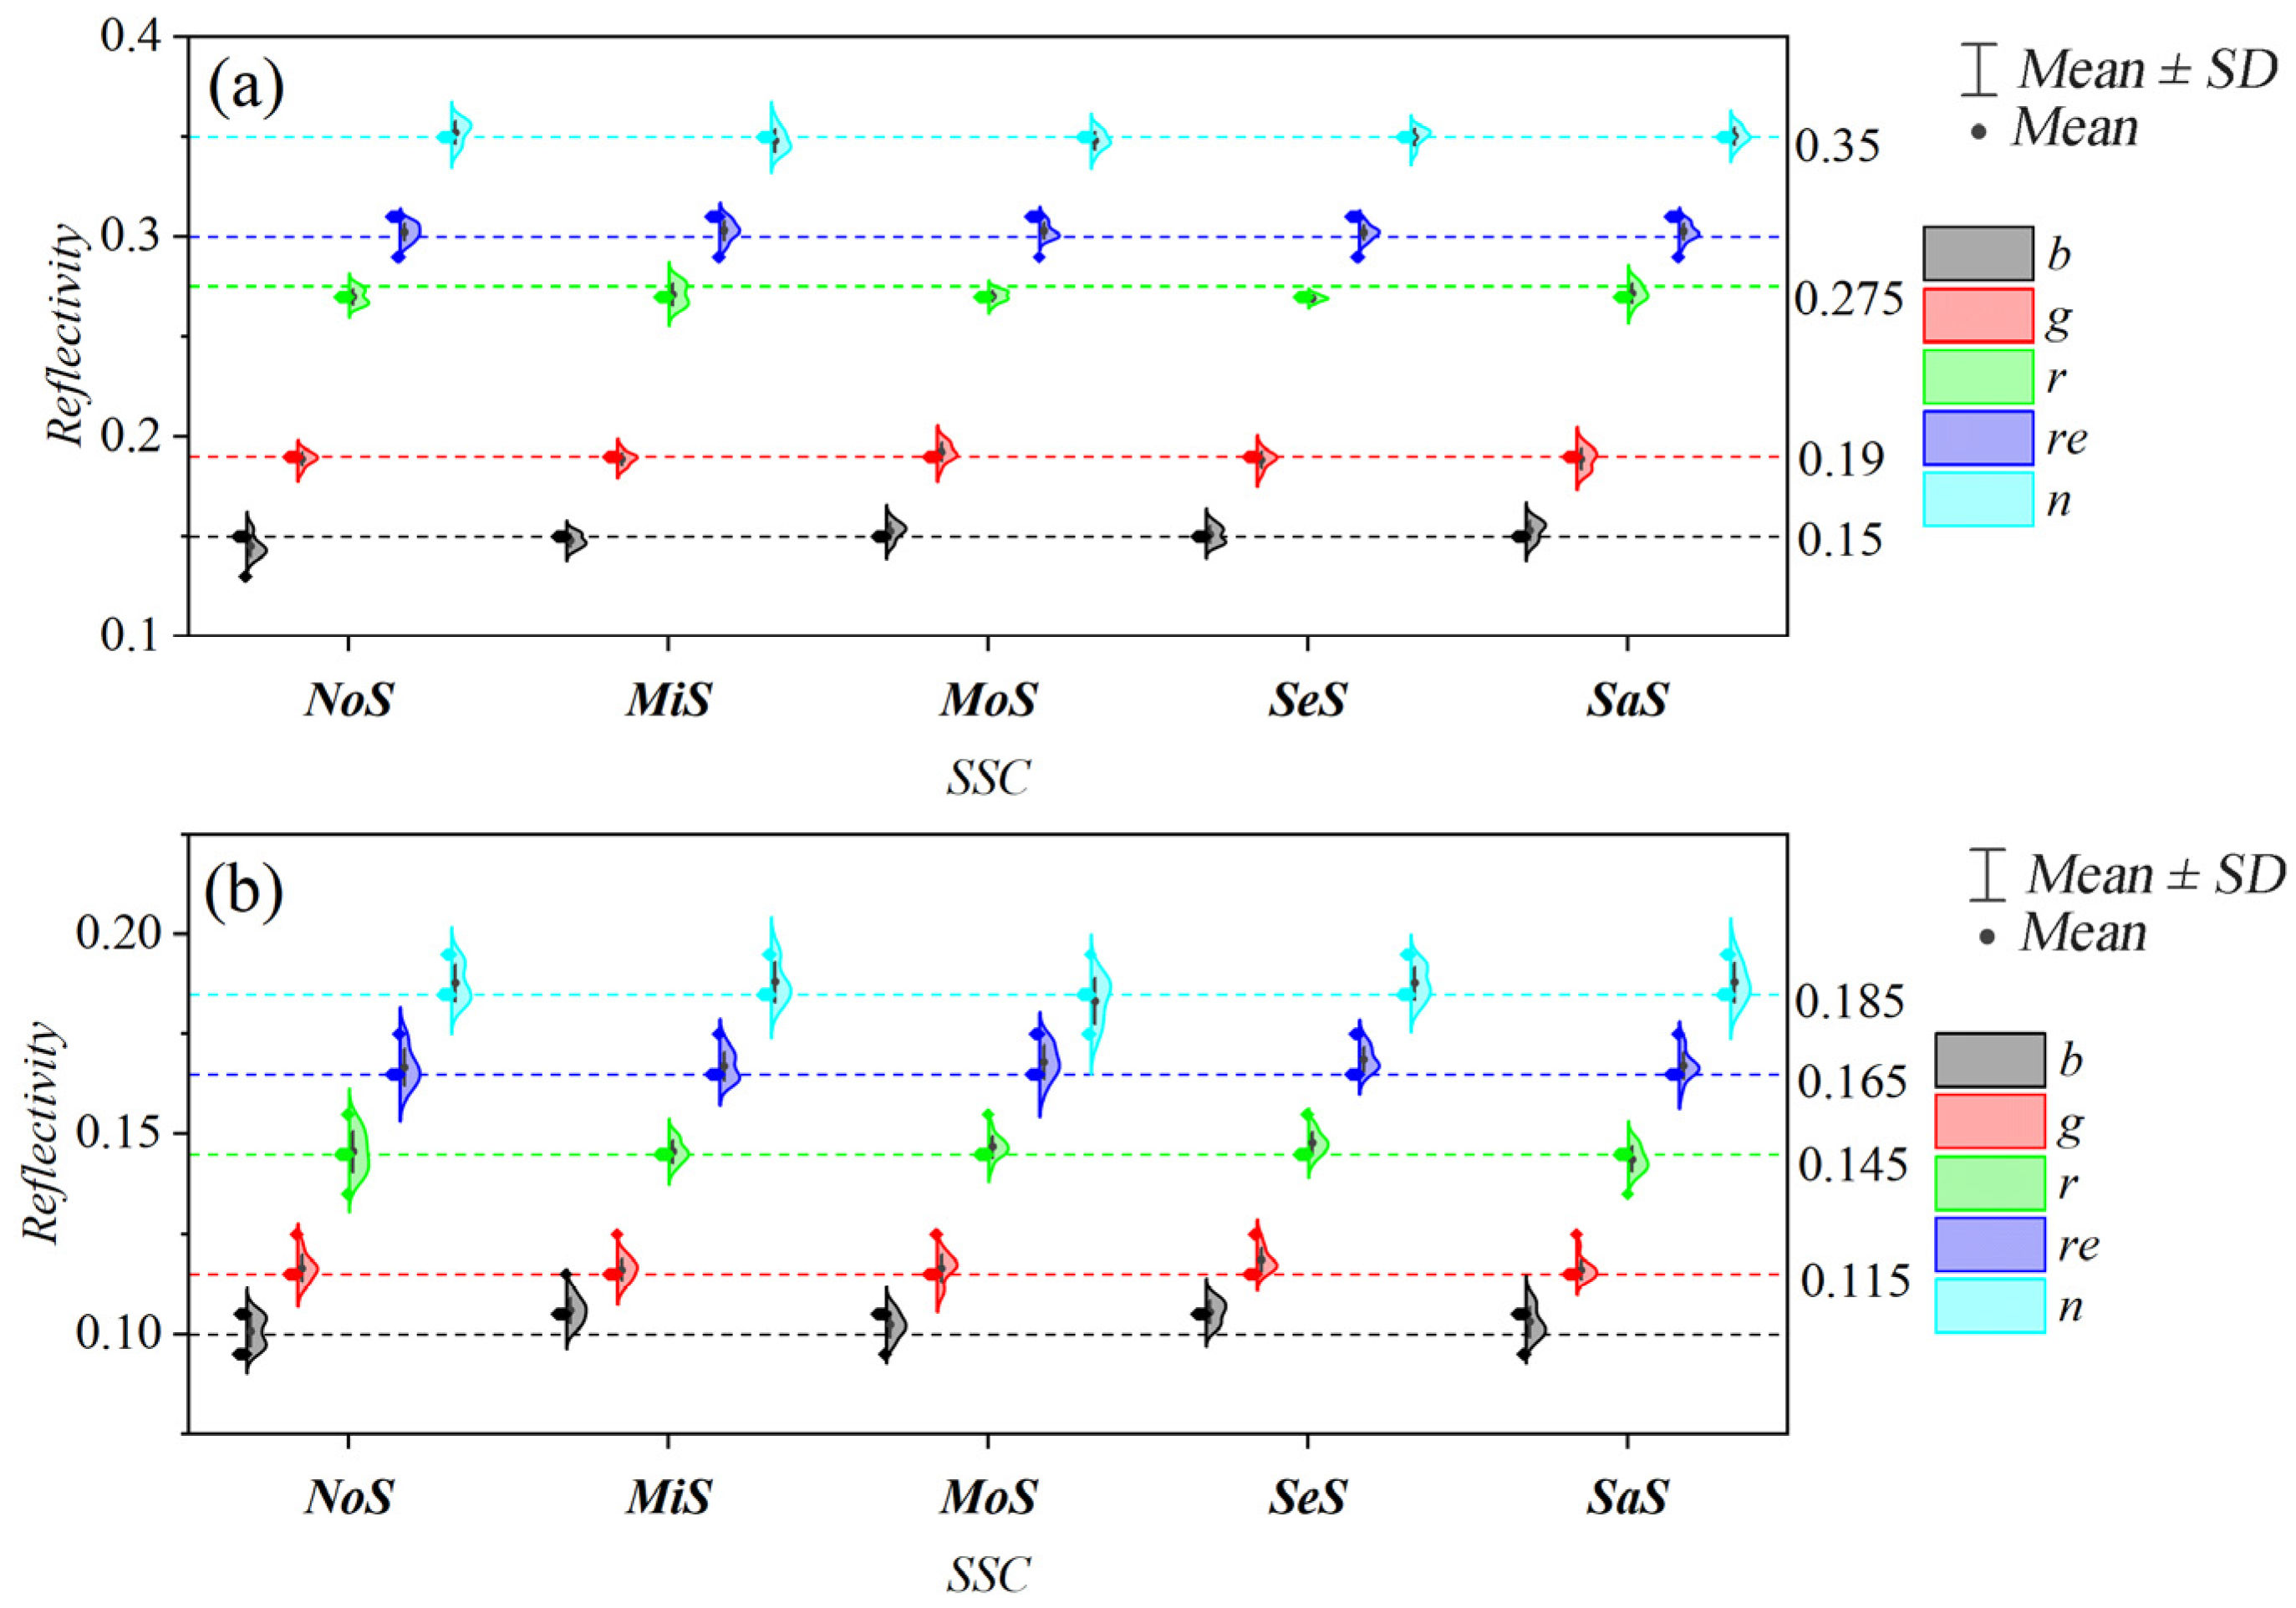
The spectral reflectance of black-mulched areas was consistently lower than that of white-mulched areas (Figure 8), which can be attributed to the distinct optical properties of different mulch colors [54]. White plastic mulch exhibits strong reflectance peaks in the NIR–SWIR spectral regions, whereas black plastic mulch, containing carbon black additives, shows strong absorption in the visible bands and relatively moderate reflectance in the near-infrared region [59,60]. Moreover, saline soils typically experience sufficient irrigation, causing surface salts to be leached into deeper soil layers and resulting in relatively uniform salinity at the soil surface [55]. In combination with the impermeability of plastic mulch [61], high soil moisture promotes close contact between the soil surface and the mulch, thereby maintaining relatively stable reflectance characteristics in mulched areas throughout the experimental period.
Figure 8.
Reflectance of five spectral bands for (a) white-mulched and (b) black-mulched areas under different soil salinity levels; the panel on the right shows the overall mean, without units.
Although soil salinity exhibits measurable correlations with spectral features, this relationship is inherently complex and is rarely characterized by a simple global linear pattern [15,50,58]. Therefore, soil–mulch mixed spectral features were constructed using an area-weighted method, and their nonlinear relationships with SSC were analyzed using the RFE algorithm. The results are presented in Table 4. Compared with the original bare-soil dataset, the importance ranking of variables in the mixed spectral dataset changed substantially, with pronounced differences observed between mulch types. We note that the exact ordering can be affected by uncertainties such as sampling variability, spatial heterogeneity in soil–mulch mixing proportions, and the stochastic nature of ensemble learning; however, the observed shifts are supported by the consistent changes in selected features across resolutions (Table A1). These findings indicate that when soil–mulch mixed pixels are present in the monitoring target, feature variables should be reselected prior to model construction.
Table 4.
Optimal feature combinations for soil–mulch mixed spectra.
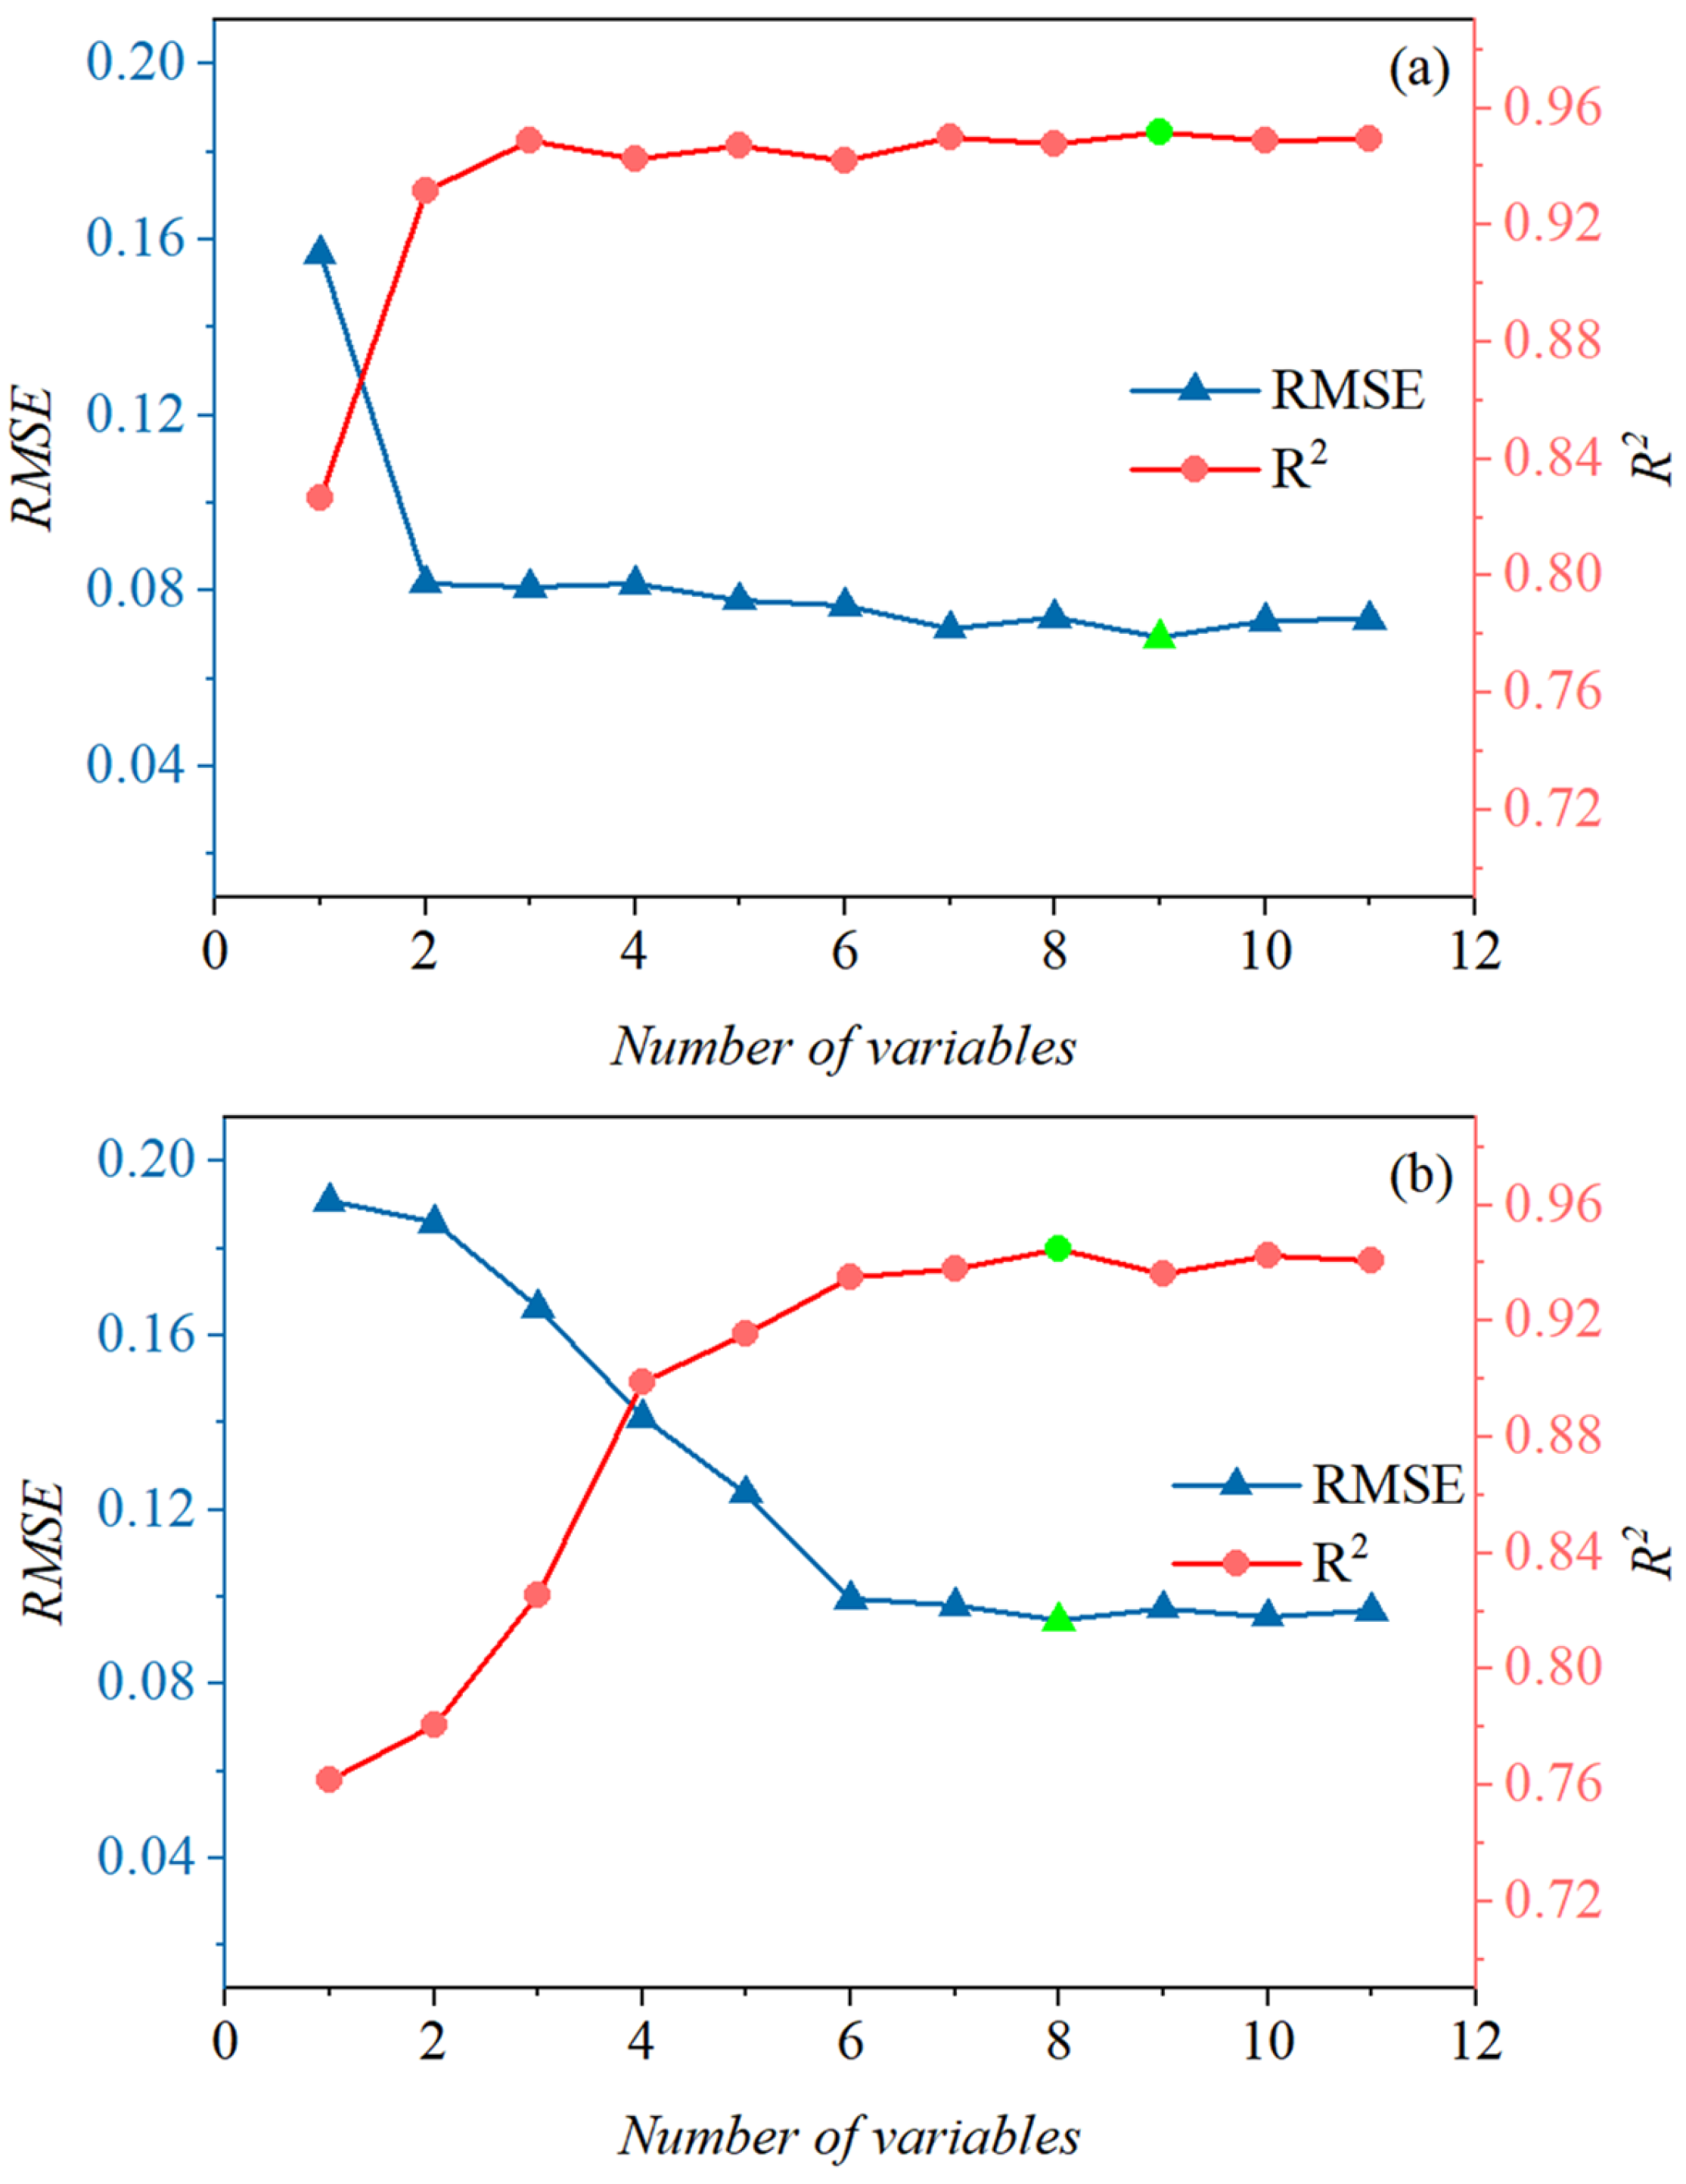
When mulch types were distinguished, the RFR–RFE model accuracy exhibited different responses to the number of selected variables, and increasing the number of features did not lead to continuous improvements in model performance (Figure 9). To control overfitting, all models were evaluated using three-fold cross-validation, and feature subset size was determined based on cross-validated mean R2 and RMSE rather than training accuracy alone. High information redundancy among features or small gradients in feature importance may hinder stable elimination of irrelevant variables, increasing overfitting risk and reducing feature stability [62]. The ensemble averaging mechanism of random forest regression further helps reduce model variance and improve generalization.
Figure 9.
Variation in RFR–RFE model accuracy with the number of selected features for soil–mulch mixed areas: (a) white mulch–soil mixed spectra (B+L); (b) black mulch–soil mixed spectra (H+L). Note: The unit of RMSE is the same as that of SSC, expressed as soil salt content percentage on a mass basis (% w/w). Green dots indicate the optimal R2 and RMSE values.
3.2. Scale-Dependent Variations in Spectral Indices Across Mulch Types in Farmland
To investigate the sensitivity of spectral indices for SSC inversion across different mulch-covered farmlands (B, H, and L) under multiple spatial resolutions, the mean values and standard deviations of 11 spectral indices were first calculated at four spatial resolutions (Table A1).
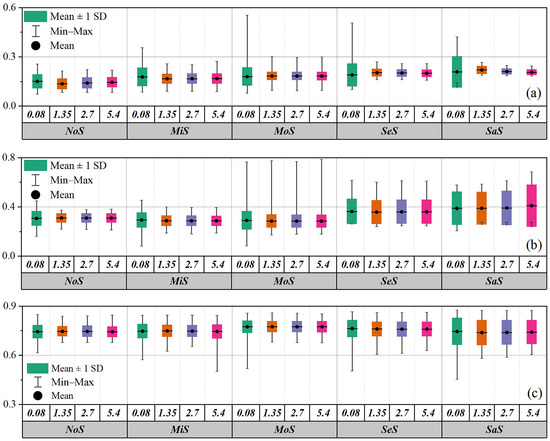
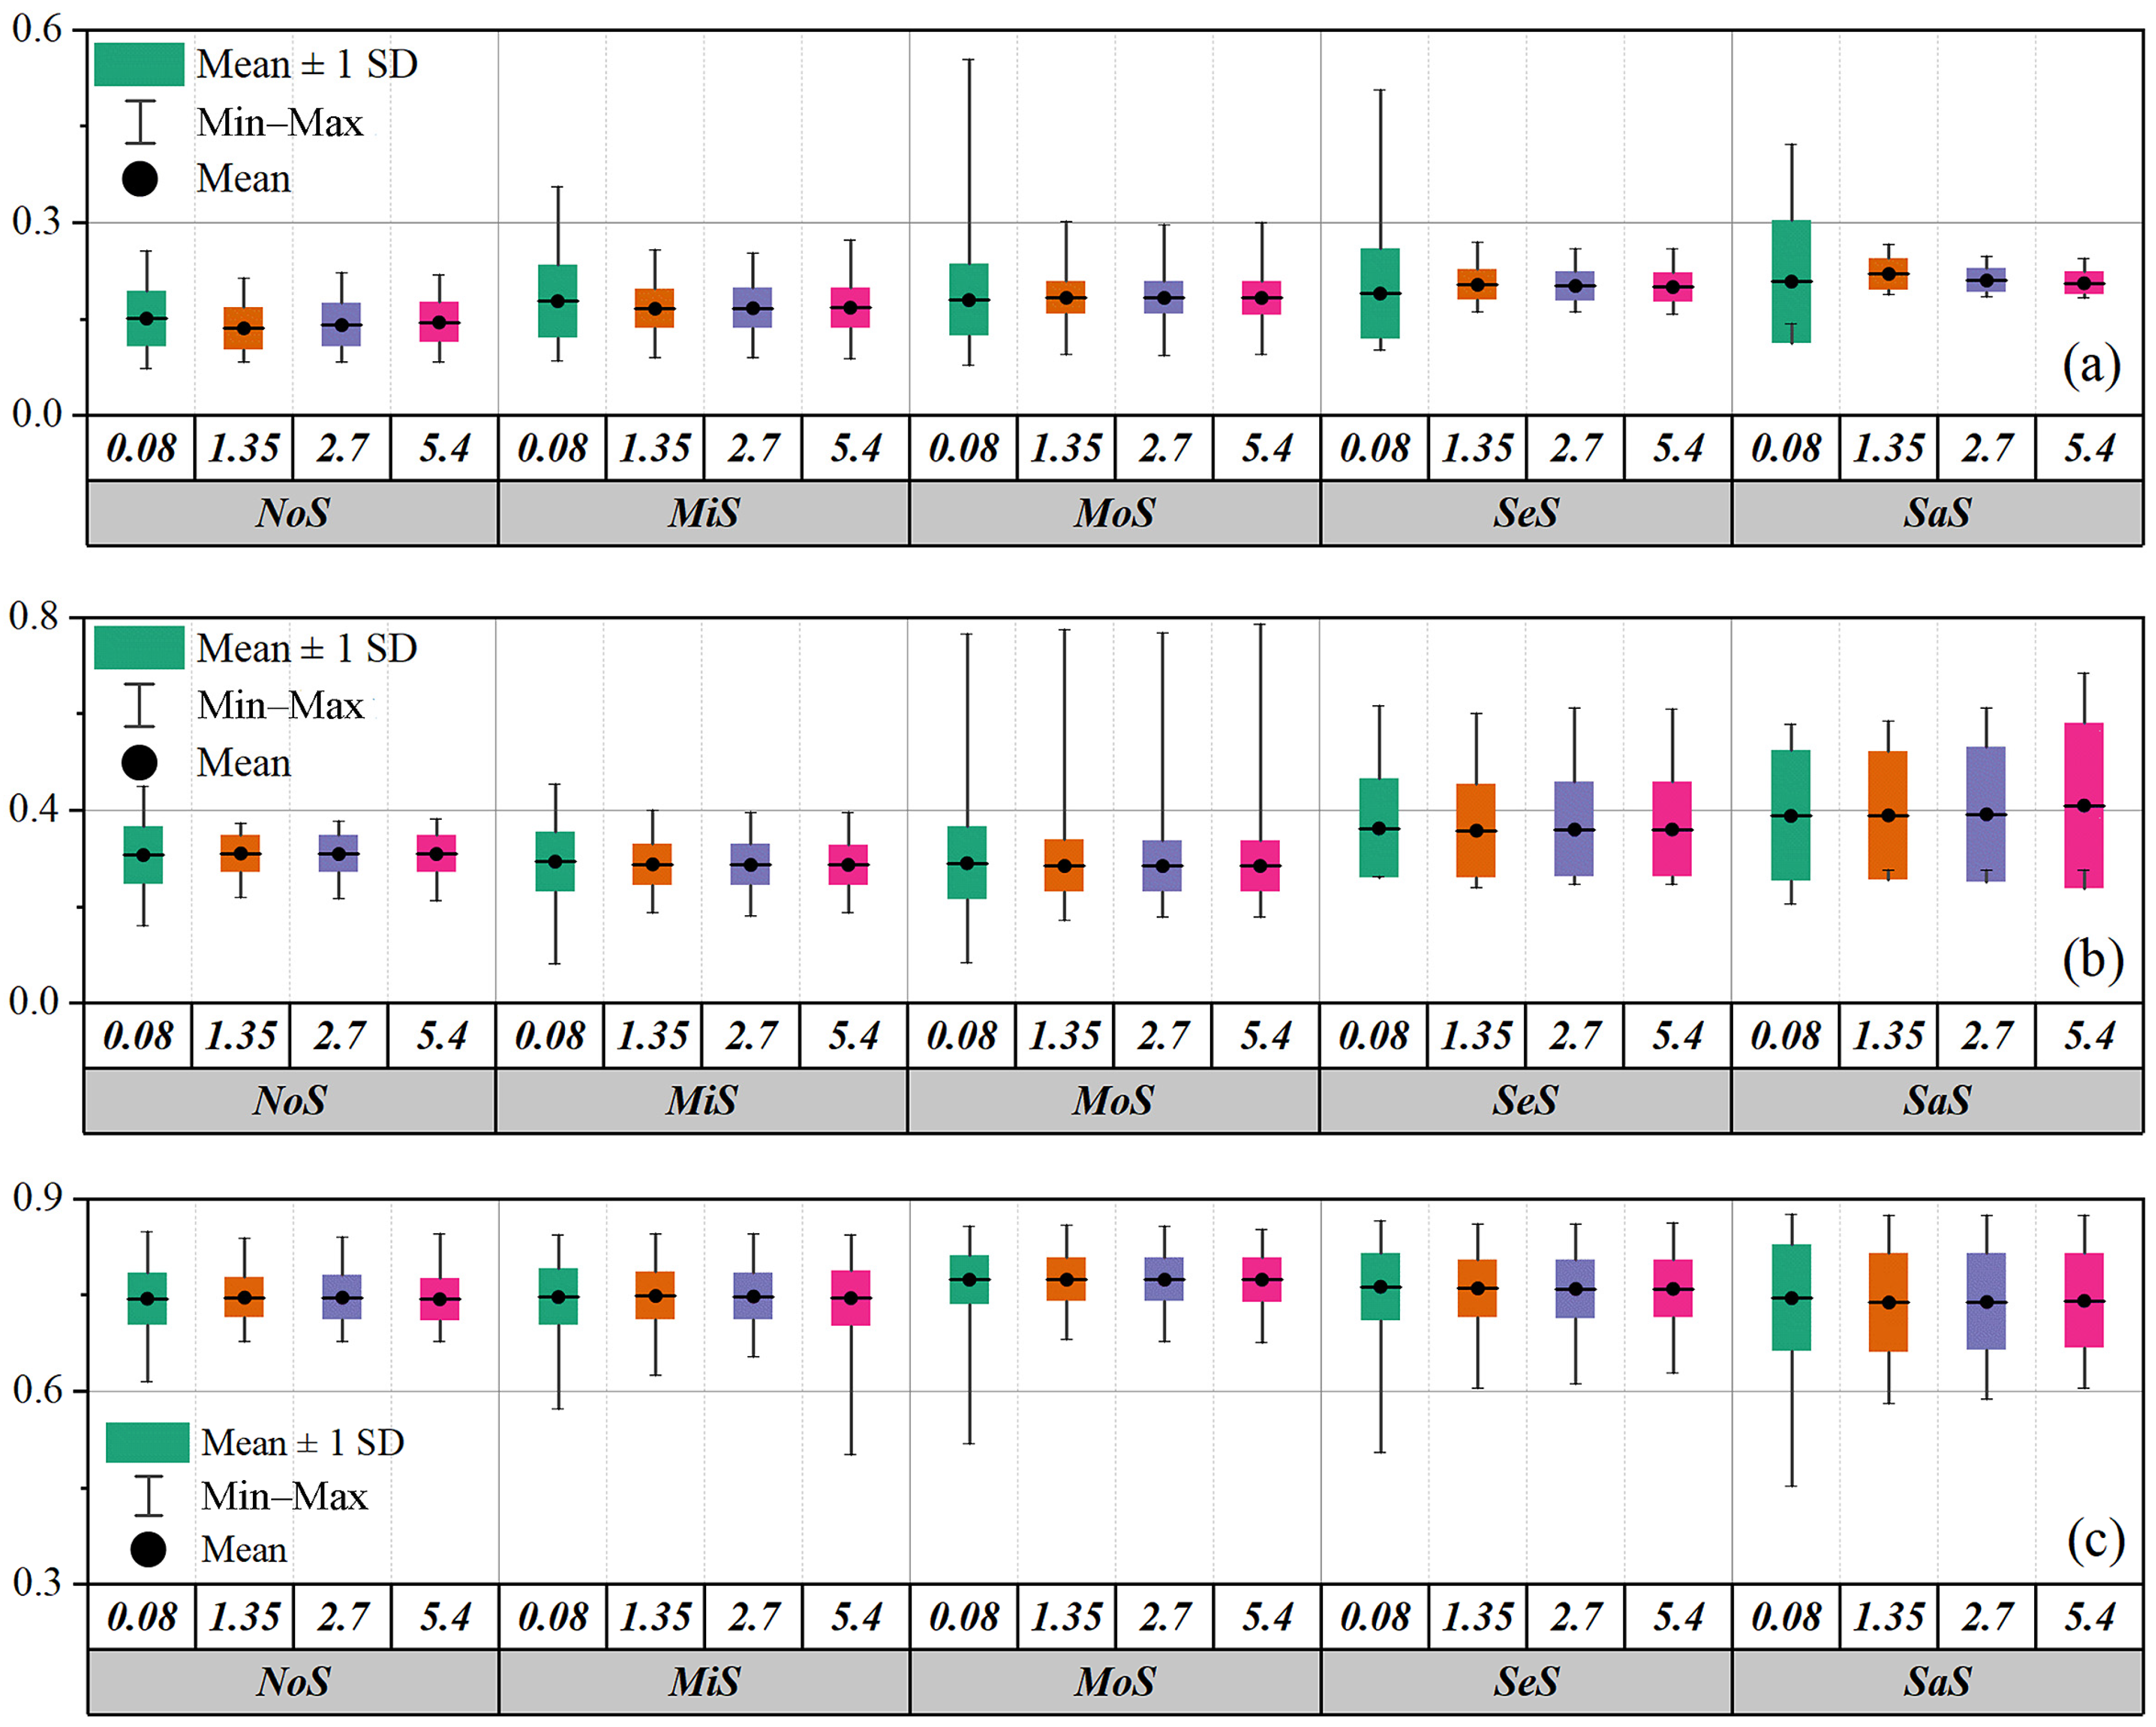
The analysis revealed pronounced differences in the sensitivity of spectral indices to spatial resolution. In terms of mean value variations, some indices—such as SI5 and CRSI in white film-covered farmland, and SI5 in uncovered farmland—exhibited substantial decreases in mean values as spatial resolution decreased, indicating high sensitivity to scale. In contrast, indices such as SI1 showed relatively minor changes in mean values across resolutions, demonstrating greater stability. Regarding standard deviation, all spectral indices across the three farmland types exhibited a pronounced decrease as spatial resolution decreased (i.e., scale increased) (Figure 10), indicating that spatial heterogeneity was progressively smoothed at coarser resolutions. Distinct responses to scale variation were observed among different mulch types. In black film-covered farmland, the mean values of most non-negative indices were notably lower than those in white film-covered and uncovered farmlands, and their standard deviations were generally smaller, indicating stronger spatial homogeneity. In contrast, uncovered farmland exhibited larger standard deviations overall, reflecting higher local variability.
Figure 10.
Variations in spectral indices across five salinity levels at four spatial resolutions. Subfigure (a) shows SI1 for white film-covered farmland, subfigure (b) shows SI5 for black film-covered farmland, and subfigure (c) shows CRSI for uncovered farmland. The values 0.08, 1.35, 2.7, and 5.4 represent spatial resolutions (m), and the vertical axis represents spectral index values, normalized values without units.
Spatial resolution can alter spectral curve characteristics by influencing the proportion of mixed pixels [63]. High spatial resolution reduces mixed-pixel effects and yields purer target spectra, but it also increases data volume, noise levels, and the complexity of spectral mixing. Conversely, lower spatial resolution tends to smooth or suppress overall noise, thereby effectively reducing the impact of random noise [64]. Therefore, SSC estimation in mulched farmland should integrate the sensitivity of spectral indices to both mulch type and spatial resolution, and an appropriate resolution should be selected to improve model accuracy and stability.
3.3. Effects of Spatial Resolution and Mulch Type on SSC–Spectral Relationships in Farmland
3.3.1. Linear Correlation Responses Across Resolutions and Mulch Types
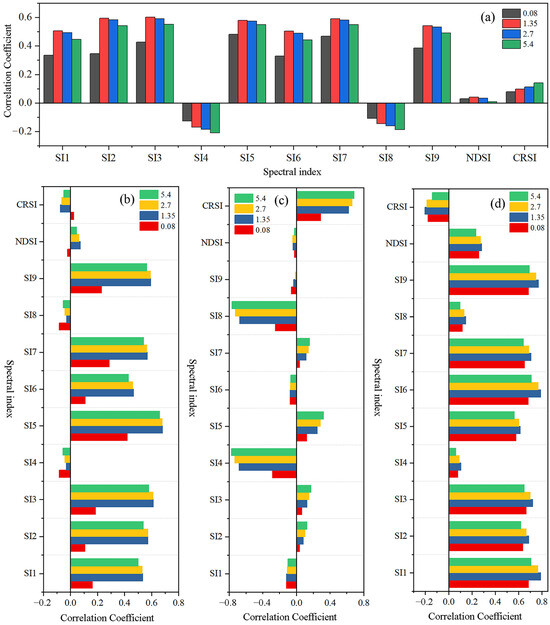
The linear relationships between spectral indices and SSC for farmland without distinguishing mulch types were analyzed using PCC’s r across multiple spatial resolutions (Figure 11a). The results indicate that although individual spectral indices responded differently to changes in spatial resolution, the relative ranking of their correlation strengths remained largely unaffected. For example, SI7 consistently exhibited the strongest correlation with SSC across all resolutions, with correlation coefficients of 0.4686, 0.5901, 0.5809, and 0.548 at spatial resolutions of 0.08, 1.35, 2.7, and 5.4 m, respectively, whereas NDSI consistently showed the weakest correlation. After distinguishing mulch types, the absolute values of the correlation coefficients between spectral indices and SSC increased markedly (Figure 12b–d). The maximum correlation coefficients for different farmland types were 0.6818 for white film-covered farmland (SI5 at 1.35 m), 0.7711 for black film-covered farmland (SI4 at 5.4 m), and 0.7898 for uncovered farmland (SI6 at 1.35 m). Overall, uncovered farmland exhibited the strongest SSC–spectral relationships, whereas white film-covered farmland showed the weakest. The highly sensitive indices for uncovered farmland (SI1, SI2, SI3, SI5, SI6, SI7, and SI9) were largely consistent with those for white film-covered farmland, but differed substantially from those for black film-covered farmland (SI4, SI8, and CRSI). Moreover, higher spatial resolution did not necessarily correspond to stronger correlations within the same mulch type. The optimal spatial resolution was 1.35 m for both white film-covered and uncovered farmlands, whereas black film-covered farmland exhibited the strongest correlations at 5.4 m. The predominance of SI7 across resolutions in the aggregated farmland analysis suggests that the index captures a stable salinity-related spectral contrast that persists under scale change. In general, salinity increases surface brightness and modifies soil structure/roughness, which most strongly affects reflectance in the VIS (especially red/red-edge) and its contrast with NIR [51]. For black film-covered farmland, the strong spectral masking by black mulch increases the contribution of mixed pixels and adjacency/inter-reflection effects, so indices such as SI4 that better preserve SSC-related separability under these conditions become dominant.
Figure 11.
The feature combinations filtered by the linear correlation coefficient method at four resolutions for the four data sets. Subfigure (a) corresponds to farmland without distinguishing mulch types, (b) to white film-covered farmland, (c) to black film-covered farmland, and (d) to uncovered farmland. Spatial resolutions of 0.08, 1.35, 2.7, and 5.4 m are shown. The horizontal axis represents the correlation coefficient, and the vertical axis represents the spectral indices.
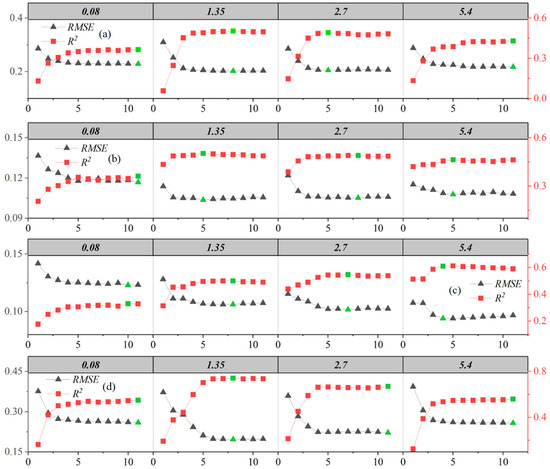
Figure 12.
The feature combinations selected based on the RFR–RFE method for four data groups at four different spatial resolutions. Subfigure (a) represents data without differentiation of mulch types, subfigure (b) represents white film-covered farmland, subfigure (c) represents black film-covered farmland, and subfigure (d) represents uncovered farmland. The values 0.08, 1.35, 2.7, and 5.4 denote spatial resolutions (m). The horizontal axis indicates the number of selected features, the left vertical axis represents RMSE, and the right vertical axis represents R2. Green dots indicate the optimal R2 and RMSE values.
Plastic mulch induces pronounced adjacency and inter-reflection effects in diffuse light scattering [65]. Multiple reflections between adjacent surface components generate complex optical paths before reaching the sensor, directly altering the spectral information of saline soils [66]. At coarser spatial resolutions, mixed pixels composed of both soil and mulch further modify the spectral reflectance characteristics of salinized surfaces [67]. White plastic film exhibits relatively high transmittance and does not fully obscure the spectral reflectance responses of the underlying soil, whereas black plastic film has low transmittance and substantially alters the spectral response of the soil beneath it [68,69]. Consequently, the sensitivity of SSC–spectral relationships to spatial resolution varies markedly among different mulch types. The selection of optimal spatial resolution should avoid interference from indices that are insensitive to scale variation. Ignoring resolution effects may introduce systematic bias into SSC inversion results. Therefore, integrating mulch type-specific optimal resolutions is essential to enhance the robustness and applicability of SSC estimation.
3.3.2. Nonlinear Feature Selection Performance Across Resolutions and Mulch Types
The optimal feature combinations for different mulch types across multiple spatial resolutions, as determined using the RFR–RFE algorithm, are shown in Figure 12 and Table A2. The results demonstrate that feature selection performance is jointly influenced by the interaction between mulch type and spatial resolution. Notably, at each of the four spatial resolutions, RFR–RFE produced consistently higher model explanatory power (R2) for the B, H, and L datasets than the dataset without mulch differentiation (W), providing empirical support for its robust performance across resolutions. Marked differences were observed in the optimal spatial resolutions and corresponding feature combinations among mulch types. The optimal resolution was 1.35 m for both uncovered and white film-covered farmland, whereas black film-covered farmland achieved optimal performance at 5.4 m. This suggests that excessively high spatial resolution may cause field-scale texture (i.e., real spatial heterogeneity patterns such as ridges, gaps, and patchiness) to interfere with SSC–spectral responses when the captured local detail also introduces non-informative variability (noise) that obscures salinity-related signals. Moreover, the optimal resolutions were generally associated with relatively small numbers of selected features (five for W, five for B, four for H, and eight for L), which helps reduce model complexity and mitigate overfitting.
To evaluate feature stability, we summarized how frequently each index was selected by RFR–RFE across the four spatial resolutions within each group (Table A2). Several indices were consistently selected at all resolutions, indicating stable contributions: for W, SI4/SI5/SI7/NDSI/CRSI (4/4); for B, NDSI/SI3/SI4/SI5 (4/4); for H, SI8/SI4/SI5/CRSI (4/4); and for L, SI8/SI7/SI6/SI9/SI1 (4/4). This frequency-based stability evaluation supports that the key indices are robust to resolution changes within each mulch group.
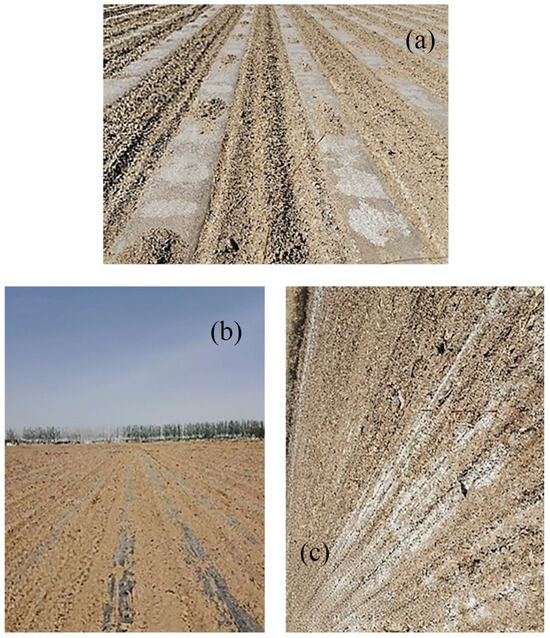
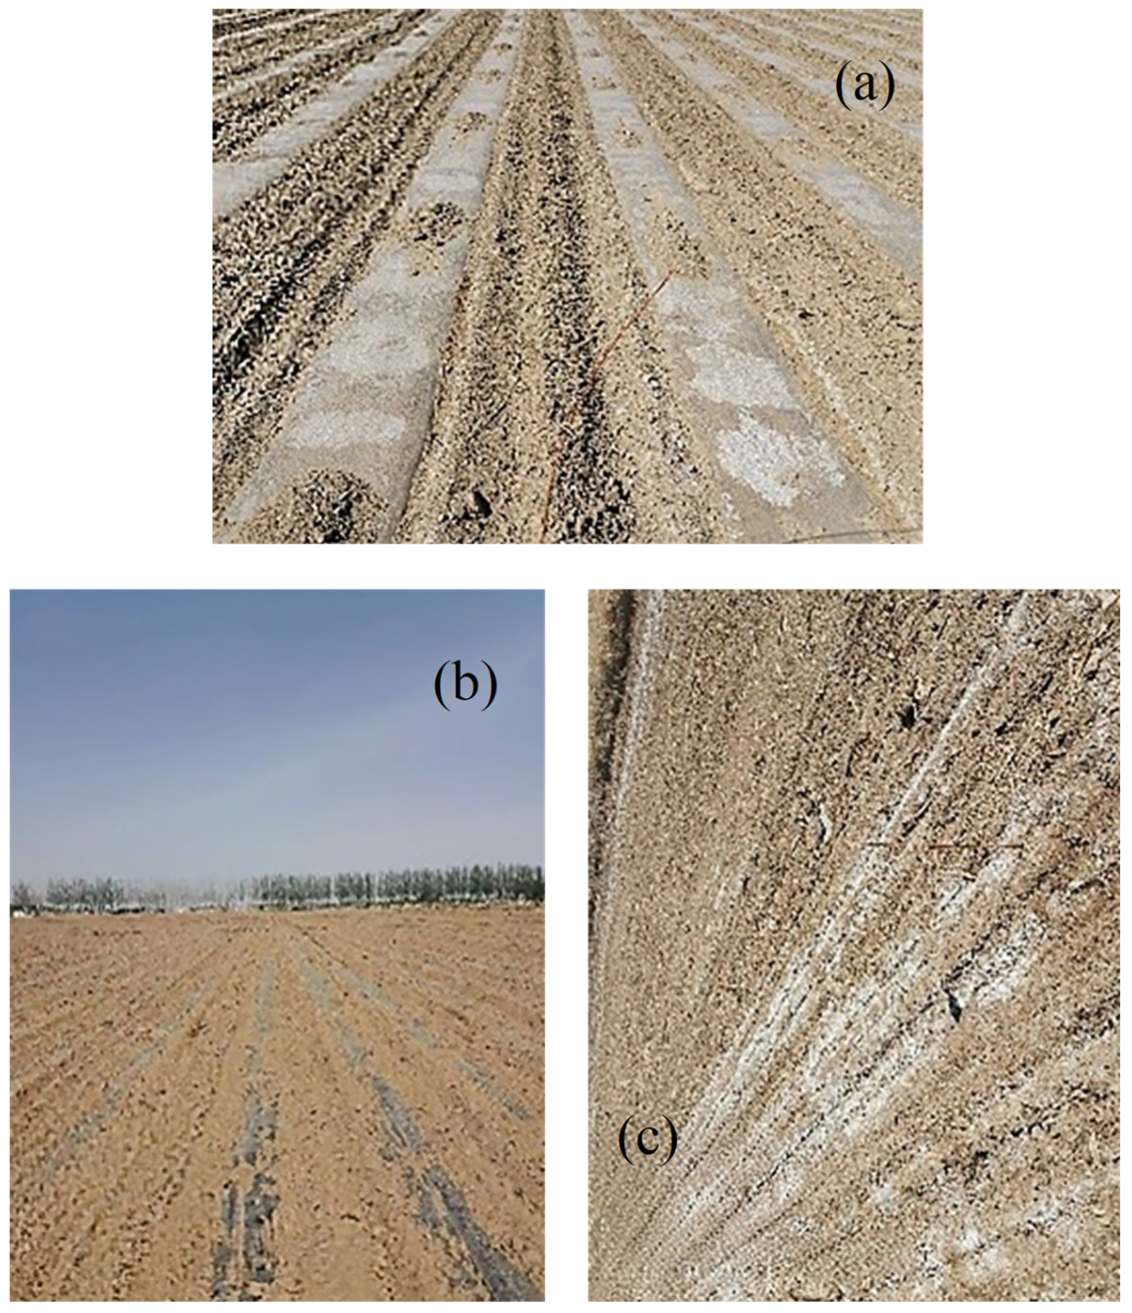
Compared with soil–mulch mixed spectra derived from controlled experiments, the spectral indices exhibiting stronger correlations with SSC in field-based UAV data differed markedly. For instance, SI5 for white film-covered farmland and SI4 for black film-covered farmland showed substantially stronger SSC correlations in the in situ datasets than in the controlled experiments. These discrepancies may arise from several factors. First, the SSC gradients in controlled experiments (five levels) were substantially fewer than those in UAV-based in situ observations, which constrained variable distributions and variability, potentially leading to underestimation of true inter-variable relationships [45]. Second, the soil–mulch contact state differs between controlled experiments and actual farmland. In field conditions, mulching operations disturb the soil surface, preventing tight soil–mulch contact (Figure 13), with disturbance intensity varying among crop types. Under transpiration and condensation processes, dense water droplets may form within mulch gaps, selectively absorbing light [70] and modifying farmland spectral reflectance. These effects are amplified by the semi-transparent nature of white film and the low transmittance of black film [68,69]. Furthermore, differences in soil disturbance during mulching alter the geometric parameters and surface texture of exposed soil areas, leading to variations in surface roughness. Surface roughness affects light scattering and reduces overall reflectance through shadowing effects, thereby distorting spectral shapes [71] and further influencing the strength of SSC–spectral relationships [5]. Finally, no single optimal spatial resolution exists that is universally applicable to all remote sensing estimation tasks [72]. Optimal resolution depends on the spatial characteristics of the target variable, the specific remote sensing data, and the modeling approach employed [64]. Given the pronounced spectral differences among white film-covered, black film-covered, and uncovered farmlands, certain spectral parameters may experience signal saturation at specific resolutions [73], resulting in distinct optimal indices and resolutions for different mulch types.
Figure 13.
States of farmland surface cover: (a) white film-covered farmland, (b) black film-covered farmland, and (c) uncovered farmland.
4. Conclusions
This study addressed the pervasive scale effects and mixed-pixel issues in remote sensing-based monitoring of soil salinization in mulched farmland. By systematically analyzing spectral variations across multiple spatial resolutions, we evaluated the adaptability of different feature selection methods under varying resolutions and mulch types. The main conclusions are as follows: (1) At near-ground ultra-high spatial resolution, the correlations between inter-row bare soil spectral features and SSC were only weakly influenced by mulch type, and distinguishing mulch types contributed little to enhancing SSC–spectral relationships. (2) Under multi-scale farmland conditions, explicitly differentiating black film-covered, white film-covered, and uncovered farmland significantly strengthened the correlations between spectral indices and SSC. (3) The random forest-based recursive feature elimination (RFR–RFE) method exhibited robust and stable performance across different spatial resolutions and mulching conditions, demonstrating particular advantages when dealing with mixed-pixel spectral data. (4) Optimal spatial resolution varied by mulch type within the context of this study: 1.35 m for white film-covered and uncovered farmland, and 5.4 m for black film-covered farmland. (5) Using multi-level salinized soil samples combined with multi-scale spectral analysis, this study clarified the interactive effects of spatial resolution and mulch type on SSC inversion accuracy. For soil salinity monitoring in mulched farmland, spatial resolution should be selected in accordance with mulch type, and appropriate feature selection methods should be employed to improve the robustness and accuracy of inversion models. The findings provide methodological guidance and technical support for dynamic soil salinity monitoring, optimal resolution selection of remote sensing imagery, and feature variable screening in mulched saline–alkali regions. It should be noted that the findings of this study have not yet been validated in other regions or using different sensor systems. Further investigation is needed to assess the general applicability of the identified optimal resolutions under varying environmental and observational conditions.
Author Contributions
W.M.: Writing—review & editing, Writing—original draft, Visualization, Validation, Software, Methodology, Investigation, Formal analysis, Data curation, Conceptualization. W.H.: Writing—review & editing, Supervision, Project administration, Funding acquisition. X.C.: Writing—review & editing, Methodology, Investigation. L.Z.: Methodology. Y.N.: Supervision. X.F.: Investigation. All authors have read and agreed to the published version of the manuscript.
Funding
This study was supported by the Shaanxi Qinchuangyuan Industrial Innovation Cluster “Four-Chain” Integration Project (2025CY-JJQ-21), Key Industrial Innovation Chain Project of Shaanxi Province (2024NC-ZDCYL-05-01), and Major Science and Technology Special Program of Yunnan Province (202402AE090005).
Data Availability Statement
Access to the raw data is restricted due to pending patent applications (CN202410172995.3, CN202411319216.4) and a confidentiality agreement with collaborators. The data are also used by partners in preparation for a separate manuscript. Therefore, the complete dataset cannot be made public until these processes are complete. Processed data may be available upon reasonable request from the corresponding author after the patent and manuscript are published. All data necessary to support the conclusions and ensure reproducibility are provided within the paper.
Acknowledgments
We are grateful to Jiawei Cui, Shenjin Huang, and Jiandong Tang for data collection, and we also appreciate Cunwang Jin, Junxia Miao, Guozhi Guo and Chunping Wang in the Green Industry Development Center of Wuyuan County for providing experimental conditions. The authors have reviewed and edited the output and take full responsibility for the content of this publication.
Conflicts of Interest
We declare that we have no financial and personal relationships with other people or organizations that can inappropriately influence our work. There is no professional or other personal interest of any nature or kind in any product, service and/or company that could be construed as influencing the position presented in, or the review of, the manuscript entitled “Effects of Spatial Resolution on Spectral Reflectance Responses of Soil Salinity in Plastic-Mulched Farmland”.
Appendix A
Table A1.
Statistical results of spectral indices across five salinity levels at four spatial resolutions. B denotes white film-covered farmland, H denotes black film-covered farmland, and L denotes uncovered farmland.
Table A2.
Feature combinations selected from four datasets based on the RFR–RFE method at four spatial resolutions. W indicates no distinction between mulch types, B indicates white film-covered farmland, H indicates black film-covered farmland, and L indicates uncovered farmland.
References
- Perri, S.; Molini, A.; Hedin, L.O.; Porporato, A. Contrasting Effects of Aridity and Seasonality on Global Salinization. Nat. Geosci. 2022, 15, 375–381. [Google Scholar] [CrossRef] [Scilit]
- Ma, W.; Cui, X.; Han, W.; Zhang, H.; Zhang, L. Improved Soil Salinity Estimation in Arid Regions: Leveraging Bare Soil Periods and Environmental Factors. iScience 2025, 28, 113020. [Google Scholar] [CrossRef] [Scilit] [PubMed]
- Tarolli, P.; Luo, J.; Park, E.; Barcaccia, G.; Masin, R. Soil Salinization in Agriculture: Mitigation and Adaptation Strategies Combining Nature-Based Solutions and Bioengineering. iScience 2024, 27, 108830. [Google Scholar] [CrossRef] [Scilit] [PubMed]
- Ma, Y.; Tashpolat, N. Current Status and Development Trend of Soil Salinity Monitoring Research in China. Sustainability 2023, 15, 5874. [Google Scholar] [CrossRef] [Scilit]
- Ma, W.; Han, W.; Cui, X.; Zhang, H.; Zhang, L.; Dong, Y.; Zhai, X. Soil Salinity Estimation Incorporating Environmental Covariables Using UAV Remote Sensing for Precision Field Management. Comput. Electron. Agric. 2025, 237, 110532. [Google Scholar] [CrossRef] [Scilit]
- Auci, S.; Pronti, A. Irrigation Technology Adaptation for a Sustainable Agriculture: A Panel Endogenous Switching Analysis on the Italian Farmland Productivity. Resour. Energy Econ. 2023, 74, 101391. [Google Scholar] [CrossRef] [Scilit]
- Sahbeni, G.; Ngabire, M.; Musyimi, P.K.; Székely, B. Challenges and Opportunities in Remote Sensing for Soil Salinization Mapping and Monitoring: A Review. Remote Sens. 2023, 15, 2540. [Google Scholar] [CrossRef] [Scilit]
- Meng, D.; Zong, X.; Xi, D.; Cai, C.; Liu, J. Effects of Plastic Film Mulching on Soil Water-Salt Status and Transplanting Effect of Leymus chinensis in Severe Saline-Alkali Land. J. Jilin Agric. Univ. 2018, 40, 722–726. [Google Scholar] [CrossRef]
- Cui, H. Experimental and Simulation Study on Dynamic Movement of Soil Water, Fertilizer and Salt Under Drip Irrigation Condition in Maize Field of Hetao Irrigation District. Master’s Thesis, Tianjin Agricultural University, Tianjin, China, 2023. [Google Scholar]
- Yuanqiao, L.; Caixia, Z.; Changrong, Y.; Lili, M.; Qi, L.; Zhen, L.; Wenqing, H. Effects of Agricultural Plastic Film Residues on Transportation and Distribution of Water and Nitrate in Soil. Chemosphere 2020, 242, 125131. [Google Scholar] [CrossRef] [Scilit] [PubMed]
- Yao, Z.; Chen, J.; Zhang, Z.; Tan, C.; Wei, G.; Wang, X. Effect of Plastic Film Mulching on Accuracy of Inverting Soil Salt Content Based on UAV Multispectral Remote Sensing. Trans. Chin. Soc. Agric. Eng. 2019, 35, 89–97. [Google Scholar]
- Gnann, N.; Baschek, B.; Ternes, T.A. Close-Range Remote Sensing-Based Detection and Identification of Macroplastics on Water Assisted by Artificial Intelligence: A Review. Water Res. 2022, 222, 118902. [Google Scholar] [CrossRef] [Scilit] [PubMed]
- Garrigues, S.; Allard, D.; Baret, F.; Morisette, J. Multivariate Quantification of Landscape Spatial Heterogeneity Using Variogram Models. Remote Sens. Environ. 2008, 112, 216–230. [Google Scholar] [CrossRef] [Scilit]
- Wetherley, E.B.; Roberts, D.A.; McFadden, J.P. Mapping Spectrally Similar Urban Materials at Sub-Pixel Scales. Remote Sens. Environ. 2017, 195, 170–183. [Google Scholar] [CrossRef] [Scilit]
- Cui, X.; Han, W.; Zhang, H.; Dong, Y.; Ma, W.; Zhai, X.; Zhang, L.; Li, G. Estimating and Mapping the Dynamics of Soil Salinity under Different Crop Types Using Sentinel-2 Satellite Imagery. Geoderma 2023, 440, 116738. [Google Scholar] [CrossRef] [Scilit]
- Cui, X.; Han, W.; Dong, Y.; Zhai, X.; Ma, W.; Zhang, L.; Huang, S. Estimating and Mapping Soil Salinity in Multiple Vegetation Cover Periods by Using Unmanned Aerial Vehicle Remote Sensing. Remote Sens. 2023, 15, 4400. [Google Scholar] [CrossRef] [Scilit]
- Cheng, F.; Ou, G.; Wang, M.; Liu, C. Remote Sensing Estimation of Forest Carbon Stock Based on Machine Learning Algorithms. Forests 2024, 15, 681. [Google Scholar] [CrossRef] [Scilit]
- Wei, H.-E.; Grafton, M.; Bretherton, M.; Irwin, M.; Sandoval, E. Evaluation of Point Hyperspectral Reflectance and Multivariate Regression Models for Grapevine Water Status Estimation. Remote Sens. 2021, 13, 3198. [Google Scholar] [CrossRef] [Scilit]
- Zhuang, Q.; Wu, S.; Feng, X.; Niu, Y. Analysis and Prediction of Vegetation Dynamics Under the Background of Climate Change in Xinjiang, China. PeerJ 2020, 8, e8282. [Google Scholar] [CrossRef] [Scilit]
- Pullanagari, R.R.; Kereszturi, G.; Yule, I. Integrating Airborne Hyperspectral, Topographic, and Soil Data for Estimating Pasture Quality Using Recursive Feature Elimination with Random Forest Regression. Remote Sens. 2018, 10, 1117. [Google Scholar] [CrossRef] [Scilit]
- Shu, F. Study on Utilization and Recovery of Agricultural Plastic Film and Its Fiscal Support Policy in China. Master’s Thesis, Chinese Academy of Agricultural Sciences, Beijing, China, 2015. [Google Scholar]
- Sun, Y.; Gao, Y.; Dou, J.; Wang, Y.; Liu, H. Comprehensive Effect of Degradable Film Mulching on Maize Cultivation in Semi-Arid Region. Chin. Agric. Sci. Bull. 2011, 27, 27–31. [Google Scholar]
- Bayannur Bureau of Statistics. Bayannur Statistical Yearbook 2022; China Statistics Press: Beijing, China, 2022. [Google Scholar]
- Yahiaoui, I.; Bradaï, A.; Douaoui, A.; Abdennour, M.A. Performance of Random Forest and Buffer Analysis of Sentinel-2 Data for Modelling Soil Salinity in the Lower-Cheliff Plain (Algeria). Int. J. Remote Sens. 2021, 42, 148–171. [Google Scholar] [CrossRef] [Scilit]
- Aplin, P. On Scales and Dynamics in Observing the Environment. Int. J. Remote Sens. 2006, 27, 2123–2140. [Google Scholar] [CrossRef] [Scilit]
- Dobigeon, N.; Altmann, Y.; Brun, N.; Moussaoui, S. Chapter 6—Linear and Nonlinear Unmixing in Hyperspectral Imaging. In Data Handling in Science and Technology; Ruckebusch, C., Ed.; Resolving Spectral Mixtures; Elsevier: Amsterdam, The Netherlands, 2016; Volume 30, pp. 185–224. [Google Scholar]
- Pu, R.; Gong, P.; Michishita, R.; Sasagawa, T. Spectral Mixture Analysis for Mapping Abundance of Urban Surface Components from the Terra/ASTER Data. Remote Sens. Environ. 2008, 112, 939–954. [Google Scholar] [CrossRef] [Scilit]
- Li, G.; Han, W.; Dong, Y.; Zhai, X.; Huang, S.; Ma, W.; Cui, X.; Wang, Y. Multi-Year Crop Type Mapping Using Sentinel-2 Imagery and Deep Semantic Segmentation Algorithm in the Hetao Irrigation District in China. Remote Sens. 2023, 15, 875. [Google Scholar] [CrossRef] [Scilit]
- Zhang, J.; Zhang, Z.; Chen, J.; Chen, H.; Jin, J.; Han, J.; Wang, X.; Song, Z.; Wei, G. Estimating Soil Salinity with Different Fractional Vegetation Cover Using Remote Sensing. Land Degrad. Dev. 2021, 32, 597–612. [Google Scholar] [CrossRef] [Scilit]
- Douaoui, A.E.K.; Nicolas, H.; Walter, C. Detecting Salinity Hazards Within a Semiarid Context by Means of Combining Soil and Remote-Sensing Data. Geoderma 2006, 134, 217–230. [Google Scholar] [CrossRef] [Scilit]
- Guo, B.; Han, B.; Yang, F.; Fan, Y.; Jiang, L.; Chen, S.; Yang, W.; Gong, R.; Liang, T. Salinization Information Extraction Model Based on VI-SI Feature Space Combinations in the Yellow River Delta Based on Landsat 8 OLI Image. Geomat. Nat. Hazards Risk 2019, 10, 1863–1878. [Google Scholar] [CrossRef] [Scilit]
- Allbed, A.; Kumar, L.; Aldakheel, Y.Y. Assessing Soil Salinity Using Soil Salinity and Vegetation Indices Derived from IKONOS High-Spatial Resolution Imageries: Applications in a Date Palm Dominated Region. Geoderma 2014, 230–231, 1–8. [Google Scholar] [CrossRef] [Scilit]
- Bannari, A.; Guedon, A.M.; El-Harti, A.; Cherkaoui, F.Z.; El-Ghmari, A. Characterization of Slightly and Moderately Saline and Sodic Soils in Irrigated Agricultural Land Using Simulated Data of Advanced Land Imaging (EO-1) Sensor. Commun. Soil. Sci. Plant Anal. 2008, 39, 2795–2811. [Google Scholar] [CrossRef] [Scilit]
- Wei, G.; Li, Y.; Zhang, Z.; Chen, Y.; Chen, J.; Yao, Z.; Lao, C.; Chen, H. Estimation of Soil Salt Content by Combining UAV-Borne Multispectral Sensor and Machine Learning Algorithms. PeerJ 2020, 8, e9087. [Google Scholar] [CrossRef] [Scilit]
- Scudiero, E.; Skaggs, T.H.; Corwin, D.L. Regional Scale Soil Salinity Evaluation Using Landsat 7, Western San Joaquin Valley, California, USA. Geoderma Reg. 2014, 2–3, 82–90. [Google Scholar] [CrossRef] [Scilit]
- Kendall, M.G. A New Measure of Rank Correlation. Biometrika 1938, 30, 81–93. [Google Scholar] [CrossRef] [Scilit]
- Pearson, K. Contributions to the Mathematical Theory of Evolution. Philos. Trans. R. Soc. Lond. A 1894, 185, 71–110. [Google Scholar] [CrossRef] [Scilit]
- Spearman, C. The Proof and Measurement of Association between Two Things. Am. J. Psychol. 1904, 15, 72–101. [Google Scholar] [CrossRef] [Scilit]
- Guyon, I.; Weston, J.; Barnhill, S.; Vapnik, V. Gene Selection for Cancer Classification Using Support Vector Machines. Mach. Learn. 2002, 46, 389–422. [Google Scholar] [CrossRef] [Scilit]
- Lu, N.; Liu, S.; Du, J.; Fang, Z.; Dong, W.; Tao, L.; Yang, Y. Grey Relational Analysis Model with Cross-Sequences and Its Application in Evaluating Air Quality Index. Expert Syst. Appl. 2023, 233, 120910. [Google Scholar] [CrossRef] [Scilit]
- Reshef, D.N.; Reshef, Y.A.; Finucane, H.K.; Grossman, S.R.; McVean, G.; Turnbaugh, P.J.; Lander, E.S.; Mitzenmacher, M.; Sabeti, P.C. Detecting Novel Associations in Large Data Sets. Science 2011, 334, 1518–1524. [Google Scholar] [CrossRef] [Scilit]
- Zhang, X.; Liu, L.; Zhao, T.; Chen, X.; Lin, S.; Wang, J.; Mi, J.; Liu, W. GWL_FCS30: A Global 30 m Wetland Map with a Fine Classification System Using Multi-Sourced and Time-Series Remote Sensing Imagery in 2020. Earth Syst. Sci. Data 2023, 15, 265–293. [Google Scholar] [CrossRef] [Scilit]
- Zhou, X.; Wen, H.; Zhang, Y.; Xu, J.; Zhang, W. Landslide Susceptibility Mapping Using Hybrid Random Forest with GeoDetector and RFE for Factor Optimization. Geosci. Front. 2021, 12, 101211. [Google Scholar] [CrossRef] [Scilit]
- Romdhani, H.; Lakhal-Chaieb, L.; Rivest, L.-P. Kendall’s Tau for Hierarchical Data. J. Multivar. Anal. 2014, 128, 210–225. [Google Scholar] [CrossRef] [Scilit]
- Schober, P.; Boer, C.; Schwarte, L.A. Correlation Coefficients: Appropriate Use and Interpretation. Anesth. Analg. 2018, 126, 1763. [Google Scholar] [CrossRef] [Scilit]
- Shaqiri, M.; Iljazi, T.; Kamberi, L.; Halili, R. Differences Between the Correlation Coefficients Pearson, Kendall and Spearman. J. Nat. Sci. Math. UT 2023, 8, 392–397. [Google Scholar]
- De Winter, J.C.F.; Gosling, S.D.; Potter, J. Comparing the Pearson and Spearman Correlation Coefficients Across Distributions and Sample Sizes: A Tutorial Using Simulations and Empirical Data. Psychol. Methods 2016, 21, 273–290. [Google Scholar] [CrossRef] [Scilit] [PubMed]
- Farifteh, J.; Farshad, A.; George, R.J. Assessing Salt-Affected Soils Using Remote Sensing, Solute Modelling, and Geophysics. Geoderma 2006, 130, 191–206. [Google Scholar] [CrossRef] [Scilit]
- Sun, Y.; Li, X.; Shi, H.; Ma, H.; Wang, W.; Cui, J.; Chen, C. Optimization of Remote Sensing Inversion of Soil Salinity in Saline Wasteland and Cultivated Land Based on Hyperspectral Data. Trans. Chin. Soc. Agric. Eng. 2022, 38, 101–111. [Google Scholar]
- Metternicht, G.I.; Zinck, J.A. Remote Sensing of Soil Salinity: Potentials and Constraints. Remote Sens. Environ. 2003, 85, 1–20. [Google Scholar] [CrossRef] [Scilit]
- Wang, F.; Yang, S.; Wei, Y.; Shi, Q.; Ding, J. Characterizing Soil Salinity at Multiple Depth Using Electromagnetic Induction and Remote Sensing Data with Random Forests: A Case Study in Tarim River Basin of Southern Xinjiang, China. Sci. Total Environ. 2021, 754, 142030. [Google Scholar] [CrossRef] [Scilit] [PubMed]
- Cheng, T.; Zhang, J.; Zhang, S.; Bai, Y.; Wang, J.; Li, S.; Javid, T.; Meng, X.; Sharma, T.P.P. Monitoring Soil Salinization and Its Spatiotemporal Variation at Different Depths across the Yellow River Delta Based on Remote Sensing Data with Multi-Parameter Optimization. Environ. Sci. Pollut. Res. 2022, 29, 24269–24285. [Google Scholar] [CrossRef] [Scilit] [PubMed]
- Chen, Y.; Mu, X.; McVicar, T.R.; Wang, Y.; Guo, Y.; Yan, K.; Lai, Y.; Xie, D.; Yan, G. Using an Improved Radiative Transfer Model to Estimate Leaf Area Index, Fractional Vegetation Cover and Leaf Inclination Angle from Himawari-8 Geostationary Satellite Data. Remote Sens. Environ. 2025, 318, 114595. [Google Scholar] [CrossRef] [Scilit]
- Sun, H.; Zheng, X.; Lu, X.; Wu, S. Spectral–Spatial Attention Network for Hyperspectral Image Classification. IEEE Trans. Geosci. Remote Sens. 2020, 58, 3232–3245. [Google Scholar] [CrossRef] [Scilit]
- Wang, X.; Yang, J.; Liu, G.; Yao, R.; Yu, S. Impact of Irrigation Volume and Water Salinity on Winter Wheat Productivity and Soil Salinity Distribution. Agric. Water Manag. 2015, 149, 44–54. [Google Scholar] [CrossRef] [Scilit]
- Lundberg, S.; Lee, S.-I. A Unified Approach to Interpreting Model Predictions. In Advances in Neural Information Processing Systems 30 (NIPS 2017); Curran Associates, Inc.: New York, NY, USA, 2017; pp. 4768–4777. [Google Scholar]
- Wang, Q. Effects of Mulch Color and Irrigation Amount on Spring Maize Growth and Farmland Evapotranspiration Characteristics in Hetao Irrigation District. Master‘s Thesis, Northwest A&F University, Yangling, China, 2022. [Google Scholar]
- Yang, S.; Miao, Q.; Shi, H.; Zhao, Y.; Liu, X.; Nie, X.; Feng, W.; Gonçalves, J.M.; Zhang, T.; Li, Y.; et al. Spatial and Temporal Heterogeneity of Soil Salinity and Ionic Coupling Relationship under the Water-Saving Renovation of a Typical Irrigation District in Arid and Semi-Arid Areas. Sci. Total Environ. 2024, 951, 175776. [Google Scholar] [CrossRef] [Scilit]
- Zhang, M.; Dong, J.; Ge, Q.; Hasituya; Hao, P. A Review of Agricultural Film Mapping: Current Status, Challenges, and Future Directions. J. Remote Sens. 2025, 5, 0395. [Google Scholar] [CrossRef] [Scilit]
- Zhang, X.; Li, J.; Li, H.; Guo, Z.; Chang, C.; Xu, X.; Zhen, T.; Yu, K.; Li, P. Identification of Plastic Film Mulched Farmland in the Core Area of the Beijing-Tianjin Sand Source Region Using Multi-Temporal Remote Sensing Features. Remote Sens. Appl. Soc. Environ. 2025, 38, 101600. [Google Scholar] [CrossRef] [Scilit]
- Zhou, J.; Gui, H.; Banfield, C.C.; Wen, Y.; Zang, H.; Dippold, M.A.; Charlton, A.; Jones, D.L. The Microplastisphere: Biodegradable Microplastics Addition Alters Soil Microbial Community Structure and Function. Soil Biol. Biochem. 2021, 156, 108211. [Google Scholar] [CrossRef] [Scilit]
- Gregorutti, B.; Michel, B.; Saint-Pierre, P. Correlation and Variable Importance in Random Forests. Stat. Comput. 2017, 27, 659–678. [Google Scholar] [CrossRef] [Scilit]
- Fu, Y.; Yao, Y.; Wang, L.; Yi, H.; Shan, Y. How Spatial Resolution Mediates Canopy Spectral Diversity as a Proxy for Marsh Plant Diversity. Ecol. Inform. 2025, 90, 103253. [Google Scholar] [CrossRef] [Scilit]
- Rocchini, D. Effects of Spatial and Spectral Resolution in Estimating Ecosystem α-Diversity by Satellite Imagery. Remote Sens. Environ. 2007, 111, 423–434. [Google Scholar] [CrossRef] [Scilit]
- Han, Y.; Wen, J.; Xiao, Q.; Bao, Y.; Chen, X.; Liu, Q.; He, M. Research Progress on Inversion Methods of Land Surface Bidirectional Reflectance. Natl. Remote Sens. Bull. 2023, 27, 2024–2040. [Google Scholar] [CrossRef] [Scilit]
- Hao, D.; Wen, J.; Xiao, Q.; Wu, S.; Lin, X.; You, D.; Tang, Y. Modeling Anisotropic Reflectance Over Composite Sloping Terrain. IEEE Trans. Geosci. Remote Sens. 2018, 56, 3903–3923. [Google Scholar] [CrossRef] [Scilit]
- Wang, L.; Bi, Y.; Wang, W.; Li, J. Endmember Extraction and Abundance Estimation Algorithm Based on Double-Compressed Sampling. Sci. Rep. 2024, 14, 17934. [Google Scholar] [CrossRef] [Scilit]
- Balocco, C.; Mercatelli, L.; Azzali, N.; Meucci, M.; Grazzini, G. Experimental Transmittance of Polyethylene Films in the Solar and Infrared Wavelengths. Sol. Energy 2018, 165, 199–205. [Google Scholar] [CrossRef] [Scilit]
- Jeon, Y.; Seol, W.; Kim, S.; Kim, K.-S. Robust Near-Infrared-Based Plastic Classification with Relative Spectral Similarity Pattern. Waste Manag. 2023, 166, 315–324. [Google Scholar] [CrossRef] [Scilit]
- Cao, M.; Chen, M.; Liu, J.; Liu, Y. Assessing the Performance of Satellite Soil Moisture on Agricultural Drought Monitoring in the North China Plain. Agric. Water Manag. 2022, 263, 107450. [Google Scholar] [CrossRef] [Scilit]
- Manninen, T.; Anttila, K.; Jääskeläinen, E.; Riihelä, A.; Peltoniemi, J.; Räisänen, P.; Lahtinen, P.; Siljamo, N.; Thölix, L.; Meinander, O.; et al. Effect of Small-Scale Snow Surface Roughness on Snow Albedo and Reflectance. Cryosphere 2021, 15, 793–820. [Google Scholar] [CrossRef] [Scilit]
- Afrasiabian, Y.; Noory, H.; Mokhtari, A.; Nikoo, M.R.; Pourshakouri, F.; Haghighatmehr, P. Effects of Spatial, Temporal, and Spectral Resolutions on the Estimation of Wheat and Barley Leaf Area Index Using Multi- and Hyper-Spectral Data (Case Study: Karaj, Iran). Precis. Agric. 2021, 22, 660–688. [Google Scholar] [CrossRef] [Scilit]
- Chen, J.; Chen, Z.; Huang, R.; You, H.; Han, X.; Yue, T.; Zhou, G. The Effects of Spatial Resolution and Resampling on the Classification Accuracy of Wetland Vegetation Species and Ground Objects: A Study Based on High Spatial Resolution UAV Images. Drones 2023, 7, 61. [Google Scholar] [CrossRef] [Scilit]

Disclaimer/Publisher’s Note: The statements, opinions and data contained in all publications are solely those of the individual author(s) and contributor(s) and not of MDPI and/or the editor(s). MDPI and/or the editor(s) disclaim responsibility for any injury to people or property resulting from any ideas, methods, instructions or products referred to in the content. |
© 2026 by the authors. Licensee MDPI, Basel, Switzerland. This article is an open access article distributed under the terms and conditions of the Creative Commons Attribution (CC BY) license.