


Abstract
IoT-based smart greenhouse sensing, real-time signal conditioning and abnormality detection are still predominantly executed at gateway or cloud levels, limiting responsiveness and increasing vulnerability to noise-induced false alarms. This study proposes and experimentally validates a mobile-edge signal processing and abnormality detection framework executed entirely within an Android-based smartphone application, eliminating dependence on continuous cloud-side analytics. Environmental data from 27 wireless sensor nodes measuring temperature, relative humidity, CO2 concentration, and light intensity were processed in real time using a sliding-window moving-average filter (N = 6) implemented with O(1) computational complexity. Abnormal conditions were determined via thresholding combined with temporal majority voting validation to suppress transient violations. Performance was also evaluated with direct threshold-based detection on raw signals to assess the effect of mobile-side filtering and temporal majority validation on abnormal sample counts, event fragmentation, and detection consistency. Mobile application side signal conditioning reduced short-term variance by 35–55% while maintaining an effective delay below two sampling intervals. Event-level analysis demonstrated substantial consolidation of noise-induced detections, reducing abnormal event frequency by up to 69% and increasing median event duration from 5 to 38 min for temperature, with negligible detection bias (±1.1%). End-to-end processing latency remained bounded under sustained multi-node streaming, with median delays of 1.0–1.6 s and 95th-percentile delays below 4.0 s. These results demonstrate that lightweight mobile-edge signal conditioning can significantly enhance detection robust-ness, reduce false alarms, and achieve low-latency environmental monitoring in green-houses. The proposed framework provides scalable and computationally efficient architecture for real-time abnormality detection in precision agriculture systems.
1. Introduction
Using smart greenhouses for crop production has become an essential component of modern precision agriculture, particularly in response to climate instability, resource limitations, and the growing demand for a consistent, year-round food supply [1,2]. Unlike open-field cultivation, greenhouse systems depend on the continuous regulation of internal microclimatic conditions to maintain crop physiological stability and maximize resource-use efficiency [3]. Environmental variables, including air temperature, relative humidity, carbon dioxide (CO2) concentration, and light intensity, directly govern photosynthesis, transpiration, respiration, and nutrient assimilation processes. Even short-duration deviations from acceptable operational ranges may induce metabolic stress, reduce yield, com-promise quality, and increase vulnerability to disease. As greenhouse automation scales in spatial complexity and operational intensity, reliable real-time environmental supervision becomes a critical systems-engineering requirement rather than a simple visualization task [4]. From an agronomic perspective, abnormality detection is important because it enables earlier recognition of environmental conditions that may directly impair crop performance. Persistent high temperature can intensify transpiration demand and heat stress, prolonged excessive humidity can increase the likelihood of condensation and disease-conducive conditions, abnormal CO2 levels can reduce photosynthetic efficiency, and unstable light conditions can affect crop growth and canopy development [5]. Therefore, real-time detection of abnormal environmental events is not only a technical monitoring function but also a practical greenhouse management tool that can support earlier intervention, improve climate-control decisions, and reduce the risk of crop stress under protected cultivation.
The integration of Internet of Things (IoT) technologies has enabled widespread deployment of distributed wireless sensor networks within greenhouse environments [6]. Multi-layer and multi-zone sensing architectures provide high-resolution spatial and temporal characterizations of environmental heterogeneity, revealing longitudinal gradients and vertical stratification that significantly influence crop microclimates [6,7]. These sensing infrastructures are typically interconnected with gateways, backend servers, and user interfaces, forming hierarchical monitoring architectures that support both visualization and automated climate control [8,9]. While increased sensing density enhances environmental awareness, the adoption of low-cost sensor nodes introduces new challenges in signal reliability and data interpretability.
In operational greenhouse environments, sensor measurements are frequently influenced by airflow turbulence from ventilation systems, localized irrigation and misting events, rapid solar radiation transitions, electromagnetic interference, sensor drift, packet loss, and power instability [10]. These disturbances generate high-frequency fluctuations, abrupt spikes, and transient oscillations that may not correspond to meaningful environment transitions. When such raw signals are directly visualized or processed through instantaneous threshold-based alarm mechanisms, transient disturbances can trigger excessive false abnormality detections and unstable monitoring interfaces. This phenomenon not only reduces operator confidence but may also lead to alarm fatigue or delayed corrective actions [11]. Consequently, the challenge in greenhouse monitoring is not merely data acquisition, but robust signal conditioning that balances noise suppression with preservation of genuine environmental dynamics.
Extensive research has investigated signal processing and anomaly detection techniques for environmental and industrial sensing systems. Conventional low-pass and median filters are widely employed due to their computational simplicity [12]. Recursive estimation methods, including Kalman filtering and adaptive filtering, provide statistically grounded state estimation under modeled system dynamics [13,14]. Frequency-domain approaches, such as Fourier and wavelet transforms, enable the separation of transient disturbances from structured environmental signals [15,16]. More recently, machine learning and deep-learning-based anomaly detection frameworks have demonstrated promising performance in industrial IoT contexts [17,18,19].
Despite methodological advances, practical deployment in greenhouse environments exposes critical limitations. Kalman-based methods require accurate state-space modeling and noise covariance tuning, which are difficult to maintain under nonlinear, seasonally varying, and spatially heterogeneous greenhouse conditions. Frequency-domain techniques introduce computational and memory overhead that may hinder real-time execution in resource-constrained platforms [20]. Data-driven anomaly detection approaches demand extensive labeled datasets and continuous retraining, which are often unavailable in agricultural environments characterized by evolving operating conditions and sparse abnormal event labeling. Moreover, existing studies predominantly evaluate algorithmic detection accuracy while providing limited analysis of deployment-level performance, including latency behavior, abnormal event fragmentation, detection bias introduced by filtering, and scalability under sustained multi-node streaming.
Among deterministic filtering approaches, moving-average (MA) filtering remains attractive due to its numerical stability, interpretability, and minimal computational overhead [21]. MA filtering effectively attenuates high-frequency fluctuations while preserving dominant environmental trends, making it well-suited for threshold-based abnormality detection frameworks commonly employed in greenhouse supervision [22]. However, in most existing greenhouse monitoring architectures, signal conditioning and abnormality detection are executed at sensor nodes, gateways, or cloud servers [23,24]. While centralized processing enables data aggregation and long-term analytics, it introduces structural constraints, including increased end-to-end communication latency, dependency on continuous network connectivity, transmission of noisy raw data streams before filtering, and delayed user-side interpretation.
These architectural characteristics create a critical disconnect in signal conditioning and are often performed remotely, whereas environmental interpretation and operational decision-making occur at the user interface [25]. Under network congestion or intermittent connectivity, abnormal environmental conditions may not be reflected promptly at the operator interface. Additionally, visualization of unfiltered signals before backend processing can amplify transient false alarms and reduce decision reliability [26]. This highlights a structural research gap: insufficient integration of deterministic signal conditioning and abnormality validation directly at the mobile interface layer, where real-time supervision is required.
Mobile-edge computing provides a technically feasible yet underexplored solution to this architectural limitation. Modern smartphones integrate multi-core processors, energy-efficient computational pipelines, and advanced visualization capabilities capable of executing lightweight signal processing operations in real time [27]. By relocating signal conditioning and abnormality validation to the mobile application layer, it becomes possible to suppress noise before visualization, reduce end-to-end latency, decrease reliance on continuous cloud-side computation, and provide immediate contextual abnormality notifications to operators [28]. However, systematic evaluation of fully mobile-executed deterministic signal processing pipelines in greenhouse monitoring systems remains limited. Beyond engineering performance, sensor-based greenhouse monitoring has increasing value as a decision-support tool in crop production. Environmental sensing can guide practical management actions such as ventilation adjustment, humidity control, shading response, and CO2 regulation, particularly when abnormal conditions persist long enough to influence crop physiology or disease risk. From an agronomic perspective, the relevance of abnormality detection lies not only in identifying signal deviations, but also in enabling timely greenhouse management decisions that protect crop health and maintain more stable production conditions.
Existing studies rarely examine the combined effects of mobile-side filtering on signal variability, abnormality detection robustness, event consolidation behavior, detection bias, and latency distributions under continuous multi-node operation. Without comprehensive quantitative analysis across these dimensions, the practical viability and architectural advantages of mobile-edge analytics for greenhouse supervision remain insufficiently validated.
To address this gap, this study develops and experimentally evaluates a mobile-application-based edge signal processing and abnormality detection framework specifically designed for greenhouse environmental monitoring. The proposed framework integrates sliding-window moving-average filtering, implemented using an incremental running-sum formulation to ensure constant-time computational complexity, deterministic threshold-based abnormality classification grounded in operational safety limits, and temporal majority-voting validation to suppress transient threshold violations and consolidate fragmented detections. Unlike conventional cloud- or gateway-centric architectures, the entire signal conditioning and abnormality detection pipeline is executed directly at the mobile interface layer.
The objectives of this research were threefold. First, to design and implement a computationally efficient mobile-edge signal processing architecture suitable for scalable multi-node greenhouse monitoring. Second, to evaluate the effect of moving-average filtering and temporal majority validation relative to direct threshold-based detection on raw signals, with emphasis on abnormal sample counts, event fragmentation, event duration, and detection bias. Third, to assess the real-time feasibility, latency characteristics, and deployment stability of a fully mobile-executed abnormality detection framework under sustained environmental data streaming.
2. Materials and Methods
2.1. Design and Implementation of the Mobile-Edge Monitoring Application
An Android-based smartphone application was developed to operate as a mobile-edge monitoring and signal processing unit for real-time greenhouse environmental supervision. Unlike conventional visualization-only clients, the proposed application performs signal conditioning, abnormality detection, and decision-support operations directly on the mobile device, thereby reducing end-to-end communication latency and minimizing dependence on continuous cloud-side computation. The application was implemented using Android Studio (Version: Hedgehong 2023.1.1) with Java (Version: 23) as the primary programming language to ensure long-term API stability and broad compatibility across heterogeneous Android hardware platforms. Kotlin Coroutines (Version: 2.1.0) were incorporated to support asynchronous execution, enabling concurrent data acquisition, signal processing, visualization rendering, and actuator command handling without blocking the user interface thread. This non-blocking architecture ensured stable operation under sustained multi-node data streaming and maintained responsive user interaction during continuous monitoring.
Secure system access was implemented through Firebase Authentication, restricting monitoring and control privileges to authorized users. Authentication credentials were verified before granting access to environmental data streams and actuator control inter-faces, ensuring secure remote interaction in multi-user greenhouse deployments. The communication workflow followed a hierarchical structure. Environmental measurements acquired by distributed sensing nodes were transmitted to a gateway and subsequently forwarded to backend services for routing and persistence. Message Queuing Telemetry Transport (MQTT) was employed as a lightweight publish–subscribe protocol to enable low-latency bidirectional communication between the smartphone application and the edge server. MQTT facilitated efficient streaming of time-stamped environmental measurements while supporting remote actuator command transmission when required.
The Firebase Real-time Database served as the cloud-based persistence layer, maintaining synchronized records of real-time and historical environmental measurements. However, in contrast to cloud-centric architectures where signal interpretation is executed remotely, computationally relevant operations, including sliding-window buffering, moving-average filtering, threshold evaluation, and temporal abnormality validation, were performed directly at the mobile edge. This architectural separation reduced latency, limited bandwidth usage, and ensured continued decision-support functionality even under transient network instability. A system-level overview of the communication hierarchy and mobile-edge execution workflow is illustrated in Figure 1.
Figure 1.
System-level workflow of the mobile application edge smart greenhouse monitoring architecture, illustrating distributed sensing, communication hierarchy, backend data synchronization, and smartphone-based signal processing and abnormality detection.
2.2. System Architecture for Mobile-Edge Greenhouse Monitoring
The overall smart greenhouse monitoring framework was organized into three functional layers: (i) the environmental sensing layer, (ii) the communication and data management layer, and (iii) the mobile-edge monitoring and decision-support layer. An environmental sensing layer for distributed wireless sensor nodes was deployed across multiple longitudinal and vertical positions within the greenhouse to capture spatial variability in environmental conditions. Each node measured air temperature, relative humidity, carbon dioxide (CO2) concentration, and light intensity at a fixed sampling interval of 60 s. The 60 s sampling rate was selected to balance temporal responsiveness with communication overhead and energy efficiency at the sensing layer. Each measurement was time-stamped at the node level before transmission to preserve chronological consistency during down-stream processing. This configuration provided reliable spatial coverage while maintaining energy-efficient operation suitable for long-term smart greenhouse deployment.
Within the communication and data management layer, sensor measurements were transmitted to a gateway via low-power wireless communication and subsequently forwarded to backend services responsible for routing, synchronization, and storage. An application programming interface (API) enables structured data access between backend services and mobile applications. The communication architecture supported bidirectional interaction, enabling both environmental data streaming and actuator command transmission from the mobile interface. Backend services ensured historical data persistence and state synchronization, while real-time interpretation and signal conditioning were delegated to the mobile application edge layer to reduce centralized computational dependency.
Mobile-edge monitoring and the decision-support layer for the smartphone application functioned as an edge-level computational unit responsible for real-time signal processing, abnormality detection, and visualization. Incoming environmental measurements were appended to sliding-window buffers before signal conditioning. A running-sum implementation of moving-average filtering was employed to attenuate high-frequency fluctuations while maintaining constant-time computational complexity O(1) per update and minimal memory overhead. Filtered signals were subsequently evaluated using deterministic threshold comparison and temporal validation mechanisms to suppress transient threshold violations. Confirmed abnormal states were reflected within the user interface through real-time graphical visualization, push notifications, and alert indicators. By executing signal interpretation and decision logic directly at the mobile edge rather than solely within backend infrastructure, the proposed architecture reduced communication latency, improved responsiveness to abnormal environmental conditions, and enhanced scalability for distributed greenhouse monitoring applications. From a greenhouse management perspective, the abnormal events detected by the proposed framework are intended to function as supervisory indicators that support corrective action. Sustained high-temperature events may indicate the need for ventilation, shading, or cooling adjustment, whereas prolonged high-humidity events may justify the dehumidification response or closer inspection for disease-conducive conditions. Abnormal CO2 behavior may indicate unexpected ventilation losses or insufficient enrichment, and abnormal light patterns may suggest shading imbalance, solar fluctuation, or sensor-related problems. In this way, the mobile-edge framework provides not only computational event detection, but also practically interpretable information for greenhouse managers and agronomists. A structural representation of this layered architecture and mobile-edge processing workflow is presented in Figure 2.
Figure 2.
Three-layer architecture of the mobile-edge greenhouse monitoring system, including environ-mental sensing, communication, backend data management, and smartphone-based signal processing and abnormality detection.
2.3. Signal Processing and Abnormality Detection Framework
Smart greenhouse environmental monitoring generated continuous multivariate time-series data that was heavily impacted by sensor noise, short-term disruptions, and transient operational events. Reliable anomaly detection in such settings necessitated not just a rapid reaction but also resistance to misleading variations. As shown in Figure 2, this study proposed a signal processing and abnormality detection framework that was implemented at the mobile application-edge level. Data ingestion, signal conditioning, abnormality assessment, and event management were explicitly modularized to ensure analytical clarity and scalable deployment.
Environmental data such as temperature, humidity, CO2 concentration, and light intensity were collected via distributed wireless sensor nodes and relayed via an MQTT broker at a set sample period of 60 s. The raw sensor data were given to the mobile application via an API service layer utilizing JSON-based REST communication, allowing for standardized and platform-independent data interchange, as shown in Equation (1):
where k denotes the sample index, Ax(t) denotes the discrete-time environmental sensor signal, and x represents the specific environmental variable under consideration. To support modularity and scalability, signals were processed independently for each sensor node and environmental variable.
Figure 3 illustrates that the mobile application-edge structure consists of four functional modules. The data intake module acquired unprocessed sensor signals and upheld a fixed-length sliding window buffer, implementing moving-average filtering to mitigate high-frequency noise. The signal processing module assessed the filtered signals against established operating criteria to categorize environmental conditions. The anomaly detection module utilized sliding-window majority voting to confirm temporal consistency and mitigate temporary threshold breaches. The event management module recorded verified anomalies and dispatched push notifications to the mobile interface. This integrated architecture facilitated the computationally efficient and resilient real-time detection of green-house environmental anomalies.
Figure 3.
Architecture of a mobile application for abnormality detection for greenhouse environmental monitoring.
2.3.1. Real-Time Sliding Window Signal Smoothing and Conditioning
To enable real-time signal smoothing while maintaining bound memory usage, a sliding-window approach was implemented within the mobile application. In this study, a sliding window refers to a fixed-length sequence of the most recent sensor samples, which were continuously updated as new data arrived as shown in Figure 4.
Figure 4.
Flowchart of the mobile applications for moving-average signal processing and the abnormal detection pipeline for greenhouse environmental monitoring.
For each sensor node and environmental variable, an independent sliding window of length N was maintained in the mobile application memory. When a new measurement x(tk) was received, it was appended to the window, and if the window size exceeded N the oldest sample x(tk−N) was discarded. Consequently, the window always contained the most recent samples, as shown in Equation (2):
where W(tk) denotes the sliding window at time tk containing the most recent N sensor samples, with x(tk) representing the current measurement and x(tk−1) to x(tk−N + 1) denoting the preceding samples retained for real-time signal processing. This structure enabled continuous online processing without storing the entire data history and ensured stable memory usage on the mobile device. Signal smoothing was performed using a simple moving-average (MA) filter applied to the sliding window, as shown in Equation (3):
where (tk) denotes the moving-average filtered signal at time tk, x(tk−i) represents the raw sensor samples within the sliding window, N is the window length, and i is the sample index over the most recent N measurements used to compute the average. To reduce computational overhead on the mobile device, the filter was implemented using an incremental running sum formulation (Equations (4) and (5)):
where S(tk) denotes the running sum of the most recent N sensor samples at a time tk, S(tk−1) is the running sum at the previous time step, x(tk) is the newly received sample, and x(tk−N) is the oldest sample removed from the window. The filtered signal (tk) is obtained by dividing the updated running sum S(tk) by the window length N. This implementation ensured O(1) computational complexity per sample, independent of window size. The window length was set to N = 6. With a 60 s sampling interval, this corresponds to a 6 min smoothing horizon. This value was selected as a practical compromise between suppressing transient spikes and preserving timely abnormality detection, because greenhouse environmental variables generally evolve on a minute scale rather than a second scale. Smaller window sizes provided less suppression of short-term noise, whereas larger window sizes increased smoothing delay and could reduce sensitivity to short but operationally meaningful deviations. Accordingly, N = 6 was retained as a balanced configuration for real-time supervisory monitoring.
2.3.2. Threshold Determination for Normal and Abnormal Environmental Conditions
Abnormality detection was conducted using the filtered signal (tk), which provided a noise-attenuated and temporally stable representation of the greenhouse environmental state. The use of filtered signals ensured that abnormality decisions reflected meaningful environmental deviations rather than short-term fluctuations or sensor noise. Normal and abnormal conditions were defined deterministically based on greenhouse climate management standards, plant physiological tolerance ranges reported in the literature, and practical operating limits of the deployed sensors.
For each environmental variable v lower and upper operational thresholds (Tmin, Tmax) were predefined to delineate acceptable greenhouse operating conditions. A filtered sample was classified as normal when the environmental condition remained within these bounds, as shown in Equation (6):
Conversely, a sample was classified as abnormal when the filtered signal exceeded the operational limits, as shown in Equation (7):
Based on this decision rule, a binary abnormality indicator was defined in Equation (8) as follows:
Each time step satisfying (tk) = 1 was defined as an abnormal sample, forming the fundamental unit for subsequent temporal validation and event-level abnormality analysis. This sample-level definition directly corresponded to the abnormal sample counts.
The threshold ranges in Table 1 were selected as conservative greenhouse-wide operational limits using three criteria: (i) agronomic ranges reported in greenhouse literature for avoiding plant stress; (ii) practical management limits used for supervisory monitoring; and (iii) physically meaningful sensor-output bounds for identifying implausible or fault-related measurements. Therefore, these thresholds were not intended to represent crop-specific optimal setpoints, but rather general limits for detecting sustained out-of-range, unsafe, or non-physical environmental conditions. Under this framework, saturation values, initialization codes, or communication error values were inherently classified as abnormal because they fell outside physically meaningful operating ranges.
Table 1.
Summary of the operational threshold ranges used to define normal and abnormal conditions for each monitored environmental variable.
Short-duration threshold violations frequently occurred because of transient environmental fluctuations or sensor artifacts and did not necessarily represent meaningful abnormal conditions. To suppress such false alarms, temporal validation was applied to the abnormality indicator sequence (tk).
A secondary sliding window of length M was maintained over the most recent abnormality indicators. A validated abnormal state was confirmed using a majority voting rule, as given in Equation (9):
where (tk) denotes the validated abnormality state for the environment variable v at time tk; (tk−j) represents the instantaneous abnormality indicators within the validation window; M is the temporal validation window length; and ⌈M/2⌉ is the majority threshold. A validated abnormal condition is confirmed when at least half of the samples within the window are classified as abnormal; otherwise, the state is considered normal. Consecutive validated abnormal samples were grouped and defined as a single abnormal event as Equation (10):
where denotes an abnormal event for the environmental variable v, defined as a contiguous sequence of time indices from tk1 to tk2, during which the validated abnormality state (tk) remains equal to 1. Event duration was calculated as D = (k2 − k1 + 1)Δt. This event-level definition formed the basis for abnormal event consolidation and duration analysis.
2.3.3. Algorithmic Integration of Signal Processing and Abnormality Detection
The complete signal processing and abnormality detection pipeline was implemented as a unified, deterministic algorithm executed entirely within the mobile application (Algorithm 1). The algorithm integrated real-time sliding-window buffering, moving-average signal smoothing, threshold-based state classification, and temporal validation using majority voting into a single causal execution flow.
Environmental measurements were processed independently for each sensor node and each environmental variable as samples arrived at the mobile device, sliding window buffering constrained memory usage by retaining only the most recent samples required for processing. Moving-average filtering was implemented using an incremental running-sum formulation, ensuring constant-time computational complexity per sample and preventing processing overhead from scaling with window size or number of sensor nodes.
Filtered signals were evaluated against predefined operational thresholds to generate instantaneous indicators of abnormality. Temporal validation was subsequently applied using majority voting over a secondary sliding window to confirm persistence of abnormal conditions and suppress short-lived threshold violations. Only validated abnormal states were treated as environmental abnormalities and forwarded to the event-handling stage. Because all buffering, filtering, classification, and validation steps were executed locally on the mobile device, the algorithm achieved low, bounded, and predictable latency under continuous multi-node data streaming.
| Algorithm 1: Mobile-edge Signal Processing and Abnormal Detection Algorithm |
| 1: PROCEDURE: Mobile-edge signal processing and abnormality detection 2: Input: Raw environmental sensor measurements (temperature, relative humidity, CO2 concentration, light intensity) Sliding-window length Operational thresholds Temporal validation window length 3: Output: Validated abnormality state 4: Initialize sliding window buffer 5: Initialize abnormality indicator buffer 6: For each newly received sensor sample 7: Append to buffer 8: If , remove the oldest sample using FIFO 9: If , proceed to the next sample 10: Compute filtered signal using the incremental moving-average formulation 11: If or 12: Set instantaneous abnormality indicator 13: Else: 14: Set instantaneous abnormality indicator 15: Append to buffer 16: If , remove the oldest indicator 17: Apply majority voting over buffer 18: If the majority condition is satisfied: 19: Confirm validated abnormal state 20: Else: 21: Suppress transient abnormality 22: End if 23: End for |
2.4. Experimental Site and Node Deployment
2.4.1. Greenhouse Layout and Study Areas
The experimental evaluation was conducted inside a research-scale, plastic-covered greenhouse located at Chungnam National University, Daejeon, Republic of Korea (36°22′7.8″ N, 127°21′15.3″ E). The greenhouse provided a controlled yet realistic agricultural environment for evaluating mobile-based environmental signal processing and ab-normality detection under practical operating conditions. The greenhouse structure had a total length of approximately 12.0 m, a width of 4.0 m, and a maximum internal height of 4.5 m, forming a single-span arched structure. The internal cultivation area was organized into longitudinal planting beds arranged along the greenhouse length, allowing clear separation of spatial monitoring zones. To support spatially representative environmental sensing, the greenhouse was divided into front, center, and rear sections, as illustrated in Figure 5, enabling the systematic evaluation of longitudinal environmental variability. In the vertical direction, the greenhouse space was segmented into three height layers, namely: the bottom layer at 1.0 m above ground level, the middle layer at 2.0 m, and the top layer at approximately 3.0 m near the roof structure. This layered configuration enabled characterization of vertical gradients in temperature, humidity, CO2 concentration, and light intensity, which are common in naturally ventilated greenhouse environments. The layout design ensured that environmental conditions were monitored across both horizontal and vertical dimensions, providing a comprehensive spatial dataset for validating the proposed signal processing and abnormality detection framework.
Figure 5.
Schematic overview of the test greenhouse layout and dimensions.
2.4.2. Node Deployment and System Integration
A total of 27 wireless environmental sensor nodes were deployed inside the greenhouse following a structured spatial configuration, as shown in Figure 6a. The nodes were distributed across the three longitudinal sections (front, center, rear) and the three vertical layers (bottom, middle, top), forming three vertical sensing lines along the greenhouse length. Each vertical line consisted of three sensor nodes, corresponding to the three height layers, enabling direct comparison of environmental conditions along the vertical axis. This deployment layout was selected to capture both vertical and longitudinal microclimatic variability within the greenhouse while maintaining a structured and comparable sensing arrangement. The nodes in each layer were positioned within the same greenhouse section to allow for the direct comparison of environmental conditions at similar horizontal locations while isolating height-dependent variation. This configuration enabled the systematic evaluation of temperature, relative humidity, CO2 concentration, and light intensity across the front, center, and rear zones and across the bottom, middle, and top layers under the same operational conditions.
Figure 6.
(a) Sensor node deployments in a greenhouse, and (b) a data acquisition box for transmitting data to the mobile application.
The environmental sensing nodes were designed to monitor key microclimate variables relevant to smart greenhouse operation, including air temperature (T), relative humidity (RH), CO2 concentration, and light intensity (LI). Each node integrated calibrated, low-power sensing elements selected to ensure measurement reliability under high-humidity and temperature-variable greenhouse conditions.
Air temperature and relative humidity were measured using a digital temperature–humidity sensor (DHT22; Aosong Electronics Co., Ltd., Guangzhou, China), providing a measurement range of −40 to 80 °C and 0 to 100% RH, with accuracies of ±0.5 °C and ±2%, respectively. These specifications support the reliable detection of vertical and spatial microclimate variation within the greenhouse canopy and upper layers. The CO2 concentration was measured using a nondispersive infrared (NDIR) sensor (MH-Z19B; Zhengzhou Winsen Electronics Technology Co., Ltd., Zhengzhou, China) operating over a 0 to 5000 ppm range with ±50 ppm accuracy, enabling the assessment of ventilation effectiveness and localized CO2 accumulation. Light intensity was monitored using a photodiode-based digital sensor (BH1750; Shenzhen Youxin Electronic Technology Co., Ltd., Shenzhen, China) with a detection range of 1 to 65,535 lx, suitable for capturing diurnal solar radiation patterns and shading effects.
All sensors were selected for low power consumption, long-term stability, and compatibility with periodic calibration. Factory calibration was verified prior to deployment using reference instruments under controlled conditions, and routine zero-offset and span checks were performed during maintenance to ensure data consistency throughout the monitoring period. The specifications and model numbers of the environmental sensors used in this study are summarized in Table 2.
Table 2.
Specifications of the environmental sensors used in the study.
Sensor nodes were mounted securely on greenhouse structural elements to minimize vibration and shading effects while ensuring consistent exposure to the surrounding environmental conditions. The deployment spacing between nodes was maintained at approximately 1.0 m horizontally and 1.0–3.0 m vertically, depending on the layer, as indicated in the layout diagram.
Sensor nodes transmitted time-stamped environmental measurements at a fixed sampling interval of 60 s using a low-power wireless communication protocol. Data from all nodes were aggregated by a LoRa gateway installed within the greenhouse and forwarded to a local data acquisition (DAQ) unit. The DAQ system, implemented using a microcontroller (model: Raspberry Pi 4B, Raspberry Pi Foundation, Cambridge, UK) and gateway, handled data buffering, preliminary routing, and communication with backend services, as illustrated in Figure 6b.
The gateway communicated with the backend infrastructure using lightweight messaging and REST-based Application Programming Interfaces (APIs), enabling seamless integration between the sensing layer, data services, and the mobile application. This architecture ensured reliable data delivery while maintaining low energy consumption at the sensor node level and low latency for mobile application-side processing. The smart greenhouse was cultivated with strawberries throughout the experimental period, and all environmental interpretation was conducted under strawberry-growing conditions. Real-time remote monitoring was performed continuously for more than one month at a fixed sampling interval of 60 s, following node-level functional verification and timestamp synchronization. In total, 27 environmental sensing nodes were deployed in the greenhouse, and each node measured air temperature, relative humidity, CO2 concentration, and light intensity. Under this configuration, the monitoring protocol generated 20,160 time-stamped records per node, corresponding to 80,640 variable-level measurements per node and 2,177,280 environmental observations in total across 27 nodes and four monitored variables.
2.5. Experimental and Analytical Procedures
The performance of the proposed mobile-edge framework was evaluated against a raw-signal baseline in which the same operational thresholds were applied directly to unfiltered sensor measurements without moving-average smoothing or temporal majority validation. This baseline was selected because direct threshold-based detection remains a simple and commonly used screening strategy in greenhouse monitoring, thereby allowing the contribution of mobile-side filtering and validation to be isolated clearly. As illustrated in Figure 7, the evaluation framework followed a sequential mobile-side processing pipeline consisting of sensor data arrival, sliding-window buffering, moving-average filtering, abnormality validation, and visualization with notification. The analysis focused on variability reduction, abnormal sample counts, abnormal event count, event duration, abnormality index, and end-to-end latency under continuous multi-node streaming.
Figure 7.
Mobile application processing and evaluation timeline illustrating sensor data arrival at the mobile edge, sliding-window buffering, moving-average filtering, abnormality validation based on pre-defined thresholds, and subsequent visualization and notification generation.
For the proposed method, incoming sensor samples were appended to a fixed-length sliding-window buffer immediately after arrival at the mobile application at time . Once the buffer size reached the predefined window length , the filtered signal was computed using a moving-average operation. For the baseline method, the same operational thresholds (, ) were applied directly to the raw signal without filtering or temporal validation. This paired analysis enabled direct assessment of the effect of mobile-side smoothing and validation on abnormality classification.
Abnormal events were defined as temporally contiguous sequences of abnormal samples following the validation stage shown in Figure 7. Event characteristics were quantified in terms of event count, event duration, and the proportion of abnormal samples within each event. To assess variability reduction and abnormality consolidation introduced by mobile-side filtering, raw and filtered signals were compared using the relative variance reduction metric shown in Equation (11):
where and denote the variances in the raw and filtered signals, respectively. To further quantify potential detection bias caused by filtering, an abnormality index was defined in Equation (12):
where Nfiltered and Nraw represent the number of abnormal samples detected in the filtered and raw signals, respectively. An index value close to unity indicates unbiased abnormality detection.
Mobile application performance was evaluated through end-to-end processing latency analysis, corresponding to the processing delay. The latency τ was defined as the elapsed time between sensor data arrival at the mobile application and completion of visualization and alert generation, as shown in Equation (13):
where tarrival and tdisplay denote the times of data reception and visualization, respectively. Latency behavior was characterized using percentile-based metrics and the complementary cumulative distribution function (CCDF) to capture both typical and worst-case delay behavior under sustained multi-node operation, as shown in Equation (14):
The moving-average filter was implemented using an incremental running-sum formulation with constant-time computational complexity O(1). This implementation ensured scalability with respect to both sliding-window length and the number of concurrently connected sensor nodes, consistent with the real-time processing workflow depicted in Figure 7.
3. Results
3.1. Effect of Signal Processing on Smart Greenhouse Environmental Parameters
The output of the signal processing framework was evaluated by comparing raw and processed greenhouse environmental signals for temperature, humidity, CO2 concentration, and light intensity. Raw signals across sensor nodes retained full short-term variability, whereas processed signals were obtained using moving-average filtering and emphasized sustained temporal behavior. The comparison focused on changes in signal range, peak magnitude, and temporal smoothness, as illustrated in Figure 8. For all parameters, the processed signals exhibited reduced short-term fluctuations relative to the raw signals while preserving the overall temporal evolution and extreme-value behavior relevant to greenhouse operation. Comparisons between raw and processed signals were summarized in Table 3.
Figure 8.
Comparison of raw and processed greenhouse environmental signals under moving-average filtering: (a) temperature, (b) humidity, (c) CO2 concentration, and (d) light intensity. Gray lines denote raw signals, while red lines indicate moving-average processed signals.
Table 3.
Comparison results for raw and processed greenhouse environmental signals.
The processed temperature signal exhibited a pronounced diurnal pattern through-out the monitoring period (Figure 8a). Nighttime temperatures generally decreased to approximately 40–45 °C, whereas daytime values increased substantially, with repeated peaks exceeding 65 °C and occasional excursions approaching 80 °C. The raw signal contained frequent short-duration spikes and rapid oscillations, particularly during daytime heating. After processing, high-frequency fluctuations were attenuated, and the dominant daily heating and cooling cycles became more clearly resolved. Several sustained intervals exceeded the upper operational threshold of 40 °C, indicating prolonged exposure to potentially stressful thermal conditions.
Humidity exhibited an inverse temporal relationship with temperature (Figure 8b). The raw signal showed pronounced short-term variability during periods of rapid thermal change, while the processed signal emphasized longer-term humidity trends by sup-pressing transient fluctuations. Nighttime humidity frequently approached or exceeded 90%, whereas daytime values typically decreased to approximately 50–70%. Short-duration excursions below 30% were also observed, crossing both the lower and upper defined operational thresholds.
CO2 concentration displayed substantial temporal variability over the observation period (Figure 8c). The raw signal contained numerous sharp spikes and abrupt drops, with concentrations ranging from near-ambient levels to peaks exceeding 10,000 ppm. After processing, transient spikes were suppressed, and longer-duration concentration regimes became more apparent. Multiple sustained intervals exceeded the upper threshold of 2300 ppm, while extended periods approached or fell below the lower bound of 300 ppm, reflecting dynamic ventilation and gas exchange conditions.
Light intensity showed the greatest temporal variability among the monitored parameters (Figure 8d). Raw signals exhibited sharp peaks and rapid oscillations associated with changes in solar radiation and shading. The processed signal reduced high-frequency fluctuations while preserving the overall timing, magnitude, and duration of the daily illumination cycles. Daytime light intensity typically ranged between approximately 10,000 and 30,000 lx, with repeated peaks approaching the upper operational limit, whereas nighttime values consistently remained near zero.
In the mobile application, raw and processed environmental signals were visualized at the individual sensor-node level to support real-time comparison and quantitative interpretation (Figure 9). For representative nodes (09 and 21), raw temperature, humidity, CO2, and light intensity signals exhibited short-term fluctuations and abrupt variations, whereas the processed signals showed smoother trends with reduced high-frequency noise. Temperature and humidity signals displayed clearer temporal patterns after processing, CO2 concentrations exhibited attenuated transient variations, and light intensity signals highlighted sustained illumination changes. These observations confirm that the mobile application effectively presents both raw and processed data, enabling a clear assessment of environmental conditions and the impact of signal processing in real time.
Figure 9.
Mobile application visualization of raw and processed greenhouse environmental signals at the sensor-node level: (a,b) Raw and processed signals for sensor node 09 and (c,d) raw and processed signals for sensor node 21, including air temperature, relative humidity, CO2 concentration, and light intensity.
Signal quality improvement through temporal averaging was evaluated using signal-to-noise ratio (SNR) analysis based on the ensemble superposition of greenhouse environmental sensor data. As the number of superpositions increased, the estimated signal amplitude rapidly converged to a stable level of approximately 2.0 × 10³, indicating that the dominant environmental component was consistently reinforced through averaging. In contrast, the estimated noise amplitude increased initially and then stabilized at approximately 7.5–8.0 × 10³, reflecting the asymptotic behavior of uncorrelated noise under repeated superposition. This divergence in convergence behavior between signal and noise components illustrates the effectiveness of temporal averaging in isolating structured environmental trends from fluctuations.
The resulting SNR exhibited a sharp increase at low averaging depths, followed by gradual convergence to a stable range of approximately 0.25–0.30 after 500–1000 superpositions. Beyond this range, additional averaging yielded only marginal improvement, indicating diminishing returns in noise suppression. This convergence behavior was consistent with theoretical expectations for ensemble averaging, in which most gains are achieved with moderate averaging depth. The observed stabilization of SNR confirms that the moving-average-based processing described in materials and methods effectively enhanced signal robustness while preserving underlying environmental dynamics, supporting its suitability for greenhouse monitoring and real-time mobile visualization, as illustrated in Figure 10.
Figure 10.
Signal quality improvement via ensemble averaging of greenhouse environmental sensor data.
3.2. Abnormality Detection and Real-Time Notification Performance
The performance of abnormality detection was quantitatively evaluated by analyzing abnormal sample counts, abnormal event characteristics, and the relative abnormality index derived from filtered and raw signals across all monitored variables. The quantitative detection performance and abnormal conditions were clearly and intuitively visualized through the mobile application for a real-time notification interface. As shown in Figure 11, once an abnormal event was confirmed through temporal validation, the application generated a structured alert identifying the affected sensor node, the environmental variable, and the abnormal value. Multiple concurrent abnormalities detected at the same node were aggregated within a single notification, enabling rapid diagnosis of compound environmental issues. Node-level alerts simultaneously reported out-of-range temperature and humidity values as well as abnormal CO2 or light intensity readings, indicating sensor malfunction or persistent out-of-range conditions rather than transient noise. The notification list pro-vided a chronological overview of abnormal events across different nodes, allowing operators to quickly identify spatial patterns and prioritize intervention. This visualization strategy enhances situational awareness by translating processed signal-level decisions into actionable, human-readable alerts, thereby supporting timely greenhouse management decisions without requiring direct inspection of raw or filtered time-series data.
Figure 11.
Real-time mobile notifications of environmental abnormalities detected at the sensor-node level.
The comparison between raw and filtered abnormal sample counts showed that moving-average filtering refined abnormality classification rather than uniformly suppressing detections. Abnormal temperature and CO2 samples increased slightly (+1.1% and +0.4%, respectively), indicating improved sensitivity to sustained deviations after high-frequency noise attenuation. In contrast, abnormal humidity samples decreased marginally (−0.5%) due to the suppression of short-lived threshold crossings caused by rapid fluctuations and sensor noise. Light intensity abnormal samples remained effectively unchanged (0.0%) because illumination-related abnormalities were predominantly sustained and therefore unaffected by temporal averaging. Overall, the filtering process selectively reduced noise-induced false positives while preserving persistent abnormal conditions, as illustrated in Table 4.
Table 4.
Summary of the environmental abnormal samples before and after moving-average filtering in the mobile application.
Abnormal event consolidation and duration analysis demonstrated that the most pronounced performance improvement occurred at the event level. Following moving-average filtering and temporal validation, the total number of abnormal events decreased substantially across all environmental variables, while event persistence increased. Abnormal temperature events were reduced from 490 to 150, accompanied by an increase in median event duration from 5 min to 38 min, indicating consolidation of fragmented detections into fewer, more meaningful abnormal episodes. Humidity events decreased from 231 to 47, CO2 events from 79 to 62, and light intensity events from 228 to 110. Across all variables, median event duration increased by roughly twofold to sevenfold, confirming effective suppression of transient anomalies while preserving persistent abnormal conditions as shown in Figure 12. At the same time, this result also reflects a trade-off: some short-duration abnormal excursions may be smoothed out or merged into longer-valid events. The selected configuration therefore prioritizes robust detection of sustained abnormal conditions over maximal sensitivity to very brief threshold crossings, which was considered appropriate for minute-scale greenhouse monitoring.
Figure 12.
Trade-off between abnormal event reduction and event persistence achieved through mobile application-based signal processing.
To assess the potential detection bias introduced by mobile application-side processing, the abnormality index was evaluated for each variable. Temperature and CO2 concentration exhibited indices of 1.011 and 1.004, respectively, indicating minor amplification of sustained abnormal conditions. Humidity showed a slightly conservative response (0.995), while light intensity remained effectively unbiased (1.000). All deviations from unity were within ±1.1%, demonstrating negligible systematic bias. Overall, these results confirm that the proposed mobile-application-based framework effectively reduces false alarms, consolidates abnormal events, and enhances detection robustness and temporal consistency, enabling reliable real-time greenhouse monitoring and decision support at the mobile edge.
3.3. Performance and Real-Time Execution Efficiency of the Monitoring Application
The real-time performance of the proposed mobile-edge monitoring application was evaluated with respect to execution stability, computational latency, scalability under multi-node load, and bounded abnormality confirmation delay. The evaluation was conducted during continuous streaming of synchronized environmental data from 27 distributed wireless sensor nodes operating at a fixed sampling interval of 60 s. Throughout the experimental period, the application operated without crashes, memory overflow, data packet loss, or synchronization errors. Signal buffering, running-sum moving-average filtering, deterministic threshold comparison, and temporal majority-based validation were executed locally on the smartphone device. No observable user interface blocking, frame drops, or notification instability occurred during sustained operation, indicating effective isolation between computational tasks and the visualization layer under asynchronous execution. End-to-end computational latency was defined as the elapsed time between reception of a sensor measurement at the mobile device and completion of signal processing, abnormality classification, and graphical update. The principal latency statistics under varying load conditions are summarized in Table 5.
Table 5.
End-to-end computational latency statistics under varying load conditions.
Median latency increased from 1.0 s to 1.6 s between light and peak conditions, corresponding to a 60% relative increase under intensified computational stress but only 0.6 s absolute growth. The 95th percentile delay remained strictly bound below 3.5 s across all scenarios. The maximum observed latency did not exceed 4.0 s, representing <6% of the 60 s sampling interval. A linear regression analysis of median latency versus load intensity yielded an approximately linear scaling trend (R2 > 0.98), indicating controlled and predictable growth without nonlinear escalation. The latency increases per load remained below 0.25 s, confirming bounded scalability. To characterize worst-case delay behavior, complementary cumulative distribution functions (CCDFs) are analyzed, as shown in Figure 13.
Figure 13.
Complementary cumulative distribution functions (CCDFs) of end-to-end processing delay under progressive load conditions: (a) light, (b) moderate, (c) high, and (d) peak load. Dashed and dotted lines indicate median (μ50) and 95th percentile (μ95) delays, respectively.
The CCDF curves demonstrated rapid exponential-like tail decay under all load conditions, with the probability of delays exceeding 3.5 s remaining ≤10−3. No heavy-tailed latency distribution was observed, indicating strong temporal determinism and absence of computational jitter amplification under increased node density. Latency scaling followed a near-linear trend as load increased, rather than exhibiting nonlinear escalation, con-firming controlled scalability of the mobile-edge processing architecture. The bounded latency behavior directly resulted from the algorithmic design. The running-sum implementation of the moving-average filter ensured constant-time O(1) updates per incoming sample, preventing computational complexity from scaling with window length or historical buffer size. Consequently, incremental latency under higher load was primarily attributable to message handling and rendering operations rather than filtering complexity. This architectural characteristic indicated that the system could support further sensor expansion without exponential growth in processing delay.
For contextual interpretation, it is noteworthy that cloud-mediated greenhouse monitoring architectures typically introduce multi-stage transmission, server-side processing, and round-trip synchronization delays that can exceed several seconds under network congestion. In contrast, the proposed mobile-edge execution pipeline confines processing delay to the local device, eliminating network-dependent computation and ensuring bounded latency independent of external server load. It was important to distinguish computational latency from abnormal confirmation delay. While computational processing remained within seconds, temporal validation introduced a bounded confirmation interval determined by the sampling interval and sliding-window length. With a 60 s sampling interval and N = 6, the theoretical maximum confirmation delay equaled 5 min. Empirical observations showed that most abnormal events were con-firmed within approximately two to three minutes, with worst-case delays approaching the upper bound only under marginal threshold-crossing conditions. This bounded delay represented a deliberate stability responsive trade-off: shorter windows reduced confirmation time but increased false alarm fragmentation, whereas the selected configuration prioritized detection robustness appropriate for minute-scale greenhouse environmental dynamics. Collectively, the results demonstrated that the proposed mobile-edge architecture achieved (i) sub-4-second bounded computational latency, (ii) predictable minute-scale abnormality confirmation aligned with environmental dynamics, and (iii) stable near-linear scalability under multi-node stress. These findings confirmed that real-time environmental supervision and abnormality detection were reliably executed at the mobile edge without dependence on continuous cloud-side computation, thereby supporting scalable deployment in smart greenhouse monitoring systems. From a greenhouse management standpoint, these latency characteristics were operationally important because they allow persistent abnormal environmental conditions to be communicated to operators within a practically useful decision window. Faster and more stable notification of temperature, humidity, CO2, and light abnormalities can support earlier intervention, reduce prolonged crop exposure to stressful conditions, and improve confidence in real-time supervisory monitoring. In addition, reducing fragmented false alarms is valuable for greenhouse operation because it decreases alarm fatigue and helps managers focus on sustained abnormal events that are more likely to require corrective action.
3.4. Energy Efficiency of Mobile-Edge Processing and Resource Utilization
The resource overhead and energy efficiency of the proposed mobile-edge monitoring framework were systematically evaluated under progressive multi-node load conditions (light, moderate, high, and peak). The analysis focused on battery power consumption, CPU utilization, and memory footprint to quantify computational scalability and assess suitability for sustained real-time deployment in greenhouse environments, as shown in Table 6.
Table 6.
Resource utilization under progressive load conditions.
Battery power increased monotonically from approximately 1450 mW under the light load to approximately 4300 mW under the peak load. Regression analysis confirmed strong linear scaling (R2 > 0.97). The average incremental increase was approximately 950 mW per load level, indicating predictable energy overhead proportional to computational demand. No nonlinear amplification or abrupt power spikes were observed, suggesting the absence of hidden algorithmic bottlenecks.
CPU utilization increased progressively from approximately 50% to 65% across load levels. One-way ANOVA confirmed statistically significant load-dependent variation in CPU utilization (p < 0.01, η2 indicating moderate-to-large effect size). Despite the increased workload, CPU utilization remained below saturation thresholds, preserving computational headroom for additional node integration. In contrast, the memory footprint remained stable across all conditions, with variation below 2%. ANOVA indicated no statistically significant load effect on memory usage (p > 0.05), confirming the absence of memory leakage, buffer accumulation, and heap fragmentation during sustained operation, as illustrated in Figure 14.
Figure 14.
Resource utilization and energy scaling of the mobile-edge monitoring application under progressive load conditions: (a) battery power consumption, (b) CPU utilization, and (c) memory footprint. Error bars denote standard deviation.
The combined latency and resource analyses demonstrated that the mobile-edge execution framework maintained computational efficiency under progressive multi-node stress. Although battery power increased with load intensity, scaling remained approximately linear with processing demand, indicating a bounded energy cost per processed sample as node density increased. This controlled behavior was attributed to three architectural properties: (i) constant-time O(1) signal filtering, which prevented growth in algorithmic complexity; (ii) asynchronous task isolation, which decoupled computation from interface rendering and avoided execution congestion; and (iii) fully local abnormality classification, which eliminated network-induced variability. Under peak load, computational latency remained below 4 s, CPU utilization did not reach saturation, and memory usage showed no statistically significant variation, collectively indicating balanced resource allocation without structural bottlenecks.
In contrast to cloud-mediated greenhouse monitoring architectures, where transmission latency, server-side processing, and round-trip synchronization introduce timing and energy variability, the proposed mobile-edge design confines signal interpretation to the smartphone device. This local execution model ensured deterministic latency, predictable energy scaling, and independence from backend congestion. Overall, the results confirmed statistically validated scalability and stable resource utilization, supporting the suitability of the framework for distributed greenhouse monitoring requiring low-latency supervision and sustained long-duration operations.
4. Discussion
This study demonstrated that deterministic signal conditioning and abnormality detection can be executed entirely at the mobile edge while maintaining bounded latency, statistical robustness, and scalable resource behavior. Rather than treating the smartphone as a passive visualization endpoint, the proposed architecture redefined it as an active computational node within the greenhouse sensing hierarchy. This structural repositioning eliminated backend-dependent decision latency and suppressed noise propagation before visualization, addressing a fundamental architectural weakness in cloud- and gateway-centric greenhouse monitoring systems [29]. The agronomic relevance of this framework lies in its ability to transform raw environmental signals into actionable supervisory information for greenhouse crop management. In practice, abnormality detection is valuable not simply because it identifies out-of-range measurements, but because it can warn operators of conditions associated with heat stress, excessive humidity, reduced photosynthetic efficiency, or unstable radiation exposure before these conditions persist long enough to impair crop performance. Accordingly, the contribution of the present work extends beyond edge computation alone and includes a practical monitoring function that can support crop-protection decisions and more stable greenhouse climate management [30].
Conventional greenhouse monitoring platforms typically rely on centralized or gate-way-level processing for filtering and anomaly detection [31,32]. While such architectures enable aggregation and long-term storage, they inherently introduce multi-stage transmission latency and round-trip synchronization delays. Reported end-to-end delays frequently exceed several seconds and may approach or surpass ten seconds under network congestion [33,34]. In contrast, the mobile-edge framework achieved median processing delays of 1.0–1.6 s and maintained 95th-percentile delays below 4.0 s under sustained 27-node streaming. Complementary cumulative distribution analysis showed rapid tail decay without heavy-tailed amplification, indicating deterministic timing behavior rather than queue-induced latency escalation. This distinction is critical: deterministic bounded latency ensures that abnormal environmental transitions are reflected at the operator interface within a predictable temporal window, independent of backend variability.
From a signal-processing perspective, numerous techniques have been applied in environmental monitoring, including low-pass filtering [11,35], adaptive filtering [36], Kalman estimation [13,14], and wavelet-based multiscale analysis [12,15]. While these methods offer strong theoretical foundations, their deployment in greenhouse environments presents practical constraints. Kalman-based approaches require stable state-space modeling and covariance tuning, which are difficult to maintain in spatially heterogeneous, seasonally dynamic agricultural systems [13,14]. Wavelet-domain approaches introduce higher memory and computational overhead [12,15]. Machine-learning-based anomaly detection frameworks provide adaptive pattern recognition [17,18,19], but they demand labeled datasets, retraining, and greater inference complexity, limiting interpretability and in-creasing computational burden.
In contrast, the moving-average strategy implemented here achieved a 35–55% reduction in short-term variability with constant-time O(1) computational complexity. Prior greenhouse studies reported variability reductions of 20–40% using gateway-side filtering [37,38], but they rarely quantified event-level consequences or detection bias. The present results demonstrate that smoothing translated into operationally meaningful improvements: abnormal event frequency was reduced by more than 50% for key variables, while abnormality indices remained within ±1.1% of unity. This indicates that persistent environmental deviations were preserved rather than attenuated, addressing a common criticism of smoothing-based detection frameworks.
A central contribution of this work lies in shifting abnormality analysis from sample-level evaluation to event-level interpretation. Many greenhouse systems rely on instantaneous threshold violations [35,36], which are highly sensitive to transient oscillations caused by ventilation turbulence, misting events, or sensor artifacts. False alarm rates exceeding 30–50% have been documented in practice [37], yet few studies quantify abnormality persistence or consolidation. Here, abnormal temperature events decreased from 490 to 150 after filtering and validation, while median event duration increased from 5 min to 38 min. This consolidation reflects the suppression of fragmentation rather than the loss of detection sensitivity. Nevertheless, this gain in robustness is accompanied by reduced sensitivity to very brief abnormal excursions, which may be smoothed or merged during filtering and temporal validation. By preserving event integrity while reducing spurious triggers, the framework aligns detection logic with the temporal dynamics of greenhouse microclimates, which evolve on minute-scale rather than second-scale horizons.
Scalability and resource behavior further distinguish between the proposed architecture. Edge computing has been advocated in agricultural IoT to reduce bandwidth de-pendency and improve responsiveness [27,28], yet most implementations deploy analytics at gateway or fog layers. Smartphone applications have generally functioned as visualization clients rather than deterministic processing engines. In the present implementation, battery power increased proportionally with load (R2 > 0.97), CPU utilization remained below saturation thresholds, and memory usage exhibited no statistically significant load dependence (p > 0.05). The constant-time filtering formulation ensured that computational complexity did not scale with window size or historical depth, preventing nonlinear resource amplification. This bounded scaling behavior is essential for sustained agricultural monitoring, where devices must operate continuously across seasonal cycles without performance degradation [38].
Architecturally, the framework contributes a decoupling principle: environmental interpretation can be separated from backend persistence without sacrificing reliability. By executing signal conditioning and validation at the user-device layer, the monitoring system becomes resilient to backend congestion and intermittent connectivity. This design reduces structural dependency on continuous cloud analytics while maintaining deterministic execution and interpretability—advantages not typically offered by data-driven black-box anomaly detection models [17,18,19].
Importantly, the contribution of this study is not the novelty of the moving-average algorithm itself, but the demonstration that a fully mobile-executed deterministic pipeline can achieve statistically validated robustness, event-level consolidation, and bounded latency under realistic multi-node deployment. The framework bridges a structural gap between lightweight deterministic processing and scalable edge computing in precision agriculture. Although performance was validated under a 27-node configuration, scalability beyond this density and across heterogeneous smartphone hardware platforms warrants further investigation. Future research may explore adaptive window strategies, hybrid deterministic–learning detection schemes for rare-event classification, and integration with predictive control or digital-twin greenhouse models.
Overall, the findings establish that mobile-edge deterministic signal processing provides a viable and scalable alternative to centralized greenhouse monitoring paradigms. By achieving sub-4-second bounded latency, substantial abnormal event consolidation, negligible detection bias, and statistically stable resource scaling, the proposed architecture advances real-time environmental supervision toward a more autonomous, responsive, and infrastructure-resilient model suitable for precision agriculture systems.
5. Conclusions
Deterministic, low-latency environmental supervision in greenhouse systems requires the architectural integration of signal conditioning, abnormality validation, and visualization within a unified execution layer. The results of this study demonstrate that relocating these operations to the mobile edge enables real-time environmental interpretation without dependence on continuous cloud-side analytics while maintaining statistical robustness and bounded computational complexity.
Mobile-side moving-average filtering reduced short-term signal variability by 35–55% across temperature, humidity, CO2 concentration, and light intensity, while preserving constant-time O(1) computational complexity and maintaining effective response delays below two sampling intervals. Variability suppression translated into operationally meaningful improvements at the event level. Abnormal detections were consolidated by more than 50% for key environmental variables, and the median event duration increased from 5 min to 38 min for temperature, with comparable multi-fold extensions observed across other parameters. Detection fidelity remained preserved, as abnormality indices stayed within ±1.1% of unity, indicating negligible systematic bias and retention of sustained environmental deviations.
Under sustained streaming from 27 distributed sensor nodes, the mobile-edge framework maintained deterministic latency characteristics, with median end-to-end processing delays of 1.0–1.6 s and 95th-percentile delays below 4.0 s. Latency distributions exhibited bounded tails without heavy-tailed escalation, and scalability analysis confirmed near-linear growth behavior under progressive load. CPU utilization remained below saturation thresholds, memory footprint showed no statistically significant load dependence, and battery power increased proportionally rather than exponentially, confirming stable computational and energy behavior. The principal contribution of this study lies in architectural validation rather than algorithmic novelty. Executing signal conditioning and abnormality classification entirely at the user-device layer decoupled environmental interpretation from backend variability, reduced structural dependency on centralized computation, and enhanced operational resilience under intermittent connectivity. The smartphone functioned as an active analytical node within the greenhouse sensing hierarchy rather than a passive visualization interface.
Collectively, the findings confirm that mobile-edge deterministic processing constitutes a robust, scalable, and infrastructure-resilient alternative to centralized greenhouse monitoring paradigms. Beyond its engineering value, the validated framework has clear agronomic relevance because it supports the earlier recognition of environmental conditions associated with crop stress, excessive humidity, unstable CO2 balance, and abnormal light exposure. By improving the timeliness and reliability of abnormality detection at the user-device level, the proposed system can contribute to more responsive greenhouse supervision, better-informed climate-control decisions, and improved crop-environment management in protected cultivation systems.
Author Contributions
Conceptualization, E.B., M.N.R. and S.-O.C.; methodology, E.B. and M.N.R.; software, E.B. and M.N.R.; validation, E.B., M.N.R., H.J., H.C. and S.-O.C.; formal analysis, E.B., M.N.R., H.J. and H.C.; investigation, H.C. and S.-O.C.; resources, S.-O.C.; data curation E.B., M.N.R., H.J. and H.C.; writing—original draft preparation, E.B.; writing—review and editing, M.N.R., H.C. and S.-O.C.; visualization, E.B., M.N.R. and H.J.; supervision, S.-O.C.; project administration, S.-O.C.; funding acquisition, S.-O.C. All authors have read and agreed to the published version of the manuscript.
Funding
This study was supported by the Korea Institute of Planning and Evaluation for Technology in Food, Agriculture and Forestry (IPET), through the Smart Farm Multi-Ministry Package Innovation Technology Development Project Program, funded by the Ministry of Agriculture, Food and Rural Affairs (MAFRA) (Project No. RS-2025-02310974), Republic of Korea.
Data Availability Statement
Data are contained within the article.
Conflicts of Interest
The authors declare no conflicts of interest.
References
- Wanyama, J.; Bwambale, E. Precision water management. In Encyclopedia of Digital Agricultural Technologies; Springer: Cham, Switzerland, 2023; pp. 1062–1069. [Google Scholar]
- Sharma, T.; Ananthakrishnan, S.; Gawdiya, S.; Rawat, A.; Singh, A.; Suryawanshi, Y.; Rana, R.S. Hydroponics farming: A holistic perspective for crop production. In Oilseed Crops; Wiley: Malden, MA, USA, 2025; pp. 309–332. [Google Scholar] [CrossRef] [Scilit]
- Grasso, N.; Fasciolo, B.; Awouda, A.M.M.; Bruno, G. A smart aeroponic chamber: Structure and architecture for efficient production and resource management. In Hydroponics: The Future of Sustainable Farming; Springer: New York, NY, USA, 2024; pp. 353–380. [Google Scholar]
- Lan, Y.; Xu, W. Precision agricultural aviation for agrochemical applications. In Encyclopedia of Digital Agricultural Technologies; Springer: Cham, Switzerland, 2023; pp. 1002–1013. [Google Scholar]
- Miao, Y. Precision nutrient management. In Encyclopedia of Digital Agricultural Technologies; Springer: Cham, Switzerland, 2023; pp. 1054–1061. [Google Scholar]
- Simo, A.; Dzitac, S.; Duțu, A.; Pandelica, I. Smart agriculture in the digital age: A comprehensive IoT-driven greenhouse monitoring system. Int. J. Comput. Commun. Control 2023, 18, 6147. [Google Scholar] [CrossRef] [Scilit]
- Babar, A.Z.; Akan, O.B. Sustainable and precision agriculture with the Internet of Everything (IoE). arXiv 2024, arXiv:2404.06341. [Google Scholar] [CrossRef] [Scilit]
- Alsamhi, S.H.; Ma, O.; Ansari, M.S.; Almalki, F.A. Survey on collaborative smart drones and Internet of Things for improving the smartness of smart cities. IEEE Access 2019, 7, 128125–128152. [Google Scholar] [CrossRef] [Scilit]
- Sarkar, D.; Shukla, A.; Kumar, A.; Sadhu, P.K. Role of Internet of Things in maximum power extraction from BIPV modules: A review for developing smart zero energy buildings. Int. J. Eng. Technol. 2018, 7, 1033–1037. [Google Scholar] [CrossRef] [Scilit]
- Bicamumakuba, E.; Reza, M.N.; Jin, H.; Samsuzzaman; Lee, K.H.; Chung, S.-O. Multi-sensor monitoring, intelligent control, and data processing for smart greenhouse environment management. Sensors 2025, 25, 6134. [Google Scholar] [CrossRef] [Scilit]
- Usmani, U.A.; Aziz, I.A.; Jaafar, J.; Watada, J. Deep learning for anomaly detection in time-series data: An analysis of techniques, Review of applications, and guidelines for future research. IEEE Access 2024, 12, 174564–174590. [Google Scholar] [CrossRef] [Scilit]
- Cheraghinia, M.; Shahid, A.; Luchie, S.; Gordebeke, G.J.; Caytan, O.; Fontaine, J.; De Poorter, E. A comprehensive overview on UWB radar: Applications, standards, signal processing techniques and trends. IEEE Commun. Surv. Tutor. 2024, 27, 2283–2324. [Google Scholar] [CrossRef] [Scilit]
- Zhao, J.; Netto, M.; Mili, L. A robust iterated extended Kalman filter for power system dynamic state estimation. IEEE Trans. Power Syst. 2016, 32, 3205–3216. [Google Scholar] [CrossRef] [Scilit]
- Zhang, J.; Welch, G.; Bishop, G.; Huang, Z. A two-stage Kalman filter approach for robust and real-time power system state estimation. IEEE Trans. Sustain. Energy 2013, 5, 629–636. [Google Scholar] [CrossRef] [Scilit]
- Shore, N. Wavelet-based time-frequency fingerprinting for feature extraction of traditional Irish music. arXiv 2025, arXiv:2508.00479. [Google Scholar]
- Li, S.; Shi, W.; Lu, J.; Zhang, H.; Wang, Y.; Zhang, P.; Wang, Y. Progress in aero-engine fault signal recognition and intelligent diagnosis. Machines 2026, 14, 118. [Google Scholar] [CrossRef] [Scilit]
- Idouglid, L.; Tkatek, S.; Elfayq, K.; Guezzaz, A. A novel anomaly detection model for the industrial Internet of Things using machine learning techniques. Radioelectron. Comput. Syst. 2024, 1, 143–151. [Google Scholar] [CrossRef] [Scilit]
- Usmani, U.A.; Happonen, A.; Watada, J. A review of unsupervised machine learning frameworks for anomaly detection in industrial applications. In Intelligent Computing. SAI 2022; Lecture Notes in Networks and Systems; Arai, K., Ed.; Springer: Cham, Switzerland, 2022; Volume 507. [Google Scholar] [CrossRef] [Scilit]
- Mikayilov, K.; Gardashova, L. Modern anomaly detection methods in industry: Comparative analysis of machine learning algorithms. Science 2025, 14, 100154. [Google Scholar]
- Kalmyrzayev, B.; Ali, H.; Akhtar, M.T. Spectral filtering using periodic autoregressive moving average graph neural networks. IEEE Access 2026, 14, 9696–9716. [Google Scholar] [CrossRef] [Scilit]
- Shah, J.H.; Jhaveri, R.H. Filtering and spectral analysis of time series data. In Data Science and Its Applications; Chapman & Hall/CRC: Boca Raton, FL, USA, 2021; pp. 103–126. [Google Scholar]
- Gong, Y.; Bao, C.; He, Z.; Jian, Y.; Wang, X.; Huang, H.; Song, X. Gas pipeline leak detection: Acoustic-based, OGI-based, and multimodal fusion methods. Information 2025, 16, 731. [Google Scholar] [CrossRef] [Scilit]
- Nsoh, B.; Katimbo, A.; Guo, H.; Heeren, D.M.; Nakabuye, H.N.; Qiao, X.; Kiraga, S. IoT-based machine learning solutions for smart irrigation management. Sensors 2024, 24, 7480. [Google Scholar] [CrossRef] [Scilit]
- Alhashemi, K.; Altinoz, O.T. Power demand forecasting using singular spectrum analysis and Kalman filter-smoother. IEEE Access 2025, 13, 164130–164155. [Google Scholar] [CrossRef] [Scilit]
- Lu, S.; Lu, J.; An, K.; Wang, X.; He, Q. Edge computing on IoT for machine signal processing and fault diagnosis: A review. IEEE Internet Things J. 2023, 10, 11093–11116. [Google Scholar] [CrossRef] [Scilit]
- Xu, W.; Yang, Z.; Ng, D.W.K.; Levorato, M.; Eldar, Y.C.; Debbah, M. Edge learning for B5G networks with distributed signal processing. IEEE J. Sel. Top. Signal Process. 2023, 17, 9–39. [Google Scholar] [CrossRef] [Scilit]
- Mao, Y.; You, C.; Zhang, J.; Huang, K.; Letaief, K.B. A survey on mobile edge computing: The communication perspective. IEEE Commun. Surv. Tutor. 2017, 19, 2322–2358. [Google Scholar] [CrossRef] [Scilit]
- Modupe, O.T.; Otitoola, A.A.; Oladapo, O.J.; Abiona, O.O.; Oyeniran, O.C.; Adewusi, A.O.; Obijuru, A. Reviewing the transformational impact of edge computing on real-time data processing and analytics. Comput. Sci. IT Res. J. 2024, 5, 693–702. [Google Scholar] [CrossRef] [Scilit]
- Arregui Almeida, D.; Chafla Altamirano, J.; Román Cañizares, M.; Játiva, P.P.; Guaña-Moya, J.; Sánchez, I. Gateway-free LoRa mesh on ESP32: Design and empirical performance. Sensors 2025, 25, 6036. [Google Scholar] [CrossRef] [Scilit] [PubMed]
- Bicamumakuba, E.; Habineza, E.; Reza, M.N.; Chung, S.-O. IoT-enabled LoRaWAN gateway for monitoring and predicting spatial environmental parameters in smart greenhouses. Precis. Agric. Sci. Technol. 2025, 7, 28–46. [Google Scholar]
- Shu, J.; Quan, Y.; Yang, D. LSTM–AE–Bayes embedded gateway for real-time anomaly detection in agricultural wireless sensor networks. Smart Agric. Technol. 2025, 11, 100944. [Google Scholar] [CrossRef] [Scilit]
- Bayih, A.Z.; Morales, J.; Assabie, Y.; De By, R.A. Utilization of Internet of Things and Wireless Sensor Networks for Sustainable Smallholder Agriculture. Sensors 2022, 22, 3273. [Google Scholar] [CrossRef] [Scilit] [PubMed]
- Yu, Y.; Xu, J.; Liang, Y.; Li, F. Long-distance optical fiber time synchronization technology and accuracy analysis. In Proceedings of the 2nd International Conference on Artificial Intelligence and Education; IEEE: Piscataway, NJ, USA, 2021; pp. 141–149. [Google Scholar]
- Günther, F.; Rastikian, S.; Towa, P.; Wiggers, T. KEMTLS with delayed forward identity protection. In Applied Cryptography and Network Security; Springer: Cham, Switzerland, 2022; pp. 253–272. [Google Scholar]
- van Mourik, S.; van Beveren, P.J.; López-Cruz, I.L.; van Henten, E.J. Improving climate monitoring in greenhouse cultivation via model-based filtering. Biosyst. Eng. 2019, 181, 40–51. [Google Scholar] [CrossRef] [Scilit]
- Huet, A.; Navarro, J.M.; Rossi, D. Local evaluation of time-series anomaly detection algorithms. In Proceedings of the 28th ACM SIGKDD Conference on Knowledge Discovery and Data Min; ACM: New York, NY, USA, 2022; pp. 635–645. [Google Scholar]
- Friedman, B.; Fuckert, D.; Jahrsdoerfer, M.; Magness, R.; Patterson, E.S.; Syed, R.; Zaleski, J.R. Identifying and monitoring respiratory compromise. Biomed. Instrum. Technol. 2019, 53, 110–123. [Google Scholar] [CrossRef] [Scilit]
- Yu, L.; Du, Z.; Li, X.; Zheng, J.; Zhao, Q.; Wu, H.; Huang, X. Enhancing global agricultural monitoring systems for climate-smart agriculture. Clim. Smart Agric. 2025, 2, 100037. [Google Scholar] [CrossRef] [Scilit]
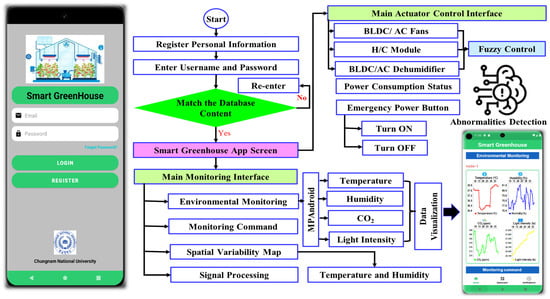
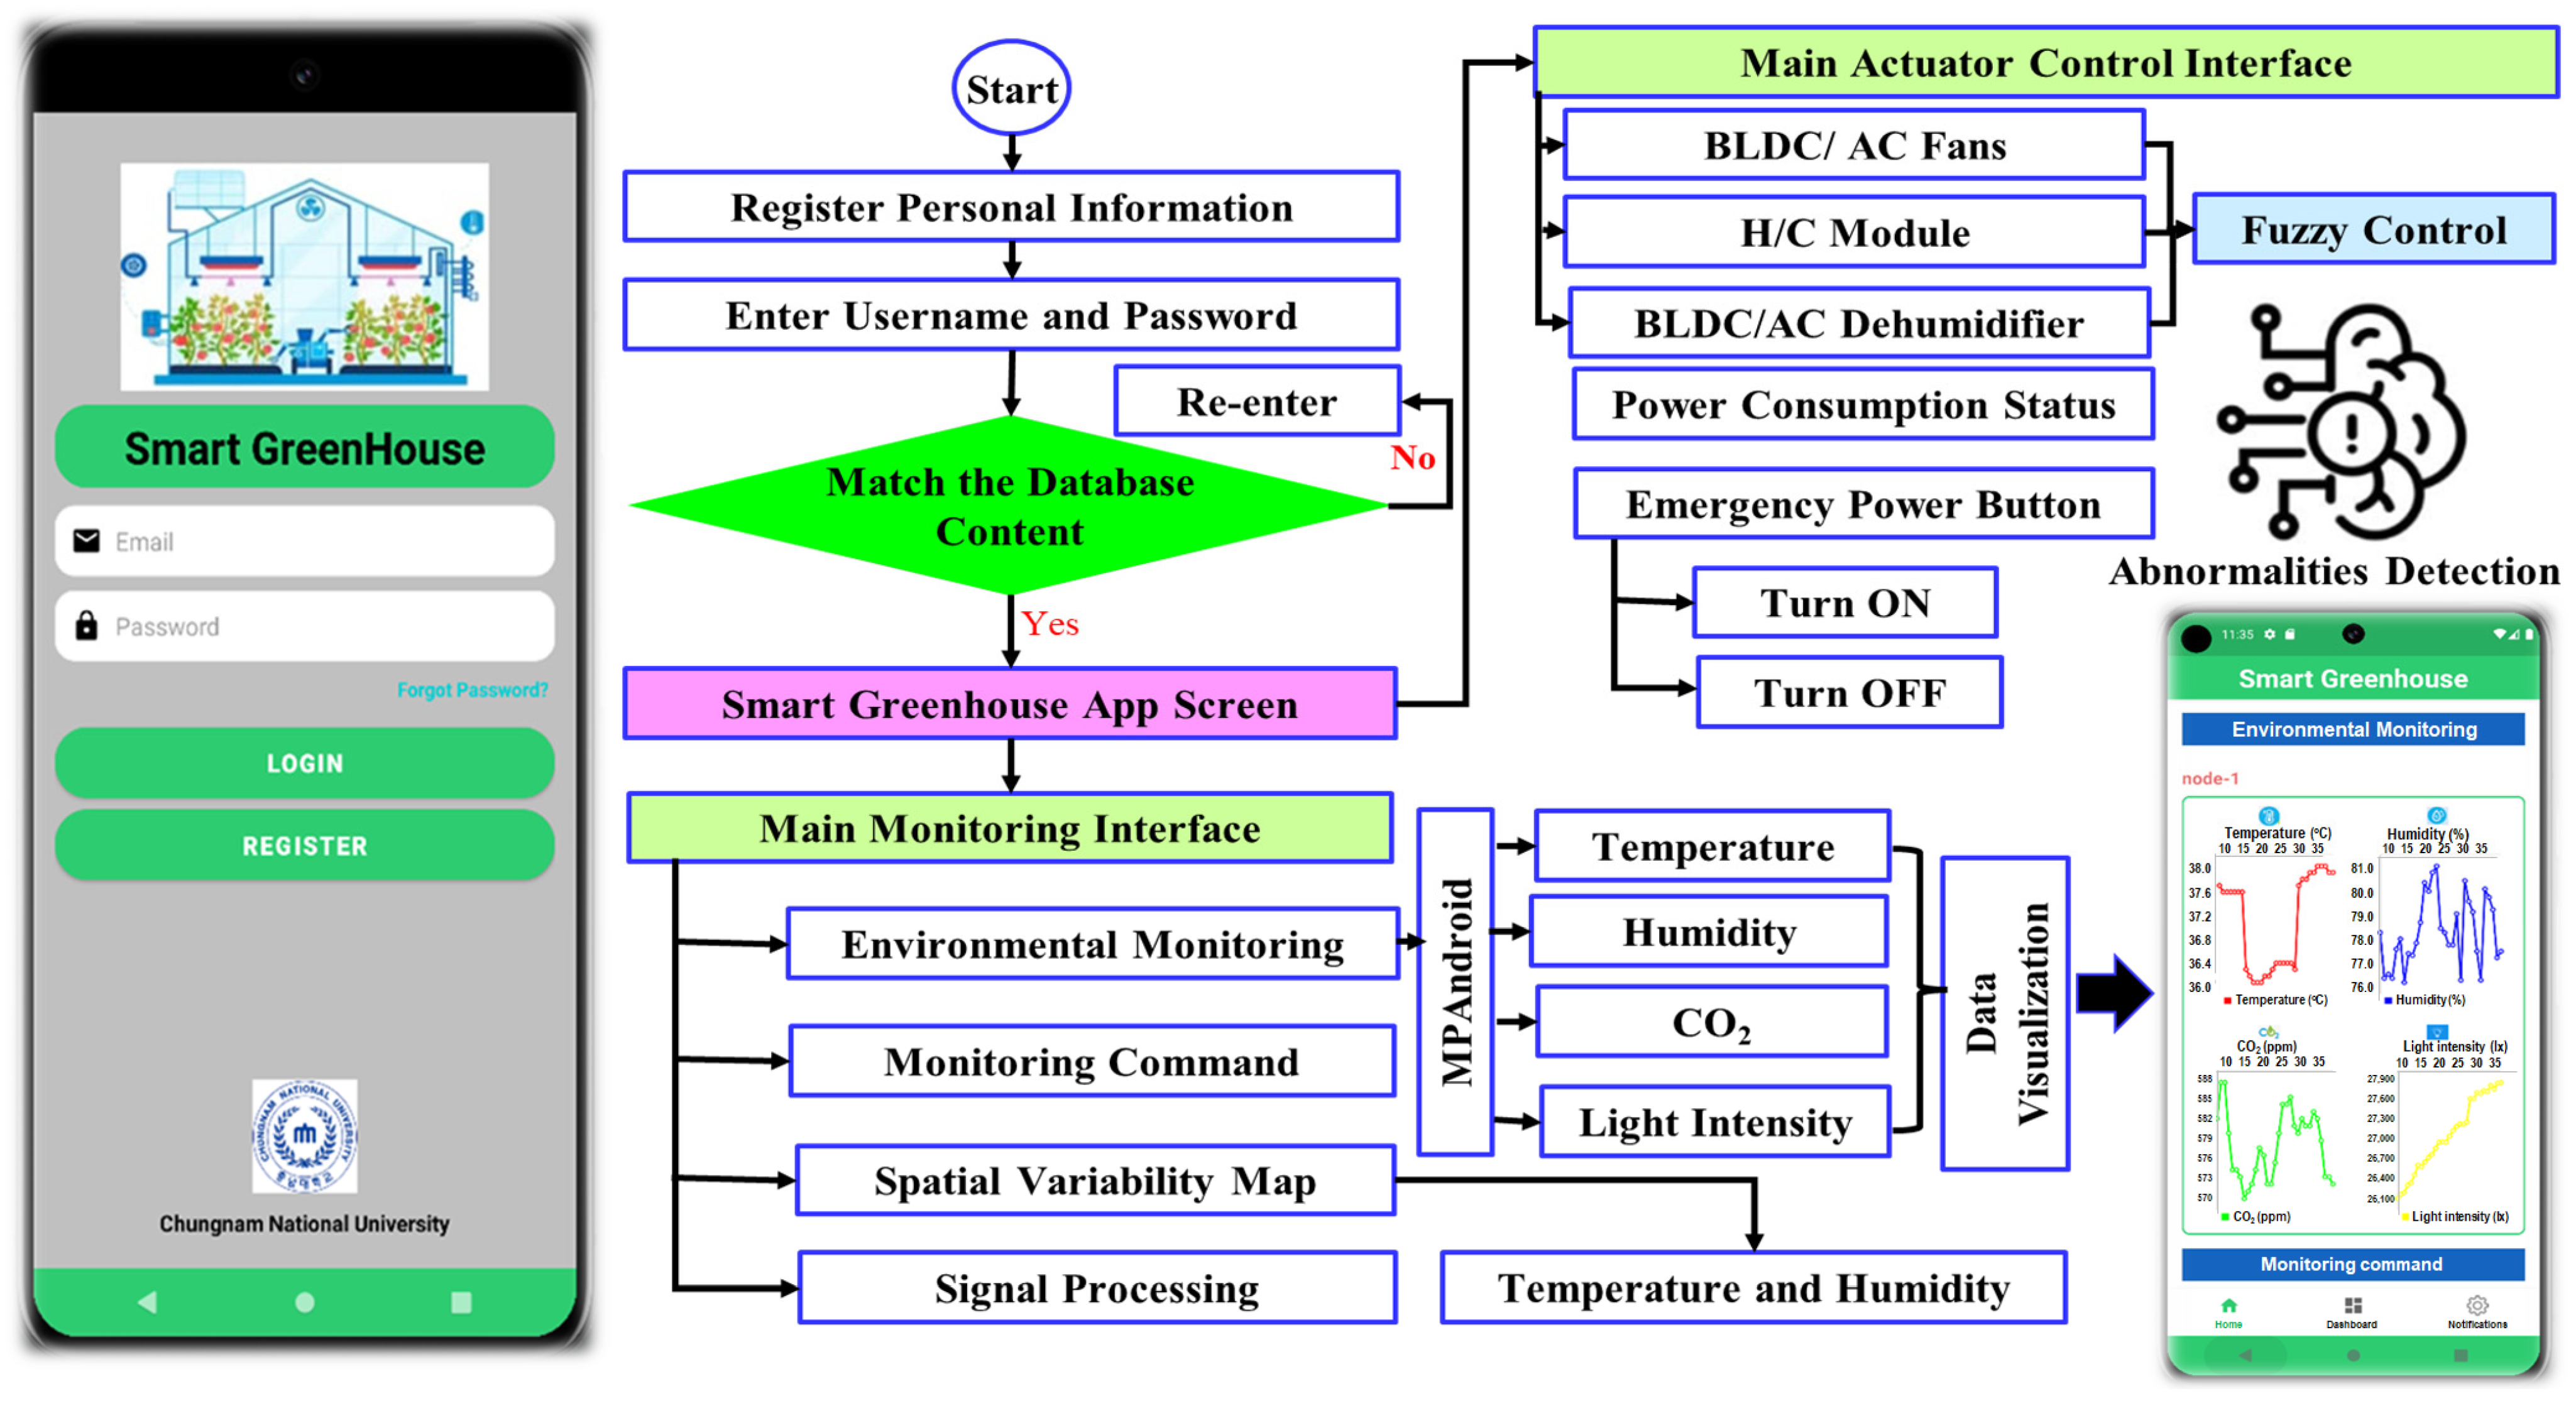
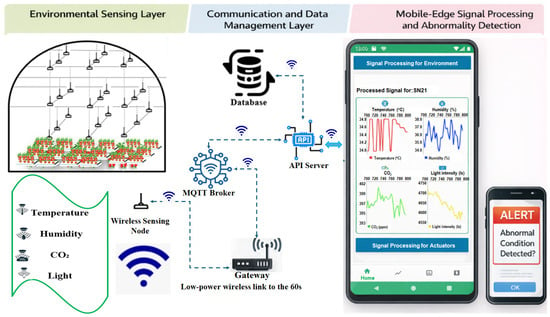
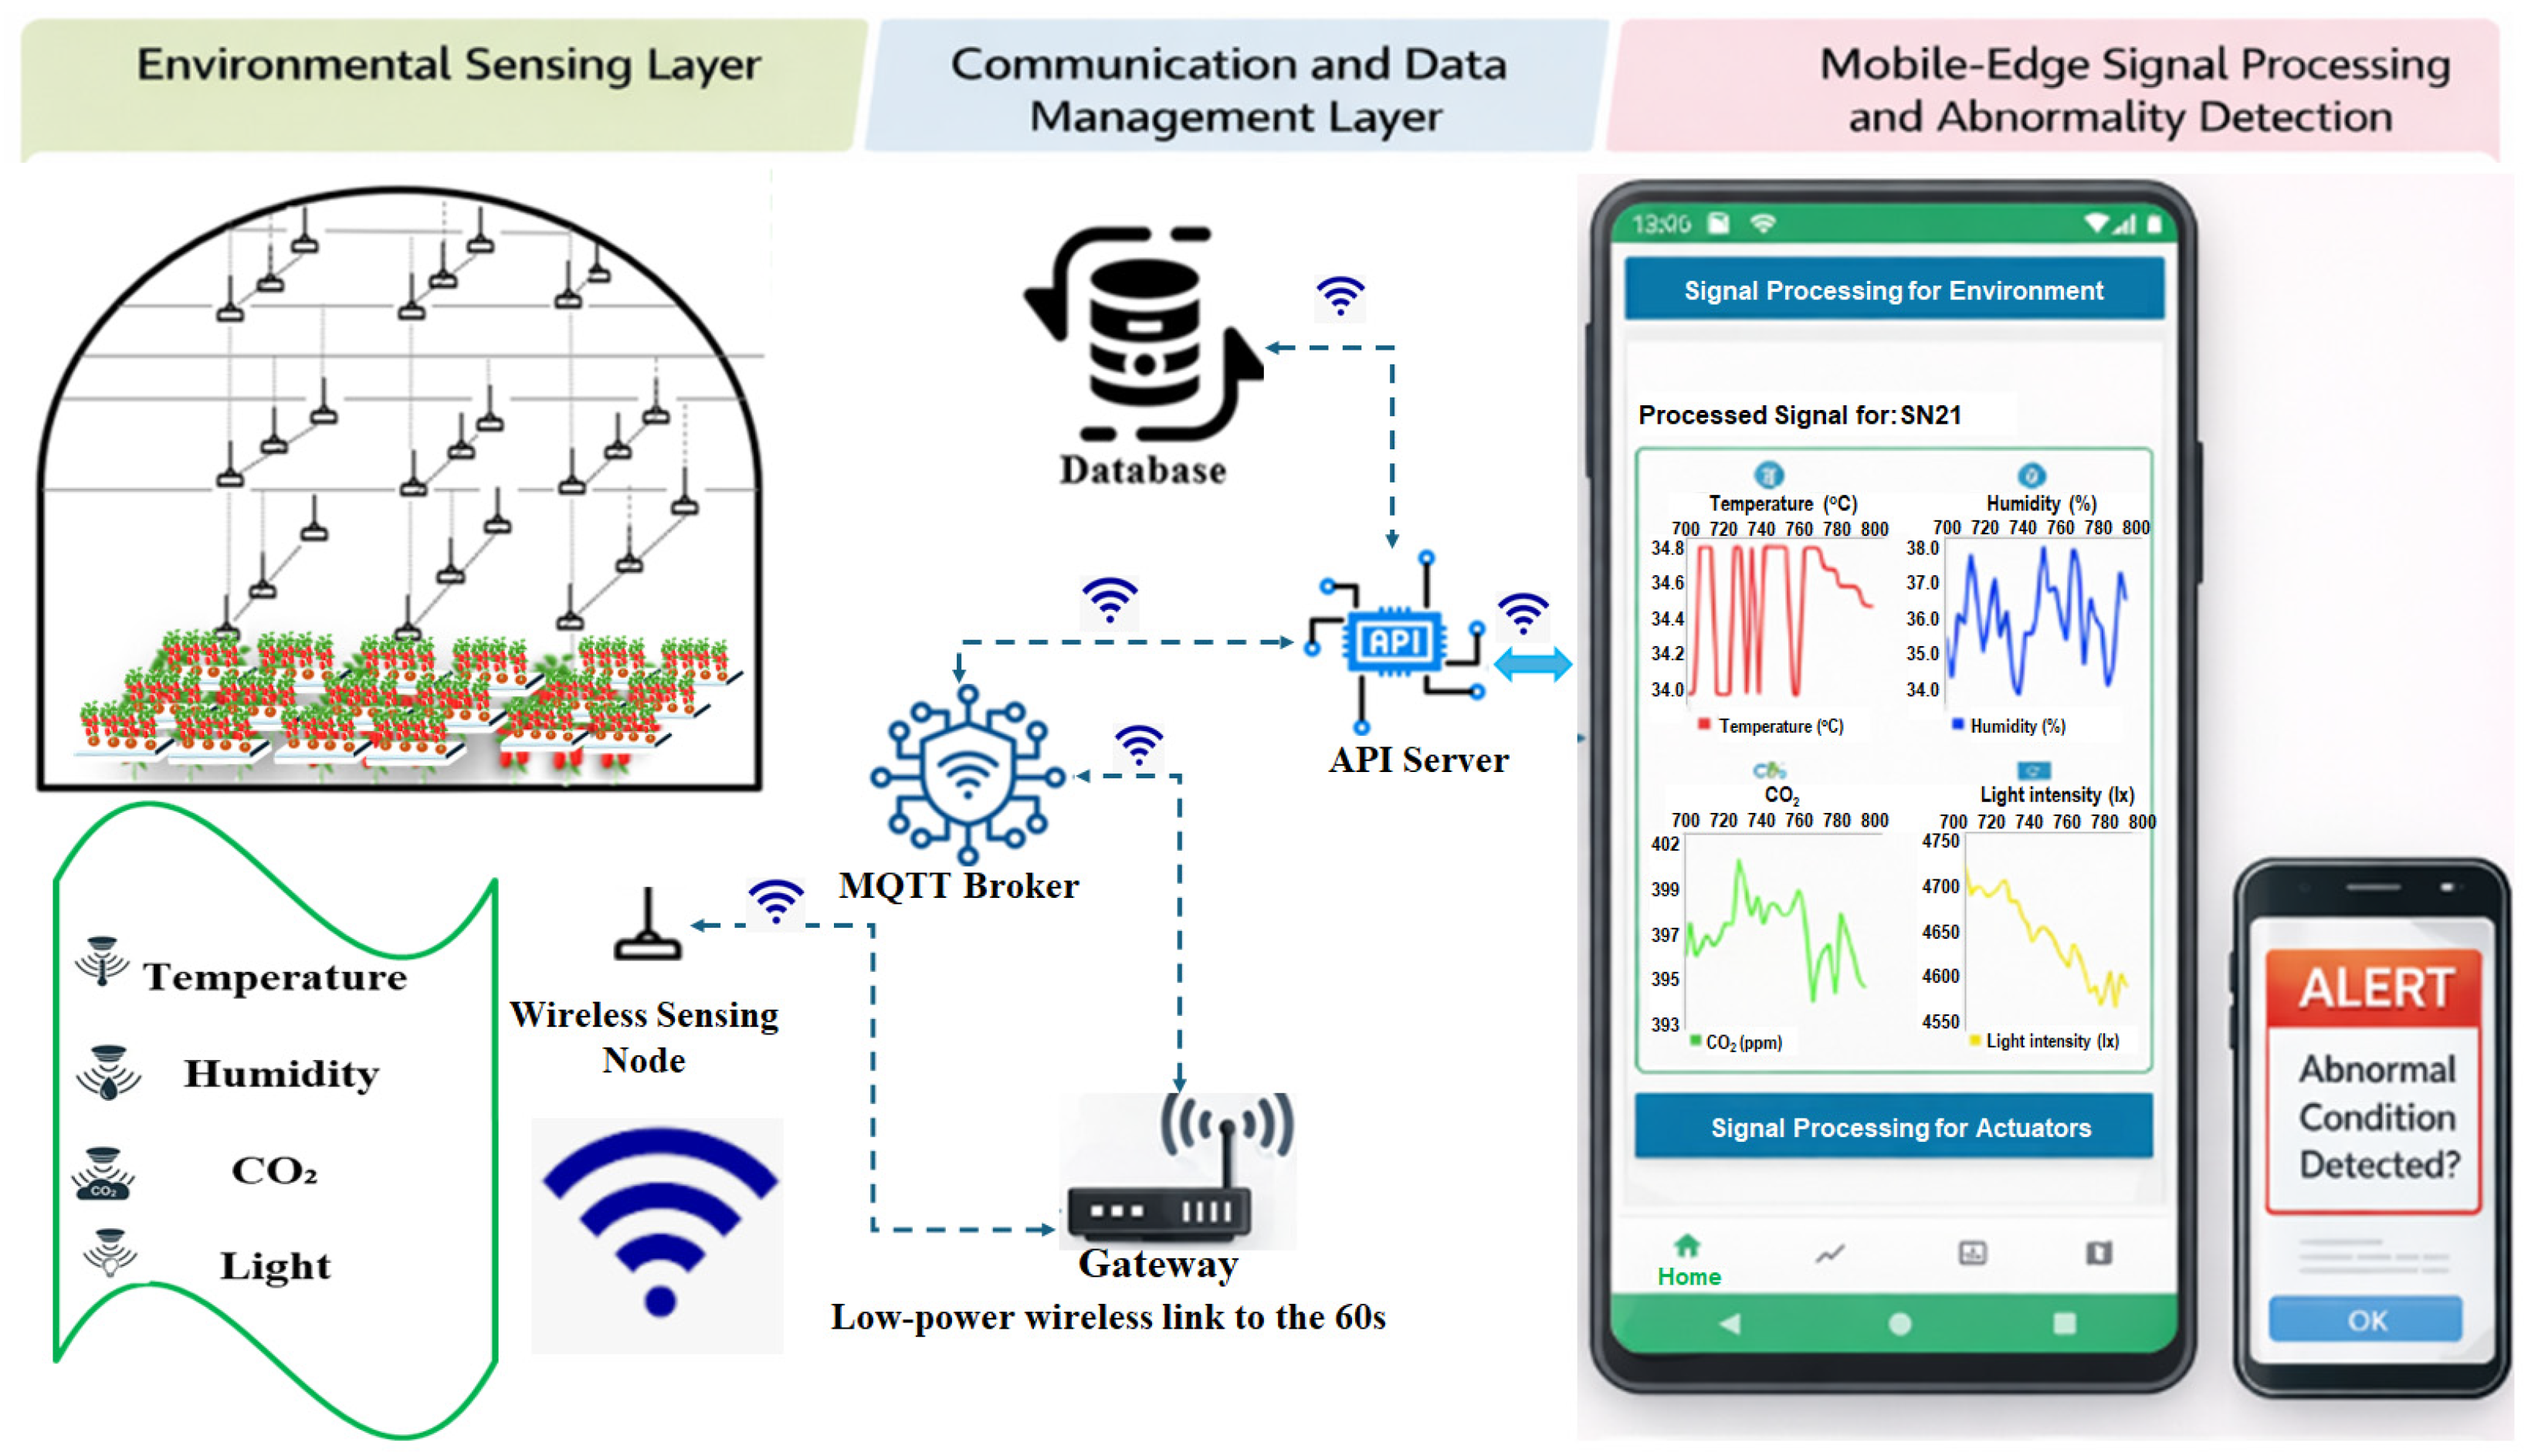
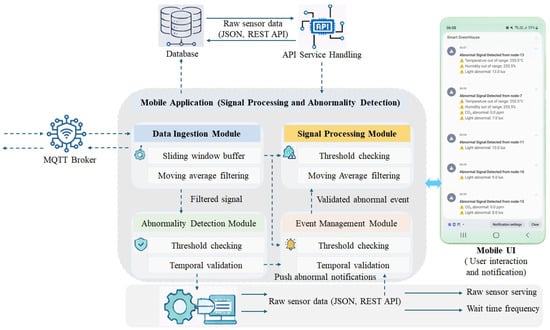
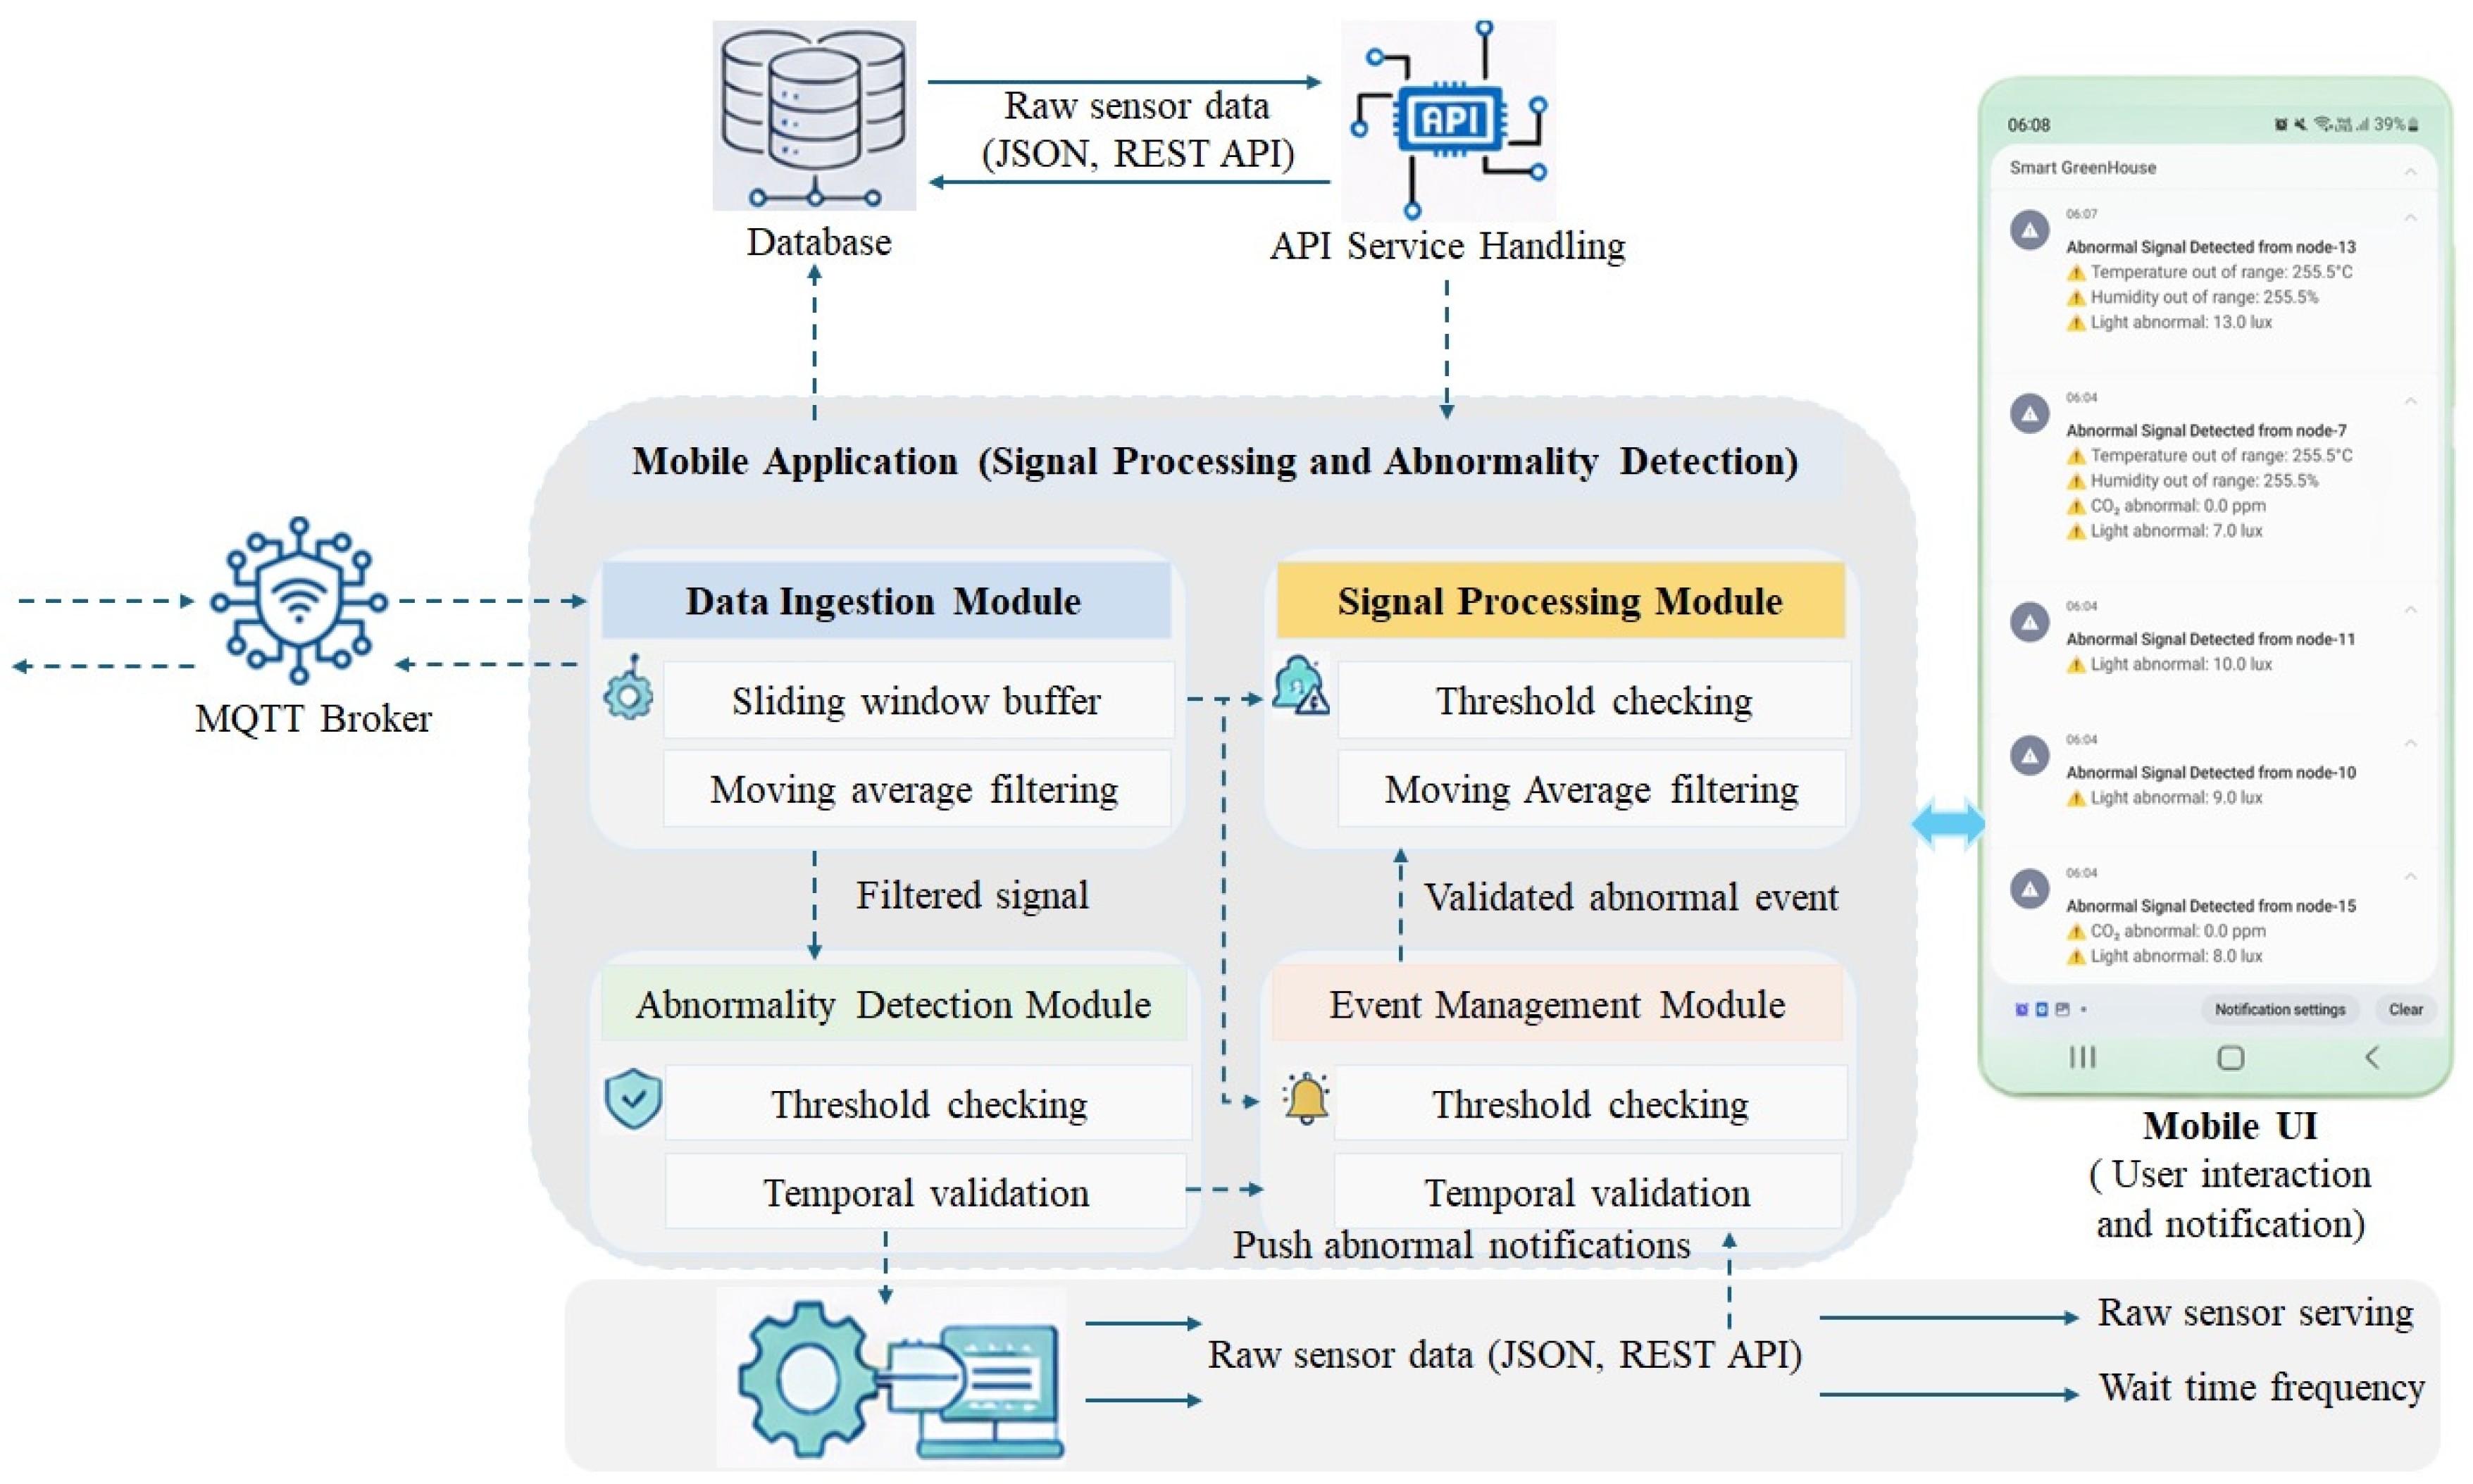
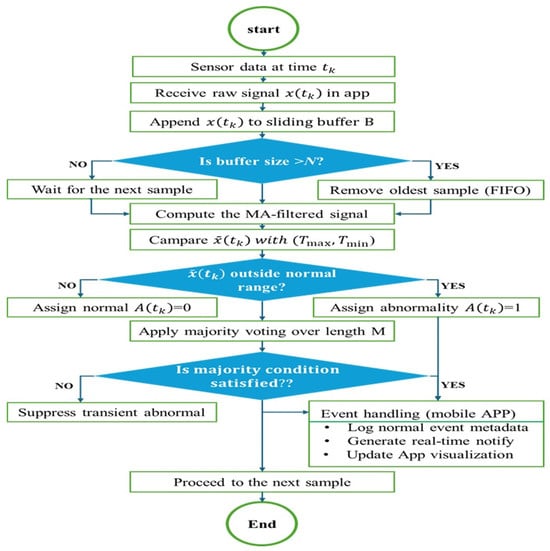
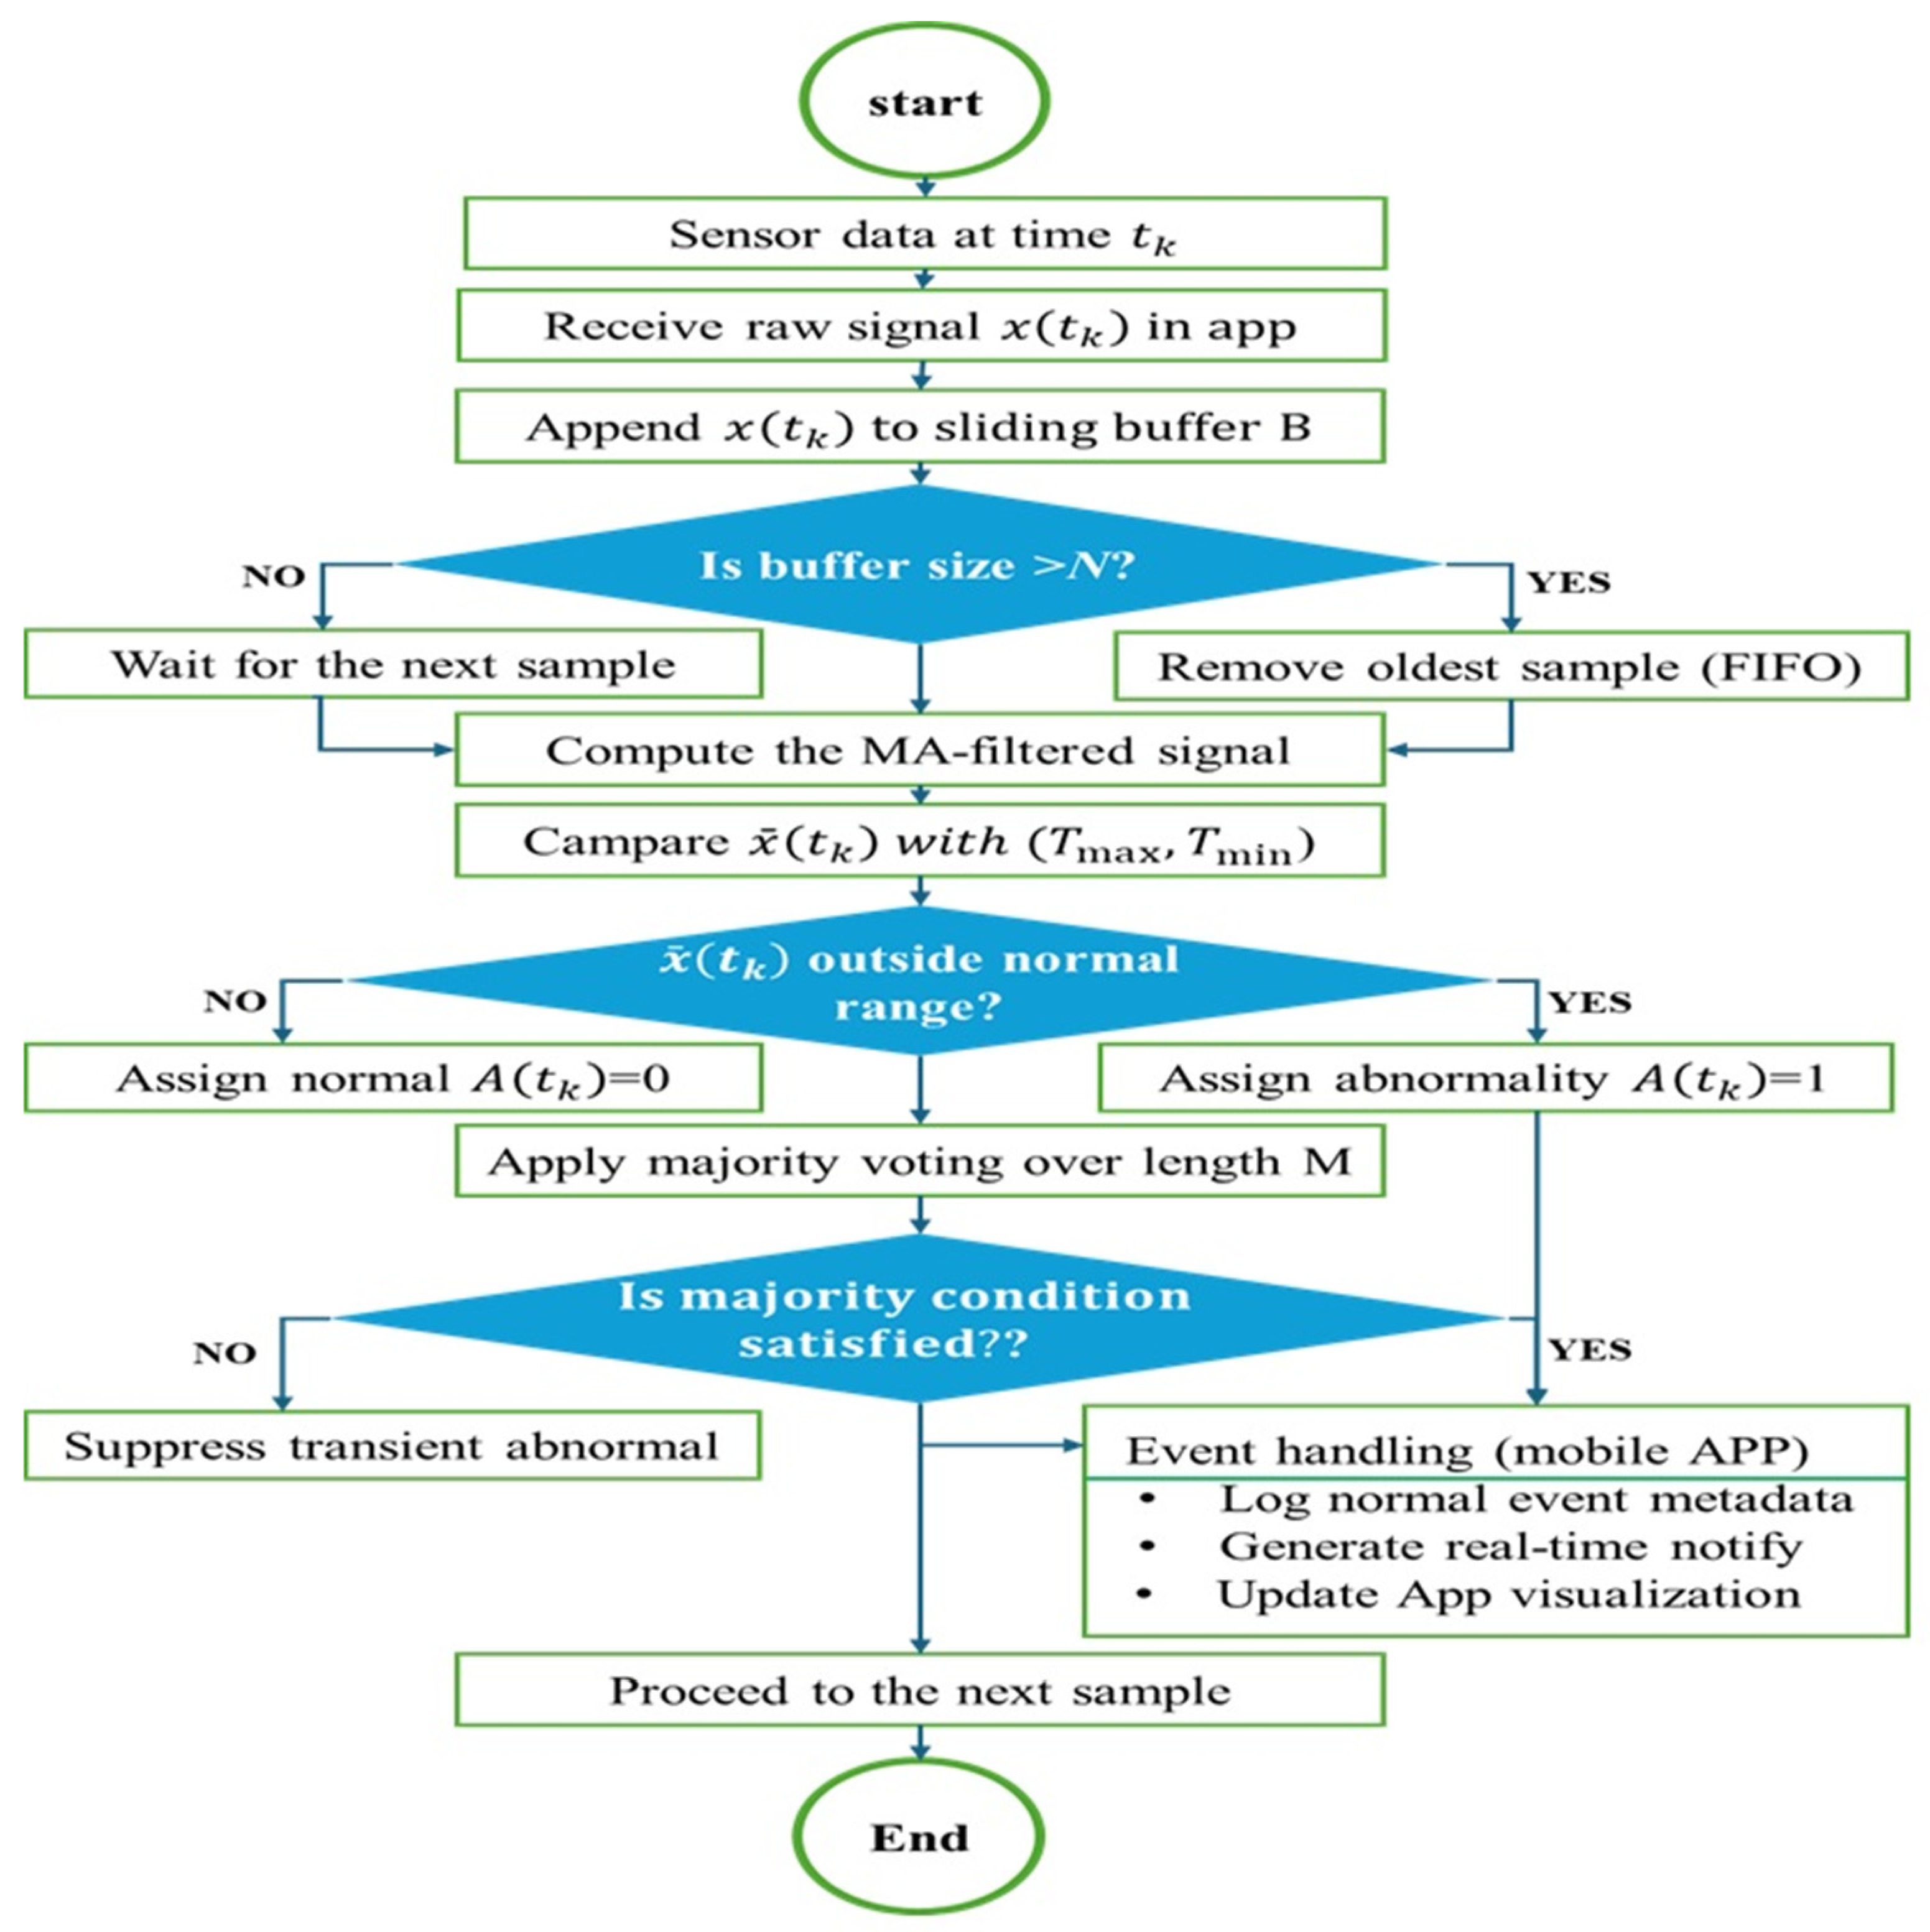
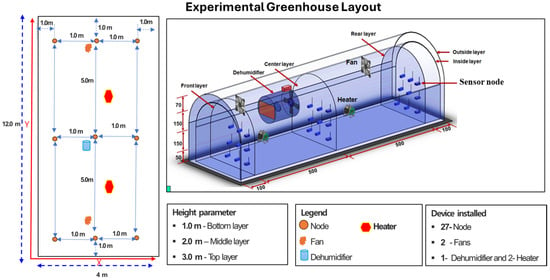
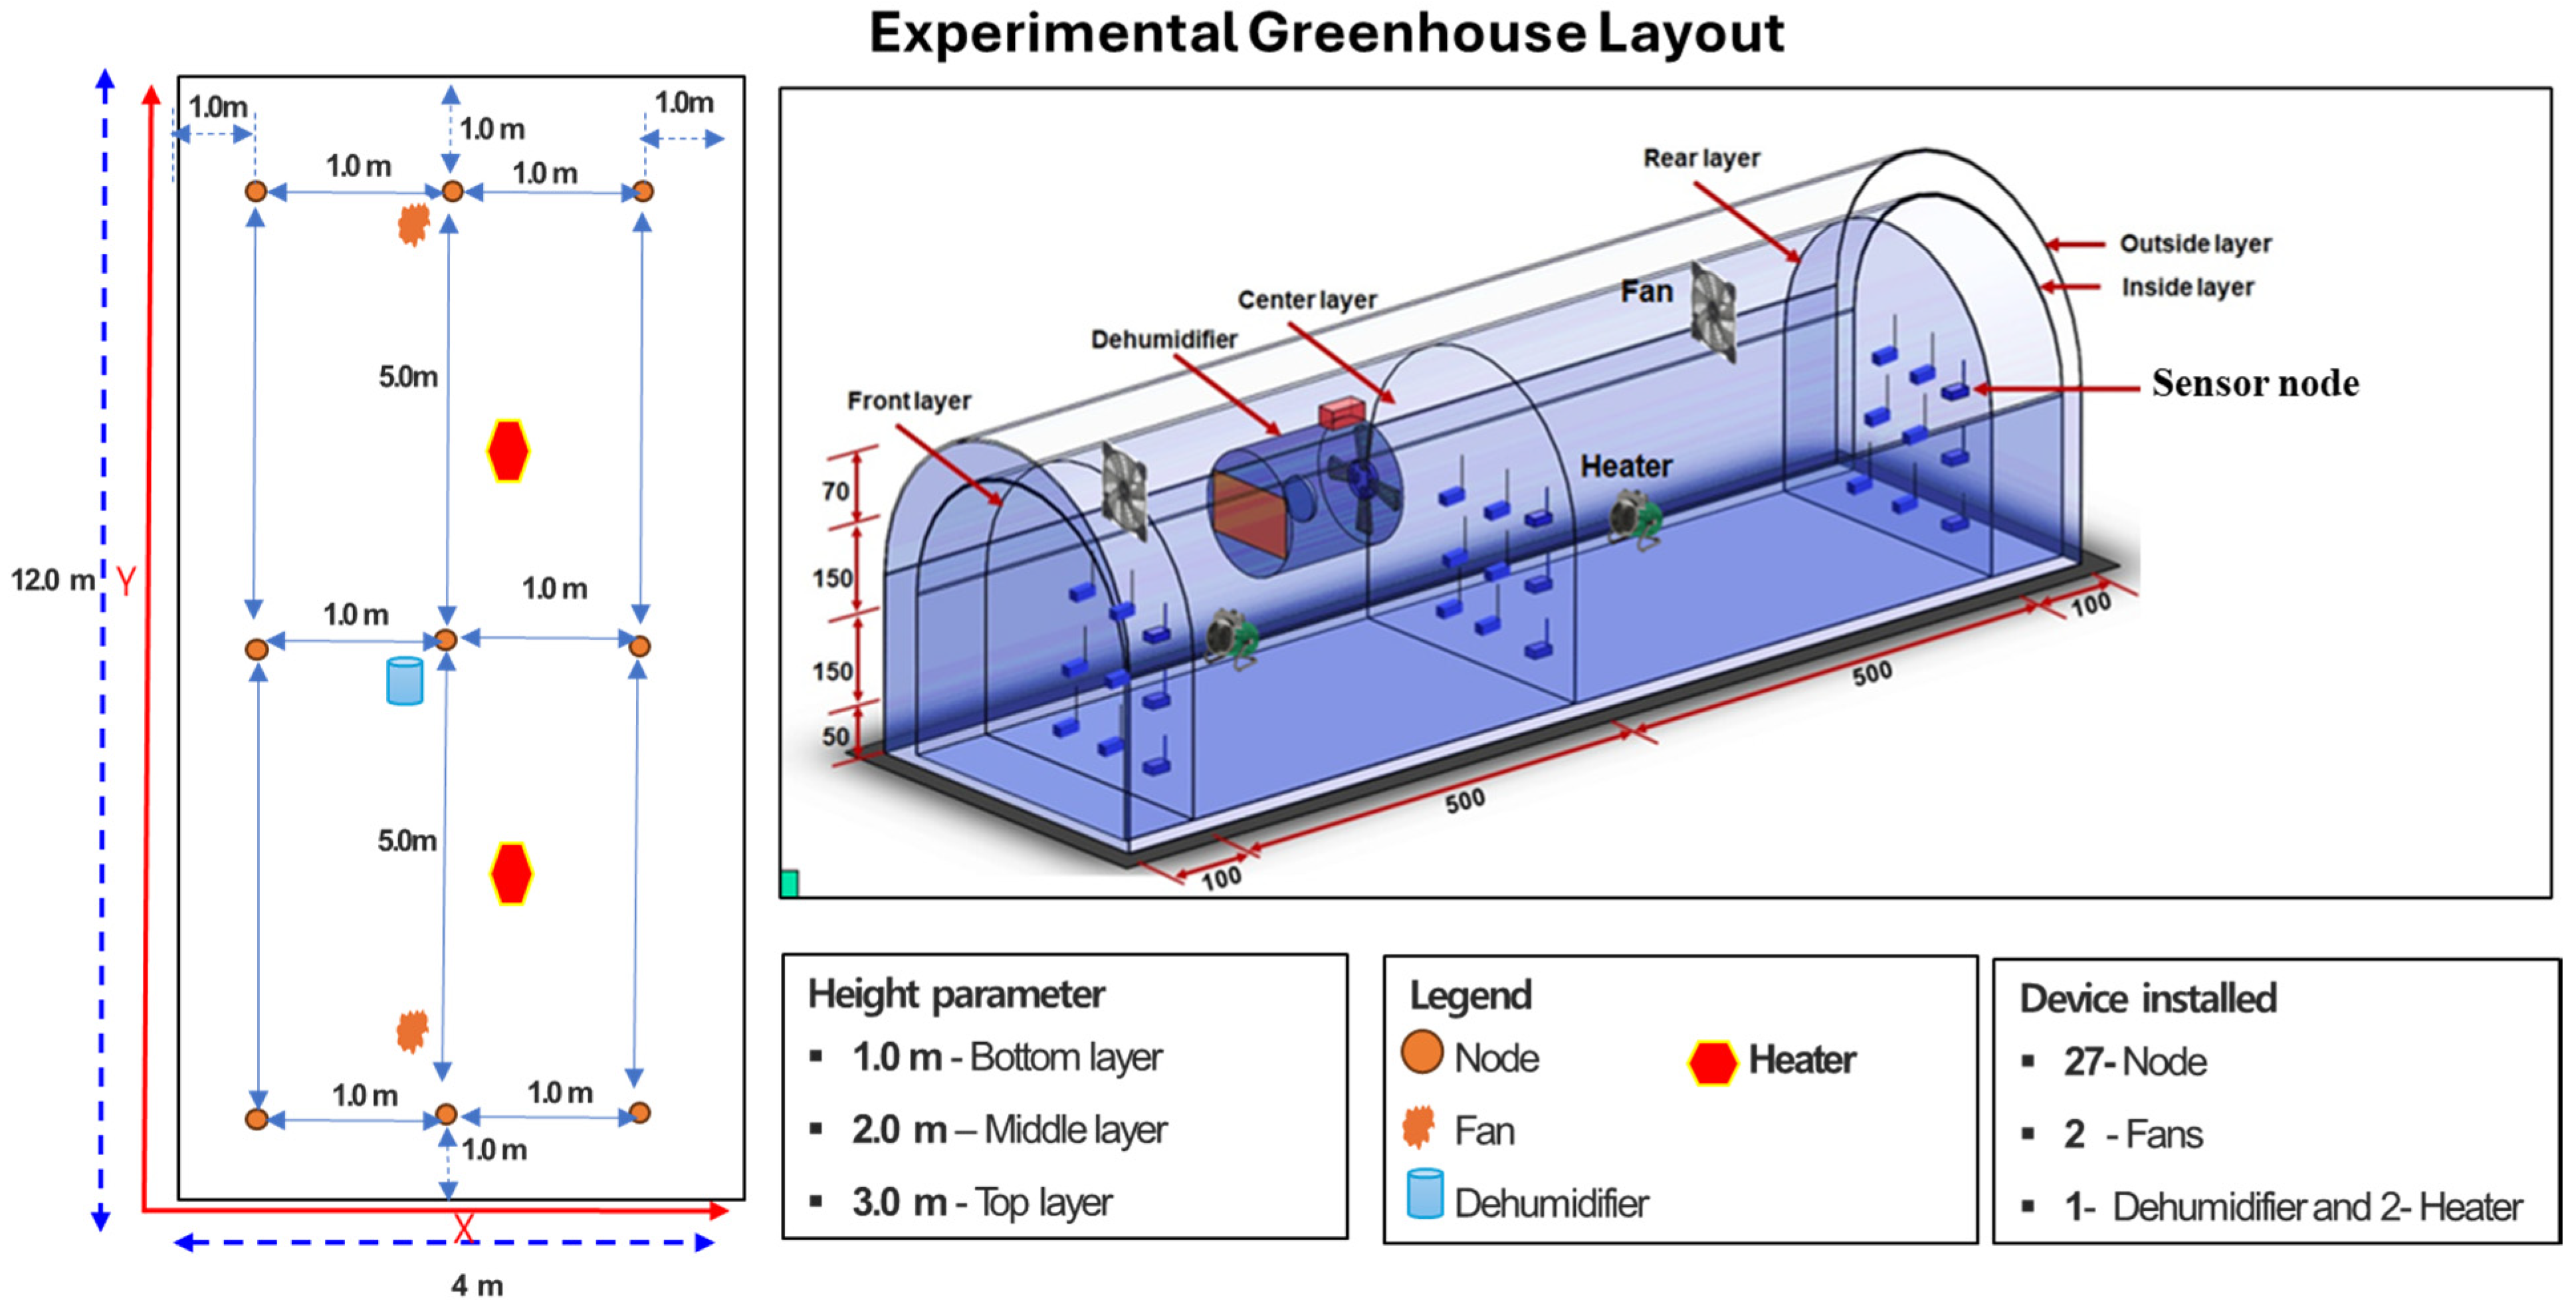
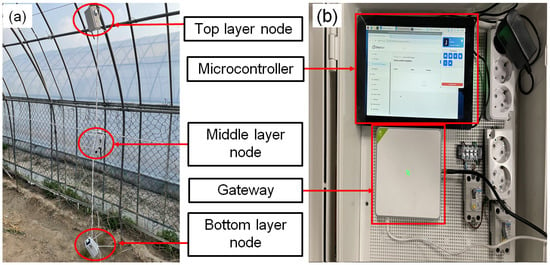
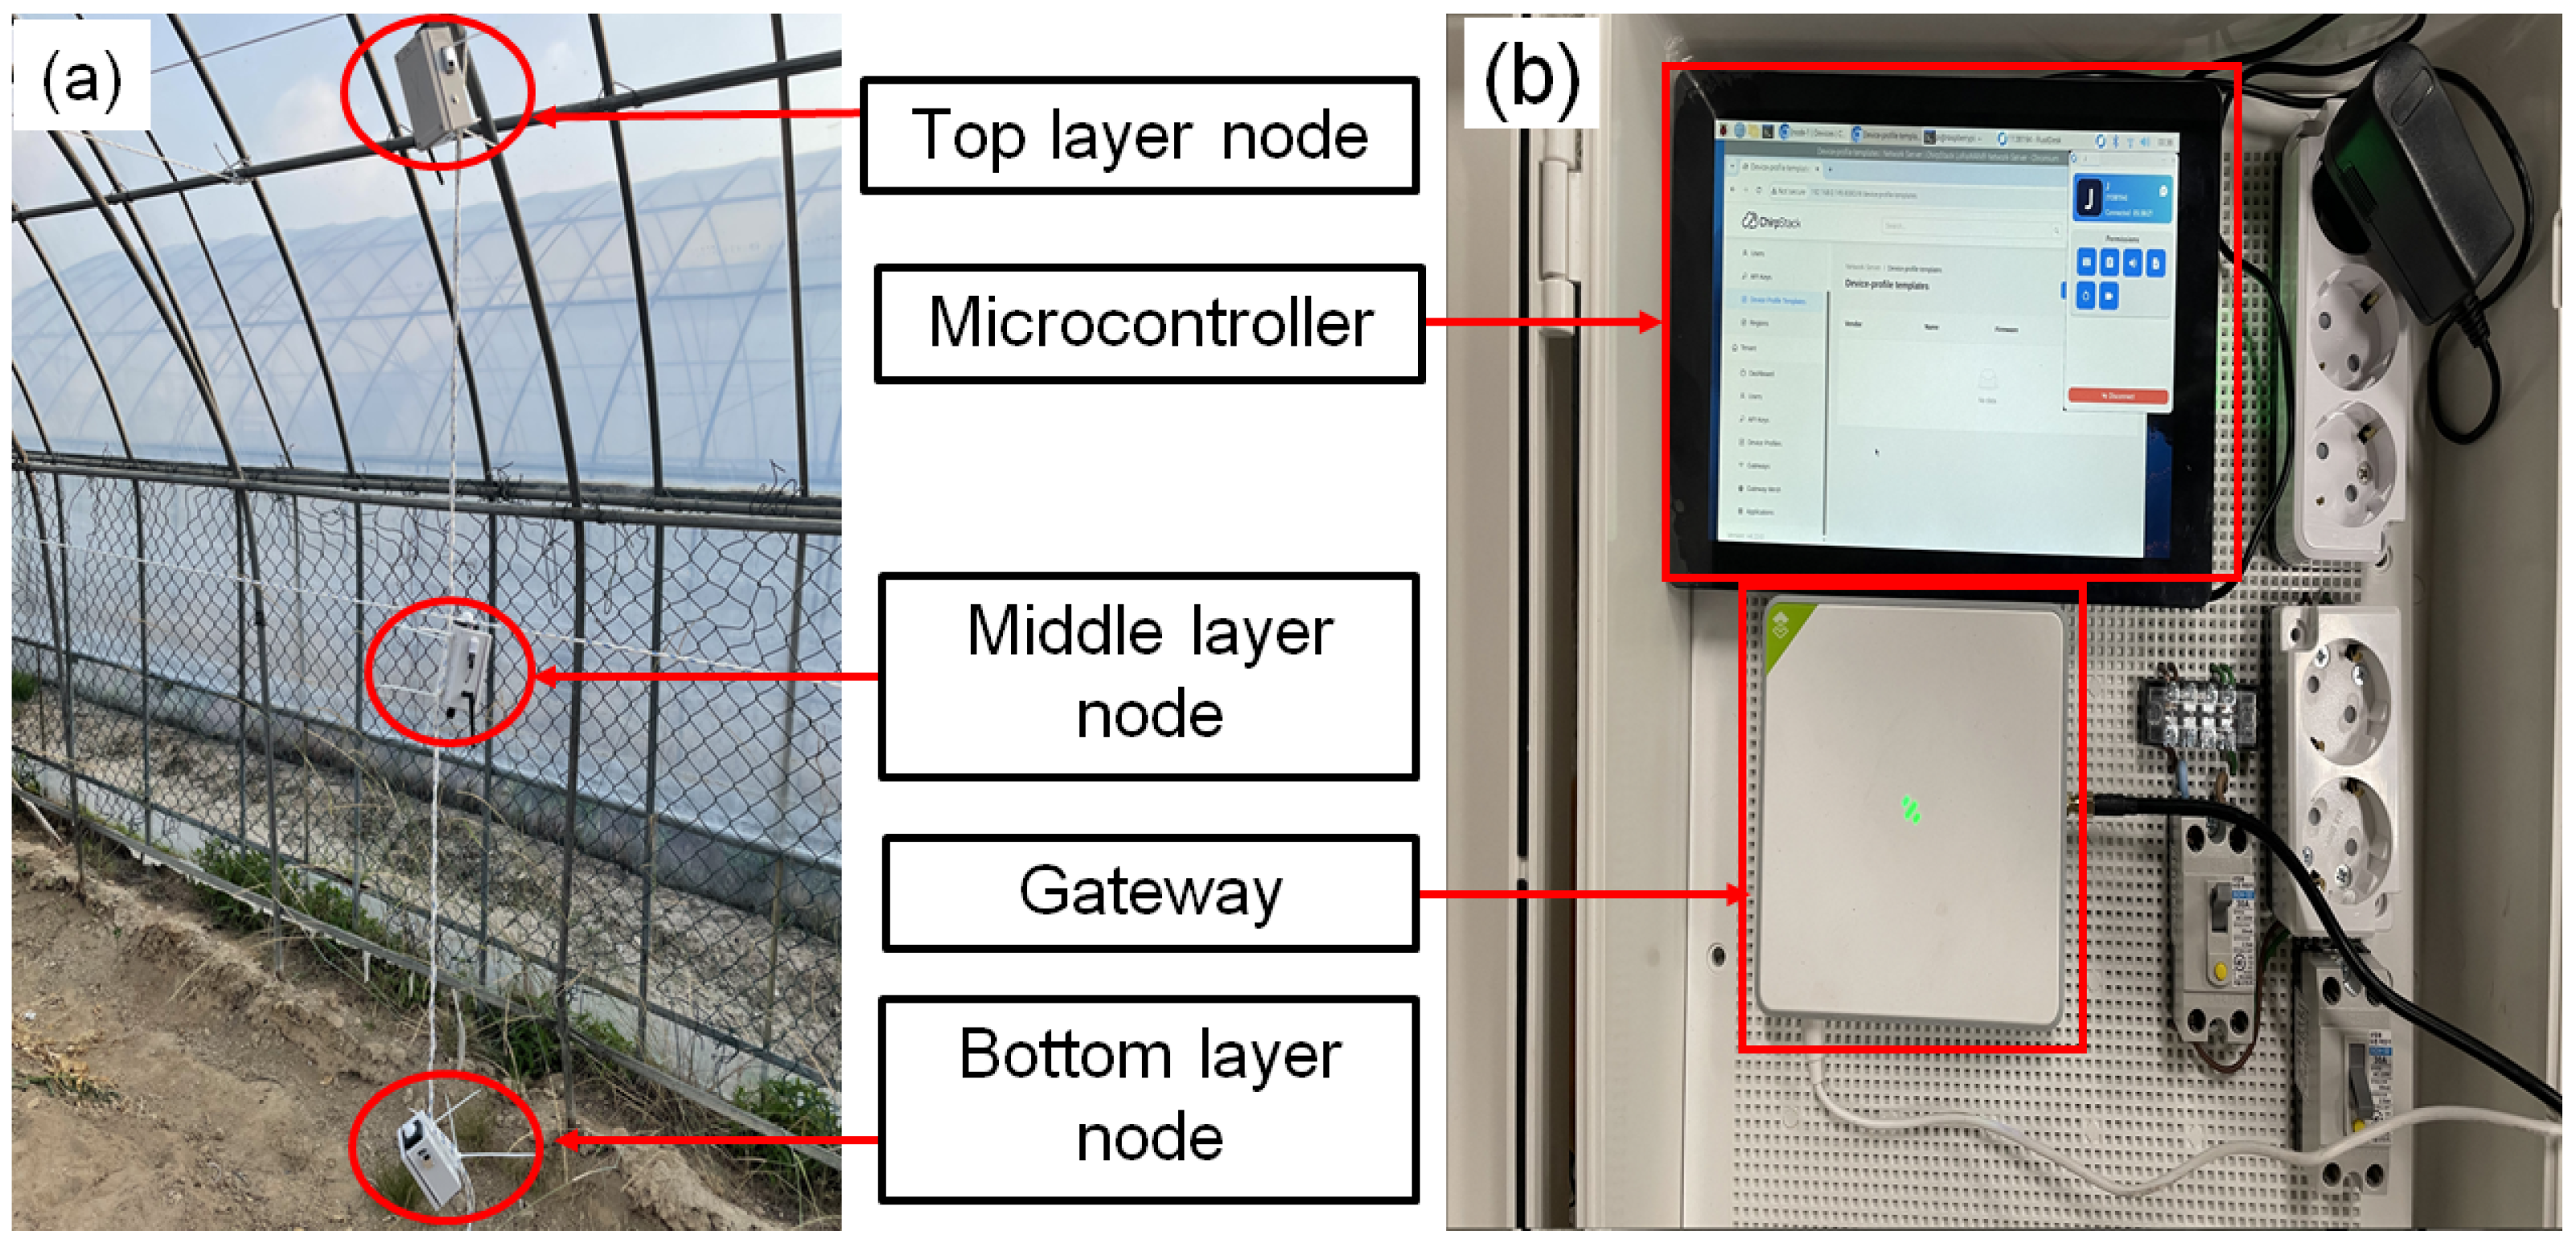
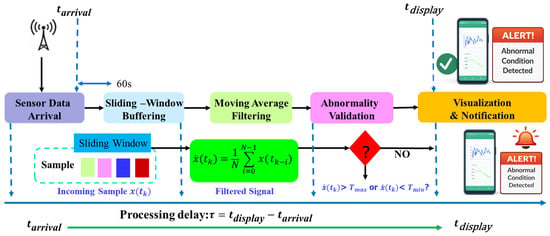
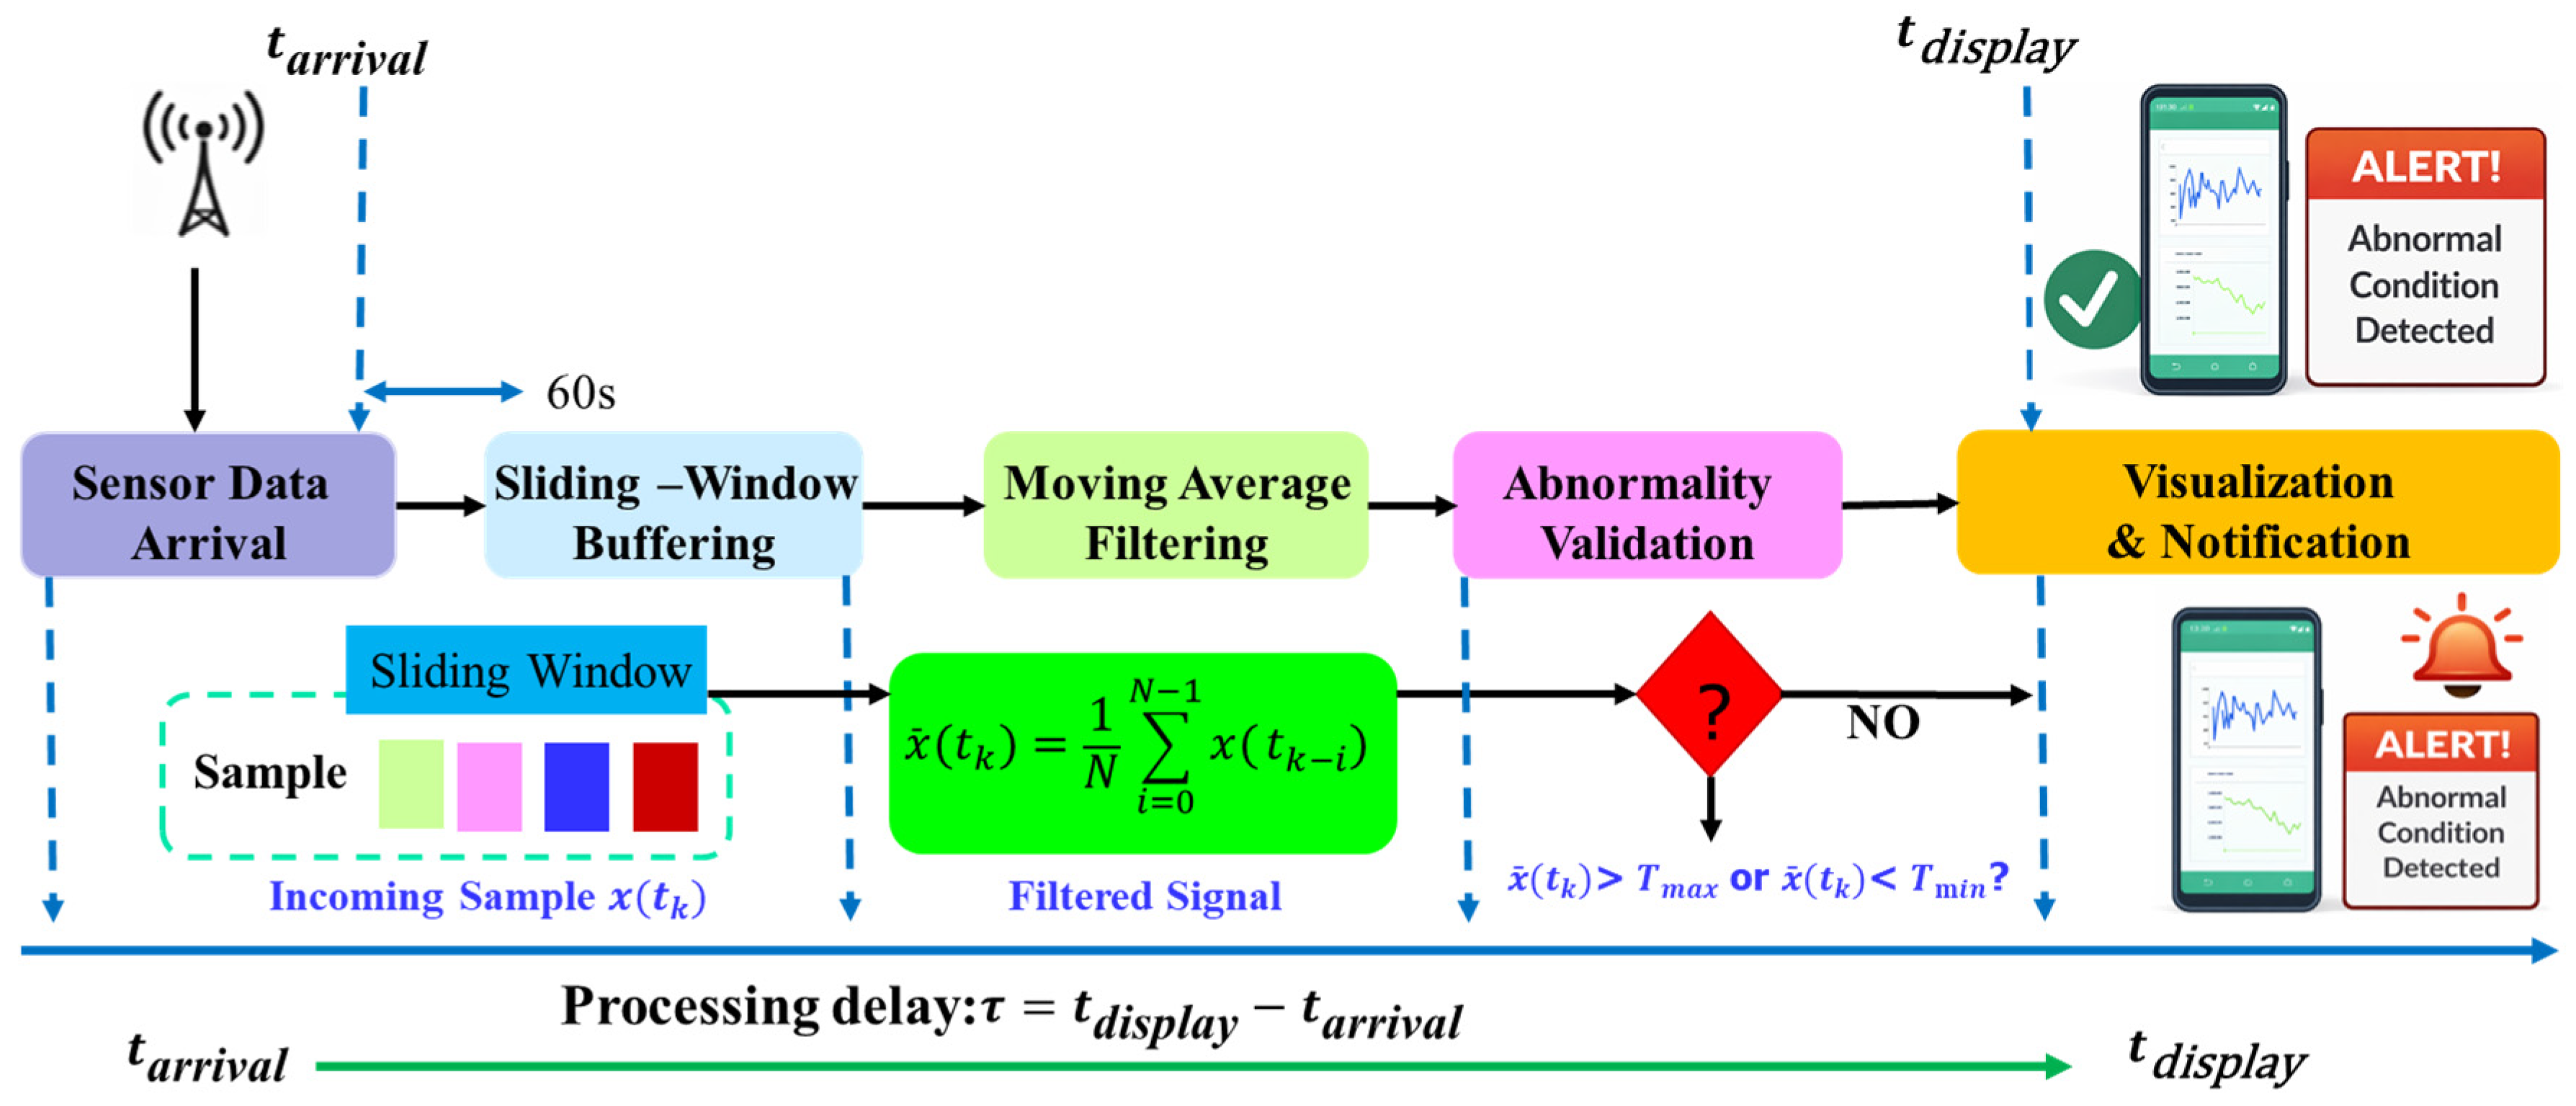
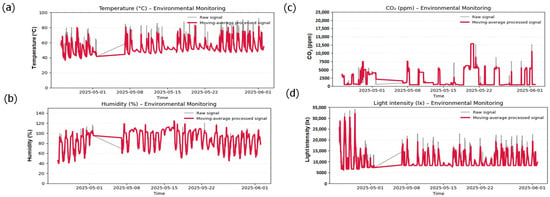
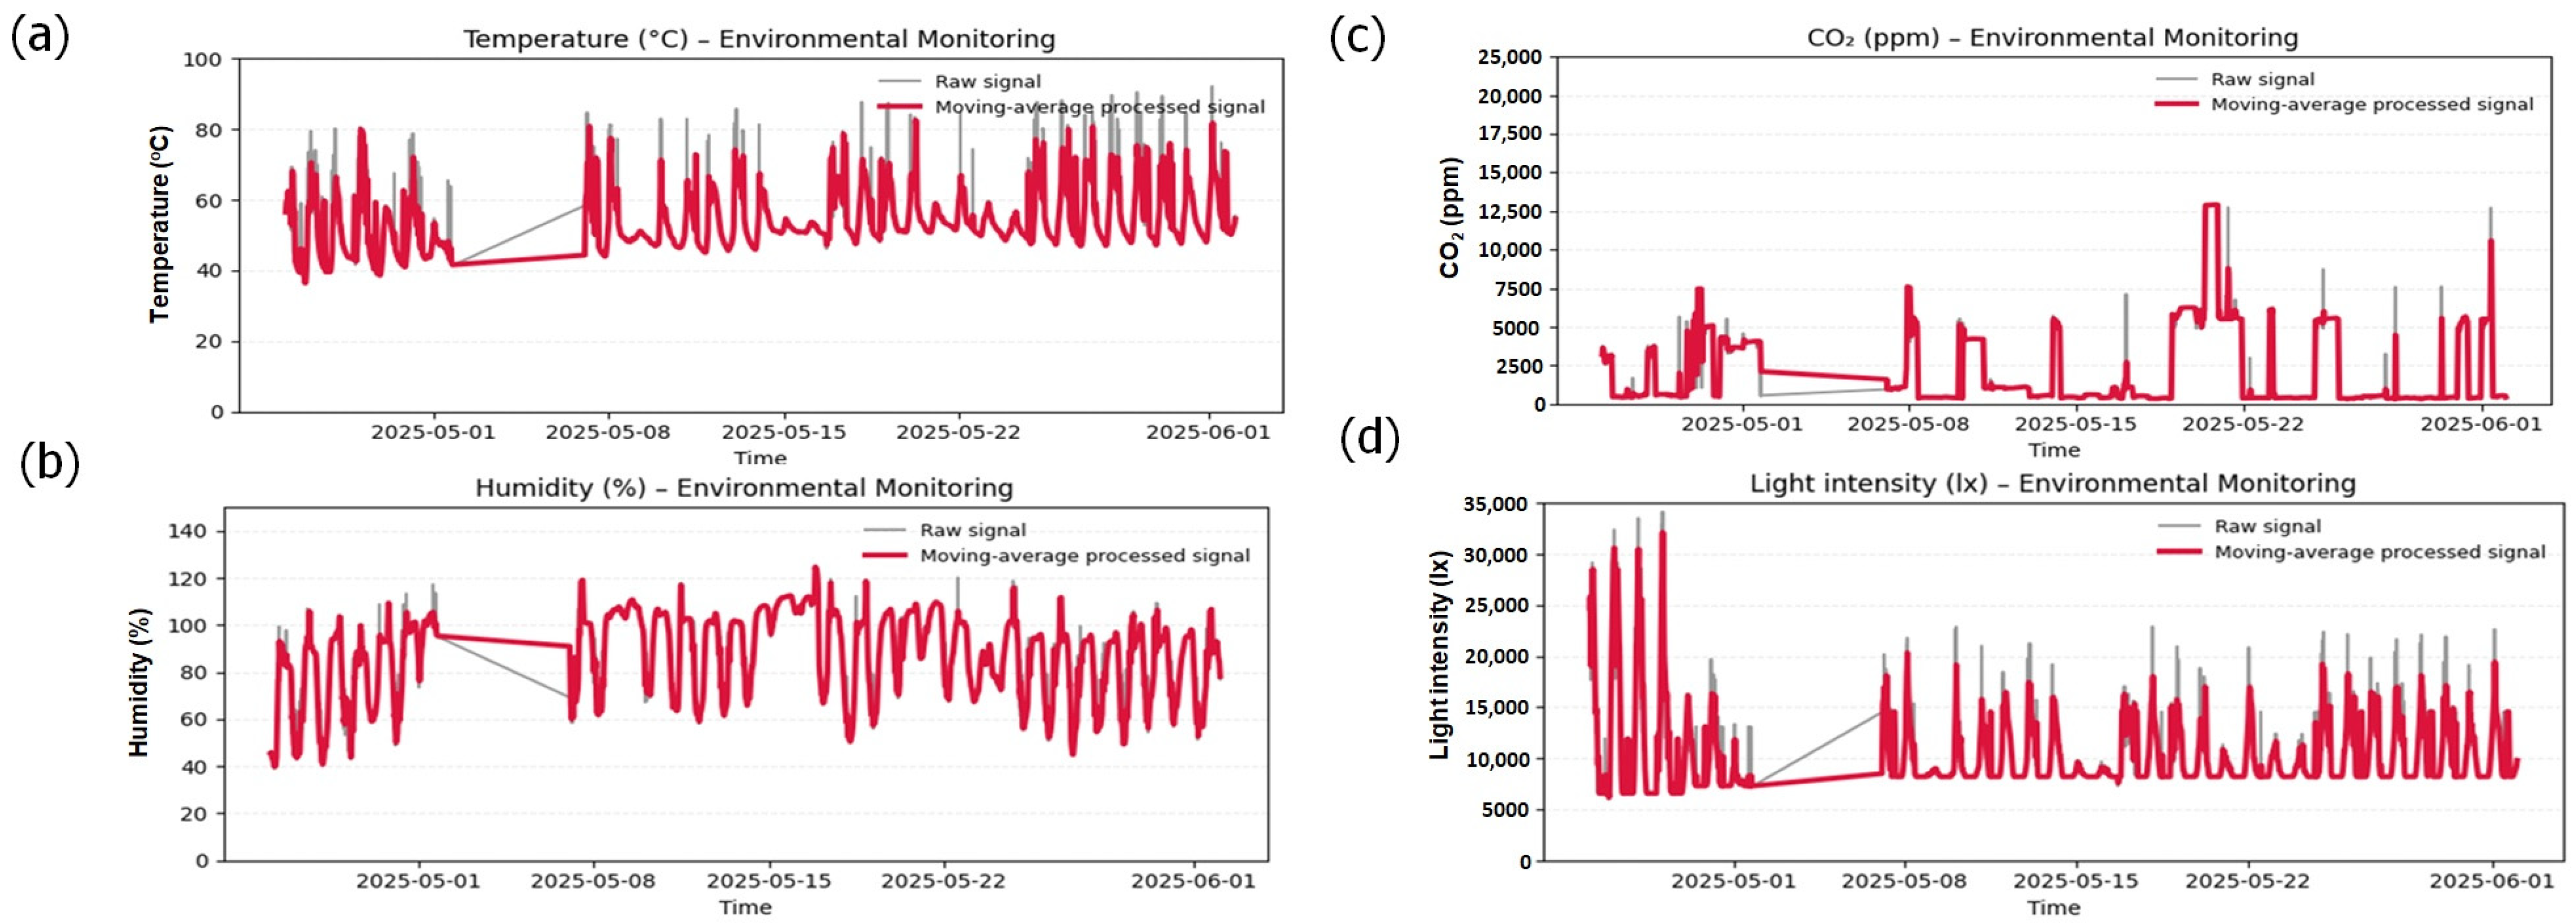
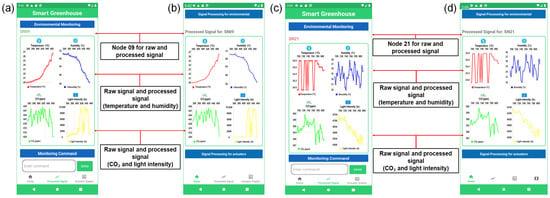
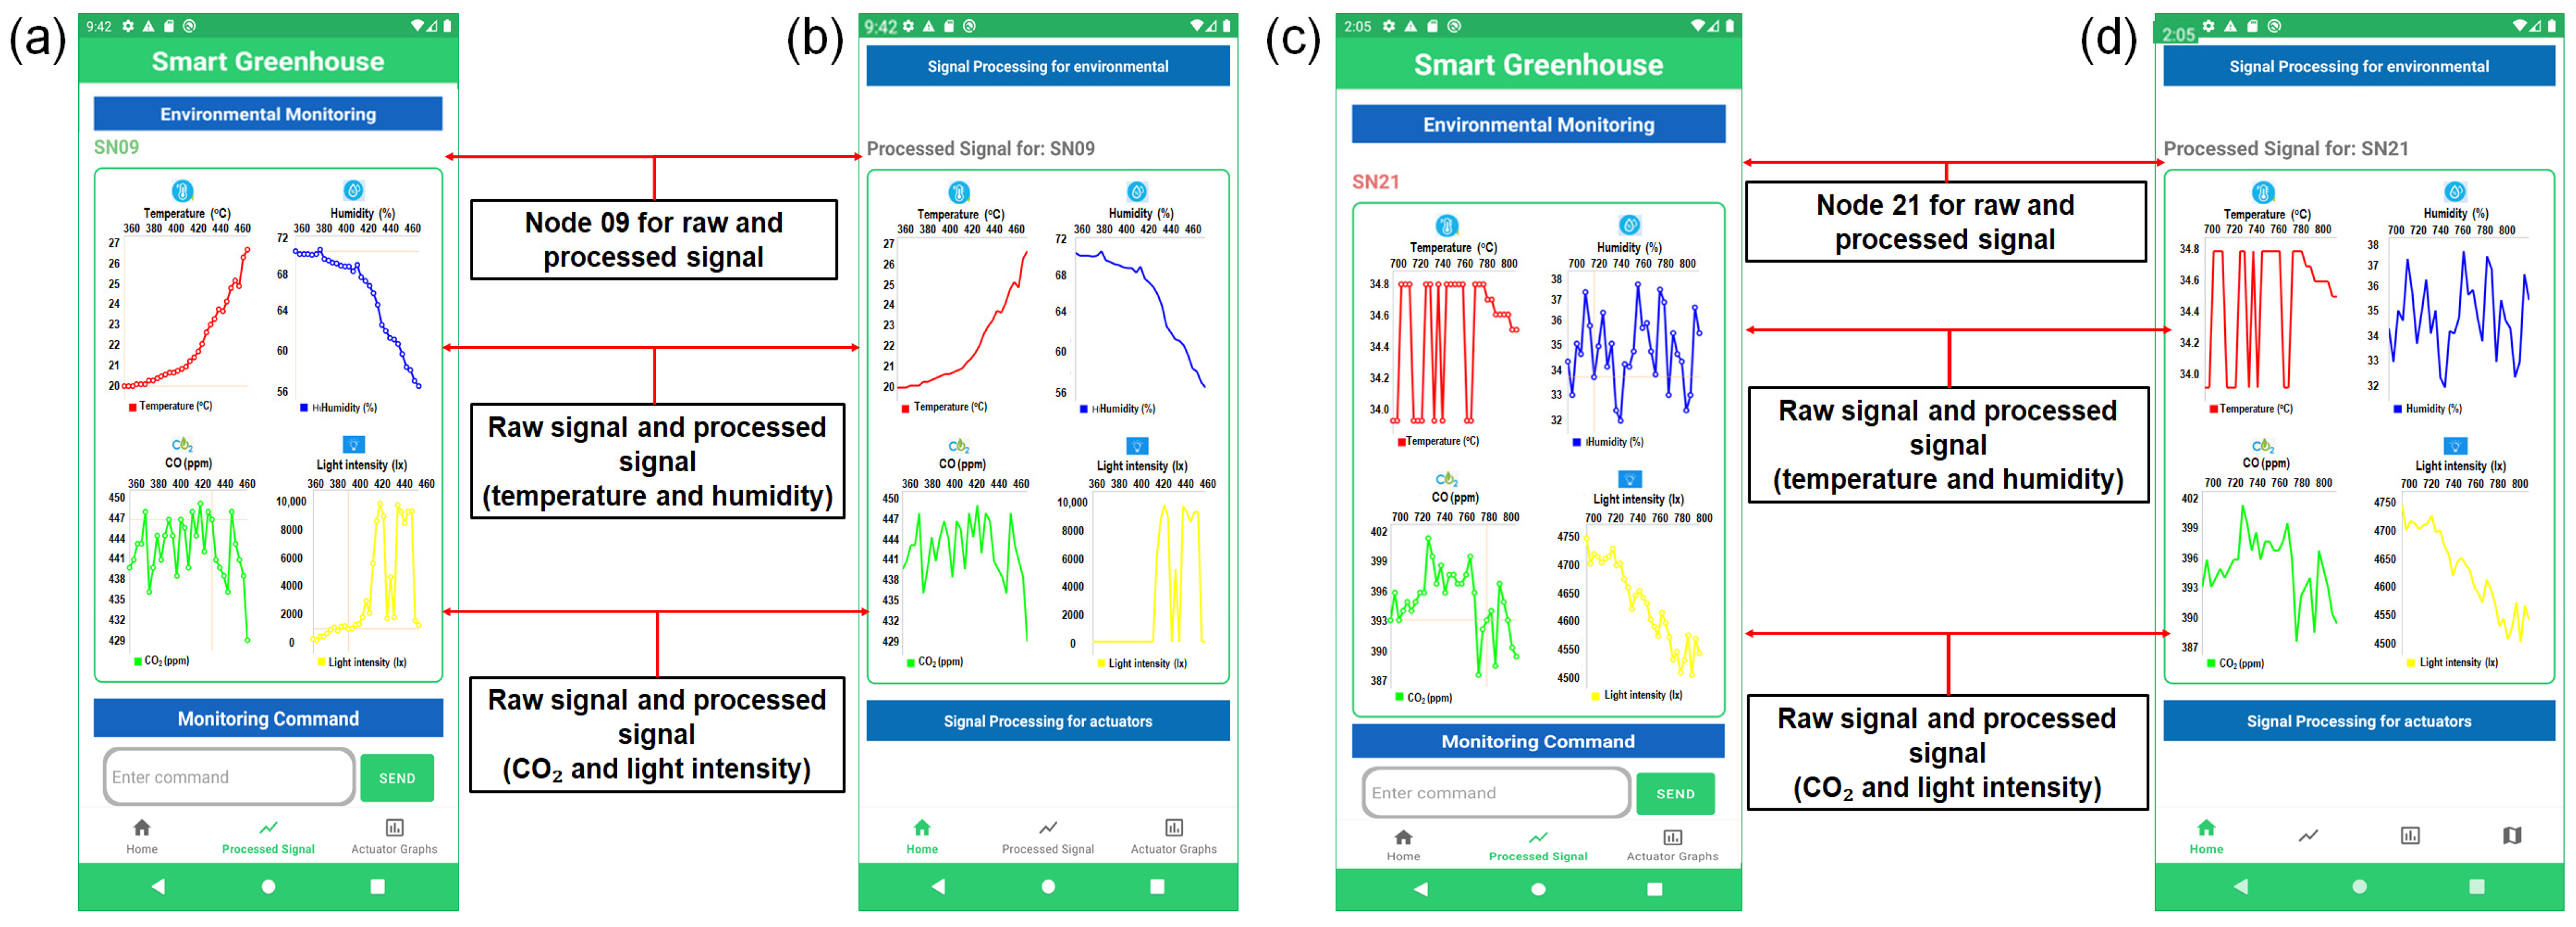
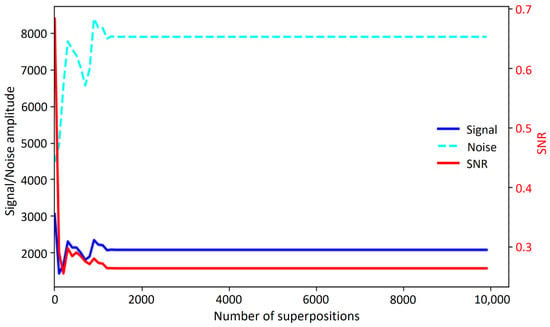
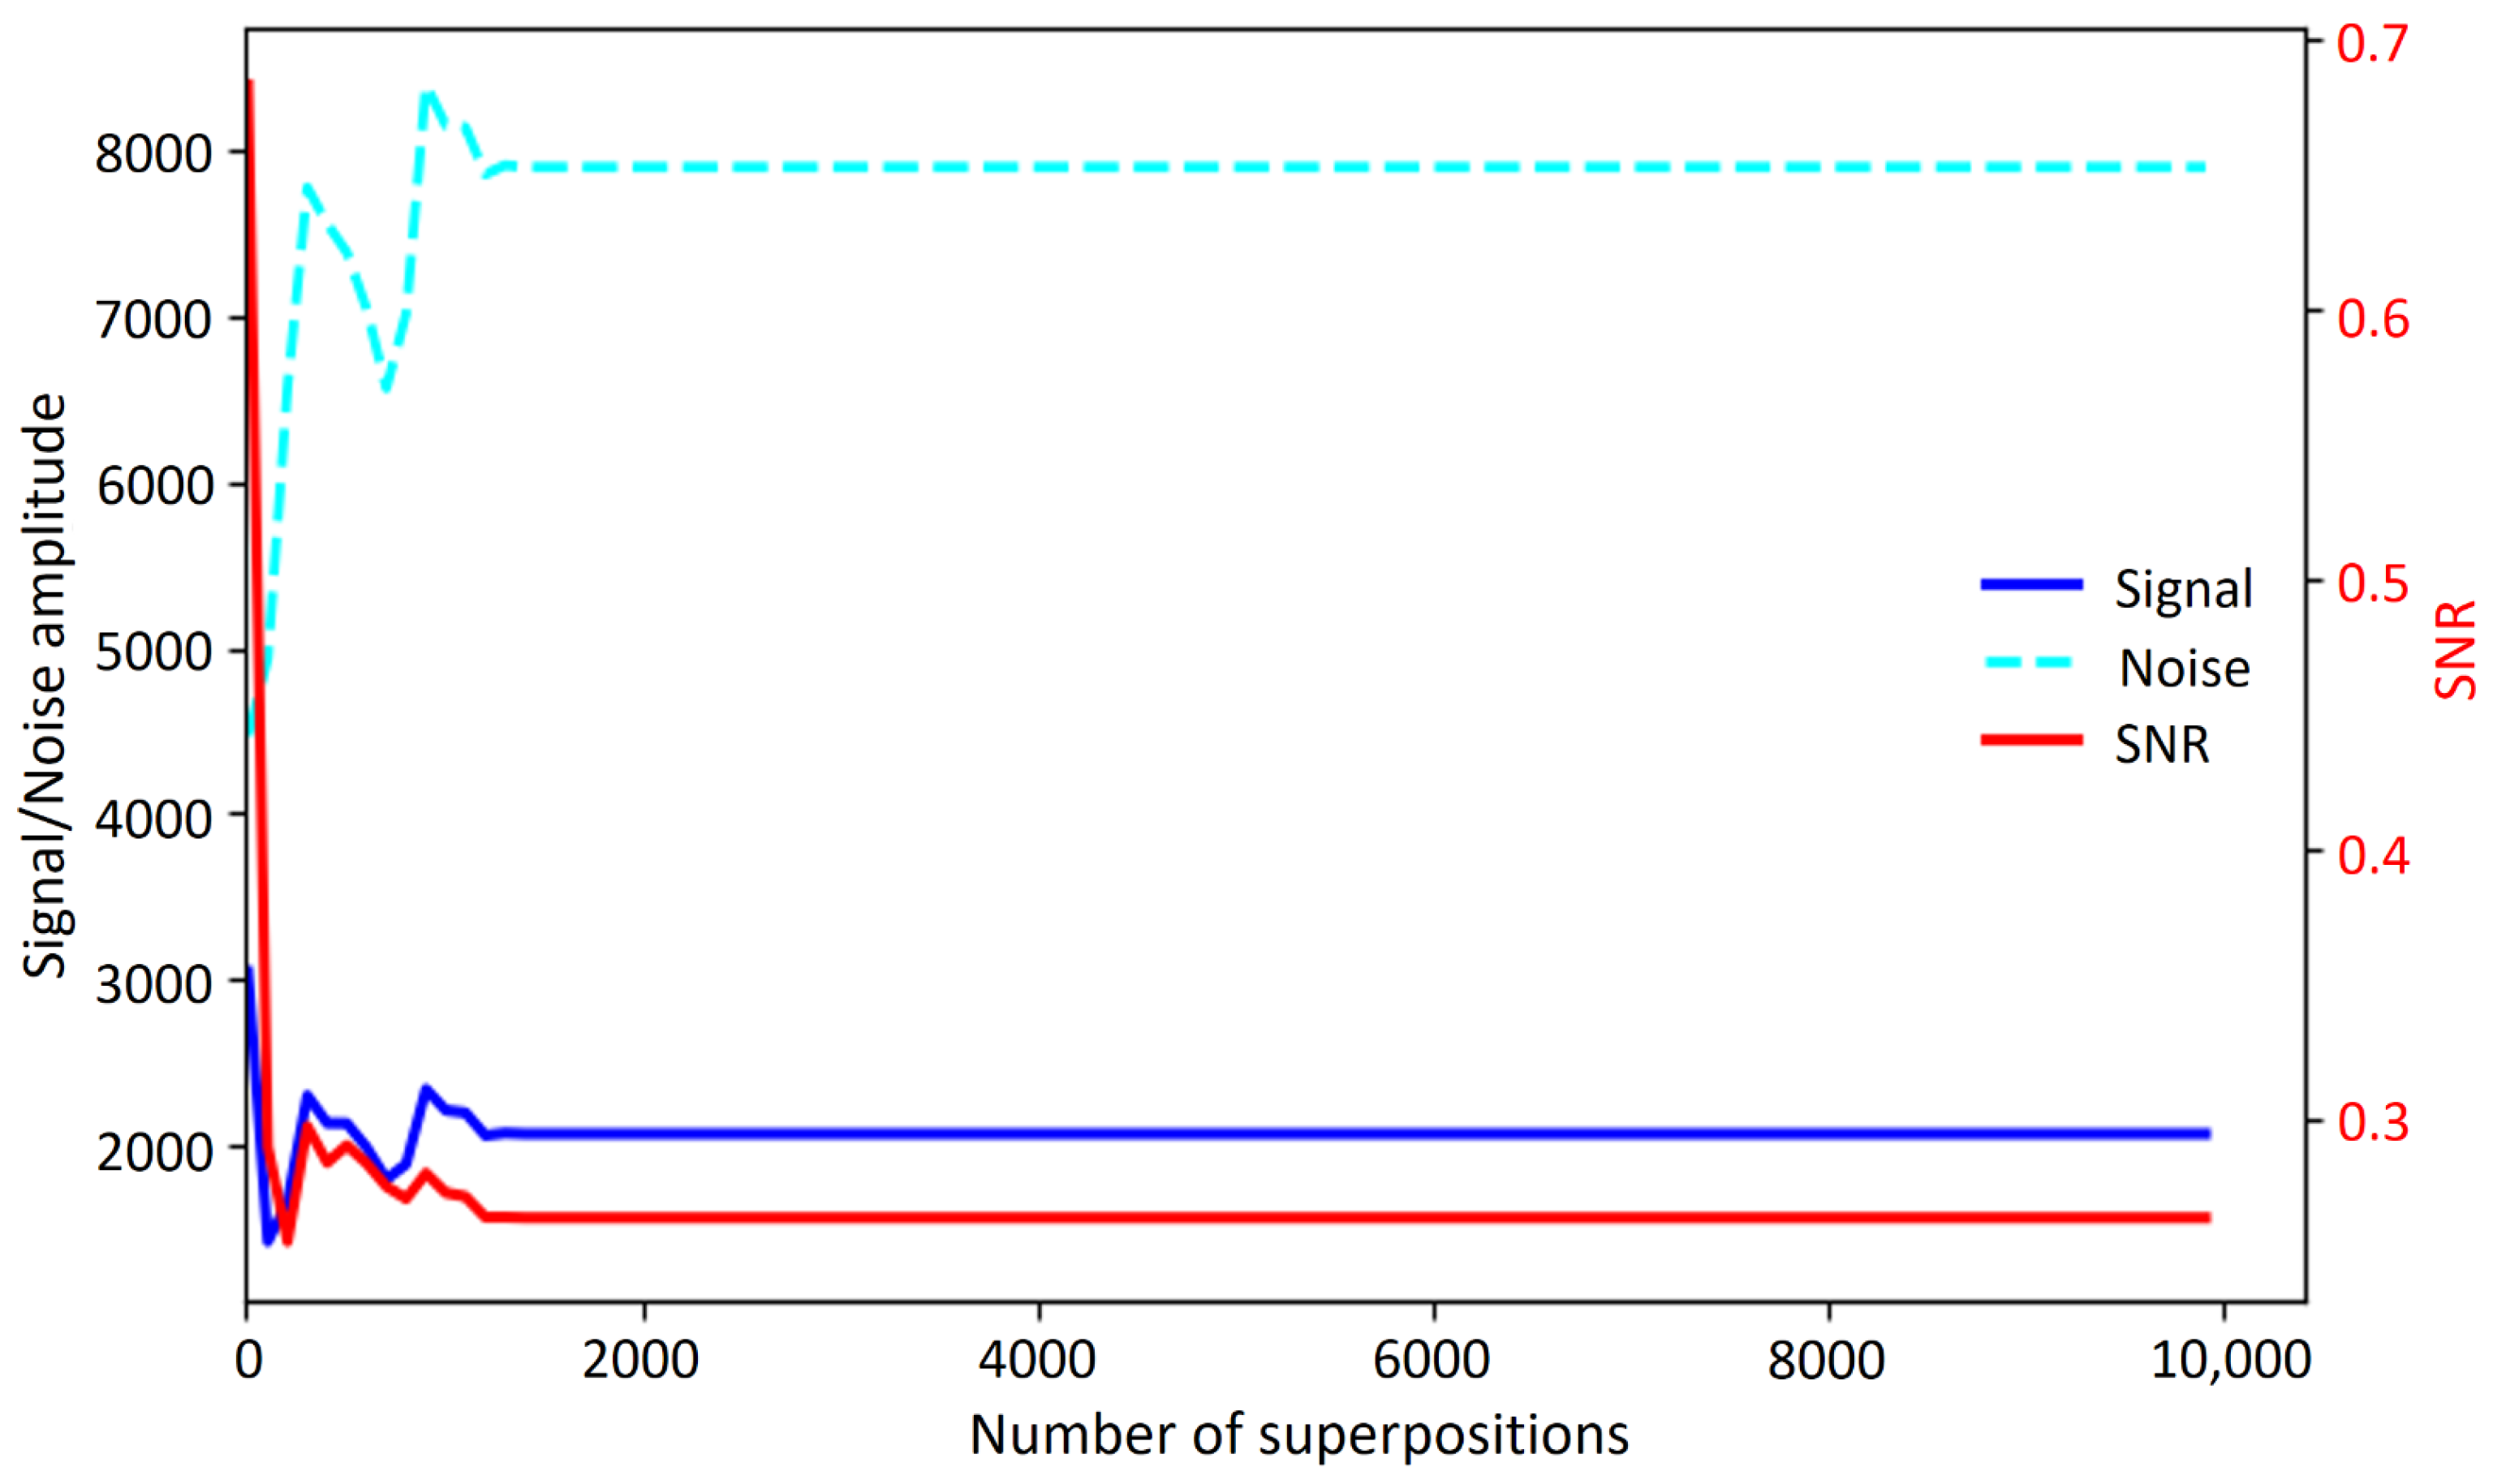
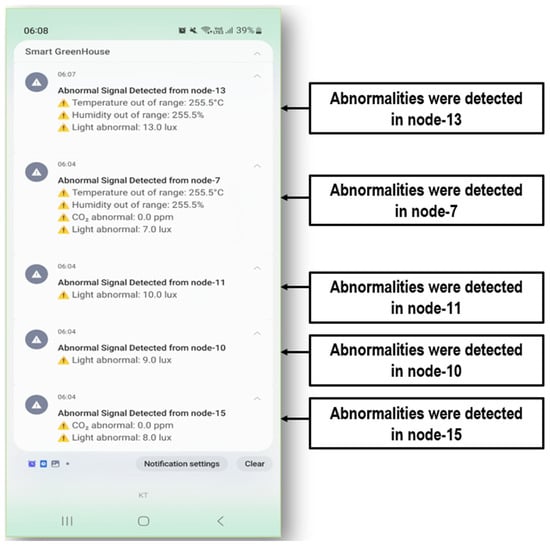
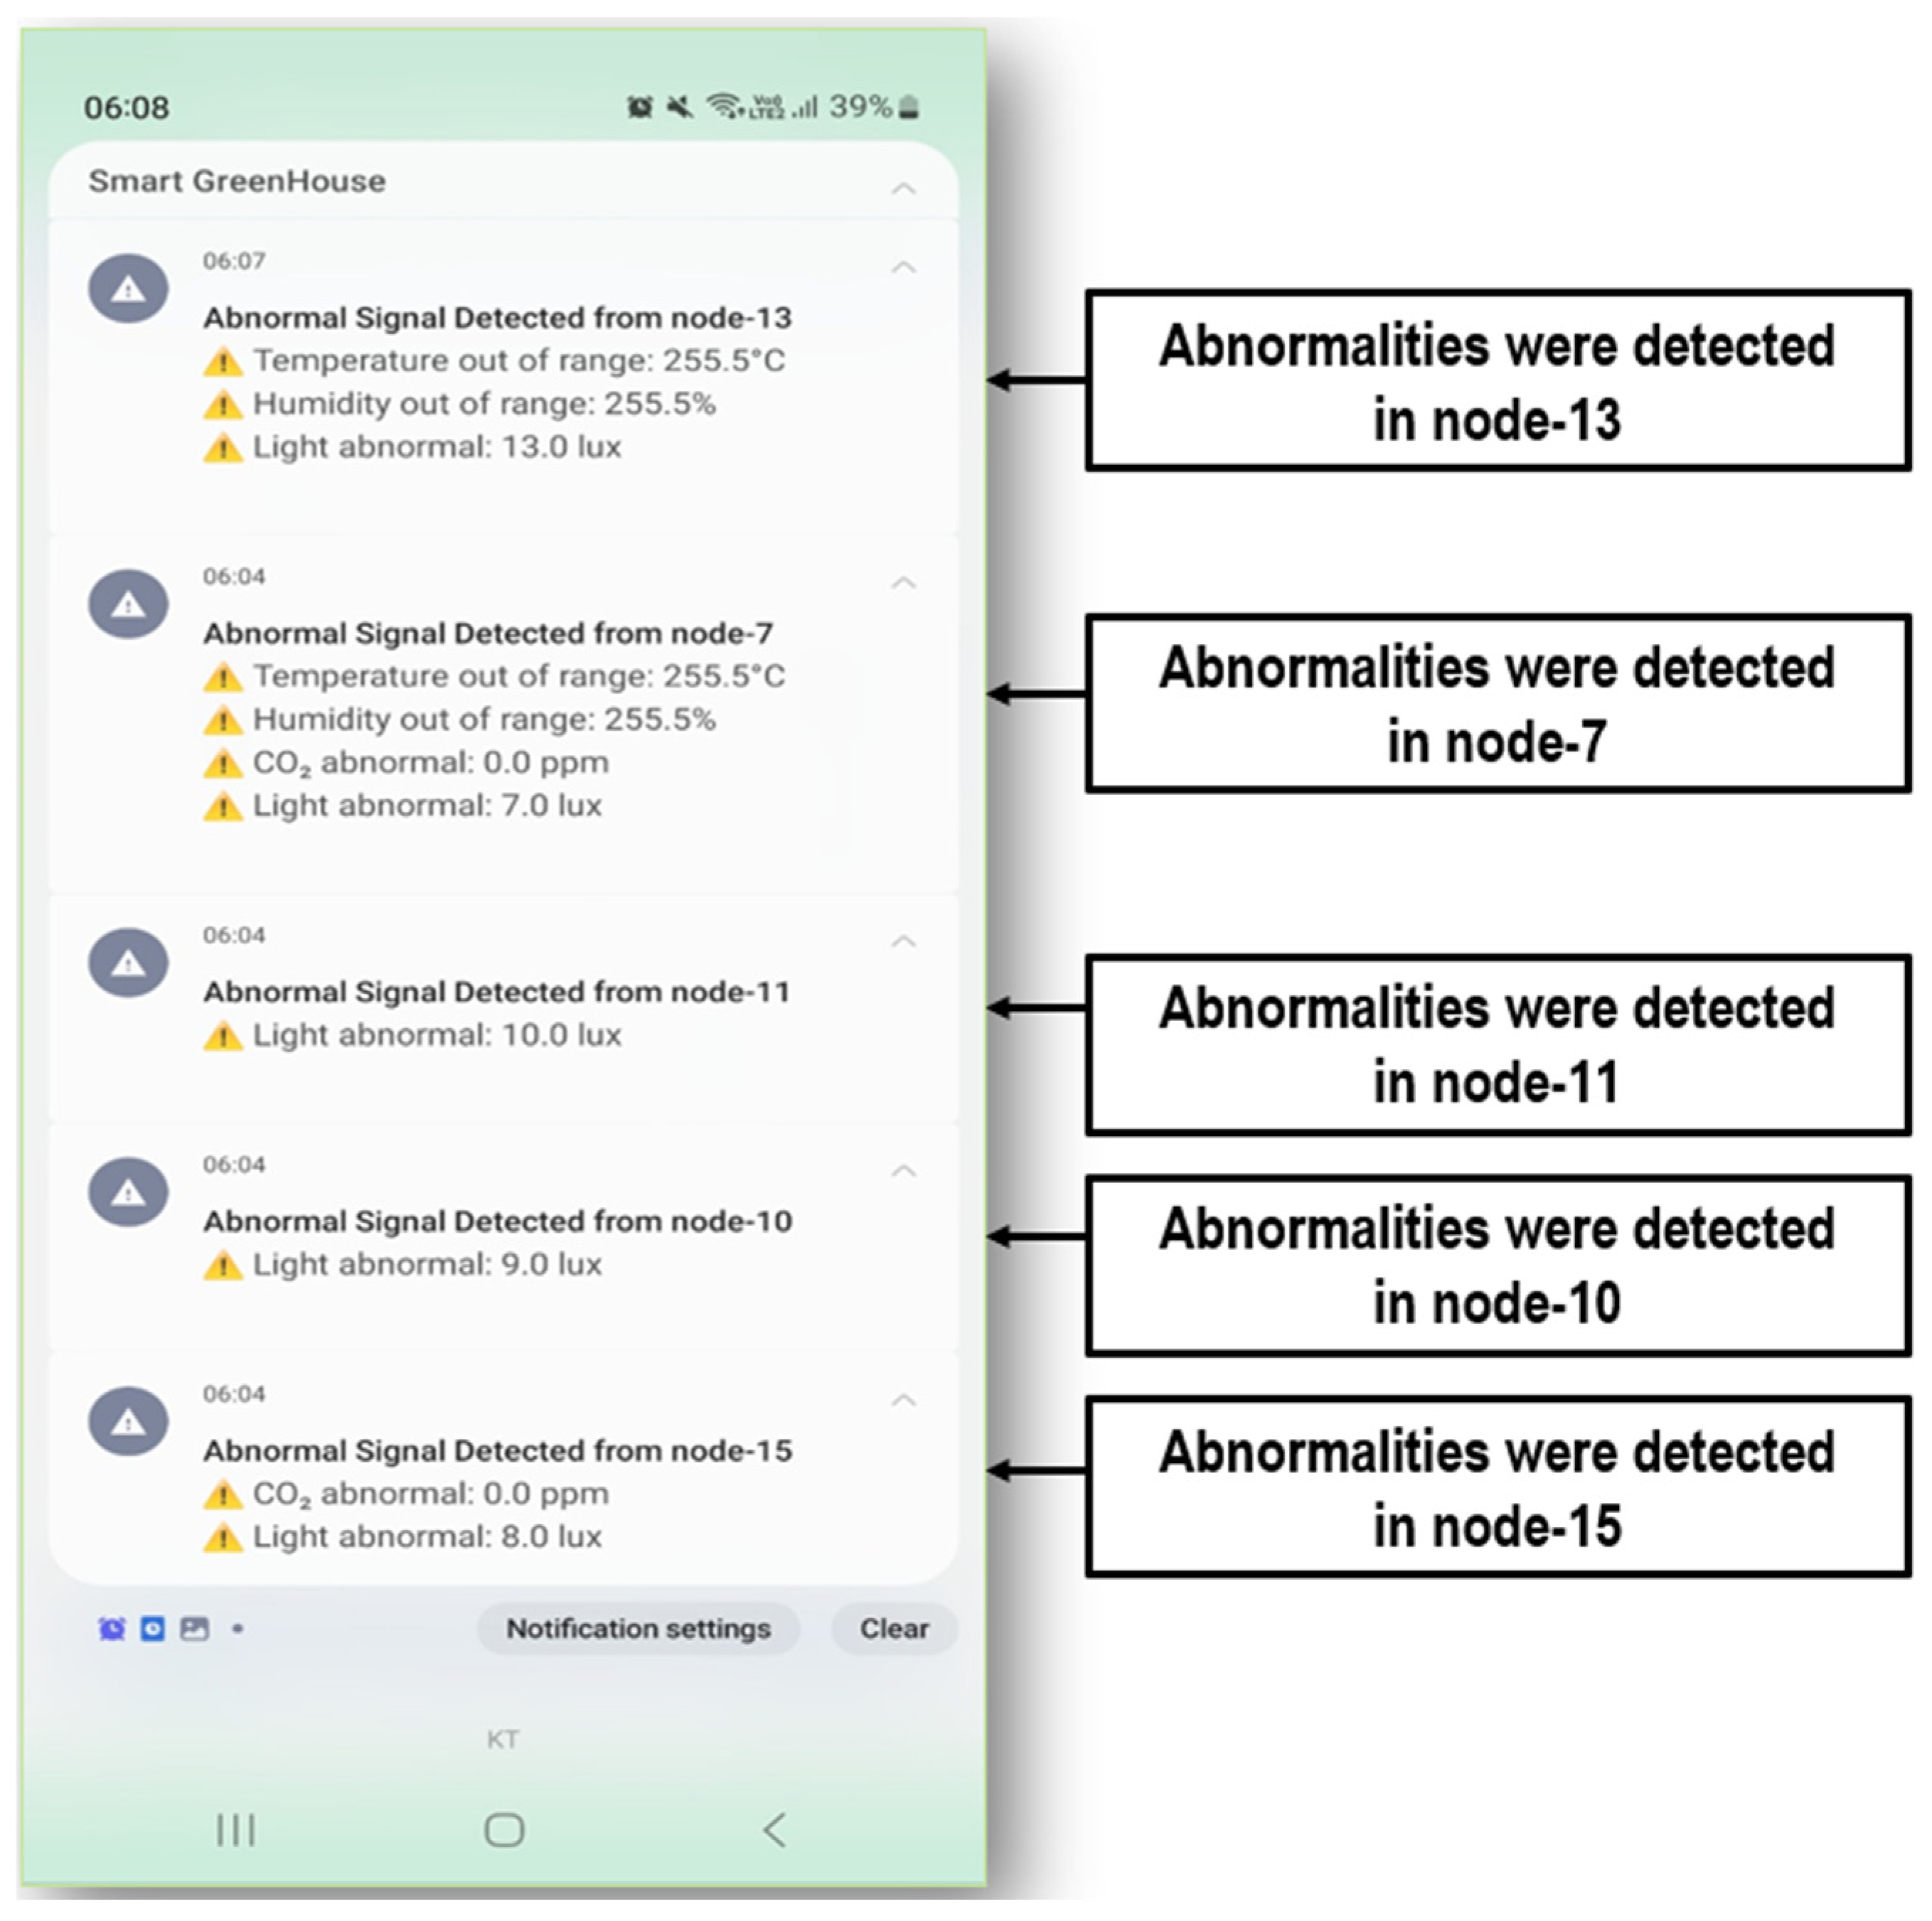
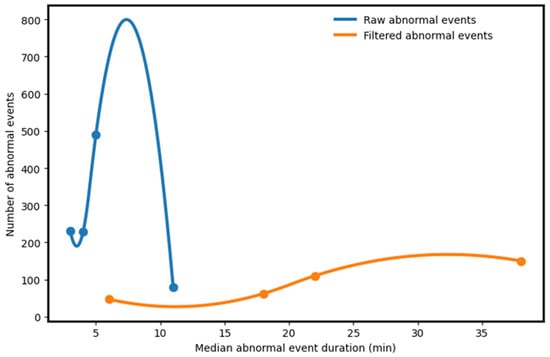
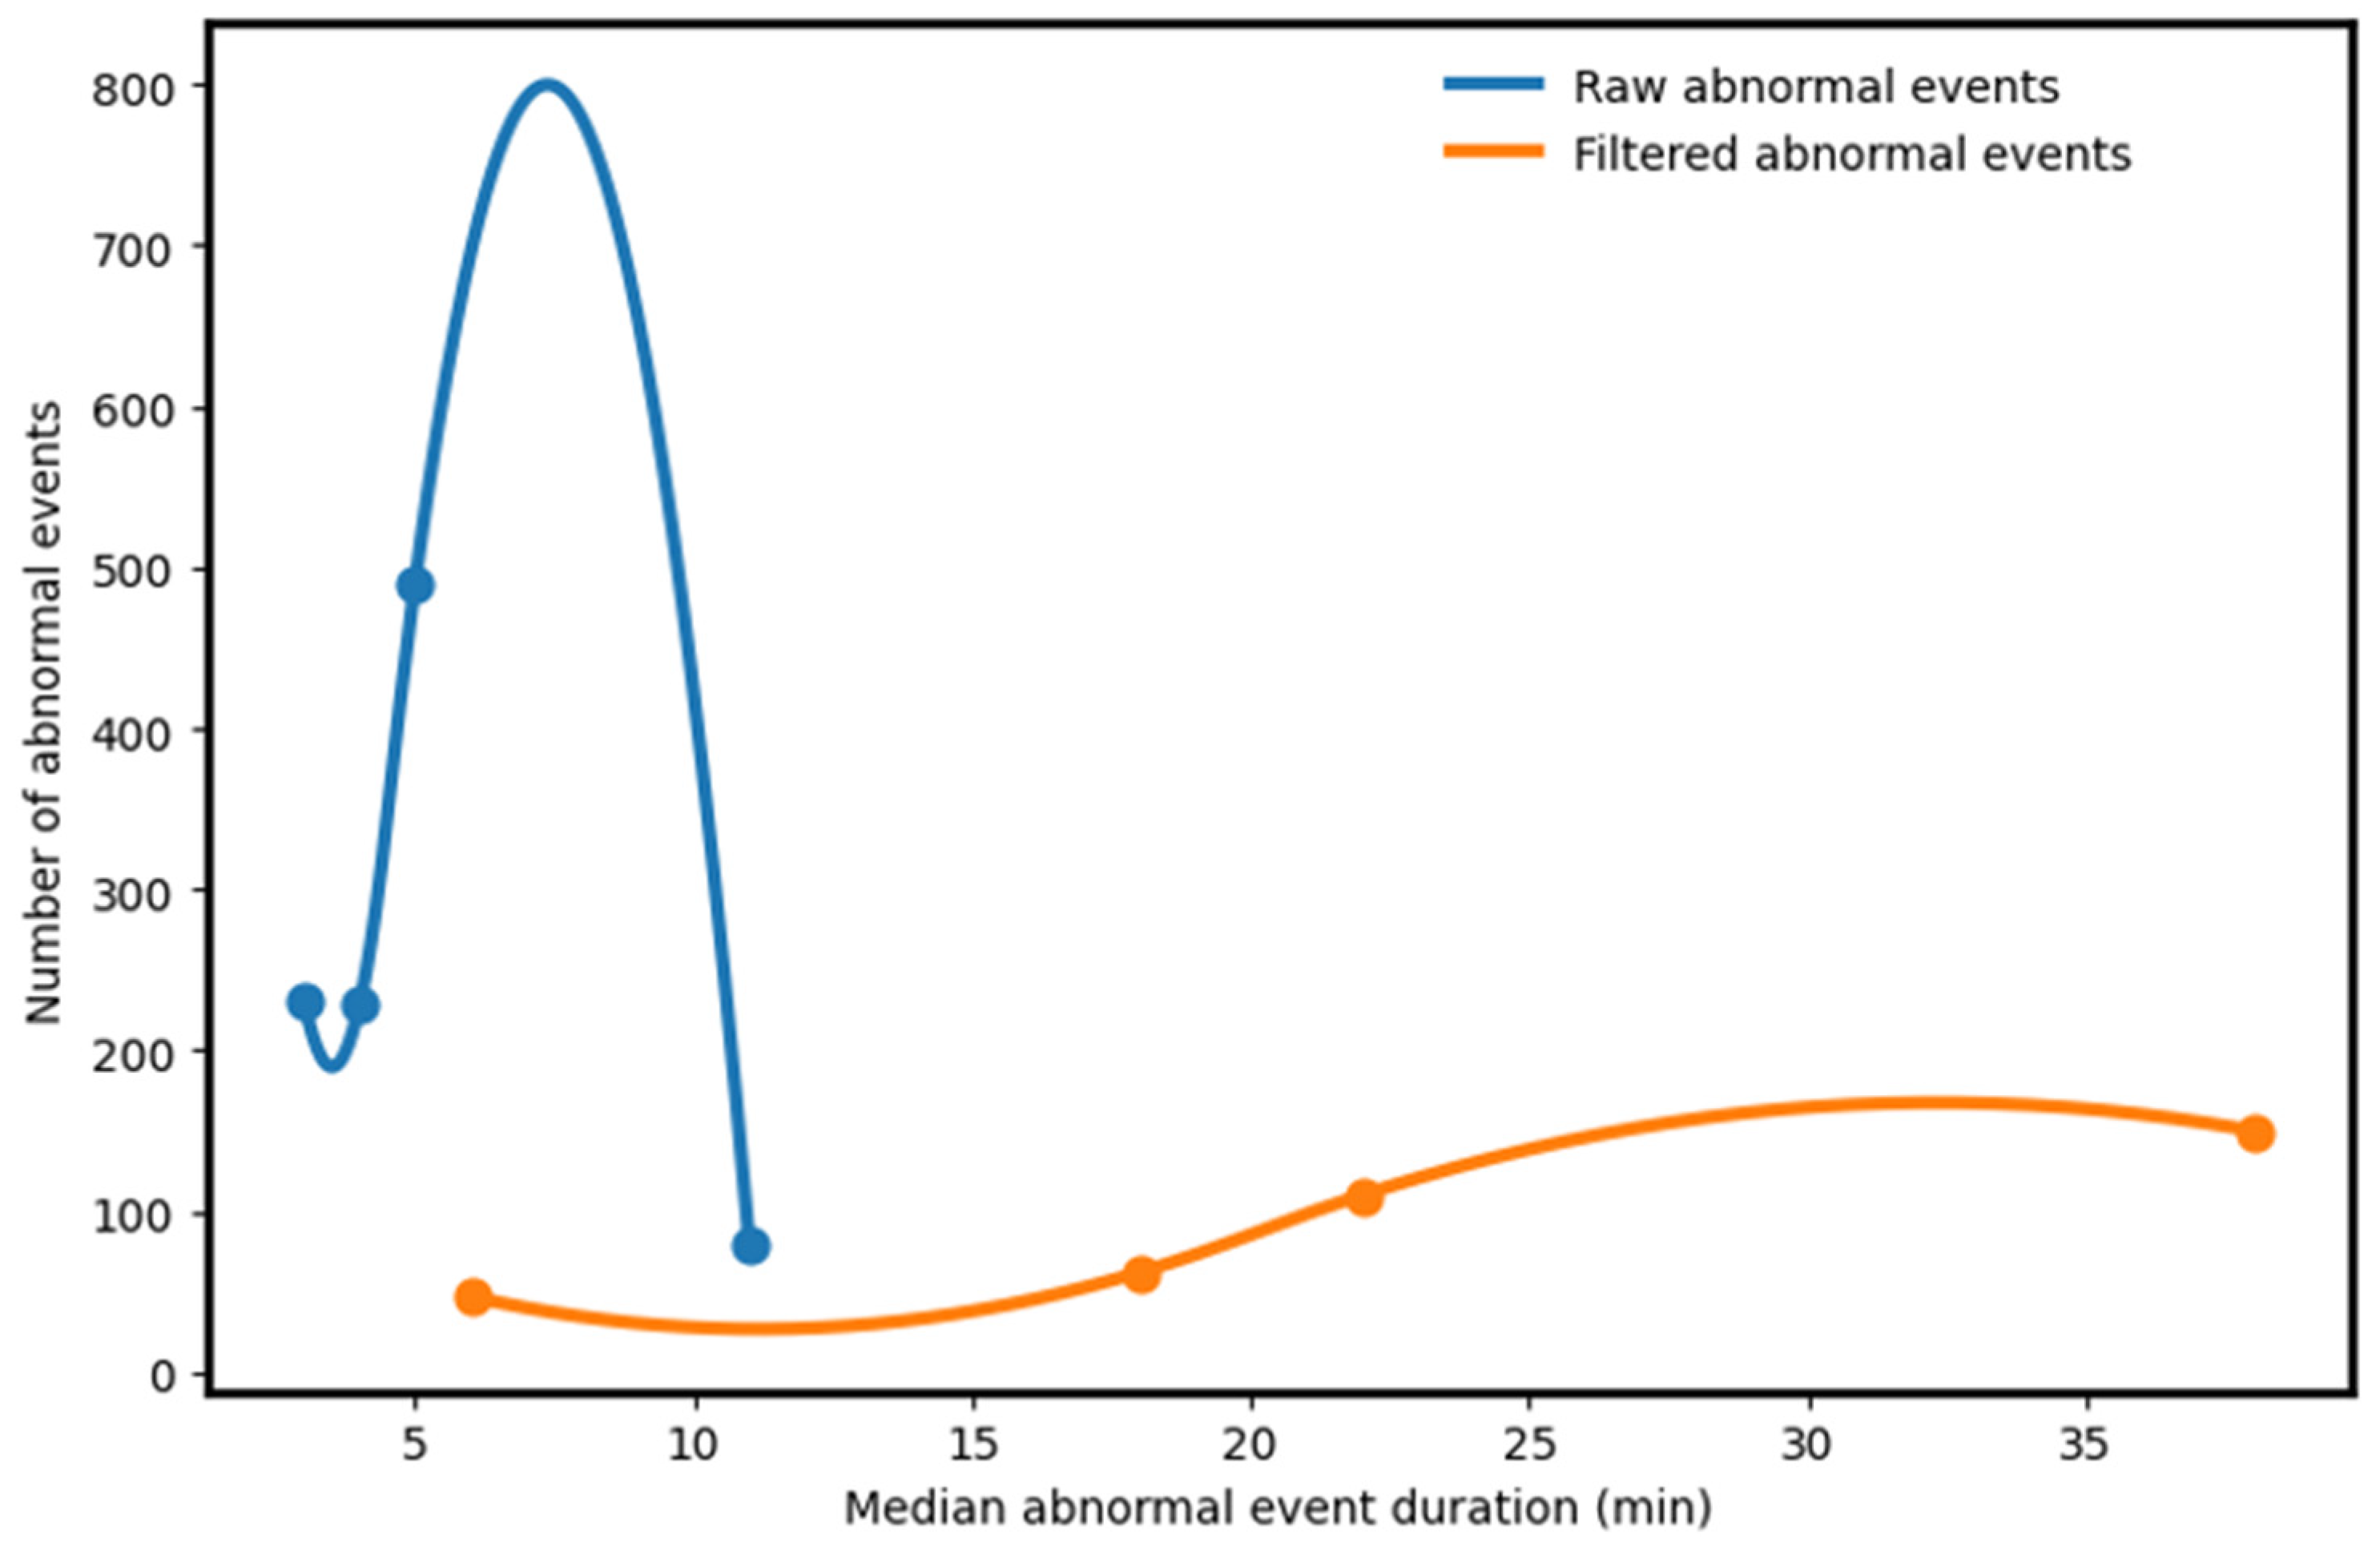
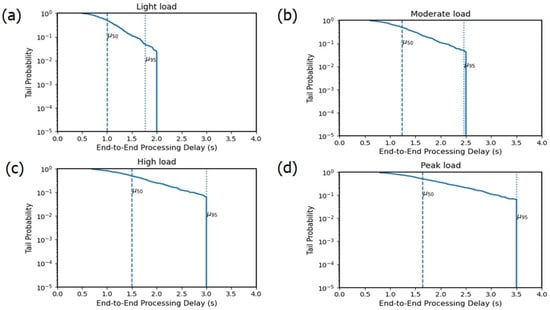
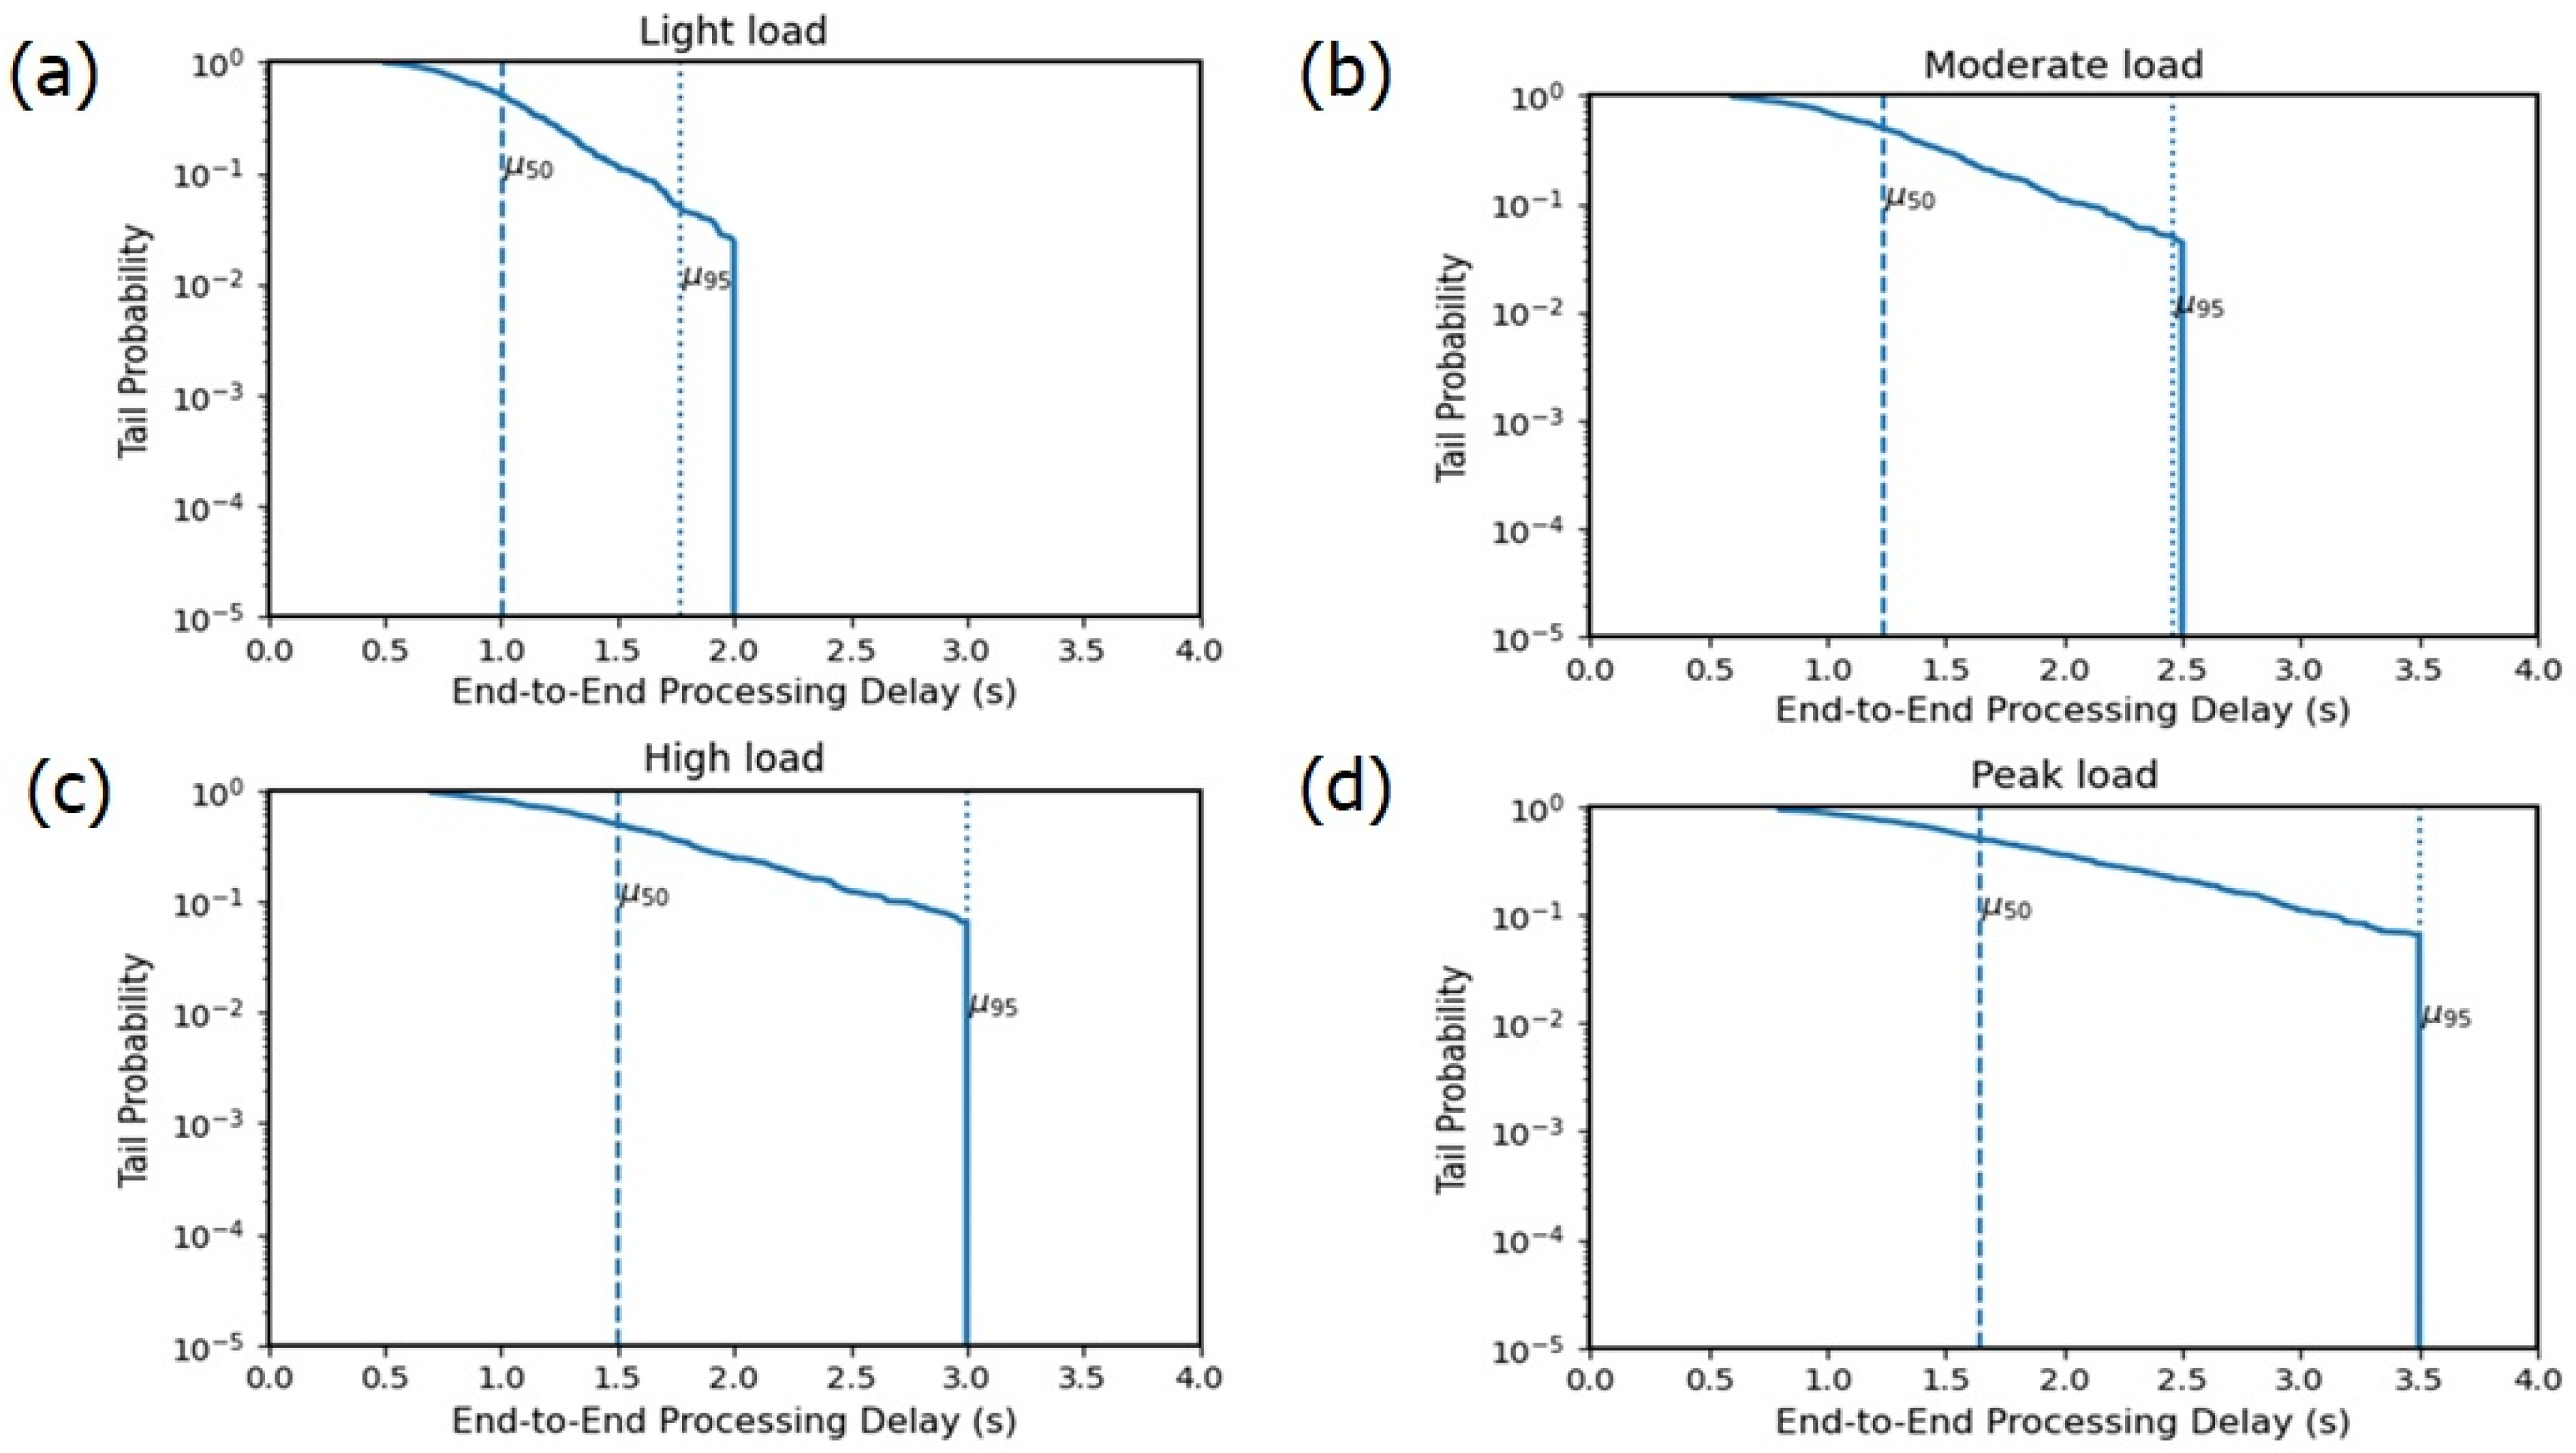
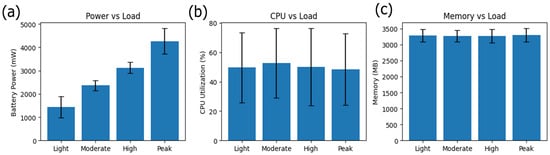
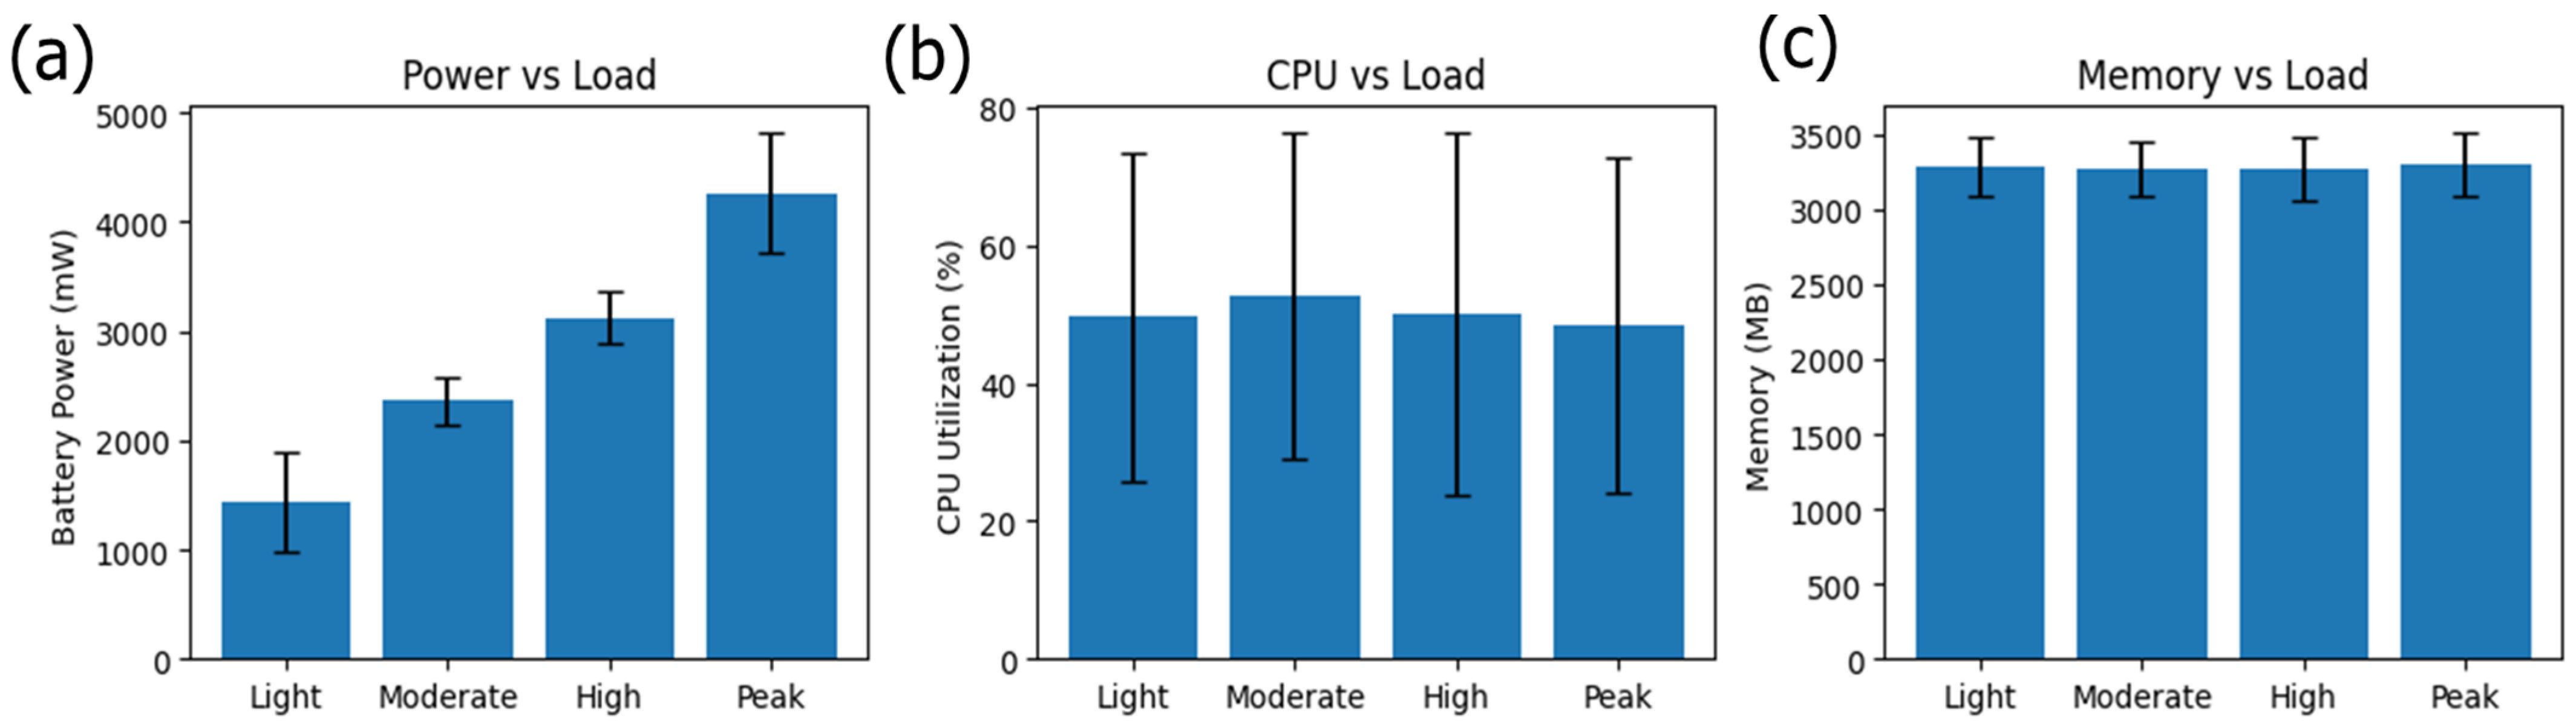




Disclaimer/Publisher’s Note: The statements, opinions and data contained in all publications are solely those of the individual author(s) and contributor(s) and not of MDPI and/or the editor(s). MDPI and/or the editor(s) disclaim responsibility for any injury to people or property resulting from any ideas, methods, instructions or products referred to in the content. |
© 2026 by the authors. Licensee MDPI, Basel, Switzerland. This article is an open access article distributed under the terms and conditions of the Creative Commons Attribution (CC BY) license.