


Abstract
Biofuels can help reduce dependence on petroleum-based fuels, and peanut oil is a potentially valuable biofuel source. This study estimates the carbon intensity (CI) of peanut oil production in Texas using the Greenhouse Gases, Regulated Emissions, and Energy Use in Transportation (GREET) model. Both the Argonne National Laboratory (ANL) and California (CA) versions of GREET were employed to calculate CI values across various scenarios. Six pathways were developed considering farming, transportation, oil extraction, and land use change processes. These scenarios varied based on peanut varieties (High Oil and Conventional Oil content), irrigation methods (irrigated or dryland), and locations (Stephenville, Dilley, and Vernon): (1) Stephenville Dryland var. High Oil, (2) Stephenville Fully Irrigated var. High Oil, (3) Vernon Limited Irrigated var. High Oil/Rye cover crop, (4) Vernon Limited Irrigated var. Conventional Oil, (5) Vernon Limited Irrigated var. Conventional Oil/Rye cover crop, (6) Dilley Fully Irrigated var. High Oil. The CI values of these scenarios were compared with those of soybean oil. According to the ANL-GREET model results, the highest CI was observed in the Dryland scenario, though it remains lower than that of soybean oil. The lowest CI was found in the Vernon Span 17 Rye Irrigated scenario. The CA-GREET model results indicated the lowest CI for Dilley and the highest for Stephenville Dryland. The high oil yield in Dilley (1.25 tons/acre) significantly reduced the CI compared to the yield in Stephenville Dryland (0.25 tons/acre). These findings suggest that peanut oil is a promising addition to the currently available biofuel options.
1. Introduction
The U.S. EPA Renewable Fuel Standard 2 mandates that petroleum refiners and importers blend a specific percentage of biofuels into their fuels, with these biofuels required to produce fewer greenhouse gas (GHG) emissions than the petroleum fuels they replace [1]. Consequently, biomass-based alternative liquid fuels have gained attention as a sustainable solution due to their low life cycle GHG emissions, renewable feedstocks, and biodegradable residues [2]. Estimating the carbon intensity (CI) of new biofuels is therefore crucial in evaluating their potential feasibility.
Life cycle GHG emissions reductions for producing biodiesel and renewable diesel (RD) from various oils and fats range from 40% to 86% compared to petroleum diesel, accounting for land use change estimations [3]. Peanut oil, in particular, is a high-quality vegetable oil suitable for conversion to renewable diesel fuels, as peanuts are among the highest-yielding annual crops for oil content, averaging over 250 gallons per acre—six times that of soybeans [4,5]. Additionally, legumes like peanuts are excellent rotation partners, requiring less (or even no) fertilizer than other feedstocks.
Conventional peanut cultivars typically exhibit an oil content of approximately 48% on a dry weight basis, whereas recently developed High Oil breeding lines have achieved oil contents approaching 60%. In this study, these are herein referred to as “Conventional Oil” and “High Oil” peanuts, respectively. The principal distinction between these two groups lies in their lipid concentration, which has direct implications for oil extraction efficiency, processing requirements, and system-level mass and energy balances. Specifically, higher oil content increases the oil yield per unit mass of harvested peanuts, thereby potentially reducing feedstock demand, processing intensity, and associated inputs per functional unit of oil produced. From a life cycle assessment perspective, these differences are expected to influence key environmental indicators—including energy use, greenhouse gas emissions, and resource efficiency—highlighting the importance of explicitly distinguishing between Conventional and High Oil varieties in sustainability evaluations. Improved agricultural practices have also increased peanut productivity, resource efficiency, and reduced environmental impacts. Since the early 1980s, GHG emissions for peanut production have decreased by 40%, from over 1 kg CO2e/kg (26.28 g/MJ CO2e with energy density of 38.05 MJ/kg for peanut) to less than 0.6 kg CO2e/kg (15.77 g/MJ CO2e with energy density of 38.05 MJ/kg for peanut) [4,5].
Farming activities, transport, storage, and usage are all included in the full life cycle assessment (LCA) of peanut oil production. The rising demand for peanut oil as a biofuel can increase peanut cultivation, leading to higher prices and expanded acreage. This expansion often involves converting non-agricultural land, releasing sequestered carbon and increasing indirect land use change (iLUC) impacts [6]. Indirect land use change (iLUC) involves altering land’s original purpose, like clearing forests for biofuel crops, and includes effects such as displacement of land use elsewhere, price fluctuations, and carbon stock changes [7]. Direct land use change, however, occurs when land is repurposed from one agricultural use to another with a similar end goal, such as switching from corn-for-ethanol to switchgrass for biofuel production, where the land continues to serve the same overall function. Induced land use change (ILUC) refers to a broader concept encompassing both direct and indirect changes. It is driven by increased demand for agricultural products, such as biofuels, leading to land expansion and carbon balance shifts in ecosystems [2,8].
Chen et al. (2018) highlighted the interaction between LCA and ILUC for biodiesel, showing that soy biodiesel could reduce GHG emissions by 76% without considering ILUC, and by 66–72% when ILUC is included [2]. Spawn et al. (2021) emphasized the significant LUC emissions from grassland conversion in the US, with peanuts being a particularly carbon-intensive crop due to their displacement of forests [9]. This study underscores the need for careful carbon accounting in agricultural assessments. Zhao et al. (2021) estimated ILUC emissions for sustainable aviation fuels (SAFs) using a computable general equilibrium model, highlighting the varying impacts of different feedstocks and regions [10].
While some studies suggest that peanuts have a similar carbon footprint to soybeans [4,5], the CI of crop production and biofuel processes must be quantified and compared. Key challenges for producing peanut include optimizing oil content, production levels, and CI estimates to minimize environmental impact and maximize yield and cost efficiency.
This research aims to develop CI estimates for ‘High Oil’ and Conventional Oil peanut under various production and location scenarios. The CI estimates will quantify and describe GHG emissions and the potential global warming impact of ‘High Oil’ at the farm level and throughout the supply chain for producing peanut oil. This data will aid in assessing the feasibility, sustainability and environmental impact of ‘High Oil’ oil production, supporting decision-making, and enabling performance benchmarking across major peanut-producing regions. Moreover, it will facilitate comparisons of the economic and CI feasibility of peanut oil with other renewable diesel feedstocks such as soybean.
The Greenhouse Gases, Regulated Emissions, and Energy Use in Transportation (GREET) model, developed by the Argonne National Laboratory (ANL) [11], advances the understanding of biofuels’ sustainability, producing high-quality analyses. The CA-GREET model, a California-specific version used under the California Low Carbon Fuel Standard (LCFS), includes additional regional and pollutant emission factors. The ANL-GREET and CA-GREET models do not have a pathway for estimating the CI of peanut oil extraction.
This research aims to: (1) develop a pathway in the GREET models (ANL and CA versions) to estimate the CI of peanut oil extraction, (2) compare the CI estimates in CA-GREET and ANL-GREET, (3) compare the CI values of peanut oil (Conventional vs. High Oil) and soy oil, (4) quantify the CI values for different peanut oil production scenarios in Texas, and (5) identify the most sensitive parameter(s) in CI through sensitivity analysis.
2. Materials and Methods
Six pathways were developed and the CI values for different scenarios of High Oil and Conventional Oil peanut production, transportation, oil extraction, and land use change processes were estimated.
2.1. Scenarios for High Oil and Conventional Peanut
One of the goals of this research is to explore cropping systems that optimize the growth, harvest, and yield of High Oil Peanuts. A team of cropping systems specialists assessed low-input cropping systems through field trials, identifying yield-limiting factors and developing solutions to improve the viability of High Oil Peanuts. With increasing competition for water resources due to growing groundwater demands from municipalities and industries, water-conserving cropping systems are crucial. In Texas, declining groundwater levels or pumping restrictions can alter irrigation rates within a single growing season. A potential strategy to address reduced irrigation capacity is to cultivate crops with lower water requirements. Conservation tillage, which increases surface residue, can enhance water retention, soil moisture storage, and water use efficiency. Research in Texas peanut-producing areas has shown that conservation tillage combined with cover crops boosts soil organic carbon. The study will evaluate rotational systems, cover crops, tillage, and fertilizer practices under dryland and limited irrigation conditions to create cropping systems with minimal carbon footprints. These factors guided the establishment of field trials across various locations in Texas. The research also assessed dryland and limited irrigated systems. Fertilizer and herbicide use, tillage practices, cover crops, and rotational partners for weed management were evaluated holistically to achieve low CI in High Oil peanut production. Field trials were conducted in three distinct regions: Lubbock, Stephenville, and Vernon, Texas. Traditional peanut cropping systems served as controls at each site (e.g., cotton–peanut rotation in Vernon and Lubbock). The study explored limited irrigation and dryland systems, which was a departure from conventional peanut farming in these regions, ensuring no competition with existing food-grade production systems. Initial research from Vernon and Lubbock showed that conservation tillage and cover crops did not affect peanut yields in traditional systems, and the study built on these findings for ‘High Oil’ peanuts production. Tillage practices ranged from conventional to strip-tillage and no-till, with or without cover crops. Water management involved dryland and different levels of limited irrigation, including a treatment simulating reduced well capacity to focus irrigation at key growth stages. Crop yields for both ‘High Oil’ peanut and rotational crops were measured throughout the study. As trials progressed, more focused experiments were conducted to refine management practices for the identified cropping systems, including herbicide use, fertility, and pest management. The collected data supported economic assessments and CI quantification.
Research conducted in peanut-producing regions of Texas demonstrated that combining conservation tillage with cover crops increased soil organic carbon (C). Rotational cropping systems, cover crops, tillage methods, and fertilizer practices were evaluated under dryland and limited irrigation conditions to develop a cropping system with the lowest possible carbon footprint. To this end, six pathways were developed for farming, transportation, oil extraction, land use change processes in different scenarios for producing peanut depending on peanut varieties (High Oil vs. Conventional Oil), irrigated or dryland, and location (Stephenville, Dilley, and Vernon). Stephenville, Dilley, and Vernon were selected to represent the diversity of peanut production systems in Texas, including variations in climate, soil type, irrigation practices, and yield potential. Stephenville reflects North-Central dryland and irrigated systems, Vernon represents limited irrigation in the Rolling Plains, and Dilley captures high-yield irrigated production in South Texas. Together, these sites provide a representative range of conditions for evaluating carbon intensity across typical Texas peanut systems.
These six scenarios are (1) Stephenville Dryland var. High Oil, (2) Stephenville Fully Irrigated var. High Oil, (3) Vernon Limited Irrigated var. High Oil/Rye cover crop, (4) Vernon Limited Irrigated var. Conventional Oil, (5) Vernon Limited Irrigated var. Conventional Oil/Rye cover crop, (6) Dilley Fully Irrigated var. High Oil. The CI values of these six scenarios were further compared with that of soybean (var stands for the variety of the peanut (High Oil/Conventional Oil)).
Table 1 presents the six scenarios along with their corresponding input data. The yield data were derived from three replicates of two-row plots, weighed, and adjusted to represent tons of pods per acre, which were then converted to bushels per acre to align with the functional unit in the GREET model. The yield in Dilley Fully Irrigated (176.62 Bushel/acre) is the highest across all scenarios. Vernon Limited Irrigated (both High Oil/Rye and Conventional Oil/Rye) yields (126.85 and 136.48 Bushel/acre respectively) are also high, especially without fertilizers. The yield in Stephenville Dryland (34.52 Bushel/acre) is the lowest, likely due to lack of irrigation. Despite having added fertilizers, the yield of Stephenville Fully Irrigated (76.27 Bushel/acre) is still significantly lower than the Vernon and Dilley scenarios. Fertilizer application is concentrated in the Stephenville Fully Irrigated and Dilley Fully Irrigated scenarios. Both scenarios show significant use of nitrogen (N), potassium (K), and phosphorus (P). No fertilizers were applied in the Vernon Limited Irrigated scenarios (High Oil/Rye and Conventional Oil/Rye), yet they achieved high yields, especially scenario 5 (136.48 Bushel/acre), which outperforms even scenario 2 (Stephenville Fully Irrigated with added fertilizers). In Vernon Limited Irrigated scenarios, higher amounts of herbicides (25.68 and 21.45 g/bushel) were applied compared to other scenarios. No herbicides were applied in Stephenville Dryland scenario, likely due to different management practices and resource limitations. All scenarios except Stephenville Dryland have significant water use for irrigation, with Dilley Fully Irrigated requiring the most (26 Acre-inches). The energy required for irrigation (measured in Btu/bushel) is highest in the Vernon scenarios, with Vernon Limited Irrigated High Oil/Rye requiring 5368.68 Btu/bushel. The total energy for farming is highest in Stephenville Dryland (37,017.41 Btu/bushel), largely driven by diesel fuel and gasoline use. The total energy use across irrigated systems decreases with increased yield efficiency. Dilley Fully Irrigated, with the highest yield, has a relatively low total energy use (10,898.59 Btu/bushel). Interestingly, the total energy in farming for Vernon Limited Irrigated scenarios (14,081.40 and 14,166.76 Btu/bushel) is lower than Stephenville Fully Irrigated (16,755.25 Btu/bushel) despite their higher yields. The oil content is highest in the High Oil varieties (0.60%), particularly for the Stephenville and Vernon High Oil scenarios. The oil content in Conventional Oil scenarios is lower (0.48%). Soybean oil content is significantly lower at 0.23%.
Table 1.
Six scenarios based on data collected from the selected field trails and the input data for each (var stands for the variety of the peanut (High Oil/Conventional Oil)).
Despite not using fertilizers, the Vernon Limited Irrigated scenarios (especially the Conventional Oil/Rye scenario) achieve high yields and relatively low energy use compared to Stephenville and Dilley irrigated systems. This may be attributed to favorable climatic conditions, soil properties, or the impact of the cover crop (Rye) in maintaining soil health. Scenarios like Stephenville Fully Irrigated use large amounts of fertilizer but still have lower yields compared to Vernon Limited Irrigated scenarios without fertilizers. This raises questions about the efficiency of fertilizer use in the Stephenville area and whether soil or other environmental factors are limiting yield response to fertilizers. Dilley Fully Irrigated: this scenario stands out as having the highest yield and moderate energy use, making it a productive option under full irrigation conditions. Despite no fertilizer application, the yields in Vernon Limited Irrigated (especially Conventional Oil/Rye) are higher than in Stephenville Fully Irrigated where fertilizers are used. Soil quality, crop rotation practices, or microclimate differences can be contributing to these results. Theoretically, peanuts require little to no fertilizers. The difference in yield across the scenarios can be attributed to variations in soil types, climate (temperature, rainfall, solar radiation, and other climatic conditions), and the amount of fertilizer applied.
To decrease carbon emissions and costs, drying and shelling processes were not considered for estimating CI. Butts et al. (2009) [12] indicated that drying, cleaning, and shelling peanuts account for about one-third of the costs associated with their production for oil extraction. The modified peanut combined successfully captured 91% of the peanut kernels harvested in the control treatment and shelled 99% of the kernels harvested, significantly outperforming a conventional grain combine. This approach, which involves letting peanuts dry in the windrow, reduced postharvest oil production costs by up to 36% [12]. Thus, to reduce the CI and cost, it is assumed that peanuts can be dried by leaving them on the ground and then harvesting them afterward. Shelling can also be performed simultaneously with harvesting.
Additionally, it is noteworthy that harvesting peanuts involves soil disturbance. This soil disturbance leads to carbon dioxide release because disturbing the top layer of soil, which contains carbon-rich organic matter, exposes it to oxygen, leading to the oxidation of the organic matter [13]. However, the GHG emissions from the harvesting process are not accounted for in the current phase of this research due to the limitations of the GREET model. Such emissions are highly site-specific and temporally variable, requiring process-based models (e.g., DNDC [14,15] or DayCent [16,17]) and detailed field measurements for reliable estimation.
No studies were found on estimating the CI for harvesting peanuts. To approximate this, we identified a similar study that compared plowing and no-plowing conditions for grassland in Ireland [13]. According to this study, plowing grassland resulted in carbon emissions of 0.64 g CO2/ha during the first 9 h. Using this value, we estimate that the total CO2 emissions for plowing peanuts during the first 24 h would be approximately 0.06 g CO2/MJ for a yield of 25.69 bushels of peanuts per acre. Given the minimal impact of the CI value associated with harvesting peanuts, it is not included in the final outputs. Moreover, although we identified this research conducted by Willems et al. (2011) [13], it is not applicable to our study. The primary reason is the significant difference in hydroclimatic conditions between Ireland and Texas. Additionally, the differences in farming practices and the nature of grasslands versus peanut crops further limit the relevance of this study.
Importantly, one of the primary objectives of this study is to conduct a comparative assessment across multiple scenarios. Since soil disturbance emissions during harvesting are consistently excluded from all scenarios, their omission does not affect the relative differences among scenarios or the overall comparative conclusions. In addition, relative to dominant life cycle contributors, such as fertilizer application, irrigation energy use, and processing inputs, the contribution of short-term soil disturbance is expected to be minor. Therefore, while this limitation introduces some uncertainty in absolute values, it is not anticipated to significantly influence the comparative carbon intensity results.
2.2. Developing a Pathway in the ANL-GREET and CA-GREET Tier 2 Models to Estimate the CI of ‘High Oil’ Peanut Oil Production
Peanut is an attractive alternative to many vegetable oils currently used for biofuels due to its relatively high oil content and lower fertilizer requirements. Despite these advantages, the ANL-GREET and CA-GREET [18,19] models do not have a pathway for estimating the CI of peanut oil extraction. However, the GREET model allows for the addition of new resources, processes, and pathways, provided there is sufficient data inventory.
2.2.1. System Boundary and Functional Unit
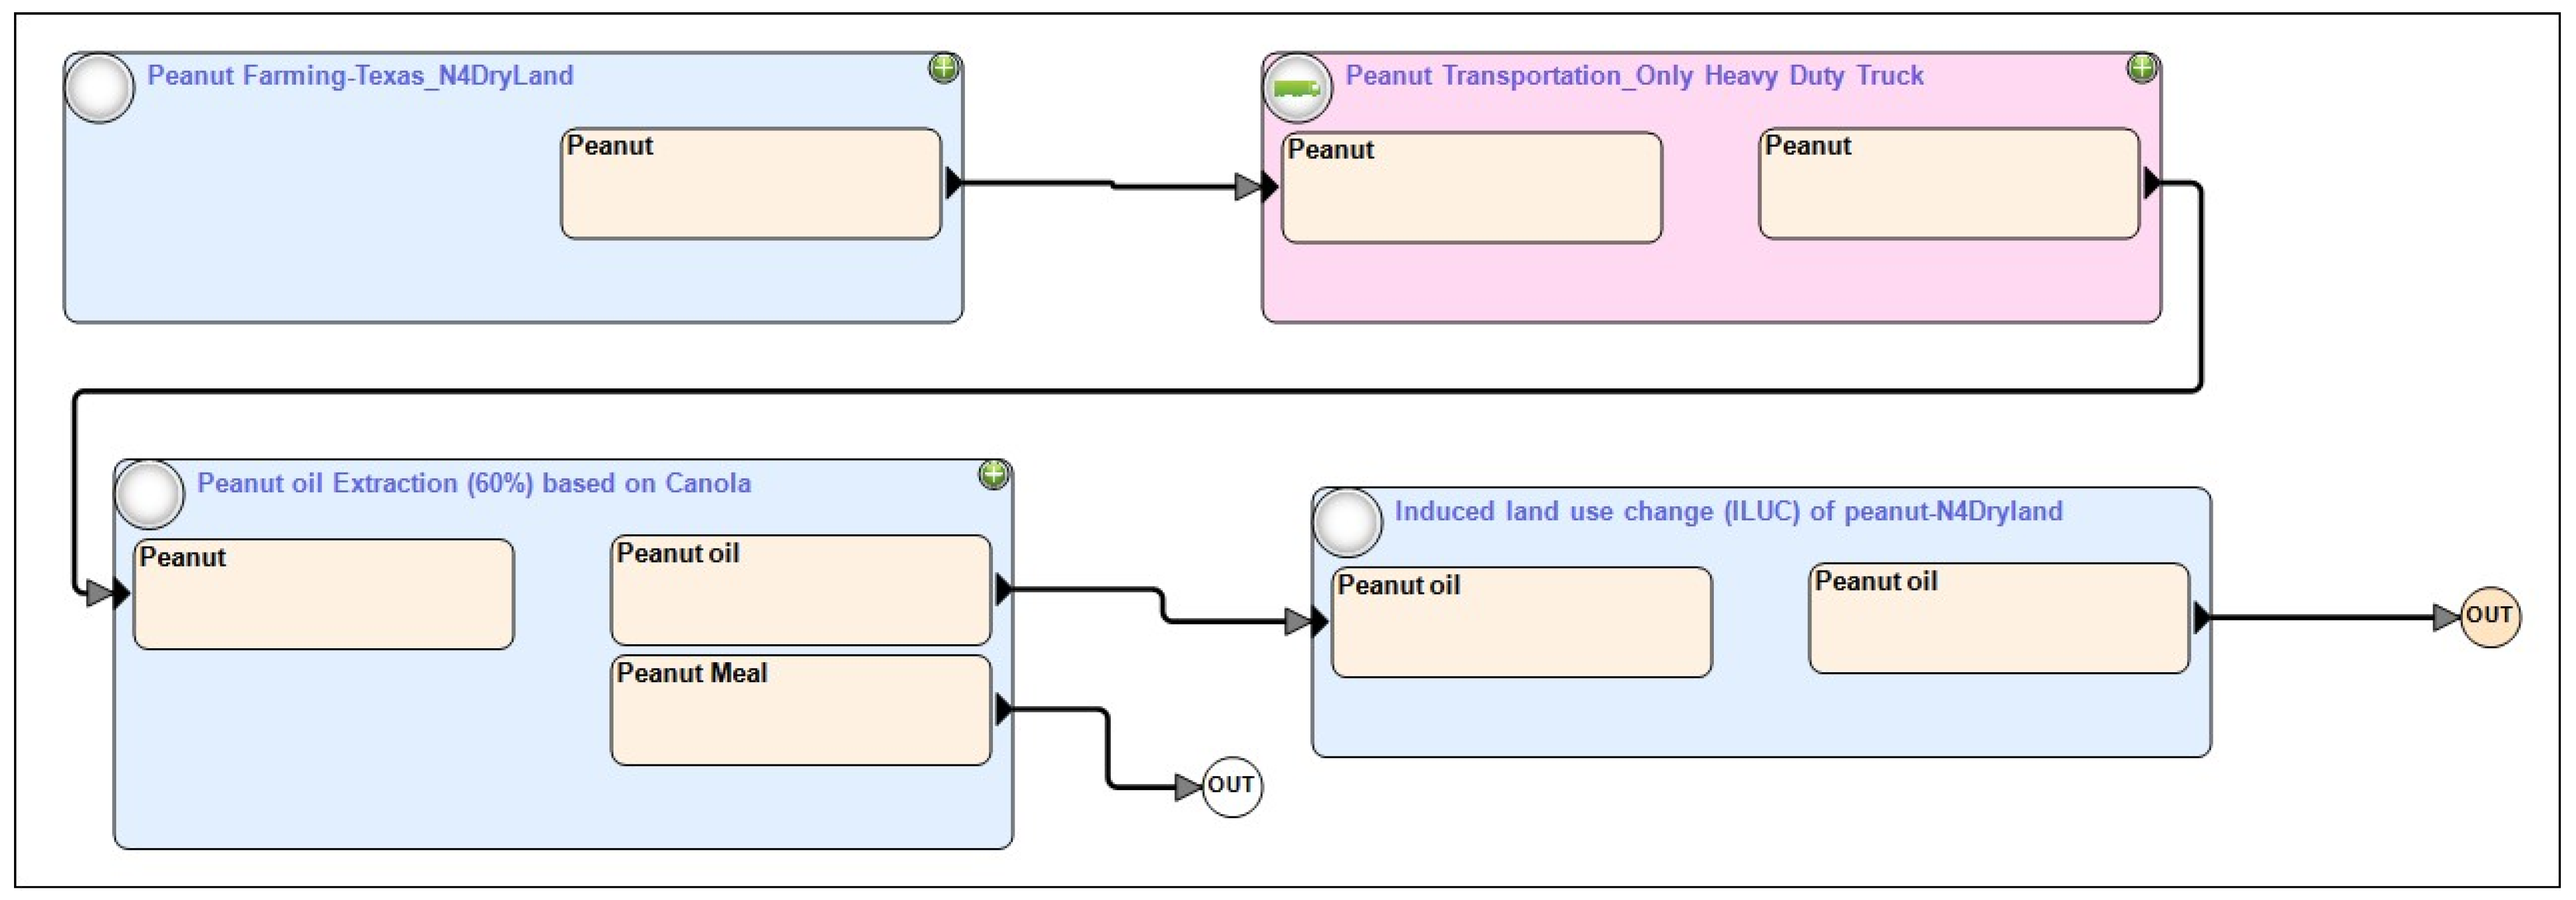
This study adopts a cradle-to-gate LCA approach to quantify the CI of peanut oil production systems in Texas. The system boundary includes all major stages from agricultural production to oil extraction, as illustrated in Figure 1. The agricultural phase comprises upstream production of inputs (e.g., fertilizers, pesticides, and seeds), direct field emissions such as nitrous oxide (N2O) from fertilization, fuel combustion associated with farm machinery, and energy consumption for irrigation.
Figure 1.
‘High Oil’ pathway for oil extraction using ANL-GREET model. Schematic representation of the life cycle of peanut production and processing in Texas including transportation and induced land use change (ILUC) modeling. The system boundary begins with peanut farming on non-irrigated dryland (Peanut Farming-Texas_N4DryLand), where peanuts are cultivated and harvested. Peanuts are then transported via heavy-duty trucks (Peanut Transportation_Only Heavy Duty Truck) to processing facilities. The peanut oil extraction process (Peanut oil Extraction, 60% based on canola) separates peanuts into peanut oil and peanut meal, with outputs entering the ILUC module (Induced Land Use Change of peanut-N4Dryland) to estimate environmental impacts associated with land conversion driven by peanut oil production. The arrows indicate material flows between processes, and the final outputs represent the system-level products considered in the life cycle assessment.
The post-harvest phase includes transportation of peanuts from the farm to the oil extraction facility, followed by oil processing operations. The oil extraction stage consists of preprocessing, solvent extraction (e.g., n-hexane), separation, and refining processes required to produce peanut oil. Consistent with regional agricultural practices in Texas, drying and shelling are assumed to occur on-farm during or immediately after harvesting and therefore do not constitute separate energy-intensive processes within the system boundary. As a result, no additional transportation or processing burdens are assigned to these steps.
The system boundary excludes downstream processes such as fuel conversion (e.g., biodiesel production), distribution, and end use. ILUC impacts are estimated separately and reported as an additional contribution to CI.
The functional unit of this study is defined as one megajoule (MJ) of energy content of produced peanut oil. All inputs, outputs, and emissions are normalized to this functional unit to ensure consistency and to facilitate comparison with other vegetable oil systems reported in the literature.
2.2.2. Pathway in ANL-GREET
The High Oil peanut research project successfully addressed the data inventory challenge by collaborating with an interdisciplinary team. This team includes breeders for identifying the most suitable peanut germplasm for Texas, agronomists, soil scientists and cropping systems researchers, microbiome researchers as well as extension specialists familiar with Texas peanut production. The data collected by this team was used to incorporate the farming, transportation, oil extraction, and induced land use change (ILUC) processes of ‘High Oil’ and ‘Conventional Oil’ peanuts into the GREET model. The processes involved in peanut production, transportation, oil extraction, and ILUC for dryland scenario, as an example, are illustrated in Figure 1. For ANL-GREET, .net version 2021 (v1.3.0.13857) was used. The input data for the peanut farming process includes various fertilizers and chemicals, irrigation water, energy required for farming, and yield (Table 1).
2.3. Energy Requirement for Transportation
Considering the typical distances from farms to peanut processing facilities and the types of transportation used in Texas, it is assumed that heavy-duty trucks are employed for transporting peanuts from farms to oil extraction plants, within a radius of 30 miles, which is the default mileage value for soybean in the GREET model. The 30-mile distance for peanut transportation was confirmed with local peanut producers and the oil extraction facility in Texas. This value was applied uniformly across all scenarios to ensure consistent and comparable assessment of scenario-specific impacts. “Only Heavy Duty Truck” was considered for peanut transportation to processing facilities.
2.4. Energy Requirement for Drying and Shelling
The drying and shelling processes, as well as the transportation from drying and shelling facilities to oil extraction plants, are excluded from this analysis. It is assumed that in Texas drying is achieved by leaving the peanuts on the ground and harvesting them after they have dried. Shelling is assumed to occur simultaneously with harvesting. As it is assumed that drying and shelling are performed on the farm, the same transportation will be utilized for moving the product from the farm to the oil extraction facility. Consequently, the transportation from drying and shelling facilities to oil extraction plants is excluded from the analysis.
Because drying and shelling are integrated with on-farm harvesting, no additional energy or transportation is required beyond that used to move the harvested peanuts from the farm to the oil extraction facility. Treating drying and shelling as separate processes would require accounting for additional energy use and associated greenhouse gas emissions, potentially increasing the estimated carbon intensity. This approach reflects the operational context of peanut oil production in Texas while ensuring consistent comparison across all scenarios.
2.5. Energy Requirement for Peanut Oil Extraction
The energy types required for the oil extraction process include electricity, natural gas, and N-Hexane. Data for peanut oil extraction is currently unavailable; therefore, data in the literature for canola, which has a similar oil content to peanuts, was used as a proxy. In the absence of peanut-specific industrial data, surrogate data from similar oilseed systems are commonly used in LCA studies, with adjustments based on key parameters such as oil content and extraction efficiency [20,21]. Since canola contains 46% oil, which is close to the oil content in the peanut varieties in our study (48%, 58%, and 60%), the energy needed for peanut oil extraction was estimated by applying the canola data and adjusting for the oil content ratio. The assumption is based on the principle that higher oil content requires less energy for extraction. Consequently, the inverse ratio of oil content between peanuts and canola was applied to estimate the energy required for peanut oil extraction. The oil content is 58% and 60% for High Oil varieties, while it is 48% for Conventional varieties. A 2% loss of oil during the extraction process was assumed to account for inefficiencies in mechanical and solvent-based recovery. The mass balance allocation method was used for peanut oil extraction and the meal co-product. The allocation factors are 0.40 for scenarios 1, 2, and 3; 0.52 for scenarios 4 and 5; and 0.42 for scenario 6.
2.6. Estimating ILUC
The available scenarios in the GREET Model for estimating ILUC include CARB case 8, CARB Average Proxy [19], and GTAP 2004 and 2011. These scenarios are data-intensive and require more data than currently available for estimating the ILUC of peanut oil production. For instance, parameters such as PAEL (yield to price response for cropland pasture), ETA (productivity of new cropland versus existing cropland), and YDEL (yield to price response in crop production) are needed, which is beyond the scope of this study at this phase. To address this challenge, the estimated ILUC of soybean in the ANL-GREET model was used as a proxy, adjusted by the ratios of oil content and yield between peanuts and soybeans. This approach is based on the premise of determining how much land is required to produce the same amount of oil.
2.7. Comparison of Soybean and Peanut
To ensure a consistent and valid comparison, CI of soybean oil was estimated using the same system boundaries, functional unit, and modeling framework as applied to peanut oil. Specifically, both systems follow a cradle-to-factory gate approach, including farming, transportation, oil extraction, and land use change processes. Input parameters for soybean production, such as fertilizer application, energy use, and yield, were obtained from the GREET model default dataset and relevant literature [20,22].
To maintain consistency, processes not included in the peanut oil pathway (e.g., downstream fuel conversion, distribution, and end-use combustion) were also excluded from the soybean pathway. Additionally, ILUC values for soybean were derived directly from the GREET model, while peanut ILUC was estimated proportionally based on oil content and yield differences. This harmonization of assumptions ensures that the comparison between peanut oil and soybean oil reflects differences in feedstock and management practices rather than inconsistencies in system boundaries or modeling approaches.
2.8. Sensitivity Analysis
To identify which input variables have the most significant impact on the model’s output, sensitivity analysis was conducted. Tornado charts were used to represent the sensitivity analysis results. The methodology from Chen et al. (2018) was adopted to create the ‘High Oil’ tornado charts, using the 10th percentile (P10) and 90th percentile (P90) approach. In this approach, P10 is the highest value (10% of estimates will equal or exceed P10), and P90 is the lowest value (90% of estimates will equal or exceed P90). However, the presence of zero values for some variables (e.g., no fertilizers in the Dryland scenario) restricts the application of this approach. Additionally, longer time series are required to identify statistical distributions of input variables. Consequently, a 50% increase and reduction in inputs were used instead.
The Monte Carlo method [23] with a one-at-a-time approach was used for sensitivity analysis, considering the impacts of a 50% reduction and increase in inputs. The values of other variables were held constant when running the sensitivity analysis for each specific input.
Sensitivity analyses were conducted for key input parameters, including irrigation energy demand (electricity) and fertilizer application rates (nitrogen, phosphorus, and potash), and the results are presented in the Results section. These analyses identify the most influential inputs affecting CI across scenarios.
Peanut yield was not included as a variable in the sensitivity analysis because it is not an independent input parameter within the GREET modeling framework, but rather an outcome of site-specific conditions and management practices (e.g., irrigation, fertilizer use, and climate). In this study, yield variability is explicitly captured through the six defined scenarios, which represent different locations and management systems. Therefore, the influence of yield on CI is inherently reflected in the scenario-based results.
Furthermore, yield directly determines the functional output (oil produced per unit area) and is the dominant factor influencing CI. Including it as a sensitivity parameter would not provide additional meaningful insight, as its effect is already embedded in the comparative analysis across scenarios. Accordingly, the sensitivity analysis focuses on controllable input parameters, which are more appropriate for evaluating uncertainty within each scenario.
Sensitivity analysis for oil extraction efficiency was not performed due to the current lack of peanut-specific processing data. This limitation will be addressed in future phases of this ongoing five-year project as additional data become available, enabling more comprehensive uncertainty analysis.
3. Results and Discussion
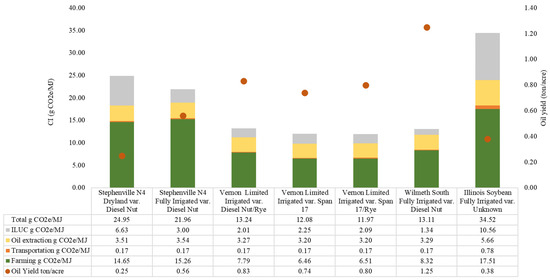
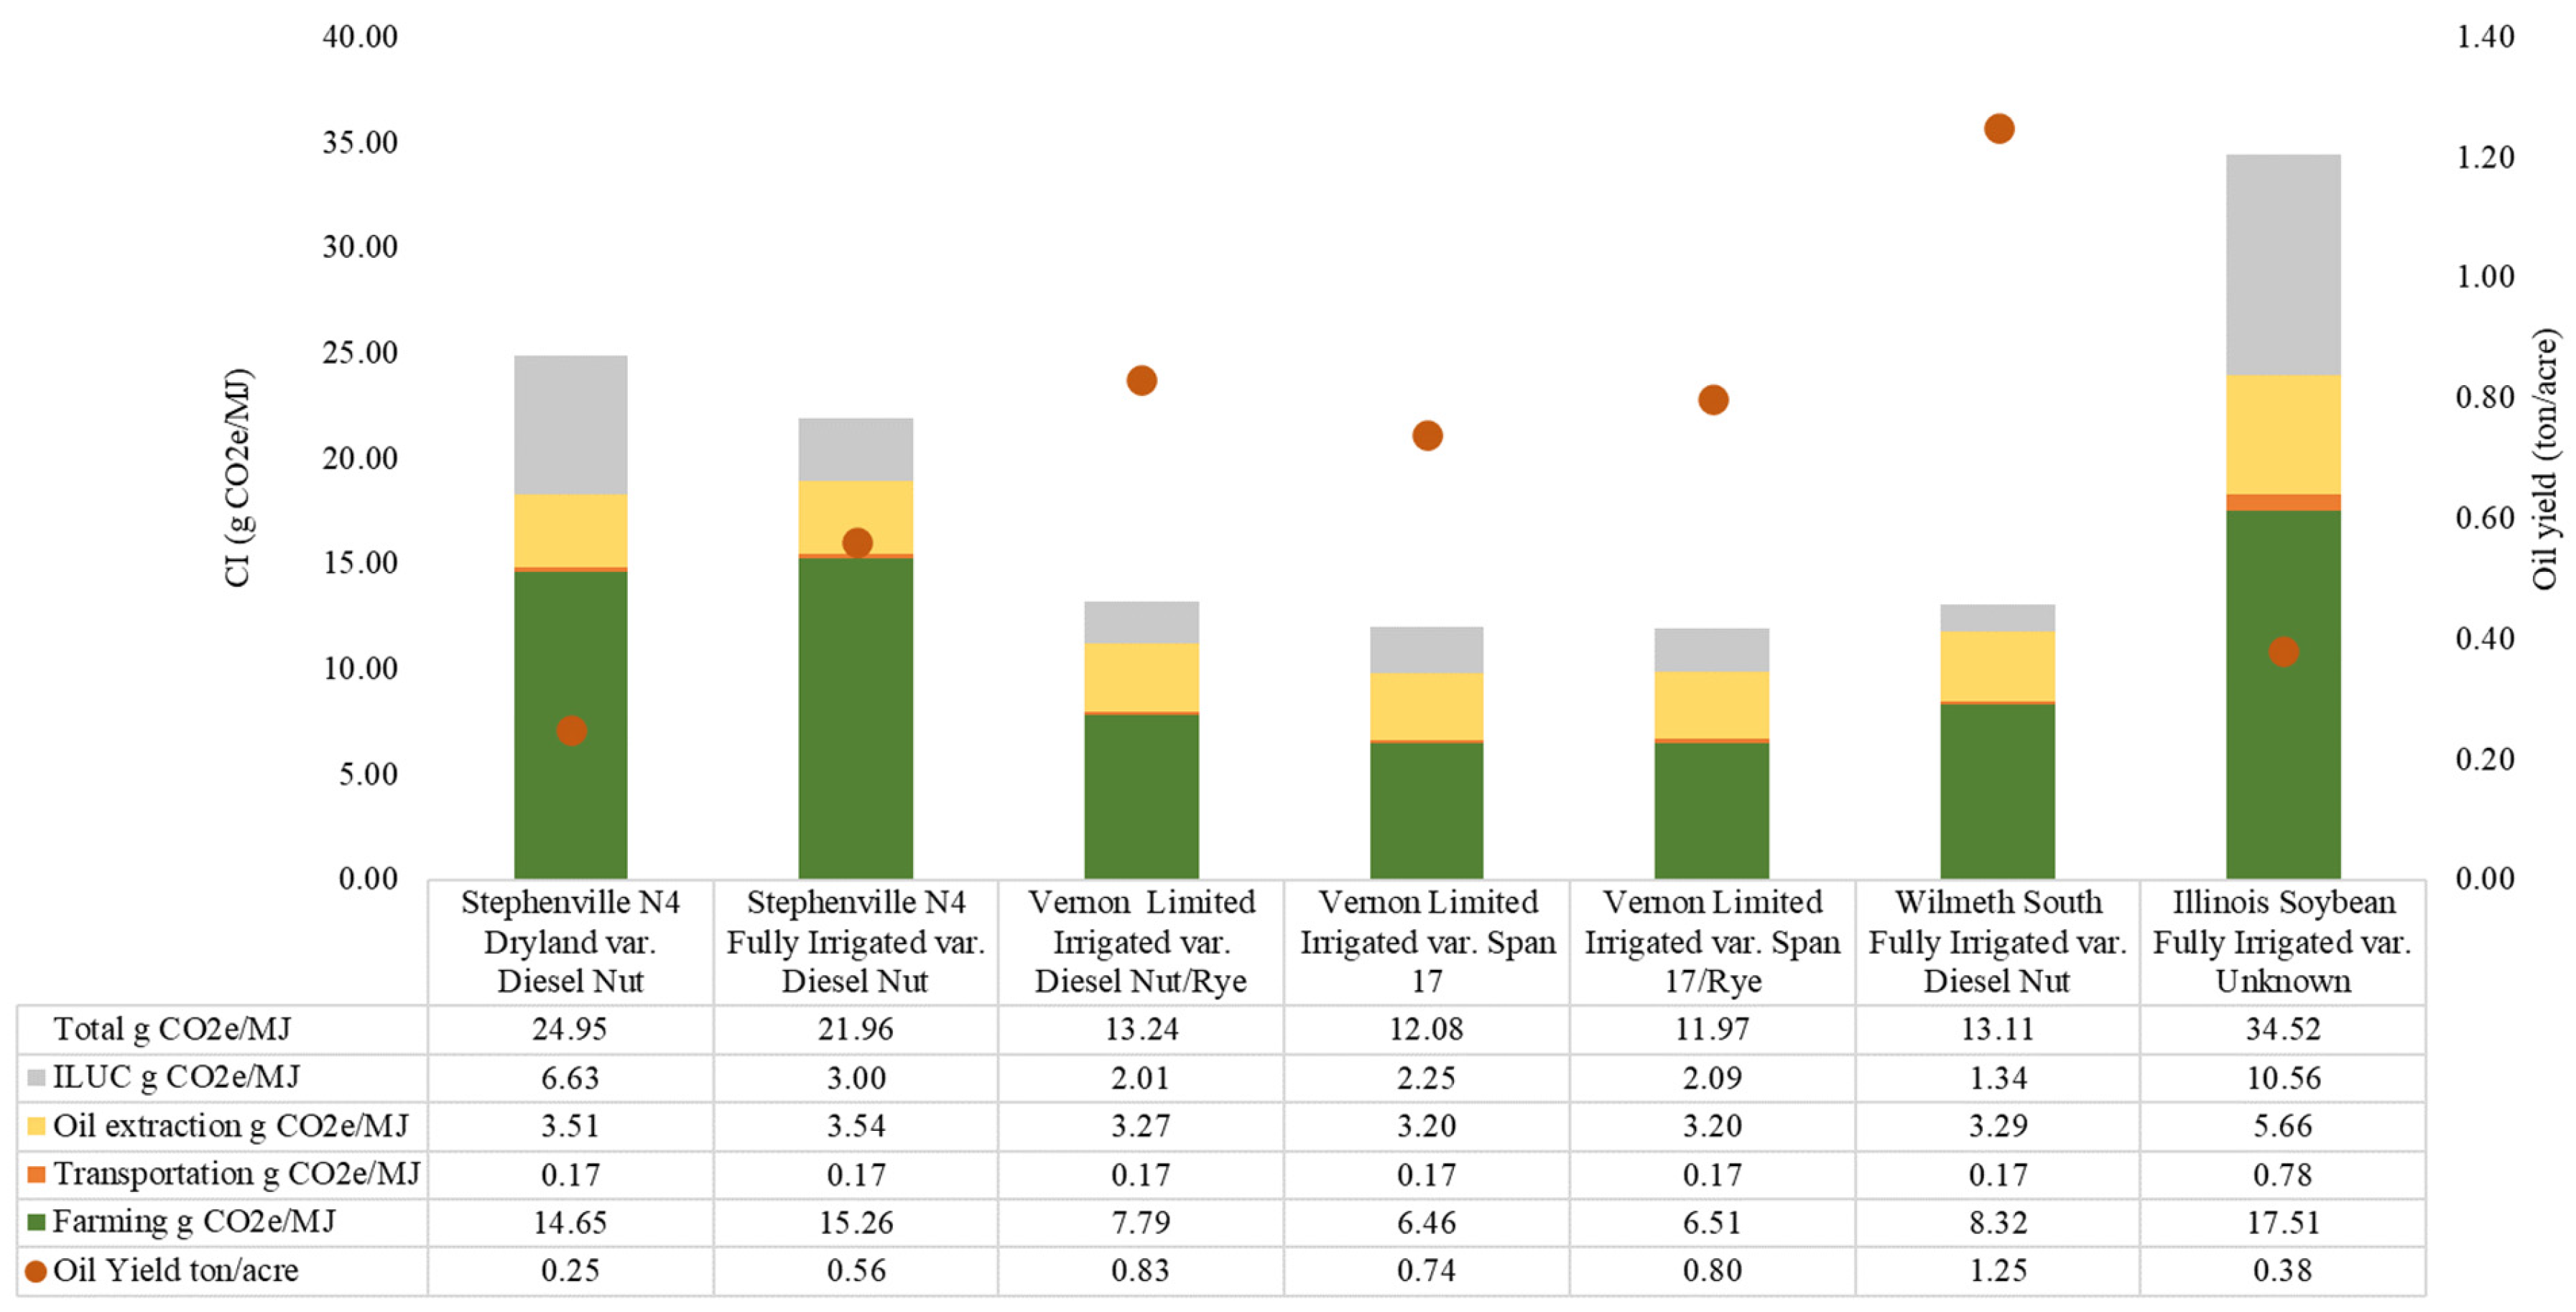
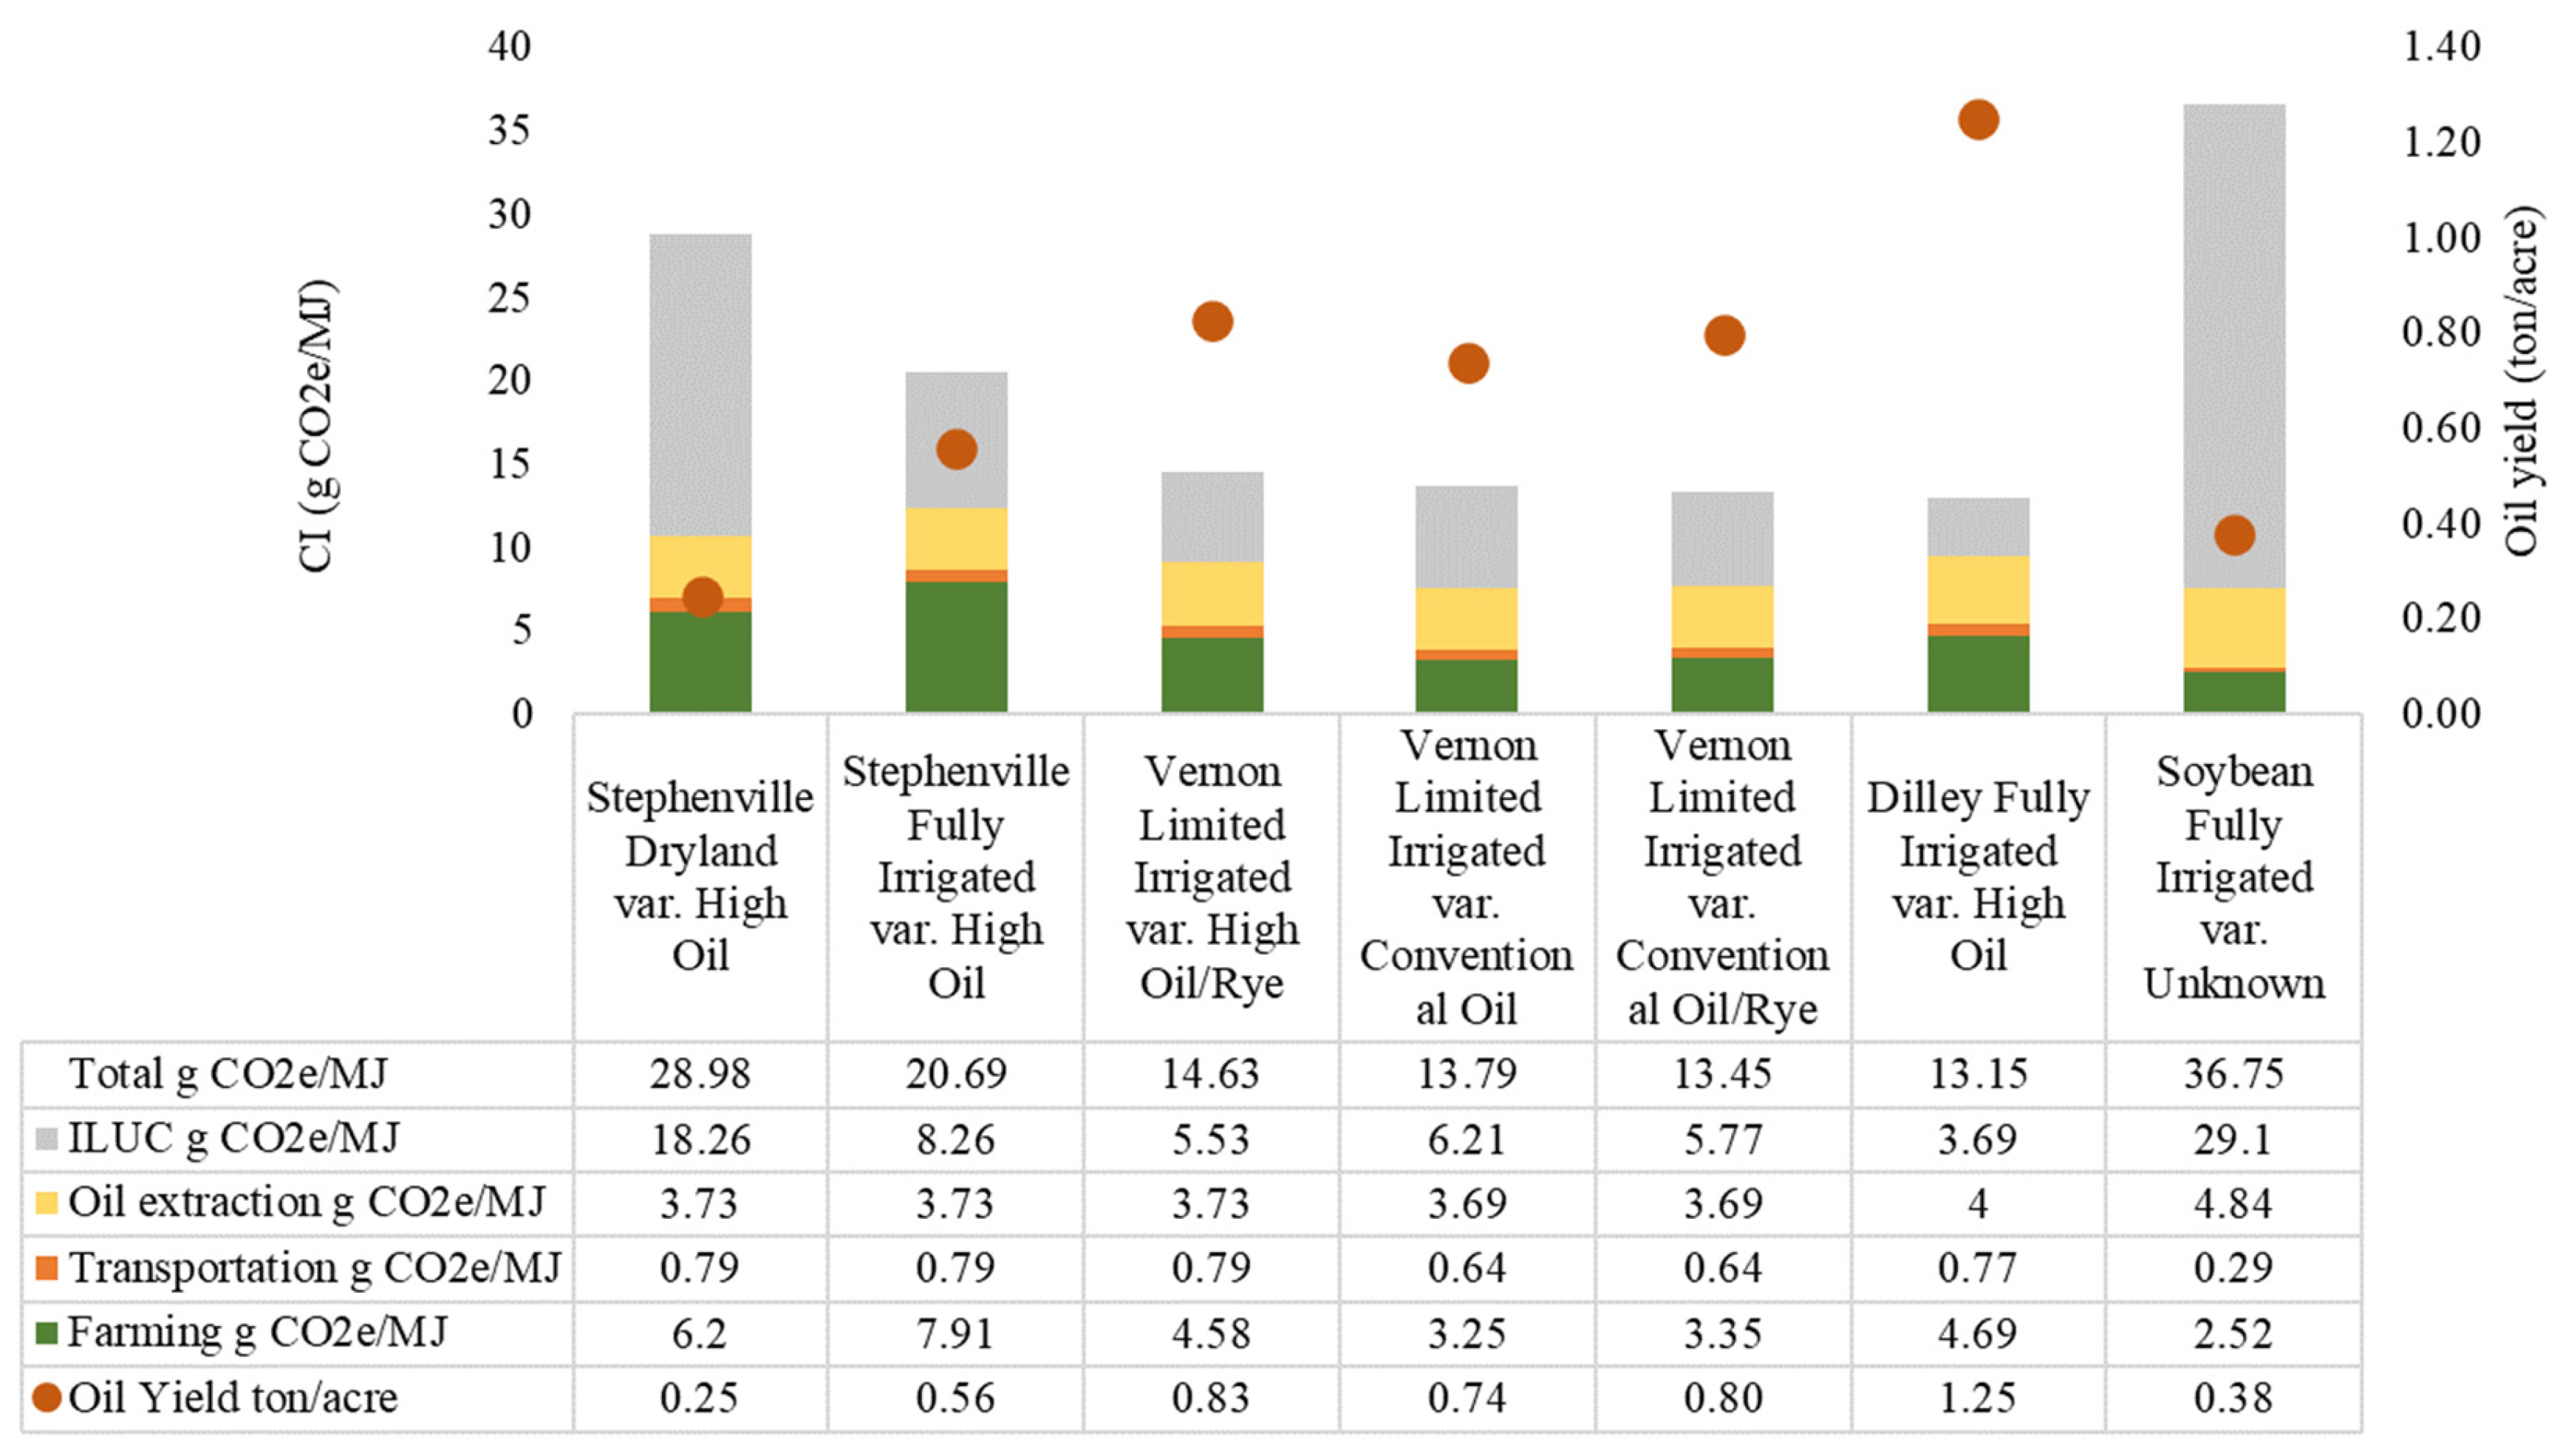
ANL-GREET outputs showed that the highest CI is estimated in the Dryland scenario, but still remains significantly lower than that of soybean. The lowest CI is found in the Vernon Limited Irrigated var. Conventional Oil/Rye scenario (Figure 2). These findings are consistent with previous LCA studies showing that higher yields and improved management practices lead to lower CI due to more efficient use of inputs [20,24].
Figure 2.
Estimated CI for ‘High Oil’ and ‘Conventional Oil’ peanuts based on six production scenarios using ANL-GREET model.
Peanut-specific LCA studies further support the trends observed in this study. A U.S.-based assessment of peanut production in Georgia reported that greenhouse gas emissions are strongly driven by fertilizer use and yield variability, with improved management practices significantly reducing global warming potential [25]. Similarly, international studies indicate that peanut oil systems can achieve relatively lower carbon footprints compared to other oilseeds when efficient production practices are applied, largely due to lower fertilizer-related emissions and favorable yield-based performance [10]. These findings are consistent with the relatively low CI values estimated in this study for Texas peanut systems.
According to a literature survey, the soybean CI of 53 g/MJ CO2Eq is based on the CA-GREET Tier 2 model. The CA-GREET model, a modified version of the ANL-GREET model, reflects California-specific fuel pathways. The total CI value from cradle-to-grave for biodiesel (BD) from soybean is 53.86 g/MJ CO2e, with CI values for farming, BD production, tank-to-wheel (TTW), and ILUC being 10.05, 13.95, 0.76, and 29.1 g/MJ CO2e, respectively [22]. The total CI based on the ANL-GREET model is estimated at 34.52 g/MJ CO2e. excluding processes not included in the production of soy oil (such as soy oil transportation, TTW, BD production, and BD transportation) in CA-GREET reduces the total CI value for soy oil production to 37.7 g/MJ CO2e. The difference between the total CI values for soy oil production from CA-GREET and ANL-GREET is primarily due to ILUC values (29.1 vs. 9.07 g/MJ CO2e). Other differences are attributed to modified fuel specifications and factors in the CA-GREET model. These published values confirm that the CI of peanut oil production estimated in this study remains below that of soybean oil systems under comparable system boundaries.
In addition, comparative LCA studies of vegetable oils show that environmental performance varies depending on system boundaries and regional conditions. For example, Schmidt (2015) reported that peanut oil can exhibit higher impacts than some oilseeds under certain assumptions, particularly due to land and water use, highlighting the importance of yield and management practices in determining CI outcomes. This variability reinforces that the relatively low CI values obtained in this study are primarily driven by favorable production conditions and higher oil yields in Texas.
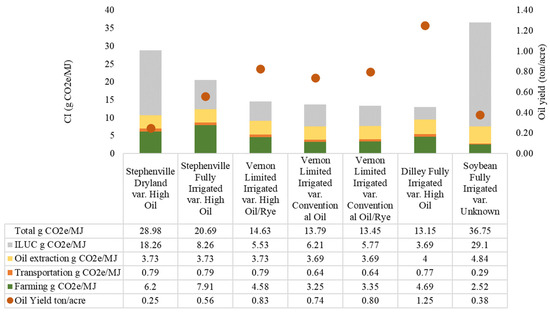
The variation in CI across the six scenarios is mainly driven by differences in oil yield and management practices. The highest and lowest CIs among the six scenarios are for Stephenville Dryland and Dilley, respectively (Figure 3). The High Oil yield at Dilley (1.25 ton/acre) significantly reduces the CI compared to the oil yield at Stephenville Dryland (0.25 ton/acre). This inverse relationship between yield and CI is widely reported in LCA studies of oilseed and bioenergy systems [20,24].
Figure 3.
Estimated CI for ‘High Oil’ and ‘Conventional Oil’ peanuts based on six production scenarios using CA-GREET model.
As noted previously, some differences are attributed to variations in fuel specifications and modeling parameters between the CA-GREET and ANL-GREET models. Although both models are built on the same core framework, they differ in key assumptions that influence CI results.
First, emission factors differ between the two models. ANL-GREET uses U.S. national average emission factors for fuels and energy systems, while CA-GREET incorporates California-specific factors reflecting cleaner fuel standards and regulatory adjustments. For example, the average U.S. electricity grid carbon intensity in ANL-GREET is typically on the order of 400–450 g CO2e/kWh, whereas the California grid used in CA-GREET is significantly lower, approximately 200–250 g CO2e/kWh, due to a higher share of renewables [11,19]. This difference leads to lower CI estimates in CA-GREET for electricity-intensive processes such as irrigation and oil extraction.
Second, the treatment of land use change (LUC) differs substantially. ANL-GREET estimates ILUC using GTAP-based economic modeling, with values such as 9.07 g CO2e/MJ for soybean oil pathways. In contrast, CA-GREET adopts CARB-specific ILUC factors, which are significantly higher; for example, soybean biodiesel pathways include ILUC values of approximately 29.1 g CO2e/MJ [22]. This results in higher overall CI values in CA-GREET when ILUC is included.
Third, electricity grid assumptions further contribute to differences in results. ANL-GREET applies a national average grid mix, while CA-GREET reflects California’s electricity portfolio, which includes a larger proportion of renewable energy sources. As a result, processes relying on electricity generally show lower CI values in CA-GREET compared to ANL-GREET.
Overall, these differences lead to systematic variation in CI outputs between the two models. CA-GREET typically produces lower CI values for energy-related processes due to cleaner electricity and adjusted emission factors, but higher CI contributions from land use change due to more conservative ILUC assumptions. These model-specific differences should be considered when comparing results across regions or policy frameworks [11,19,22].
3.1. Sensitivity Analysis Using ANL-GREET
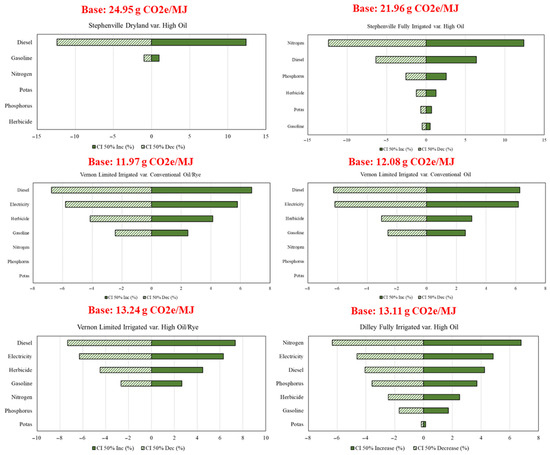
The tornado charts using 50% increase and reduction sensitivity analysis for six scenarios are illustrated in Figure 4. The output CI is most sensitive to the amount of applied nitrogen fertilizer and less sensitive to the amount of applied potash fertilizer for producing ‘High Oil’ in the Dilley Irrigated var. High Oil scenario. In the other scenarios, diesel is the most sensitive parameter.
Figure 4.
Tornado Chart for six scenarios based on a 50% percentage reduction and increase in the inputs (ANL-GREET).
3.2. Sensitivity Analysis Using CA-GREET Tier 2
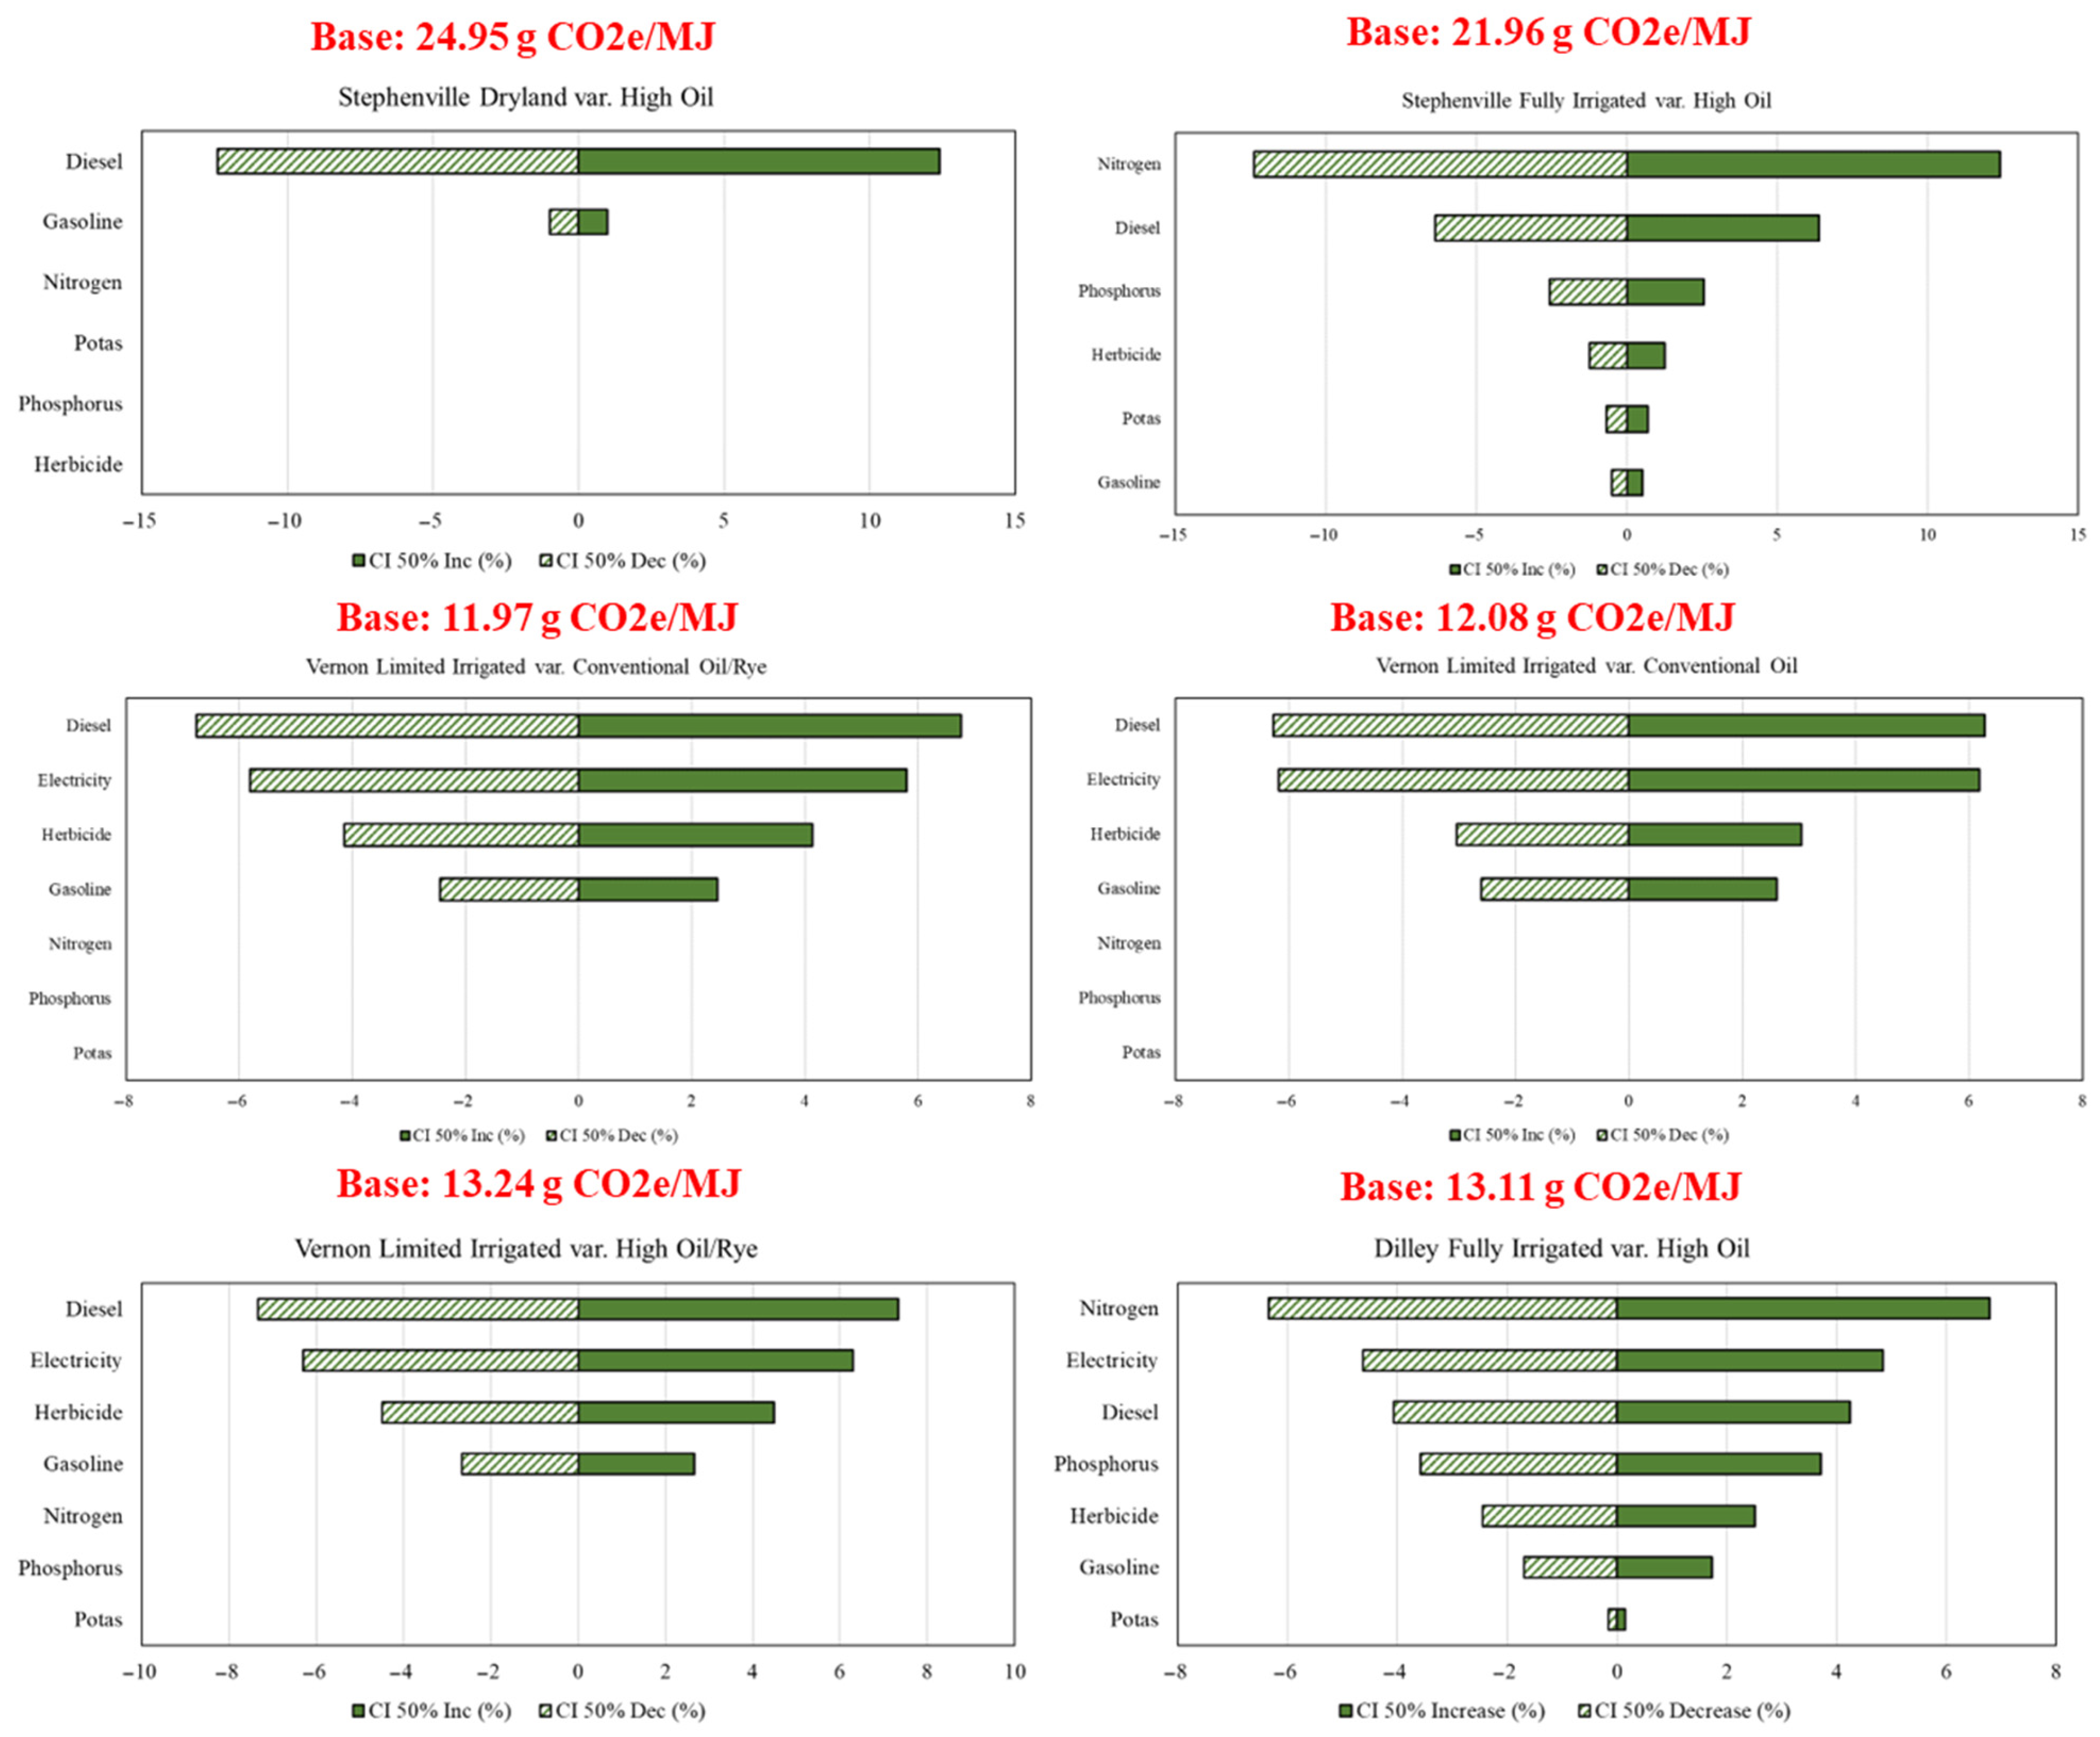
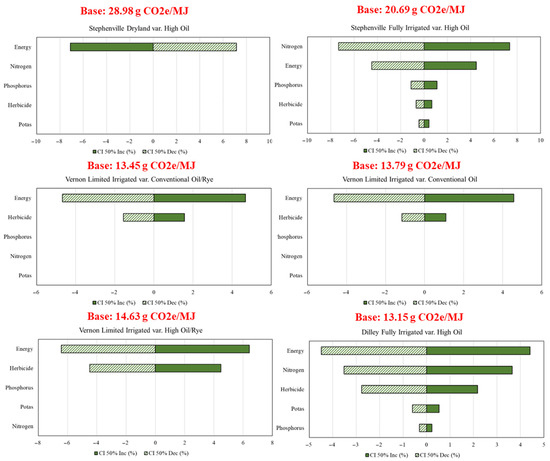
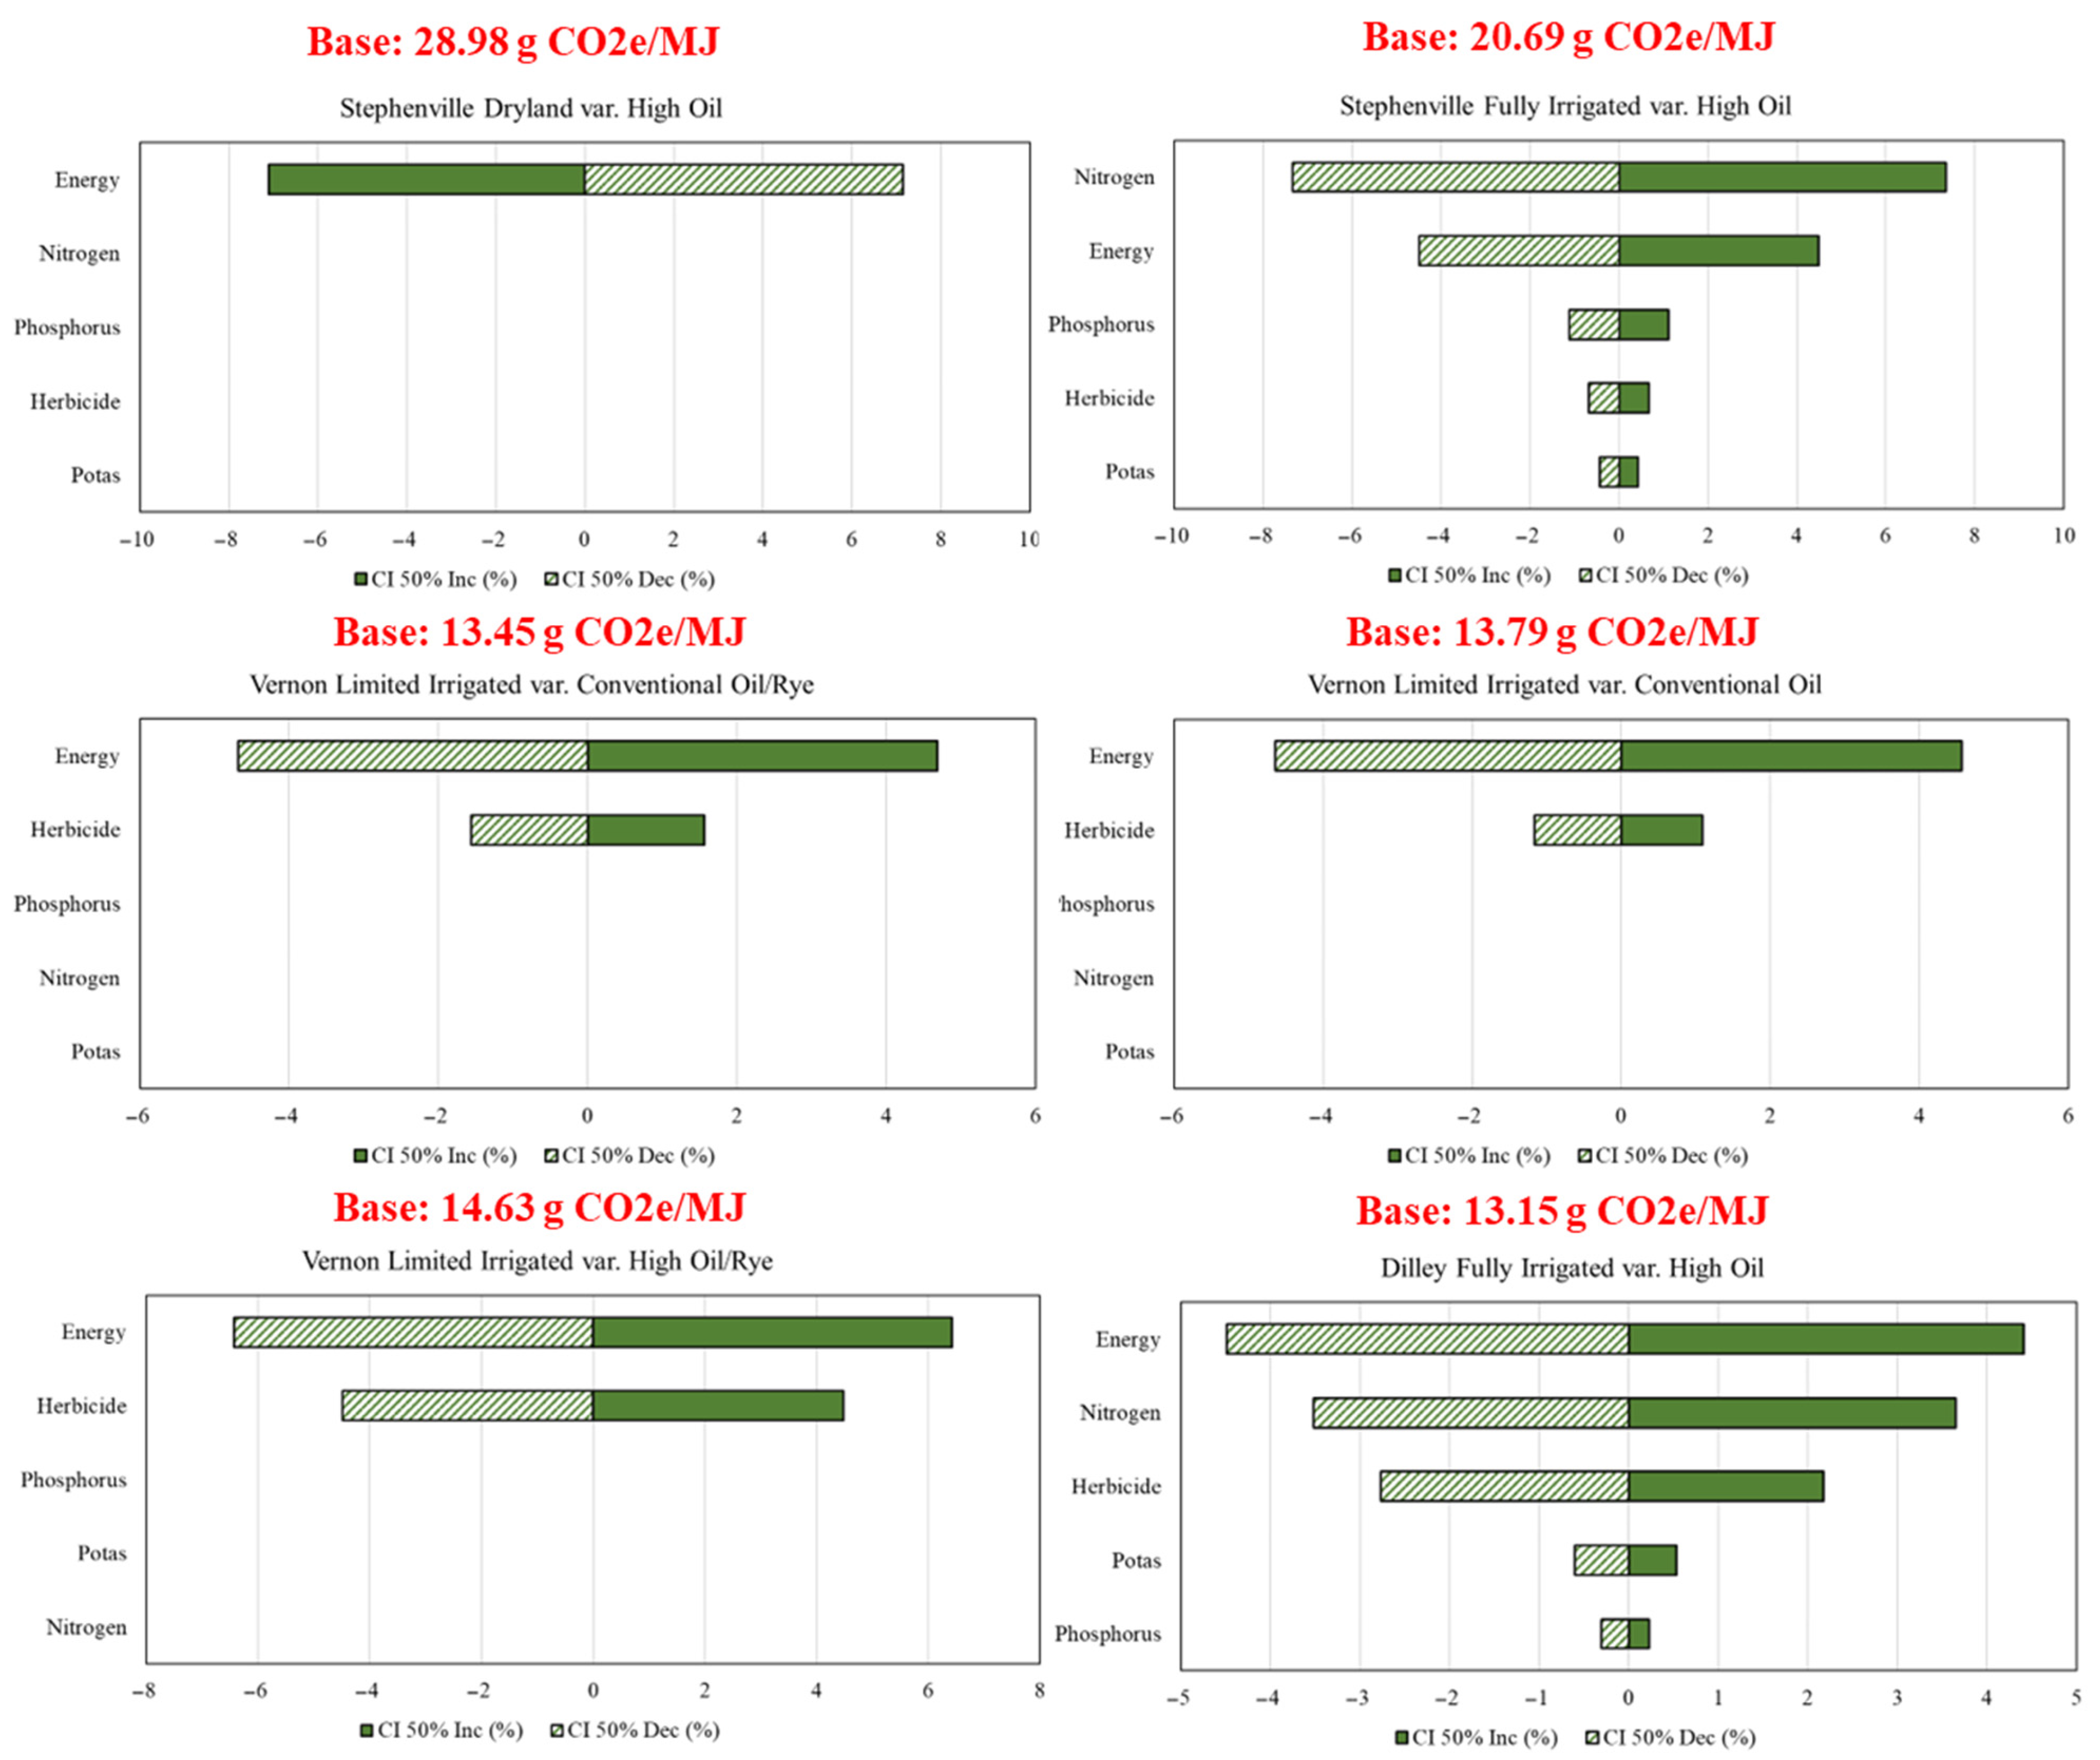
The sensitivity analysis conducted using the CA-GREET Tier 2 model identified the total energy required for farming as the most sensitive parameter in all scenarios except Stephenville Fully Irrigated var. High Oil (Figure 5). In the Dilley Fully Irrigated var. High Oil scenario, the second most sensitive parameter was nitrogen fertilizer. This contrasts with the tornado chart based on the ANL-GREET model, where nitrogen fertilizer was identified as the most sensitive parameter (Figure 4).
Figure 5.
Tornado Chart for six scenarios based on a 50% percentage reduction and increase in the inputs (CA-GREET).
The discrepancy between the outputs of CA-GREET and ANL-GREET can be attributed to differences in emission factors used in these models. Specifically, CA-GREET tends to show lower CI values for farming but higher CI values for land use change. It is important to note that CA-GREET refers to land use change as indirect land use change, while ANL-GREET uses the term induced land use change. Other processes exhibit only minor differences between the two models.
3.3. Contribution Analysis of Carbon Intensity Components
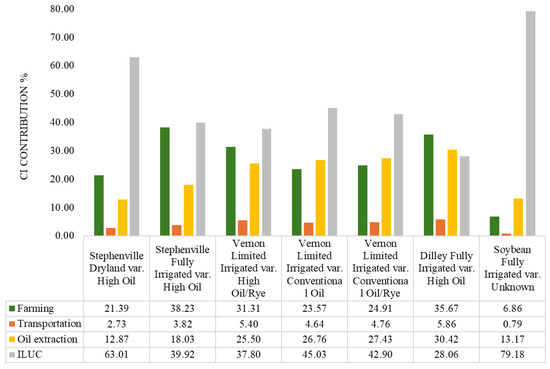
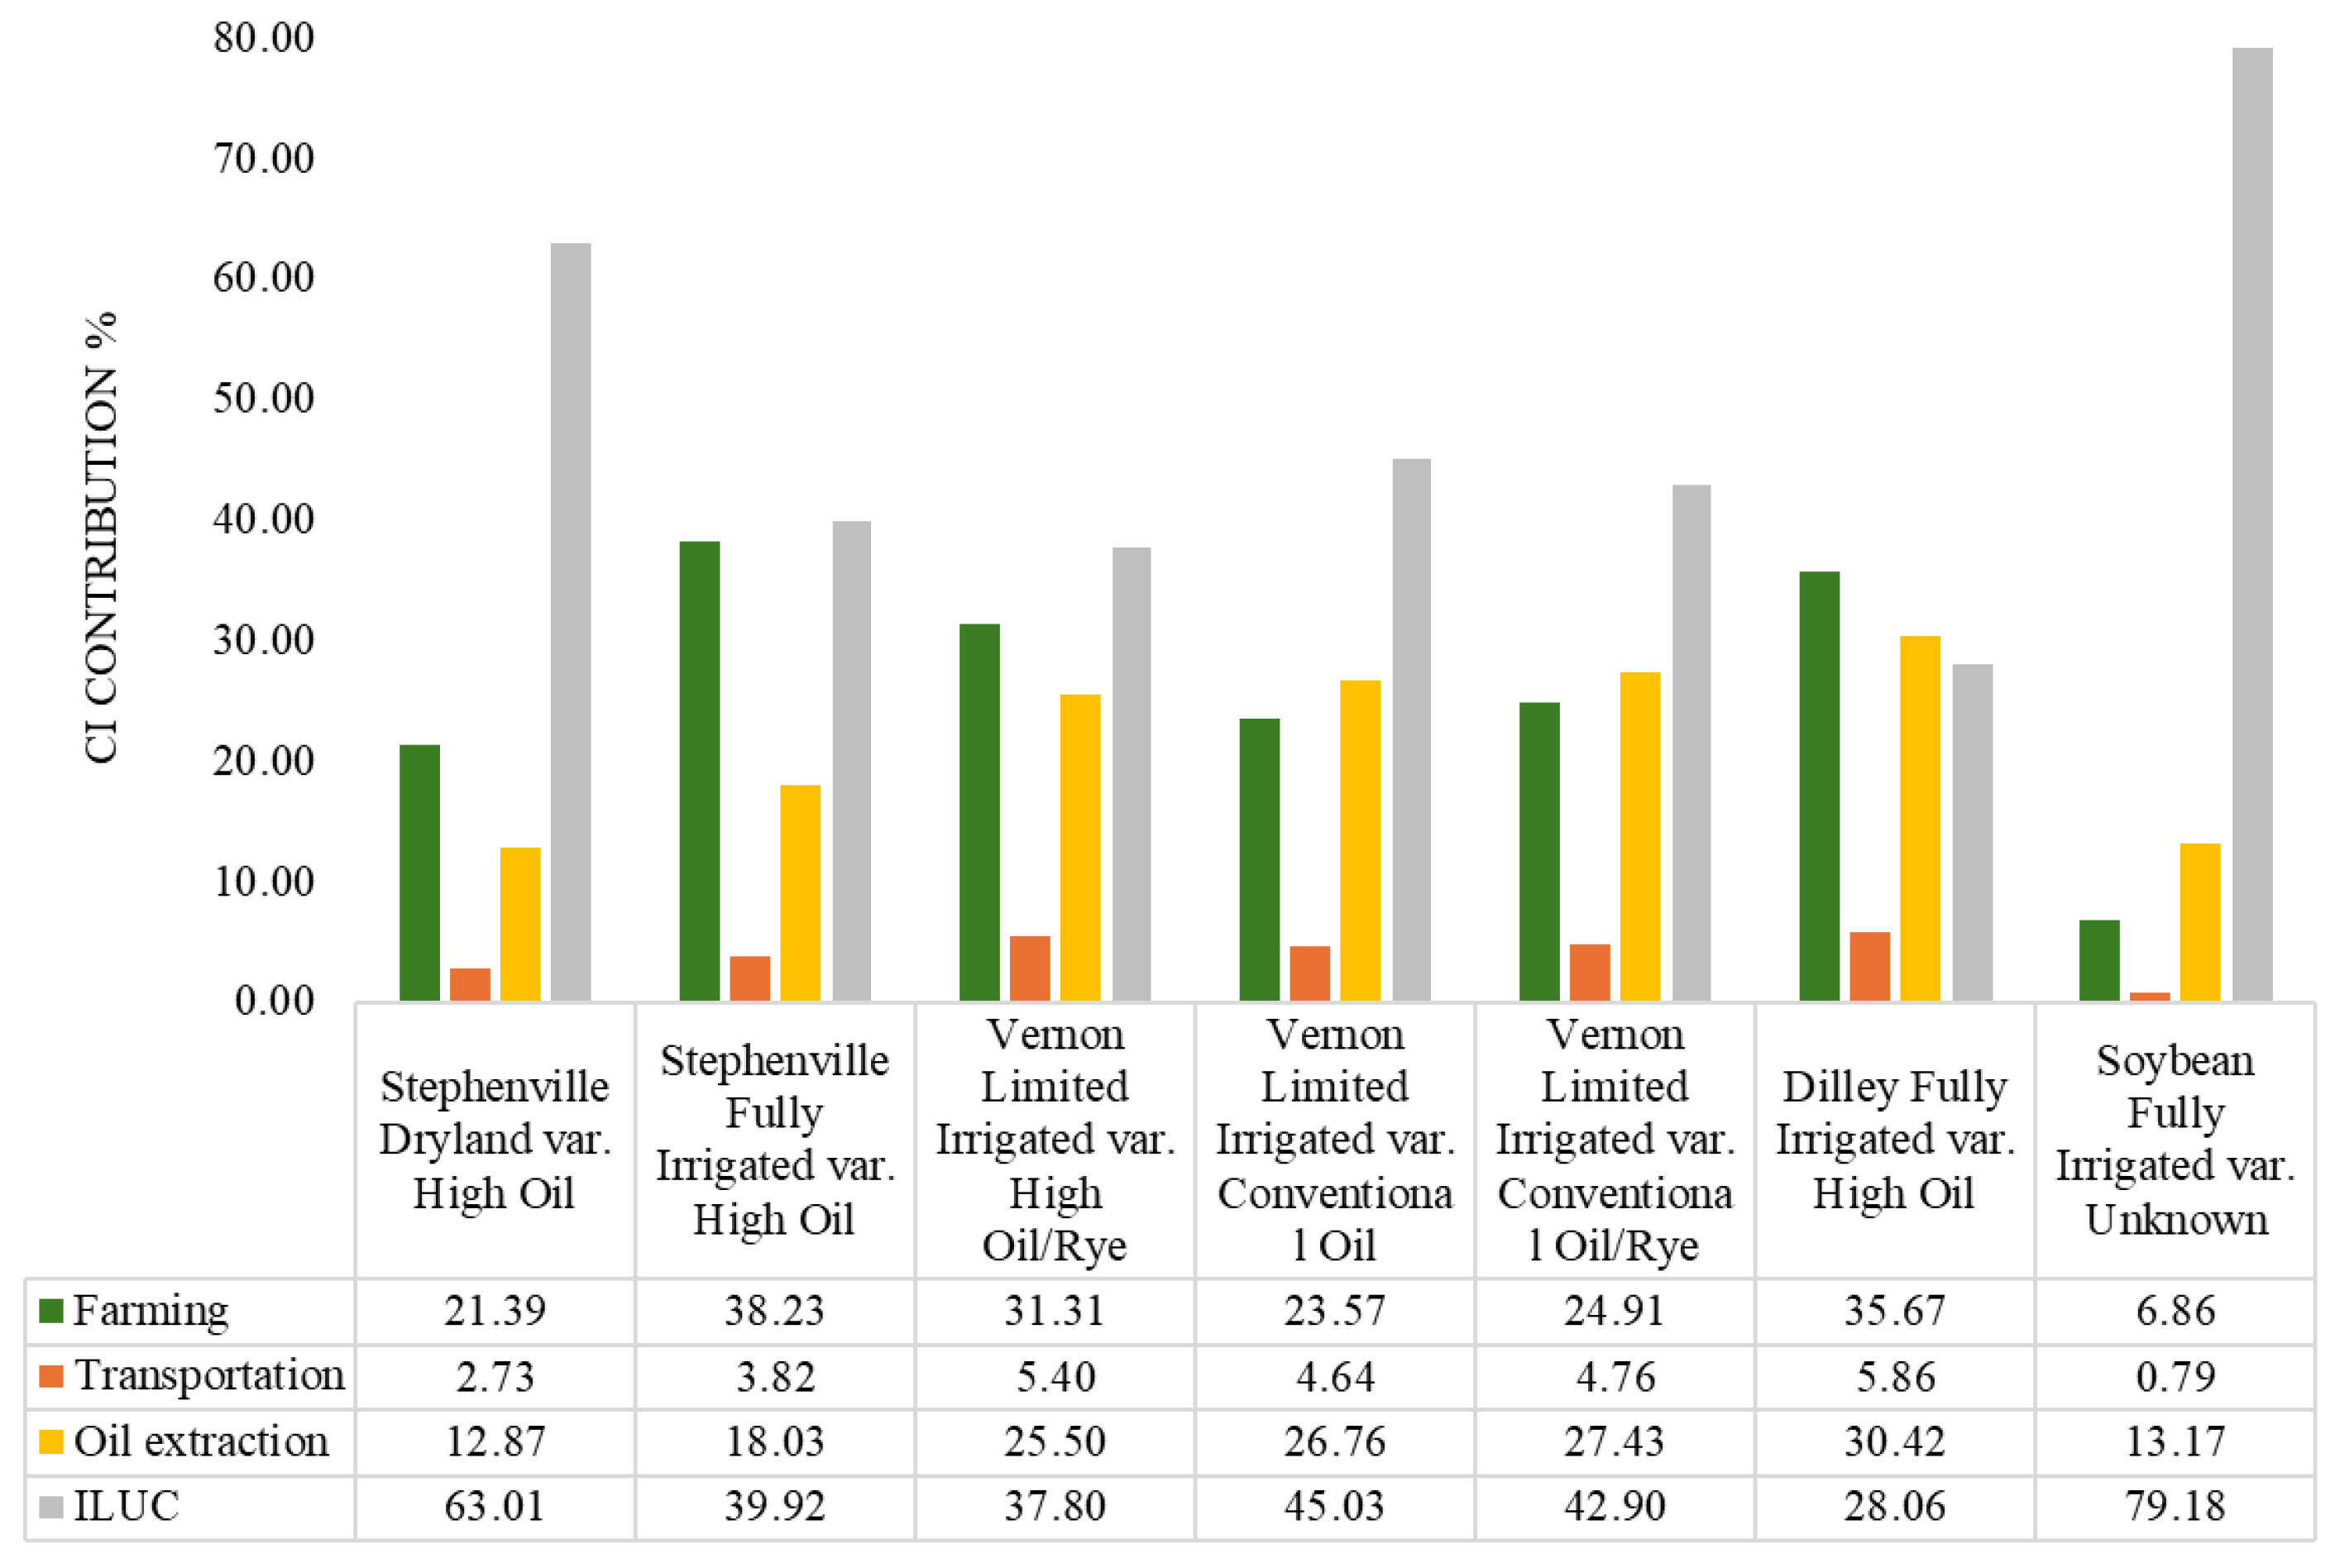
To better understand the drivers of CI across scenarios, a contribution analysis was conducted by disaggregating total CI into four major components: farming, transportation, oil extraction, and ILUC for both CA-GREET and ANL-GREET models. Figure 6 shows the output of the contribution analysis for six scenarios from CA-GREET.
Figure 6.
Contribution analysis for six scenarios (CA-GREET).
Under CA-GREET, ILUC is the dominant contributor across all peanut scenarios, accounting for approximately 28% to 63% of total CI. The highest ILUC contribution is observed in the Stephenville Dryland var. High Oil scenario (63.01%), while the lowest occurs in the Dilley Fully Irrigated var. High Oil scenario (28.06%). In comparison, soybean exhibits an even higher ILUC contribution (79.18%), indicating that land use change assumptions strongly influence total CI in CA-GREET.
Farming is the second-largest contributor, ranging from 21.39% to 38.23%, with higher contributions in irrigated systems due to increased energy demand for irrigation. Oil extraction contributes between 12.87% and 30.42%, becoming more significant in high-yield scenarios where more oil is processed. Transportation remains minimal, contributing only 2.73% to 5.86%, due to short assumed transport distances.
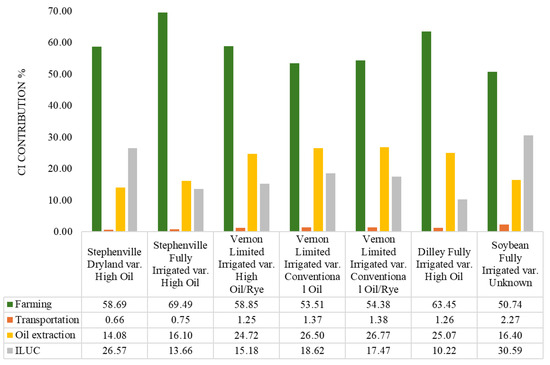
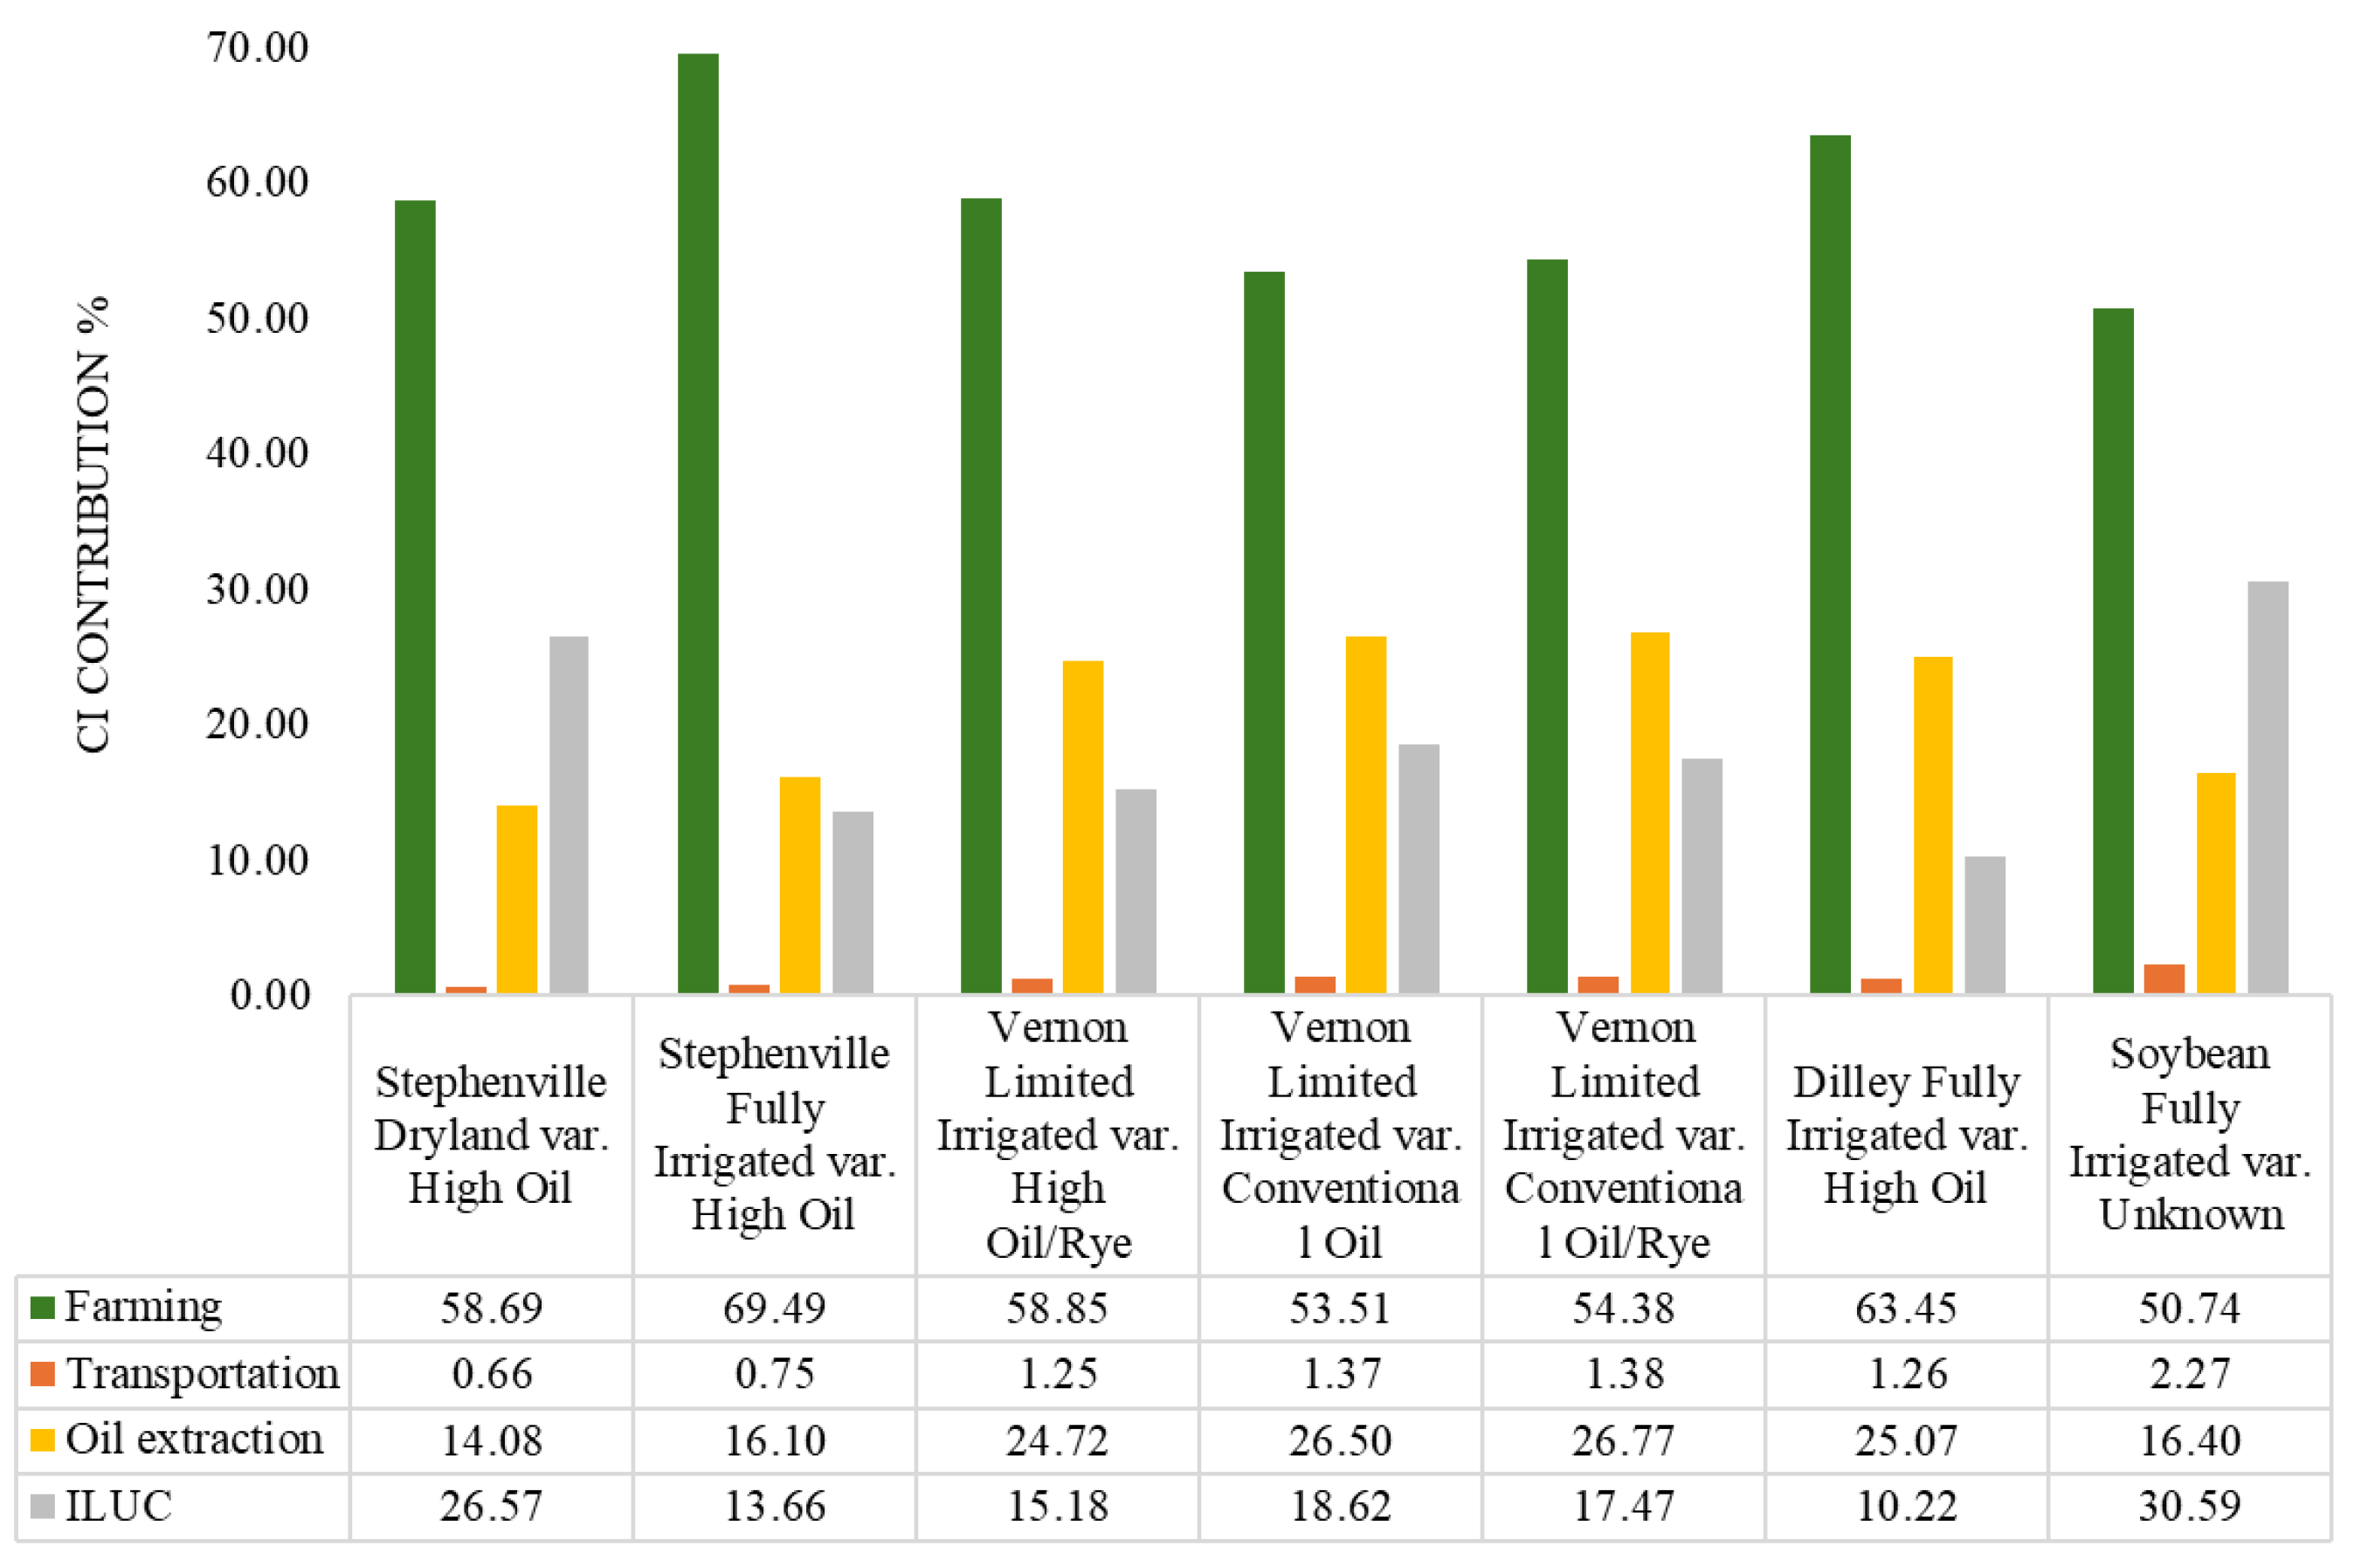
In contrast, ANL-GREET shows a different distribution of contributions. Figure 7 shows the output of the contribution analysis for six scenarios from ANL-GREET. Farming is the dominant contributor, accounting for approximately 53.51% to 69.49% of total CI across peanut scenarios. The highest farming contribution is observed in the Stephenville Fully Irrigated var. High Oil scenario (69.49%), reflecting the significant role of field-level energy use and inputs in this model.
Figure 7.
Contribution analysis for six scenarios (ANL-GREET).
ILUC contributions in ANL-GREET are substantially lower than in CA-GREET, ranging from 10.22% to 26.57%. The lowest ILUC contribution is observed in the Dilley Fully Irrigated var. High Oil scenario (10.22%), while the highest occurs in the Stephenville Dryland scenario (26.57%). Soybean ILUC contribution is higher (30.59%), but still significantly lower than its CA-GREET counterpart, highlighting differences in ILUC modeling assumptions between the two frameworks.
Oil extraction contributes between 14.08% and 26.77%, with relatively consistent importance across scenarios, particularly in Vernon and Dilley systems. Transportation has the smallest contribution, ranging from 0.66% to 1.38% for peanut scenarios and 2.27% for soybean, confirming its negligible impact on total CI.
The comparison between CA-GREET and ANL-GREET clearly shows that the relative importance of CI components is model-dependent. CA-GREET emphasizes ILUC as the primary driver of emissions, whereas ANL-GREET attributes a larger share to farming activities. Despite these differences, both models consistently indicate that transportation has a minimal contribution and that improved yield and management practices reduce overall CI.
These findings highlight that management practices (affecting farming emissions) and land-use assumptions (affecting ILUC) are the two most critical factors influencing CI outcomes, and their relative importance depends on the modeling framework used.
3.4. Practical Implications for Scalability, Economics, and Environmental Tradeoffs
The results of this study provide important insights into the practical feasibility of scaling peanut oil production as a biofuel feedstock in Texas. The relatively low CI values observed, particularly in high-yield scenarios such as Dilley and Vernon, indicate strong potential for expanding peanut-based systems within low-carbon fuel strategies. The availability of High Oil peanut varieties further enhances this potential by increasing oil yield per unit area, thereby improving resource-use efficiency and reducing CI per unit of output. However, large-scale deployment will depend on regional suitability, infrastructure availability, and the ability to integrate peanut production into existing agricultural systems without disrupting food supply chains.
From an economic perspective, the viability of large-scale peanut-based biofuel production is influenced by several factors, including production costs, input prices, and market dynamics. Peanut production systems benefit from relatively lower nitrogen fertilizer requirements due to biological nitrogen fixation, which can reduce input costs compared to other oilseed crops. However, irrigation energy, fuel use, and potential fluctuations in commodity prices may affect profitability. Additionally, increased demand for peanuts as a biofuel feedstock could create competition with existing food and feed markets, potentially influencing prices and land allocation decisions. The adoption of High Oil varieties may help offset some of these challenges by increasing oil output without proportionally increasing input costs.
Environmental tradeoffs are also a critical consideration, particularly in semi-arid regions of Texas where water availability is limited. While irrigation can significantly increase yields and reduce CI per unit of oil produced, it also increases water demand and energy consumption for pumping. In regions such as Dilley, where high yields are achieved under full irrigation, the sustainability of groundwater use must be carefully evaluated. Over-reliance on irrigation could exacerbate aquifer depletion and increase indirect emissions associated with energy use; therefore improving irrigation efficiency, adopting conservation tillage and cover cropping practices, and prioritizing production in regions with favorable rainfall patterns are essential strategies for minimizing environmental impacts.
Overall, the findings suggest that peanut-based biofuel production in Texas is promising but must be approached with a balanced consideration of scalability, economic viability, and environmental sustainability. Strategic management practices and region-specific planning will be key to maximizing benefits while minimizing potential tradeoffs.
3.5. Comparison with Other Oilseed Feedstocks
To further contextualize the CI results of peanut oil systems, comparisons with other high-oil-content feedstocks such as rapeseed (canola) and sunflower are essential. Reported LCA studies indicate that CI values for vegetable oil-based biofuels vary widely depending on system boundaries and inclusion of LUC. For example, soybean oil-based biodiesel has been reported at approximately 34.5 g CO2e/MJ using the ANL-GREET model and up to 53.9 g CO2e/MJ when including indirect land use change in CA-GREET [20,22].
Rapeseed (canola) biodiesel typically exhibits CI values in the range of 40–60 g CO2e/MJ when ILUC is included, with farming emissions, particularly nitrogen fertilizer use, being a dominant contributor [20,26,27]. Although rapeseed has a relatively high oil content (≈40–46%), its higher nitrogen fertilizer demand increases nitrous oxide (N2O) emissions, which significantly contributes to its overall CI.
Sunflower oil systems show comparable or slightly lower CI values, generally ranging between 35 and 55 g CO2e/MJ depending on irrigation intensity, yield, and regional practices [26,27]. Similar to rapeseed, sunflower production can involve substantial fertilizer and water inputs, which influence its environmental performance.
In contrast, peanut production benefits from biological nitrogen fixation, reducing the need for synthetic nitrogen fertilizers, one of the largest contributors to agricultural greenhouse gas emissions. U.S.-based studies report that peanut production emissions can be as low as 0.6 kg CO2e/kg of peanuts (15.77 g/MJ CO2e with energy density of 38.05 MJ/kg for peanut) under improved management practices [4,5]. Furthermore, the higher oil content of ‘High Oil’ peanut varieties (up to 58–60%) enhances oil yield efficiency, which directly lowers CI per unit of oil produced.
Overall, while CI values for oilseed-based systems are highly sensitive to assumptions regarding yield, fertilizer use, and LUC, the results of this study indicate that peanut oil systems, particularly under high-yield and efficient management conditions, can achieve CI values that are competitive with or lower than those of soybean, rapeseed, and sunflower systems. These findings further support the potential of peanut oil as a viable and sustainable feedstock for biofuel production.
4. Conclusions
The ‘High Oil’ variety, with its higher oil content and lower water demand, demonstrated lower CI values in the scenarios studied. These advantages make ‘High Oil’ a viable option for biofuel production. The most crucial factor influencing CI is oil yield (ton/acre); higher oil yields result in reduced requirements for fertilizers, herbicides, and energy, thereby lowering the CI. The CA-GREET model indicated that among the six scenarios, Stephenville Dryland had the highest CI, while Dilley had the lowest. The High Oil yield at Dilley (1.25 ton/acre) significantly reduces CI compared to the oil yield at Stephenville Dryland (0.25 ton/acre).
The following limitations/challenges exist in the current phase of this research, but they will be addressed in the next stages. For example, currently, there is insufficient detailed inventory data, particularly for peanut transportation and oil extraction processes. Input data for peanut oil extraction is not yet available; therefore, some literature data for canola, which has a similar oil content to peanut, was used. Introducing ‘High Oil’ to the GTAP Model database is very data-intensive and requires more time and effort. The CI of ILUC was estimated based on the ratio of oil content and potential cultivated land for ‘High Oil’ and soybean. It is assumed that the distance from farms to oil extraction facilities is within a 30-mile radius, as per the default value in the GREET model. To find the best-fit statistical distribution for each input, longer time series data are required. Due to insufficient data, a 50% percentile approach was used for sensitivity analysis. Zero values for some inputs (e.g., applied fertilizers in certain scenarios) posed challenges for sensitivity analysis. The Dilley Irrigated var. ‘Diesel Nut’ scenario did not have zero values, allowing for a complete tornado chart to be created only for this scenario. It is assumed that drying can be done by leaving the peanuts on the ground and harvesting after drying. Shelling can be done simultaneously with harvesting [12]. Thus, no carbon intensity is attributed to the drying and shelling processes as these operations are assumed to occur in-field without requiring additional energy inputs. Peanuts are assumed to be dried on the ground prior to harvesting, with shelling performed simultaneously during the harvesting process. Harvesting involves soil disturbance, but the associated GHG emissions are not accounted for due to the limitations of the GREET model. These limitations and challenges will be addressed in the next phase of this research. For example, as we make progress, we will refine and dig deeper to find more data.
Future work will focus on collecting peanut-specific data for transportation and oil extraction, refining the GTAP model for ‘High Oil’ varieties, and improving uncertainty analysis with longer-term datasets. These efforts will allow more accurate estimation of carbon intensity and inclusion of currently simplified or excluded processes, such as soil disturbance during harvesting and drying/shelling operations.
Author Contributions
Conceptualization, M.H.B., M.N.M., L.A.R. and J.M.C.; methodology, M.H.B., M.N.M., L.A.R. and J.M.C.; software, M.H.B., M.N.M., L.A.R. and J.M.C.; validation, M.H.B., M.N.M., L.A.R. and J.M.C.; formal analysis, M.H.B., M.N.M., L.A.R. and J.M.C.; investigation, M.H.B., M.N.M., L.A.R. and J.M.C.; resources, M.H.B., M.N.M., L.A.R. and J.M.C.; data curation, M.H.B., M.N.M., L.A.R. and J.M.C.; writing—original draft preparation, M.H.B. and M.N.M.; writing—review and editing, M.H.B., M.N.M., L.A.R. and J.M.C.; visualization, M.H.B. and M.N.M.; supervision, M.N.M., L.A.R. and J.M.C.; project administration, M.N.M., L.A.R. and J.M.C.; funding acquisition, M.H.B., M.N.M., L.A.R. and J.M.C. All authors have read and agreed to the published version of the manuscript.
Funding
This work was supported by Chevron U.S.A. Inc. under award number M2202342.
Data Availability Statement
The data that support the findings of this study are available on request from the corresponding author.
Acknowledgments
We would like to express our sincere gratitude to Chevron U.S.A. Inc. for their generous funding and support, which made this research possible. This work was supported by Chevron U.S.A. Inc. under award number M2202342. We also extend our thanks to all the individuals and institutions who contributed to the completion of this study. The funders had no role in the data collection, analysis, or publication of this study.
Conflicts of Interest
The authors declare that they have no conflicts of interest.
References
- Environmental Protection Agency. Renewable Fuel Standard (RFS) Program: RFS2 Program Amendments. 2010. Available online: https://www.epa.gov/renewable-fuel-standard-program/renewable-fuel-standard-rfs2-program-amendments-2010 (accessed on 23 May 2024).
- Chen, R.; Qin, Z.; Han, J.; Wang, M.; Taheripour, F.; Tyner, W.; O’Connor, D.; Duffield, J. Life Cycle Energy and Greenhouse Gas Emission Effects of Biodiesel in the United States with Induced Land Use Change Impacts. Bioresour. Technol. 2018, 251, 249–258. [Google Scholar] [CrossRef] [PubMed]
- Xu, H.; Ou, L.; Li, Y.; Hawkins, T.R.; Wang, M. Life Cycle Greenhouse Gas Emissions of Biodiesel and Renewable Diesel Production in the United States. Environ. Sci. Technol. 2022, 56, 7512–7521. [Google Scholar] [CrossRef] [PubMed]
- McCarty, J.A.; Sandefur, H.N.; Matlock, M.; Thoma, G.; Kim, D. Life Cycle Assessment of Greenhouse Gas Emissions Associated with Production and Consumption of Peanut Butter in the U.S. Trans. ASABE 2014, 57, 1741–1750. [Google Scholar] [CrossRef]
- McCarty, J.A.; Ramsey, S.; Sandefur, H.N. A Historical Analysis of the Environmental Footprint of Peanut Production in the United States from 1980 to 2014. Peanut Sci. 2016, 43, 157–167. [Google Scholar] [CrossRef]
- Prabhu, A. Staff Report: Calculating Carbon Intensity Values from Indirect Land Use Change of Crop-Based Biofuels. 2015. Available online: https://ww2.arb.ca.gov/sites/default/files/classic/fuels/lcfs/peerreview/050515staffreport_iluc.pdf (accessed on 24 May 2024).
- Sanchez, S.T.; Woods, J.; Akhurst, M.; Brander, M.; O’Hare, M.; Dawson, T.P.; Edwards, R.; Liska, A.J.; Malpas, R. Accounting for indirect land-use change in the life cycle assessment of biofuel supply chains. J. R. Soc. Interface 2012, 9, 1105–1119. [Google Scholar] [CrossRef] [PubMed]
- ICAO. Environment: Sustainable Aviation Fuels Life Cycle. 2023. Available online: www.icao.int/environmental-protection/pages/SAF_LifeCycle.aspx (accessed on 1 August 2023).
- Spawn, S.A.; Lark, T.J.; Gibbs, H.K. Carbon emissions from cropland expansion in the United States. Environ. Res. Lett. 2021, 14, 045009. [Google Scholar] [CrossRef]
- Zhao, X.; Taheripour, F.; Malina, R.; Staples, M.D.; Tyner, W.E. Estimating induced land use change emissions for sustainable aviation biofuel pathways. Sci. Total. Environ. 2021, 779, 146238. [Google Scholar] [CrossRef] [PubMed]
- Wang, M.; Elgowainy, A.; Lu, Z.; Baek, K.H.; Balchandani, S.; Benavides, P.T.; Burnham, A.; Cai, H.; Chen, P.; Gan, Y.; et al. Greenhouse Gases, Regulated Emissions, and Energy use in Technologies Model ® (2023 .Net). [Computer Software]. 9 October 2023. Available online: https://greet.anl.gov/files/h3k81jas (accessed on 19 March 2026).
- Butts, C.L.; Sorensen, R.B.; Nuti, R.C. Performance of Equipment for in-field shelling of peanut for biodiesel production. Trans. ASABE 2009, 52, 1461–1470. [Google Scholar] [CrossRef]
- Willems, A.B.; Augustenborg, C.A.; Hepp, S.; Lanigan, G.; Hochstrasser, T.; Kammann, C.; Müller, C. Carbon dioxide emissions from spring plowing of grassland in Ireland. Agric. Ecosyst. Environ. 2011, 144, 347–351. [Google Scholar] [CrossRef]
- Li, C. Modeling trace gas emissions from agricultural ecosystems. Nutr. Cycl. Agroecosystems 2000, 58, 259–276. [Google Scholar] [CrossRef]
- Li, C.; Frolking, S.; Frolking, T.A. A model of nitrous oxide evolution from soil driven by rainfall events: 1. Model structure and sensitivity. J. Geophys. Res. Atmos. 1992, 97, 9759–9776. [Google Scholar] [CrossRef]
- Parton, W.J.; Hartman, M.; Ojima, D.; Schimel, D. DAYCENT and its land surface submodel: Description and testing. Glob. Planet. Change 1998, 19, 35–48. [Google Scholar] [CrossRef]
- Del Grosso, S.J.; Parton, W.J.; Mosier, A.R.; Walsh, M.K.; Ojima, D.S.; Thornton, P.E. DAYCENT national-scale simulations of nitrous oxide emissions from cropped soils in the United States. J. Environ. Qual. 2005, 35, 1451–1460. [Google Scholar] [CrossRef] [PubMed]
- Life Cycle Associates, LLC. CA-GREET Life Cycle Model. 2024. Available online: https://www.lifecycleassociates.com/lca-tools/ca_greet/ (accessed on 23 May 2024).
- California Air Resources Board. LCFS Life Cycle Analysis Models and Documentation. 2019. Available online: https://ww2.arb.ca.gov/resources/documents/lcfs-life-cycle-analysis-models-and-documentation (accessed on 1 January 2025).
- Wang, M.; Han, J.; Dunn, J.B.; Cai, H.; Elgowainy, A. Well-to-wheels energy use and greenhouse gas emissions of ethanol from corn, sugarcane and cellulosic biomass for US use. Environ. Res. Lett. 2012, 7, 045905. [Google Scholar] [CrossRef]
- Gunstone, F.D. Vegetable Oils in Food Technology: Composition, Properties and Uses, 2nd ed.; Wiley-Blackwell: Hoboken, NJ, USA, 2011. [Google Scholar]
- S&T Consultants Inc. Carb LCFS Tier 2 Fuel Pathway Report. Soybean Oil Renewable Diesel. 2016. Available online: https://ww2.arb.ca.gov/sites/default/files/classic/fuels/lcfs/fuelpathways/comments/tier2/dgd-soy-rd-rpt-030917.pdf (accessed on 1 October 2024).
- Metropolis, N.; Ulam, S. The Monte Carlo Method. J. Am. Stat. Assoc. 1949, 44, 335–341. [Google Scholar] [CrossRef] [PubMed]
- Dunn, J.B.; Mueller, S.; Kwon, H.-Y.; Wang, M.Q. Land-use change and greenhouse gas emissions from corn and cellulosic ethanol. Biotechnol. Biofuels 2013, 6, 51. [Google Scholar] [CrossRef] [PubMed]
- Alhashim, R.; Anandhi, A. Global warming and toxicity impacts: Peanuts in Georgia, USA using life cycle assessment. Sustainability 2022, 14, 3671. [Google Scholar] [CrossRef]
- Malça, J.; Freire, F. Life-cycle studies of biodiesel in Europe: A review addressing the variability of results and modeling issues. Renew. Sustain. Energy Rev. 2011, 15, 338–351. [Google Scholar] [CrossRef]
- Schmidt, J.H. Life cycle assessment of five vegetable oils. J. Clean. Prod. 2015, 87, 130–138. [Google Scholar] [CrossRef]

Disclaimer/Publisher’s Note: The statements, opinions and data contained in all publications are solely those of the individual author(s) and contributor(s) and not of MDPI and/or the editor(s). MDPI and/or the editor(s) disclaim responsibility for any injury to people or property resulting from any ideas, methods, instructions or products referred to in the content. |
© 2026 by the authors. Licensee MDPI, Basel, Switzerland. This article is an open access article distributed under the terms and conditions of the Creative Commons Attribution (CC BY) license.