


Abstract
Unmanned Aerial Vehicle (UAV) imagery has become an important tool for erosion monitoring, but little is known about its application in Mediterranean agricultural systems such as vineyards and olive groves. In this study, drone flights were conducted in vineyards and olive groves where mulch and biochar treatments had been applied. Digital terrain models (DTMs) and orthomosaics were constructed using a photogrammetry workflow, and model error was determined via global positioning system (GPS) transects. Erosion was assessed using Digital elevation models of Difference (DoD) and compared with field-based erosion plot measurements. Explanatory variables for erosion (soil roughness, slope length, steepness, vegetation cover) were derived from DTMs and orthomosaics and were evaluated in a multiple linear regression model. Although direct measurement of erosion from the DoDs was difficult, this was primarily influenced by the unexpectedly low erosion rates during the study period, and the high root mean square error (RMSE) of the DTMs. Significant differences in DTM-derived variables were found between study areas, and especially between areas with organic and integrated management, even though treatments showed similar patterns. The multiple linear regression model demonstrated strong explanatory power, accounting for a large part of the variation in measured erosion using the UAV-derived variables (R2 = 0.81). Slope and slope length were the most important predictors of erosion together with the interaction between these two variables. The results suggest that soil erosion in the study areas was mostly determined by topographic and management factors, rather than the applied treatments. This study highlights the value of UAV imagery in advancing the understanding of erosion processes in Mediterranean agricultural systems, while also identifying the challenge of accurately measuring erosion from DoDs under conditions of low erosion rates.
1. Introduction
The Mediterranean region stands out as one of Europe’s areas most sensitive to land degradation in [1,2], due to its distinctive arid climate, land abandonment, and unsustainable agricultural practices [3,4]. While soil erosion rates in the Mediterranean are generally lower than in other parts of Europe, this often reflects the already degraded state of soils, underlining that further degradation would have severe impacts [5,6]. Mediterranean erosion rates are generally highest in croplands, where it causes a loss of fertile soil and leads to reduced productivity in agricultural systems [1]. Vineyards and olive groves are among the agricultural systems that are most prone to erosion, with vineyards having the highest erosion rates by far [5,7]. The main causes for high erosion rates in these systems are low vegetation cover, tillage, and steep slopes [8]. Soil erosion in olive groves has increased over time due to the intensification of olive production and is a major threat to the sustainability of olive groves [9,10]. Furthermore, conventional management leads to reduced sustainability and yield in vineyards [11]. Meanwhile, increased periods of prolonged drought are expected to lead to an intensification of irrigation in olive groves and vineyards, and in turn, this intensification is causing more soil erosion [12].
As one of the most important drivers behind land degradation in many ecosystems, soil erosion negatively affects soil properties, reduces agricultural productivity and available agricultural land [1,13], and leads to a decrease in organic carbon and nutrients as the soil is lost [14]. Furthermore, soil erosion can lead to negative off-site effects such as decreasing water quality [15]. On the local scale, soil erosion causes agricultural systems to become unsustainable, negatively impacting the resilience of farmer livelihoods [16]. Furthermore, erosion-induced decreases in agricultural productivity are a driver of land abandonment [17], which can exacerbate soil erosion and stimulate rural depopulation, negatively affecting rural economies [18]. In turn, rural depopulation eventually leads to the loss of cultural values and traditions of local communities [19]. As such, the prevention of soil erosion is important for both ecological and socio-economic reasons. These factors show that there is a need for research into measures to reduce soil erosion and increase the sustainability of agricultural orchards in the Mediterranean [20].
Remote sensing is a useful tool for the spatial assessment of soil erosion and is increasingly being used in soil erosion assessment and monitoring [21]. Satellite remote sensing is often used to estimate erosion parameters such as vegetation cover. Erosion, from catchment to global scale, is mapped by incorporating the measured parameters in erosion models [1,21,22]. On smaller scales, remote sensing from Unmanned Aerial Vehicles (UAVs) or drones offers a suitable alternative [23]. While satellite remote sensing can only be used to measure erosion parameters, UAV-based remote sensing can directly measure soil erosion over time [24]. Furthermore, UAV-based remote sensing can assess soil erosion at a significantly higher resolution, allowing for greater accuracy [25] and facilitate the precise assessment of microtopology [26].
UAV-based remote sensing is increasingly used to investigate the components of soil erosion at the field and catchment scale. For example, UAV-based remote sensing has been used to study spatial patterns of erosion [27], calculate sediment budgets [28], detect rill formation in agricultural fields [29], and estimate microtopographic soil parameters such as soil roughness [30]. However, at even smaller scales, such as those of small erosion plots within fields, UAV-based remote sensing has only been applied in a small number of studies [25], underscoring the need to study the use of UAV-based remote sensing at these smaller scales.
Many studies have already used field experiments to study soil erosion with conventional methods, such as sediment traps or rainfall simulations [5,31]. However, these methods do not identify the individual components of inter-rill, rill, and gully erosion and cannot be used to study spatial patterns of sedimentation and deposition. This introduces uncertainty about the actual impacts of soil erosion and the influence of different erosion processes, such as the aforementioned rill or gully erosion [32]. Consequently, exact measurements of surface changes with high temporal and spatial resolution are needed to investigate the development of erosion patterns over time, which is necessary to understand rill and inter-rill erosion processes [24].
UAV remote sensing can offer new methods for studying soil erosion at the plot scale [24,29,33,34]. Previous research includes only a limited number of studies using UAV remote sensing to assess soil erosion in vineyards [35], and none focused on olive orchards. Moreover, few studies have compared the effects of different soil conservation measures between plots using UAV remote sensing [36,37], and none have tested the application of biochar, a product that, beyond its effects to reduce erosion, can also improve soil habitat and crop growth [38,39].
To address these research gaps, the present study focuses on vineyards and olive orchards in Alentejo, Portugal, a region where climate change and agricultural intensification have been shown to increase erosion risks [40], making it an interesting location for studies of soil erosion in Mediterranean agricultural systems. The general objective of this research is to evaluate the applicability and limitations of UAV-based photogrammetry for soil erosion assessment in Mediterranean vineyards and olive groves.
Specifically, this study aims to (i) assess the accuracy of UAV-derived DTMs and their suitability for quantifying soil erosion through DoDs, (ii) compare erosion estimates derived from DoDs with in-field erosion measurements at the plot scale, (iii) evaluate the effects of mulch and mulch–biochar treatments on soil erosion, and (iv) identify key topographic and vegetation-related variables derived from UAV data that explain spatial variability in measured soil erosion. By addressing these objectives, this study provides insight into both the potential and the current limitations of UAV photogrammetry for erosion monitoring in Mediterranean agricultural orchards.
2. Materials and Methods
2.1. Study Area and Experimental Design
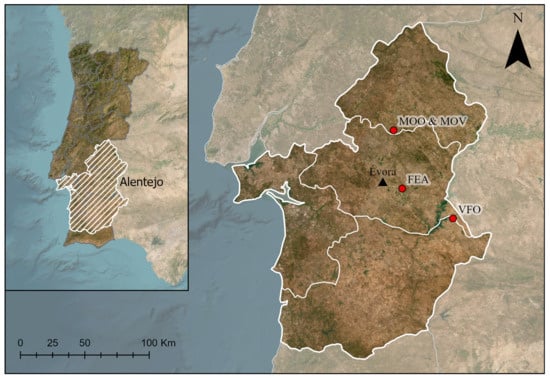
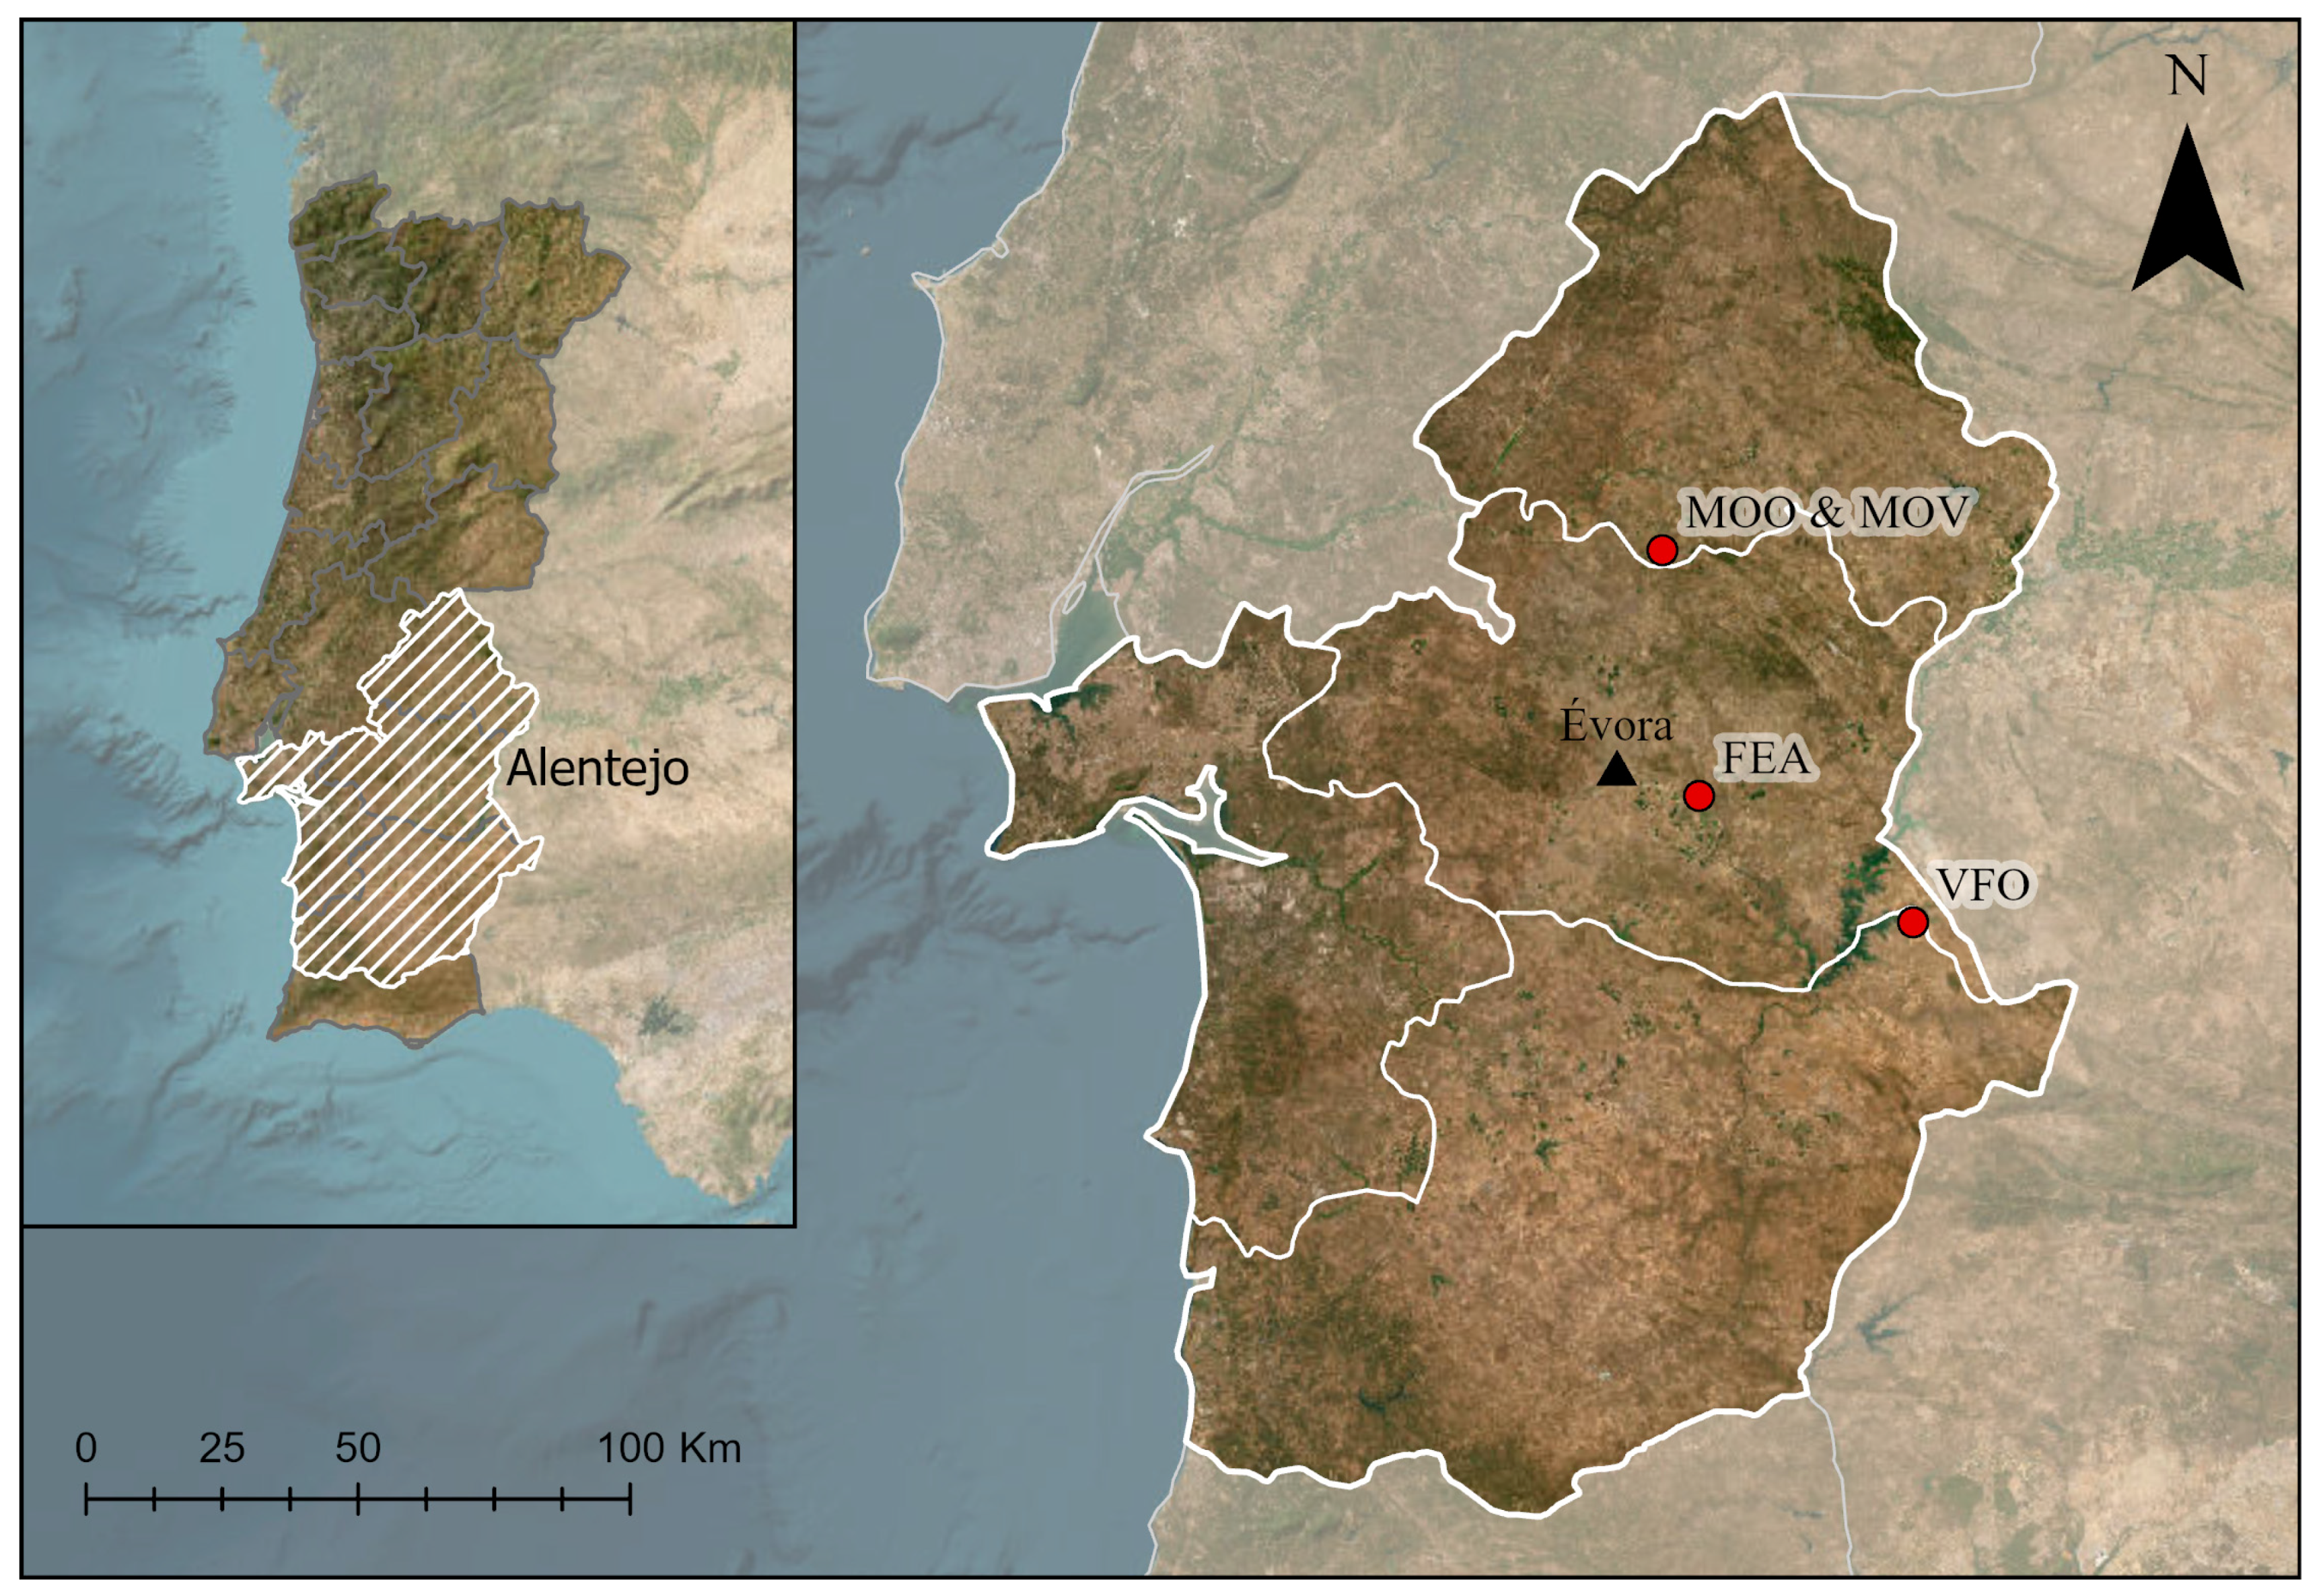
This research was conducted across four study areas in Portugal’s Alentejo region: two olive orchards and two vineyards. The olive orchards were the irrigated, integrated-management Vale Formoso (VFO) area near Granja (40 km east of Évora, GPS coordinates 38°18′13.3″ N 7°16′37.6″ W) and the organic, rainfed Mouchão Olive (MOO) area near Casa Branca (20 km north of Évora, 38°55′03″ N 7°47′20″ W). Approximately 600 m from MOO lies the integrated-management Mouchão Vineyard (MOV) area, with the second vineyard, the Fundação Eugénio de Almeida (FEA) area, situated 15 km east of Évora (38°31′03″ N 7°44′17″ W). In the integrated-management study areas, ground cover was permitted to grow throughout, with herbicide application focused near the tree lines [10,41]. The regional climate is characterized as hot-summer Mediterranean (Köppen Csa), with a mean annual temperature of 16 °C and annual precipitation ranging from 500 to 600 mm. Soil parent materials were slate/conglomerate at VFO, conglomerate at MOO and MOV, and schist at FEA. Soils were classified as Cambisols, except for Regosols and Luvisols identified at the MOO and MOV areas. Nine erosion plots with areas ranging between 150 and 200 m2 were installed in each study area, in three blocks of three plots each. Three different treatments were randomly applied to each of the plots: untreated, a mulch layer, and a mulch layer over a biochar layer applied previously. The mulch application rates were 3 Mg/ha of olive leaves in the olive groves and 2 Mg/ha of straw in the vineyards. Biochar was applied at a rate of 10 Mg/ha in both land uses. The treatments were applied in a completely randomized block design, with three blocks of three plots per location, resulting in 36 plots. The study took place from 2024 to April 2025. The total rainfall between these dates (520 mm for MOO, MOV, and FEA; 451 mm for VFO) was very near to the long-term annual rainfall. Figure 1 shows a map with the locations of the study sites, and Table 1 provides a summary of the plots and treatments per study area.
Figure 1.
Map showing the locations of the study areas. On the left: reference map of Portugal, indicating the Alentejo region. On the right: map with the locations of the study areas within the Alentejo region (red circles) and Évora city (black triangle).
Table 1.
Summary of the plots per location and treatment. Each plot was given a code according to its study area (VFO, MOO, FEA, MOV). Furthermore, the plots were numbered and assigned a code for the applied treatment (C = control, M = mulch, MB = mulch + biochar). Plots in each study area were divided into three blocks.
2.2. In-Field Erosion and Bulk Density Measurements
Sediment fences [42] were installed at the downslope end of every erosion plot. Sediment was removed from the fences and weighed during monthly field visits. The dry weight of the sediments was determined by drying samples in the laboratory.
Soil bulk density of each plot was determined and was required for the calculation of weight of eroded sediments as estimated by the DoDs. Nine soil samples were taken in each plot—at the bottom, middle, and top of the plot—and for three micro-environments—below the tree or vine, in areas compacted by wheel passages (ruts), and in vegetated areas. All samples were weighed and then dried for 24 h at 105 °C. After drying, the samples were weighed again. Bulk density was calculated as the mass of dry soil divided by the total volume of the sample.
2.3. Derivation of Digital Elevation Models
Two sets of drone flights were conducted, in early November 2024 and in early April 2025. A Mavic 2 Pro Camera (Hasselblad, Gothenburg, Sweden) was used, with a resolution of 0.8 cm per pixel. The flight altitude was 37 m. Photographs were taken with 80 percent frontal overlap and 60 percent sideways overlap. DTMs were created from the photographs of each drone flight through a Structure-from-Motion photogrammetry workflow, using the Agisoft Metashape Pro software 2.3.0 [43]. Ground Control Points (GCPs) were used to georeference the DTMs. Georeferencing was necessary to correct camera calibration parameters in the Metashape software and to remove deformations in the sparse point cloud [44,45]. A Trimble Catalyst GPS was used to record the x, y, and z coordinates of the GCPs and several transects within the erosion plots with an average accuracy of 0.02 m. In total, 12 transects were surveyed, one for each block. Coregistration was used to align the 2025 DTMs with the 2024 DTMs. Coregistration is a technique used for multitemporal topographic datasets, where the second DTM is aligned with the first DTM by identifying areas where no elevation change has taken place (e.g., rocks, roads) and using these areas as GCPs in the second DTM [44,46]. As a measure of DTM model error, the Root Mean Square Error (RMSE) between the elevation of GPS points and the elevation of corresponding points in the DTMs was calculated, with the GPS data used as ground truth data. Table 2 presents an overview of the drone and GPS surveys per study site.
Table 2.
Overview of the drone surveys. The number of images was the same during both surveys and includes nadir (n) and oblique (o) images. GPS points collected in 2024 include the ground control points (gcps). GPS points collected in 2025 include the transect points measured in the field (tran), as well as the coregistration points (coreg). Low and high altitudes are given in meters above sea level (m.a.s.l.).
2.4. Erosion Estimation from DTMs
DEMs of Difference (DoD) were calculated for each plot to estimate the erosion between the 2024 and 2025 drone flights. DoDs were calculated by subtracting the 2025 DTMs from the 2024 DTMs. The propagated error in the DoD was calculated as shown in Equation (1) [47,48,49]. A “level of detail” (LoD) was used to account for the DoD error in the erosion estimation. The LoD can be seen as a confidence interval for the change in elevation between the first and second DTM, where only elevation changes outside the confidence interval are considered actual topographic changes. Previous studies show that a 95% LoD is generally appropriate [47,50].
where is the propagated error, and are the errors from the respective DTMs, and is the 95% Level of Detail. The net eroded volume was calculated as the sum of all significant elevation differences in the DoD multiplied by the raster cell size. This volume was converted into eroded weight by multiplying by the plot average bulk density.
2.5. Deriviation of Topographic Variables
Several variables were derived from the DTMs and orthomosaics, including plot area, length, slope, surface roughness, and vegetation cover.
In order to calculate surface roughness, the DTMs were first detrended to remove global effects such as slope that could affect the results [24]. Detrending was performed by fitting a linear, first-order polynomial to the DTM and subtracting this polynomial from the original DTM. The Random Roughness index, also referred to as the Root Mean Squared Height (RMSH), was calculated to quantify surface roughness [30].
where z is the elevation of cell i, the mean elevation, and n the number of cells. Vegetation cover was derived from the orthomosaics using the Visible Atmospherically Resistant Index (VARI) index, a vegetation index that uses only the red, green, and blue wavelength bands, and does not require near-infrared data [51].
where equals the reflectance of the respective wavelength band. A threshold was used to determine vegetated areas from the resulting VARI maps. All cells with a value above the threshold were classified as vegetation and those below as bare soil. The threshold was determined from the VARI histogram. The VARI maps were classified into vegetation and bare soil, and the vegetation cover was calculated as the percentage of vegetation cells divided by the total amount of cells per plot.
2.6. Statistical Analysis
All statistical analyses were performed in the R environment using RStudio 4.5.3. The data generated for this study and used in the statistical analysis is publicly available at Supplementary Materials and supporting information regarding the statistical analysis is publicly available at Supplementary Materials. The accuracy of the net erosion estimates was assessed through RMSE and R2 metrics. The RMSE is a measure of model accuracy, with a lower RMSE indicating a more accurate estimation of erosion compared to the ground truth. The coefficient of determination (R2) is a measure of the goodness of fit for a model compared to the ground truth, with a higher value indicating a better fit.
Relative error in field measurements of sediment weights from erosion plots increases as the actual weight of sediments in the sediment traps decreases. In cases of very low erosion rates, this can significantly affect the accuracy assessment of erosion model estimations [52]. Nearing (2000) defined occurrence intervals between which the relative difference between actual and predicted erosion is deemed acceptable for different erosion rates [53]. The occurrence interval’s upper and lower boundaries are defined as follows:
As erosion rates measured during this study were very low in some plots, Nearing’s effectiveness coefficient was calculated as an additional accuracy metric to provide a more in-depth assessment of model accuracy. The effectiveness coefficient is defined as the percentage of model predictions of which the relative difference with the field measurements falls within the 95% occurrence interval:
The effects of the different treatments on measured erosion, soil roughness, and vegetation cover parameters were analyzed using linear mixed-effects models. The models were fitted using the lmer() function in the lme4 package. Model parameters were estimated using restricted maximum likelihood (REML). Fixed effects were tested using Type III Analysis of variance with Satterthwaite approximations for degrees of freedom and p-values. Treatment, study area, and their interaction were included as fixed effects, while block nested within the study area was included as a random effect. This approach accounted for the hierarchical structure of the experimental design, with plots grouped within blocks, controlling for correlation among plots within the same block.
A multiple linear regression was performed to investigate whether the UAV-derived variables could be used to explain the erosion measured in the field. First, a correlation analysis was performed to identify variables that could be used in multiple linear regression. As several variables were not normally distributed, Spearman’s (non-parametric) rank correlation coefficient was calculated. Variables that had a significant correlation with the measured erosion were selected. From the selected variables, a candidate set of models was constructed, and the best performing model was selected by calculating and comparing the Alkaike Information Criterion (AIC) for each candidate using the model.sel() function from the MuMIn package. In all candidate models, study area was included as fixed intercept to prevent site differences influencing the model outcomes. The linear regression model was fitted using the lm() function from the base stats R package 4.5.3, with parameters estimated by ordinary least squares (OLS). The performance of the selected model was assessed by calculating Leave-One-Out cross-validation R2.
3. Results
3.1. DTM Accuracy Assessment
Table 3 shows summary statistics for the 2025 DTMs. The DTM resolution was lower than 0.02 m for all areas. The number of coregistration points varied per area and was mainly dependent on the number of stable points that could be found between the 2024 and 2025 drone images. In general, RMSE and 95% LoD were higher in olive groves. The MOV1 and MOV2 areas were located next to each other, and both areas were surveyed in one continuous drone flight, resulting in one DTM containing both areas. However, separate GPS transects were surveyed for each area. This explains why the resolution and number of coregistration points are equal between MOV1 and MOV2, but the RMSE and 95% LoD differ.
Table 3.
Summary statistics of the 2025 DTMs showing the resolution of the DTM (cell size) in meters, the residual error, the RMSE between the 2025 DTM and the GPS transect, and the Level of Detection calculated for a 95% confidence interval.
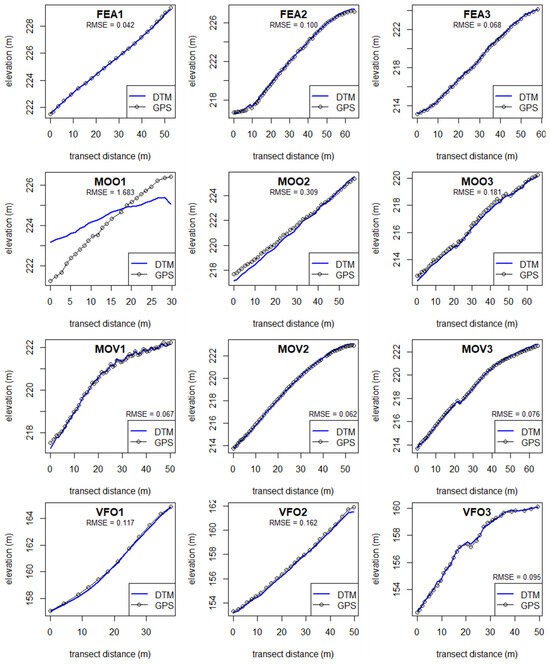
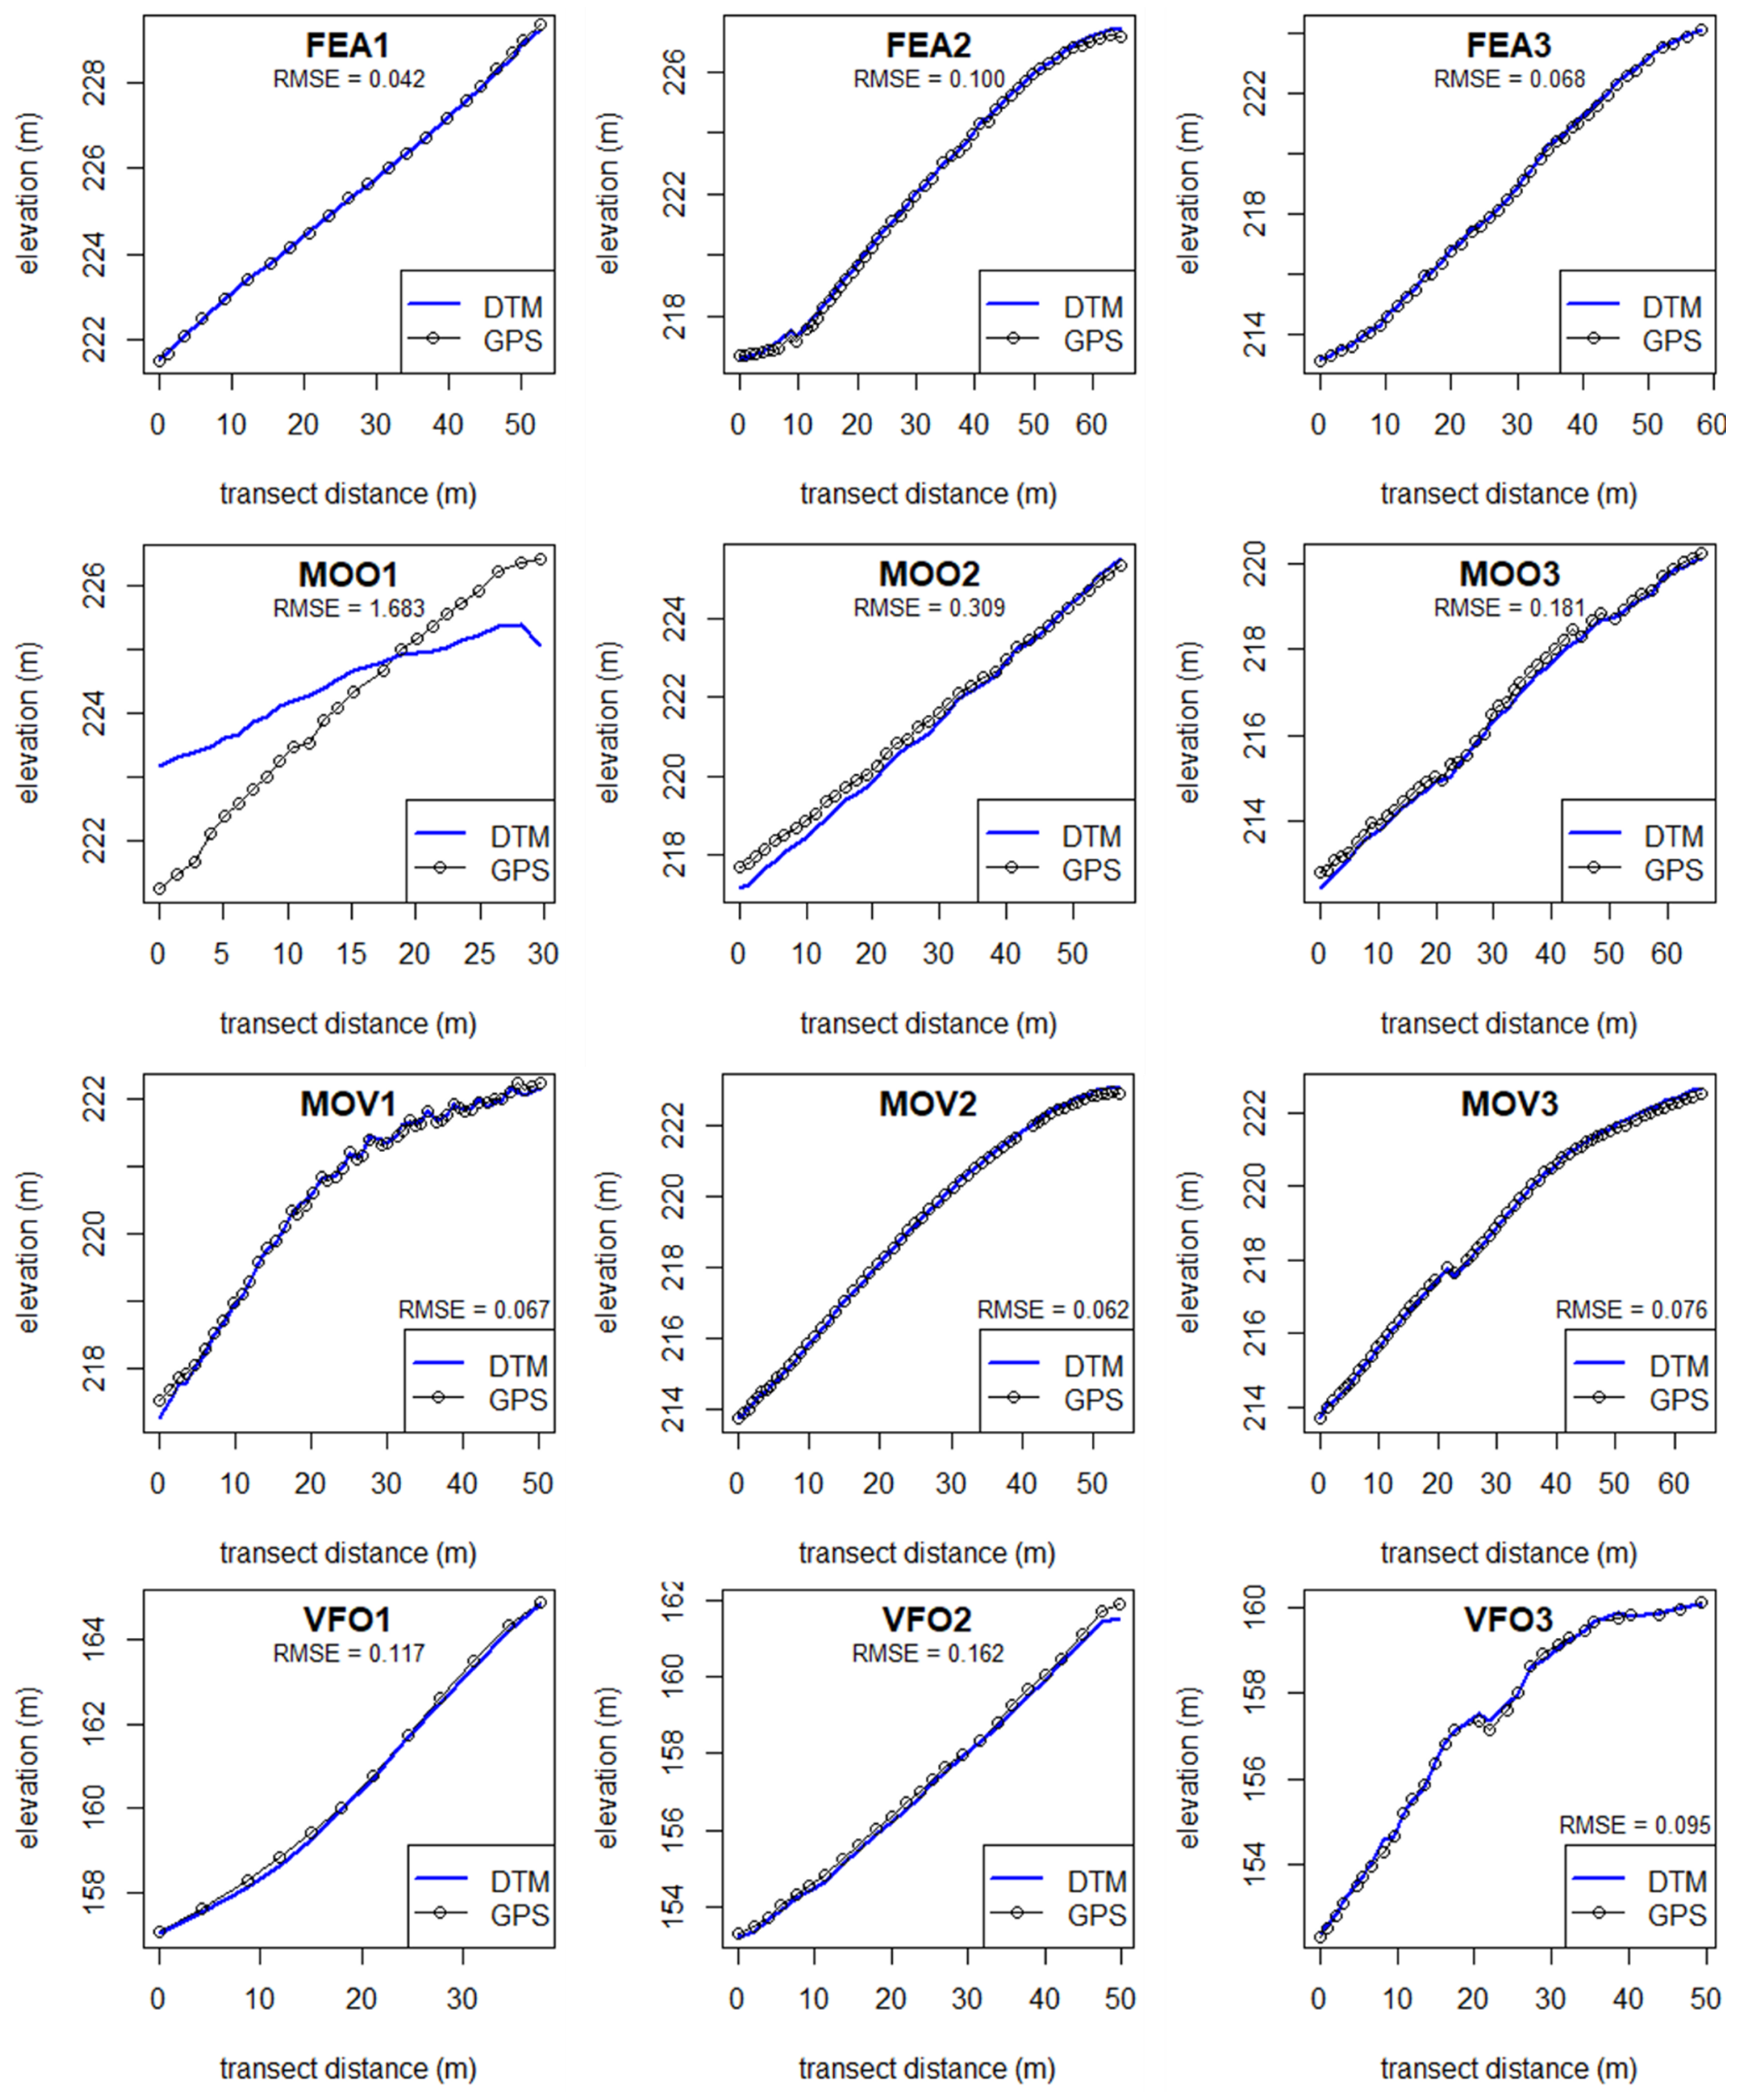
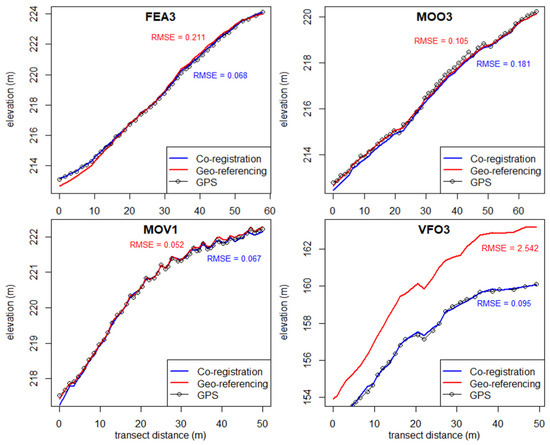
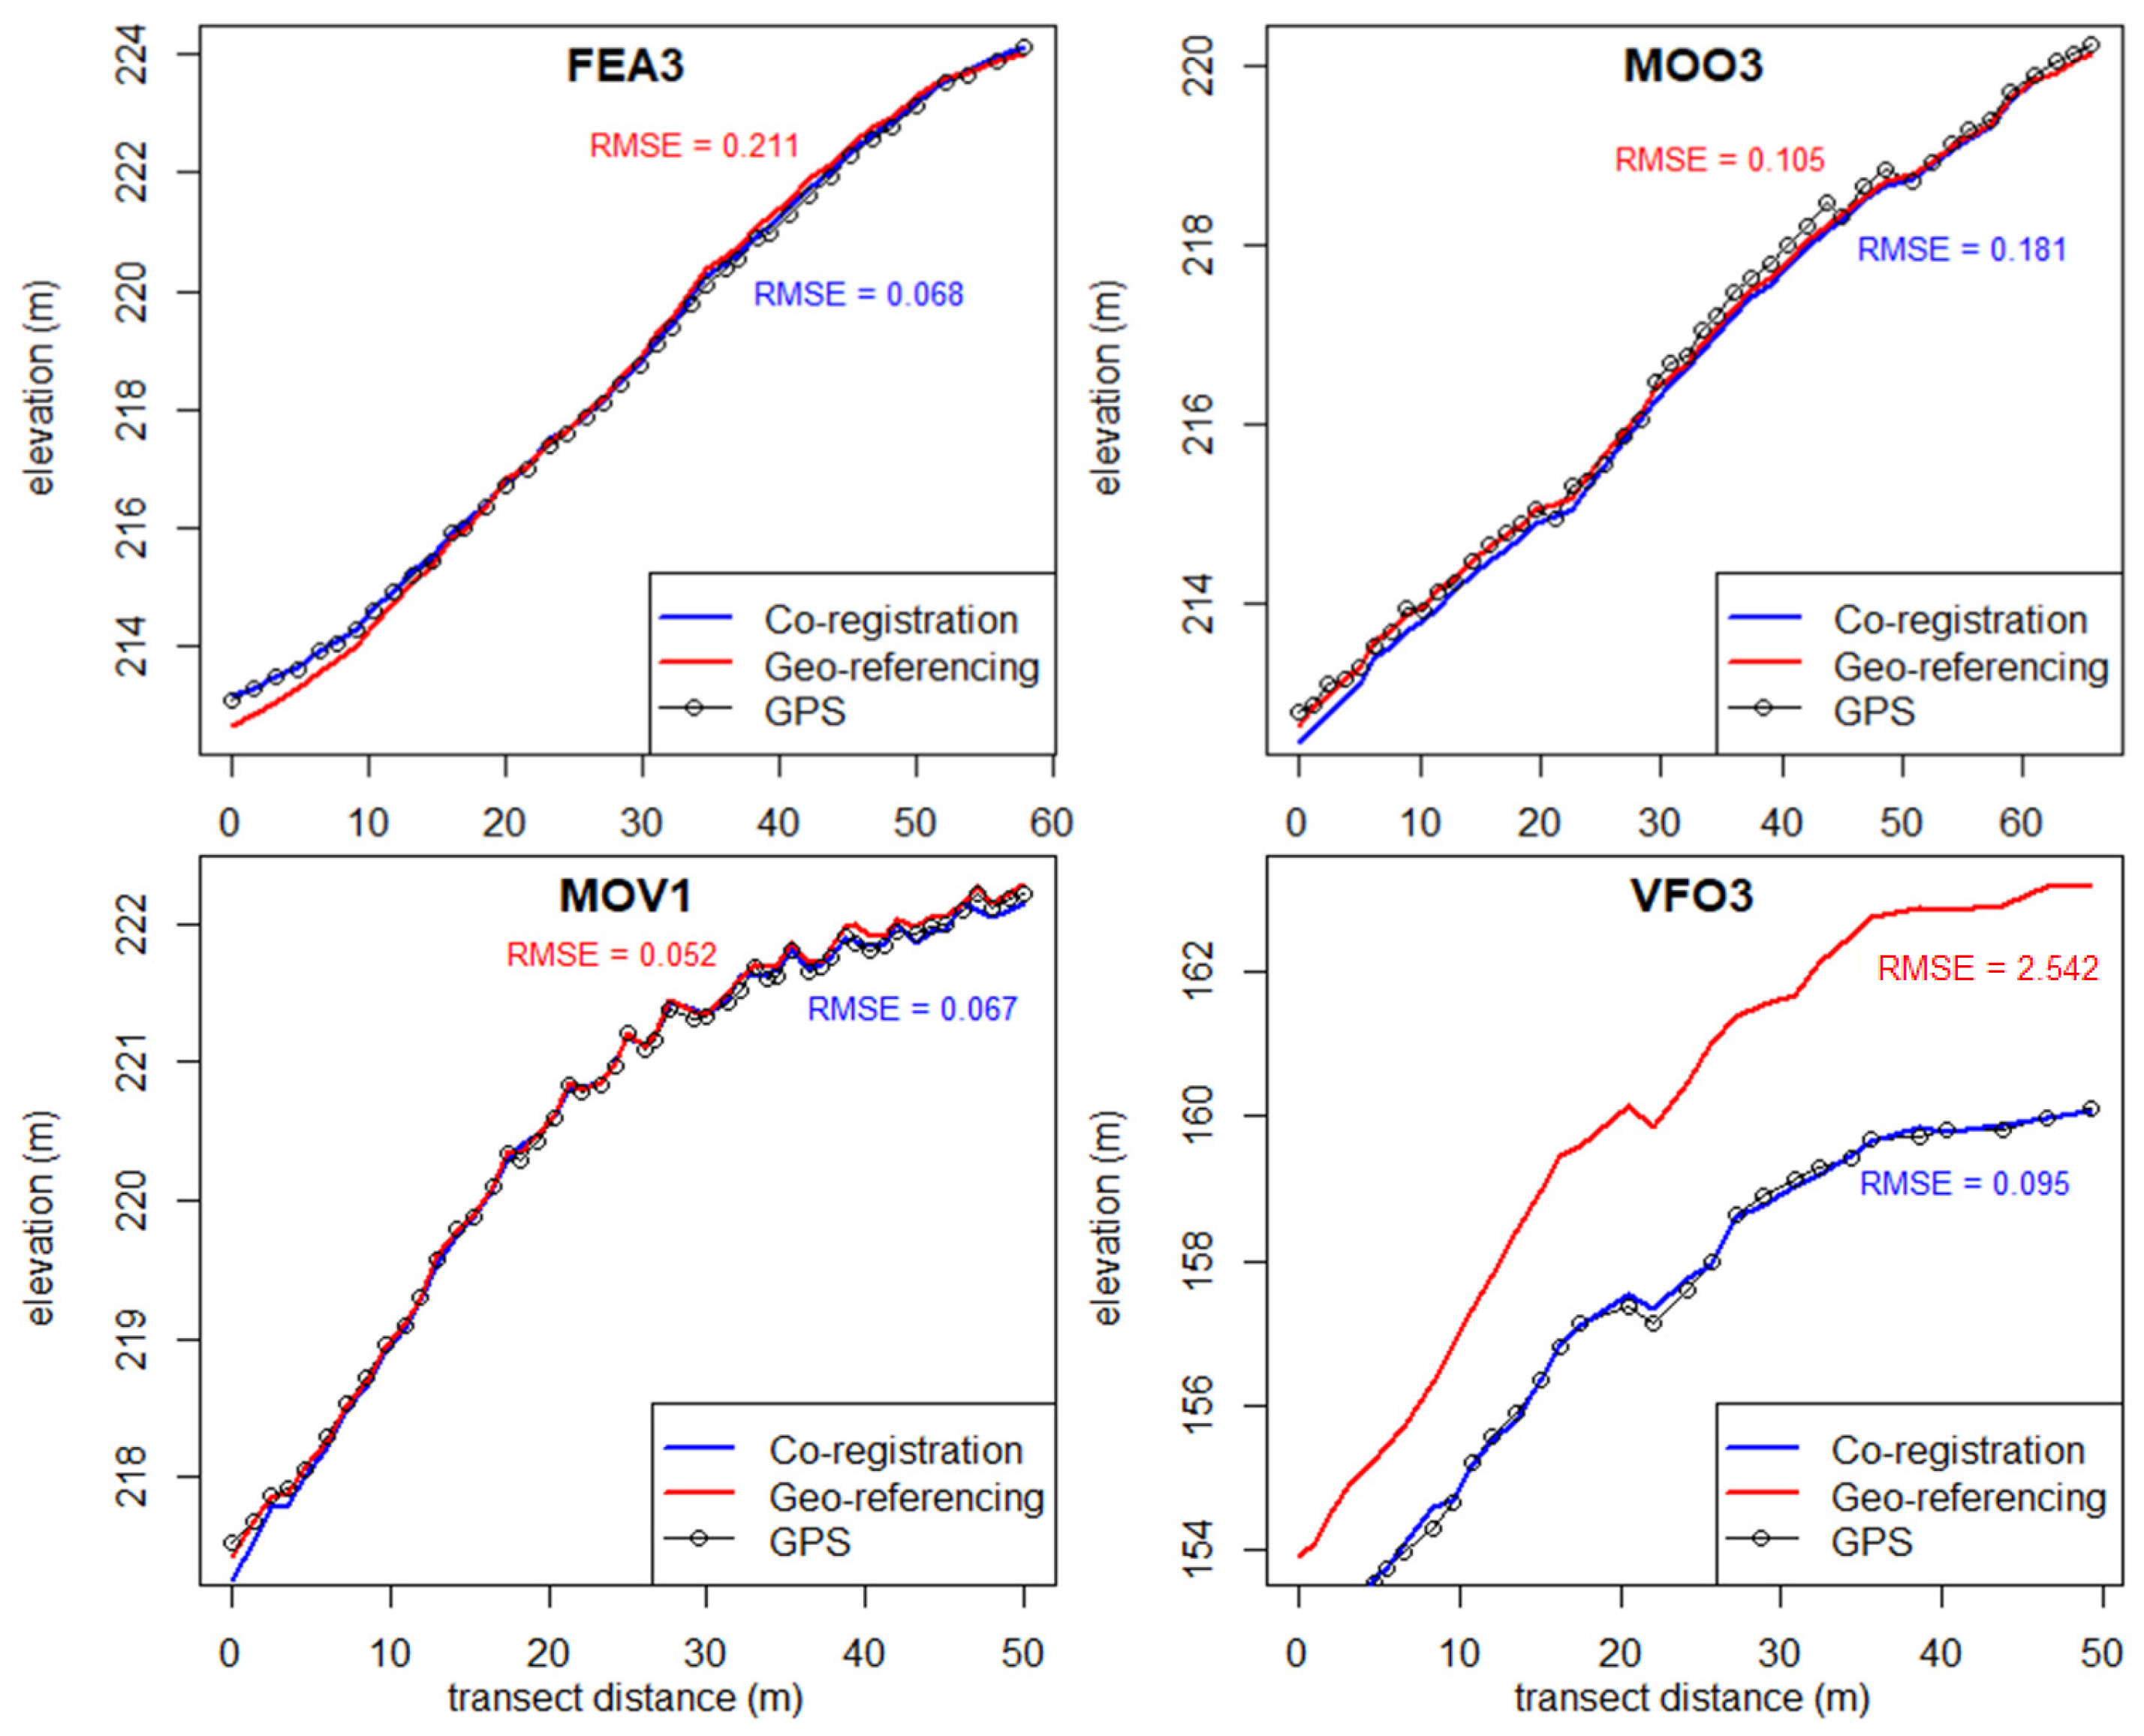
Figure 2 shows graphs of the GPS transects per DTM, with the heights of the transect points on the y-axis and the distance along the transect on the x-axis. The blue line shows the corresponding height values of the DTMs along the transect. From Figure 2, it is visible that in the vineyards (FEA and MOV) and in the olive orchard VFO, there was generally a good fit between GPS and DTM. The MOO DTMs had a much higher RMSE compared to the other areas, and Figure 2 shows that the GPS transects did not fit as well with the DTMs. For the MOO1 area, it was not possible to generate a correct DTM from the 2025 drone survey, which explains the misalignment with the GPS transect and the high RMSE.
Figure 2.
Transects showing the heights of the GPS points versus the corresponding heights in the DTMs, and the RMSE values calculated from the differences between GPS and DTM heights.
Figure 3 compares both methods (coregistration and geo-referencing) and their accuracy compared to the GPS transects. In general, the two methods performed similarly and the differences between the transects were small. In VFO3, the coregistration method performed significantly better, with its transect almost perfectly matching the GPS data. The geo-referencing transect shows a similar overall shape, but it is systematically shifted upward by approximately 2 m relative to both the GPS and coregistration lines.
Figure 3.
Transects showing the heights of GPS points compared to the corresponding height on the Coregistered and Geo-referenced DTMs.
3.2. Quantitative and Qualitative Erosion Assessment from DTMs
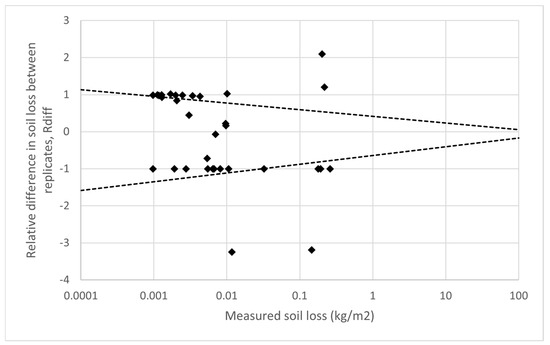
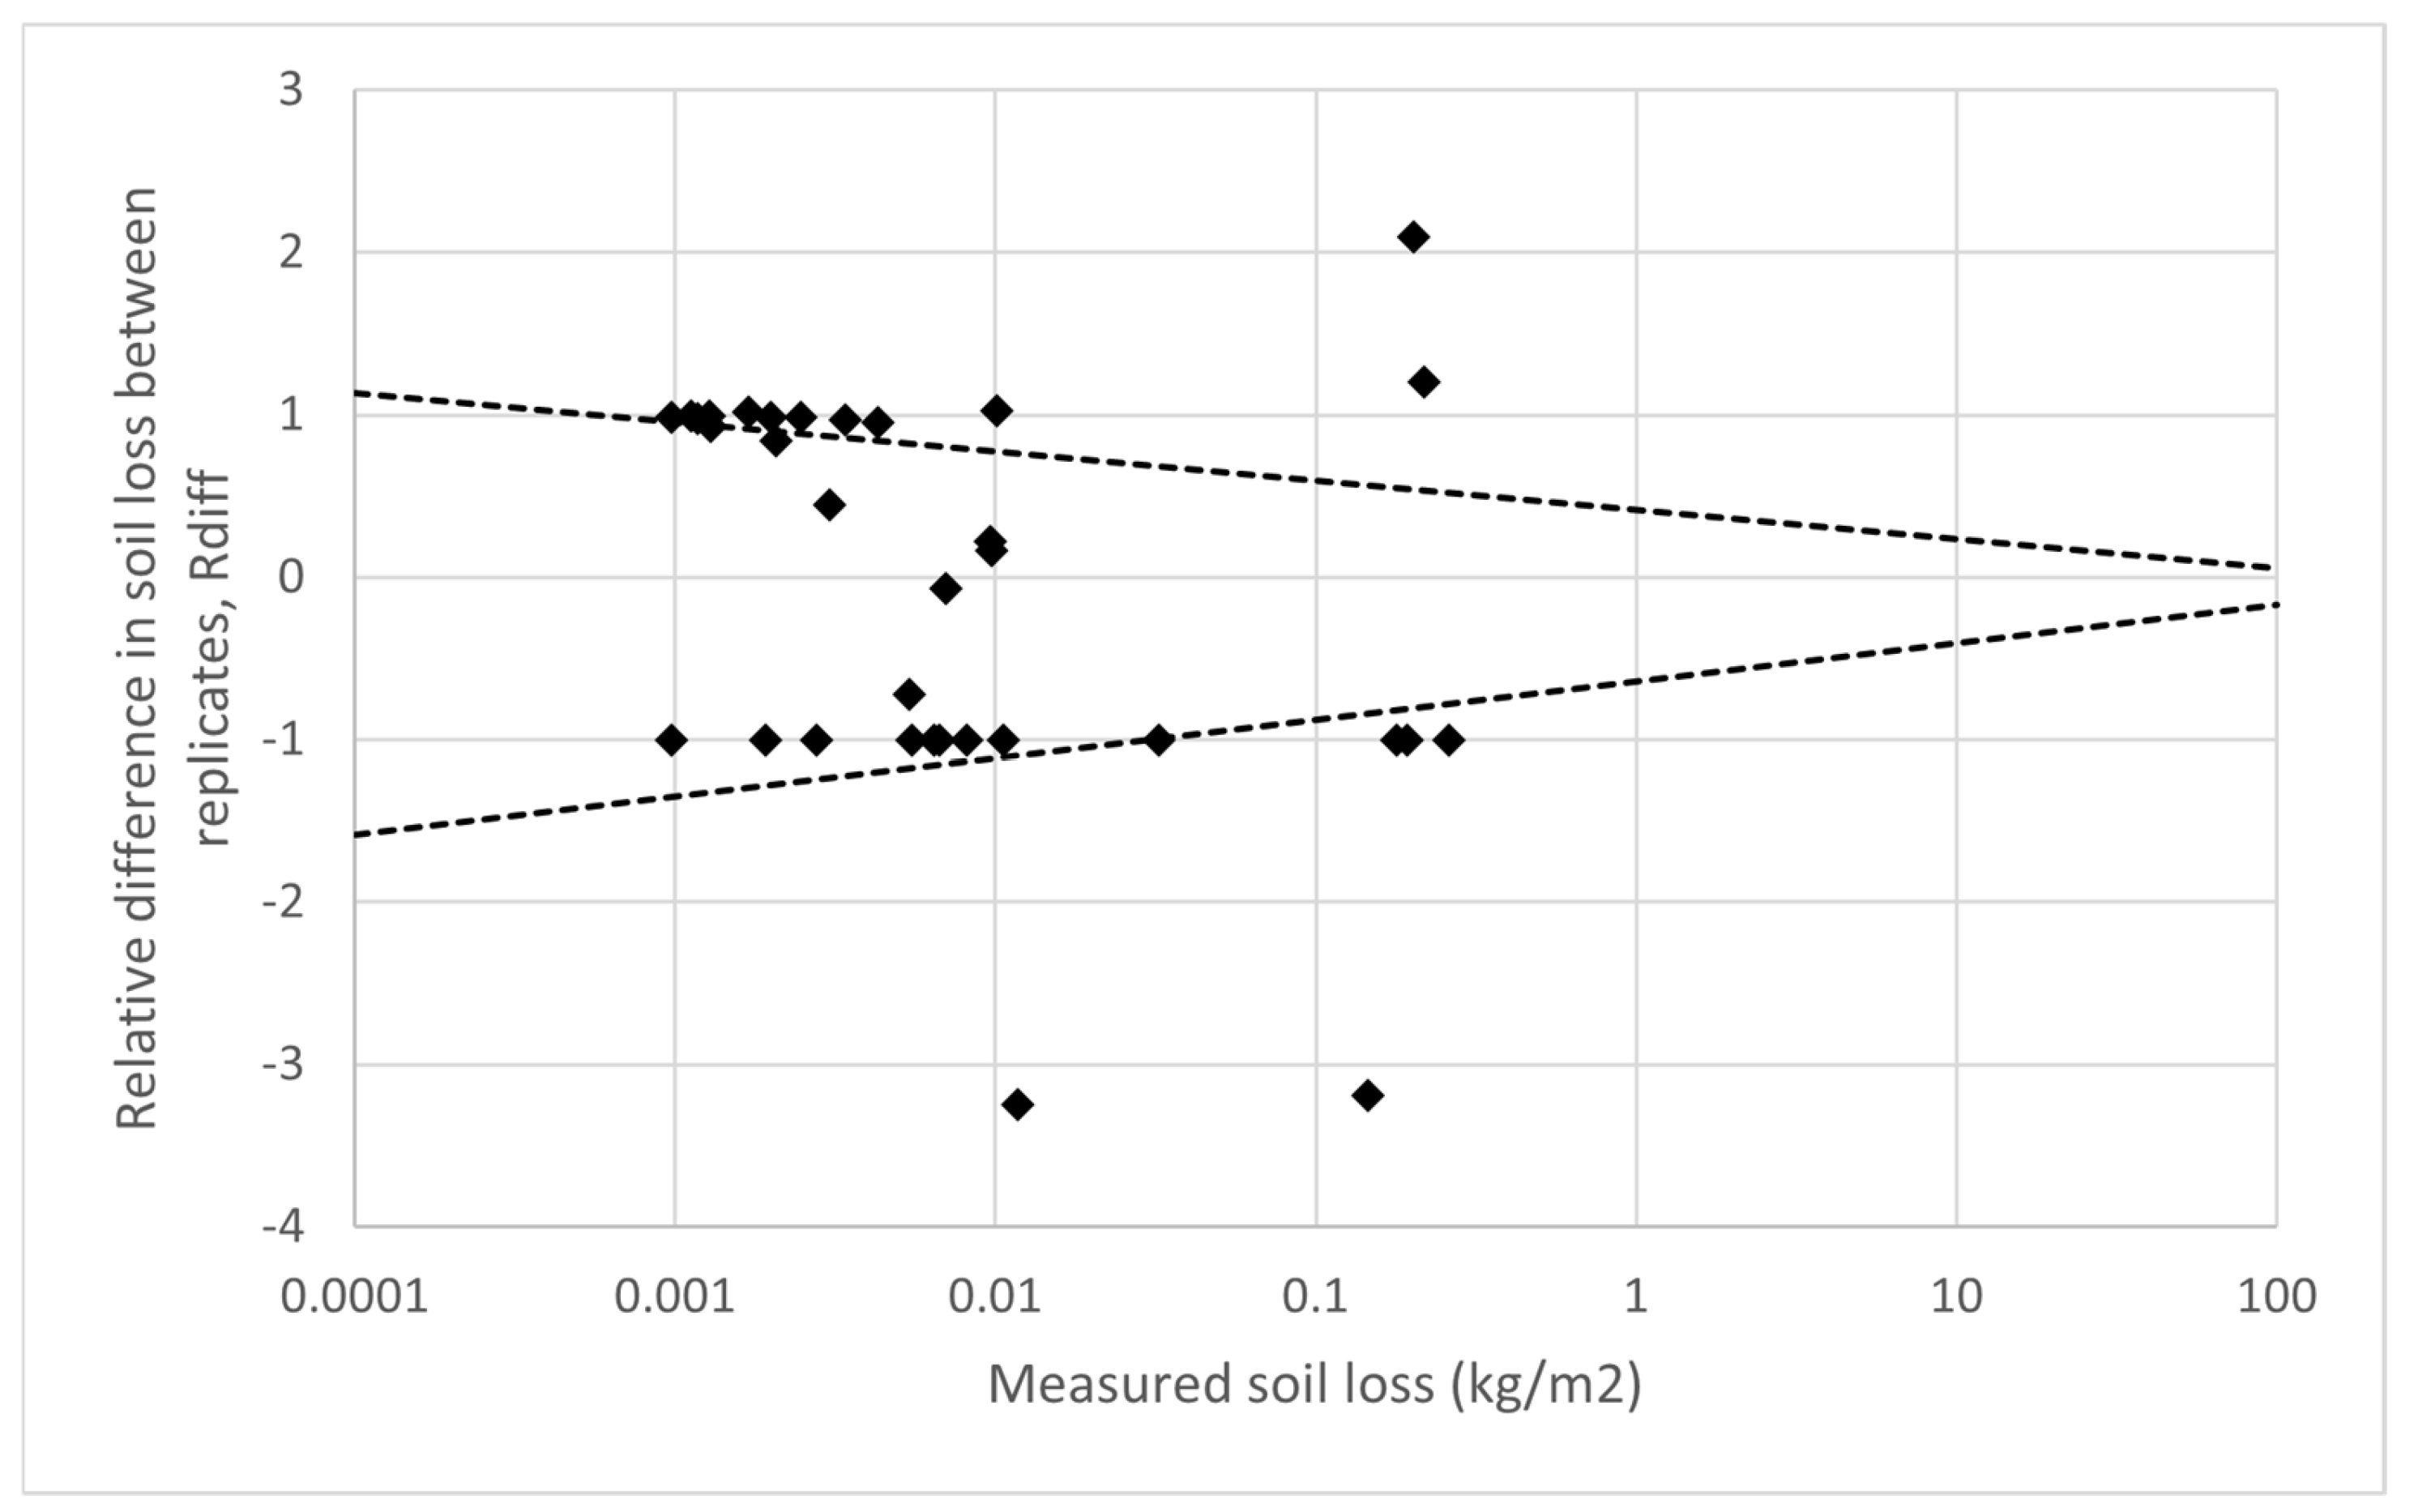
The DoDs could not accurately predict the erosion in most of the plots. In many of the plots, no erosion was detected at all. In 6 plots, the DoDs showed a net deposition, possibly due to vegetation growth that was not successfully filtered. Comparing predicted and measured erosion (sample size n = 33) resulted in an R2 of 0.22 and RMSE of 0.52 kg/m2, indicating poor ability of the DoDs to estimate erosion. Figure 4 shows the relative difference between the measured and predicted erosion for each plot. Relative differences that fall within the occurrence interval are deemed acceptable differences. The final effectiveness coefficient e was 0.45 for a 95% occurrence interval.
Figure 4.
Plot of relative differences. The dashed lines represent the 95% occurrence interval as determined by Nearing (2000) [53] for replicate erosion plots, which become wider at lower rates of measured erosion.
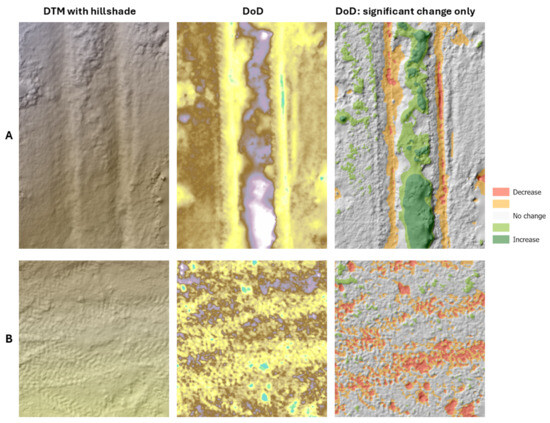
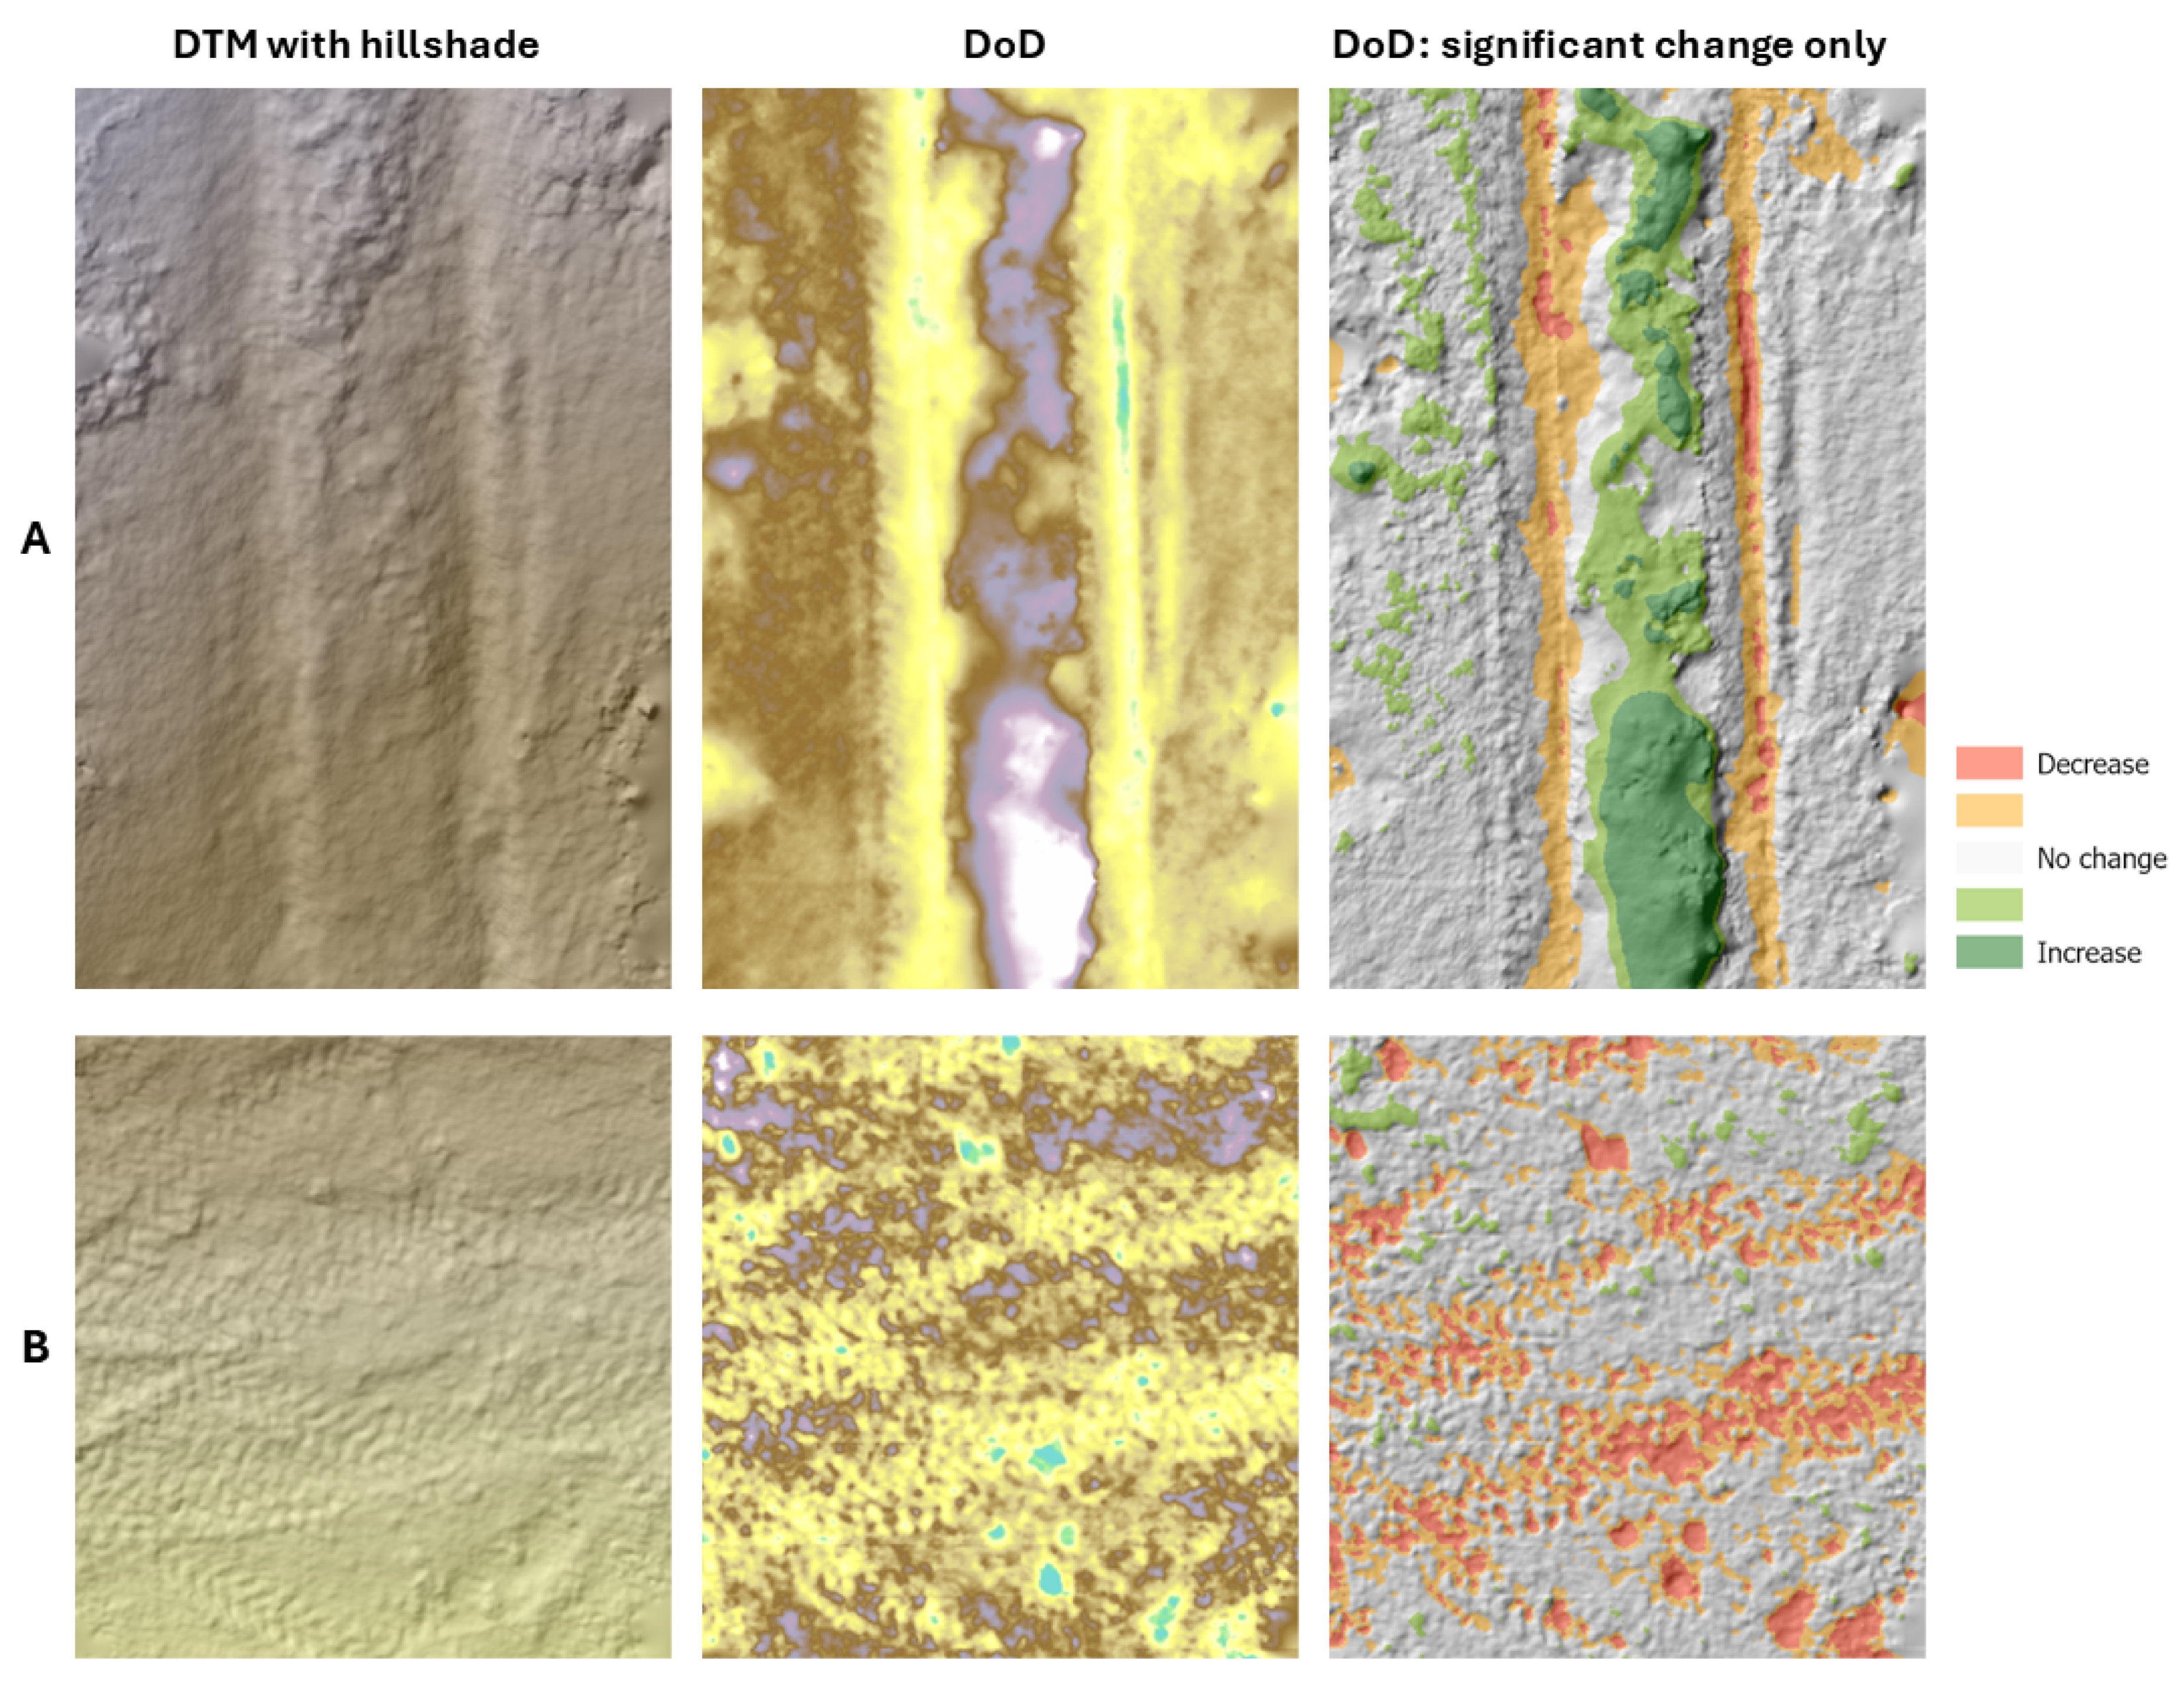
Elevation changes caused by agricultural management, external disturbances, and data processing were found to be much greater than changes caused by water-induced erosion. Figure 5 illustrates these changes, showing a selection of DoDs of the erosion plots. Elevation changes caused by agricultural management included compaction in ruts and raised sides of ruts caused by frequent tractor passages. Furthermore, in locations where vegetation was not successfully removed from the DTM, increases due to growth of vegetation strips were visible. Some areas of the plots were not covered by the drone surveys, usually due to high vegetation cover. These areas were interpolated during the creation of the DTMs, which introduced inaccurate elevation changes in the DoDs. Finally, some elevation changes were caused by soil samples taken between the 2024 and 2025 drone surveys.
Figure 5.
Two examples of DoDs from the study areas. For each example, the first image shows the original DTM, the second image shows the DoD and the third image shows the DoD with only areas with significant increase or decrease. (A) shows a part of plot VFO8, where compaction in ruts caused by tractor passages, raising of the sides of ruts, and vegetation growth are visible. (B) shows a part of plot MOO7, where compaction in existing ruts and creation of new ruts because of tractor passages, and holes caused by soil sampling are shown.
3.3. Comparison Between Treatments and Areas
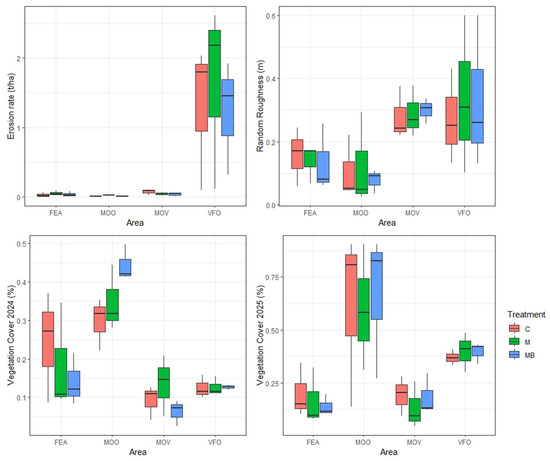
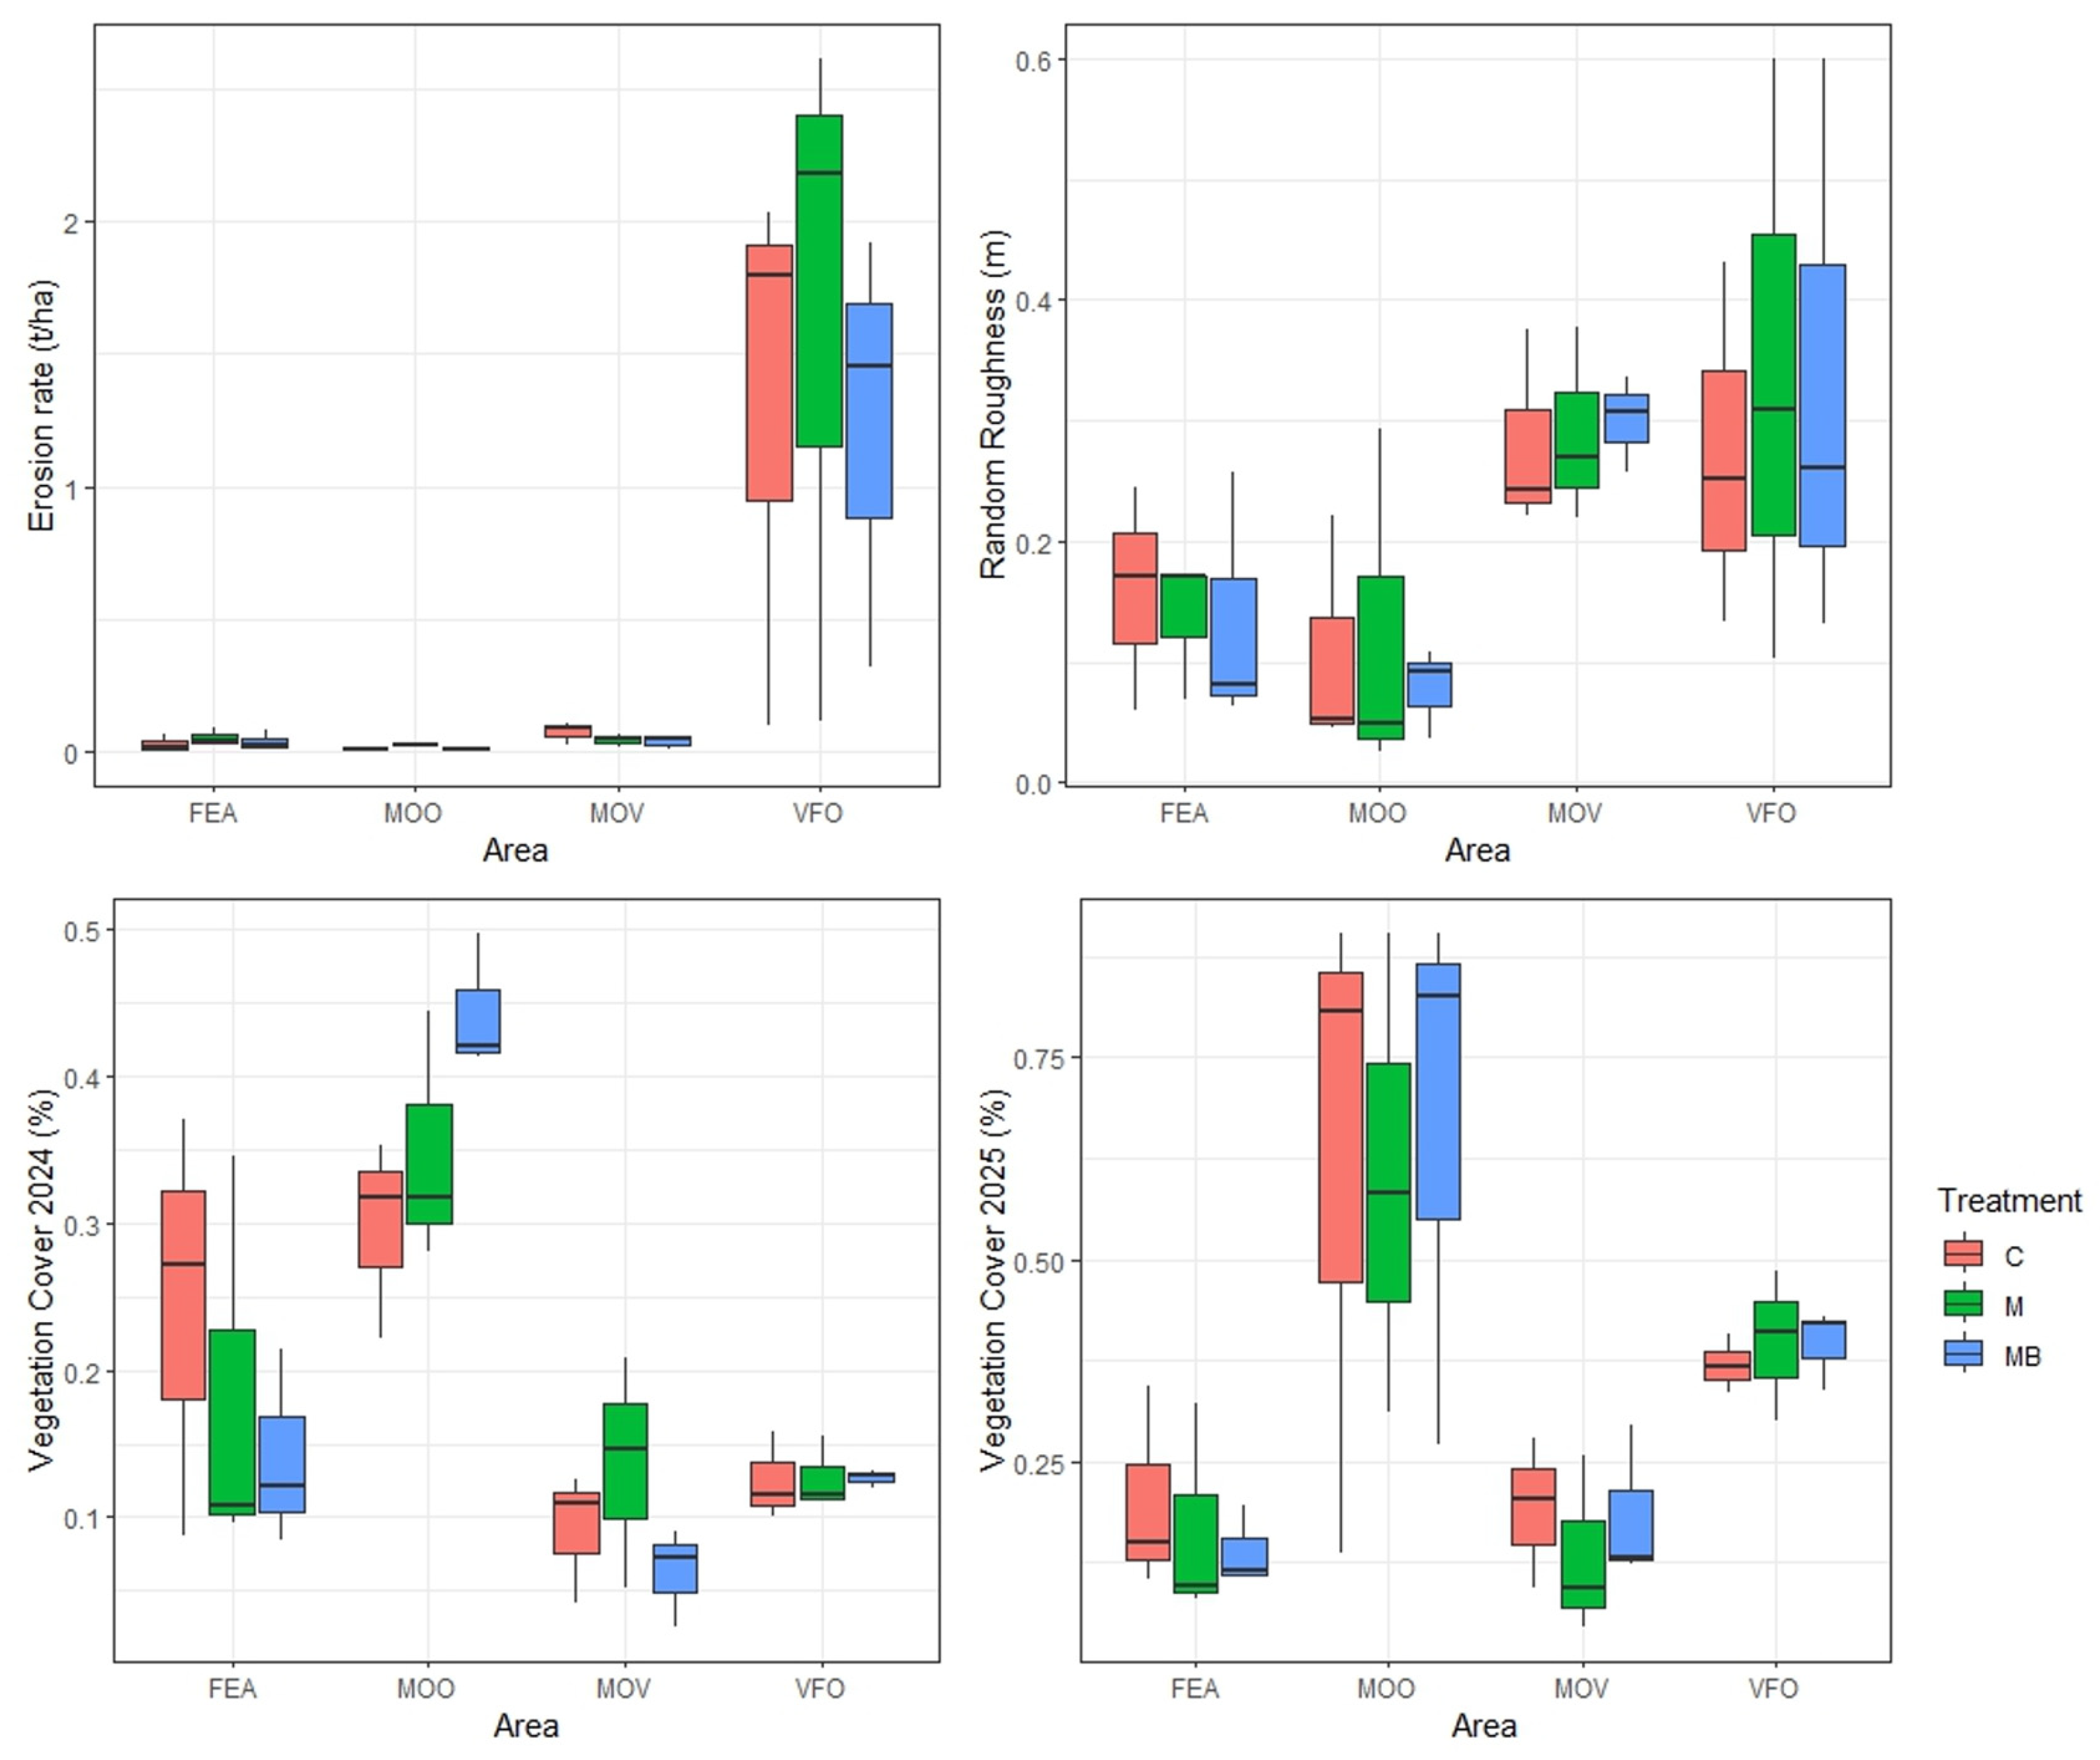
Figure 6 shows boxplots of measured erosion, random roughness, and vegetation cover. The mixed linear models showed a significant effect of study area on the 2024 vegetation cover (p < 0.001, ω2 = 0.69, 95% CI [0.48, 1.00]), 2025 vegetation cover (p = 0.045, ω2 = 0.69, 95% CI [0.48, 1.00]), and measured erosion (p = 0.032, ω2 = 0.40, 95% CI [0.00, 1.00]). Study area was not shown to influence Random Roughness (p = 0.191, ω2 = 0.22, 95% CI [0.00, 1.00]). None of the investigated variables showed significant differences between treatments, but all variables showed significant differences between study areas. Table 4 shows the outcomes of each mixed linear model, including p-value, omega-squared effect size, and confidence interval.
Figure 6.
Boxplots of the measured erosion, random roughness, and vegetation cover. The boxplots are separated by study areas (FEA, MOO, MOV, VFO). The color of the boxplot shows the treatment, with red for control, green for much, and blue for mulch + biochar.
Table 4.
Table showing a summary of the mixed linear models. The first column shows the investigated variable. The second, third, and fourth columns show the p-value, effect size, and 95% confidence interval for treatment, study area, and interaction between treatment and study area, respectively.
3.4. Multiple Linear Regression Analysis
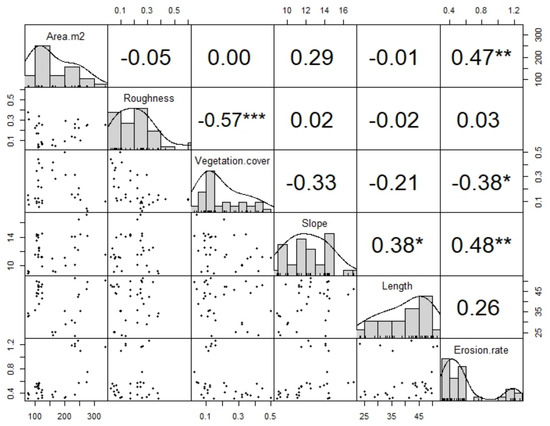
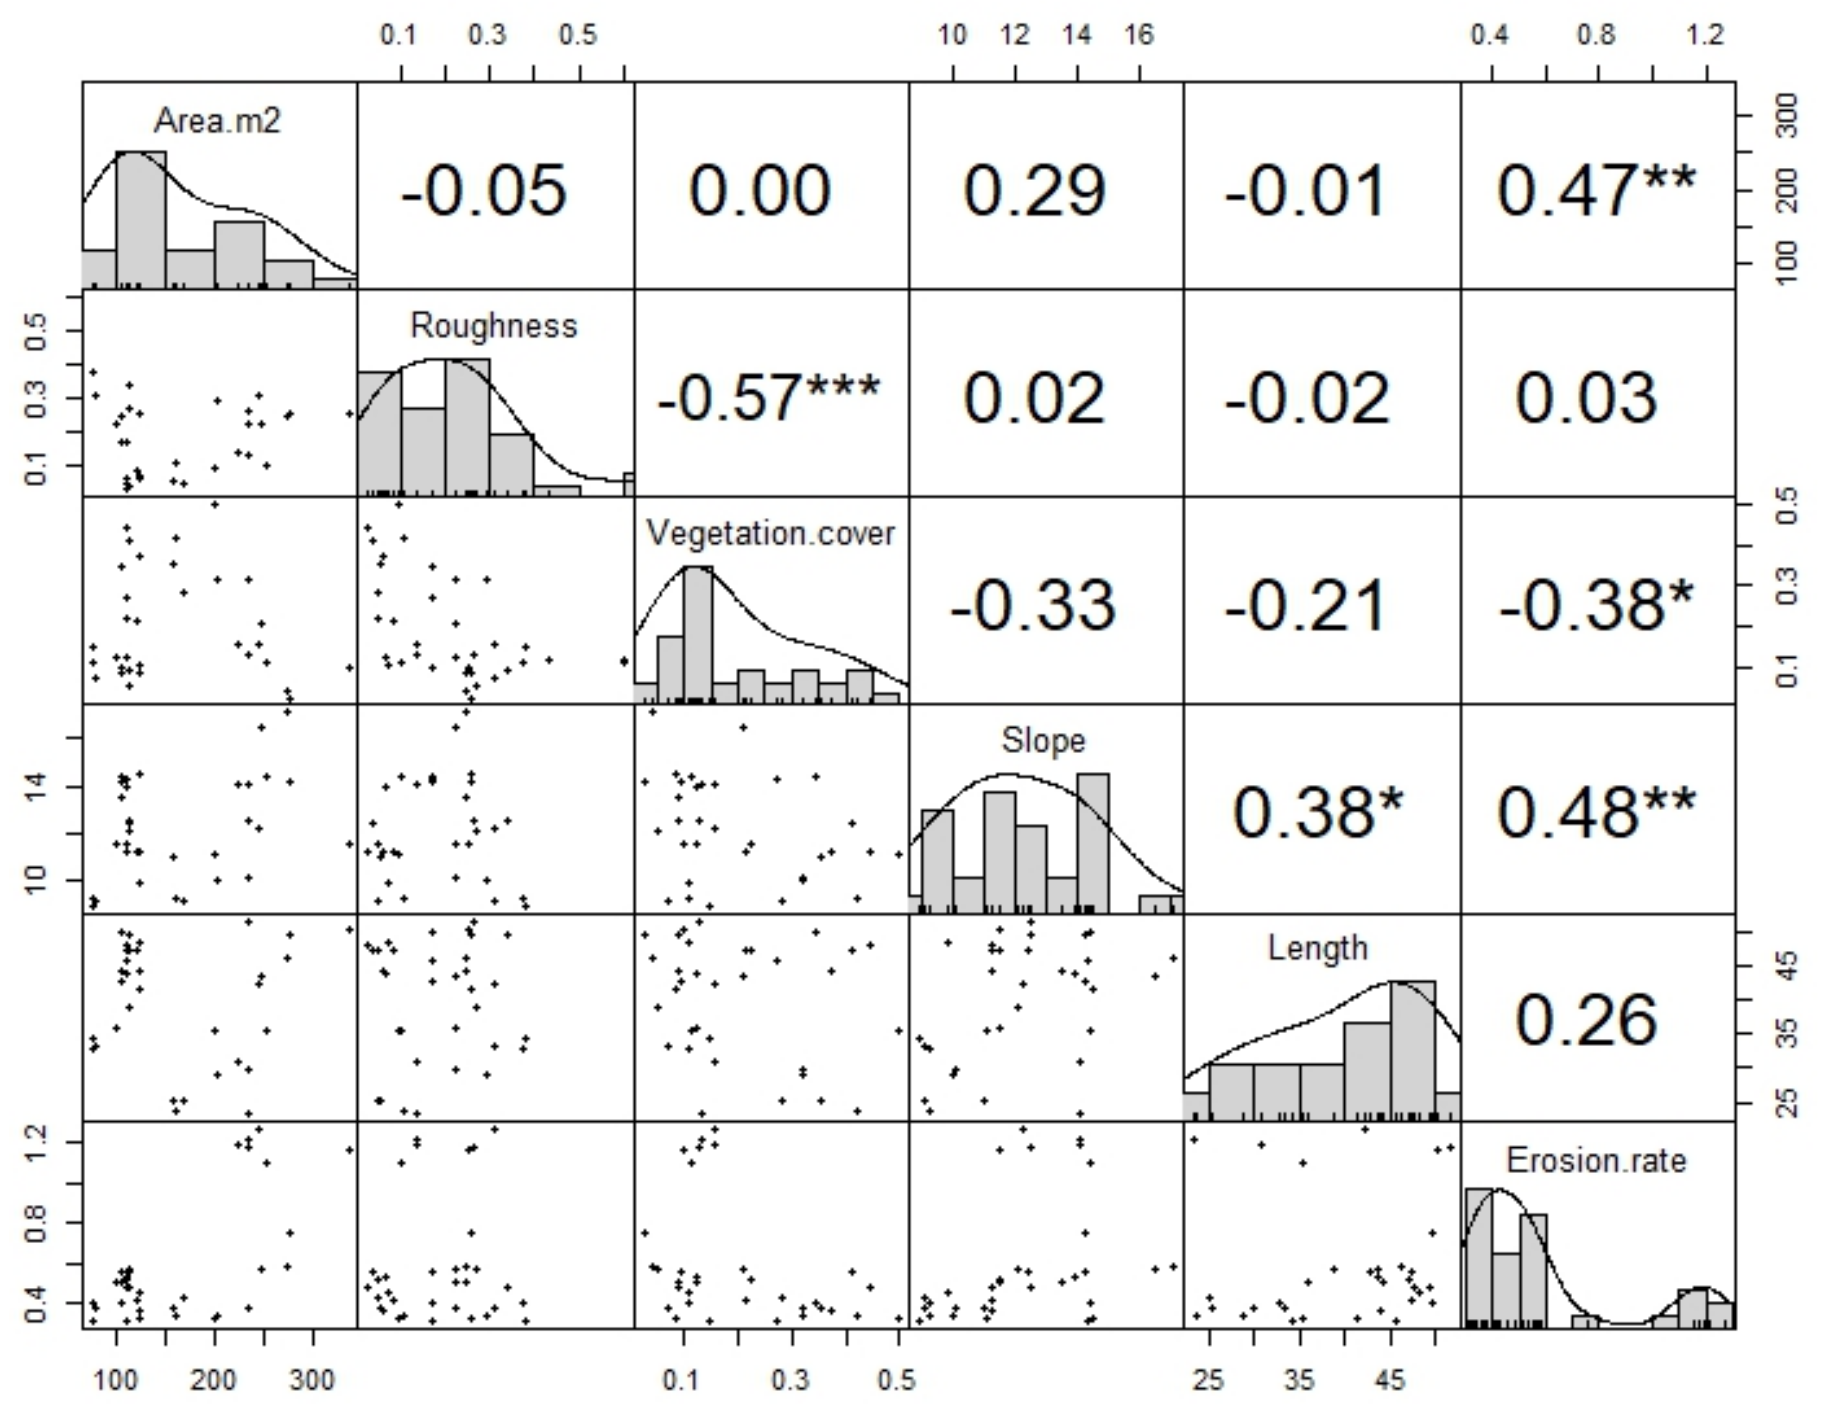
Figure 7 shows a correlation matrix containing all correlations between the measured erosion and UAV-derived variables. Significant correlations were found between measured erosion, vegetation cover, and slope. No significant correlations were found between measured erosion, roughness, and plot length. As there was a high degree of collinearity between the 2024 and 2025 vegetation cover, only the 2024 vegetation cover was chosen for further analysis.
Figure 7.
Correlation matrix of the UAV-derived variables and in-field measured erosion. The top-left to bottom-right diagonal of plots show the variable names together with their distribution. The top-right set of plots show the Spearman correlation coefficient with indications of the strength of the correlation (* = weak, ** = moderate, *** = strong). The bottom-left set of plots show scatterplots between the variables.
The findings of the correlation analysis were used to design a candidate set of models that could explain the rate of soil erosion in the study areas. The full candidate set is shown in Table 5, including the AIC of each model. Comparison showed that the model 2 with slope, plot length, and an interaction between these variables had the lowest AIC score (AIC = −25.6). It is worth noting that adding vegetation cover (AIC = −21.9) or both vegetation cover and contributing area (AIC = −21.9, ΔAIC = 2.73 and AIC = −18.7, ΔAIC = 6.87, respectively) did not lead to improvement of the model.
Table 5.
Table summarizing the candidate set of models. The first column shows the model number. The second column gives the formula of the model. The third column gives a short description of which variables were included in the model. The last three columns give the AIC of each model, the ΔAIC (difference in AIC with the best model), and Weight, which signifies the probability that the model is the best among the candidate set. Note that the models are arranged by AIC and not by model number.
Table 6 shows a summary of Model 2, examining the effects of slope, plot length, interaction between slope and plot length, and the location on soil erosion rates. Location was included as a categorical predictor with the reference location (FEA) omitted from the table. Coefficients for MOO, MOV, and VFO represent differences relative to that reference location. Diagnostic plots showed approximately normally distributed residuals and no evidence of strong leverage or influential observations. There were indications of mild heteroscedasticity, and robust standard errors were computed to account for this. The model explained a substantial proportion of the variance in soil erosion rate, with an Adjusted R2 of 0.81. Leave-one-out-cross-validation resulted in an R2 of 0.75, indicating good performance on unseen data. Maximum VIF was 11.2 for the slope–length interaction, which is relatively high but expected in interaction models. Predictor level VIF was 1.28 indicating no problems with multicollinearity. Slope (β = 0.204, p = 0.008) and length (β = 0.068, p = 0.0032) were found to have significant positive effects on erosion rates. Furthermore, there was a significant negative interaction between slope and length (β = −0.006, p = 0.002), indicating that the effect of slope on erosion rate decreases with increasing slope length. Location was also shown to affect erosion rates, with VFO (β = 0.578, p = 4.01 × 10⁻⁹) showing significantly higher erosion compared to the reference location (FEA).
Table 6.
Results of the linear model examining the effects of slope, length, and location on the erosion rate. The table shows the estimated regression coefficients (β), standard errors (SE), t-statistics (t), and p-values (p) for each predictor.
4. Discussion
4.1. DTM Construction and Accuracy Assessment
All DTMs had a resolution finer than 0.02 m. These results were similar to previous studies in agricultural orchards, although resolution is highly dependent on several factors such as flight altitude, camera resolution, and overlap between images [54,55]. A comparison of the 2025 DTMs with the GPS transects showed large differences in RMSE between study areas. Furthermore, it showed that RMSE values were much lower in vineyards than in olive groves. This result was expected as areas where a larger percentage of the ground is obscured by vegetation canopy have been shown to yield less accurate results in UAV photogrammetry [56,57]. There was a large difference in RMSE values between the two olive orchards, with MOO having much larger values than VFO. This outcome was counterintuitive, as VFO had a higher canopy cover and thus was expected to have higher RMSE values. However, this can be explained by the decrease in RMSE as the number of coregistration points increased. Even so, it was not an obvious outcome that more coregistration points would lead to a lower RMSE, as the 2024 DTMs themselves were models and not true elevation data, and the GPS transects had been surveyed during the 2025 drone flights. However, what separated the 2024 DTMs from the 2025 DTMs was that the 2024 DTMs were directly georeferenced through ground control points while the 2025 DTMS were indirectly georeferenced through alignment with the 2024 DTMs. This shows that georeferencing is crucial for accurate DTM generation, which has also been concluded by previous studies [44,45,57,58]. Furthermore, it suggests that the coregistration process could be enhanced by georeferencing the 2025 DTMs with ground control points, concurrently with alignment to the 2024 DTMs [59].
Comparing coregistration and georeferencing methods showed that, generally, coregistration did not produce better results than georeferencing. VFO3 was the exception, as in this case there was a systematic error in the elevation of the georeferenced DTM. It is possible that this was caused by an error in the georeferencing process, but could also have been caused by errors during the drone survey. In previous studies, coregistration of multitemporal DTMs has mostly been used on larger scales [44,46] and was not often used in small-scale agricultural areas. This study did not show that coregistration was beneficial for erosion monitoring. The use of coregistration on a small scale in agricultural fields proved to be limited, as it was difficult to identify sufficient areas that did not undergo any elevation change. Furthermore, whereas on larger scales, areas such as rocky outcrops can be used as coregistration points [46], coregistration in the study areas had to rely on singular rocks or other small features. It cannot be said with certainty that there was no elevation change in these features. If a coregistration point had an elevation change between the 2024 and 2025 drone flights, it could have introduced an additional error into the model. As such, the placement of permanent ground control points that remain in the study areas for the duration of monitoring could reduce the uncertainty of elevation changes in control points, reduce the error introduced by unknown elevation changes, and improve the accuracy of the DTMs [59,60].
4.2. DTM Erosion Estimation
It was not possible to accurately estimate the soil erosion in the plots, as the estimated erosion only had an R2 of 0.22 compared to the measured erosion. The accuracy in this study was much lower than in other studies using a similar approach, although specific R2 values were not reported [61]. The accuracy of the DTMs and error propagation to the DoDs could be largely responsible for the low accuracy in erosion estimations. As the total measured erosion in most of the plots did not exceed 0.2 tons per hectare, the actual elevation changes in the plots were far below the 95% Level of Detection threshold. This becomes clear when the measured erosion is expressed as depth of topsoil loss (calculated as weight/(bulk density × area)). For example, 207 g of sediment was measured in plot FEA1. This would equal a depth of 0.0000011 m (0.207 kg/(1530 kg/m3 × 122 m2)) when divided over the plot, which is less than the 95% LoD for this plot, which was 0.117 m. Similarly, plot MOV9 yielded 78 g of erosion, equivalent to a depth of 0.0000006 m (0.078 kg/(1830 kg/m3 × 75 m2)) when divided over the plot, which was smaller than the 95% LoD of 0.211 m. These calculations show that there was so little erosion in some of the plots that detection was impossible. This was also true for plots in the VFO area, where higher erosion rates were measured, but no erosion was found in the DoDs, as the 95% LoD was also larger in this area. This explains why no erosion was found in many of the plots. However, it does not explain why, in some plots, a net deposition was found, despite the plots being closed, nor does it explain why the erosion of some plots was greatly overestimated.
The net deposition was likely caused by a combination of outliers in the DTMs and vegetation growth, which has been shown to significantly affect erosion estimates in previous studies [62]. While the filtering of vegetation with the VARI was able to remove most vegetation, some ground vegetation was not detected and was included in the erosion estimations. If these areas with unfiltered vegetation grew during the study period, they would contribute to the deposition in the DoDs. As erosion rates were low in most plots, even small patches of unfiltered vegetation could cause a net deposition at the plot scale. The plots with greatly overestimated erosion were all found in the VFO study area. Here, a systematic difference between the two DTMs caused the 2025 DTM to be lower than the 2024 DTM, despite the coregistration. It is most likely that this systematic error was caused by the dense canopy and ground vegetation cover during the 2025 flights and ultimately shows the limitations of UAV photogrammetry in densely vegetated areas [56,57].
Another important factor explaining the low accuracy of the soil erosion estimations in this study is the natural seasonality of soil erosion in Mediterranean climates. Several studies have shown that under Mediterranean conditions, soil erosion varies strongly with season, with higher erosion occurring when vegetation cover is low and intense rainfall events occurring after prolonged dry periods. In comparison, there are low erosion rates during wetter seasons with more vegetation cover. For instance, Ferreira and Panagopoulos (2014) used the Revised Universal Soil Loss Equation (RUSLE) approach and found that the highest predicted soil erosion rates occurred in autumn, contributing approximately 65% of the total annual erosion due to reduced vegetation cover after the dry summer, while predicted erosion in winter was much lower (≈7% of the total) despite relatively high rainfall erosivity during that season [63]. These findings suggest that the November–April period of the current study may be inherently less erosive in Mediterranean agricultural systems because the soil is wetter and less repellent and vegetation cover typically increases after early autumn rains, reducing the susceptibility of soil to detachment and transport [64].
While the erosion measured in the field was used as ground truth data in this study, it is important to recognize that these measurements also contain a degree of error compared to the actual erosion. One source of error in measured erosion could be wind erosion, which can significantly influence soil loss in runoff plots [65]. Errors in sediment sampling, either due to equipment or human error, could also influence the error in the measured erosion [66]. Nearing et al. (1999) [52] stated that there is a high variability in measured erosion for similar plots, and that this variability increases as erosion rates decrease. This variability also affects the evaluation of soil erosion models. As the acceptable relative difference between estimated and measured erosion becomes larger according to Nearing’s occurrence intervals, many of the relative differences between measured and predicted erosion in this study fell within the 95% occurrence intervals, resulting in an effectiveness coefficient of 0.45. The occurrence intervals allow the determination of the performance of erosion estimations while taking this variability into account. As erosion rates become lower, the variability between erosion plots increases, which makes Nearing’s occurrence intervals especially relevant in studies with low erosion rates. This became evident from this study’s erosion estimations, as even though the R2 of the DoD estimations was only 0.22, just less than half of the estimations could be considered acceptable according to the 95% occurrence intervals. This shows that it becomes more difficult to estimate erosion through DoDs or erosion models at lower erosion rates.
4.3. Interpreting Treatment and Area Effects
The mixed linear models showed no significant differences between treatments and control for any of the investigated variables. As such, application of mulch or mulch with biochar did not affect the measured variables at the time of this study. Previous studies have shown that the effectiveness of mulch and biochar changes over time [67,68,69], although the exact timeframe for which the application is effective is unknown. This could explain why there were no significant differences between treatments in this study. However, most studies on the long-term effects of mulch and biochar were focused on post-fire applications, and no literature for vineyards and olive groves was found, indicating a knowledge gap. As the treatments were applied one year before this study, it cannot be determined if they had any effect closer to the time of application.
The mixed linear models showed some differences in the measured variables between some of the study areas. In case of vegetation cover, differences could be explained by management factors that distinguished the study areas. For example, organic farming has been shown to lead to higher winter vegetation cover in olive orchards compared to non-organic farming [70]. Furthermore, vegetation cover has been shown to be generally higher in olive groves compared to vineyards [71]. Differences in erosion rate could be explained by the fact that erosion was found to be much higher in VFO compared to all other study areas.
Calculating Minimum Detectable Effect (α = 0.05, power = 80%) showed that the experimental setup was able to detect differences of 1.25 standard deviations or larger, which translates to differences of 0.94 t/ha for erosion rate, 0.19 m for Random Roughness, and 16% or 31% for 2024 and 2025 vegetation cover, respectively. This indicates that the experimental setup was underpowered to detect small to moderate differences. As such, non-significant effects should be seen as evidence against large treatment differences rather than evidence of no effect at all. However, given that the treatment sum of squares in all mixed linear models were (extremely) small relative to location effects, the absence of statistical significance is unlikely to be only a consequence of low power. The results suggest that if any true treatment effects were present, they would be small compared to the variability between locations.
4.4. Implications of Linear Regression Findings
The multiple linear regression showed that a large proportion of variability in measured erosion could be explained by the predictors. Compared to previous studies, the regression model performed similarly or better than comparable models in other studies [72,73,74], but they did not perform as well as some studies using more advanced machine learning algorithms [73]. For example, Arnaez et al. (2007) achieved an R2 of 0.74 in vineyards, with other studies achieving similar scores through multiple regression [74]. However, Sahour et al. (2021) showed that it was possible to achieve better results using deep learning (R2 = 0.95) or boosted regression trees (R2 = 0.99) compared to multiple linear regression (R2 = 0.77) [73]. It is important to note that the aforementioned studies were conducted on a larger scale and over a longer time frame, and that no literature was found that used more complex machine learning techniques to investigate erosion for similar areas and time frames as those in this study.
The regression model showed that erosion rates in the study area were primarily driven by slope, slope length, and their interaction. The significant negative interaction between slope and slope length indicated that the effect of slope on erosion is decreased when the slope length increases. This could also explain why there was a significant difference in erosion rates between VFO and the other study areas, as slopes were generally steeper in this area and plots were of similar length or shorter.
The plot area was not found to be important for the variation in measured erosion. The measured erosion in the regression models was given as an erosion rate in tons/ha, meaning that the plot area is already considered in the response variable. It is to be expected that if the response variable were given in total weight, the plot area could be a more important predictor. In the literature, some studies have reported a significant connection between plot area and erosion rates. Larger plots could lead to a reduction in measured erosion rates due to more possibilities of sediment deposition within the plot [75,76]. Erosion rates could increase due to more erosion processes taking place at larger scales or due to a larger contributing area for runoff generation [10,75]. However, the analysis shows that these factors did not significantly affect erosion rates in this study. Scale effects for differences within the plot scale have been reported for smaller differences than those in this study [10,77]. The area may become a more relevant predictor for erosion when the differences in area and subsequent scale effects become larger [78].
The regression analysis did not show that ground cover had a significant effect on the erosion rate. This is not in line with findings of other studies, who reported that higher ground cover often leads to decreased erosion rates [79,80,81,82,83,84,85]. Differences in vegetation cover among the study sites were primarily driven by differences in agricultural management, while variation in vegetation cover within individual study areas was limited. As a result, ground cover may not have shown a significant independent effect in the model as much of the variation in vegetation cover was already included in the location variable. Since location was included as a categorical predictor and was found to be a significant factor influencing erosion rates, it likely reflects site-specific characteristics, including differences in vegetation cover. As such, the influence of ground cover on erosion rates could have been partially accounted for by the location variable in the regression model.
As the slope and plot length interaction is comparable to the LS factor of the USLE model, the regression analysis showed that erosion in the study areas was mostly influenced by the LS and factors. Furthermore, in the second-best model, ground cover (C factor) was included. These findings are in line with previous research, which states that the C and LS factors are the most important for the determination of soil loss potential [86,87]. This also becomes apparent from studies focusing on the Mediterranean [88]. López-Vicente & Navas (2009) state that “the C factor contributed most to variability; the LS and K factors contributed in a similar way” [88]. In this study, bulk density could be seen as a proxy for the erodibility (K) factor, as it has been shown that bulk density can partly explain variations in the K factor [89]. Interestingly, bulk density did not significantly correlate with erosion and was therefore not included as a possible predictor in the regression analysis, suggesting that the erodibility factor did not have a significant impact on erosion. It could be possible that bulk density was not a good proxy for the erodibility factor, as the high stoniness of Mediterranean soils has been shown to have a large impact on the erodibility [90]. The inclusion of the soil stone fraction in the regression analysis could have been a better representative of the K factor, especially considering that the high stoniness of Mediterranean soils is one of the main causes of low erosion rates in the Mediterranean [5,76].
4.5. Limitations
The erosion estimations were most likely influenced by disturbances that were specific to this study, including disturbance through tractor passages and disturbance from soil sampling. The tractor passages that occasionally took place compressed soil in the ruts, and pushing soil sideways caused the edges of the ruts to rise [91,92]. In the VFO area, rills were starting to form in some ruts during one field visit. However, during the next field visit, these rills had disappeared due to compression caused by a tractor passage, and as such, the rills were no longer present during the 2025 drone flights and not visible on the 2025 DTMs. The tractor passages had another effect in the MOO area, where the soil was disturbed to such an extent that it was difficult to find any coregistration points. Furthermore, it was not known where and how often tractor passages occurred. In January, some students visited the study areas to collect soil samples for their research. This resulted in several holes per plot, which have appeared in the 2025 DTMs as erosion and could have affected the erosion estimates.
This study used a Level of Detection threshold to differentiate between real elevation changes and noise. The downside of this methodology is that the smallest changes are discarded as noise, while they could have been actual elevation changes [49]. In this study, this would have limited the erosion estimations as there were mostly low elevation changes due to the low erosion rates. While many studies assume the same error for every cell of a DTM, in reality, the error is spatially distributed and is dependent on topographic parameters such as slope and roughness, as well as on data quality parameters such as point density [46]. Wheaton et al. (2010) [49] proposed the use of a fuzzy inference system to make a spatial model of DTM error by using parameters that have been shown to influence the DTM error as inputs and showed that this led to an improvement in sediment budgets. In future studies, it could be beneficial to include spatially distributed errors in the erosion estimation, especially in areas with low erosion rates, to ensure that small, real elevation changes are not discarded as noise.
Vegetation cover was a limiting factor in the olive orchards, resulting in high RMSE values. The canopy cover of the olive trees caused the area below the trees to be obscured, which caused holes in the DTM under the trees, even though oblique photographs were added during the DTM generation process. In these areas, the use of a LIDAR scanner would lead to better results, as LIDAR scanners can penetrate vegetation and have multiple returns, although they are generally more expensive [57,93].
The high RMSE values of the DTMs were the factor that ultimately limited the DoD erosion estimations the most. Besides causing higher RMSE values, vegetation cover also limited the results by causing outliers in the DoDs, which further impacted the erosion estimates. The other limitations had less impact on the estimations, as even without disturbances, the erosion estimates would have been poor. If RMSE values had been much lower, disturbances caused by tractor passages and sampling would have had a larger impact on the results, especially since erosion rates were low. While the limitations discussed in this section severely impacted the erosion estimation, they did not have a big impact on the results of the ANOVA analysis or the regression models.
5. Conclusions
This study investigated the use of UAVs for erosion monitoring in Mediterranean agricultural orchards by direct measurement of elevation differences using DTMs of Difference, and through the derivation of explanatory variables for erosion and multiple linear regression. Furthermore, this study investigated the use of coregistration to improve DoD estimates and reduce model error. Additionally, this study used UAV remote sensing to determine the effects of the application of mulch and mulch with biochar on erosion and other variables.
The main conclusions of this study are summarized below:
- Comparison between coregistration and georeferencing methods showed that coregistration did not lead to an improvement in DTM error compared to traditional georeferencing.
- The high RMSE values of the DTMs prevented accurate estimation of erosion with the DoDs, also because of low erosion rates during the study period.
- The mixed linear models showed no differences between the control, mulch, and mulch with biochar treatments. Only differences between areas were found, which could mostly be attributed to the type of agriculture and management in the study areas.
- The regression models were able to explain a large part of the variation in measured erosion and showed that a combination of slope and slope length were the primary drivers behind soil erosion.
Supplementary Materials
The following supporting information can be downloaded at: https://www.mdpi.com/article/10.3390/agronomy16060645/s1 and https://zenodo.org/records/18599366.
Author Contributions
Conceptualization, T.d.P., S.P., J.P.N. and A.P.; methodology, S.P.; software, T.d.P. and A.P.; validation, T.d.P., A.P. and S.P.; formal analysis, T.d.P., A.P., S.P. and J.N.G.V.C.; investigation, T.d.P., J.N.G.V.C., L.C. and S.P.; resources, S.P. and J.P.N.; data curation, T.d.P., J.N.G.V.C., A.P. and S.P.; writing—original draft preparation, T.d.P. and J.P.N.; writing—review and editing, T.d.P., S.P., J.N.G.V.C., L.C. and J.P.N.; visualization, T.d.P., A.P. and S.P.; supervision, S.P. and J.P.N.; project administration, S.P.; funding acquisition, S.P. All authors have read and agreed to the published version of the manuscript.
Funding
This research was funded by Portuguese Funds through the PRR under the SOLVIT sub-project (SOLVIT–Vine & Wine Portugal C644866286-00000011) and through FCT under the Project SOLVO (https://www.solvo.uevora.pt; https://doi.org/10.54499/2022.06004.PTDC; accessed on 10 September 2025) and MED–Mediterranean Institute for Agriculture, Environment and Development (https://doi.org/10.54499/UID/05183/2025) and CHANGE–Global Change and Sustainability Institute (https://doi.org/10.54499/LA/P/0121/2020) research units. Sergio Prats was supported by the Spanish The Ministry of Science, Innovation and Universities through the research contract RYC2022-035489-I.
Data Availability Statement
The original data presented in the study are openly available in https://doi.org/10.5281/zenodo.18599365, accessed on 12 March 2026.
Acknowledgments
We want to acknowledge the support of the managers and owners of the orchards—Carolina Sardinha, Iain Richardson, José Limpo, Pedro Ostos, André Pilirito and Ana Sampaio—for their help and contribution to the development of this research. Luísa Coelho thanks to Algarve 2030, Portugal 2030, and the European Union under the scope of AlgaeBoost—Support for the Boost and Development of GreenCoLab’s Institutional Capacity in the Area of Sustainable Blue Biotechnology, ALGARVE-FSE+-01493100.
Conflicts of Interest
Author Anton Pijl was employed by the company Cambisol. The remaining authors declare that the research was conducted in the absence of any commercial or financial relationships that could be construed as a potential conflict of interest.
References
- Borrelli, P.; Robinson, D.A.; Fleischer, L.R.; Lugato, E.; Ballabio, C.; Alewell, C.; Meusburger, K.; Modugno, S.; Schütt, B.; Ferro, V.; et al. An Assessment of the Global Impact of 21st Century Land Use Change on Soil Erosion. Nat. Commun. 2017, 8, 2013. [Google Scholar] [CrossRef] [Scilit] [PubMed]
- Ferreira, C.S.S.; Seifollahi-Aghmiuni, S.; Destouni, G.; Ghajarnia, N.; Kalantari, Z. Soil Degradation in the European Mediterranean Region: Processes, Status and Consequences. Sci. Total Environ. 2022, 805, 150106. [Google Scholar] [CrossRef] [Scilit] [PubMed]
- Cerdà, A.; Rodrigo-Comino, J.; Novara, A.; Brevik, E.C.; Vaezi, A.R.; Pulido, M.; Giménez-Morera, A.; Keesstra, S.D. Long-Term Impact of Rainfed Agricultural Land Abandonment on Soil Erosion in the Western Mediterranean Basin. Progress. Phys. Geogr. Earth Environ. 2018, 42, 202–219. [Google Scholar] [CrossRef] [Scilit]
- Halbac-Cotoara-Zamfir, R.; Smiraglia, D.; Quaranta, G.; Salvia, R.; Salvati, L.; Giménez-Morera, A. Land Degradation and Mitigation Policies in the Mediterranean Region: A Brief Commentary. Sustainability 2020, 12, 8313. [Google Scholar] [CrossRef] [Scilit]
- Cerdan, O.; Govers, G.; Le Bissonnais, Y.; Van Oost, K.; Poesen, J.; Saby, N.; Gobin, A.; Vacca, A.; Quinton, J.; Auerswald, K.; et al. Rates and Spatial Variations of Soil Erosion in Europe: A Study Based on Erosion Plot Data. Geomorphology 2010, 122, 167–177. [Google Scholar] [CrossRef] [Scilit]
- Malvar, M.C.; Prats, S.A.; Keizer, J.J. Runoff and Inter-Rill Erosion Affected by Wildfire and Pre-Fire Ploughing in Eucalypt Plantations of North-Central Portugal. Land Degrad. Dev. 2016, 27, 1366–1378. [Google Scholar] [CrossRef] [Scilit]
- Kosmas, C.; Danalatos, N.; Cammeraat, L.H.; Chabart, M.; Diamantopoulos, J.; Farand, R.; Gutierrez, L.; Jacob, A.; Marques, H.; Martinez-Fernandez, J.; et al. The Effect of Land Use on Runoff and Soil Erosion Rates under Mediterranean Conditions. Catlna 1997, 29, 45–59. [Google Scholar] [CrossRef] [Scilit]
- Rodrigo Comino, J.; Senciales, J.M.; Ramos, M.C.; Martínez-Casasnovas, J.A.; Lasanta, T.; Brevik, E.C.; Ries, J.B.; Ruiz Sinoga, J.D. Understanding Soil Erosion Processes in Mediterranean Sloping Vineyards (Montes de Málaga, Spain). Geoderma 2017, 296, 47–59. [Google Scholar] [CrossRef] [Scilit]
- Vanwalleghem, T.; Amate, J.I.; de Molina, M.G.; Fernández, D.S.; Gómez, J.A. Quantifying the Effect of Historical Soil Management on Soil Erosion Rates in Mediterranean Olive Orchards. Agric. Ecosyst. Environ. 2011, 142, 341–351. [Google Scholar] [CrossRef] [Scilit]
- Daimonakos, V.; Zinderen, A.V.; Muñoz-Rojas, J.; Costa, D.; Nunes, J.P.; Prats, S.A. How Strongly Do Management Practices and Scales Influence Soil Erosion Rates in Olive Orchards? Empirical Evidence from Alentejo (Portugal). Geoderma 2026, 466, 117673. [Google Scholar] [CrossRef] [Scilit]
- Fraga, H.; Santos, J.A. Vineyard Mulching as a Climate Change Adaptation Measure: Future Simulations for Alentejo, Portugal. Agric. Syst. 2018, 164, 107–115. [Google Scholar] [CrossRef] [Scilit]
- Valverde, P.; Serralheiro, R.; de Carvalho, M.; Maia, R.; Oliveira, B.; Ramos, V. Climate Change Impacts on Irrigated Agriculture in the Guadiana River Basin (Portugal). Agric. Water Manag. 2015, 152, 17–30. [Google Scholar] [CrossRef] [Scilit]
- Du, X.; Jian, J.; Du, C.; Stewart, R.D. Conservation Management Decreases Surface Runoff and Soil Erosion. Int. Soil Water Conserv. Res. 2022, 10, 188–196. [Google Scholar] [CrossRef] [Scilit]
- Steinhoff-Knopp, B.; Kuhn, T.K.; Burkhard, B. The Impact of Soil Erosion on Soil-Related Ecosystem Services: Development and Testing a Scenario-Based Assessment Approach. Environ. Monit. Assess. 2021, 193, 274. [Google Scholar] [CrossRef] [Scilit] [PubMed]
- Issaka, S.; Ashraf, M.A. Impact of Soil Erosion and Degradation on Water Quality: A Review. Geol. Ecol. Landsc. 2017, 1, 1–11. [Google Scholar] [CrossRef] [Scilit]
- Cerdà, A.; Novara, A.; Moradi, E. Long-Term Non-Sustainable Soil Erosion Rates and Soil Compaction in Drip-Irrigated Citrus Plantation in Eastern Iberian Peninsula. Sci. Total Environ. 2021, 787, 147549. [Google Scholar] [CrossRef] [Scilit]
- Rey Benayas, J.M.; Martins, A.; Nicolau, J.M.; Schulz, J.J. Abandonment of Agricultural Land: An Overview of Drivers and Consequences. CABI Rev. 2007, 2, 1–14. [Google Scholar] [CrossRef] [Scilit]
- Rodrigo-Comino, J.; Martínez-Hernández, C.; Iserloh, T.; Cerdà, A. Contrasted Impact of Land Abandonment on Soil Erosion in Mediterranean Agriculture Fields. Pedosphere 2018, 28, 617–631. [Google Scholar] [CrossRef] [Scilit]
- Quintas-Soriano, C.; Torralba, M.; García-Martín, M.; Plieninger, T. Narratives of Land Abandonment in a Biocultural Landscape of Spain. Reg. Environ. Change 2023, 23, 144. [Google Scholar] [CrossRef] [Scilit]
- Cárceles Rodríguez, B.; Zuazo, V.H.D.; Rodríguez, M.S.; Ruiz, B.G.; García-Tejero, I.F. Soil Erosion and the Efficiency of the Conservation Measures in Mediterranean Hillslope Farming (SE Spain). Eurasian Soil Sci. 2021, 54, 792–806. [Google Scholar] [CrossRef] [Scilit]
- Sepuru, T.K.; Dube, T. An Appraisal on the Progress of Remote Sensing Applications in Soil Erosion Mapping and Monitoring. Remote Sens. Appl. 2018, 9, 1–9. [Google Scholar] [CrossRef] [Scilit]
- Vrieling, A. Satellite Remote Sensing for Water Erosion Assessment: A Review. Catena 2006, 65, 2–18. [Google Scholar] [CrossRef] [Scilit]
- Smith, M.W.; Vericat, D. From Experimental Plots to Experimental Landscapes: Topography, Erosion and Deposition in Sub-humid Badlands from Structure-from-Motion Photogrammetry. Earth Surf. Process. Landf. 2015, 40, 1656–1671. [Google Scholar] [CrossRef] [Scilit]
- Eltner, A.; Baumgart, P.; Maas, H.; Faust, D. Multi-temporal UAV Data for Automatic Measurement of Rill and Interrill Erosion on Loess Soil. Earth Surf. Process. Landf. 2015, 40, 741–755. [Google Scholar] [CrossRef] [Scilit]
- Wang, J.; Yang, J.; Li, Z.; Ke, L.; Li, Q.; Fan, J.; Wang, X. Research on Soil Erosion Based on Remote Sensing Technology: A Review. Agriculture 2024, 15, 18. [Google Scholar] [CrossRef] [Scilit]
- Nouwakpo, S.K.; James, M.R.; Weltz, M.A.; Huang, C.; Chagas, I.; Lima, L. Evaluation of Structure from Motion for Soil Microtopography Measurement. Photogramm. Rec. 2014, 29, 297–316. [Google Scholar] [CrossRef] [Scilit]
- Wang, H.; Pang, G.; Yang, Q.; Long, Y.; Wang, L.; Wang, C.; Hu, S.; Wang, Z.; Yang, A. Effects of Slope Shape on Soil Erosion and Deposition Patterns Based on SfM-UAV Photogrammetry. Geoderma 2024, 451, 117076. [Google Scholar] [CrossRef] [Scilit]
- Meinen, B.U.; Robinson, D.T. Agricultural Erosion Modelling: Evaluating USLE and WEPP Field-Scale Erosion Estimates Using UAV Time-Series Data. Environ. Model. Softw. 2021, 137, 104962. [Google Scholar] [CrossRef] [Scilit]
- Bazzoffi, P. Measurement of Rill Erosion through a New UAV-GIS Methodology. Ital. J. Agron. 2015, 10, 1–18. [Google Scholar] [CrossRef] [Scilit]
- Fan, L.; Atkinson, P.M. A New Multi-Resolution Based Method for Estimating Local Surface Roughness from Point Clouds. ISPRS J. Photogramm. Remote Sens. 2018, 144, 369–378. [Google Scholar] [CrossRef] [Scilit]
- Martínez-Murillo, J.F.; Nadal-Romero, E.; Regüés, D.; Cerdà, A.; Poesen, J. Soil Erosion and Hydrology of the Western Mediterranean Badlands throughout Rainfall Simulation Experiments: A Review. Catena 2013, 106, 101–112. [Google Scholar] [CrossRef] [Scilit]
- Li, Z.; Fang, H. Impacts of Climate Change on Water Erosion: A Review. Earth Sci. Rev. 2016, 163, 94–117. [Google Scholar] [CrossRef] [Scilit]
- Carollo, F.G.; Di Stefano, C.; Ferro, V.; Pampalone, V. Measuring Rill Erosion at Plot Scale by a Drone-based Technology. Hydrol. Process. 2015, 29, 3802–3811. [Google Scholar] [CrossRef] [Scilit]
- Malinowski, R.; Heckrath, G.; Rybicki, M.; Eltner, A. Mapping Rill Soil Erosion in Agricultural Fields with UAV-borne Remote Sensing Data. Earth Surf. Process. Landf. 2023, 48, 596–612. [Google Scholar] [CrossRef] [Scilit]
- Straffelini, E.; Pijl, A.; Otto, S.; Marchesini, E.; Pitacco, A.; Tarolli, P. A High-Resolution Physical Modelling Approach to Assess Runoff and Soil Erosion in Vineyards under Different Soil Managements. Soil Tillage Res. 2022, 222, 105418. [Google Scholar] [CrossRef] [Scilit]
- Guo, X.; Shao, Q.; Luo, Y. Effects of Different Management Measures on Soil Conservation and the Influence of Environmental Conditions: A Case Study Involving UAV Remote Sensing on the Loess Plateau. Remote Sens. Ecol. Conserv. 2022, 8, 683–697. [Google Scholar] [CrossRef] [Scilit]
- Rodrigues, B.T.; Zema, D.A.; González-Romero, J.; Rodrigues, M.T.; Campos, S.; Galletero, P.; Plaza-Álvarez, P.A.; Lucas-Borja, M.E. The Use of Unmanned Aerial Vehicles (UAVs) for Estimating Soil Volumes Retained by Check Dams after Wildfires in Mediterranean Forests. Soil Syst. 2021, 5, 9. [Google Scholar] [CrossRef] [Scilit]
- Coelho, L.; Canedo, J.N.G.V.; Custódio, M.; Flores, D.; Mourão, P.; Palma, P.; Prats, S.A. Feedstock and Pyrolysis Conditions of Biochars: Influence on Soil Phytotoxicity and Water Ecotoxicity. Soil Biol. Biochem. 2025, 211, 109935. [Google Scholar] [CrossRef] [Scilit]
- Canedo, J.N.G.V.; Coelho, L.; Castro, L.; Verheijen, F.G.A.; Prats, S. Biochar and Mulch: Hydrologic, Erosive, and Phytotoxic Responses Across Different Application Strategies and Agricultural Soils. Agronomy 2025, 15, 926. [Google Scholar] [CrossRef] [Scilit]
- Rodríguez Sousa, A.A.; Muñoz-Rojas, J.; Brígido, C.; Prats, S.A. Impacts of Agricultural Intensification on Soil Erosion and Sustainability of Olive Groves in Alentejo (Portugal). Landsc. Ecol. 2023, 38, 3479–3498. [Google Scholar] [CrossRef] [Scilit]
- Pierini, M.; Harjivan, S.G.; Sieli, N.; Cabrita, M.J.; Prats, S.; Catarino, S.; Ricardo-da-Silva, J.M. Effect of Organic Soil Amendments and Vineyard Topographic Position on the Chemical Composition of Syrah, Trincadeira, Alicante Bouschet, and Antão Vaz Grapes (Vitis vinifera L.) in the Alentejo Wine Region. Environments 2026, 13, 44. [Google Scholar] [CrossRef] [Scilit]
- Robichaud, P.R.; Brown, R.E. Silt Fences: An Economical Technique for Measuring Hillslope Soil Erosion; U.S. Department of Agriculture, Forest Service, Rocky Mountain Research Station: Fort Collins, CO, USA, 2002.
- Agisoft LLC. Agisoft Metashape User Manual Professional Edition, Version 1.7; Agisoft LLC: St. Petersburg, Russia, 2021. [Google Scholar]
- Cucchiaro, S.; Cavalli, M.; Vericat, D.; Crema, S.; Llena, M.; Beinat, A.; Marchi, L.; Cazorzi, F. Monitoring Topographic Changes through 4D-Structure-from-Motion Photogrammetry: Application to a Debris-Flow Channel. Environ. Earth Sci. 2018, 77, 632. [Google Scholar] [CrossRef] [Scilit]
- De Marco, J.; Maset, E.; Cucchiaro, S.; Beinat, A.; Cazorzi, F. Assessing Repeatability and Reproducibility of Structure-from-Motion Photogrammetry for 3D Terrain Mapping of Riverbeds. Remote Sens. 2021, 13, 2572. [Google Scholar] [CrossRef] [Scilit]
- Cucchiaro, S.; Maset, E.; Cavalli, M.; Crema, S.; Marchi, L.; Beinat, A.; Cazorzi, F. How Does Co-Registration Affect Geomorphic Change Estimates in Multi-Temporal Surveys? GIsci. Remote Sens. 2020, 57, 611–632. [Google Scholar] [CrossRef] [Scilit]
- Dai, W.; Qian, W.; Liu, A.; Wang, C.; Yang, X.; Hu, G.; Tang, G. Monitoring and Modeling Sediment Transport in Space in Small Loess Catchments Using UAV-SfM Photogrammetry. Catena 2022, 214, 106244. [Google Scholar] [CrossRef] [Scilit]
- He, Y.; Lei, S.; Dai, W.; Chen, X.; Wang, B.; Sheng, Y.; Lin, H. DEM-Based Topographic Change Detection Considering the Spatial Distribution of Errors. Geo-Spat. Inf. Sci. 2024, 28, 497–510. [Google Scholar] [CrossRef] [Scilit]
- Wheaton, J.M.; Brasington, J.; Darby, S.E.; Sear, D.A. Accounting for Uncertainty in DEMs from Repeat Topographic Surveys: Improved Sediment Budgets. Earth Surf. Process. Landf. 2010, 35, 136–156. [Google Scholar] [CrossRef] [Scilit]
- James, M.R.; Robson, S.; Smith, M.W. 3-D Uncertainty-based Topographic Change Detection with Structure-from-motion Photogrammetry: Precision Maps for Ground Control and Directly Georeferenced Surveys. Earth Surf. Process. Landf. 2017, 42, 1769–1788. [Google Scholar] [CrossRef] [Scilit]
- Gitelson, A.A.; Stark, R.; Grits, U.; Rundquist, D.; Kaufman, Y.; Derry, D. Vegetation and Soil Lines in Visible Spectral Space: A Concept and Technique for Remote Estimation of Vegetation Fraction. Int. J. Remote Sens. 2002, 23, 2537–2562. [Google Scholar] [CrossRef] [Scilit]
- Nearing, M.A.; Govers, G.; Norton, D.L. Variability in Soil Erosion Data from Replicated Plots. Soil Sci. Soc. Am. 1999, 63, 1829–1835. [Google Scholar] [CrossRef] [Scilit]
- Nearing, M.A. Evaluating Soil Erosion Models Using Measured Plot Data: Accounting for Variability in the Data. Earth Surf. Process. Landf. 2000, 25, 1035–1043. [Google Scholar]
- Pichon, L.; Ducanchez, A.; Fonta, H.; Tisseyre, B. Quality of Digital Elevation Models Obtained from Unmanned Aerial Vehicles for Precision Viticulture. OENO One 2016, 50, 101–111. [Google Scholar] [CrossRef] [Scilit]
- Santesteban, L.G.; Guillaume, S.; Royo, J.B.; Tisseyre, B. Are Precision Agriculture Tools and Methods Relevant at the Whole-Vineyard Scale? Precis. Agric. 2013, 14, 2–17. [Google Scholar] [CrossRef] [Scilit]
- Crespo-Peremarch, P.; Torralba, J.; Carbonell-Rivera, J.P.; Ruiz, L.A. Comparing the Generation of DTM in a Forest Ecosystem Using TLS, ALS and UAV-DAP, and Different Software Tools. Int. Arch. Photogramm. Remote Sens. Spat. Inf. Sci. 2020, XLIII-B3-2020, 575–582. [Google Scholar] [CrossRef] [Scilit]
- Salach, A.; Bakuła, K.; Pilarska, M.; Ostrowski, W.; Górski, K.; Kurczyński, Z. Accuracy Assessment of Point Clouds from LiDAR and Dense Image Matching Acquired Using the UAV Platform for DTM Creation. ISPRS Int. J. Geoinf. 2018, 7, 342. [Google Scholar] [CrossRef] [Scilit]
- Jiménez-Jiménez, S.I.; Ojeda-Bustamante, W.; Marcial-Pablo, M.; Enciso, J. Digital Terrain Models Generated with Low-Cost UAV Photogrammetry: Methodology and Accuracy. ISPRS Int. J. Geoinf. 2021, 10, 285. [Google Scholar] [CrossRef] [Scilit]
- Meinen, B.U.; Robinson, D.T. Mapping Erosion and Deposition in an Agricultural Landscape: Optimization of UAV Image Acquisition Schemes for SfM-MVS. Remote Sens. Environ. 2020, 239, 111666. [Google Scholar] [CrossRef] [Scilit]
- Laporte-Fauret, Q.; Marieu, V.; Castelle, B.; Michalet, R.; Bujan, S.; Rosebery, D. Low-Cost UAV for High-Resolution and Large-Scale Coastal Dune Change Monitoring Using Photogrammetry. J. Mar. Sci. Eng. 2019, 7, 63. [Google Scholar] [CrossRef] [Scilit]
- Arriola-Valverde, S.; Villalobos-Avellan, L.C.; Villagra-Mendoza, K.; Rimolo-Donadio, R. Erosion Quantification in Runoff Agriculture Plots by Multitemporal High-Resolution UAS Digital Photogrammetry. IEEE J. Sel. Top. Appl. Earth Obs. Remote Sens. 2020, 13, 6326–6336. [Google Scholar] [CrossRef] [Scilit]
- Vinci, A.; Brigante, R.; Vergni, L. Soil Loss Estimation Under Different Soil Management Using a Multispectral UAV. In Proceedings of the 2024 IEEE International Workshop on Metrology for Agriculture and Forestry (MetroAgriFor); IEEE: New York, NY, USA, 2024; pp. 382–386. [Google Scholar]
- Ferreira, V.; Panagopoulos, T. Seasonality of Soil Erosion Under Mediterranean Conditions at the Alqueva Dam Watershed. Environ. Manag. 2014, 54, 67–83. [Google Scholar] [CrossRef] [Scilit]
- Prats, S.A.; Wagenbrenner, J.W.; Martins, M.A.S.; Malvar, M.C.; Keizer, J.J. Hydrologic Implications of Post-Fire Mulching Across Different Spatial Scales. Land Degrad. Dev. 2016, 27, 1440–1452. [Google Scholar] [CrossRef] [Scilit]
- Marzen, M.; Iserloh, T.; Fister, W.; Seeger, M.; Rodrigo-Comino, J.; Ries, J.B. On-Site Water and Wind Erosion Experiments Reveal Relative Impact on Total Soil Erosion. Geosciences 2019, 9, 478. [Google Scholar] [CrossRef] [Scilit]
- Zöbisch, M.A.; Klingspor, P.; Oduor, A.R. The Accuracy of Manual Runoff and Sediment Sampling from Erosion Plots. J. Soil Water Conserv. 1996, 51, 231–233. [Google Scholar] [CrossRef] [Scilit]
- Fan, D.; Jia, G.; Wang, Y.; Yu, X. The Effectiveness of Mulching Practices on Water Erosion Control: A Global Meta-Analysis. Geoderma 2023, 438, 116643. [Google Scholar] [CrossRef] [Scilit]
- Gholamahmadi, B.; Jeffery, S.; Gonzalez-Pelayo, O.; Prats, S.A.; Bastos, A.C.; Keizer, J.J.; Verheijen, F.G.A. Biochar Impacts on Runoff and Soil Erosion by Water: A Systematic Global Scale Meta-Analysis. Sci. Total Environ. 2023, 871, 161860. [Google Scholar] [CrossRef] [Scilit]
- Xiong, M.; Sun, R.; Chen, L. Effects of Soil Conservation Techniques on Water Erosion Control: A Global Analysis. Sci. Total Environ. 2018, 645, 753–760. [Google Scholar] [CrossRef] [Scilit]
- Solomou, A.D.; Sfougaris, A.I.; Kalburtji, K.L.; Nanos, G.D. Effects of Organic Farming on Winter Plant Composition, Cover and Diversity in Olive Grove Ecosystems in Central Greece. Commun. Soil Sci. Plant Anal. 2013, 44, 312–319. [Google Scholar] [CrossRef] [Scilit]
- Panagos, P.; Borrelli, P.; Meusburger, K.; Alewell, C.; Lugato, E.; Montanarella, L. Estimating the Soil Erosion Cover-Management Factor at the European Scale. Land Use Policy 2015, 48, 38–50. [Google Scholar] [CrossRef] [Scilit]
- Shi, Z.H.; Ai, L.; Li, X.; Huang, X.D.; Wu, G.L.; Liao, W. Partial Least-Squares Regression for Linking Land-Cover Patterns to Soil Erosion and Sediment Yield in Watersheds. J. Hydrol. 2013, 498, 165–176. [Google Scholar] [CrossRef] [Scilit]
- Sahour, H.; Gholami, V.; Vazifedan, M.; Saeedi, S. Machine Learning Applications for Water-Induced Soil Erosion Modeling and Mapping. Soil Tillage Res. 2021, 211, 105032. [Google Scholar] [CrossRef] [Scilit]
- Arnaez, J.; Lasanta, T.; Ruiz-Flaño, P.; Ortigosa, L. Factors Affecting Runoff and Erosion under Simulated Rainfall in Mediterranean Vineyards. Soil Tillage Res. 2007, 93, 324–334. [Google Scholar] [CrossRef] [Scilit]
- Boix-Fayos, C.; Martínez-Mena, M.; Arnau-Rosalén, E.; Calvo-Cases, A.; Castillo, V.; Albaladejo, J. Measuring Soil Erosion by Field Plots: Understanding the Sources of Variation. Earth Sci. Rev. 2006, 78, 267–285. [Google Scholar] [CrossRef] [Scilit]
- Bagarello, V.; Ferro, V.; Keesstra, S.; Comino, J.R.; Pulido, M.; Cerdà, A. Testing Simple Scaling in Soil Erosion Processes at Plot Scale. Catena 2018, 167, 171–180. [Google Scholar] [CrossRef] [Scilit]
- Moreno-de las Heras, M.; Nicolau, J.M.; Merino-Martín, L.; Wilcox, B.P. Plot-scale Effects on Runoff and Erosion along a Slope Degradation Gradient. Water Resour. Res. 2010, 46, W04503. [Google Scholar] [CrossRef] [Scilit]
- Wu, S.; Chen, L.; Wang, N.; Zhang, J.; Wang, S.; Bagarello, V.; Ferro, V. Variable Scale Effects on Hillslope Soil Erosion during Rainfall-Runoff Processes. Catena 2021, 207, 105606. [Google Scholar] [CrossRef] [Scilit]
- Di Stefano, C.; Ferro, V.; Burguet, M.; Taguas, E.V. Testing the Long Term Applicability of USLE-M Equation at a Olive Orchard Microcatchment in Spain. Catena 2016, 147, 71–79. [Google Scholar] [CrossRef] [Scilit]
- Nearing, M.A.; Jetten, V.; Baffaut, C.; Cerdan, O.; Couturier, A.; Hernandez, M.; Le Bissonnais, Y.; Nichols, M.H.; Nunes, J.P.; Renschler, C.S.; et al. Modeling Response of Soil Erosion and Runoff to Changes in Precipitation and Cover. Catena 2005, 61, 131–154. [Google Scholar] [CrossRef] [Scilit]
- Nunes, A.N.; de Almeida, A.C.; Coelho, C.O.A. Impacts of Land Use and Cover Type on Runoff and Soil Erosion in a Marginal Area of Portugal. Appl. Geogr. 2011, 31, 687–699. [Google Scholar] [CrossRef] [Scilit]
- Zhou, P.; Luukkanen, O.; Tokola, T.; Nieminen, J. Effect of Vegetation Cover on Soil Erosion in a Mountainous Watershed. Catena 2008, 75, 319–325. [Google Scholar] [CrossRef] [Scilit]
- Zuazo, V.H.D.; Pleguezuelo, C.R.R. Soil-Erosion and Runoff Prevention by Plant Covers: A Review. In Sustainable Agriculture; Springer: Dordrecht, The Netherlands, 2009; pp. 785–811. [Google Scholar]
- Roy, H.G.; Fox, D.M.; Emsellem, K. Impacts of Vineyard Area Dynamics on Soil Erosion in a Mediterranean Catchment (1950–2011). J. Land Use Sci. 2018, 13, 118–129. [Google Scholar] [CrossRef] [Scilit]
- Sharma, H.; Ehlers, T.A. Effects of Seasonal Variations in Vegetation and Precipitation on Catchment Erosion Rates along a Climate and Ecological Gradient: Insights from Numerical Modeling. Earth Surf. Dyn. 2023, 11, 1161–1181. [Google Scholar] [CrossRef] [Scilit]
- Efthimiou, N.; Lykoudi, E.; Psomiadis, E. Inherent Relationship of the USLE, RUSLE Topographic Factor Algorithms and Its Impact on Soil Erosion Modelling. Hydrol. Sci. J. 2020, 65, 1879–1893. [Google Scholar] [CrossRef] [Scilit]
- Hoffmann, A.; da Silva, M.A.; Naves Silva, M.L.; Curi, N.; Klinke, G.; de Freitas, D.A.F. Development of Topographic Factor Modeling for Application in Soil Erosion Models. In Soil Processes and Current Trends in Quality Assessment; InTech: London, UK, 2013. [Google Scholar]
- López-Vicente, M.; Navas, A. Predicting Soil Erosion with RUSLE in Mediterranean Agricultural Systems at Catchment Scale. Soil Sci. 2009, 174, 272–282. [Google Scholar] [CrossRef] [Scilit]
- Pacci, S.; Safli, M.E.; Odabas, M.S.; Dengiz, O. Variation of USLE-K Soil Erodibility Factor and Its Estimation with Artificial Neural Network Approach in Semi-Humid Environmental Condition. Braz. Arch. Biol. Technol. 2023, 66, e23220481. [Google Scholar]
- Panagos, P.; Meusburger, K.; Ballabio, C.; Borrelli, P.; Alewell, C. Soil Erodibility in Europe: A High-Resolution Dataset Based on LUCAS. Sci. Total Environ. 2014, 479–480, 189–200. [Google Scholar] [CrossRef] [Scilit]
- Capello, G.; Biddoccu, M.; Ferraris, S.; Cavallo, E. Effects of Tractor Passes on Hydrological and Soil Erosion Processes in Tilled and Grassed Vineyards. Water 2019, 11, 2118. [Google Scholar] [CrossRef] [Scilit]
- Tolón-Becerra, A.; Botta, G.F.; Lastra-Bravo, X.; Tourn, M.; Rivero, D. Subsoil Compaction from Tractor Traffic in an Olive (Olea europea L.) Grove in Almería, Spain. Soil Use Manag. 2012, 28, 606–613. [Google Scholar] [CrossRef] [Scilit]
- Štroner, M.; Urban, R.; Křemen, T.; Braun, J. UAV DTM Acquisition in a Forested Area–Comparison of Low-Cost Photogrammetry (DJI Zenmuse P1) and LiDAR Solutions (DJI Zenmuse L1). Eur. J. Remote Sens. 2023, 56, 2179942. [Google Scholar] [CrossRef] [Scilit]

Disclaimer/Publisher’s Note: The statements, opinions and data contained in all publications are solely those of the individual author(s) and contributor(s) and not of MDPI and/or the editor(s). MDPI and/or the editor(s) disclaim responsibility for any injury to people or property resulting from any ideas, methods, instructions or products referred to in the content. |
© 2026 by the authors. Licensee MDPI, Basel, Switzerland. This article is an open access article distributed under the terms and conditions of the Creative Commons Attribution (CC BY) license.