


Abstract
Soil erosion intensifies the redistribution and loss of soil nutrients. However, how erosion–deposition processes shape the spatial patterns of soil total nitrogen to total phosphorus (TN:TP) ratio in long-term eroded landscapes remains poorly understood. In this study, we examined the spatial variability of TN, TP, and the N:P ratio and their driving factors across a 7-ha sloping black-soil cropland in northeast China. Results showed that mean topsoil concentrations of TN and TP were 1.7 and 0.7 g kg−1, respectively, and the corresponding N:P ratio averaged 5.2, which was 46.6% lower than the Chinese average. Erosion–deposition effects were strongly depth dependent. In the 20–40 cm soil layer, all three variables declined in strongly eroded zones but increased in depositional areas, whereas in the 0–20 cm layer they were lower in depositional zones than in weakly eroded zones, indicating a vertical decoupling of nutrient redistribution under prolonged erosion. Notably, variability in soil N:P was closely associated with TN, soil organic carbon, and silt content, with TN emerging as the dominant control, as reflected by its stronger correlation with N:P (p ≤ 0.001) and higher variability (CV = 21.7–35.8%) relative to TP. Although elevation and slope gradient both influenced N:P spatial variability, only elevation showed a significant negative correlation (p ≤ 0.05). These findings indicate that, compared with TP, TN is more sensitive to long-term soil erosion and deposition and dominates the spatial pattern of the N:P ratio. The enhanced role of TN may increase the risk of N limitation in eroded farmlands. This study provides insights into the mechanisms of nutrient imbalance in eroded black soil regions and offers a scientific basis for formulating targeted soil conservation and fertility enhancement measures.
1. Introduction
Nitrogen (N) and phosphorus (P) are key structural elements and essential nutrients in soils, governing terrestrial biogeochemical cycling and ecosystem functioning through their regulation of soil properties, plant productivity, and microbial processes [1,2]. Relative to single-element contents, the soil N:P ratio provides an integrative metric of soil fertility dynamics and nutrient-limitation regimes [3]. Lower N:P ratios are commonly associated with N limitation or relative P enrichment, and thus soil N:P is widely regarded as a stoichiometric indicator that is highly responsive to environmental change [4,5].
Soil erosion represents a major environmental disturbance in agricultural ecosystems worldwide and is widely recognized as a key process shaping soil N, P, and their stoichiometric relationships. Previous studies have shown that erosion is tightly coupled with N and P cycling, generating lateral fluxes comparable in magnitude to those associated with crop harvest removal and fertilizer inputs [6,7]. It is estimated that average annual losses of TN and TP on China’s Loess Plateau reach 118 and 255 kg ha−1, respectively [8]. Erosion-induced losses of total nitrogen (TN) and total phosphorus (TP) primarily arise from particle detachment, transport, and deposition, processes that drive both the spatial redistribution and export of soil materials [9]. Frequently observed patterns show that eroding positions tend to export nutrient-rich fine particles, resulting in sustained depletion of TN and TP, whereas depositional positions retain nutrient-bearing sediments and therefore exhibit relatively higher nutrient stocks and N:P ratios [10,11]. However, over longer timescales, sustained erosion can further amplify hillslope-scale nutrient heterogeneity and may alter these simplified erosion–deposition patterns. Accordingly, a systematic evaluation of hillslope-scale soil N, P, and their stoichiometric spatial patterns under long-term erosion is warranted.
Multiple studies have indicated that the spatial heterogeneity of soil TN, TP, and their stoichiometric ratio in erosion-prone landscapes is closely linked to both topographic conditions and soil properties [12]. As a key topographic feature in erosion-prone regions, slope gradient regulates runoff dynamics and sediment transport, thereby controlling the detachment and redistribution of soil particles and associated nutrients along hillslopes and shaping the spatial distribution patterns of TN and TP [13,14]. In contrast, soil properties often exert a more direct control over nutrient distribution. Fine soil particles serve as major sorbents and carriers of organic N and P and thus play a dominant role in nutrient export and enrichment during selective erosion processes [15,16]. Meanwhile, microbial-mediated soil organic carbon (SOC) turnover regulates N mineralization and availability [17], thereby influencing soil N:P ratios. Nevertheless, given that the interactions among these factors may vary significantly across soil and hydrological regimes, comprehensively understanding the complex drivers governing TN and TP dynamics in erosion-affected landscapes is crucial for optimizing nutrient management strategies in sloping croplands.
The black soil region of northeast China is a major grain-producing area but has experienced pronounced soil erosion and degradation on sloping croplands due to long-term intensive cultivation combined with rolling topography [18,19]. Existing studies indicate that, relative to uncultivated land, TN contents in sloping farmlands within this region have declined by 11.5–22.5% [20], reflecting a persistent erosion-driven weakening of the soil nutrient pool. Despite increasing attention to erosion impacts, research on nutrient loss and its spatial organization in black soil sloping farmlands has largely focused on SOC [21,22,23], whereas systematic evidence for TN, TP, and their stoichiometric ratio remains limited. Moreover, although erosion generally depletes both TN and TP, the relative contributions of N and P to hillslope-scale N:P organization and their differences among slope positions remain poorly resolved.
We hypothesized that (i) long-term soil erosion disrupts the commonly reported pattern of higher nutrient contents in depositional than in eroded zones; (ii) TN and TP exert divergent controls on the distribution of the soil N:P ratio. To test these hypotheses, this study carried out a hillslope-scale observational study based on grid sampling and spatial statistical analyses to assess how erosion–deposition processes influence soil TN, TP, and N:P ratios in a typical long-term eroded cropland in northeast China. By quantifying the spatial patterns of soil TN, TP, and N:P ratios, this study aimed to elucidate the roles of N and P in shaping soil stoichiometric variability under erosion backgrounds. These findings provide a scientific basis for erosion-informed nutrient management in black soil croplands of northeast China.
2. Materials and Methods
2.1. Study Area
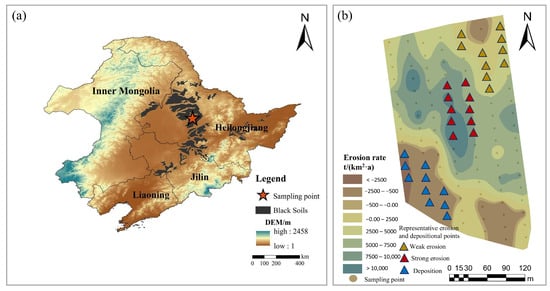
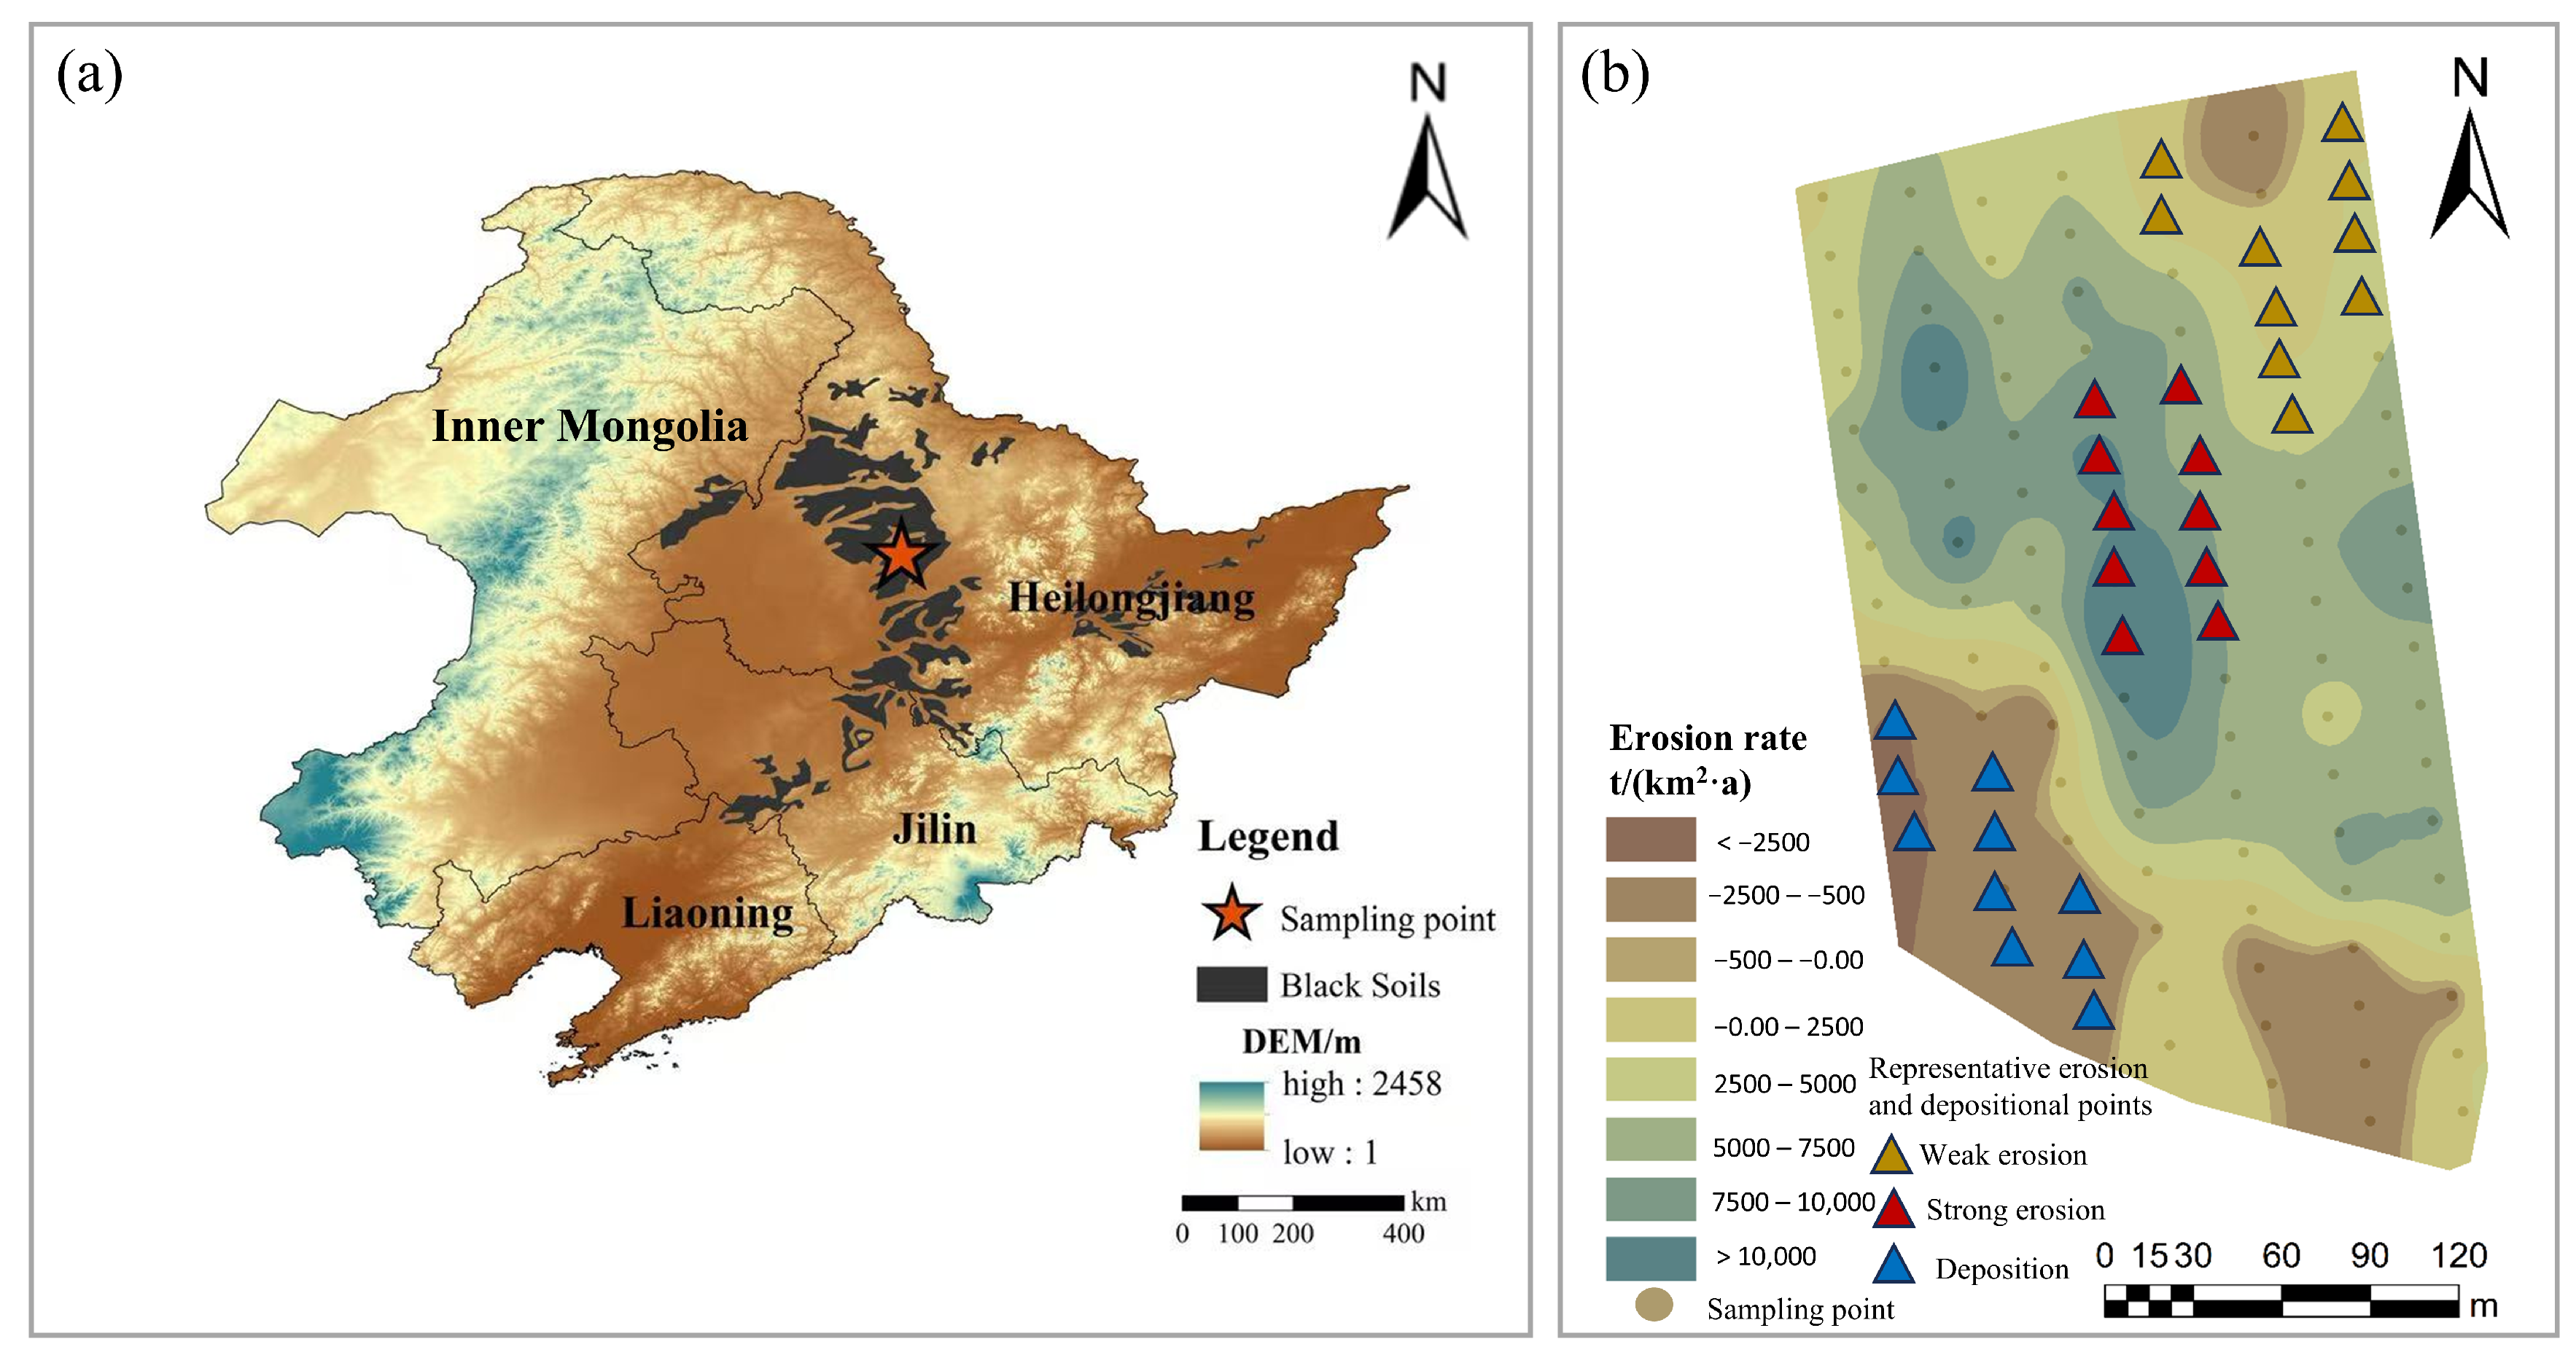
The study was conducted on a representative sloping cropland located in Hailun City, Heilongjiang Province, northeast China (47°23′03″ N, 126°50′39″ E; Figure 1a). The area is characterized by a temperate continental monsoon climate, featuring cold, dry winters and warm, humid summers. Mean annual temperature is approximately 1.5 °C, and mean annual precipitation ranges from 500 to 600 mm, with the majority occurring between June and August. The meteorological data were obtained from the National Meteorological Science Data Center for the period 1961–2021 (http://data.cma.cn, accessed on 12 February 2021). The study site comprises an agricultural hillslope covering approximately 7 ha, with an average slope gradient of about 4° and a maximum slope length of 380 m. The hillslope has experienced severe long-term soil erosion, with a measured mean erosion rate of 4189.2 t km−2 yr−1 [24] (Figure 1b). Sustained erosion has resulted in pronounced spatial differentiation of the black soil layer, with average thicknesses of approximately 35 cm at the upper position, about 20 cm at the mid-position, and exceeding 100 cm at the lower position.
Figure 1.
Location of the study hillslope (a) and spatial distribution of sampling points across the hillslope, with representative erosional and depositional sites indicated (b).
The site has been managed under a continuous maize–soybean rotation with downslope ridge tillage for more than 60 years, with soybean cultivated during the study period. The field was plowed each spring to a depth of approximately 15 cm, and crop residues were completely removed after harvest in late September to early October. Prior to soybean sowing, a single basal application of compound fertilizer (15% N, 15% P2O5, and 15% K2O) was applied at a rate of 250 kg ha−1. No additional fertilization or irrigation was applied during the growing season. The tillage and fertilization regime was uniformly applied across the hillslope. According to the USDA Soil Taxonomy [25], soils at the site are classified as Mollisols. The soils were slightly acidic and fine-textured, with their basic properties detailed in Table 1.
Table 1.
Descriptive statistics and results of t-tests for soil properties between two soil layers based on 110 grid-based sampling points across the hillslope.
2.2. Topographic Attributes and Delineation of Erosion–Deposition Zones
In October 2022, topographic data of the study hillslope were acquired using a handheld GPS receiver (Trimble Geo7X, Sunnyvale, CA, USA) integrated with a real-time kinematic (RTK) system. The collected elevation data were used to generate a high-resolution digital elevation model (DEM) of the hillslope. Based on the DEM, a total of 110 sampling locations were established across the slope using a regular 20 m × 30 m grid. Elevation and slope gradient were extracted for each sampling point and used as key topographic variables in subsequent analyses.
Delineation of erosion–deposition zones was undertaken according to erosion rates reported in our previous study at the same hillslope [24]. These erosion rates were measured at the same 110 grid sampling points used in this study; therefore, each soil sampling location has a directly corresponding erosion/deposition rate. Following the Soil Erosion Classification and Grading Standard of China (SL 190–2007), all sampling points were categorized into three erosion–deposition classes: (i) weakly eroded zones (200–2500 t km−2 yr−1), (ii) strongly eroded zones (5000–15,000 t km−2 yr−1), and (iii) depositional zones (<0 t km−2 yr−1). For comparisons among weakly eroded, strongly eroded, and depositional zones, ten representative sampling points were selected within each class to ensure comparable sample sizes across categories and to avoid bias arising from unequal class representation and spatial autocorrelation. These points were chosen to capture the typical characteristics of each zone and were distributed across upper-, mid-, and lower-slope positions (Figure 1b). Importantly, hillslope-scale spatial analyses were conducted using the full dataset (n = 110), whereas inter-zone comparisons were performed using the representative points.
2.3. Soil Sample Collection and Analysis
Soil sampling was conducted in October 2022 at 110 grid-based locations across the hillslope. At each location, five subsamples were collected from two depths (0–20 and 20–40 cm) and composited to form one representative sample per depth. Additionally, undisturbed soil cores were collected at each sampling point and oven-dried at 105 °C to constant weight for the determination of bulk density (BD) and soil moisture (SM). Disturbed soil samples were air-dried and sieved through a 2-mm mesh prior to analysis. Soil pH was measured in deionized water at a soil-to-solution ratio of 1:2.5 using a pH meter (HI 3221, Hanna Instruments Inc., Woonsocket, RI, USA). Soil texture was determined using the pipette method based on the sedimentation principle (Stokes’ law) after removal of organic matter with H2O2. Cation exchange capacity (CEC) was measured following ammonium acetate extraction. SOC and TN were quantified using an elemental CN analyzer. Total phosphorus (TP) was determined after acid digestion and measured using the molybdenum blue colorimetric method. Total potassium (TK) was measured using a flame photometer. Method blanks and external standards were run alongside the samples, and a subset of samples was re-analyzed in duplicate to verify analytical precision and accuracy. The soil N:P ratio was calculated on a molar basis after converting TN and TP concentrations to mmol kg−1 [3].
2.4. Statistical Analysis
All statistical analyses were conducted using SPSS 20.0 (IBM Corp., Armonk, NY, USA) and R software (version 4.3.2) [26]. Prior to statistical testing, data normality was evaluated with the Shapiro-Wilk test and homoscedasticity with a Levene’s test. The effects of erosion intensity and soil depth on soil TN, TP, and N:P ratios were examined using two-way ANOVA, with significance determined at p ≤ 0.05.
Spatial autocorrelation of soil TN, TP, and N:P was evaluated using Moran’s I [27]. Moran’s I ranges from −1 to 1, where negative values indicate spatial dispersion, values around 0 indicate a random spatial pattern, and positive values indicate spatial clustering; statistical significance was assessed at p ≤ 0.05. The spatial structure of TN, TP, and N:P was further characterized using semivariogram analysis. The degree of spatial dependence was quantified as the proportion of structured variance to total variance, expressed as C/(C0 + C), where C0 and C represent the nugget and structural variance, respectively. Following Cambardella et al. [28], C/(C0 + C) values <0.25, 0.25–0.75, and >0.75 were interpreted as weak, moderate, and strong spatial dependence. Experimental semivariograms were fitted using spherical, exponential, and Gaussian models. The optimal model for each variable was selected by comparing candidate models based on lower residual sum of squares (RSS) and higher coefficient of determination (R2). Model performance was further assessed using leave-one-out cross-validation, with prediction errors evaluated to ensure unbiased and stable spatial interpolation. Ordinary Kriging was applied to interpolate and map the spatial distributions of soil TN, TP, and N:P across the hillslope based on the fitted semivariogram models. Semivariogram fitting was implemented in GS+ 9.0, and spatial autocorrelation and Kriging interpolation were performed in ArcGIS 10.8 (Esri, Redlands, CA, USA).
Mantel tests were used to evaluate the relationships between soil N:P ratios and topographic factors as well as soil physicochemical properties. These analyses were conducted in R using the vegan package (version 2.7–2) [29], and correlation patterns were visualized using the ggcor package (version 0.9.8) [30].
3. Results
3.1. Soil TN and TP Across the Hillslope
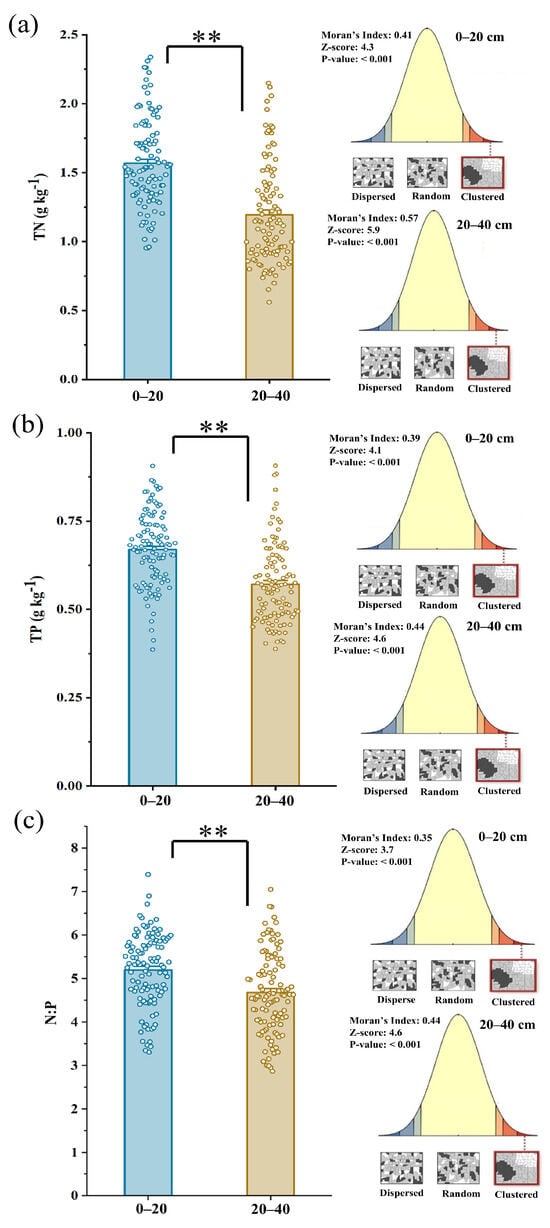
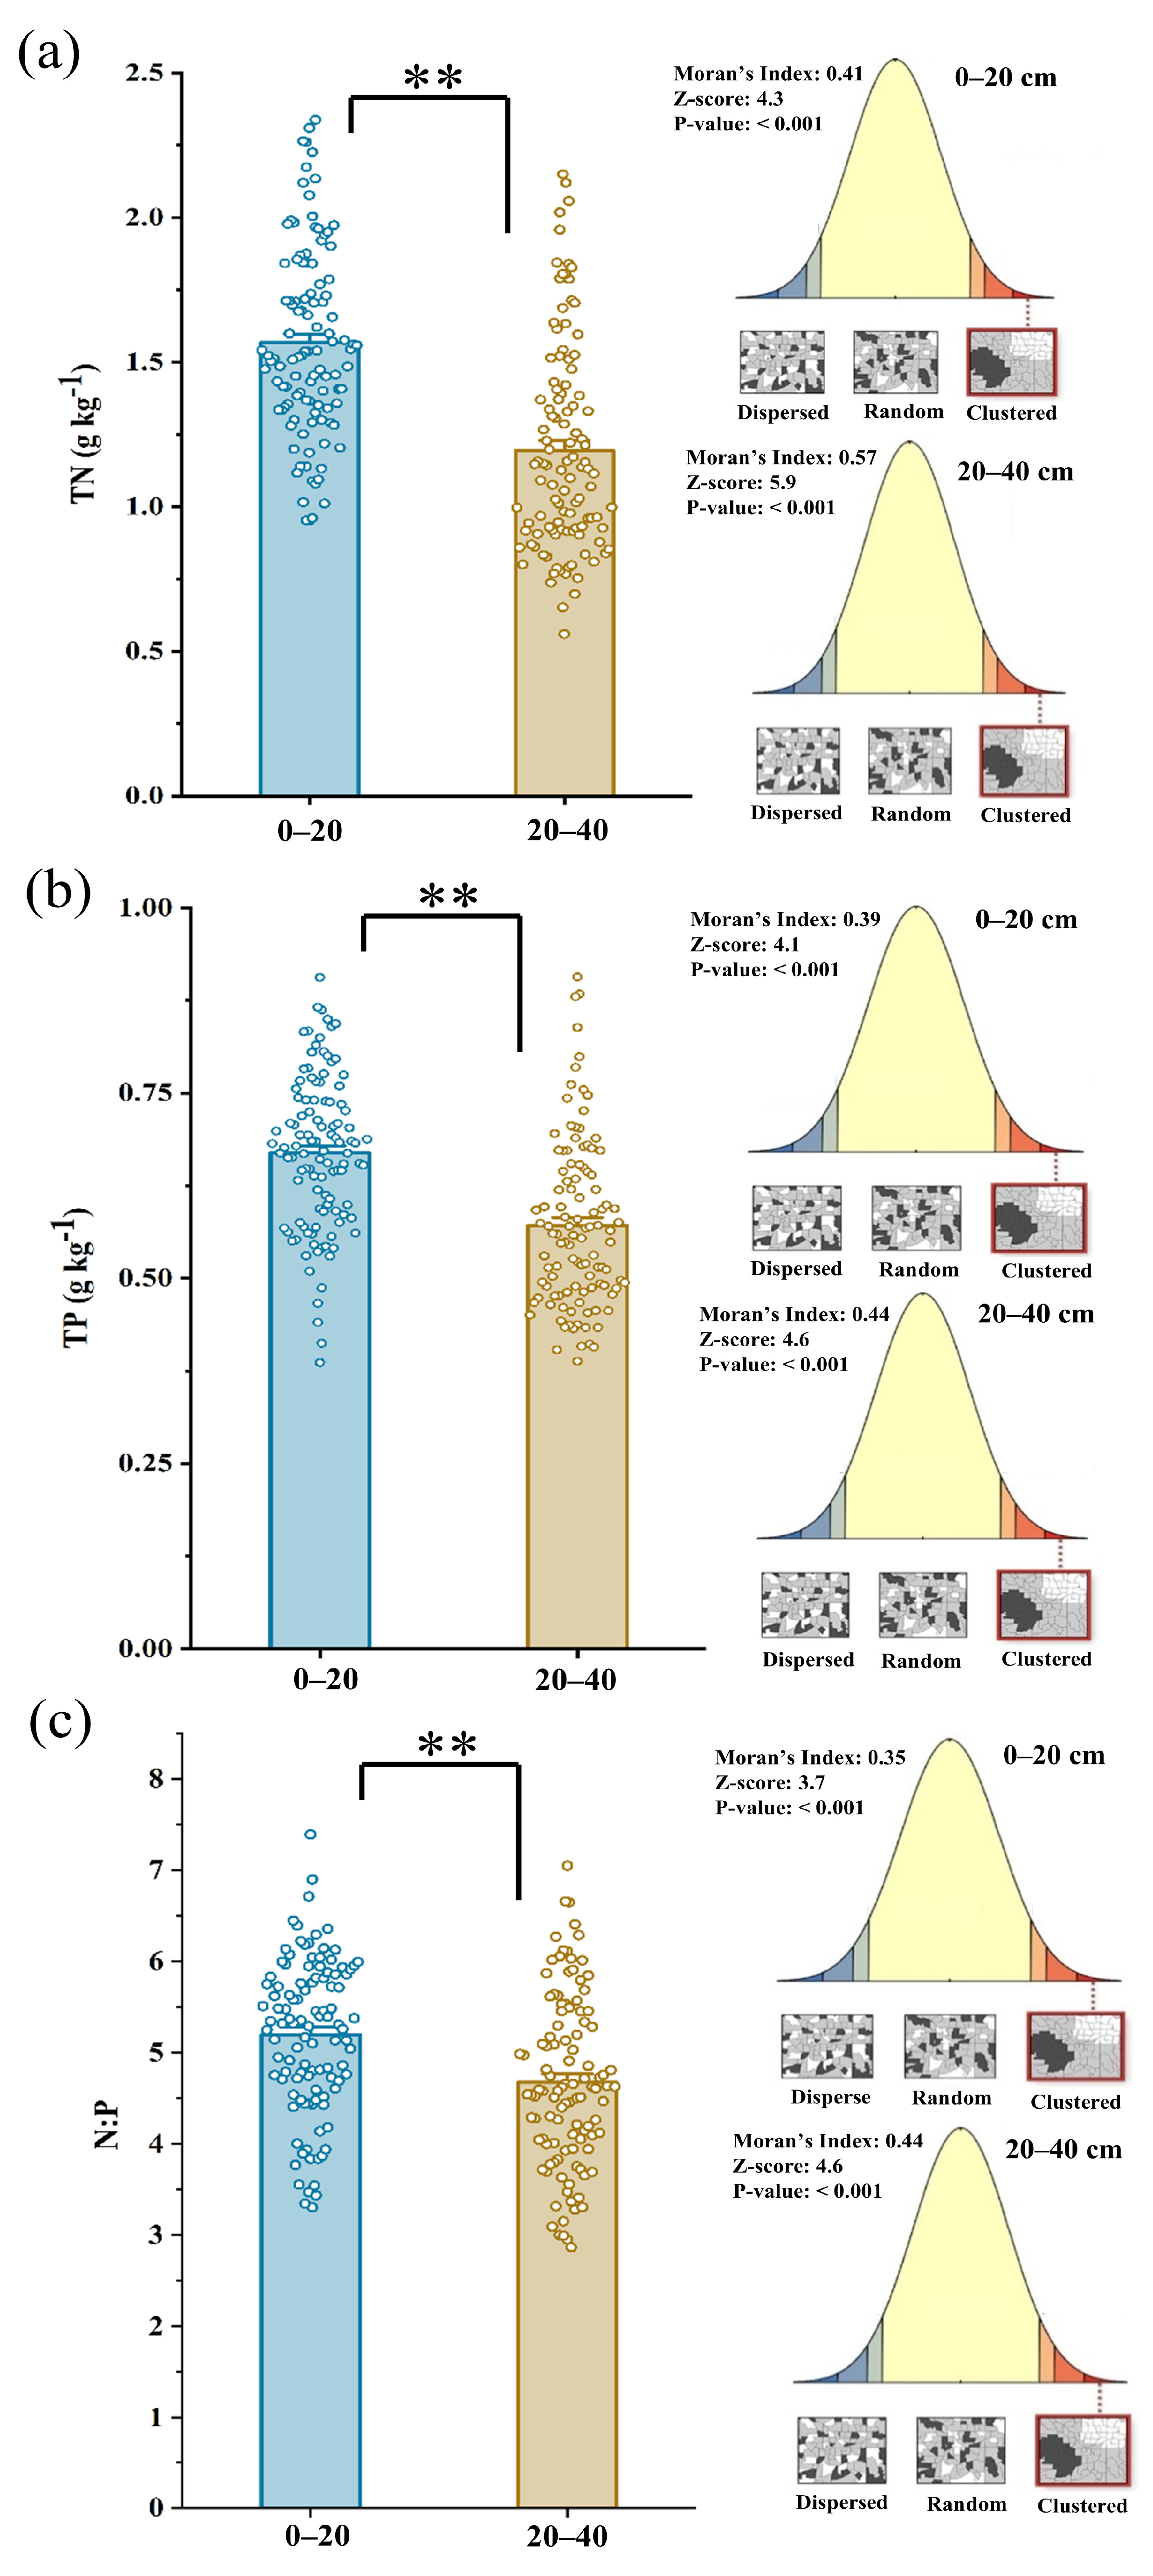
TN and TP differed significantly between the two soil layers along the hillslope (Table 1; Figure 2). Mean TN and TP concentrations in the topsoil were 1.7 g kg−1 and 0.7 g kg−1, respectively, which were significantly higher than those in the subsoil by 31.1% and 17.1%. In contrast, the subsoil showed higher CVs for both TN and TP, indicating greater spatial heterogeneity relative to the topsoil. A similar vertical pattern was observed for the N:P ratio, with mean values of 5.2 in the topsoil, exceeding that in the subsoil by 11.1%.
Figure 2.
Mean concentrations and hillslope-scale Moran’s Index spatial autocorrelation of TN (a) TP (b) and N:P ratio (c) at 0–20 and 20–40 cm. “**” denotes significant differences at p ≤ 0.01 between soil depths.
3.2. Spatial Distribution Patterns of TN and TP
Spatial autocorrelation analyses indicated significant clustering of TN, TP, and N:P ratio across the hillslope (Figure 2). Z scores for TN, TP, and N:P were 4.3, 4.1, and 4.6, respectively, with p ≤ 0.01, and Moran’s I values were consistently positive at both soil depths. Semivariogram modeling further quantified spatial dependence and its scale (Table 2). TN and TP were best fitted by exponential models at both depths, whereas N:P fitted a Gaussian model in the topsoil and an exponential model in the subsoil. Spatial dependence was moderate in the topsoil (C/(C0 + C) = 0.53–0.66) and strong in the subsoil (>0.75).
Table 2.
Semivariogram models and relative parameters of soil N, P, and N:P ratio of the hillslope.
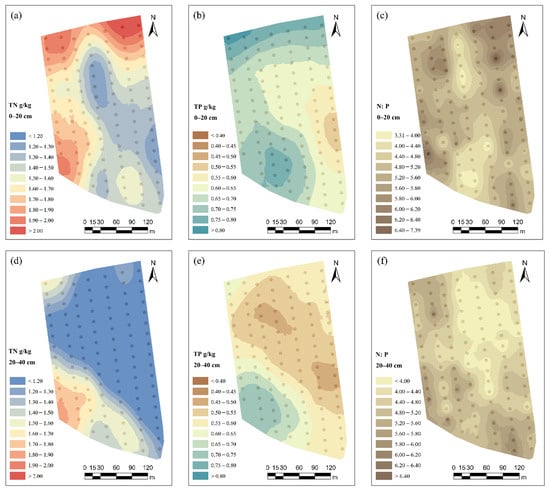
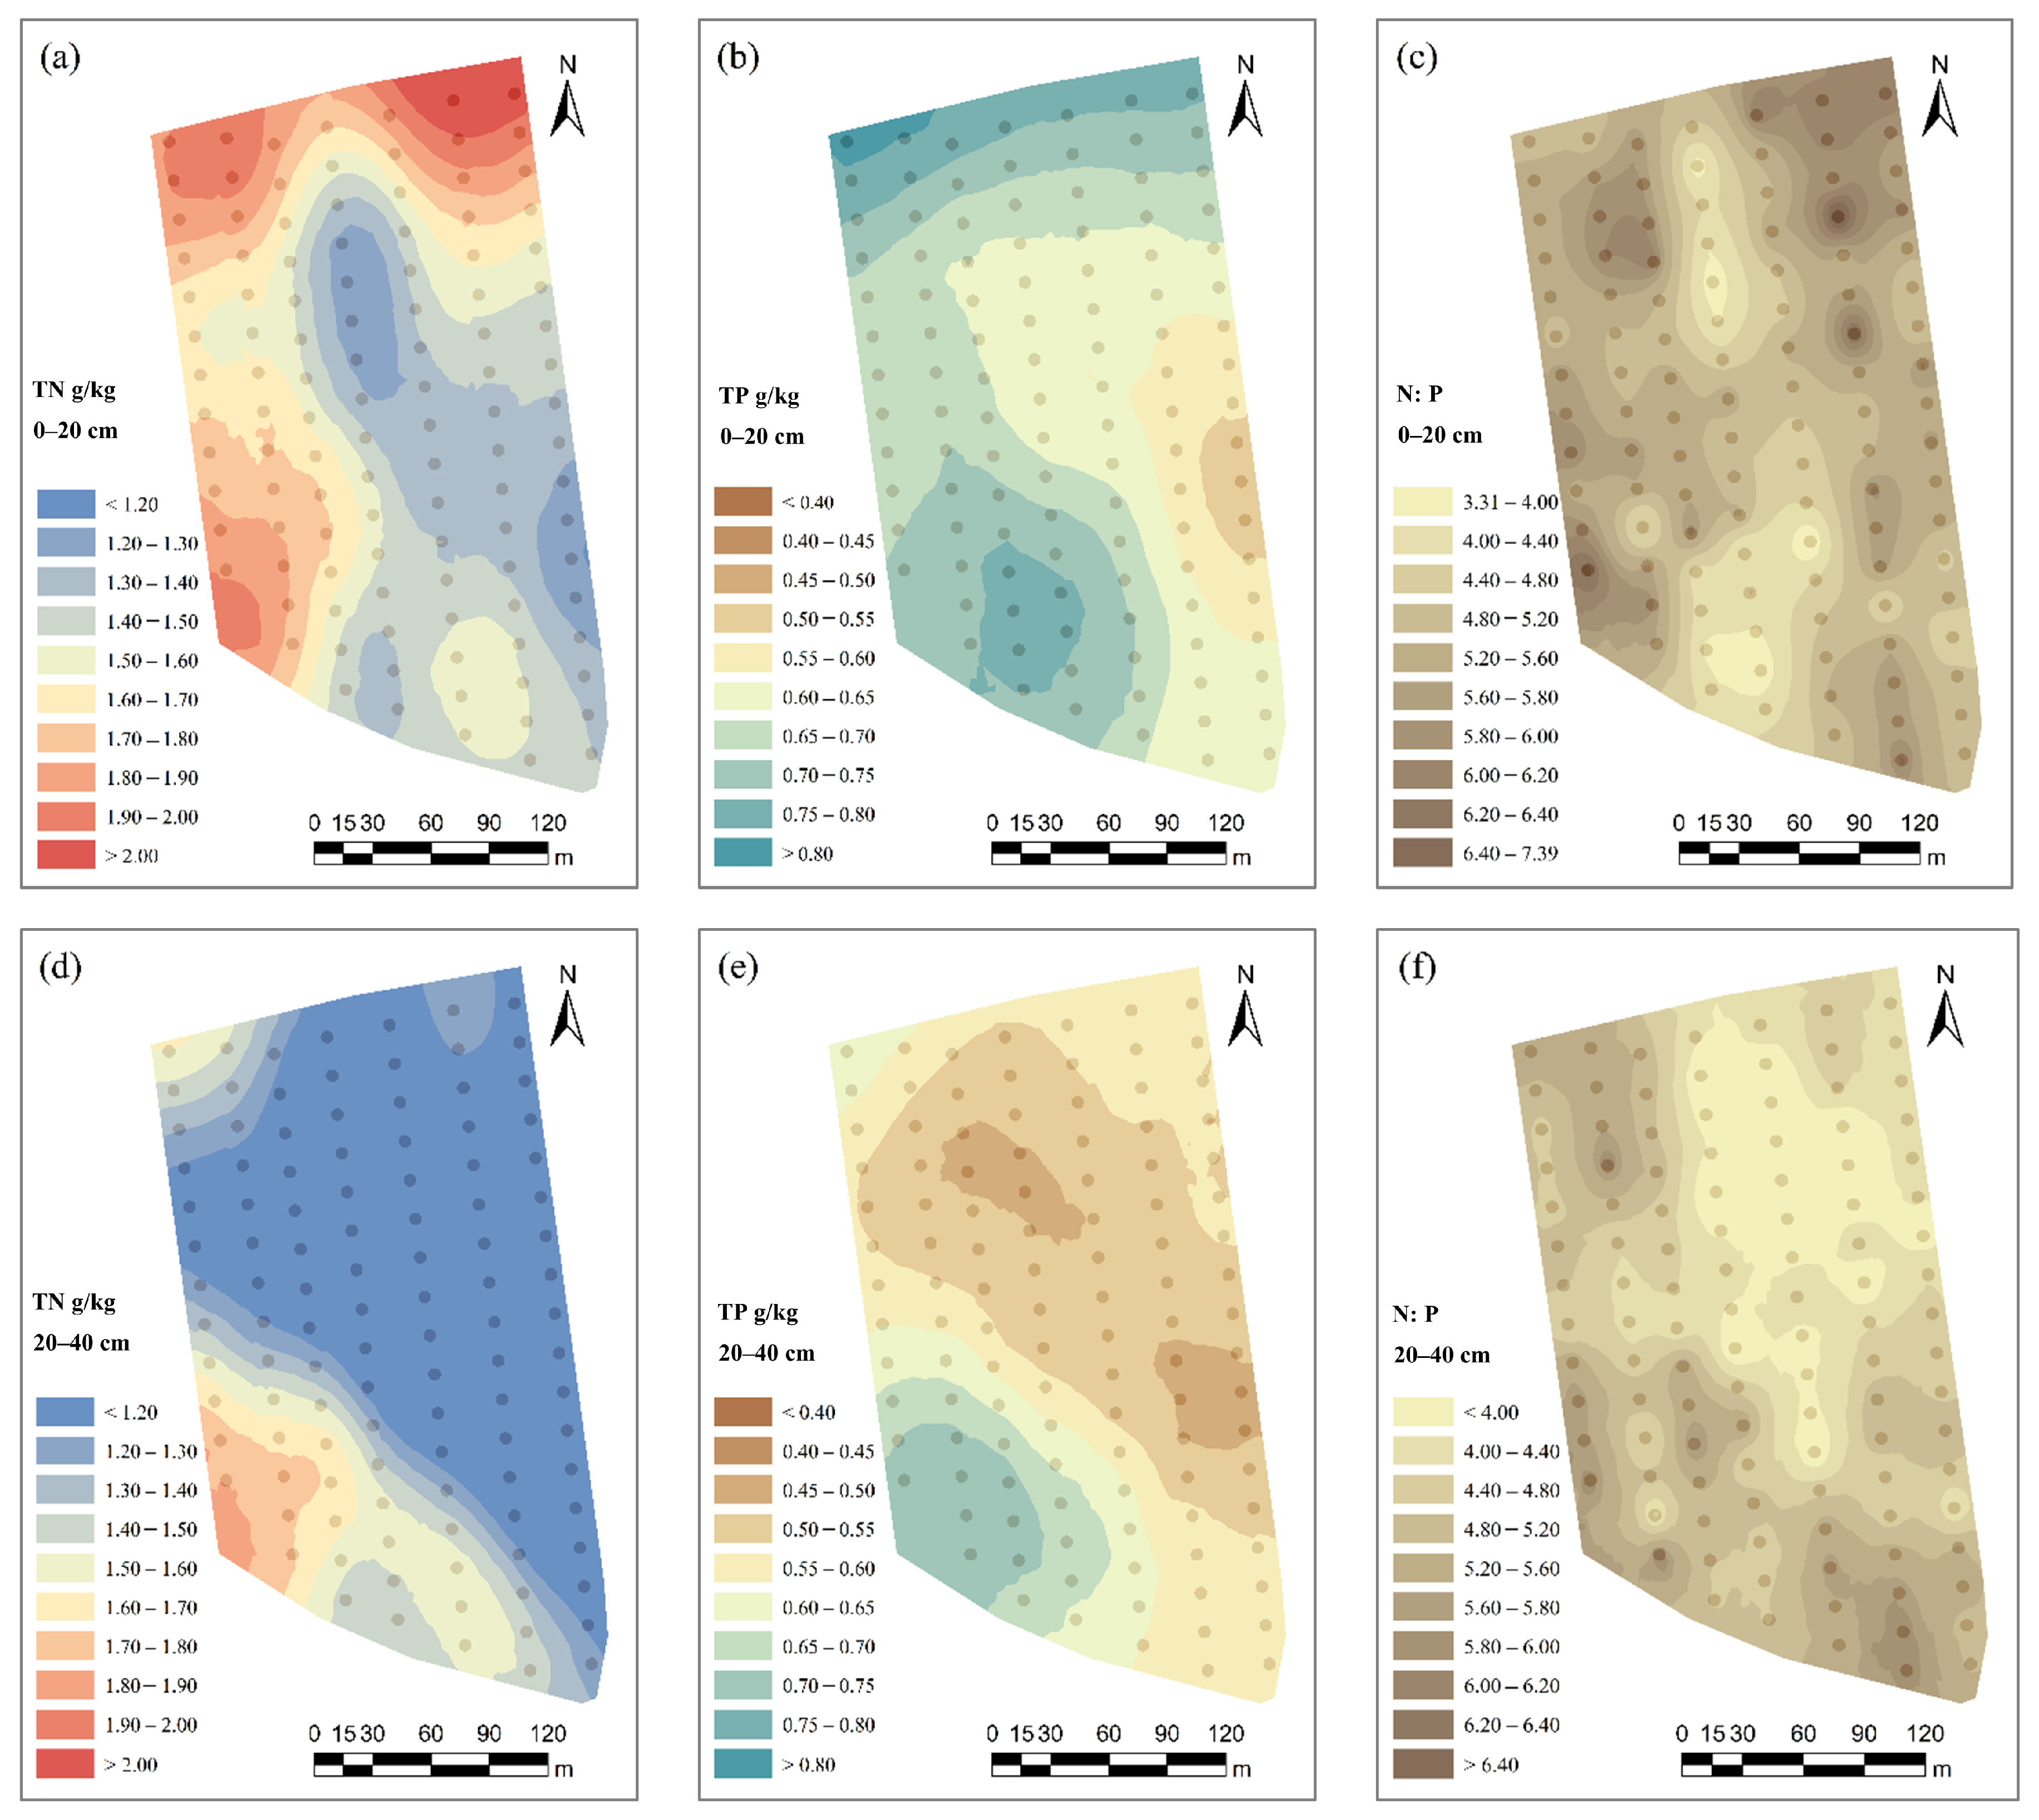
Spatial distributions of TN, TP, and N:P ratio were visualized using interpolated maps derived from the fitted semivariogram models (Figure 3). In the topsoil, TN and TP concentrations were generally higher at the weakly eroded upper position than at the depositional lower and strongly eroded middle positions (Figure 3a,b), with TN exhibiting greater spatial variability across the hillslope (CV = 21.4%; Table 1). Although N:P values were relatively high in the weakly eroded upper position, no clear increasing trend was observed (Figure 3c). However, in the subsoil, spatial distribution patterns shifted to enrichment at the depositional lower position, followed by the weakly eroded upper and strongly eroded middle positions (Figure 3d–f). Consistently, TN displayed higher spatial variability in the subsoil than TP, as indicated by larger coefficients of variation (36.2% vs. 19.8%).
Figure 3.
Spatial distribution of TN, TP, and N:P ratio at 0–20 cm (a–c) and 20–40 cm (d–f) across the hillslope based on Ordinary Kriging interpolation.
3.3. Variations in TN and TP Among Erosion–Deposition Zones
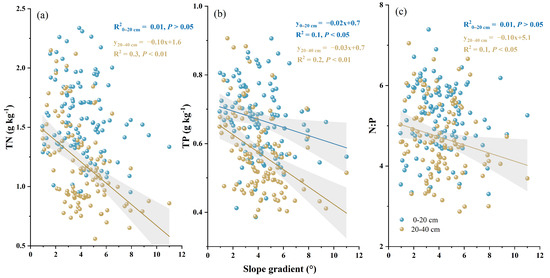
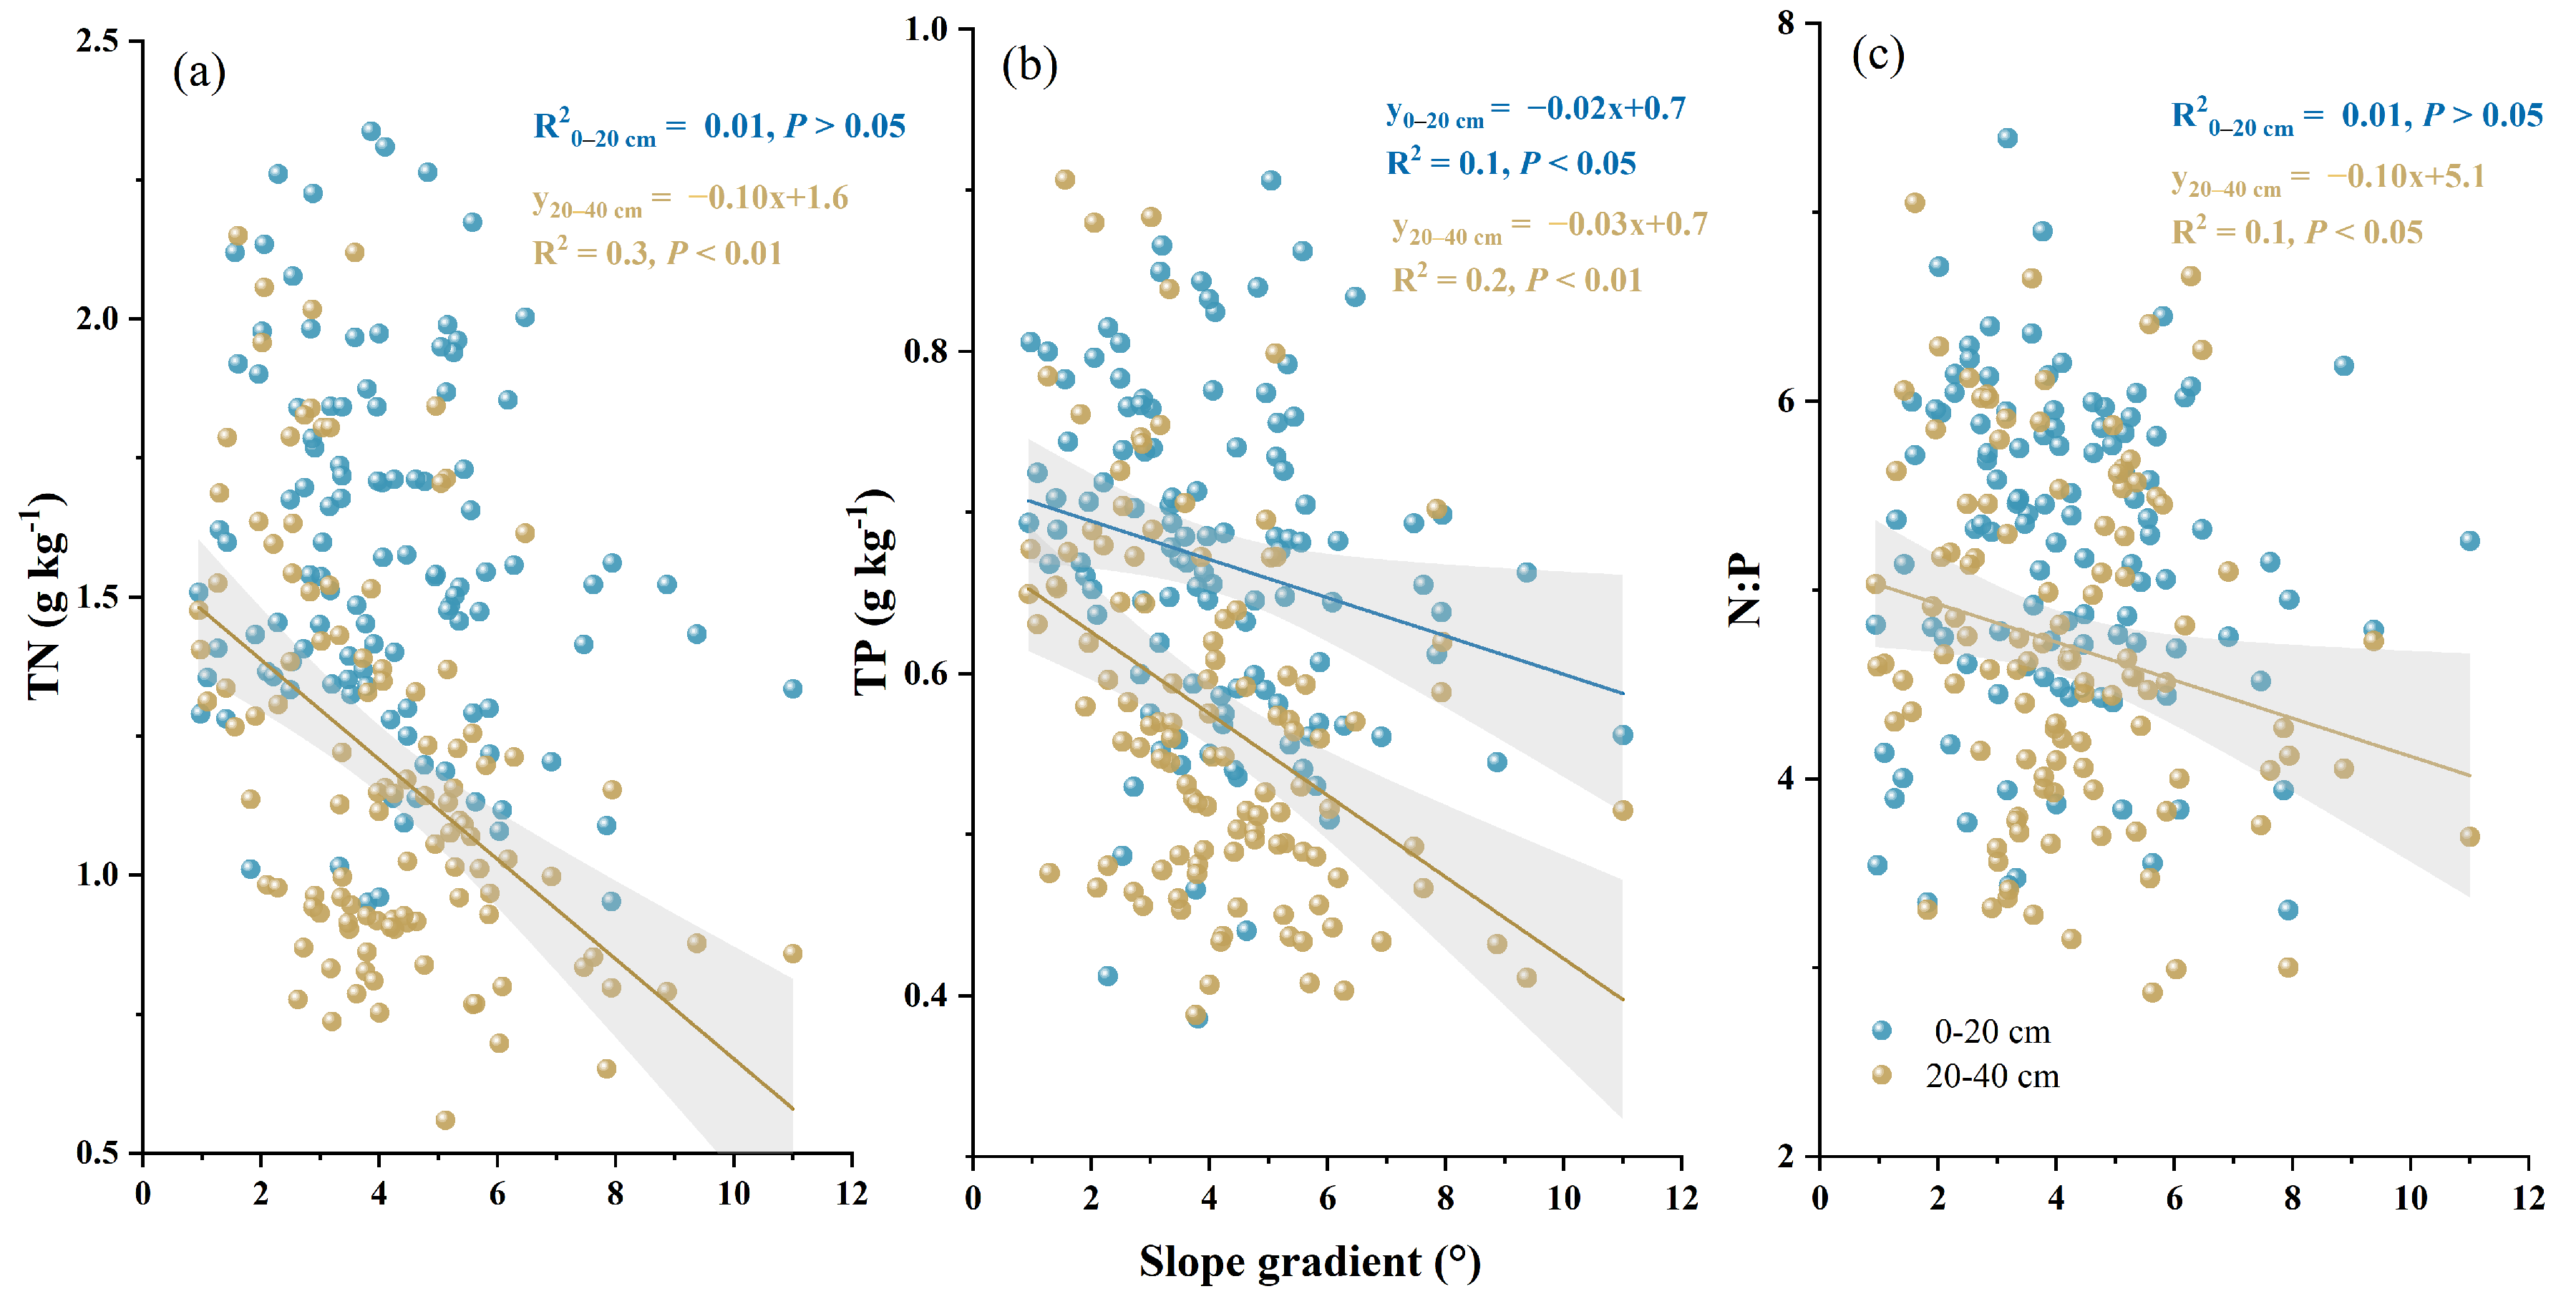
Slope gradient was negatively associated with TN, TP, and N:P, with a stronger relationship in the subsoil than in the topsoil (Figure 4). In the topsoil, only TP showed a significant negative linear relationship with slope gradient (R2 = 0.10, p ≤ 0.05), indicating a weak explanatory relationship. In contrast, in the subsoil, TN, TP, and N:P all exhibited significant negative linear trends (p ≤ 0.05), with TN showing the highest explanatory power (R2 = 0.30).
Figure 4.
Relationships between slope gradient and TN (a), TP (b), and N:P ratio (c) at two soil depths across the hillslope.
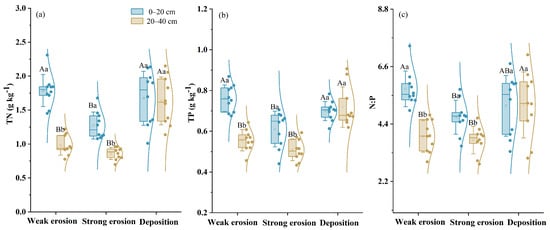
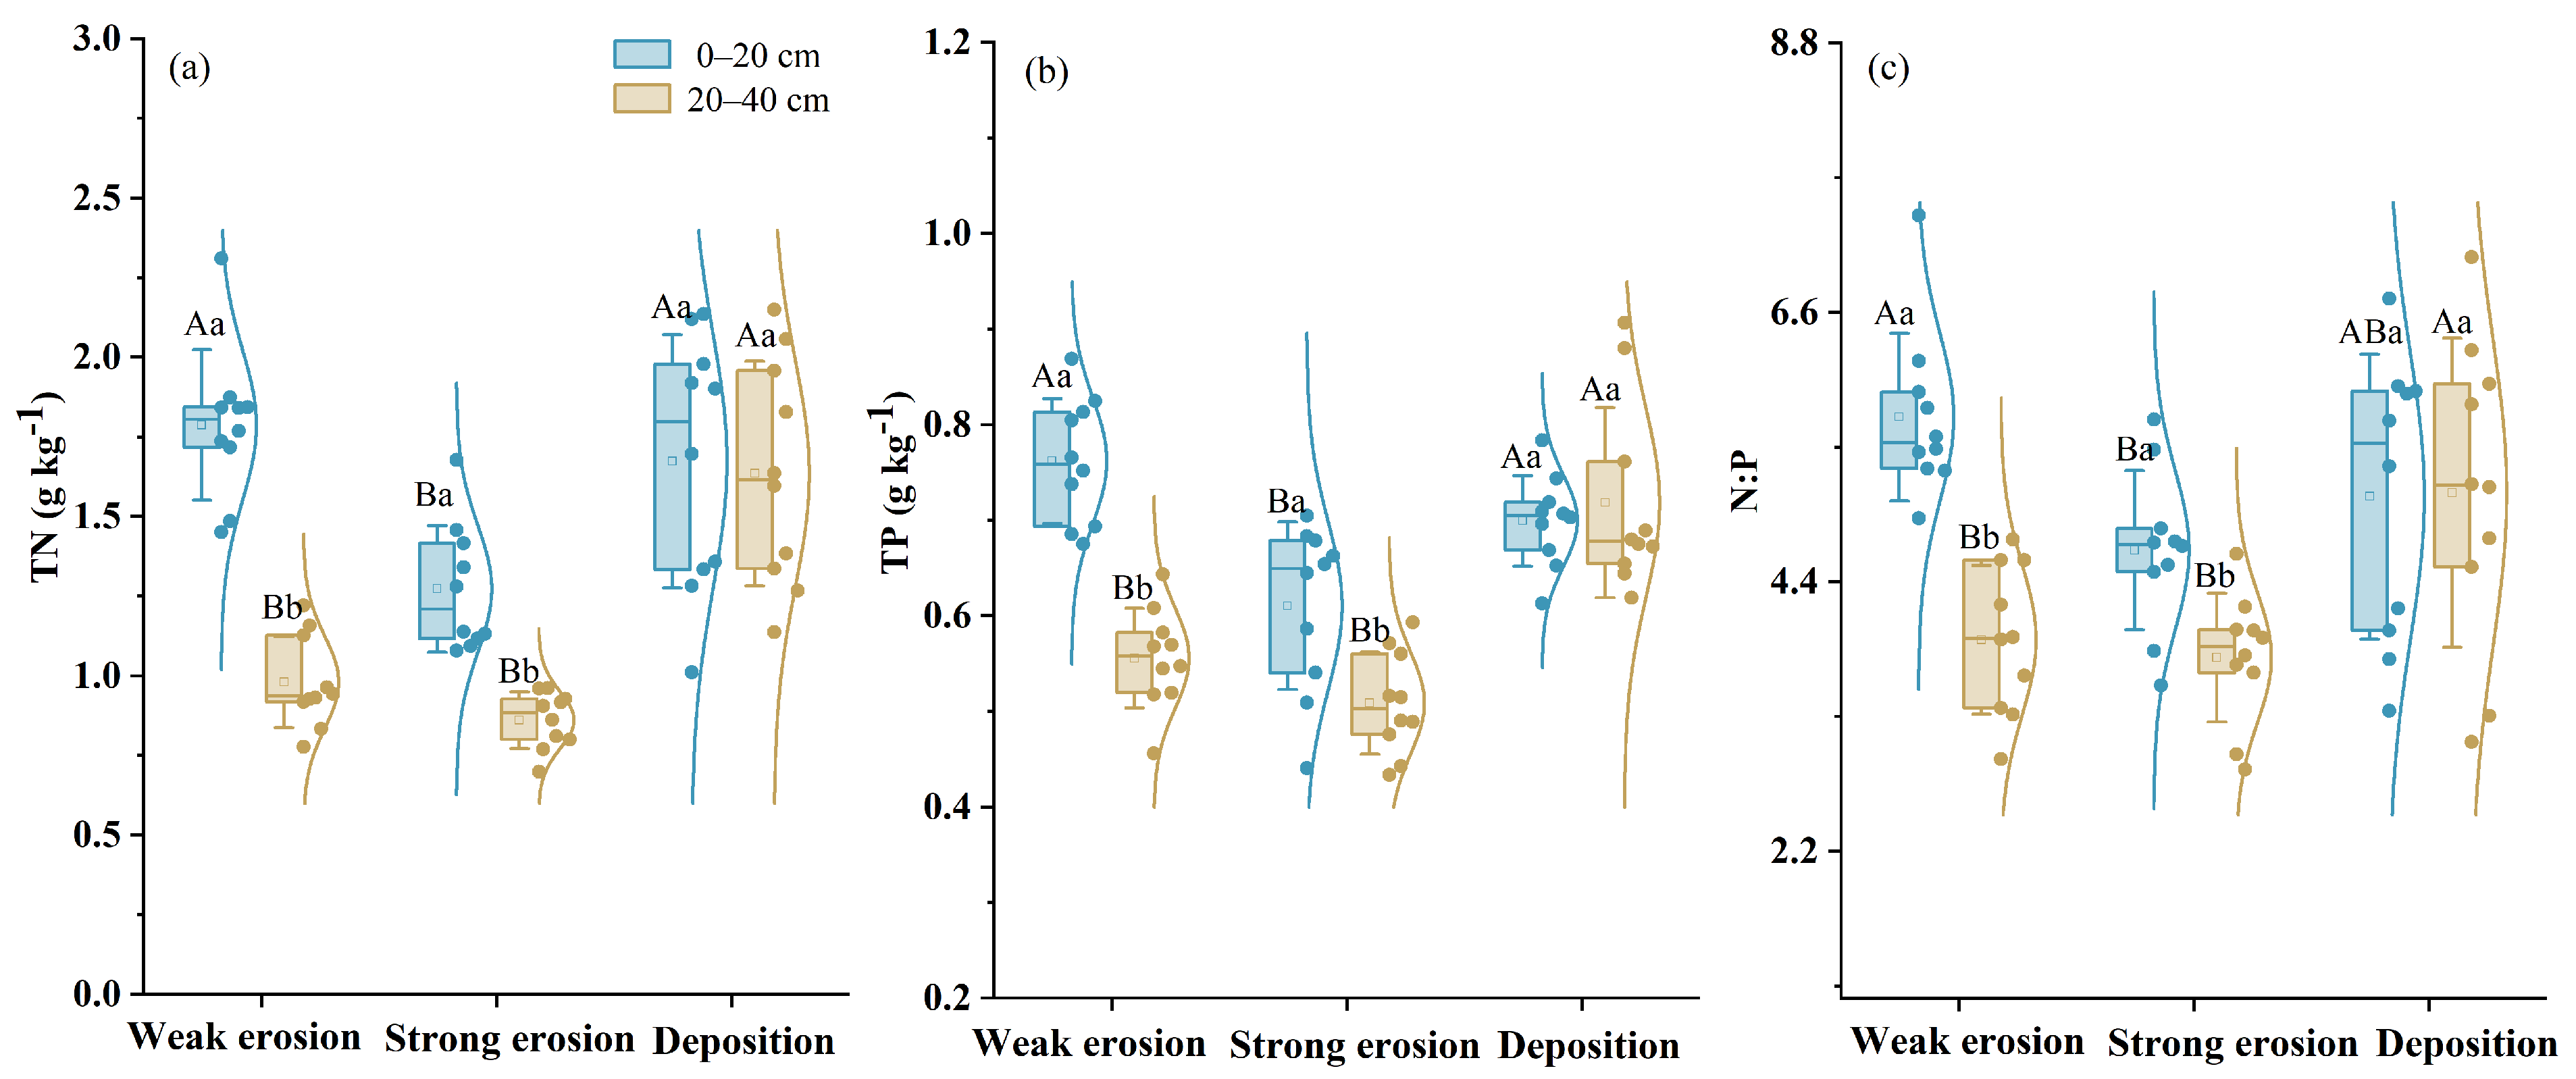
Two-way ANOVA revealed significant effects of erosion zone, soil depth, and their interaction on TN, TP, and N:P (p ≤ 0.05; Figure 5). In the topsoil, the three variables exhibited the order weakly eroded sites > depositional sites > strongly eroded sites (p ≤ 0.05), with strong erosion reducing TN, TP, and N:P by 28.7%, 19.9%, and 18.9%, respectively, relative to weak erosion. The subsoil showed a different pattern, with TN, TP, and N:P highest at the depositional site, followed by the weakly and strongly eroded sites (p ≤ 0.05). Compared with the strongly eroded site, TN, TP, and N:P at the depositional site were higher by 89.8%, 41.2%, and 35.5%, respectively. Depth effects were evident in eroded zones, where TN, TP, and N:P were generally higher in the topsoil than in the subsoil, whereas no significant depth differences were detected at the depositional site.
Figure 5.
Box plots of TN (a), TP (b), and N:P ratio (c) in weakly eroded, strongly eroded, and depositional sites at 0–20 and 20–40 cm. Different lowercase letters indicate significant differences between depths within the same site (p ≤ 0.05). Different uppercase letters indicate significant differences among sites within the same depth (p ≤ 0.05) (n = 30).
3.4. Drivers of the Soil N:P Ratio Along the Hillslope
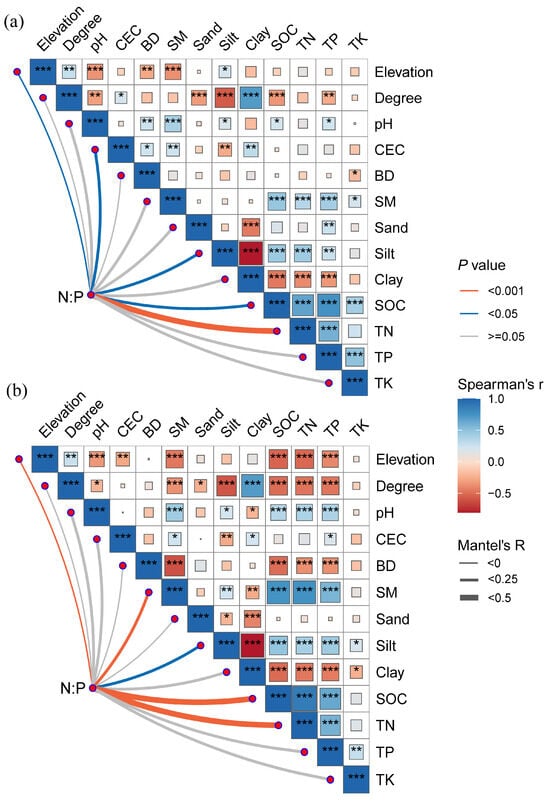
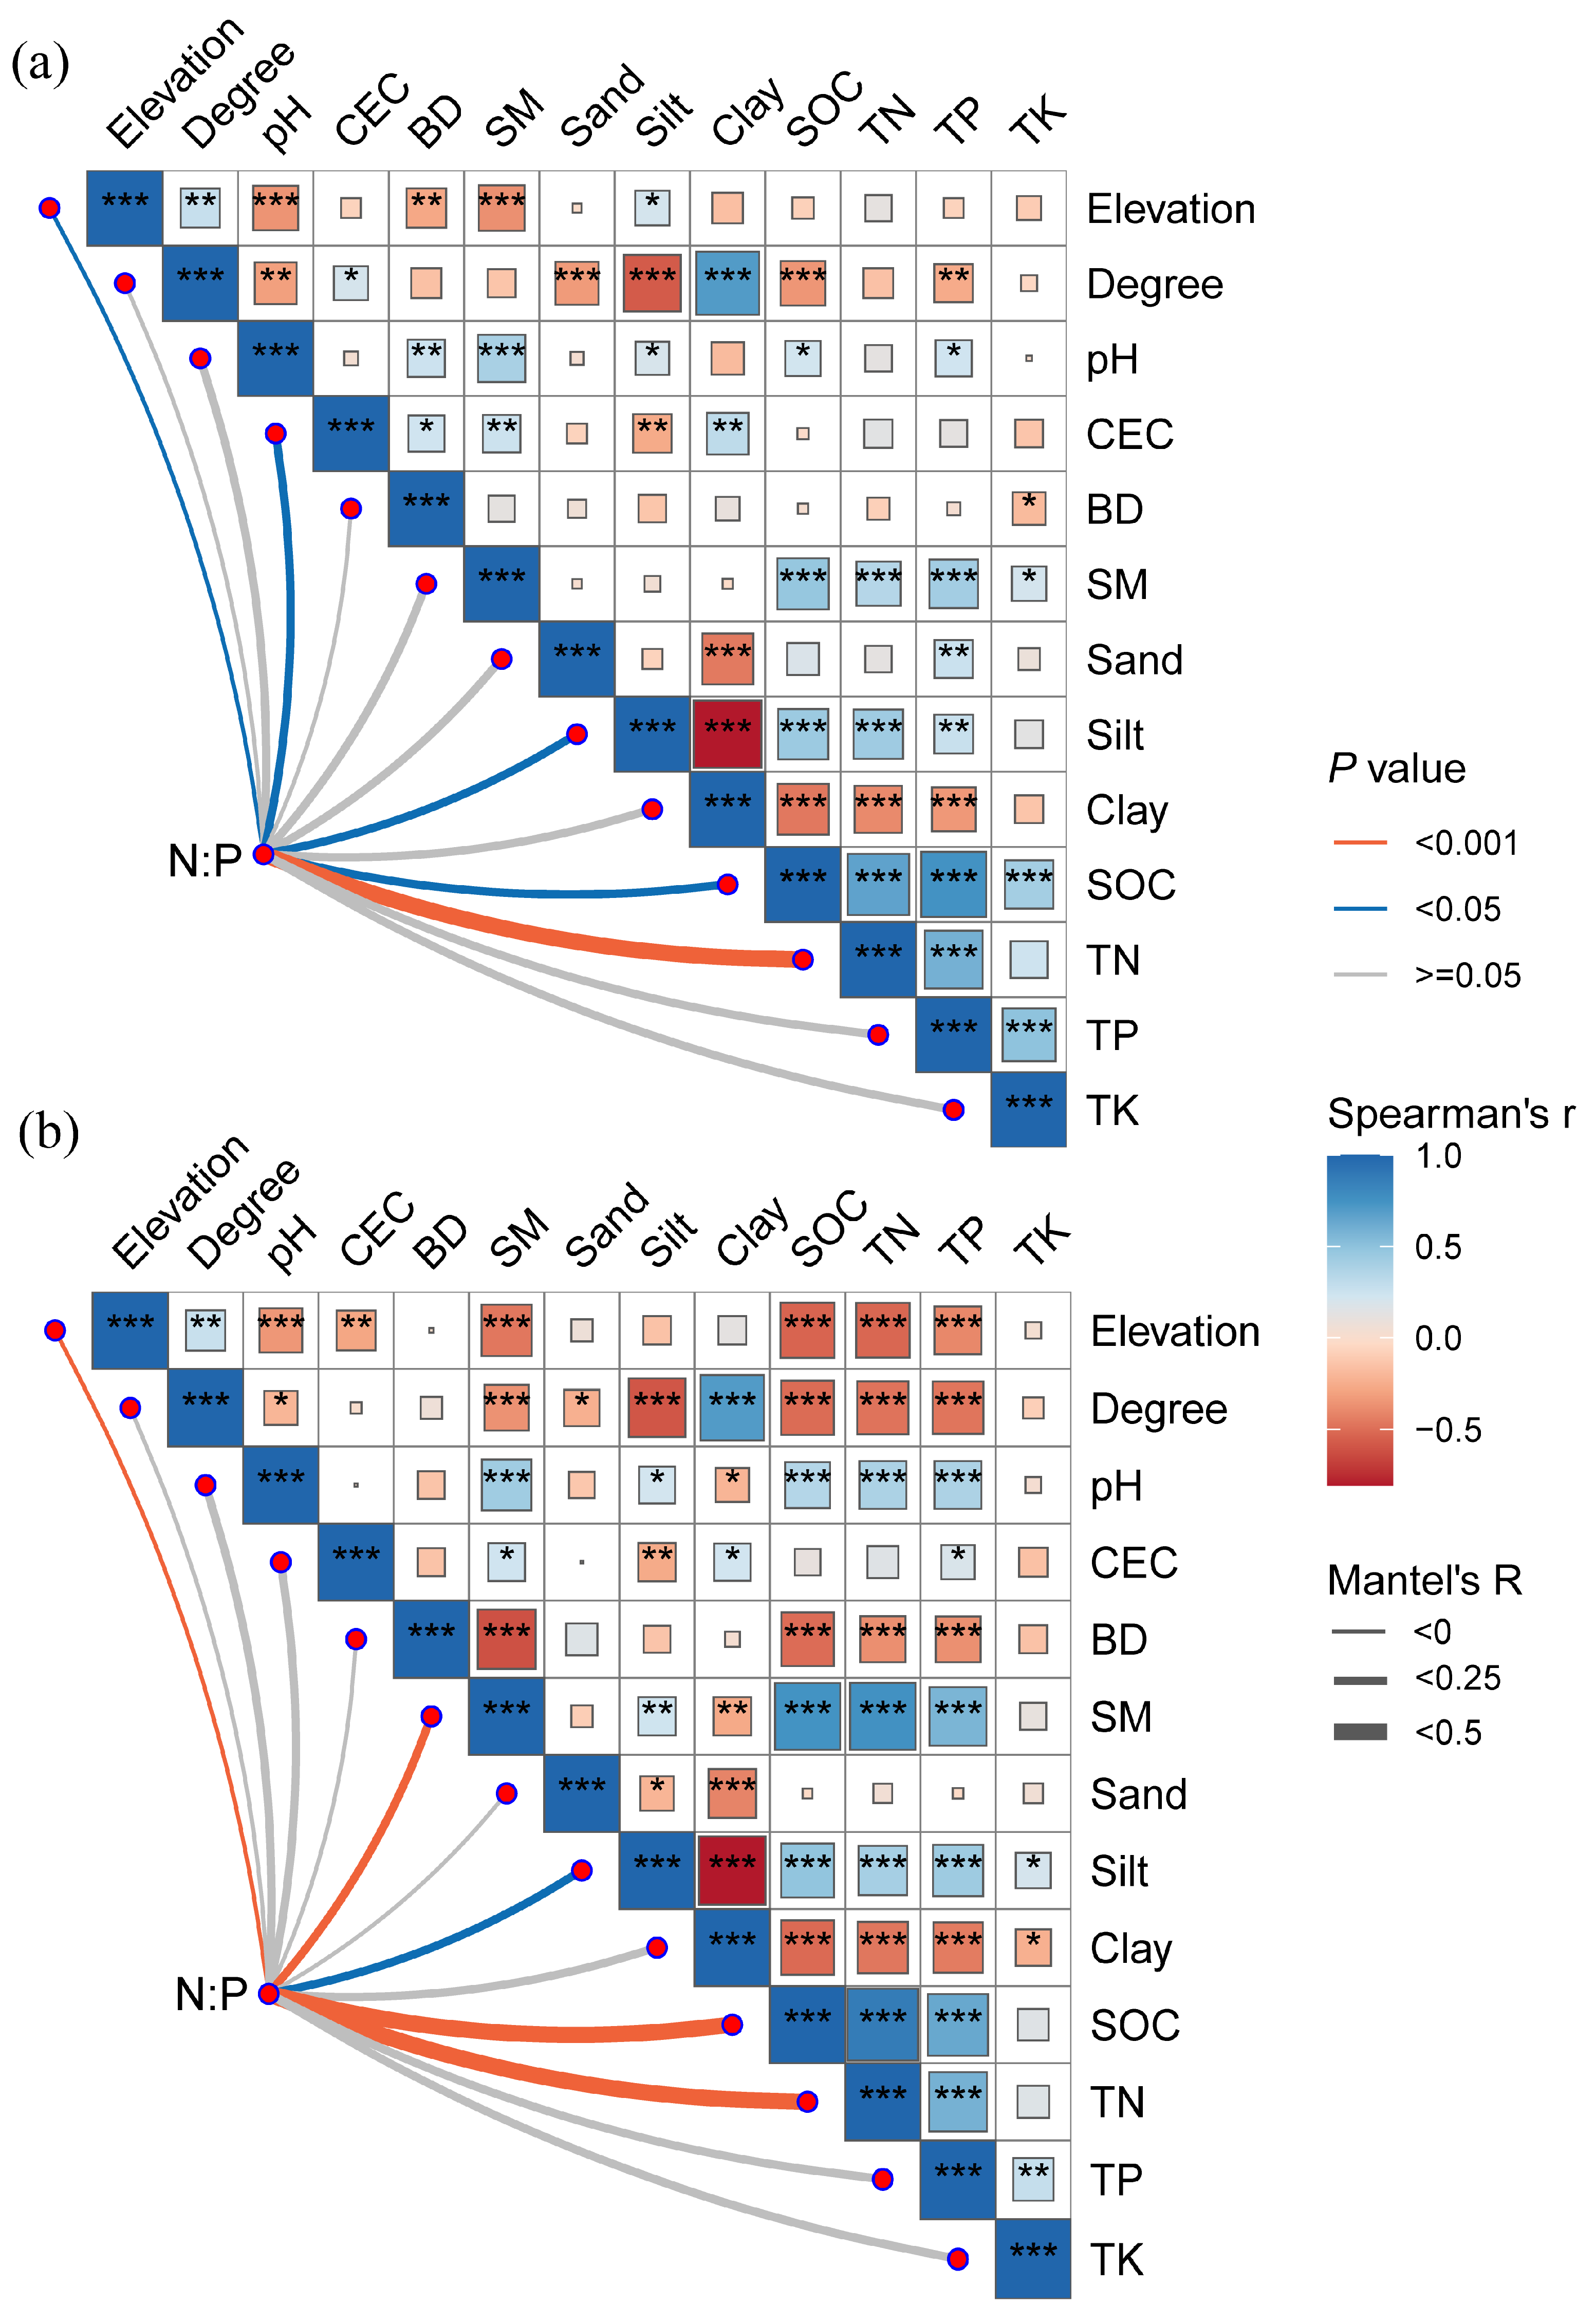
The N:P ratio was significantly associated with topographic factors and soil properties (Figure 6; Table 3). In the topsoil, N:P exhibited significant positive Mantel correlations with CEC, silt content, SOC, and TN, whereas a significant negative correlation was observed with elevation (p ≤ 0.05; Figure 6a). N:P showed a similar association pattern in the subsoil, remaining positively correlated with SOC, TN, silt, and soil moisture, and negatively correlated with elevation (p ≤ 0.05; Figure 6b). In both soil layers, the Spearman correlation matrices indicate that TN and TP generally co-varied positively with pH, soil moisture, silt, and SOC, and negatively with bulk density, clay content, and topographic factors (p ≤ 0.05).
Figure 6.
Spearman’s correlations among soil properties and topographic variables and Mantel tests relating the N:P ratio to environmental factors at 0–20 cm (a) and 20–40 cm (b) (n = 110). Colors of the squares indicate Spearman’s r. Connecting lines from N:P represent Mantel’s r, with line width proportional to Mantel’s r and line color indicating significance. CEC—cation exchange capacity; BD—bulk density; SM—soil moisture; SOC—soil organic carbon; TN—total nitrogen; TP—total phosphorus; TK—total potassium. * p ≤ 0.05, ** p ≤ 0.01, *** p ≤ 0.001.
Table 3.
Mantel’s R and p values for the relationships between the N:P ratio and environmental factors.
4. Discussion
4.1. The Status of Soil N:P Stoichiometry in Black Soil Hillslopes
Soil erosion substantially depleted nutrient pools in the studied black soil hillslope (Table 1), consistent with previous findings that long-term erosion significantly reduces both N and P stocks in northeast China relative to non-eroded croplands [31]. These results indicate that, as surface soils are progressively stripped from cultivated hillslopes, N and P are readily mobilized and exported through erosion processes, including raindrop splash and overland flow, resulting in substantial nutrient losses and a marked decline in soil productivity [32,33]. Furthermore, long-term erosion has been reported to expose formerly protected soil materials to the atmosphere and enhance N losses, potentially shifting degraded ecosystems from a N sink to a N source [34]. However, beyond reducing N stocks, evidence suggests that erosion further reorganizes soil N and P through selective redistribution and altered atmosphere–soil exchanges, leading to a systematic shift in soil stoichiometry [35,36]. In our study, the mean soil N:P ratio in the topsoil across the hillslope was 5.2 (Figure 2), which is lower than the Chinese average of 9.7 [37]. It should be noted that the national average integrates diverse ecosystem types, rendering its comparability with a single agroecosystem relatively limited. We further compared our results with regional values for farmland soils in the black soil region of northeast China (approximately 6.2) [31], and found that the N:P ratio in the studied hillslope remains obviously lower than the regional background level. Such depressed N:P levels indicate that more than six decades of persistent soil erosion have altered the relative balance between soil N and P, reflecting a hillslope-scale nutrient imbalance associated with long-term redistribution processes.
In addition to erosion, agricultural management practices may also influence soil N:P stoichiometry. Prolonged mineral fertilization has been shown to reduce soil N:P ratios [38], while the continuous removal of crop residues limits organic nutrient return to the soil, potentially aggravating N and P depletion over time. The relatively low N:P ratios observed in this study therefore likely reflect the combined influence of erosion-induced selective nutrient loss and sustained fertilization practices.
4.2. Soil Erosion Shapes Depth-Dependent Spatial Patterns of TN and TP
In our study, TN, TP, and N:P exhibited clear depth-dependent contrasts between the two soil layers (Figure 3), indicating pronounced vertical stratification of nutrient redistribution in this eroded landscape. This depth-contrasting spatial pattern is conceptually consistent with the framework of soil profile truncation [39]. Our results indicated that depositional sites exhibited significant enrichment of TN, TP, and N:P in the subsoil (Figure 5), reflecting the widely observed “source depletion–sink accumulation” behavior of erosion–deposition systems [6]. Previous studies have shown that erosion-driven particle transport exports nutrients from eroding sites and promotes their deposition and burial in downslope convergence zones, thereby building deeper nutrient pools in depositional positions [9]. In addition, burial in depositional positions can reduce oxygen availability and suppress microbial decomposition, thereby lowering N mineralization potential and further favoring N retention and subsoil accumulation [40,41]. Deep soil nutrients further supported this perspective, with TN content in the deep soil layers being significantly higher at the depositional position than at the weakly and strongly eroded positions (Table S1). Nevertheless, burial-driven accumulation does not necessarily correspond to elevated nutrient concentrations in the topsoil, suggesting a decoupling between subsoil accumulation and topsoil nutrient status under long-term erosion.
The topsoil displayed an opposite spatial pattern, with higher TN, TP, and N:P at weakly eroded sites than at strongly eroded and depositional sites (Figure 3 and Figure 5). This reversal is unlikely to reflect short-term disturbance; rather, it represents the cumulative legacy of long-term erosion through sustained reshaping of nutrient distribution across the hillslope. At strongly eroded positions, persistent soil loss has depleted surface nutrient pools and exposed nutrient-poor subsoil materials (Table S1). Recurrent downslope transport of these low-nutrient mineral materials can exert a dilution effect on depositional surfaces, resulting in relatively low nutrient concentrations in depositional topsoil despite continued accumulation in deeper layers. By comparison, weakly eroded positions, characterized by gentler slopes and weaker erosive forcing (Figure 1), tend to retain nutrient-enriched surface horizons of the original black soil, thereby maintaining higher TN, TP, and N:P in the topsoil. However, we found that TN declined sharply with depth at weakly eroded sites (Table S1), indicating that even these positions may face progressive nutrient depletion under prolonged erosion. Together, these patterns suggest that surface nutrient contrasts among slope positions may diminish over time, whereas deeper-layer heterogeneity may increase due to opposing processes of nutrient depletion at eroding sites and burial-driven accumulation at depositional sites, underscoring the limitations of surface-based assessments for hillslope-scale nutrient dynamics.
Notably, although annual tillage may promote nutrient mixing within the plough layer on sloping cropland, clear spatial differentiation in topsoil TN and TP remained evident. This indicates that long-term erosion–deposition processes continue to structure surface nutrient patterns despite mechanical mixing. Moreover, the subsoil layer remains minimally affected by direct tillage disturbance and thus is more likely to retain the longer-term imprint of erosion–deposition-driven redistribution and burial. The contrasting nutrient patterns between the topsoil and subsoil, therefore, are unlikely to be explained by tillage alone, but are more consistent with the cumulative legacy of erosion-driven selective redistribution and downslope burial.
4.3. TN as a Major Contributor to Soil N:P Variation Across the Erosion–Deposition Gradient
The spatial variability of soil N:P across the hillslope was primarily governed by TN rather than TP, as indicated by the strong association between N:P and TN and the higher coefficient of variation of TN (Table 1; Figure 6). This pattern suggests that erosion preferentially weakens soil N pools, thereby amplifying N constraint and driving spatial divergence in soil N:P stoichiometry. This N-dominated control reflects fundamental differences between TN and TP in their transport pathways and biogeochemical turnover [42,43]. On the one hand, TN responded more strongly than TP to variations in erosion–deposition processes (Figure 5), reflecting the greater sensitivity of soil N pools to erosional disturbance. On the other hand, inorganic N, particularly nitrate, is highly soluble and mobile, making it susceptible to hydrological transport, leaching, and gaseous losses via denitrification and ammonia volatilization [44,45,46]. In contrast, TP generally exhibits much lower mobility in soils. P availability is largely regulated by adsorption–desorption and precipitation–dissolution reactions, with substantial fractions readily fixed by Fe/Al oxides and clay minerals, buffering TP against erosional disturbance and constraining its spatial variability [47]. Moreover, long-term fertilization can further promote the accumulation of relatively stable “legacy P” pools, further enhancing TP resistance to erosion-induced redistribution [48]. This asymmetric response of N and P suggests that erosion is closely associated with the destabilization of soil N pools and highlights that N vulnerability may contribute substantially to stoichiometric imbalance in eroded black soil landscapes.
Our results showed that SOC and silt content are also important determinants of hillslope-scale soil N:P (Figure 6), consistent with previous findings identifying SOC as a major regulator of soil N:P in long-term cultivated soils [49]. SOC underpins the size of the soil organic N pool and, through microbially mediated turnover, governs N and P release and availability, thereby exerting a direct influence on N:P stoichiometry [50,51]. This SOC-mediated influence is further reinforced by soil texture: compared with sand, silt- and clay-sized particles provide greater reactive surface area for stabilizing organic matter and associated nutrients [52]. In eroded landscapes, SOC is preferentially redistributed with fine particles, such that SOC–fine particle complexes act as primary vectors for coupled N and P translocation [53], enhancing the sensitivity of soil N:P to variations in silt content. However, studies from sand-dominated eroded landscapes such as the Loess Plateau have reported a stronger influence of sand content on N:P [54], which contrasts with our findings. This discrepancy suggests that soil N:P stoichiometry in erosion-affected landscapes may reflect region-specific pedological and textural contexts.
Beyond soil properties, hillslope-scale N:P patterns were further organized by topographic context, particularly slope gradient and elevation (Figure 6). In the subsoil, slope gradient was negatively correlated with TN, TP, and N:P (Figure 4), consistent with the general mechanism whereby steeper slopes enhance runoff and sediment transport, increasing erosion-driven nutrient export [55,56]. However, slope gradient showed no significant spatial correspondence with N:P in the Mantel analysis. This suggests that, relative to slope gradient, erosion–deposition processes may exert a stronger control on the spatial variation of soil N:P. Consistent with this pattern, elevation exerted a clearer influence on N:P variability. Unlike natural mountain ecosystems, where elevation often regulates nutrient dynamics through climatic gradients [57], elevation in eroded landscapes primarily reflects geomorphic position along erosion–deposition zones. The observed decline in N:P with increasing elevation therefore mainly reflects a transition from depositional positions characterized by nutrient accumulation to upslope eroding positions dominated by sustained nutrient export (Figure 3, Figure 5 and Figure 6). Overall, these results demonstrate that long-term erosion reorganizes hillslope N:P patterns through coupled controls of N vulnerability, C pools, and geomorphic position.
5. Conclusions
This study investigated the spatial patterns of soil TN, TP, and N:P ratio and their key drivers across a long-term eroded black soil cropland. Soil TN, TP, and N:P exhibited significant positive spatial autocorrelation with distinct structure, while varying markedly with depth. Long-term erosion may contribute to spatial homogenization of TN, TP, and N:P in the topsoil, while enhancing subsoil heterogeneity through nutrient depletion in eroding areas and enrichment via burial in depositional zones. Soil N:P was closely associated with TN, SOC, and silt content, with TN showing the strongest association with N:P variability across the hillslope. Among topographic factors, elevation capturing the erosion–deposition gradient showed a stronger spatial association with soil N:P than slope gradient. These findings indicate that spatial variation in soil N:P is closely linked to erosion-driven redistribution processes and soil properties.
While the study site is representative of long-term eroded black soil slopes, the conclusions are drawn from two soil depths under a single long-term management regime. Future research should incorporate deeper, profile-based sampling to more fully resolve erosion-induced vertical reorganization of nutrient pools. In addition, soil conservation measures should be tailored to specific slope positions to protect the N and P pools that are most vulnerable to erosion, including practices such as conservation tillage, residue retention, and agroforestry systems that enhance surface protection and reduce nutrient loss.
Supplementary Materials
The following supporting information can be downloaded at https://www.mdpi.com/article/10.3390/agronomy16050497/s1: Table S1: Profile distribution (0–80 cm) of soil properties at the lower, middle, and upper slope positions.
Author Contributions
Conceptualization, R.Q. and L.G.; methodology, R.Q.; software, R.Q.; validation, R.Q., J.L. and L.G.; formal analysis, R.Q.; investigation, R.Q. and S.L.; resources, R.Q.; data curation, R.Q.; writing—original draft preparation, R.Q.; writing—review and editing, R.Q., J.L., X.P. and L.G.; visualization, R.Q.; supervision, J.L., X.P. and L.G.; project administration, L.G.; funding acquisition, L.G. All authors have read and agreed to the published version of the manuscript.
Funding
This work was financially supported by the National Key Research and Development Program of China (2021YFD1500801).
Data Availability Statement
The data supporting the findings of this study are not publicly available, as they form part of an ongoing long-term field experiment and include additional measurements that have not yet been fully analyzed or published. The data are available on request from the corresponding author.
Conflicts of Interest
The authors declare no conflicts of interest.
References
- Li, C.; Wang, Z.; Li, Z.; Xu, X. Soil erosion impacts on nutrient deposition in a typical karst watershed. Agric. Ecosyst. Environ. 2021, 322, 107649. [Google Scholar] [CrossRef] [Scilit]
- Ma, Y.; Zhang, C.; Yang, H.; Xu, Y.; Chen, Y.; Ning, J. The Characteristics of Soil C, N and P and Stoichiometric Ratios as Affected by Land-Use in a Karst Area, Southwest China. Land 2023, 12, 1126. [Google Scholar] [CrossRef] [Scilit]
- Cao, J.; Chen, Y.; Wang, H.; Jiang, Y.; Wu, J. Effects of long-term cultivation on spatial-temporal variation of soil nitrogen and phosphorus: A case study in Shaanxi Province, China. Environ. Monit. Assess. 2023, 195, 1439. [Google Scholar] [CrossRef] [Scilit] [PubMed]
- Tessier, J.T.; Raynal, D.J. Use of nitrogen to phosphorus ratios in plant tissue as an indicator of nutrient limitation and nitrogen saturation. J. Appl. Ecol. 2003, 40, 523–534. [Google Scholar] [CrossRef] [Scilit]
- Mohsin, A.M.; Hu, X.; Tariq, A.; Sun, N.; Mustafa, A.; Aslam, M.W.; Shah, S.A.A.; Mehmood, K.; Zhou, B.K.; Ma, X.Z.; et al. Carbon, nitrogen, and phosphorus stoichiometry mediate sensitivity of carbon stabilization mechanisms along with surface layers of a Mollisol after long-term fertilization in Northeast China. J. Soil Sediment. 2021, 21, 705–723. [Google Scholar]
- Quinton, J.N.; Govers, G.; Van Oost, K.; Bardgett, R.D. The impact of agricultural soil erosion on biogeochemical cycling. Nat. Geosci. 2010, 3, 311–314. [Google Scholar] [CrossRef] [Scilit]
- Tan, Z.; Leung, L.R.; Li, H.Y.; Tesfa, T.; Zhu, Q.; Yang, X.J.; Liu, Y.; Huang, M. Increased extreme rains intensify erosional nitrogen and phosphorus fluxes to the northern Gulf of Mexico in recent decades. Environ. Res. Lett. 2021, 16, 054080. [Google Scholar] [CrossRef] [Scilit]
- Xu, M.X.; Li, Q.; Wilson, G. Degradation of soil physicochemical quality by ephemeral gully erosion on sloping cropland of the hilly Loess Plateau, China. Soil Tillage Res. 2016, 155, 9–18. [Google Scholar] [CrossRef] [Scilit]
- Holz, M.; Augustin, J. Erosion effects on soil carbon and nitrogen dynamics on cultivated slopes: A meta-analysis. Geoderma 2021, 397, 115045. [Google Scholar] [CrossRef] [Scilit]
- Wang, X.; Cammeraat, E.L.; Cerli, C.; Kalbitz, K. Soil aggregation and the stabilization of organic carbon as affected by erosion and deposition. Soil Biol. Biochem. 2014, 72, 55–65. [Google Scholar] [CrossRef] [Scilit]
- Sarapatka, B.; Cap, L.; Bila, P. The varying effect of water erosion on chemical and biochemical soil properties in different parts of Chernozem slopes. Geoderma 2018, 314, 20–26. [Google Scholar] [CrossRef] [Scilit]
- Peng, T.; Yang, Y.; Zhang, H.; Liu, Y.; Li, C.A. The Role of Soil Erosion in Regulating Soil C, N, and C/N Ratio Along a Cultivated Black Soil Slope. Land Degrad. Dev. 2025. [Google Scholar] [CrossRef] [Scilit]
- Chaplot, V.A.; Le Bissonnais, Y. Runoff features for interrill erosion at different rainfall intensities, slope lengths, and gradients in an agricultural loessial hillslope. Soil Sci. Soc. Am. J. 2003, 67, 844–851. [Google Scholar] [CrossRef] [Scilit]
- Huang, J.; Wu, P.; Zhao, X. Effects of rainfall intensity, underlying surface and slope gradient on soil infiltration under simulated rainfall experiments. Catena 2013, 104, 93–102. [Google Scholar] [CrossRef] [Scilit]
- Liu, Z.P.; Shao, M.A.; Wang, Y.Q. Spatial patterns of soil total nitrogen and soil total phosphorus across the entire Loess Plateau region of China. Geoderma 2013, 197, 67–78. [Google Scholar] [CrossRef] [Scilit]
- Spohn, M. Preferential adsorption of nitrogen-and phosphorus-containing organic compounds to minerals in soils: A review. Soil Biol. Biochem. 2024, 194, 109428. [Google Scholar] [CrossRef] [Scilit]
- Ashraf, M.N.; Hu, C.; Wu, L.; Duan, Y.; Zhang, W.; Aziz, T.; Cai, A.; Abrar, M.M.; Xu, M. Soil and microbial biomass stoichiometry regulate soil organic carbon and nitrogen mineralization in rice-wheat rotation subjected to long-term fertilization. J. Soil Sediment. 2020, 20, 3103–3113. [Google Scholar] [CrossRef] [Scilit]
- Shen, Y.; Gu, J.; Liu, G.; Wang, X.; Shi, H.; Shu, C.; Zhang, Y. Predicting soil erosion and deposition on sloping farmland with different shapes in Northeast China using 137Cs. Catena 2023, 229, 107238. [Google Scholar] [CrossRef] [Scilit]
- Ma, R.; Tian, Z.; Zhao, Y.; Wu, Y.; Liang, Y. Response of soil quality degradation to cultivation and soil erosion: A case study in a Mollisol region of Northeast China. Soil Tillage Res. 2024, 242, 106159. [Google Scholar] [CrossRef] [Scilit]
- He, Y.; Zhang, F.; Yang, M.; Luo, J.; Su, Z. Erosion Reduces Soil Nitrogen and Regulates Its Physical Fraction Proportions in Long-Term Cultivated Sloping Farmlands of Northeast China’s Black Soil Region. Land Degrad. Dev. 2025. [Google Scholar] [CrossRef] [Scilit]
- Doetterl, S.; Berhe, A.A.; Nadeu, E.; Wang, Z.; Sommer, M.; Fiener, P. Erosion, deposition and soil carbon: A review of process-level controls, experimental tools and models to address C cycling in dynamic landscapes. EarthSci. Rev. 2016, 154, 102–122. [Google Scholar] [CrossRef] [Scilit]
- Lal, R. Fate of soil carbon transported by erosional processes. Appl. Sci. 2022, 12, 48. [Google Scholar] [CrossRef] [Scilit]
- Zheng, H.; Miao, C.; Huntingford, C.; Tarolli, P.; Li, D.; Panagos, P.; Yue, Y.; Borrelli, P.; Van Oost, K. The impacts of erosion on the carbon cycle. Rev. Geophys. 2025, 63, e2023RG000829. [Google Scholar] [CrossRef] [Scilit]
- Qian, R.; Gao, L.; Biswas, A.; Du, H.; Liu, S.; Peng, X.H. Decoupling erosion effects on carbon fractions and stability in black soil agricultural landscapes. Pedosphere, 2025; in press. [CrossRef] [Scilit]
- Soil Survey Staff. Keys to Soil Taxonomy, 13th ed.; USDA Natural Resources Conservation Service: Washington, DC, USA, 2022.
- R Core Team. R: A Language and Environment for Statistical Computing; R Foundation for Statistical Computing: Vienna, Austria, 2024; Available online: https://www.R-project.org/ (accessed on 25 December 2025).
- Moran, P.A.P. The interpretation of statistical maps. J. Roy. Stat. Soc. B 1948, 10, 243–251. [Google Scholar] [CrossRef] [Scilit]
- Cambardella, C.A.; Moorman, T.B.; Novak, J.M.; Parkin, T.B.; Karlen, D.L.; Turco, R.F.; Konopka, A.E. Field scale variability of soil properties in central Iowa soils. Soil Sci. Soc. Am. J. 1994, 58, 1501–1511. [Google Scholar] [CrossRef] [Scilit]
- Oksanen, J.; Blanchet, F.G.; Kindt, R.; Legendre, P.; Minchin, P.R.; O’Hara, R.B.; Simpson, G.L.; Sólymos, P.; Stevens, M.H.H.; Wagner, H. vegan: Community Ecology Package, R package version 2.6-4. 2012. Available online: http://CRAN.R-project.org/package=vegan (accessed on 25 December 2025).
- Huang, H. ggcor: Extended Tools for Correlation Analysis and Visualization, R package version 0.9.8.1. GitHub Repository. Available online: https://github.com/xukaili/ggcor (accessed on 10 January 2026).
- Li, H.; Zhu, H.; Qiu, L.; Wei, X.; Shao, M. Response of soil OC, N and P to land-use change and erosion in the black soil region of northeast China. Agric. Ecosyst. Environ. 2020, 302, 107081. [Google Scholar] [CrossRef] [Scilit]
- Srinivasan, V.; Maheswarappa, H.P.; Lal, R. Long term effects of topsoil depth and amendments on particulate and non particulate carbon fractions in a Miamian soil of Central Ohio. Soil Tillage Res. 2012, 121, 110–117. [Google Scholar] [CrossRef] [Scilit]
- Liu, C.; Li, Z.; Chang, X.; He, J.; Nie, X.; Liu, L.; Xiao, H.; Wang, D.; Peng, H.; Zeng, G. Soil carbon and nitrogen sources and redistribution as affected by erosion and deposition processes: A case study in a loess hilly-gully catchment, China. Agric. Ecosyst. Environ. 2018, 253, 11–22. [Google Scholar] [CrossRef] [Scilit]
- Li, W.; Wang, J.L.; Zhang, X.J.; Shi, S.L.; Cao, W.X. Effect of degradation and rebuilding of artificial grasslands on soil respiration and carbon and nitrogen pools on an alpine meadow of the Qinghai-Tibetan Plateau. Ecol. Eng. 2018, 111, 134–142. [Google Scholar] [CrossRef] [Scilit]
- Chen, G.C.; He, Z.L. Determination of soil microbial biomass phosphorus in acid red soils from Southern China. Biol. Fertil. Soils 2004, 39, 446–451. [Google Scholar] [CrossRef] [Scilit]
- Tong, L.S.; Xiao, H.B.; Xu, K.; Zhan, Y.M.; Shi, Z.H. Stoichiometric regulations of soil respiration and its temperature sensitivity under erosion and deposition conditions. Agric. Ecosyst. Environ. 2021, 319, 107507. [Google Scholar] [CrossRef] [Scilit]
- Tian, H.; Chen, G.; Zhang, C.; Liu, J.; Wang, J. Pattern and variation of C:N:P ratios in China’s soils: A synthesis of observational data. Biogeochemistry 2010, 98, 139–151. [Google Scholar] [CrossRef] [Scilit]
- Liu, Q.; Xu, H.; Yi, H. Impact of fertilizer on crop yield and C:N:P stoichiometry in arid and semi-arid soil. Int. J. Environ. Res. Public Health 2021, 18, 4341. [Google Scholar] [CrossRef] [Scilit]
- Gregorich, E.G.; Greer, K.J.; Anderson, D.W.; Liang, B.C. Carbon distribution and losses: Erosion and deposition effects. Soil Tillage Res. 1998, 47, 291–302. [Google Scholar] [CrossRef] [Scilit]
- Zibilske, L.M.; Bradford, J.M. Oxygen Effects on Carbon, Polyphenols, and Nitrogen Mineralization Potential in Soil. Soil Sci. Soc. Am. J. 2007, 71, 133–139. [Google Scholar] [CrossRef] [Scilit]
- VandenBygaart, A.J.; Kroetsch, D.; Gregorich, E.G.; Lobb, D. Soil C erosion and burial in cropland. Glob. Change Biol. 2012, 18, 1441–1452. [Google Scholar]
- Helfenstein, J.; Ringeval, B.; Tamburini, F.; Mulder, V.L.; Goll, D.S.; He, X.; Alblas, E.; Wang, Y.; Mollier, A.; Frossard, E. Understanding soil phosphorus cycling for sustainable development: A review. One Earth 2024, 7, 1727–1740. [Google Scholar] [CrossRef] [Scilit]
- Zaman, W.; Ayaz, A.; Puppe, D. Biogeochemical cycles in plant–soil systems: Significance for agriculture, interconnections, and anthropogenic disruptions. Biology 2025, 14, 433. [Google Scholar] [CrossRef] [Scilit]
- Padilla, F.M.; Gallardo, M.; Manzano-Agugliaro, F. Global trends in nitrate leaching research in the 1960–2017 period. Sci. Total. Environ. 2018, 643, 400–413. [Google Scholar] [CrossRef] [Scilit]
- Wang, Z.H.; Li, S.X. Chapter Three-Nitrate N loss by leaching and surface runoff in agricultural land: A global issue (a review). Adv. Agron. 2019, 156, 159–217. [Google Scholar]
- Tang, X.; Hu, J.; Lu, Y.; Qiu, J.; Dong, Y.; Li, B. Soil C, N, P stocks and stoichiometry as related to land use types and erosion conditions in lateritic red soil region, south China. Catena 2022, 210, 105888. [Google Scholar] [CrossRef] [Scilit]
- Chtouki, M.; Naciri, R.; Oukarroum, A. A review on phosphorus drip fertigation in the Mediterranean region: Fundamentals, current situation, challenges, and perspectives. Heliyon 2024, 10, e25803. [Google Scholar] [CrossRef] [Scilit] [PubMed]
- Doydora, S.; Gatiboni, L.; Grieger, K.; Hesterberg, D.; Jones, J.L.; McLamore, E.S.; Peters, R.; Sozzani, R.; Van den Broeck, L.; Duckworth, O.W. Accessing legacy phosphorus in soils. Soil Syst. 2020, 4, 74. [Google Scholar] [CrossRef] [Scilit]
- Wang, Y.; Zhang, X.; Huang, C. Spatial variability of soil total nitrogen and soil total phosphorus under different land uses in a small watershed on the Loess Plateau, China. Geoderma 2009, 150, 141–149. [Google Scholar] [CrossRef] [Scilit]
- Zhao, X.; Xue, J.F.; Zhang, X.Q.; Kong, F.L.; Chen, F.; Lal, R.; Zhang, H.L. Stratification and storage of soil organic carbon and nitrogen as affected by tillage practices in the North China Plain. PLoS ONE 2015, 10, e0128873. [Google Scholar]
- Hou, E.; Luo, Y.; Kuang, Y.; Chen, C.; Lu, X.; Jiang, L.; Luo, X.; Wen, D. Global meta-analysis shows pervasive phosphorus limitation of aboveground plant production in natural terrestrial ecosystems. Nat. Commun. 2020, 11, 637. [Google Scholar] [CrossRef] [Scilit]
- Nizbat, Z.; Solaiman, Z.M.; O’Connor, J.; Siddique, K.H.; Bolan, N. Chapter Two-Clay-based carbon stabilisation of organic amendments for enhanced soil organic carbon sequestration in agricultural soils. Adv. Agron. 2025, 193, 79–145. [Google Scholar]
- Wu, X.; Zhang, Z.; Cai, C.; Zhou, J.; Zhang, W. Soil type regulates the divergent loss characteristics of sediment associated carbon and nitrogen in different size classes during rainfall erosion on cultivated lands. J. Environ. Manag. 2024, 354, 120479. [Google Scholar] [CrossRef] [Scilit]
- Fei, K.; Sun, T.; Deng, L.; Zhang, L.; Wu, Y.; Fan, X.; Dong, Y. Effects of rainfall intensity and slope gradients on total carbon, nitrogen, and phosphorus lateral transport under simulated extraordinary rainstorm. J. Soil Water Conserv. 2022, 77, 589–599. [Google Scholar]
- Rimal, B.K.; Lal, R. Soil and carbon losses from five different land management areas under simulated rainfall. Soil Tillage Res. 2009, 106, 62–70. [Google Scholar] [CrossRef] [Scilit]
- Wang, N.; Wang, L.; Jin, L.; Wu, J.; Pang, M.; Wei, D.; Li, Y.; Wang, J.; Xu, T.; Yang, Z.; et al. Rainfall Runoff and Nitrogen Loss Characteristics on the Miyun Reservoir Slope. Water 2024, 16, 786. [Google Scholar] [CrossRef] [Scilit]
- Bin, H.; Li, Q.; Zhang, P.; Li, W.; Xue, X.; Zou, S.; Zhang, Q. Effects of elevation on ecological stoichiometry of plant leaves, litter, and soils in Pseudotsuga sinensis forest in the Karst Mountain region, Southwest China. J. Soil Sci. Plant Nutr. 2022, 22, 3582–3597. [Google Scholar] [CrossRef] [Scilit]

Disclaimer/Publisher’s Note: The statements, opinions and data contained in all publications are solely those of the individual author(s) and contributor(s) and not of MDPI and/or the editor(s). MDPI and/or the editor(s) disclaim responsibility for any injury to people or property resulting from any ideas, methods, instructions or products referred to in the content. |
© 2026 by the authors. Licensee MDPI, Basel, Switzerland. This article is an open access article distributed under the terms and conditions of the Creative Commons Attribution (CC BY) license.