


Abstract
Analyzing three-dimensional (3D) phenotypic parameters of maize seedlings is of significant importance for maize cultivation and selection. However, existing methods often struggle to balance cost, efficiency, and accuracy, particularly when capturing the complex morphology of seedlings characterized by slender stems. To address these issues, this study proposes a novel end-to-end automated framework for extracting phenotypes using only consumer-grade RGB cameras. The pipeline initiates with Instant-NGP to rapidly reconstruct dense point clouds, establishing the 3D data foundation for phenotypic extraction. Subsequently, we formulate a directed topological graph-based mechanism. By mathematically defining bifurcation constraints via vector analysis, this mechanism guides a depth-first traversal strategy to explicitly disentangle stem and leaf skeletons. Building upon these decoupled skeletons, organ-level point cloud segmentation is achieved through constraint-based expansion, followed by density-based spatial clustering (DBSCAN) to detect individual leaves. Algorithms combining point cloud geometry with 3D Euclidean distance are also implemented to calculate key phenotypes including plant height and stem width. Finally, single-leaf skeleton fitting is used to estimate leaf length, and principal component analysis (PCA) is adopted to determine the stem–leaf angle, realizing the comprehensive automatic extraction of maize seedling phenotypes. Experiments show that the proposed method achieves high accuracy in extracting key phenotypic parameters. The mean relative errors for plant height, stem width, leaf length, stem-leaf angle, and leaf area are 0.76%, 2.93%, 1.26%, 2.13%, and 3.33%, respectively. Compared with existing methods as far as we know, the proposed method significantly improves extraction efficiency by reducing the processing time per plant to within 5 min while maintaining such high accuracy.
1. Introduction
Maize is a fundamental staple crop that, together with rice and wheat, provides the primary source of caloric intake for billions of people worldwide [1]. Maize is also a critical component of animal feed and serves as a raw material for various industrial applications, notably in the production of biofuels [2]. The phenotype of maize seedlings, such as growth vigor and leaf morphology, directly influences their subsequent growth potential, stress resistance, and final yield performance [3,4,5,6,7,8]. Understanding seedling traits not only enhances breeding strategies but also helps optimize cultivation practices, contributing to increased productivity and food security [9]. Therefore, an automated in-depth analysis of maize seedling phenotypes is of significant theoretical and practical importance for improving the overall yield performance of maize in subsequent growth stages.
The acquisition of plant phenotypic parameters is generally classified into manual, contact-based, and non-contact methods. While widely used, manual and contact-based techniques are often time-consuming, resource-intensive, and may lead to physical damage, thereby limiting their applicability in large-scale or long-term studies [10,11,12,13]. Compared to manual and contact-based methods, non-contact plant phenotyping analysis has recently been widely applied in plant incubators to monitor dynamic changes in plant phenotypes [14,15,16,17]. Recently, many scholars have focused on non-contact plant phenotyping analysis [18,19,20]. Liu et al. proposed a novel two-dimensional phenotyping approach that integrates RGB images, the PROSAIL physical model, and a Transformer-based deep learning model to improve the accuracy of crop leaf area index (LAI) estimation [21]. A recent study developed a deep learning method called Point-Line Net, based on the Mask R-CNN framework, to automatically recognize and quantify leaves and stalks as well as track their trajectories in maize field RGB images, achieving high detection accuracy (mAP50 of 81.5%) and proposing a lightweight keypoint detection branch for the detailed structure characterization [22]. A leaf counting method has been proposed by formulating leaf counting as an object detection problem using a YOLOv3-based architecture, enabling automated counting of leaves in both cauliflower and Arabidopsis datasets [23]. However, such approaches have primarily focused on two-dimensional phenotyping of plants using RGB images. In practice, plant foliage often overlaps spatially, exhibits chromatic similarities with background elements, and is subject to varying lighting conditions, which complicates accurate phenotyping [24].
Considering these challenges, three-dimensional reconstruction of plants for phenotypic information is increasingly being adopted as an alternative to traditional two-dimensional phenotypic analysis. Currently, 3D sensing technologies applied to plant phenotyping mainly include LiDAR [25,26,27,28,29], depth cameras [30,31], multi-view stereo (MVS) [32], and structure-from-motion (SFM) [33]. Although many researchers segment acquired 3D plant point clouds to obtain organ-level point clouds for subsequent phenotypic analysis, relatively few studies have addressed the geometric analysis of plant phenotypes following semantic recognition [4,34].
In recent years, with the development of 3D reconstruction and point cloud processing technologies, increasing attention has been paid to the automatic extraction and analysis of key phenotypic parameters from 3D point clouds. A method based on structure-from-motion to reconstruct sweet potato plants from images captured at different viewpoints was proposed [35]. Plant phenotypic parameters, including leaf area, plant height, plant number, and leaf area index, were monitored during the growth period. The results demonstrated a high correlation between the point cloud-derived measurements and the actual values. However, the lengthy 3D reconstruction time of this approach renders it unsuitable for high-throughput plant phenotyping research. A recent study has demonstrated the effectiveness of UAV-based LiDAR for three-dimensional reconstruction and structural analysis of crop fields. For example, LiDAR data collected via UAVs have been successfully utilized to assess variations in the vertical structure of maize plants subjected to different degrees of lodging, with LiDAR-derived plant height measurements showing strong agreement with manual measurements, thereby confirming the accuracy and reliability of this approach [36]. Although LiDAR can directly obtain the distance between two points in point clouds and thus rapidly calculate plant phenotypes, its applicability to indoor plant phenotyping remains constrained by signal occlusion, surface reflections, and inherent spatial limitations in indoor environments. In contrast, depth cameras are less susceptible to surface reflection interference and can stably collect data in indoor or close-range scenarios, thus making them more suitable for phenotyping research on plant seedlings or in growth chambers. The Kinect depth camera has emerged as a significant tool for acquiring 3D information and has been widely applied for the phenotypic analysis of various crops, including maize, soybean, peanut, flowers, and diverse seedlings [37,38,39,40,41,42,43]. Moreover, Wei et al. developed a point cloud acquisition system using the Kinect v2 depth camera, which incorporated an enhanced RANSAC algorithm for coarse registration and a symmetric objective function-based ICP algorithm for fine registration to overcome challenges associated with the thin stems and small leaves of jasmine plants [44]. In the context of maize phenotyping, a heterogeneous maize data collection system was constructed using three Kinect v2 sensors for stem and leaf recognition and phenotypic detection at the seedling stage [45]. This method applied the improved RANSAC-TrICP algorithm for 3D point cloud registration and 3D model reconstruction, and combined eigenvalue decomposition, normal analysis and the DBSCAN algorithm to realize clustering recognition of stems, leaves and individual leaves. Although the system is effective, its practical application faces limitations due to high sensor costs and complex setup, along with reconstruction accuracy susceptibility to errors from dependencies on precise registration algorithms. With the rapid development of high-throughput phenotyping (HTP), there is still a lack of platforms capable of automatically, rapidly, low-costly, and accurately acquiring and analyzing three-dimensional plant phenotypes [46,47].
Overall, current 3D plant phenotyping techniques face significant challenges, including low reconstruction efficiency, limited organ-level accuracy, and the lack of robust automated frameworks. Although substantial research has been conducted on 2D phenotyping methods, their limited spatial dimensions hinder precise phenotypic measurements. On the other hand, while 3D methods offer more comprehensive spatial data, their relatively low throughput makes them unsuitable for large-scale applications. These limitations significantly restrict the efficient advancement of smart agriculture. To overcome the above problems, an automated 3D maize seedling phenotyping via topologically-constrained Laplacian contraction with NeRF (Auto3DPheno) is developed to extract three-dimensional phenotypic parameters of maize seedlings. This method significantly enhances the efficiency of 3D reconstruction and automates the extraction of key phenotypic traits, including leaf number, plant height, leaf length, stem width, stem-leaf angle, and leaf surface area. The main contributions of this manuscript are summarized as follows:
- High-Fidelity Reconstruction. The integration of Auto3DPheno-3D reconstruction component breaks the efficiency bottleneck of traditional 3D reconstruction. This innovation reduces reconstruction time to minutes while utilizing low-cost consumer-grade RGB cameras, establishing a robust foundation for scalable, high-throughput phenotyping without reliance on the expensive equipment.
- Robust Organ Disentanglement. Addressing the challenge of “slender stems” in maize seedlings, we formulated a novel Topologically-Constrained Laplacian Contraction strategy (Auto3DPheno-OrganSeg). This strategy incorporates a directed topological graph to mathematically identify bifurcation nodes. This allows for the precise disentanglement of intertwined stem and leaf instances, ensuring accurate organ-level definition even in complex morphologies.
- Semantic-Driven Automatic Segmentation. The Auto3DPheno-RoI Segmentation component is designed to automate the semantic interpretation of unstructured point clouds. By eliminating the need for manual Region of Interest (ROI) extraction, this module seamlessly facilitates organ-level data for subsequent downstream analysis, thereby significantly enhancing the automation level of the entire phenotypic pipeline.
- End-to-End Automated Phenotyping Pipeline. A fully automated video-to-parameter pipeline is established, capable of independently processing MP4 data. From raw video input to the final output of the key phenotypic trait, the system enables a closed-loop workflow. This seamless integration ensures compatibility with diverse phenotyping platforms, expanding the boundaries of intelligent agricultural monitoring.
2. Materials and Methods
2.1. Experimental Design
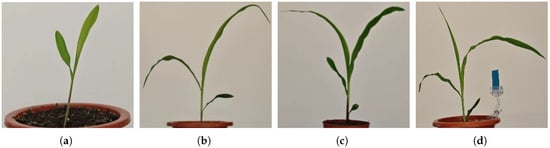
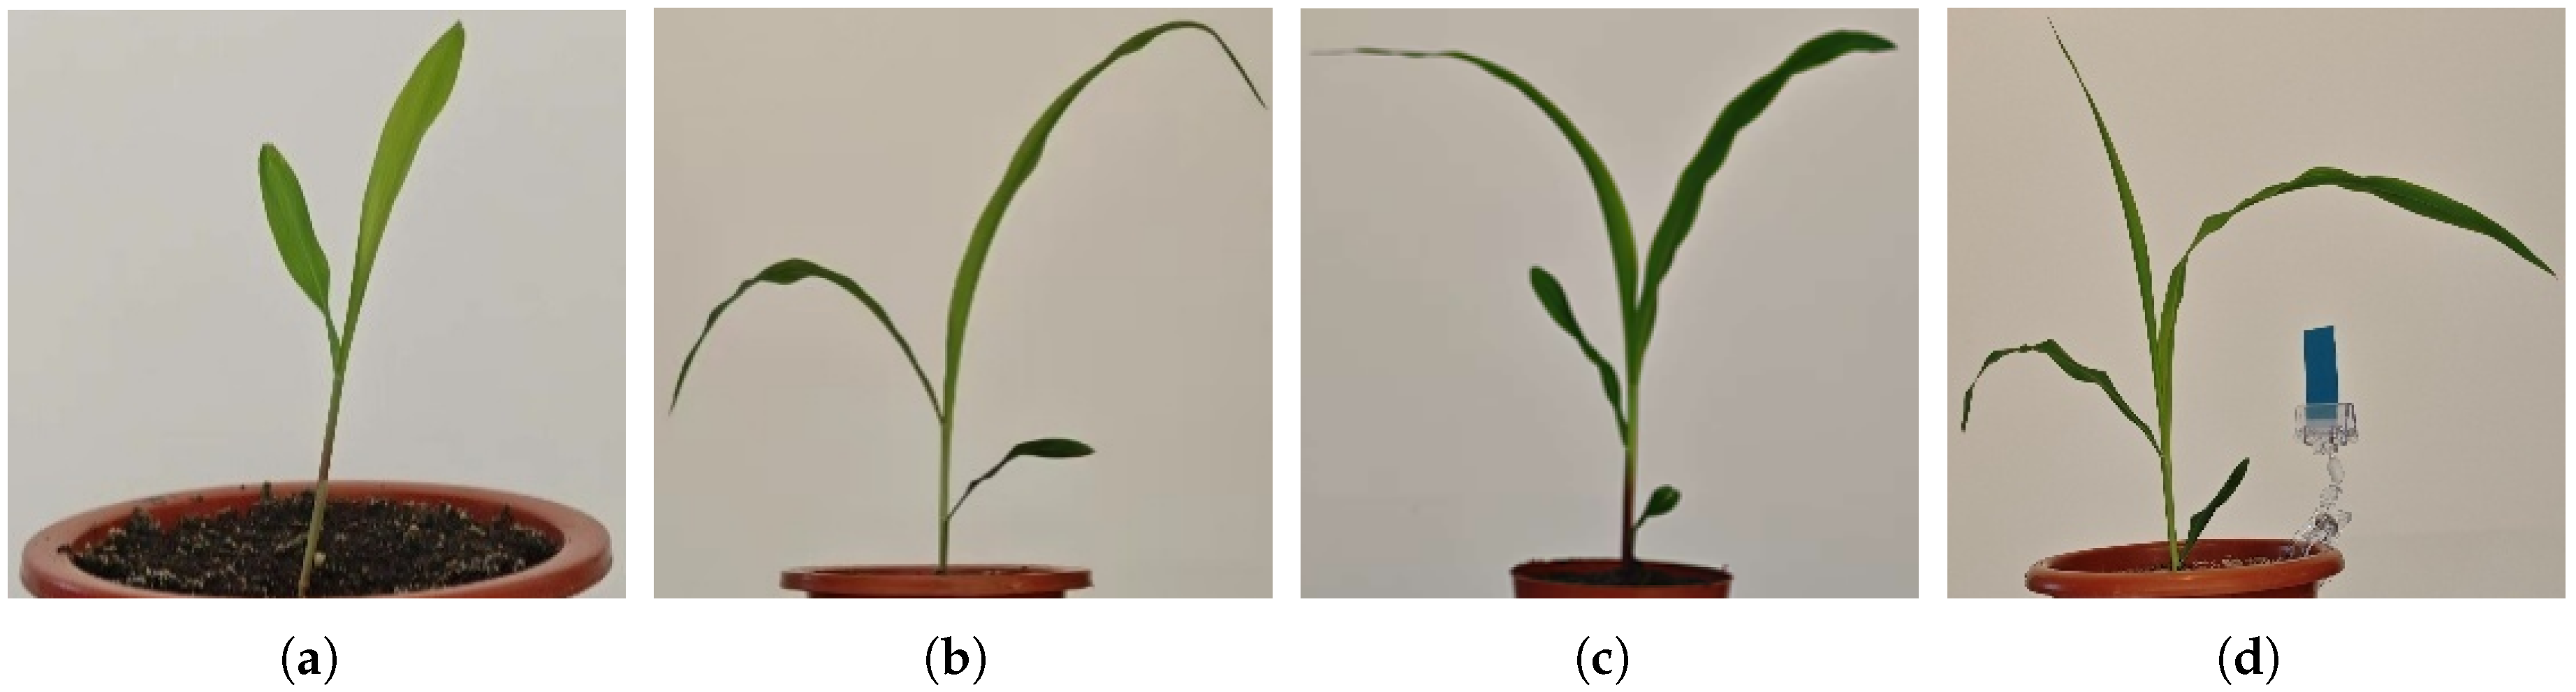
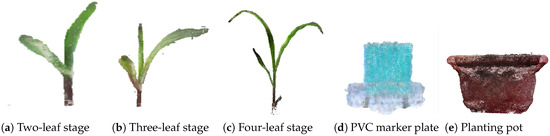
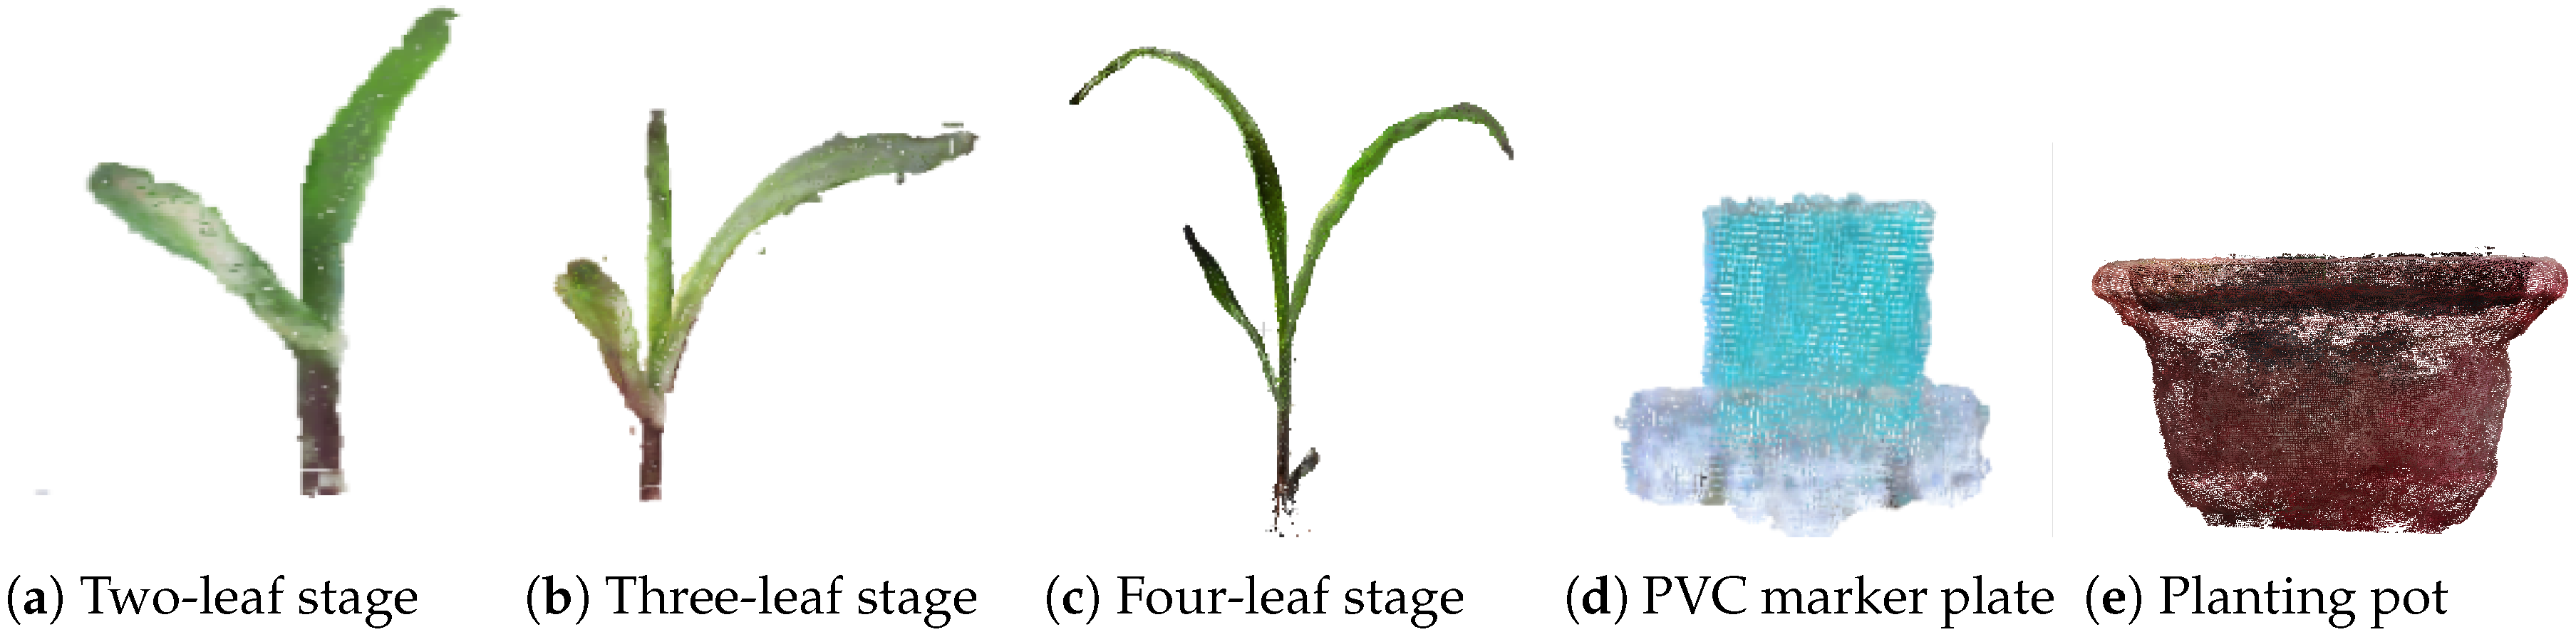
In this study, maize seedlings were selected as the research subjects, and data were collected from Jilin Province, China. Due to differences in leaf number and developmental traits, phenotypic variability among maize seedlings persists throughout the seedling stage. Therefore, seedlings were selected at intervals from 10 days after emergence to the pre-jointing stage, including those at the two-leaf, three-leaf, and four-leaf stages [48]. All maize seedlings were grown in pots under controlled indoor conditions. To better compute phenotypic parameters of the maize seedlings, a blue PVC marker plate measuring 50 × 50 mm was placed next to each seedling. The marker plate served as a calibration reference, enabling the determination of a size factor for scaling and dimension correction in subsequent phenotypic analyses. Figure 1 shows examples of images from the maize dataset and PVC marker plate.
Figure 1.
Maize dataset images and PVC marker plate image. (a) Two-leaf maize seedling image. (b) Three-leaf maize seedling image. (c) Four-leaf maize seedling image. (d) Maize seedling image with PVC marker plate.
2.2. Data Acquisition and Preprocessing
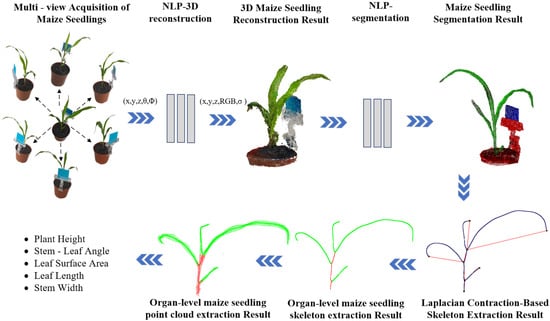
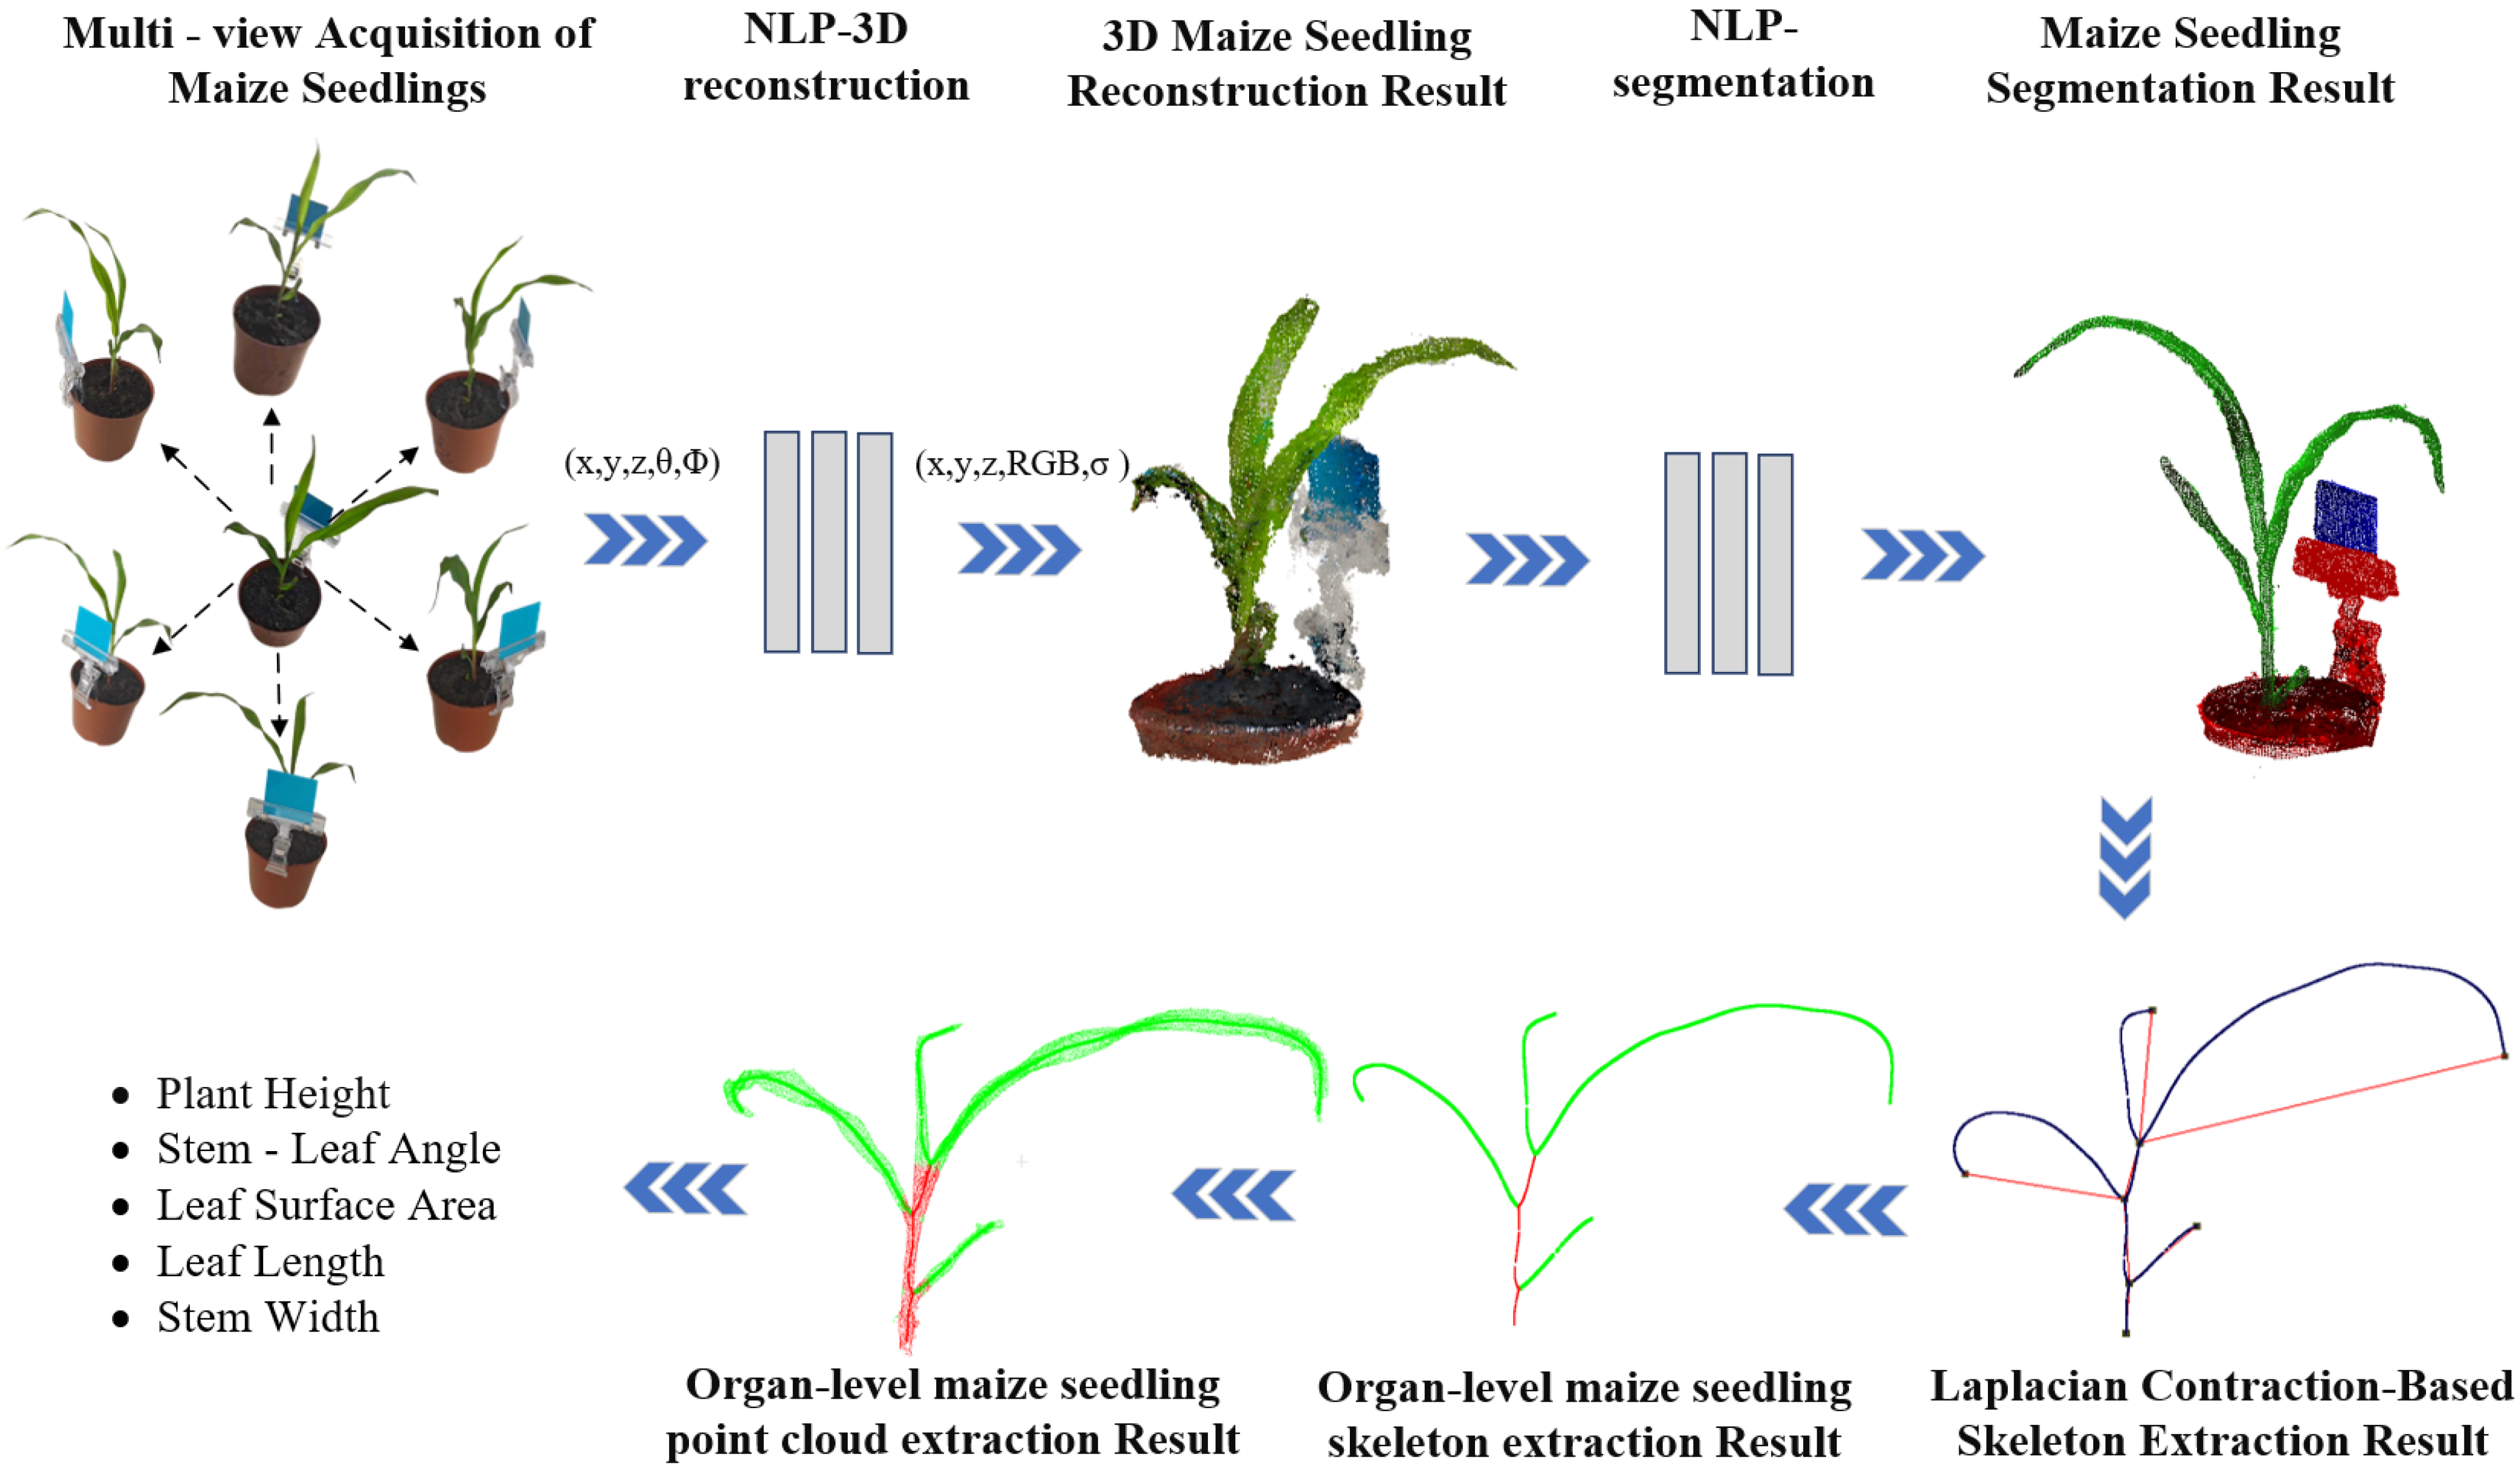
This study is structured around three main components: 3D reconstruction of maize seedlings, point cloud segmentation, and extraction of phenotypic parameters. The overall workflow is depicted in Figure 2.
Figure 2.
Overall workflow of the method.
Data acquisition was conducted using a flexible imaging strategy that does not strictly limit the light source or camera model. However, the framework requires that the spectral range of the light source falls within the visible waveband of the camera’s image sensor to ensure effective data capture. To guarantee reconstruction quality, it is essential that the acquisition process maintains stable exposure and clear imaging of the seedlings. In this study, as a representative implementation, videos were captured in MP4 format ( resolution at 50 fps) using a Canon EOS M6 camera (Canon Inc., Tokyo, Japan) under uniformly distributed indoor LED lighting. These videos were decomposed into image sequences at the original frame rate, from which over 100 multi-angle frames were extracted to build a robust dataset for each seedling.
To reconstruct the 3D structure of the maize seedlings, our proposed Auto3DPheno-3D reconstruction was adopted, which leverages Instant-NGP, an efficient implementation of neural radiance fields (NeRF) [49]. In order to construct a training dataset for 3D reconstruction, geometric relationships among multi-view images were exploited based on the SFM algorithm to recover camera poses. This process was carried out using COLMAP, an open-source SFM tool that provided automated estimation of camera intrinsic parameters, extrinsic parameters, and projection correspondences between images and 3D scene points (tracks). The intrinsic parameters of each image are represented by the camera intrinsic matrix , which is defined as:
where and are the focal lengths along the x and y axes (in pixels), and denotes the principal point coordinates, typically located at the image center.
The extrinsic parameters consist of a rotation matrix and a translation vector , which together form a camera-to-world transformation matrix:
After the estimation of camera poses, the COLMAP outputs were converted into the standard input format required by the reconstruction model. For each image, the corresponding file path, associated transformation matrix (comprising rotation and translation), and scene bounding parameters were systematically organized to establish the spatial and geometric context of the reconstruction [50].
2.3. 3D Maize Seedling Reconstruction
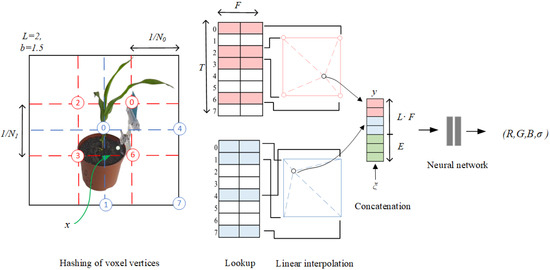
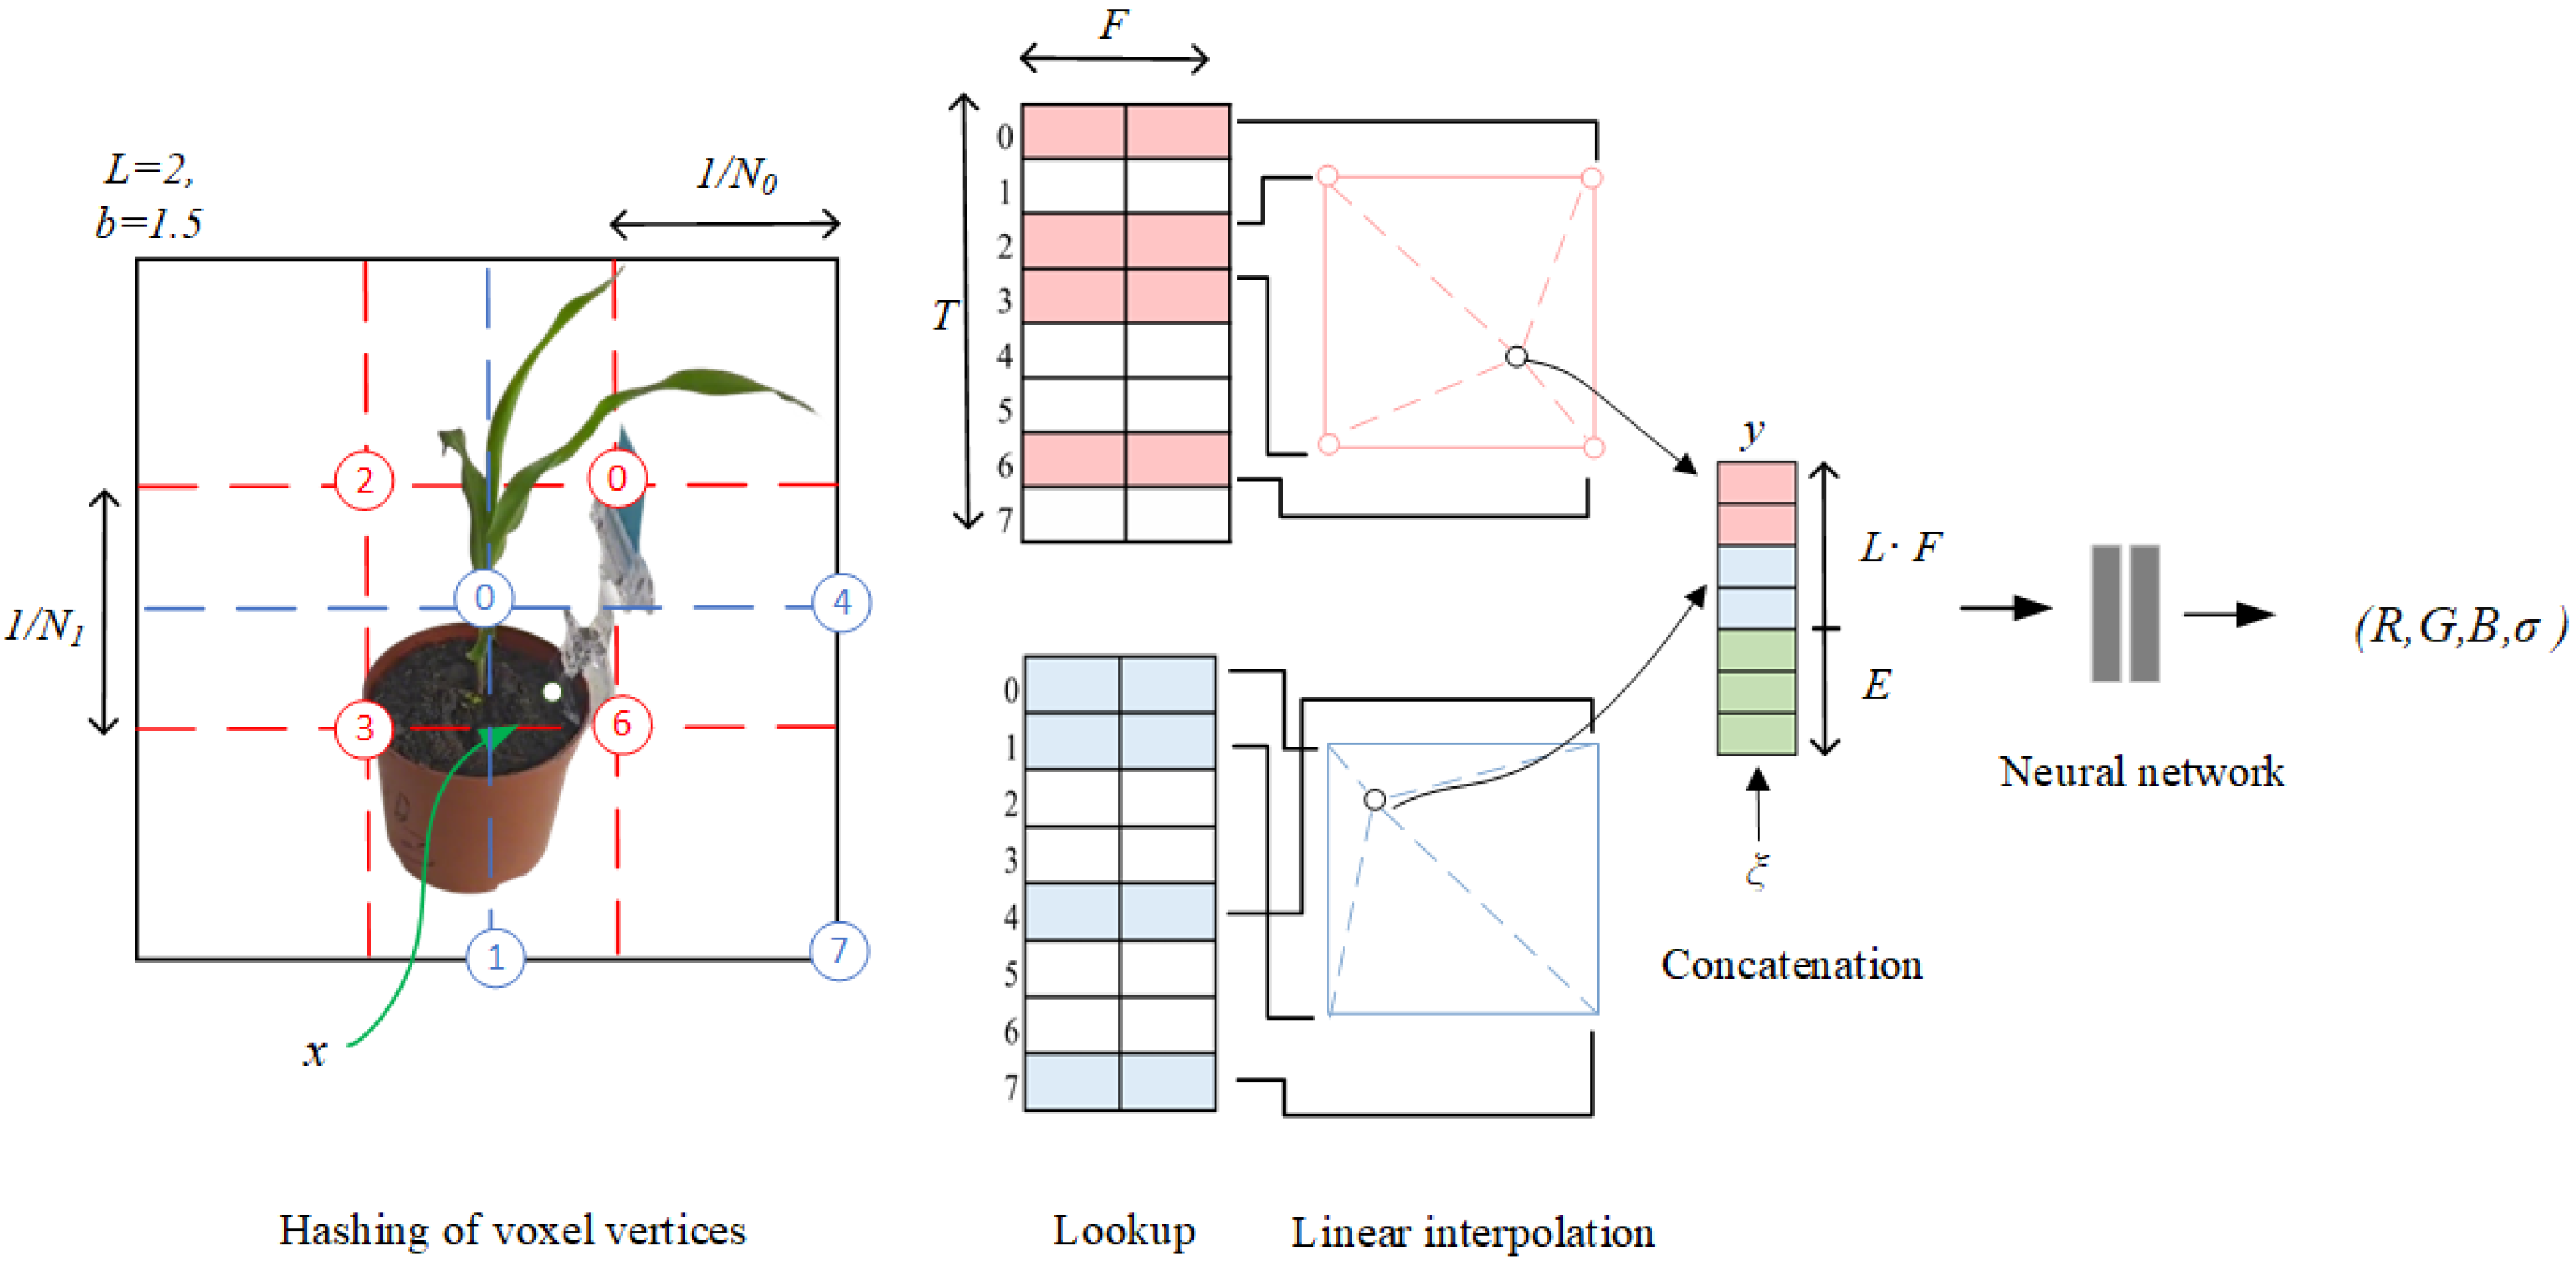
With the multi-view images and calibrated camera parameters prepared, our proposed Auto3DPheno-3D reconstruction training was subsequently performed to reconstruct the detailed 3D structure of the maize seedlings, and its training principle involves several key steps and mathematical calculations [51]. The overall training pipeline is shown in Figure 3.
Figure 3.
Reconstruction flow chart of Auto3DPheno-3D reconstruction. Where b denotes the ratio of the number of grids along one direction between adjacent resolutions, L denotes the number of layers, E denotes the feature dimension of camera pose information, T denotes the size of the hash table, and represent the scale range of multiple resolutions.
2.4. Maize Seedling Segmentation
In order to automatically segment maize seedlings, PVC marker plates, and flowerpots from 3D scenes, this study adopts the PointNet++ deep learning model as a component of Auto3DPheno-RoI Segmentation to classify the collected 3D point cloud data [52]. The detailed hierarchical architecture of Auto3DPheno-RoI Segmentation, including the sampling, grouping, and feature extraction layers, is provided in the Supplementary Materials: Maize Seedling Segmentation Implementation.
In this study, the model was trained for a total of 100 epochs with a learning rate of 0.001. The input data for the Auto3DPheno-RoI Segmentation consisted of point clouds reconstructed by Auto3DPheno-3D reconstruction, which were annotated for training purposes.
2.5. 3D Phenotypic Parameter Extraction
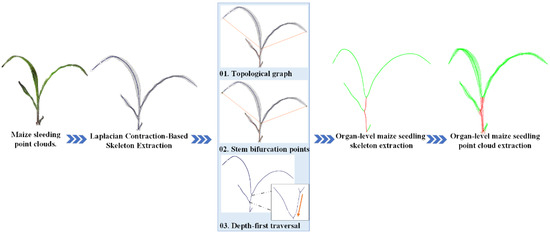
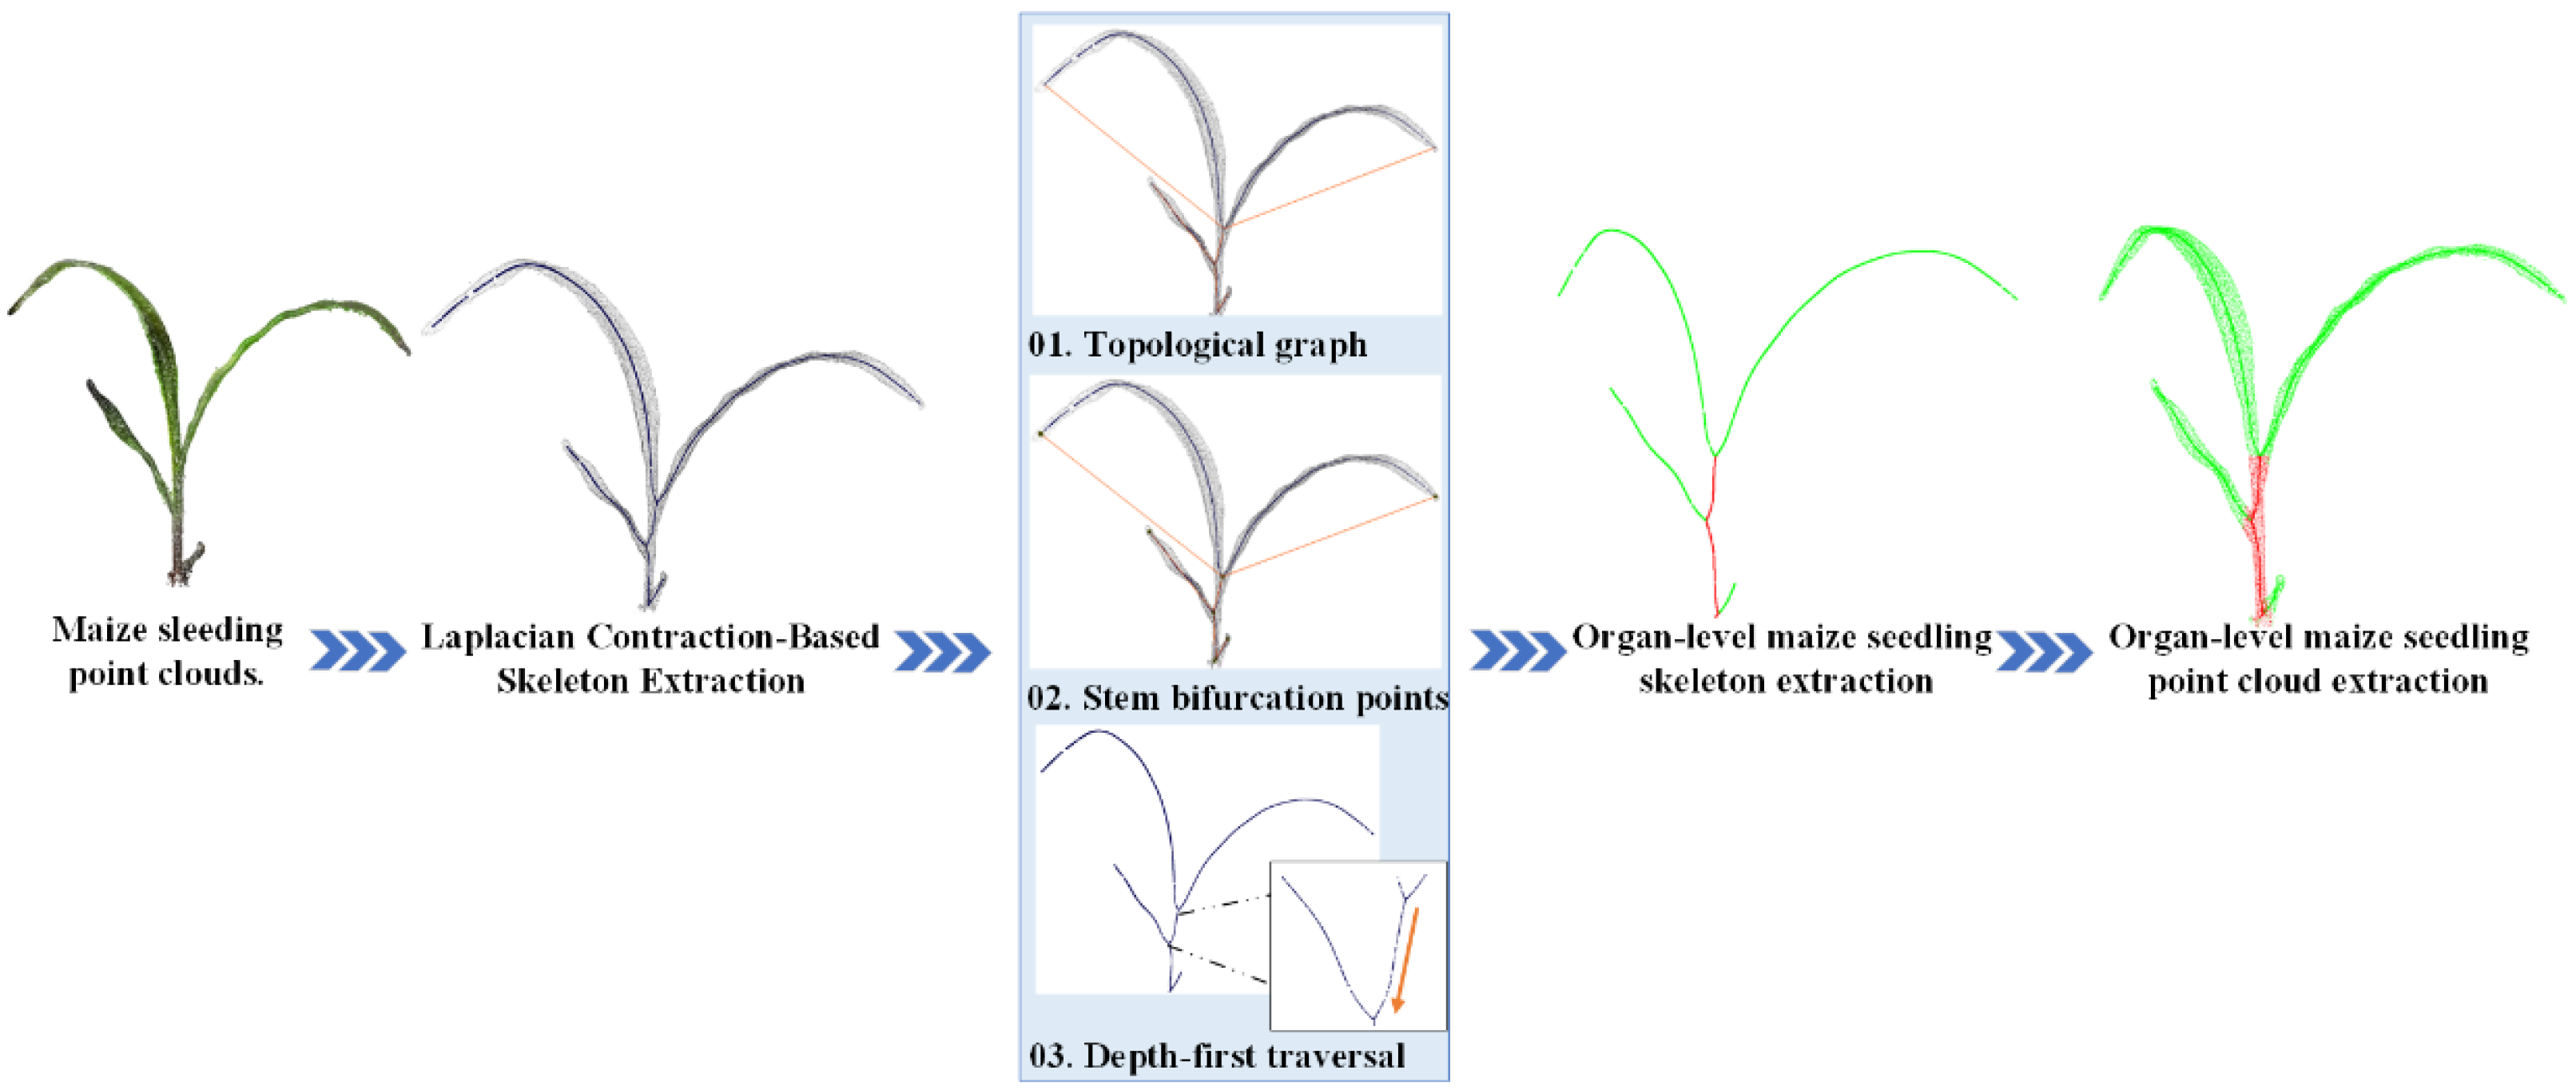
To enable precise extraction of phenotypic parameters for maize stem and leaf organs, high-resolution segmentation of maize point cloud data is essential. In this study, a topologically-constrained Laplacian contraction algorithm was formulated to extract the skeleton from maize point clouds. Subsequently, organ-level segmentation was performed based on the skeleton and its topological vectors. Finally, a dilation operation was applied to the segmented skeletons to reconstruct organ-level point clouds at the seedling stage, thus facilitating the accurate derivation of three-dimensional phenotypic parameters for maize seedlings. The overall workflow is illustrated in Figure 4.
Figure 4.
The overall workflow of 3D phenotypic parameter extraction.
2.5.1. Laplacian Contraction-Based Skeleton Extraction
The Laplacian operator-driven point cloud skeleton extraction method demonstrates remarkable robustness and computational efficiency in complex data scenarios, providing a reliable solution for skeletonization [4]. However, the significant morphological variation across maize growth stages introduces a critical challenge regarding point cloud density heterogeneity. Specifically, point cloud density fluctuates substantially during development. At the incipient two-leaf stage, the low spatial occupancy of seedlings within the imaging frame inherently results in a significantly lower number of points. In contrast, later growth stages yield extensive, high-density datasets. To robustly address this variation in data scale, we propose a size-aware parameterization strategy integrated into an adaptive Laplacian-based algorithm. The following sections elaborate on the implementation steps and technical details of this proposed method.
(1) Adaptive Neighborhood Construction. To robustly capture local geometric structures across distinct seedling growth stages, a dynamic neighborhood construction strategy is proposed. For each point , the local neighbor is determined via an adaptive k-nearest neighbors (KNN) algorithm. Crucially, unlike traditional fixed-scale approaches, the neighborhood size k is dynamically computed as:
where is the total number of points in the current point cloud. This dynamic formulation is critical for accommodating the substantial heterogeneity in point density. Unlike static parameterization, which tends to over-smooth sparse data or insufficiently attenuate noise in dense structures, this proportional strategy ensures scale invariance. Consequently, it maintains local geometric fidelity and topological consistency, remaining robust to variations in point cloud cardinality. The formal set definitions for neighbors and the standard Euclidean metric equations are provided in Supplementary Material: Laplacian Contraction-Based Skeleton Extraction.
(2) Laplacian Matrix Construction. After determining the neighborhood for each point, a constrained Laplacian matrix L is constructed to facilitate the contraction process. For additional details, please refer to the Supplemental Materials.
(3) Adaptive Point cloud contraction. Subsequent to constructing the Laplacian matrix L, an iterative contraction procedure is executed. At iteration t, the coordinates of each point are updated according to the following expression:
where is the contraction rate. To maintain structural integrity across varying growth stages, the contraction parameters are dynamically modulated via a gradient-based selection mechanism contingent on the total point count of the input:
- Contraction Rate (): the value of is adjusted stepwise; a larger is employed for high-density datasets to expedite convergence, while it is attenuated for sparse early-stage point clouds to prevent over-contraction and preserve fine geometric details.
- Convergence Criteria (): the parameter is defined as the termination threshold for the iteration process. The contraction terminates when the maximum displacement falls below . Similarly, is adapted to enforce high-fidelity convergence for extensive datasets while accommodating larger inter-point distances in sparse inputs.
Detailed parameter design and sensitivity analysis for and are provided in the Supplementary Materials.
2.5.2. Organ-Level Maize Seedling Skeleton Extraction
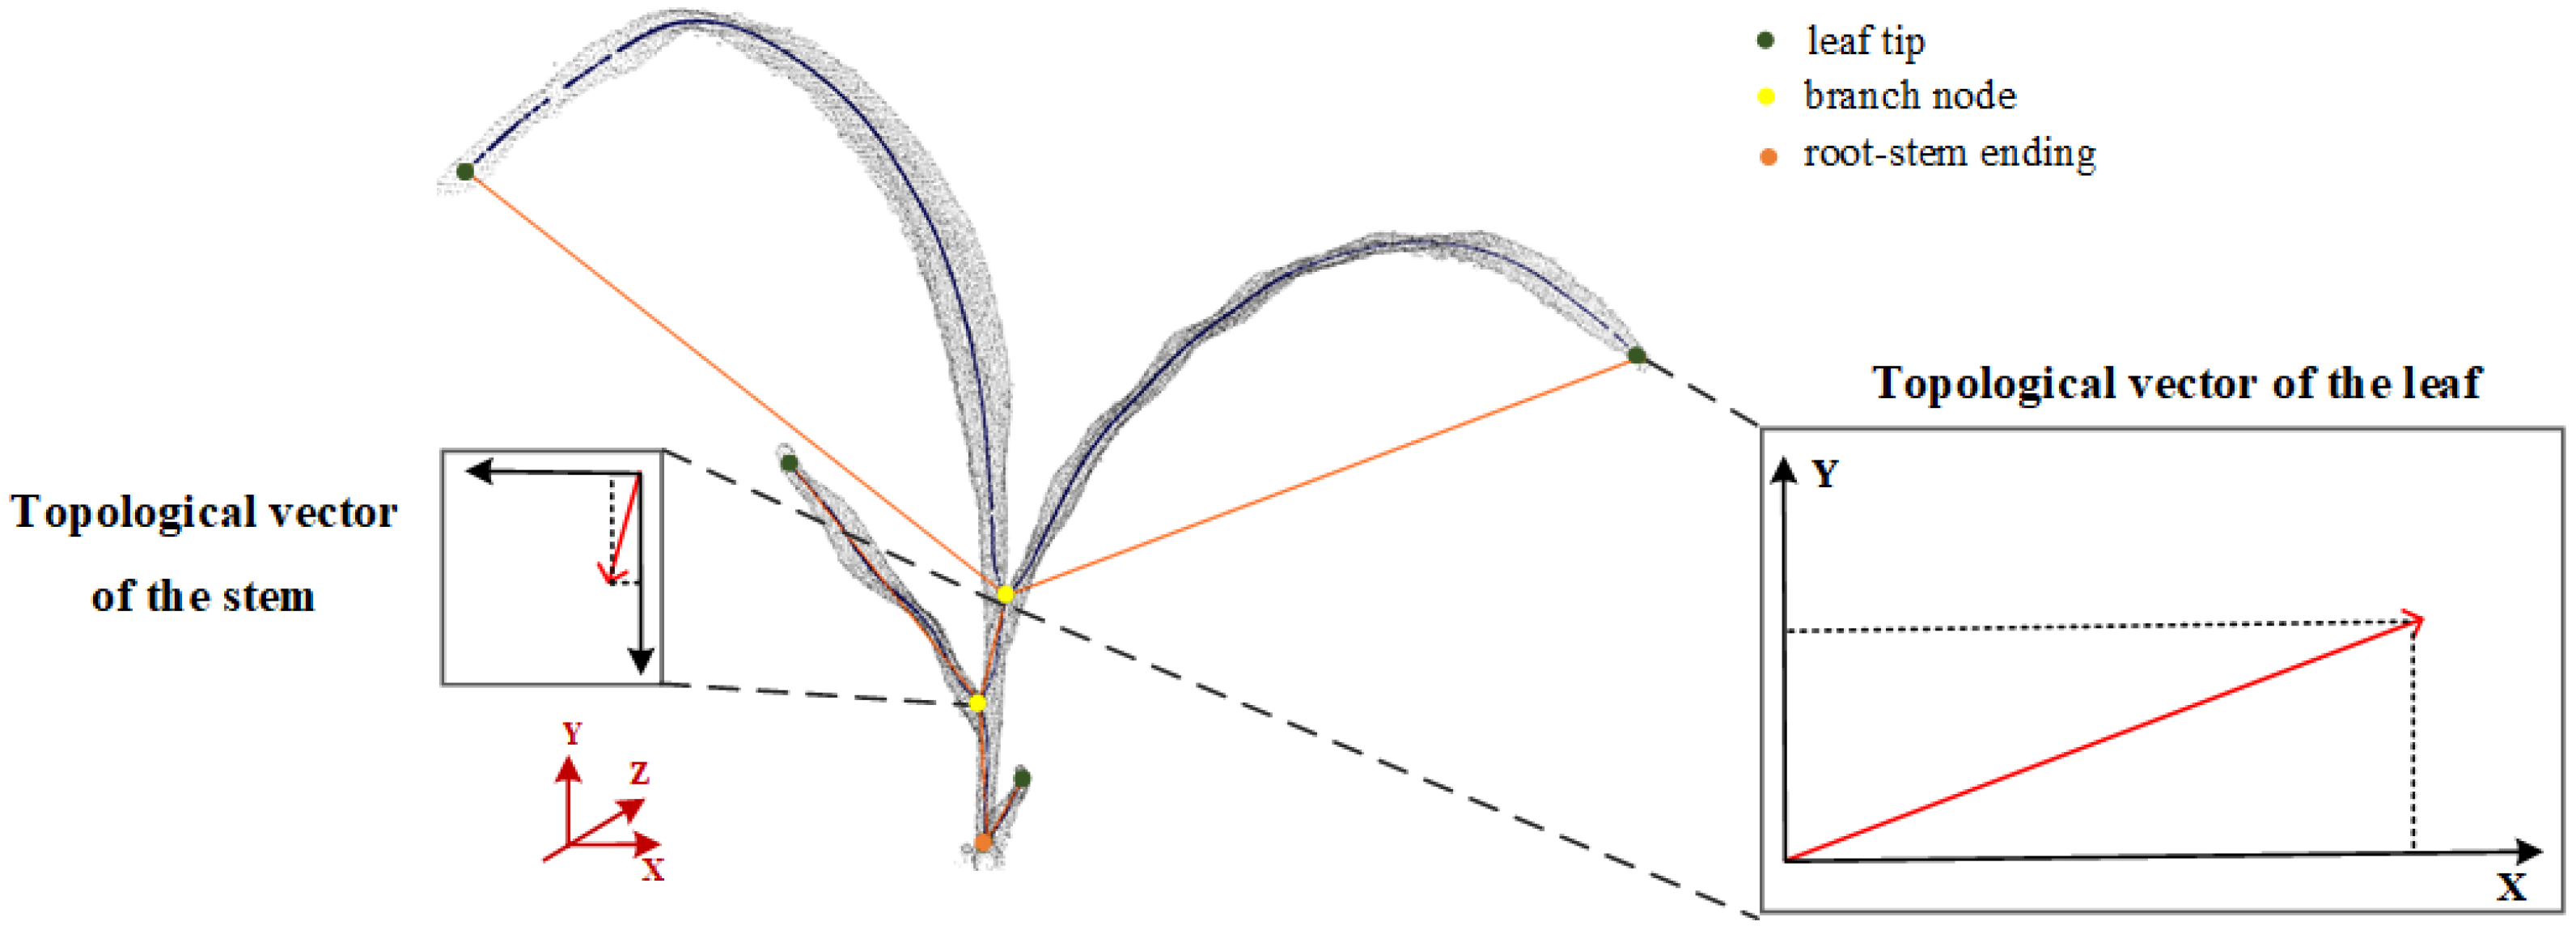
To achieve precise extraction of organ-level skeletons, this study conducted topological analysis on the contracted skeleton point cloud to construct a directed topological graph. By integrating geometric morphological features, vertices with one neighbor (degree of 1) were defined as organ-level skeleton vertices, which typically correspond to leaf tips or root-stem endings; whereas vertices with two or more neighbors (degree ≥ 2) were defined as bifurcation vertices, commonly found at stem bifurcation points. On this basis, by calculating the direction of edges in the topological graph and combining with the depth-first traversal algorithm, the automatic separation of stem and leaf skeletons was realized.
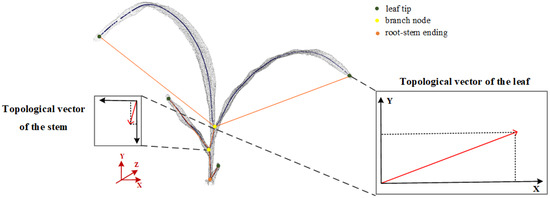
The core of this extraction lies in the construction and analysis of topological vectors to automatically distinguish between stem and leaf skeletons. As shown in Figure 5, when a bifurcation node is used as the starting node of the topological vector and the leaf tip as the ending node, the direction of all topological vectors points towards the positive y-axis. Therefore, the method for calculating the direction of the topological graph is as follows.
Figure 5.
Diagram of the Direction of Topological Vectors.
First, define the point with the minimum y value as the root-stem end, and establish the skeleton vertex set and the bifurcation node set . The direction of the topological vector in the topological graph can be defined as shown in Formula (9):
where denotes the topological vector of the leaf, with the bifurcation node fixed as the starting point; and represent the topological vector of the stem.
The organ-level skeleton point cloud of maize can be obtained by performing a depth-first traversal of the skeleton point cloud , guided by the topological vectors of maize organs. Specifically, the value of the vector is used for classification: if , the vector is considered a stem vector. Starting from the vector’s initial point, a depth-first traversal is conducted towards the terminal point, and the traversed points are added to a stack . At the end of the traversal, the points remaining in form the stem skeleton point set . All other points, excluding those in the stem skeleton point set, are considered leaf skeleton points.
2.5.3. Organ-Level Maize Seedling Point Cloud Extraction
In the 3D point cloud data of maize seedlings, the stem structure exhibits an elongated and continuous tubular morphology, whose precise extraction serves as a critical foundation for plant phenotypic analysis. This method realizes the extraction of maize seedling stem point clouds through constrained expansion operations, based on the overall point cloud data of the same maize seedling and the stem skeleton extracted by the method described in Section 2.5.2. Specifically, the method employs a dual-constraint mechanism of radius constraint and height constraint to ensure extraction accuracy. Firstly, the height constraint is utilized to generate an axial mask . This mask is designed to filter points in the current point cloud whose y-coordinates fall within the y-axis height interval corresponding to the currently traversed stem segment, where denotes the lower bound and denotes the upper bound of the interval. It can accurately filter valid points within the target range, notably reducing computational complexity while efficiently eliminating interference from non-target areas.
Subsequently, a radius constraint is established by setting a maximum expansion distance parameter to in accordance with the thickness characteristics of maize stems—where D denotes the Euclidean distance between the and corresponding points of the skeleton point cloud in the plane—and defining the central axis of the cylinder as the line connecting two points formed by combining the midpoint of the plane with the and coordinates, respectively, extending along the negative y-axis and perpendicular to the plane. The Euclidean distance is then applied to compute the shortest distance from each point in the point cloud to the stem skeleton, and points with distances not exceeding the maximum expansion distance are identified as stem point clouds. Finally, the leaf point cloud consists of points that belong to the set but do not belong to the set .
2.5.4. Maize Phenotypic Calculation
Phenotypic parameters are extracted using the segmented leaf and stem organ point clouds. The detailed definitions of these phenotypic parameters and their corresponding point cloud structural characteristics are provided in the Supplementary Materials (Table S2 and Figure S1).
The plant height parameter is extracted as the difference between the maximum and minimum y-coordinate values of the plant point cloud.
For leaf point clouds , DBSCAN is applied. The clustering process is governed by two critical hyperparameters: the neighborhood radius and the minimum number of points (). Detailed parameter configurations and specific threshold settings are provided in the Supplementary Materials: Maize Phenotypic Calculation Implementation. For each cluster, the average y-coordinate is computed as its height feature. Clusters are sorted by these y-averages (from bottom to top), enabling hierarchical screening of leaf point clouds at distinct heights. The total number of clusters directly corresponds to the leaf count.
The calculation of the stem-leaf angle is realized by calculating the included angle between the stem and leaf direction vectors. Principal component analysis (PCA) is performed on the stem point cloud to extract the main direction vector. For the leaf, curve fitting is performed on the leaf skeleton point cloud, and the direction vector is calculated by extracting the base and leaf-tip points. The final angle is computed based on the vector dot-product formula.
Leaf surface area calculation leverages 3D point cloud mesh reconstruction and optimization. First, leaf point cloud normals are estimated and oriented for consistency. Next, the Alpha-shape algorithm reconstructs triangular meshes. Topology optimization (removing degenerate triangles, duplicate vertices) refines meshes. Total surface area is the sum of all triangular face areas, scaled by a conversion factor to physical units. The physical unit conversion is provided in the Supplementary Materials: Maize Phenotypic Calculation Implementation.
To calculate leaf length, a 10th-order polynomial curve fitting is performed on the leaf skeleton point cloud using the least-squares method. The physical length is subsequently obtained by accumulating Euclidean distances along the fitting curve and applying a scale factor . The detailed implementation is provided in the Supplementary Materials.
The stem width is determined by analyzing the maximum Euclidean distance between any two points within the plane across all y-axis height intervals of the stem point cloud . The specific mathematical formulation and the iterative calculation procedure are provided in the Supplementary Materials.
2.6. Experimental Environment and Parameters
The experimentation was conducted on a Windows 11 operating system, with an NVIDIA GeForce RTX 4060 Ti graphics processing unit (GPU), a 12th Gen Intel(R) Core(TM) i5-12400F central processing unit (CPU) operating at a frequency of 2.50 GHz, and 32.0 GB of Random Access Memory (RAM). The deep learning experiment adopted a Python environment, the PyTorch framework of version 2.4.1, and CUDA 11.8; the calculation of the topologically-constrained Laplacian contraction algorithm was implemented based on Python 3.8.20.
3. Results and Discussion
3.1. Evaluation Metrics
The evaluation metrics for the Auto3DPheno-RoI Segmentation results were accuracy, Intersection over Union (IoU), and mean Intersection over Union (mIoU). The performance of the Auto3DPheno-RoI Segmentation was evaluated using three key metrics: accuracy, Intersection over Union (IoU), and mean Intersection over Union (mIoU).
Accuracy refers to the proportion of correctly predicted points among all points. The accuracy is calculated as follows:
For each class c, IoU is calculated as follows:
where denotes the set of points predicted as class c, and denotes the set of ground truth points of class c.
The mean Intersection over Union (mIoU) is typically calculated as the average of the IoUs over all classes:
where C is the number of classes.
For the evaluation of plant height, leaf length, stem width, leaf area, and stem–leaf angle, the root mean square error (RMSE) and mean relative error (Mean RE) were employed as the primary evaluation metrics. The corresponding calculation formulas are given as follows:
where represents the true measured value, denotes the calculated value derived from the model, and n is the total number of samples.
3.2. Performance Evaluation of 3D Reconstruction
3.2.1. Experimental Results of 3D Reconstruction
In this study, the PVC marker plate, maize seedlings at the two-leaf stage, three-leaf stage, four-leaf stage, and planting pots were taken as the reconstruction objects. Figure 6 shows the reconstruction results of Auto3DPheno-3D reconstruction after threshold-based filtering method was applied to the axis-aligned bounding boxes (AABBs).
Figure 6.
Auto3DPheno-3D reconstruction results across different components.
3.2.2. Discussion on 3D Reconstruction Performance
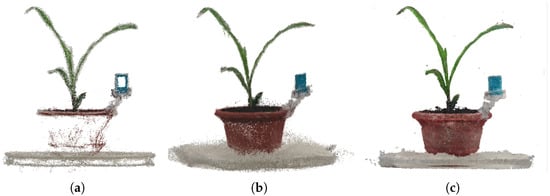
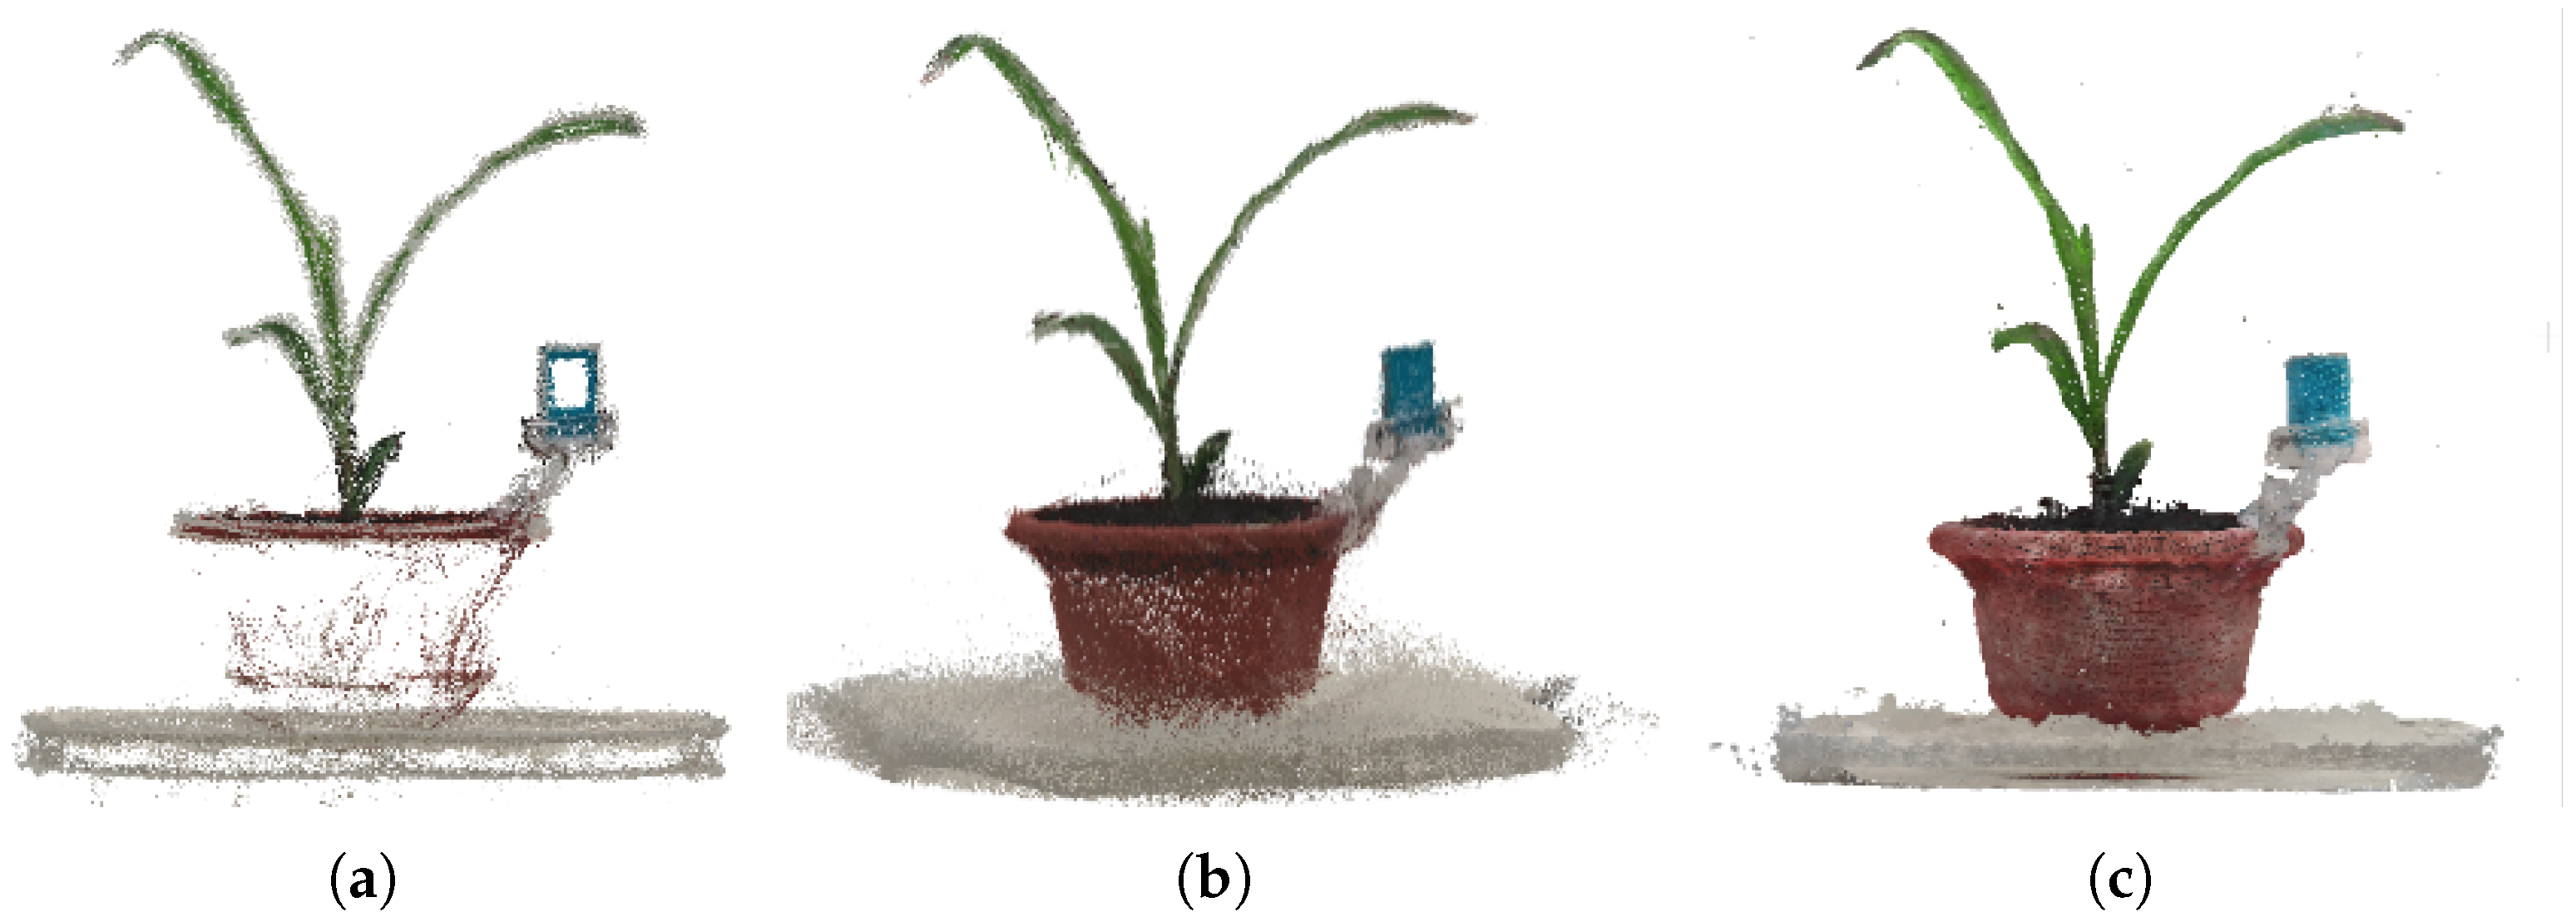
To evaluate the performance of Auto3DPheno-3D reconstruction, it was compared with Structure from Motion combined with Multi-View Stereo (SFM-MVS) and 3D Gaussian Splatting (3DGS) in terms of two key aspects: reconstruction time and reconstruction performance. The visual comparison of the reconstructed point clouds generated by different algorithms is presented in Figure 7, and quantitative data in Table 1 collectively demonstrate the superior performance of our method.
Figure 7.
Reconstruction results of different algorithms. (a) SFM-MVS. (b) 3DGS. (c) Auto3DPheno-3D reconstruction (Ours).
Table 1.
Quantitative comparison of average point cloud reconstruction quality and efficiency across maize seedling growth stages.
As shown in Figure 7 and Table 1, the reconstruction performance of SFM-MVS exhibits clear weaknesses. While it maintains a higher raw point density, its visual output reveals significant noise, geometric artifacts, and prominent holes, particularly in texture-less regions. This leads to indistinct object outlines and an overall rough geometric representation, especially for thin structures like maize leaves and PVC marker plates. These limitations of SFM-MVS are primarily attributed to its heavy reliance on local feature matching [53]. In contrast, 3DGS offers notable improvements. It achieves relatively clear object outlines and preserves more fine-grained details than SFM-MVS methods because it adopts a discrete Gaussian-based representation instead of relying on traditional point cloud or mesh generation. Nevertheless, there is still room for enhancement in its reconstruction speed, primarily as a result of a critical bottleneck derived from the high computational cost incurred by optimizing a massive number of Gaussian primitives. This issue directly leads to the consequence that its overall reconstruction time is significantly longer than what high-speed application scenarios demand [54]. However, Auto3DPheno-3D reconstruction demonstrates excellent performance by achieving a breakthrough in balancing efficiency and accuracy. By accurately restoring object outlines and fine details without the redundancy or noise found in traditional approaches, Auto3DPheno-3D provides a more robust and high-speed geometric foundation for downstream phenotypic analysis.
3.3. Analysis of Maize Seedling Segmentation
3.3.1. Maize Seedling Segmentation Results
In order to validate the performance of the Auto3DPheno-RoI Segmentation, both the training dataset and the test dataset were analyzed. The dataset employed in the experiment was specifically partitioned as follows: the training set consisted of 60 samples, the validation set included 30 samples, and the test set contained 10 samples. Notably, each set of samples covered point cloud data of maize seedlings at different growth stages, ensuring the comprehensiveness and objectivity of the evaluation.
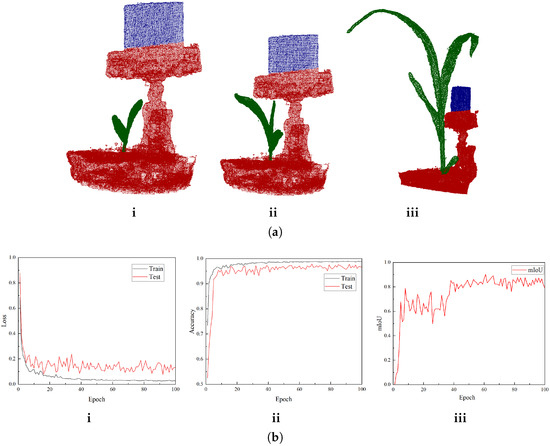
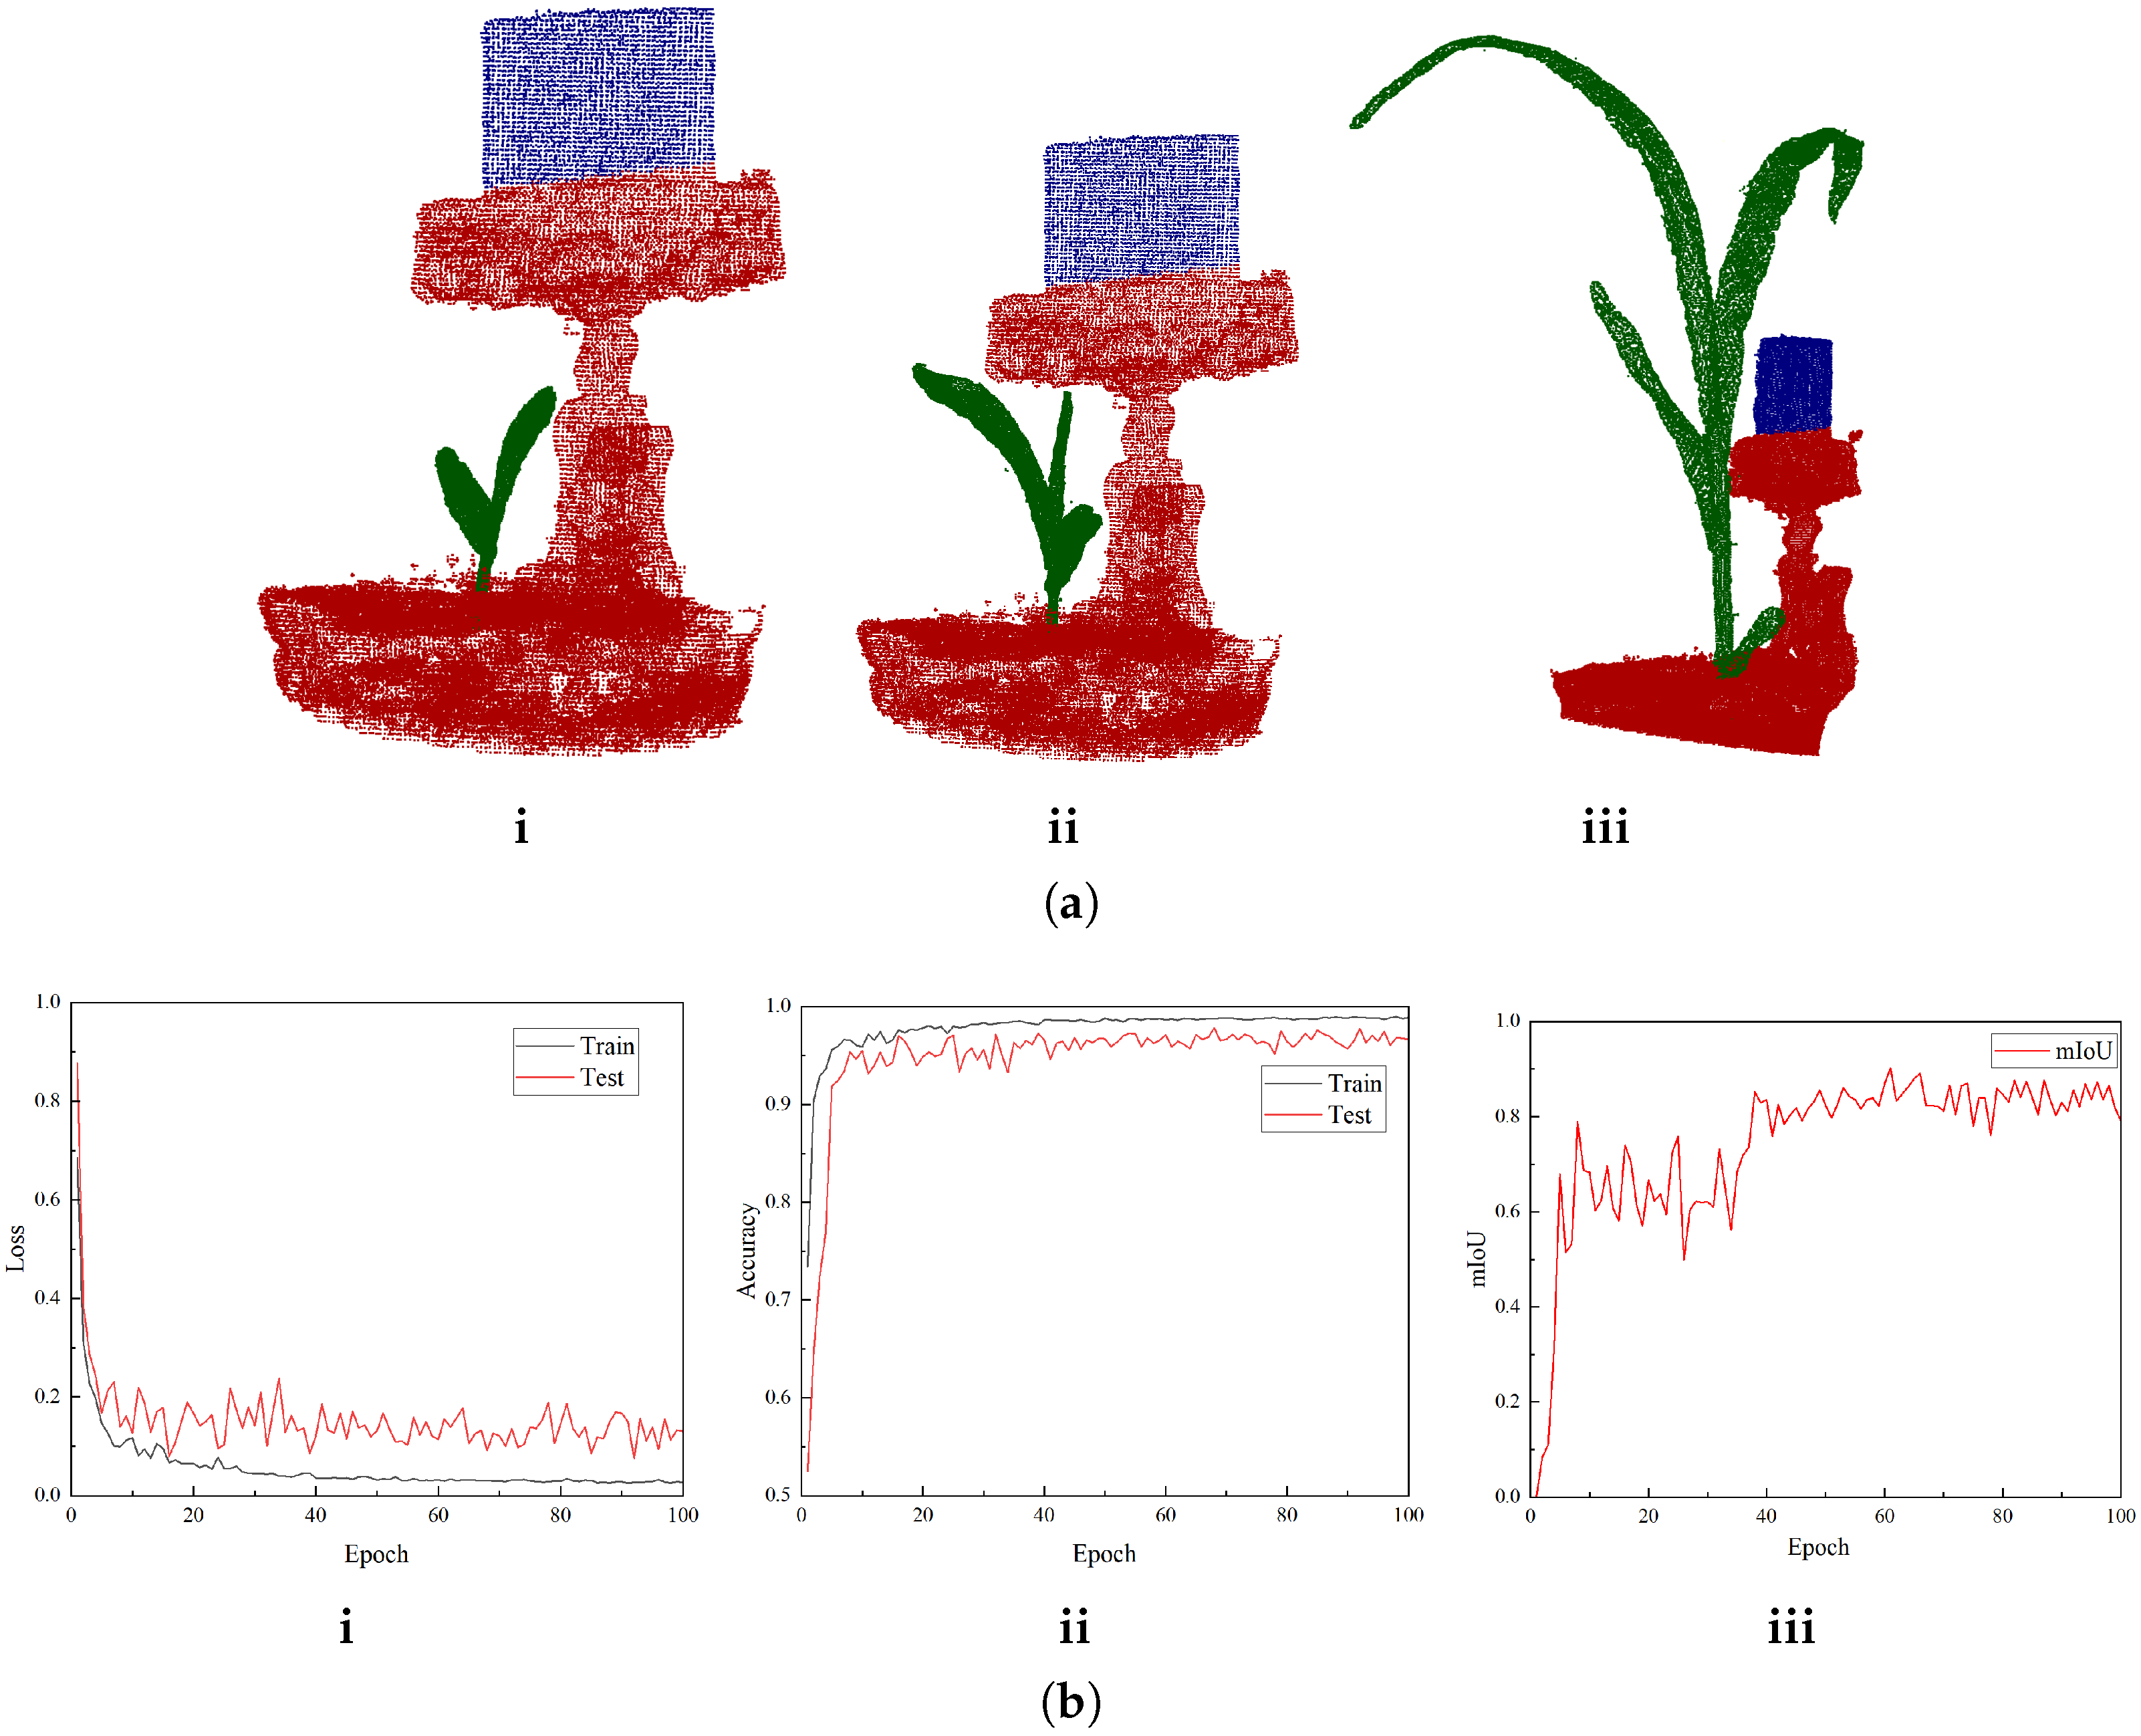
Figure 8a visualizes representative results from maize seedling samples at different growth stages, which were randomly selected from the test dataset. In these visualizations, red represents PVC markers, green denotes maize seedlings, and blue indicates the background and other irrelevant items. During the model training process, changes in training loss, accuracy, and intersection over union (IOU) for each iteration were recorded, with the relevant results shown in Figure 8b.
Figure 8.
Comprehensive evaluation of Auto3DPheno-RoI Segmentation: (a) Qualitative segmentation results across (i) two-leaf, (ii) three-leaf, and (iii) four-leaf stages; (b) Quantitative training performance including (i) Loss curve, (ii) Accuracy curve, and (iii) mIoU curve.
3.3.2. Discussion on Segmentation Performance
Within the first 10 iterations, the training loss of the model exhibited a rapid downward trend, while the accuracy and IOU increased sharply in response, indicating high efficiency in the model’s learning of basic features. During the 20–40 iteration phase, all metrics gradually stabilized, with the fluctuation amplitude being significantly reduced. After 40 iterations, the training loss stabilized at a low level, and both the accuracy and IOU remained essentially stable, demonstrating that the model had achieved a favorable convergence state and possessed robust capabilities for feature extraction and segmentation.
3.4. Evaluation of Organ-Level Skeleton and Point Cloud Extraction
3.4.1. Results of Skeleton and Point Cloud Extraction
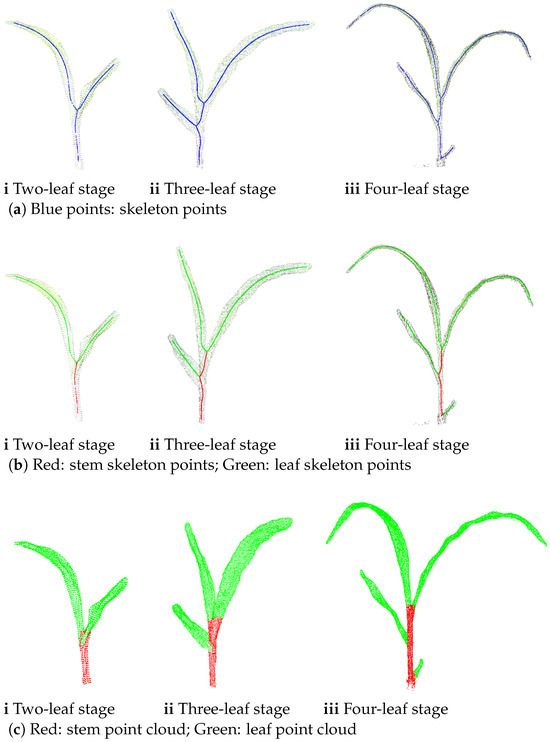
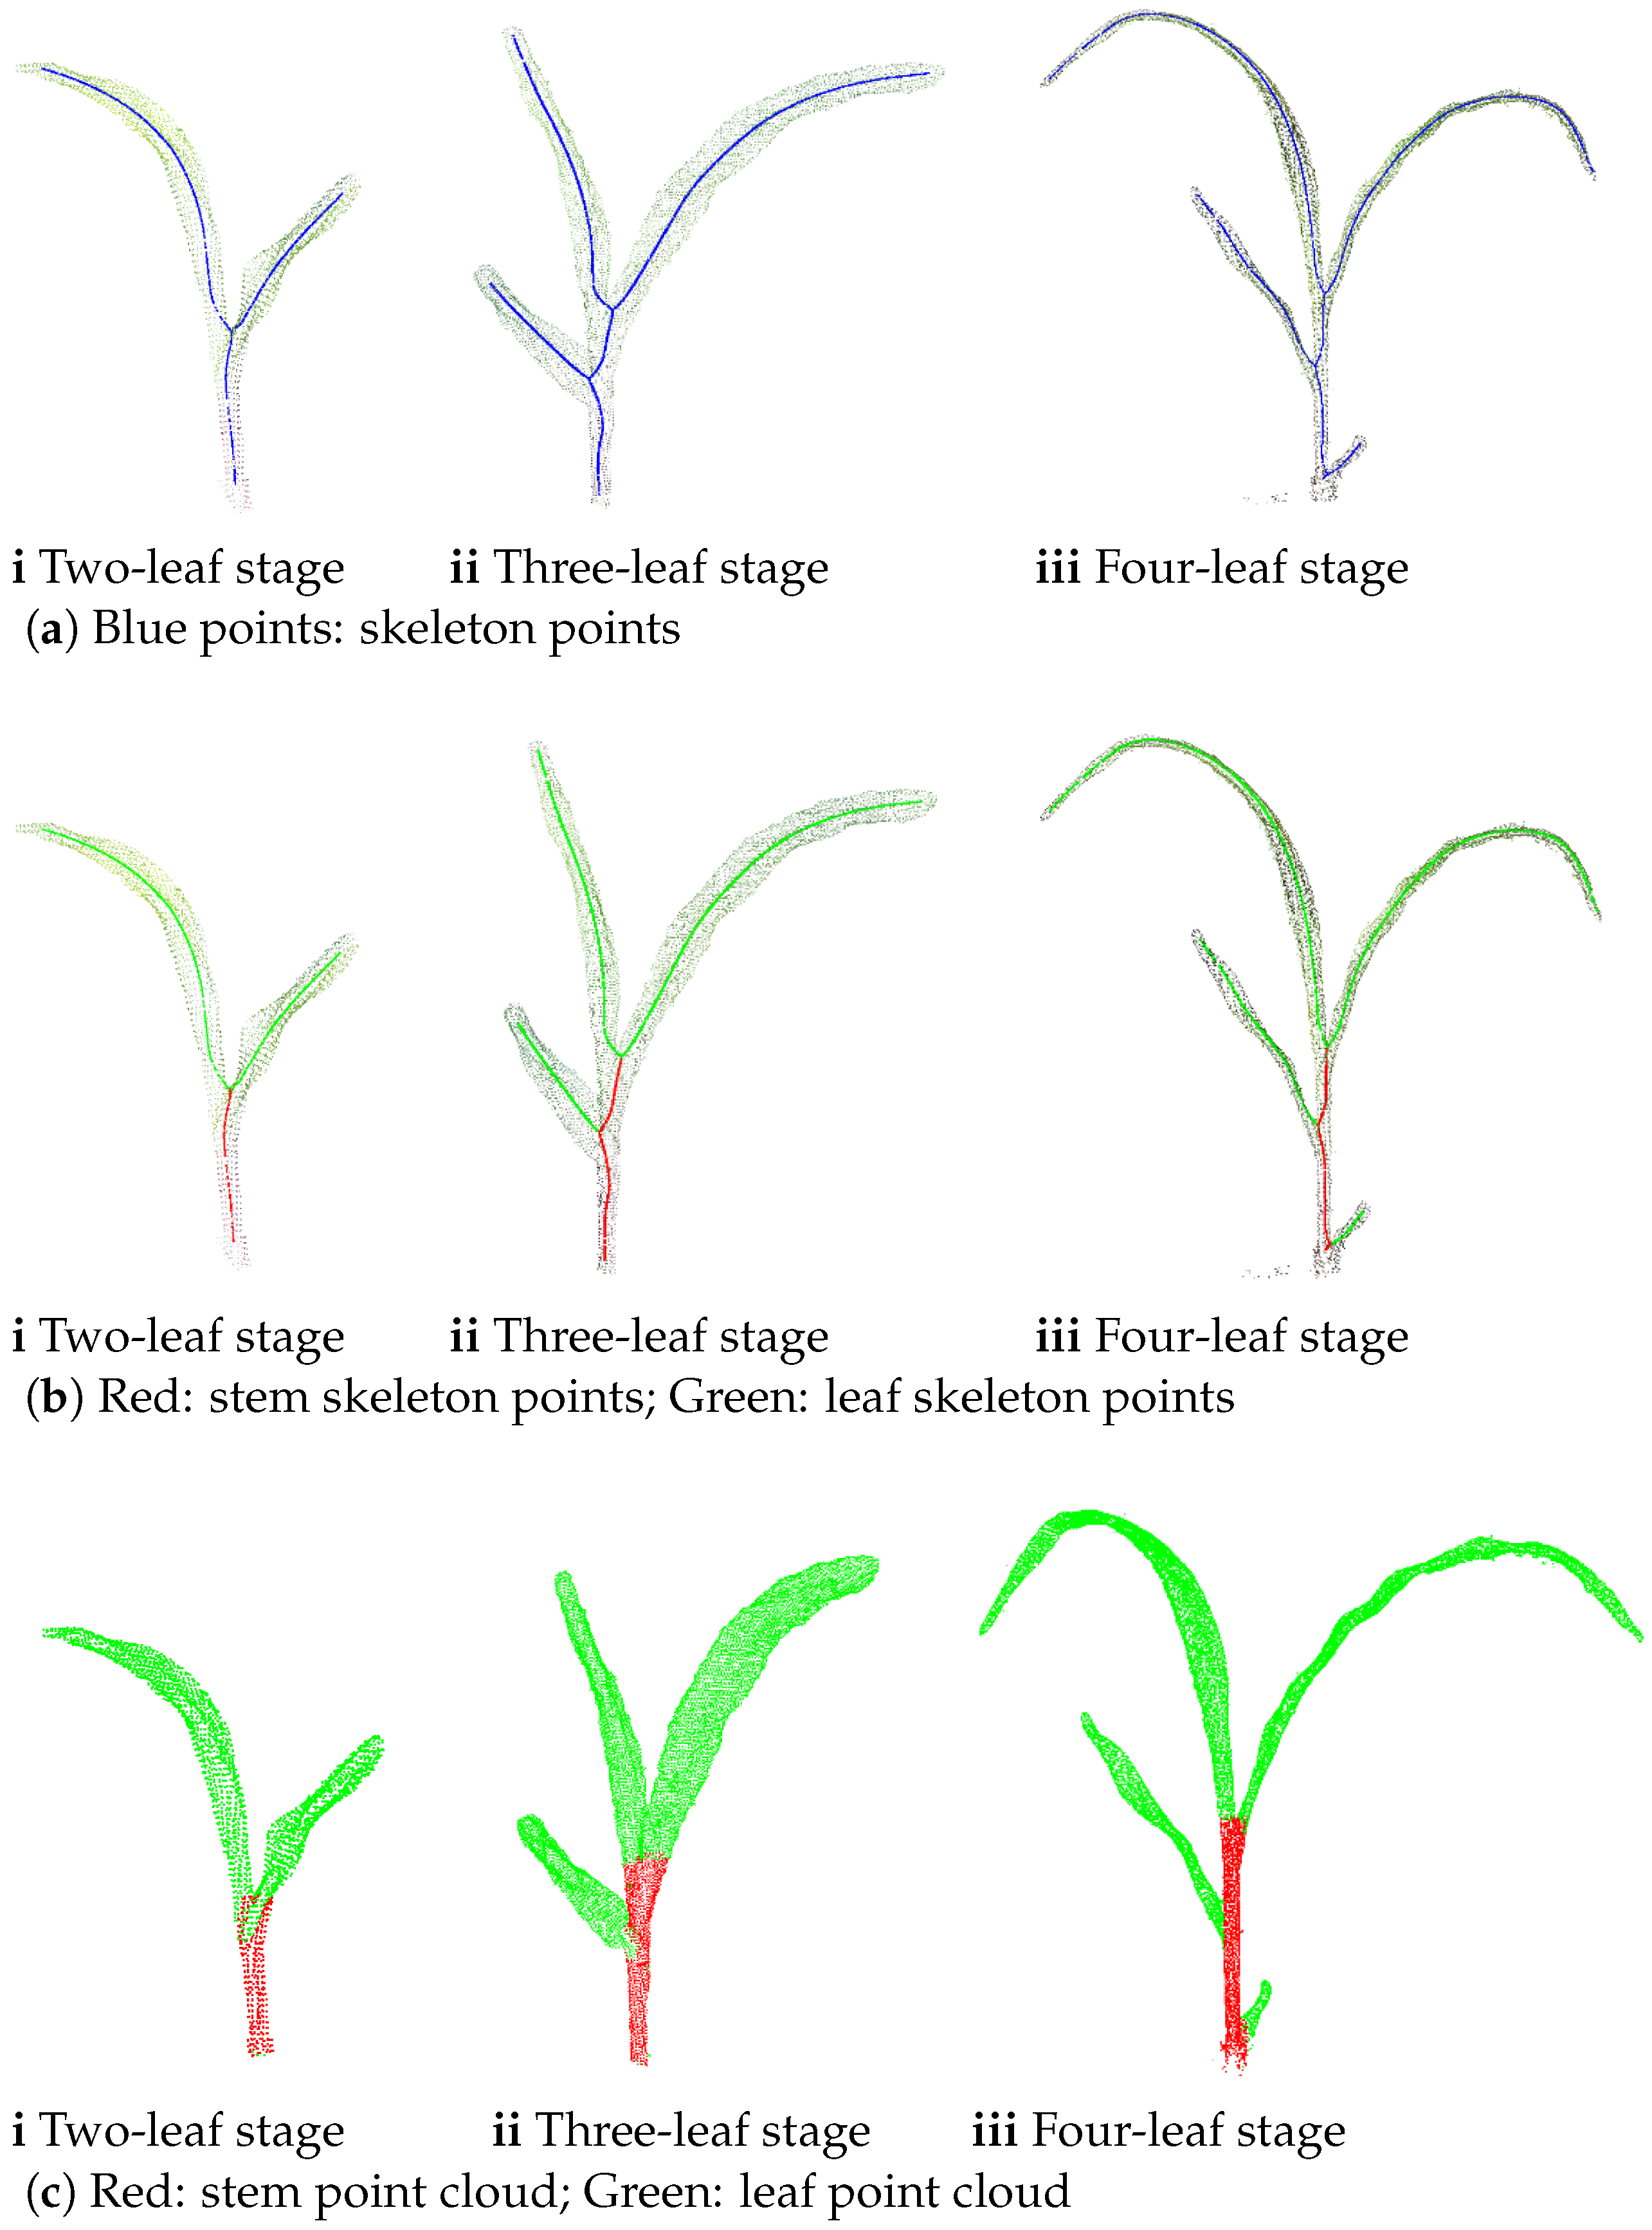
To verify the practical effectiveness of the Laplacian contraction-based skeleton extraction method, skeleton extraction was performed on maize seedling point cloud samples at different growth stages. The skeleton extracted by this method accurately matches the morphological characteristics of the seedlings, as shown in Figure 9a.
Figure 9.
Organ extraction results across: (a) Skeleton extraction; (b) Organ-level skeleton extraction; (c) Organ-level point cloud extraction.
The organ-level skeleton extraction based on the overall skeleton of maize seedlings has been effectively implemented, with the results presented in Figure 9b. Furthermore, the organ-level point clouds obtained via the dual-constraint mechanism exhibit a high degree of fidelity to the actual stem structure, with representative visualization examples shown in Figure 9c.
3.4.2. Discussion on Organ Extraction Performance
Details in Figure 9a confirm that the extracted skeletons accurately match the morphological characteristics of the seedlings, with continuous stem structures and leaf bifurcations extending precisely to the tips without fracture or redundant noise. By effectively fitting the original point cloud structure across different growth stages—from simple two-leaf to complex four-leaf stages—this method provides a reliable geometric foundation for subsequent organ-level segmentation and phenotypic calculation.
Regarding the organ-level skeleton extraction results shown in Figure 9b, the proposed approach exhibits high precision with complete separation achieved between the stem and leaf components. Notably, the absence of skeleton breakage or confusion among leaves ensures the independence and structural integrity of each organ even in samples with increased morphological complexity at the four-leaf stage. This clear delineation is crucial for accurately defining the topological relationships required for individual organ analysis.
The superior fidelity of the resulting organ-level point clouds visualized in Figure 9c is primarily attributed to the logical integration of the dual-constraint mechanism. The height constraint effectively filters irrelevant noise and optimizes computational efficiency by confining dilation operations to the target axial regions. Simultaneously, the radius constraint—tailored to the specific morphological thickness characteristics—acts as a critical geometric filter to prevent the misclassification of adjacent organs. This dual approach ensures that the point cloud expansion remains strictly confined within biological boundaries, significantly enhancing the overall accuracy and robustness of the extraction process.
3.5. Evaluation of Phenotypic Parameter Calculation and Accuracy
3.5.1. Results of Phenotypic Parameter Calculation
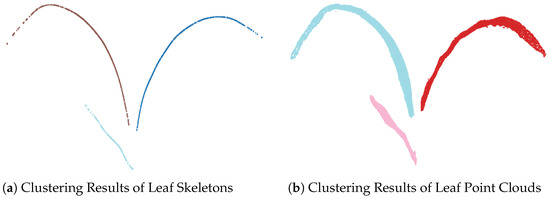
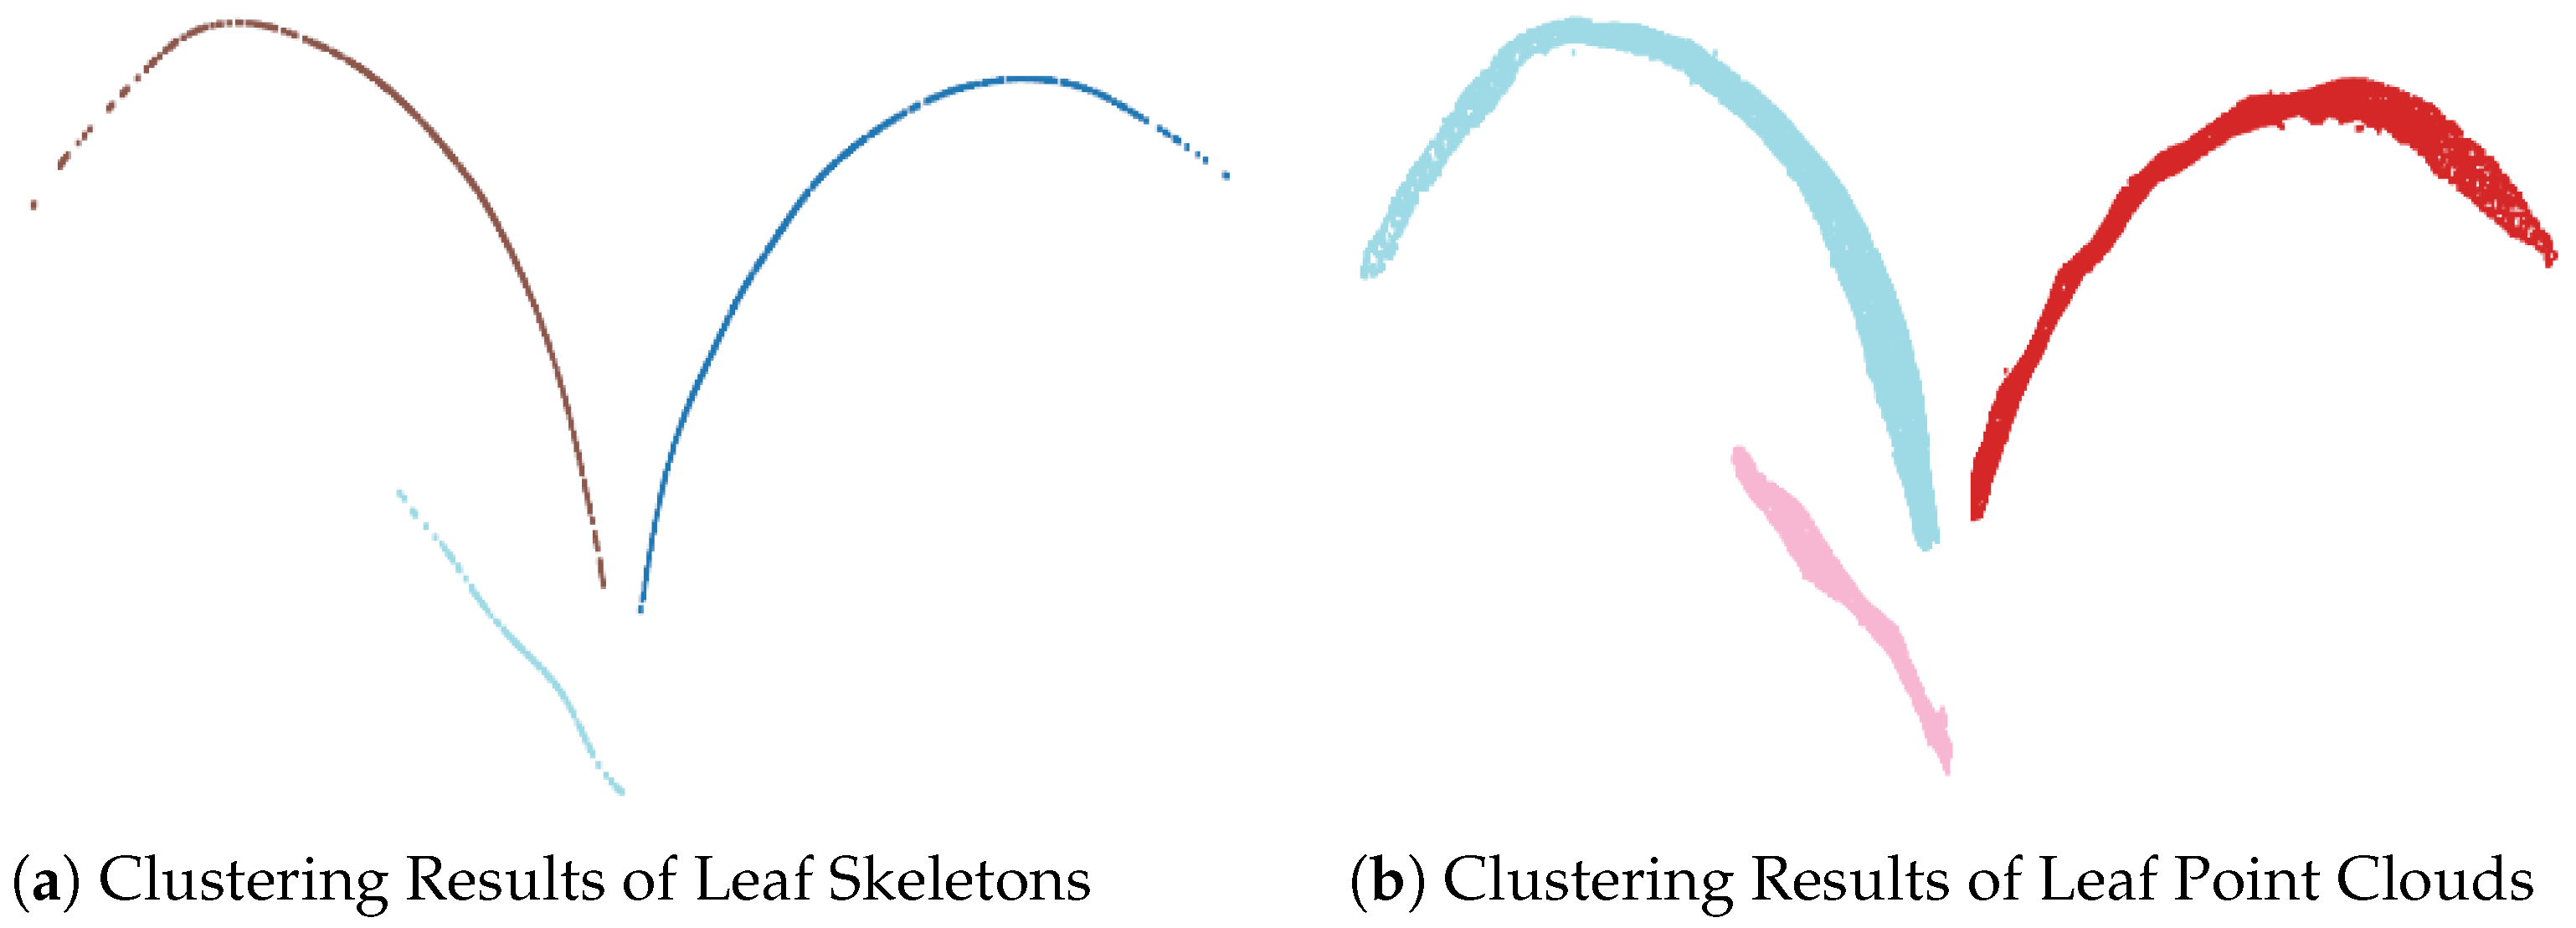
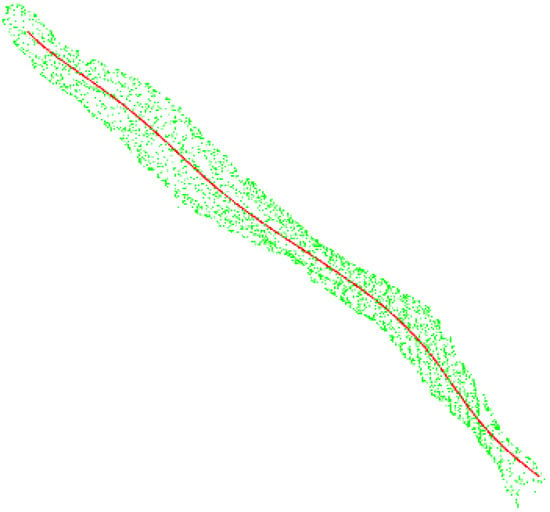
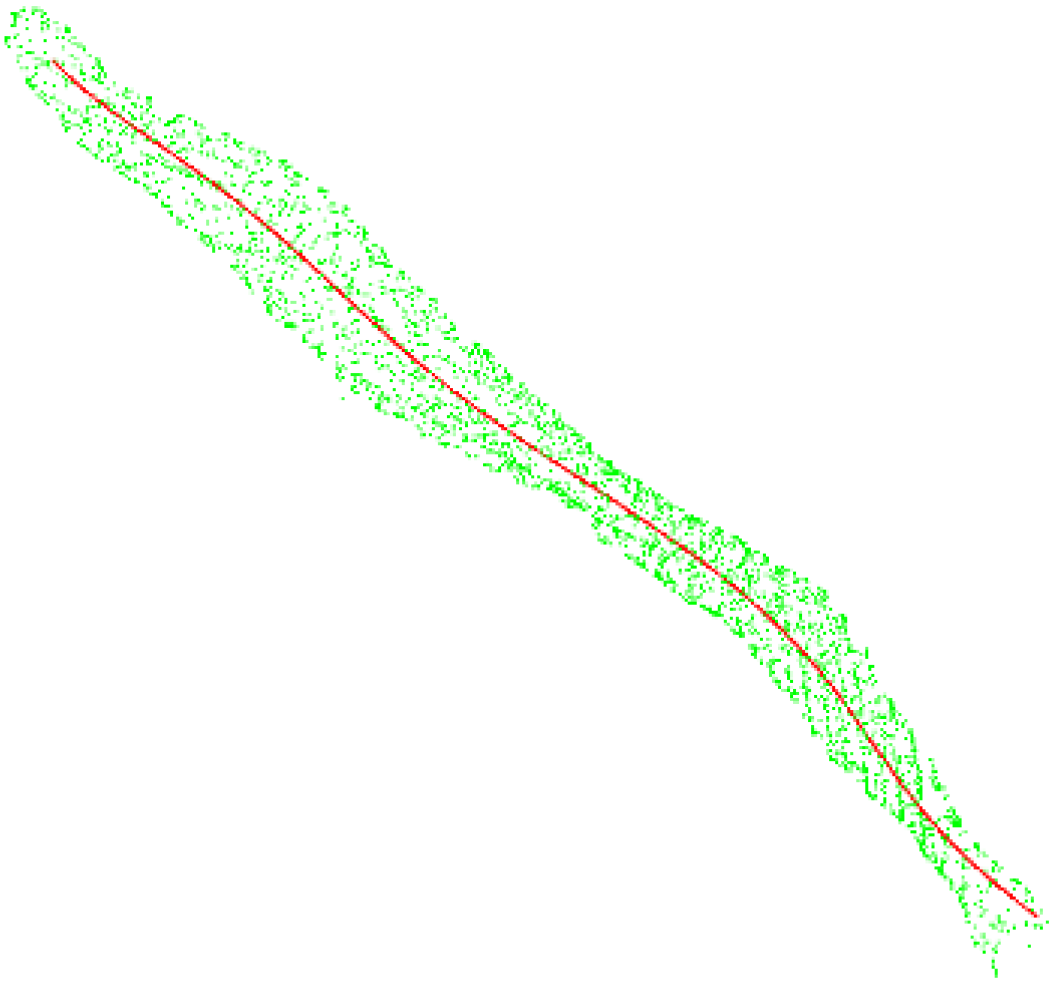
To evaluate the accuracy of parameters extracted from the Auto3DPheno method, Figure 10a and Figure 10b respectively display the leaf skeletons and leaf point clouds after clustering. To ensure optimal geometric fidelity, a 10th-order polynomial fit is performed on the leaf skeleton point clouds, as presented in Figure 11.
Figure 10.
Clustering results. Different colors represent individual leaf instances segmented from the maize seedling point cloud.
Figure 11.
Fitting results on leaf skeleton points. The green points and red points denote the original leaf point clouds and the fitted skeletons.
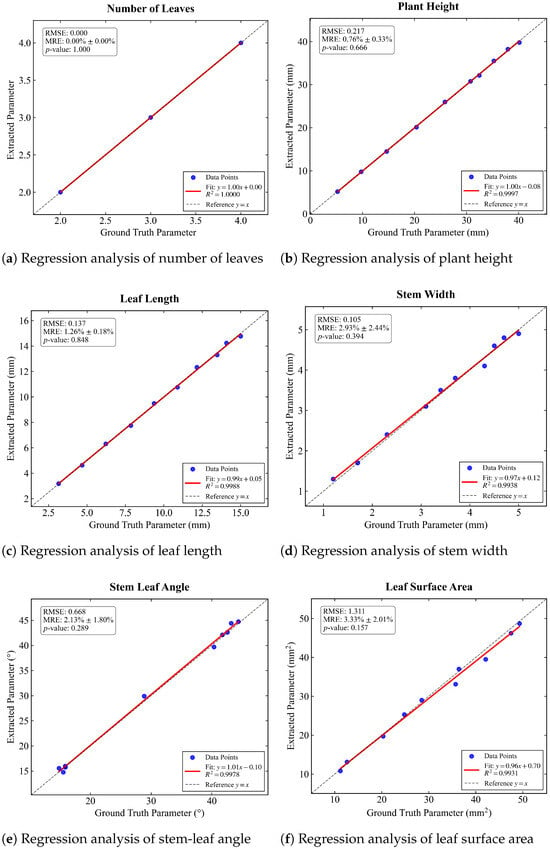
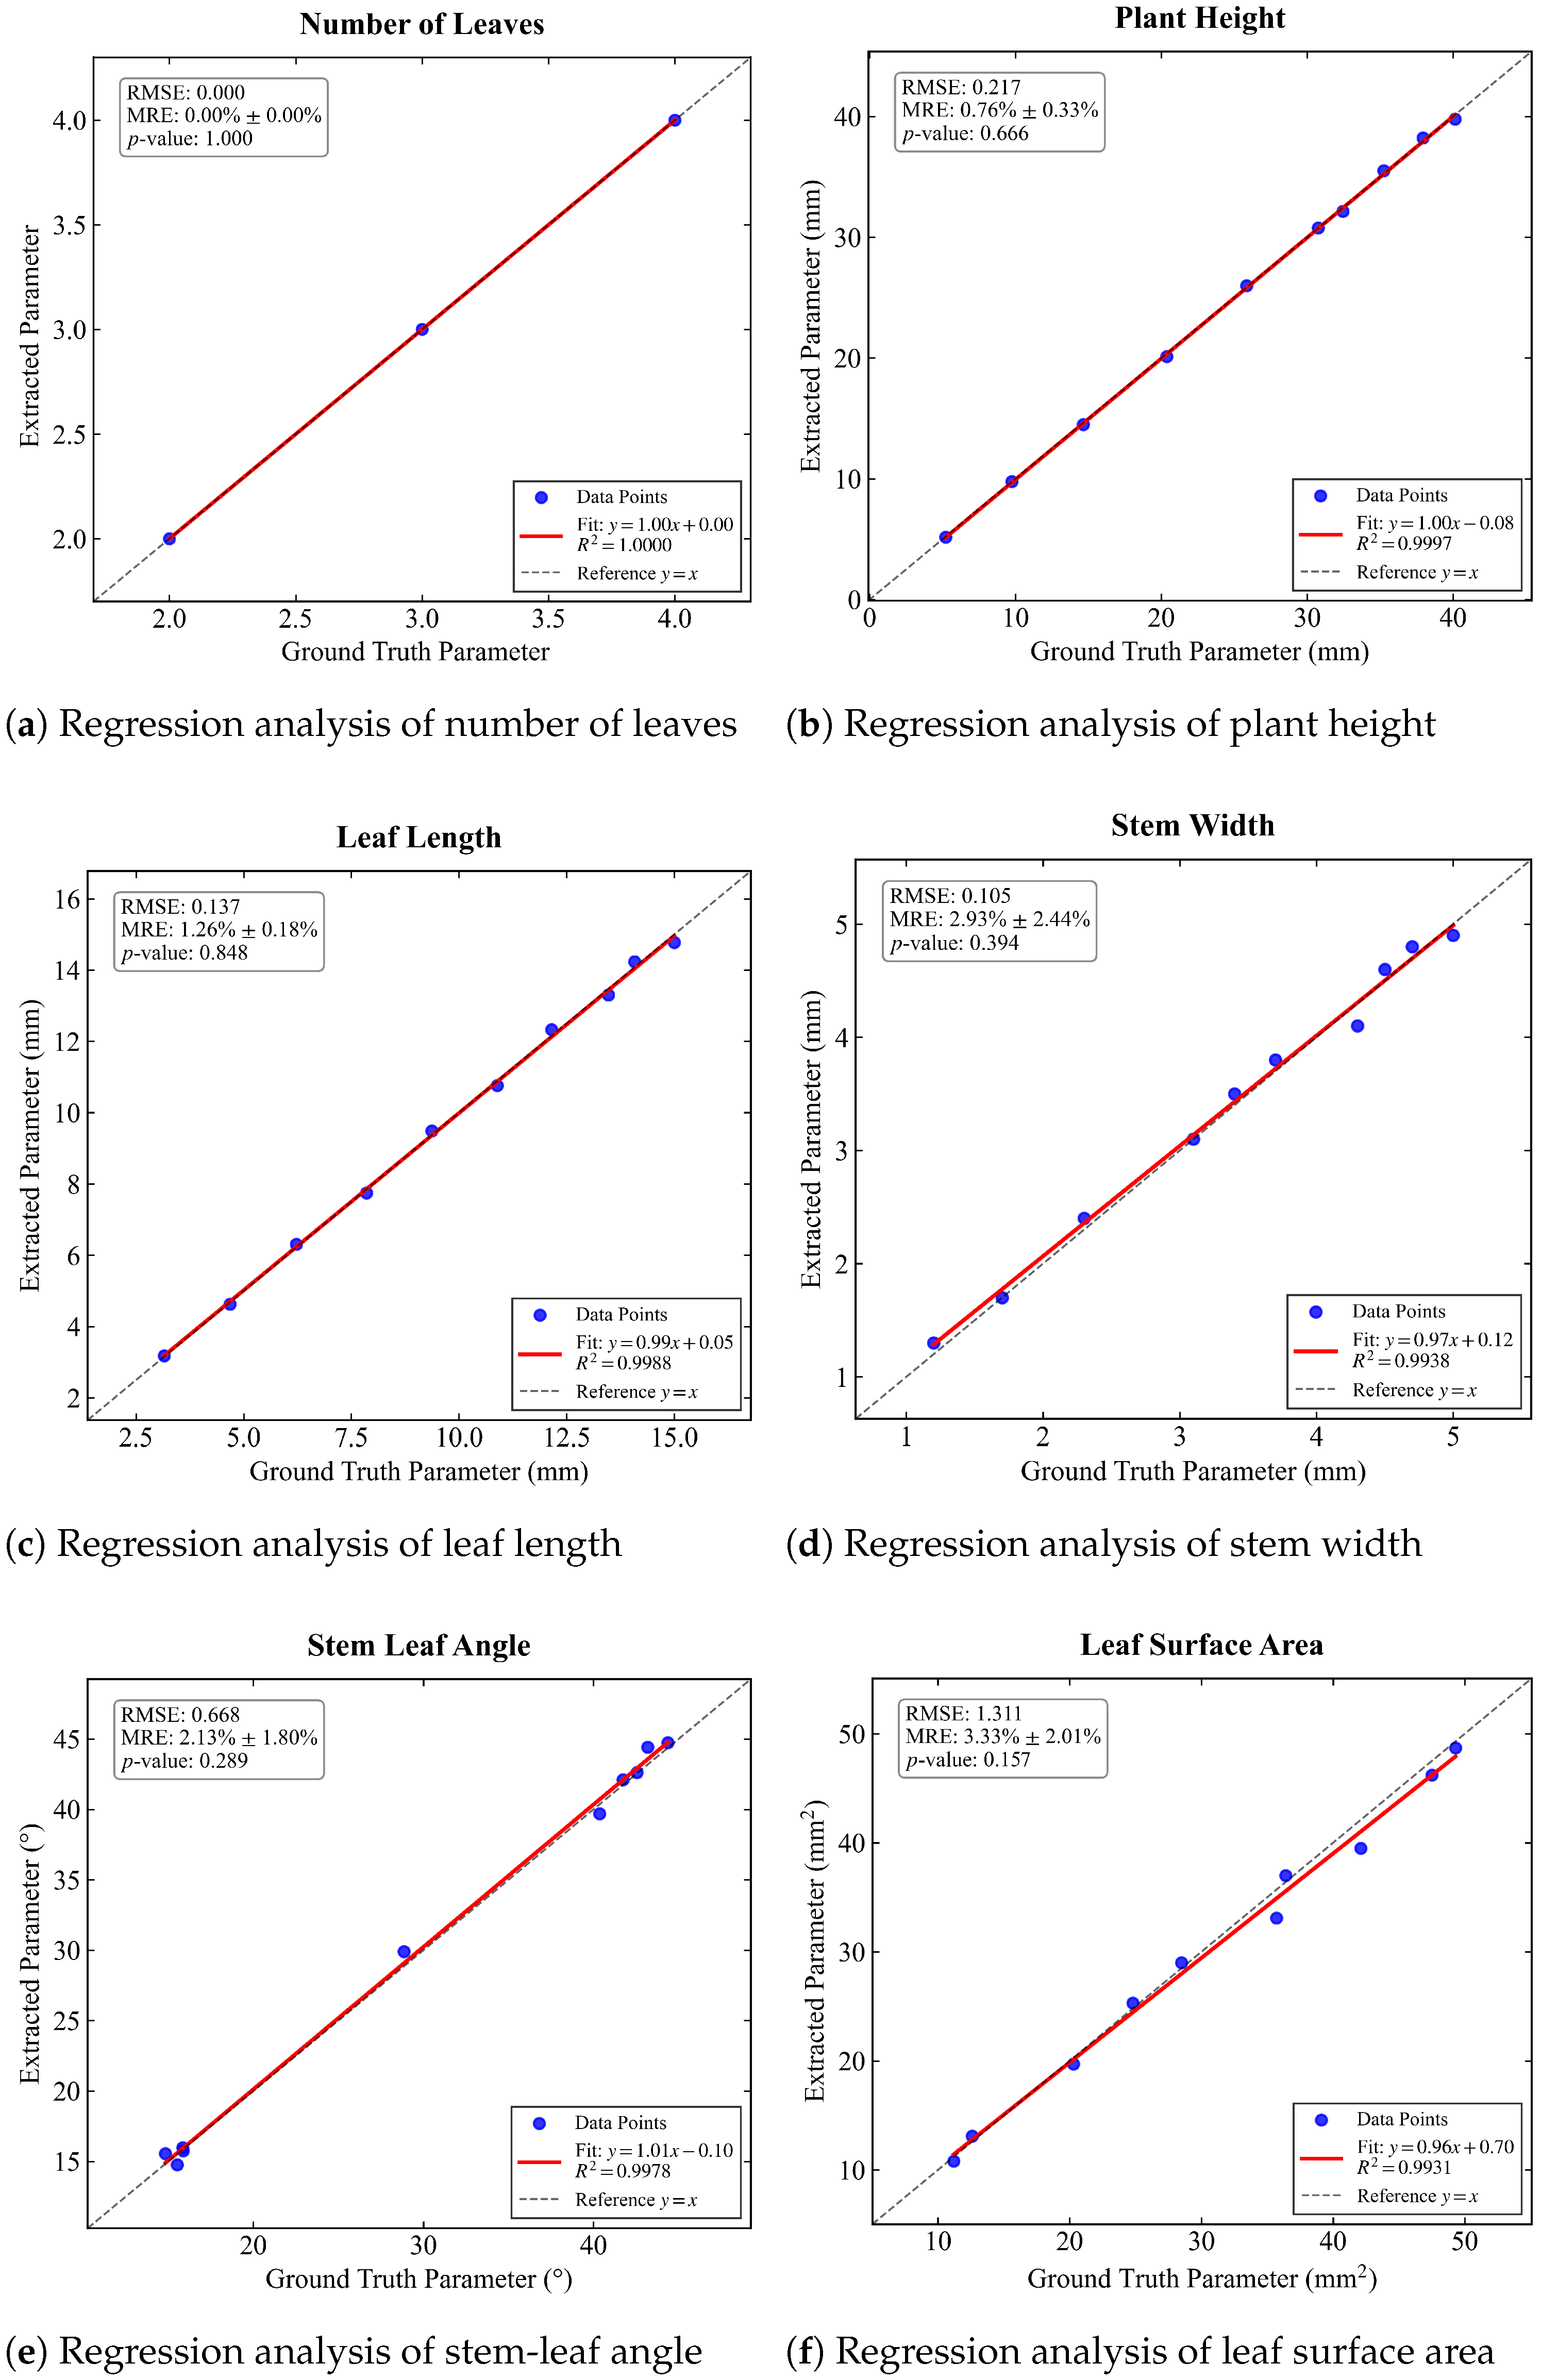
Key phenotypic parameters were extracted, and a comprehensive set of statistical metrics was employed to quantify the accuracy. As illustrated by the regression analysis in Figure 12 and the statistical summary in Table 2, a high degree of consistency with the ground truth was demonstrated.
Figure 12.
Regression analysis of the extracted values and the measured values for different phenotypic parameters.
Table 2.
Detailed statistical analysis of phenotypic parameters extracted by Auto3DPheno.
3.5.2. Discussion on Phenotypic Calculation
The high reliability of the proposed approach is first demonstrated by the strong correlation with ground-truth values. To ensure a rigorous validation, the ground-truth dataset was acquired through a standardized procedure where two operators independently took triplicate measurements to minimize variations. As shown in Table 2, the system achieved 100% accuracy for the discrete parameter of leaf number and exhibited exceptional stability for continuous traits, with values exceeding 0.99 for plant height, leaf length, and stem-leaf angle. Crucially, p-values exceeding 0.05 from paired t-tests indicate the absence of statistically significant differences between the extracted measurements and manual ground truth, confirming the biological fidelity of the digital reconstruction.
The performance superiority of the Auto3DPheno-based pipeline is further highlighted in the comparative analysis presented in Table 3. By treating SFM-MVS and 3DGS as ablation baselines for the reconstruction module, we evaluated the impact of different reconstruction frameworks on the final phenotypic extraction accuracy. Our integrated system attains the lowest Mean RE across all phenotypic parameters, ranging from 0.76% for plant height to 3.33% for leaf area, consistently outperforming both 3DGS and SFM-MVS. The relatively inferior performance and higher relative errors observed in SFM-MVS and 3DGS are primarily attributed to their tendency to produce sparse or unevenly distributed point clouds. Such limitations often lead to surface discontinuities and reduced geometric precision in complex regions like leaf edges or stem-leaf junctions.
Table 3.
Comparison of Mean RE (%) for maize seedling phenotypic parameters among different reconstruction methods and existing studies.
To further validate the competitive edge of Auto3DPheno, we compared our results with existing studies focusing on 3D maize phenotyping, as summarized in Table 3. Li et al. [55] employed an SfM-based pipeline for seedling parameter extraction, reporting a Mean RE for leaf area of 10.51%. The higher error compared to our approach (3.33%) is likely due to the inherent sparsity of SfM-derived point clouds at leaf boundaries, which hinders precise area calculation. Similarly, Guan et al. [45]. utilized depth sensors for maize seedling detection, where the intrinsic resolution limits and sensor-level noise led to Mean REs for plant height (6.18%) and leaf length (8.71%) that are notably higher than the 0.76% and 1.26% achieved by Auto3DPheno.
In summary, the Auto3DPheno framework provides a superior integrated architecture that effectively bridges the gap between raw data acquisition and high-precision phenotypic analysis. These results confirm the effectiveness and robustness of the proposed Auto3DPheno internal integrated pipeline for accurate 3D maize phenotyping.
4. Conclusions
In this study, we propose the Auto3DPheno method, a novel approach for phenotypic analysis of maize seedlings that enables fully automated, end-to-end, and rapid extraction of 3D phenotypic parameters during the seedling stage. The Auto3DPheno-3D reconstruction accurately reconstructs fine 3D morphological details of maize seedlings, ensuring comprehensive spatial representation. Compared to the traditional dense point cloud reconstruction algorithm MVS, it achieves an 88.7% improvement in time efficiency, while also outperforming 3DGS by 69.9% in this regard.
This efficiency advantage is crucial for large-scale phenotypic analysis of maize seedlings, as it supports rapid processing of multiple samples and provides practical guarantees for high-throughput analysis in agricultural research and breeding projects. The Auto3DPheno-RoI Segmentation excels at segmenting seedlings from point cloud data, laying the foundation for subsequent organ-level phenotypic analysis of maize seedlings. The Laplace skeleton extraction and the organ-level point cloud extraction method proposed in this study further refine the 3D structural information. By leveraging the connectivity features of topological graphs and geometric direction constraints, it overcomes the bottleneck of traditional threshold segmentation in adapting to complex morphologies. Verified by point cloud visualization and manual annotation, this method accurately separates stem and leaf skeletons in maize seedlings, providing a reliable structural benchmark for quantifying 3D phenotypic parameters, such as plant height, leaf angle, leaf area, and stem width. Ultimately, the Mean RE of all parameters is controlled within 9%: specifically, errors for plant height-related parameters are less than 2%, leaf angle errors are below 6%, leaf area errors do not exceed 8%, and stem width errors are within 9%. These results fully confirm the high reliability of this framework in capturing fine phenotypic characteristics of maize seedlings.
However, this study also has certain limitations. Firstly, there are specific requirements for the quality of initial data: while the framework is flexible regarding the light source type, the reconstruction performance depends on the stability of the visual input. Factors such as significant motion blur, extreme over/underexposure, or rapid fluctuations in lighting intensity during acquisition can affect the fidelity of the neural radiance field. Secondly, hardware adaptability is limited: the computation of Auto3DPheno relies on NVIDIA GPU graphics cards, which may restrict its application in resource-constrained scenarios. Finally, the capability to handle occluded scenes needs strengthening: dense overlapping among maize leaves can easily affect reconstruction accuracy. To address these limitations, future research can focus on the following aspects. On one hand, illumination-adaptive algorithms should be developed to enhance the robustness of 3D reconstruction in complex field environments and further improve the accuracy of phenotypic parameter extraction. On the other hand, efforts should be made to reduce the computational complexity of the workflow through model compression, lightweight algorithm design, and other means, breaking through hardware constraints and expanding applications to resource-constrained scenarios.
Supplementary Materials
The following supporting information can be downloaded at: https://www.mdpi.com/article/10.3390/agronomy16040401/s1, Section S1: 3D Reconstruction Implementation; Section S2: Maize Seedling Segmentation Implementation; Section S3: 3D Phenotypic Parameter Extraction Implementation; Figure S1: Phenotypic parameters point cloud structure and characteristics; Figure S2: Sensitivity analysis of the DBSCAN clustering parameter or individual leaf segmentation; Table S1: Detailed configuration of adaptive contraction parameters across different point cloud scales; Table S2: Phenotypic parameters; Table S3: Fitting error of different polynomial orders for leaf skeleton point clouds.
Author Contributions
X.T. and M.Y. designed and supervised the project. Y.G. participated in experimental treatment, experimental validation, sample collection, test determination, data collection, and wrote the first draft of the article. X.Z., L.X. and Q.J. contributed to the methodology and assisted in data analysis. S.J., D.M. and J.Z. were involved in experimental validation and resources coordination. X.T. and M.Y. participated in the revision of the manuscript. All authors have read and agreed to the published version of the manuscript.
Funding
This paper was supported by Strategic Priority Research Program of the Chinese Academy of Sciences [Grant No. XDB1290202]; Jilin Provincial Development and Reform Commission Innovation Capacity Building Project [2024C014-8]; Jilin Province Science and Technology Development Plan Project [20240302001GX, YDZJ202401310ZYTS, 20240402029GH, 20250203092SF, YDZJ202402022CXJD]; Tianjin Science and Technology Plan Project [23YFYSHZ00300]; National Natural Science Foundation of China (NSFC) [42377037]; Changchun Science and Technology Development Plan Project [24GXYSZZ34].
Data Availability Statement
The raw data supporting the conclusions of this article will be made available by the authors on request.
Conflicts of Interest
The authors declare no conflicts of interest.
References
- Shiferaw, B.; Prasanna, B.; Hellin, J.; Bänziger, M. Crops that feed the world 6. Past successes and future challenges to the role played by maize in global food security. Food Secur. 2011, 3, 307–327. [Google Scholar] [CrossRef] [Scilit]
- Delgado, C. Rising Consumption of Meat and Milk in Developing Countries Has Created a New Food Revolution. J. Nutr. 2003, 133, 3907S–3910S. [Google Scholar] [CrossRef] [Scilit]
- Ninomiya, S.; Baret, F.; Cheng, Z.M. Plant Phenomics: Emerging Transdisciplinary Science. Plant Phenomics 2019, 2019, 2765120. [Google Scholar] [CrossRef] [PubMed]
- Wu, S.; Wen, W.; Xiao, B.; Guo, X.; Du, J.; Wang, C.; Wang, Y. An Accurate Skeleton Extraction Approach From 3D Point Clouds of Maize Plants. Front. Plant Sci. 2019, 10, 248. [Google Scholar] [CrossRef] [Scilit] [PubMed]
- Zhao, C.; Zhang, Y.; Du, J.; Guo, X.; Wen, W.; Gu, S.; Wang, J.; Fan, J. Crop Phenomics: Current Status and Perspectives. Front. Plant Sci. 2019, 10, 714. [Google Scholar] [CrossRef] [Scilit] [PubMed]
- Song, X.; Cui, T.; Zhang, D.; Yang, L.; He, X.; Zhang, K. Reconstruction and spatial distribution analysis of maize seedlings based on multiple clustering of point clouds. Comput. Electron. Agric. 2025, 235, 110196. [Google Scholar] [CrossRef] [Scilit]
- Singhal, G.; Choudhury, B.U.; Singh, N.; Goswami, J. An enhanced chlorophyll estimation model with a canopy structural trait in maize crops: Use of multi-spectral UAV images and machine learning algorithm. Ecol. Inform. 2024, 83, 102811. [Google Scholar] [CrossRef] [Scilit]
- Li, E.; Wang, L.; Xie, Q.; Gao, R.; Su, Z.; Li, Y. A novel deep learning method for maize disease identification based on small sample-size and complex background datasets. Ecol. Inform. 2023, 75, 102011. [Google Scholar] [CrossRef] [Scilit]
- Fu, R.; Wang, X. Modeling the influence of phenotypic plasticity on maize hybrid performance. Plant Commun. 2023, 4, 100548. [Google Scholar] [CrossRef] [Scilit]
- Tardieu, F.; Cabrera-Bosquet, L.; Pridmore, T.; Bennett, M. Plant Phenomics, from Sensors to Knowledge. Curr. Biol. 2017, 27, R770–R783. [Google Scholar] [CrossRef] [Scilit]
- Tao, H.; Xu, S.; Tian, Y.; Li, Z.; Ge, Y.; Zhang, J.; Wang, Y.; Zhou, G.; Deng, X.; Zhang, Z.; et al. Proximal and remote sensing in plant phenomics: 20 years of progress, challenges, and perspectives. Plant Commun. 2022, 3, 100344. [Google Scholar] [CrossRef] [Scilit]
- Gao, R.; Cui, S.; Xu, H.; Kong, Q.; Su, Z.; Li, J. A method for obtaining maize phenotypic parameters based on improved QuickShift algorithm. Comput. Electron. Agric. 2023, 214, 108341. [Google Scholar] [CrossRef] [Scilit]
- Yao, J.; Gong, Y.; Xia, Z.; Nie, P.; Xu, H.; Zhang, H.; Chen, Y.; Li, X.; Li, Z.; Li, Y. Facility of tomato plant organ segmentation and phenotypic trait extraction via deep learning. Comput. Electron. Agric. 2025, 231, 109957. [Google Scholar] [CrossRef] [Scilit]
- Meyer, G.; Davison, D. An Electronic Image Plant Growth Measurement System. Trans. ASAE 1987, 30, 242–248. [Google Scholar] [CrossRef] [Scilit]
- Ghanem, M.; Marrou, H.; Sinclair, T. Physiological phenotyping of plants for crop improvement. Trends Plant Sci. 2015, 20, 139–144. [Google Scholar] [CrossRef] [Scilit]
- Rahaman, M.; Chen, D.; Gillani, Z.; Klukas, C.; Chen, M. Advanced phenotyping and phenotype data analysis for the study of plant growth and development. Front. Plant Sci. 2015, 6, 619. [Google Scholar] [CrossRef] [Scilit]
- Van, H.T.; Khuat, P.T.; Van, T.; Tuan, T.T.; Chung, Y.S. A deep learning method for differentiating safflower germplasm using optimal leaf structure features. Ecol. Inform. 2025, 85, 102998. [Google Scholar] [CrossRef] [Scilit]
- Barker, J.; Zhang, N.; Sharon, J.; Steeves, R.; Wang, X.; Wei, Y.; Poland, J. Development of a field-based high-throughput mobile phenotyping platform. Comput. Electron. Agric. 2016, 122, 74–85. [Google Scholar] [CrossRef] [Scilit]
- He, H.; Ma, X.; Guan, H. A calculation method of phenotypic traits of soybean pods based on image processing technology. Ecol. Inform. 2022, 69, 101676. [Google Scholar] [CrossRef] [Scilit]
- Ye, S.; Nedzved, O.; Nedzved, A.; Chen, C. Definition of spectrum by colors metamerism using images of plants by ordinary camera. Opt. Lasers Eng. 2024, 178, 108202. [Google Scholar] [CrossRef] [Scilit]
- Liu, T.; Duan, S.B.; Liu, N.; Wei, B.; Yang, J.; Chen, J.; Zhang, L. Estimation of crop leaf area index based on Sentinel-2 images and PROSAIL-Transformer coupling model. Comput. Electron. Agric. 2024, 227, 109663. [Google Scholar] [CrossRef] [Scilit]
- Liu, B.; Chang, J.; Hou, D.; Pan, Y.; Li, D.; Ruan, J. Recognition and Localization of Maize Leaf and Stalk Trajectories in RGB Images Based on Point-Line Net. Plant Phenomics 2024, 6, 0199. [Google Scholar] [CrossRef] [Scilit]
- Tu, Y.L.; Lin, W.Y.; Lin, Y.C. Toward automatic plant phenotyping: Starting from leaf counting. Multimed. Tools Appl. 2022, 81, 11865–11879. [Google Scholar] [CrossRef] [Scilit]
- Kolhar, S.; Jagtap, J. Phenomics for Komatsuna plant growth tracking using deep learning approach. Expert Syst. Appl. 2023, 215, 119368. [Google Scholar] [CrossRef] [Scilit]
- Tang, Z.; Jiang, T.; Wang, Y.; Sun, X. LiDAR: A new player in analyzing plant phenotypes. Trends Plant Sci. 2024, 29, 1383–1384. [Google Scholar] [CrossRef] [Scilit]
- Hadadi, M.; Saraeian, M.; Godbersen, J.; Jubery, T.; Li, Y.; Attigala, L.; Balu, A.; Sarkar, S.; Schnable, P.S.; Krishnamurthy, A.; et al. Procedural generation of 3D maize plant architecture from LiDAR data. Comput. Electron. Agric. 2025, 236, 110382. [Google Scholar] [CrossRef] [Scilit]
- Borz, S.A.; Proto, A.R. Low-cost phone-based LiDAR scanning technology provides sub-centimeter accuracy when measuring the main dimensions of motor-manual tree felling cuts. Ecol. Inform. 2025, 85, 102999. [Google Scholar] [CrossRef] [Scilit]
- Kan, R.; Zheng, K.; Zhang, S.; Chen, X.; Che, H.; Yang, S.; Wu, Z.; Mei, L. Wide-field high-resolution anamorphic Scheimpflug LiDAR for 3D plant fluorescence imaging. Opt. Lasers Eng. 2026, 197, 109496. [Google Scholar] [CrossRef] [Scilit]
- Li, X.; Zhao, H.; Liu, Y.; Jiang, H.; Bian, Y. Laser scanning based three dimensional measurement of vegetation canopy structure. Opt. Lasers Eng. 2014, 54, 152–158. [Google Scholar] [CrossRef] [Scilit]
- Li, J.; Tang, L. Developing a low-cost 3D plant morphological traits characterization system. Comput. Electron. Agric. 2017, 143, 1–13. [Google Scholar] [CrossRef] [Scilit]
- Hu, C.; Li, P.; Pan, Z. Phenotyping of poplar seedling leaves based on a 3D visualization method. Int. J. Agric. Biol. Eng. 2018, 11, 145–151. [Google Scholar] [CrossRef] [Scilit]
- Wu, S.; Wen, W.; Wang, Y.; Fan, J.; Wang, C.; Gou, W.; Guo, X. MVS-Pheno: A Portable and Low-Cost Phenotyping Platform for Maize Shoots Using Multiview Stereo 3D Reconstruction. Plant Phenomics 2020, 2020, 1848437. [Google Scholar] [CrossRef] [Scilit]
- Peng, Y.; Yang, M.; Zhao, G.; Cao, G. Binocular-Vision-Based Structure From Motion for 3-D Reconstruction of Plants. IEEE Geosci. Remote Sens. Lett. 2022, 19, 8019505. [Google Scholar] [CrossRef] [Scilit]
- Li, Y.; Wen, W.; Miao, T.; Wu, S.; Yu, Z.; Wang, X.; Guo, X.; Zhao, C. Automatic organ-level point cloud segmentation of maize shoots by integrating high-throughput data acquisition and deep learning. Comput. Electron. Agric. 2022, 193, 106702. [Google Scholar] [CrossRef] [Scilit]
- Yu, Z.; Poching, T.; Aono, M.; Shimizu, Y.; Hosoi, F.; Omasa, K. 3D monitoring for plant growth parameters in field with a single camera by multi-view approach. J. Agric. Meteorol. 2018, 74, 129–139. [Google Scholar] [CrossRef] [Scilit]
- Zhou, L.; Gu, X.; Cheng, S.; Guijun, Y.; Shu, M.; Sun, Q. Analysis of Plant Height Changes of Lodged Maize Using UAV-LiDAR Data. Agriculture 2020, 10, 146. [Google Scholar] [CrossRef] [Scilit]
- Yang, T.; Ye, J.; Zhou, S.; Xu, A.; Yin, J. 3D reconstruction method for tree seedlings based on point cloud self-registration. Comput. Electron. Agric. 2022, 200, 107210. [Google Scholar] [CrossRef] [Scilit]
- Zhang, K.; Chen, H.; Wu, H.; Zhao, X.; Zhou, C. Point cloud registration method for maize plants based on conical surface fitting—ICP. Sci. Rep. 2022, 12, 6852. [Google Scholar] [CrossRef] [Scilit]
- Ma, X.; Wei, B.; Guan, H.; Yu, S. A method of calculating phenotypic traits for soybean canopies based on three-dimensional point cloud. Ecol. Inform. 2022, 68, 101524. [Google Scholar] [CrossRef] [Scilit]
- Zhang, Y.; Li, M.; Li, G.; Li, J.; Zheng, L.; Zhang, M.; Wang, M. Multi-phenotypic parameters extraction and biomass estimation for lettuce based on point clouds. Measurement 2022, 204, 112094. [Google Scholar] [CrossRef] [Scilit]
- Liu, Y.; Yuan, H.; Zhao, X.; Fan, C.; Cheng, M. Fast reconstruction method of three-dimension model based on dual RGB-D cameras for peanut plant. Plant Methods 2023, 19, 17. [Google Scholar] [CrossRef] [Scilit]
- Ma, X.; Wei, B.; Guan, H.; Cheng, Y.; Zhuo, Z. A method for calculating and simulating phenotype of soybean based on 3D reconstruction. Eur. J. Agron. 2024, 154, 127070. [Google Scholar] [CrossRef] [Scilit]
- Wei, B.; Ma, X.; Guan, H.; Yu, M.; Yang, C.; He, H.; Wang, F.; Shen, P. Dynamic simulation of leaf area index for the soybean canopy based on 3D reconstruction. Ecol. Inform. 2023, 75, 102070. [Google Scholar] [CrossRef] [Scilit]
- Wei, X.; Chen, J.; Cai, Y.; Song, Q.; Li, X.; Deng, X. Acquisition and analysis of jasmine plant phenotype based on 3D point clouds. Measurement 2026, 257, 118465. [Google Scholar] [CrossRef] [Scilit]
- Guan, H.; Zhang, X.; Ma, X.; Zhuo, Z.; Deng, H. Recognition and phenotypic detection of maize stem and leaf at seedling stage based on 3D reconstruction technique. Opt. Laser Technol. 2025, 187, 112787. [Google Scholar] [CrossRef] [Scilit]
- Hassan, M.; Chang, C.Y. PhenoGazer: A high-throughput phenotyping system to track plant stress responses using hyperspectral reflectance, nighttime chlorophyll fluorescence and RGB imaging in controlled environments. Plant Phenomics 2025, 7, 100047. [Google Scholar] [CrossRef] [Scilit]
- Zarei, A.; Li, B.; Schnable, J.; Lyons, E.; Pauli, D.; Barnard, K.; Benes, B. PlantSegNet: 3D point cloud instance segmentation of nearby plant organs with identical semantics. Comput. Electron. Agric. 2024, 221, 108922. [Google Scholar] [CrossRef] [Scilit]
- Nleya, T.; Chungu, C.; Kleinjan, J. Corn growth and development. In iGrow Corn: Best Managemenent Practices; South Dakota State University: Brookings, SD, USA, 2016; Volume 722. [Google Scholar]
- Mildenhall, B.; Srinivasan, P.P.; Tancik, M.; Barron, J.T.; Ramamoorthi, R.; Ng, R. Nerf: Representing scenes as neural radiance fields for view synthesis. Commun. ACM 2021, 65, 99–106. [Google Scholar] [CrossRef] [Scilit]
- Zhu, W.; Ma, R.; An, J.; Li, W.; Bai, X.; Xu, D. Three-dimensional reconstruction and parameters extraction of walnut (Juglans regia L.) branches based on Neural Radiation Fields. Eur. J. Agron. 2025, 169, 127693. [Google Scholar] [CrossRef] [Scilit]
- Müller, T.; Evans, A.; Schied, C.; Keller, A. Instant Neural Graphics Primitives with a Multiresolution Hash Encoding. ACM Trans. Graph. (TOG) 2022, 41, 1–15. [Google Scholar] [CrossRef] [Scilit]
- Qi, C.; Yi, L.; Su, H.; Guibas, L. PointNet++: Deep Hierarchical Feature Learning on Point Sets in a Metric Space. Adv. Neural Inf. Process. Syst. 2023, 30, 5105–5114. [Google Scholar] [CrossRef] [Scilit]
- Li, J.; Qi, X.; Nabaei, S.H.; Liu, M.; Chen, D.; Sun, Q.; Zhang, X.; Yin, X.; Li, Z. A survey on 3D reconstruction techniques in plant phenotyping: From classical methods to neural radiance fields (NeRF), 3D gaussian splatting (3DGS), and beyond. Plant Phenomics 2025, 7, 100137. [Google Scholar] [CrossRef] [Scilit]
- Hanson, A.; Tu, A.; Lin, G.; Singla, V.; Zwicker, M.; Goldstein, T. Speedy-splat: Fast 3d gaussian splatting with sparse pixels and sparse primitives. In Proceedings of the Computer Vision and Pattern Recognition Conference, Nashville, TN, USA, 10–17 June 2025; pp. 21537–21546. [Google Scholar]
- Li, Y.; Liu, J.; Zhang, B.; Wang, Y.; Yao, J.; Zhang, X.; Fan, B.; Li, X.; Hai, Y.; Fan, X. Three-dimensional reconstruction and phenotype measurement of maize seedlings based on multi-view image sequences. Front. Plant Sci. 2022, 13, 974339. [Google Scholar] [CrossRef] [Scilit] [PubMed]

Disclaimer/Publisher’s Note: The statements, opinions and data contained in all publications are solely those of the individual author(s) and contributor(s) and not of MDPI and/or the editor(s). MDPI and/or the editor(s) disclaim responsibility for any injury to people or property resulting from any ideas, methods, instructions or products referred to in the content. |
© 2026 by the authors. Licensee MDPI, Basel, Switzerland. This article is an open access article distributed under the terms and conditions of the Creative Commons Attribution (CC BY) license.