


Abstract
This study aimed to identify promising soybean lines by combining genetic parameter estimates, simultaneous selection for grain yield and oil content, and a complementary multivariate classification of already phenotyped materials. Four soybean populations were evaluated in Jaboticabal, São Paulo, Brazil, across three agricultural years corresponding to the F5:6, F5:7, and F5:8 generations. The breeding populations comprised 142 advanced lines, whereas the augmented-block field experiment contained 281 plot-level experimental records in each agricultural year because the complete layout also included the repeated check plots required by the design. Population-based analyses were conducted using REML/BLUP, likelihood-ratio tests, and a standardized Z selection index for grain yield and oil content. The Z index identified the highest-ranked lines within each population, including genotypes 19, 42, 38, and 27 in populations A, B, C, and D, respectively. A complementary Random Forest analysis was used as a decision-support classification procedure applied to observed phenotypic information, rather than as a model for forecasting future performance or estimating unknown oil or protein values. The procedure organized the phenotypic profiles into oil-based, protein-based, and combined oil-plus-protein groups. For the combined scenario, the classification criterion rewarded high standardized values for both seed-composition traits while penalizing imbalance between them. Out-of-fold classification results showed high agreement with the predefined operational groups, with overall accuracy rates of 0.99, 1.00, and 0.98 for the oil, protein, and combined scenarios, respectively. Principal component analysis described the multivariate structure of the same phenotypic dataset. Because generation and crop year coincide, changes in genetic parameter estimates across successive evaluations cannot be attributed exclusively to selection. Overall, the results support the use of mixed models and the Z index for line selection, while Random Forest provides a complementary framework for organizing already measured materials according to contrasting and combined seed-composition objectives.
1. Introduction
For a soybean cultivar to be released onto the market, several traits must be considered throughout the breeding program. Among the most important are adaptation to the crop cycle, plant height and first-pod insertion height, lodging, pod dehiscence, seed quality, response to soil fertility, resistance to insect pests and diseases, oil content and quality, protein content and quality, herbicide tolerance, and grain yield. Selected individuals must simultaneously combine multiple favorable attributes to increase productivity and meet market demands, which makes soybean breeding inherently multi-trait and strongly dependent on balanced selection strategies [1,2]. However, the selection of superior lines is a complex process, since most agronomically important traits exhibit quantitative inheritance, substantial genotype-by-environment interaction, and often low-to-moderate heritability, which reduces the efficiency of direct phenotypic selection [3,4].
Soybean grain has high economic value because of its protein and oil contents, but simultaneous improvement in grain yield and seed composition is biologically challenging. Oil and protein contents are often negatively associated, and increases in grain yield may also be accompanied by changes in seed composition, depending on the genetic background and environmental conditions. Consequently, selection focused exclusively on one trait may result in unfavorable responses in another. Recent studies have demonstrated substantial genetic variation for oil and protein contents in soybean and have reinforced the importance of evaluating these traits jointly in breeding programs [5,6,7]. Therefore, breeding strategies that simultaneously consider grain yield, oil content, and protein content are particularly relevant when the objective is to identify lines combining agronomic performance with desirable seed composition.
Plant breeding has undergone important advances in the development of sophisticated methodologies for estimating variance components and predicting genotypic values. In this context, mixed model analysis, also known as REML/BLUP, has gained prominence because it improves the estimation of genetic parameters and the prediction of breeding values under unbalanced data structures and environmental effects [8,9]. An important advantage of this approach is its ability to generate predictions directly interpretable as genetic values, which facilitates practical decision making in breeding pipelines [10,11]. In soybean, these methods are particularly useful because they increase selection accuracy and allow for more efficient recommendation of superior genotypes across generations and environments [12,13].
In addition to mixed model approaches, the increasing availability of phenotypic data has stimulated the use of artificial intelligence and machine learning methods in plant breeding. These approaches have been increasingly explored as complementary tools for prediction, classification, and support in multivariate decision making, especially when several agronomic and quality-related traits are evaluated simultaneously [14,15]. Among machine learning algorithms, Random Forest has received considerable attention because of its capacity to capture nonlinear relationships, variable interactions, and complex data structures while maintaining strong predictive or classificatory performance [15,16]. In soybean breeding, Random Forest has already shown superior performance relative to other machine learning methods for classifying genotypes with contrasting industrial and agronomic profiles based on field-measured traits, supporting its use as a complementary tool for breeder decision making [16].
Thus, the integration of classical quantitative genetic approaches with complementary machine learning analyses may provide a broader perspective for genotype evaluation. While mixed models remain essential to estimating genetic parameters and predicting genotypic values, machine learning methods such as Random Forest can improve the interpretation of multivariate phenotypic patterns and support genotype discrimination in complex breeding datasets [8,14,16,17]. This combined strategy may be especially relevant in soybean breeding, where the simultaneous consideration of yield and grain quality traits is required for the identification of promising lines [2,7].
In view of the above, this study aimed to identify superior soybean lines by integrating genetic parameter estimation and simultaneous selection for grain yield and oil content. A complementary Random Forest classification was used to organize already phenotyped materials into contrasting performance groups for oil content, protein content, and a combined oil-plus-protein criterion. This classification was intended as decision support for selection within the evaluated dataset, rather than as a model for forecasting future performance or estimating unknown seed-composition values.
2. Materials and Methods
The individuals from four soybean populations synthesized by the Breeding Program of the Department of Plant Production at FCAV/UNESP, Jaboticabal, SP, were evaluated over three agricultural years. The breeding populations comprised 22 advanced lines from population A, 42 from population B, 49 from population C, and 29 from population D, totaling 142 distinct advanced lines (Table 1). These 142 lines constitute the target breeding materials and should not be confused with the total number of field plots. In each agricultural year, the complete augmented-block experiment comprised 281 plot-level experimental records because the field layout also contained repeated check plots used for adjustment of the unreplicated advanced lines. The F5:6 generation was evaluated in the 2019/2020 crop year, F5:7 in 2020/2021, and F5:8 in 2021/2022. Meteorological data for the experimental periods were obtained from the Agroclimatological Station of FCAV/UNESP, Jaboticabal, São Paulo, Brazil. Monthly precipitation and temperature data from November to April for the three crop seasons are presented in Supplementary Table S3. The same numbered line identities were followed across successive generations. The commercial cultivar MG/BR 46 (Conquista) and the superior lines 23, 54, and 69 were used as checks. Because each generation was evaluated in a different crop year, generation and year effects are inseparable in comparisons across successive evaluations. During the 2020/2021 and 2021/2022 crop years, the experimental areas were affected by field-specific constraints, including chemical residues and pest attacks. These occurrences were recorded during field evaluation and are considered relevant environmental factors when interpreting differences in experimental precision and genetic parameter estimates among generation-by-year combinations.
Table 1.
Genealogies of the soybean populations in which the lines were evaluated in three agricultural years.
The populations were derived from crosses between contrasting genitors for the oil content traits and presenting desirable commercial characteristics. As a source of high oil content, the Carajás and Tucunaré cultivars were used, which were crossed with three advanced lines from the Soybean Improvement Program mentioned above, which had superior agronomic attributes, such as high grain yield and high oil content, as well as the commercial cultivar Renascença with high oil content and high productivity. The genealogies of the populations evaluated are listed in Table 1.
Until the F5 generation, the populations were managed using the genealogical method, in which individual phenotypic selection took place for each plant within the plot. Each selected plant was placed in a row for selection in the next generation. The selection criteria were based on commercial agronomic traits and the percentage of oil content.
The experimental design was an augmented-block design. Each experimental plot consisted of one 5 m row spaced 0.5 m apart, with mechanical sowing at a density of 16 plants per meter. The 142 advanced lines were evaluated as unreplicated treatments, whereas the checks were repeated across the blocks to provide the replication required for adjustment of the experimental entries. The checks were repeated across blocks to provide the replication required to estimate block effects and experimental error, thereby allowing environmental adjustment of the unreplicated advanced lines within the augmented-block design. Considering advanced-line plots together with the repeated check plots, the complete field experiment comprised 281 plots in each agricultural year.
Plots were evaluated at maturity and after harvest. Plant height at maturity (PHM) was measured in centimeters from the soil surface to the apex of the main stem, whereas first-pod insertion height (FIH) was measured from the soil surface to the insertion point of the lowest pod on the main stem. Hundred-seed weight (HSW) was determined by weighing a sample of 100 seeds and was expressed in grams. Grain yield (GY) was obtained by harvesting the useful plot area, threshing the plants, correcting grain weight to 13% moisture, and converting the result into kg ha−1. Oil content (OC) and protein content (PC) were determined by near-infrared reflectance spectroscopy using a TANGO FT-NIR spectrometer (Bruker Optics, Bremen, Germany) operating in diffuse reflectance mode. Approximately 80 g of intact soybean seeds were analyzed per sample. Oil and protein concentrations were obtained directly from the instrument according to the routine analytical procedure adopted by the soybean breeding program. Lodging (Ac) was assessed using a visual scale from 1 to 5, in which 1 represented upright plants and 5 represented more than 80% lodged plants; therefore, lower scores were considered favorable. Agronomic value (AV) was assessed using a visual scale from 1 to 5, in which 1 represented poor agronomic performance and 5 represented excellent agronomic performance; therefore, higher scores were considered favorable.
The experimental data were analyzed in R (v4.6.1) using linear mixed-model methodology based on REML/BLUP. Data handling and model fitting were performed using the packages nlme, lme4, lmerTest, agricolae, MASS, dplyr, lsmeans, and car. For each population and generation-by-year combination, the model included the overall mean as a fixed effect, genotype as a random effect, block as a random environmental effect, and the residual as a random effect. The mixed model was expressed as , where is the vector of observations, is the vector of fixed effects associated with the overall mean, is the vector of random genotypic effects, is the vector of random block effects, is the vector of residual effects, and , , and are the corresponding incidence matrices. Variance components were estimated by restricted maximum likelihood, and genotypic values were obtained by BLUP. Because the augmented-block design is unbalanced and non-orthogonal by construction, model terms were evaluated through deviance analysis and likelihood-ratio tests (LRTs), following Resende and Duarte [18]. Data from populations A, B, C, and D were analyzed separately within the F5:6, F5:7, and F5:8 generation-by-year combinations. The variance components considered were genotypic variance (σ2g), block variance (σ2b), and residual variance (σ2e). Total phenotypic variance was defined as σ2P = σ2g + σ2b + σ2e. Broad-sense heritability was calculated as h2 = σ2g/σ2P. Selective accuracy was calculated as Acc = √h2. The genetic coefficient of variation was calculated as CVg = (√σ2g/) × 100, the environmental coefficient of variation as CVe = (√σ2e/) × 100, and their ratio as CVg/CVe. Genetic parameters were not reported when the genotypic variance component was not estimated.
Broad-sense heritability was calculated as h2 = σ2g/(σ2g + σ2b + σ2e), where σ2g, σ2b, and σ2e denote genotypic, block, and residual variance, respectively. Selective accuracy was calculated as Acc = √h2. The quantity reported in Table 2, Table 3 and Table 4 as σ2g + σ2e represents the sum of the genotypic and residual variance components and therefore does not include the block variance component. The genetic coefficient of variation was calculated as CVg = (√σ2g/) × 100, whereas the environmental coefficient of variation was calculated as CVe = (√σ2e/) × 100, where is the trait mean. The relative coefficient of variation was calculated as CVg/CVe.
Table 2.
Estimated variance components, genetic parameters and analysis of variance (ANADEV) for the agronomic traits evaluated in F5:6 soybean lines during the 2019/2020 crop year.
Table 3.
Variance components, genetic parameters and analysis of variance (ANADEV) for the agronomic traits evaluated in F5:7 soybean lines during the 2020/2021 crop year.
Table 4.
Variance components, genetic parameters and analysis of variance (ANADEV) for the agronomic traits evaluated in F5:8 soybean lines during the 2021/2022 crop year.
For the deviance analysis, the significance of each random effect was evaluated by comparing the complete model with a reduced model in which the effect under evaluation was removed. The difference between the deviances of the reduced and complete models was evaluated using a likelihood-ratio test against the chi-square distribution with one degree of freedom, at the 5% and 1% probability levels, as recommended by Resende [19].
The Z selection index was calculated in R. Grain yield and oil content were standardized within the analytical dataset so that traits measured on different scales could contribute comparably to the combined criterion. For the Z selection index, grain yield and oil content were first summarized for each advanced line using the mean values across the three generation-by-year evaluations. These lines were then standardized separately for each trait according to , where is the standardized value of line , is the line mean for the trait, is the overall mean of the corresponding trait within the population, and is its phenotypic standard deviation [20]. Because standardized values may be negative, a constant value of 3 was added to each standardized value; this transformation shifts the scale but does not alter the ranking of the lines. The standardized values for grain yield and oil content were then summed for each line, and the resulting combined index was ranked in descending order. The ten highest-ranked lines within each population were retained for comparison. All calculations were performed in R.
Because standardized values may be negative, a constant value of 3 was added to shift the index to positive values. This transformation changes only the location of the index and does not change the ranking of genotypes.
After standardization, the Z values for grain yield and oil content were summed for each line, and the resulting index was ranked in the favorable direction for simultaneous improvement. The ten highest-ranked lines from each population were retained for comparison. All standardization, index calculation, and ranking procedures were performed in R. The index was applied to the line means used in the original selection analysis.
Complementary classification analysis using Random Forest
The Random Forest analysis was designed as a complementary decision-support classification of already phenotyped experimental records. It was not intended to forecast future crop performance or to estimate unknown oil or protein values. The analytical script read the sheet Media_3_anos from the file media_3_anos_genotipos.xlsx and used the variables plant height, first-pod insertion height, lodging, grain yield, agronomic value, oil content, and protein content. The Random Forest dataset comprised the 281 experimental-plot records of the complete augmented-block design. These 281 records consisted of the 142 unreplicated advanced soybean lines together with the repeated check plots distributed across the blocks. Therefore, the 281 records do not represent 281 distinct genotypes. Each row of the analytical dataset corresponds to one experimental plot in the augmented-block structure, whereas the advanced soybean line is the genetic unit of interest.
Three operational classification scenarios were evaluated. For the oil scenario, entries were assigned to Excellent, Intermediate, or Less Promising groups according to the 75th and 50th percentiles of observed oil content. The same rule was applied to observed protein content in the protein scenario. For the combined oil-plus-protein scenario, oil and protein were first standardized, and a balance score was calculated as [(Z_oil + Z_protein)/2] − 0.5|Z_oil − Z_protein|. This criterion rewards high standardized performance for the two traits while penalizing imbalance between them. The combined score was then partitioned at its 50th and 75th percentiles into the same three operational groups. Because oil and protein were measured breeding criteria available at the selection stage, these variables were intentionally retained in the multivariate phenotypic profile. Consequently, the resulting classification metrics quantify internal agreement between the Random Forest organization and the predefined operational groups within the observed dataset. They should not be interpreted as evidence of independent prediction of unknown oil or protein content.
Classification consistency was assessed by stratified five-fold cross-validation with shuffling and a fixed random seed of 42. In each fold, a RandomForestClassifier with 100 trees and random_state = 42 was fitted to the training subset and used to classify the held-out validation subset. Predictions from the five held-out subsets were pooled so that every analytical record contributed once to the aggregated out-of-fold confusion matrix and classification report. Overall accuracy, precision, recall, and F1-score were calculated from these pooled classifications. Because the dataset included repeated check plots from the augmented-block design, the cross-validation procedure was not intended to provide genotype-independent external validation. Rather, it was used to quantify the internal reproducibility of the operational classification within the observed phenotypic dataset.
Principal component analysis (PCA) was performed on the same standardized phenotypic matrix to describe multivariate dispersion among entries. The same PCA ordination underlies the three scenarios, while group labels differ according to the oil, protein, or combined classification rule. Biplots were generated from the first two principal components, with variable loadings represented as vectors. PCA was used descriptively to visualize the structure of the observed phenotypic data and was not treated as an independent validation of the Random Forest classification.
3. Results
Table 2, Table 3 and Table 4 present the estimated variance components and genetic parameters for populations A, B, C, and D in the F5:6, F5:7, and F5:8 generation-by-year combinations, respectively, for the eight evaluated agronomic traits, together with the deviance analysis based on likelihood-ratio tests (LRTs).
Across the three generation-by-year combinations, the four populations differed in their mean grain yield and seed-composition profiles. These differences indicate that the breeding populations contained contrasting combinations of productivity, oil content, and protein content, providing the phenotypic variation required for simultaneous selection. The magnitude and direction of these differences varied among population-by-generation combinations, reinforcing the need to interpret the genetic parameters together with the observed phenotypic performance rather than in isolation.
The F5:6 soybean lines in all populations during the 2019/2020 crop year (Table 2) showed significant differences for the traits PHM, FIH, AV, OC and HSW. In population A, the characters FIH, OC, and PHM adopted heritability values with indices of 0.49, 0.48 and 0.40, respectively. The AV, AC and GY traits had respective values of 0.24, 0.07 and 0.16. The HSW character obtained a null value. Among the traits analyzed in population B, the OC trait had the highest heritability value of 0.59. The characters PC, FIH, GY, PHM, Ac and AV had heritability values of 0.48, 0.38, 0.37, 0.35, 0.07 and 0.21 respectively. HSW also obtained a null value. In population C, the OC trait had the highest heritability value, 0.85, while the heritability values for the PC, FIH and PHM traits were 0.52, 0.45 and 0.44, respectively. The heritability values for GY, AV and Ac were 0.29, 0.20 and 0.07, respectively. The HSW character obtained a null value. The results obtained for population D show heritability values for PC, PHM, FIH and AV of 0.68, 0.39, 0.33 and 0.20 respectively. Ac had value of 0.05 and HSW a value of 0.04. The OC and GY traits showed zero values, differing from the other populations (Table 2).
For OC and GY, selective accuracy varied among populations in F5:6. In population A, accuracy was 0.69 for OC and 0.40 for GY. In population B, both traits had accuracy values above 0.50. In population C, OC showed an accuracy of 0.92 and GY an accuracy of 0.54. In population D, OC and GY had no estimated selective accuracy because the corresponding genotypic variance estimates were zero (Table 2).
The results presented in Table 3, for the F5:7 lines, during the 2020/2021 agricultural year, show that in all four populations evaluated (A, B, C and D) in the Deviance analysis, only grain protein content (PC) showed a significant effect. For the other characters analyzed, there was no significant genetic effect.
Regarding heritability, in population A, the highest value was for PC (0.66), followed by AV (0.12) and HSW (0.02); the other characters had zero values. Population B obtained values of 0.53 for PC, 0.18 for HSW and 0.08 for AV, while the rest of the characters obtained null values. In population C, the PC character had the highest heritability value, with 0.68, and AC and HSW had values of 0.08 and 0.04 respectively, while the other characters evaluated had zero values. The heritability of population D for the PC trait was 0.70. The HSW, AV, Ac and HSW traits had heritability values of 0.17, 0.07, 0.02 and 0.01. FIH, OC and GY had zero values.
Because heritability was low or null for several traits in F5:7, selective accuracy was also reduced. Protein content (PC) showed the highest accuracy values in the four populations, with 0.81, 0.73, 0.82, and 0.84 for populations A, B, C, and D, respectively.
According to the deviance analysis in Table 4, the F5:8 lines evaluated in 2021/2022 showed different sets of significant traits among populations. In population A, PHM, AV, and HSW were significant. In population B, PHM, Ac, AV, HSW, and GY were significant. In population C, PHM, AV, HSW, PC, and GY were significant. In population D, PHM, FIH, AV, HSW, PC, and GY were significant. Thus, the pattern of significant traits in F5:8 differed among populations and from the patterns observed in the preceding generation-by-year combinations.
Selective accuracy also varied among populations in F5:8. In population A, the highest value was observed for PHM (0.60), followed by AV (0.57) and GY (0.55). In population B, PHM showed the highest accuracy (0.70), followed by AV (0.66) and GY (0.62). In population C, GY had the highest accuracy (0.79), followed by PHM (0.65) and Ac (0.64). In population D, PC showed the highest accuracy (0.76), followed by PHM (0.71) and GY (0.69).
The genotypes are ranked in descending order based on their Z index values. The higher the Z index value, the better the performance of the genotype in terms of both grain yield and oil content. Thus, the results in Table 5 indicate that genotype 19 has the best performance, with a Z index value of 6.61, followed by genotype 21, which has a Z index value of 5.69. Both genotypes have high values for both grain yield and oil content.
Table 5.
The ranking of grain yield (GY) and oil content (OC) by the Z index of the average of the ten highest value lines in population A, from the three generations evaluated.
According to the results in Table 6, genotype 42 has the highest value, with a Z selection index value of 6.21. This is followed by genotypes 37 and 24 in second and third place in the index, with values of 4.98 and 4.92 respectively.
Table 6.
The ranking of grain yield (GY) and oil content (OC) by the Z index of the average of the ten highest index lines in population B, from the three generations evaluated.
In Table 7, the genotype with the highest Z index is number 38, followed by genotypes 7 and 42. Genotype 38 stands out with a Z index of 7.45, while genotypes 7 and 42 have Z indices of 7.30 and 5.86 respectively.
Table 7.
The ranking of grain yield (GY) and oil content (OC) by the Z index of the average of the ten highest value lines in population C, from the three generations evaluated.
According to the Z index shown in Table 8, the three best results are for genotypes 27, 29 and 11, resulting in Z indices of 7.44, 6.47 and 5.72 respectively.
Table 8.
The ranking of grain yield (GY) and oil content (OC) by the Z index of the average of the ten highest value lines in population D, from the three generations evaluated.
Complementary Classification Analysis Using Random Forest
The oil-based classification showed high agreement with the predefined operational groups (Table 9). Precision ranged from 97% to 99%, recall from 96% to 100%, and F1-score from 0.97 to 1.00 across classes. Overall, out-of-fold accuracy was 0.99. These values describe the consistency with which Random Forest reproduced the oil-based grouping among the 281 plot-level phenotypic records; they do not represent independent prediction of unknown oil content.
Table 9.
Performance metrics of the Random Forest classification based on oil content. Support refers to the number of plot-level observations in each operational class.
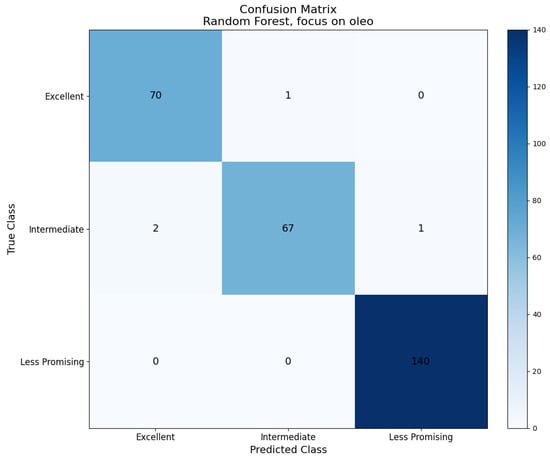
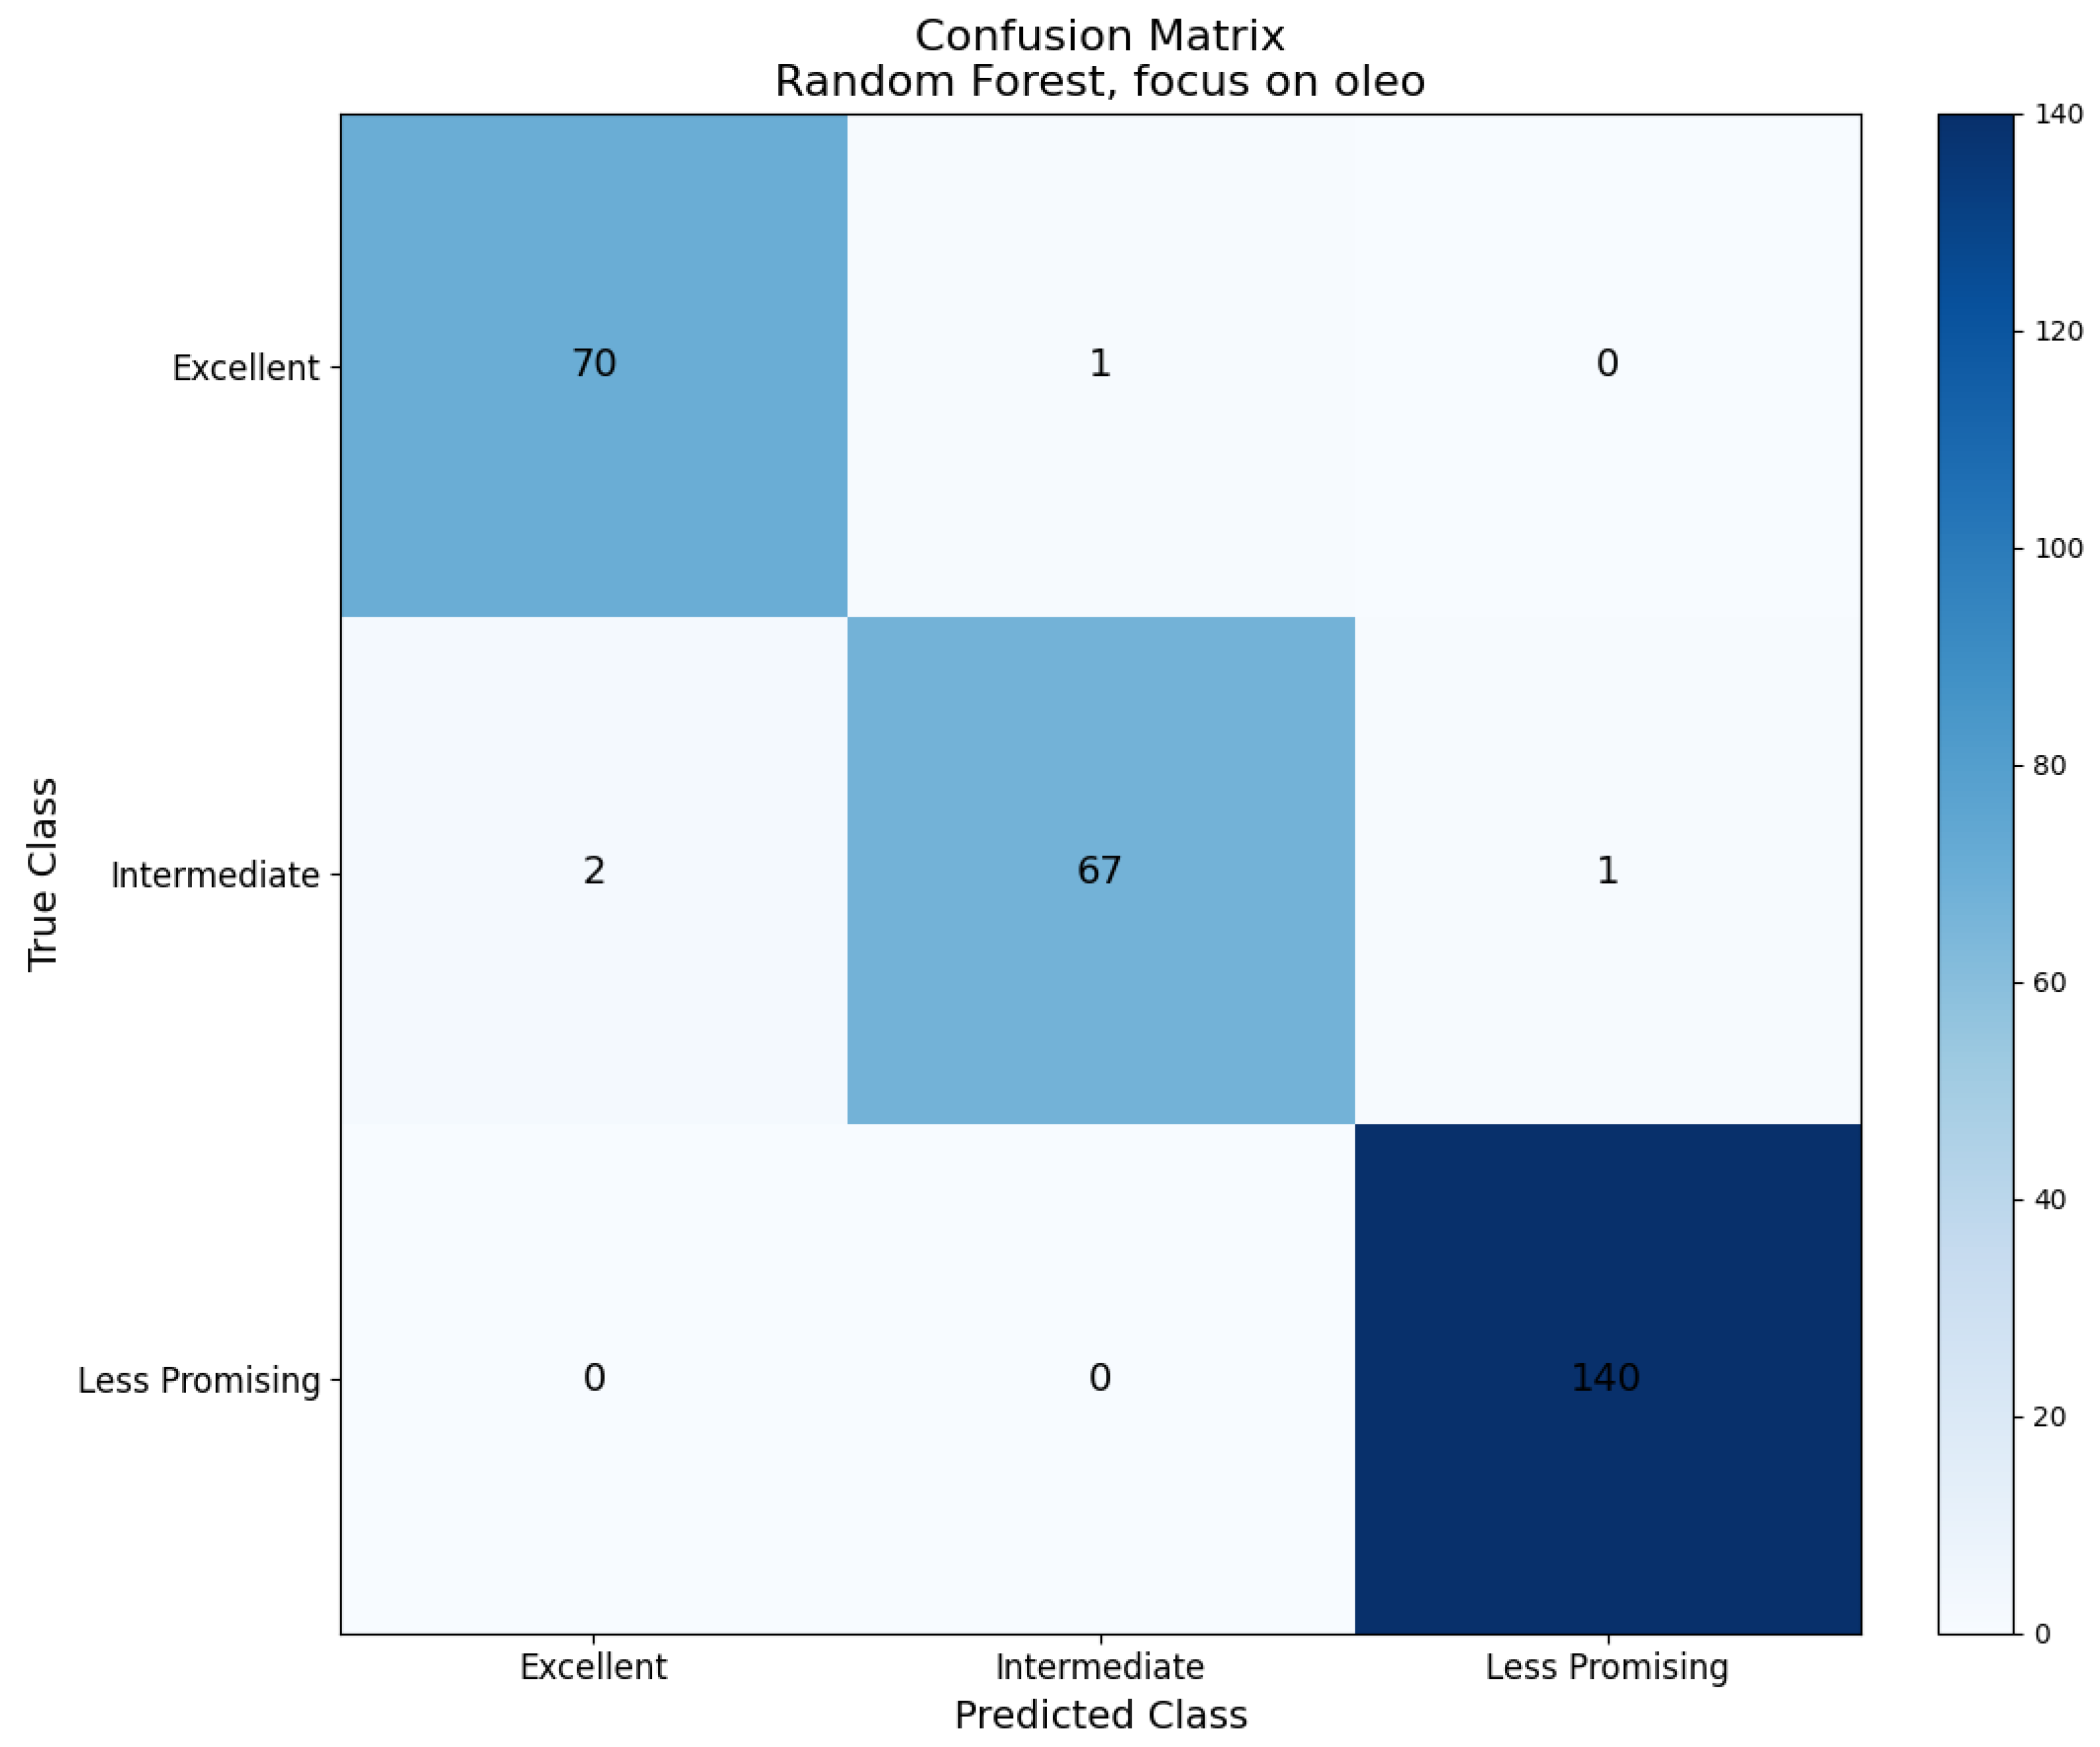
The aggregated out-of-fold confusion matrix for the oil-based classification is shown in Figure 1. Among the 71 plot-level observations assigned to the Excellent group, 70 were classified accordingly, and one was assigned to Intermediate. Among the 70 Intermediate observations, 67 were classified accordingly, two to Excellent, and one to Less Promising. All 140 Less Promising observations were classified consistently with the predefined group. The matrix therefore summarizes agreement between the operational grouping and the multivariate classification across the complete set of 281 observations.
Figure 1.
Aggregated out-of-fold confusion matrix for Random Forest classification in the oil-based scenario. The matrix describes agreement with the predefined Excellent, Intermediate, and Less Promising operational groups within the evaluated dataset.
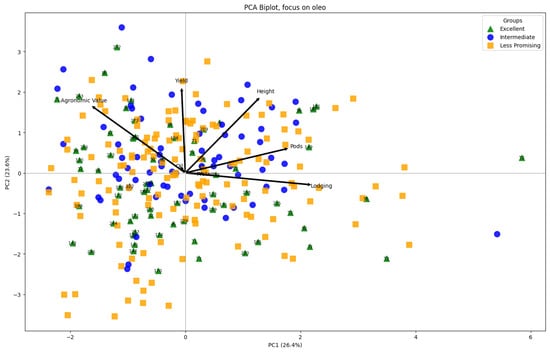
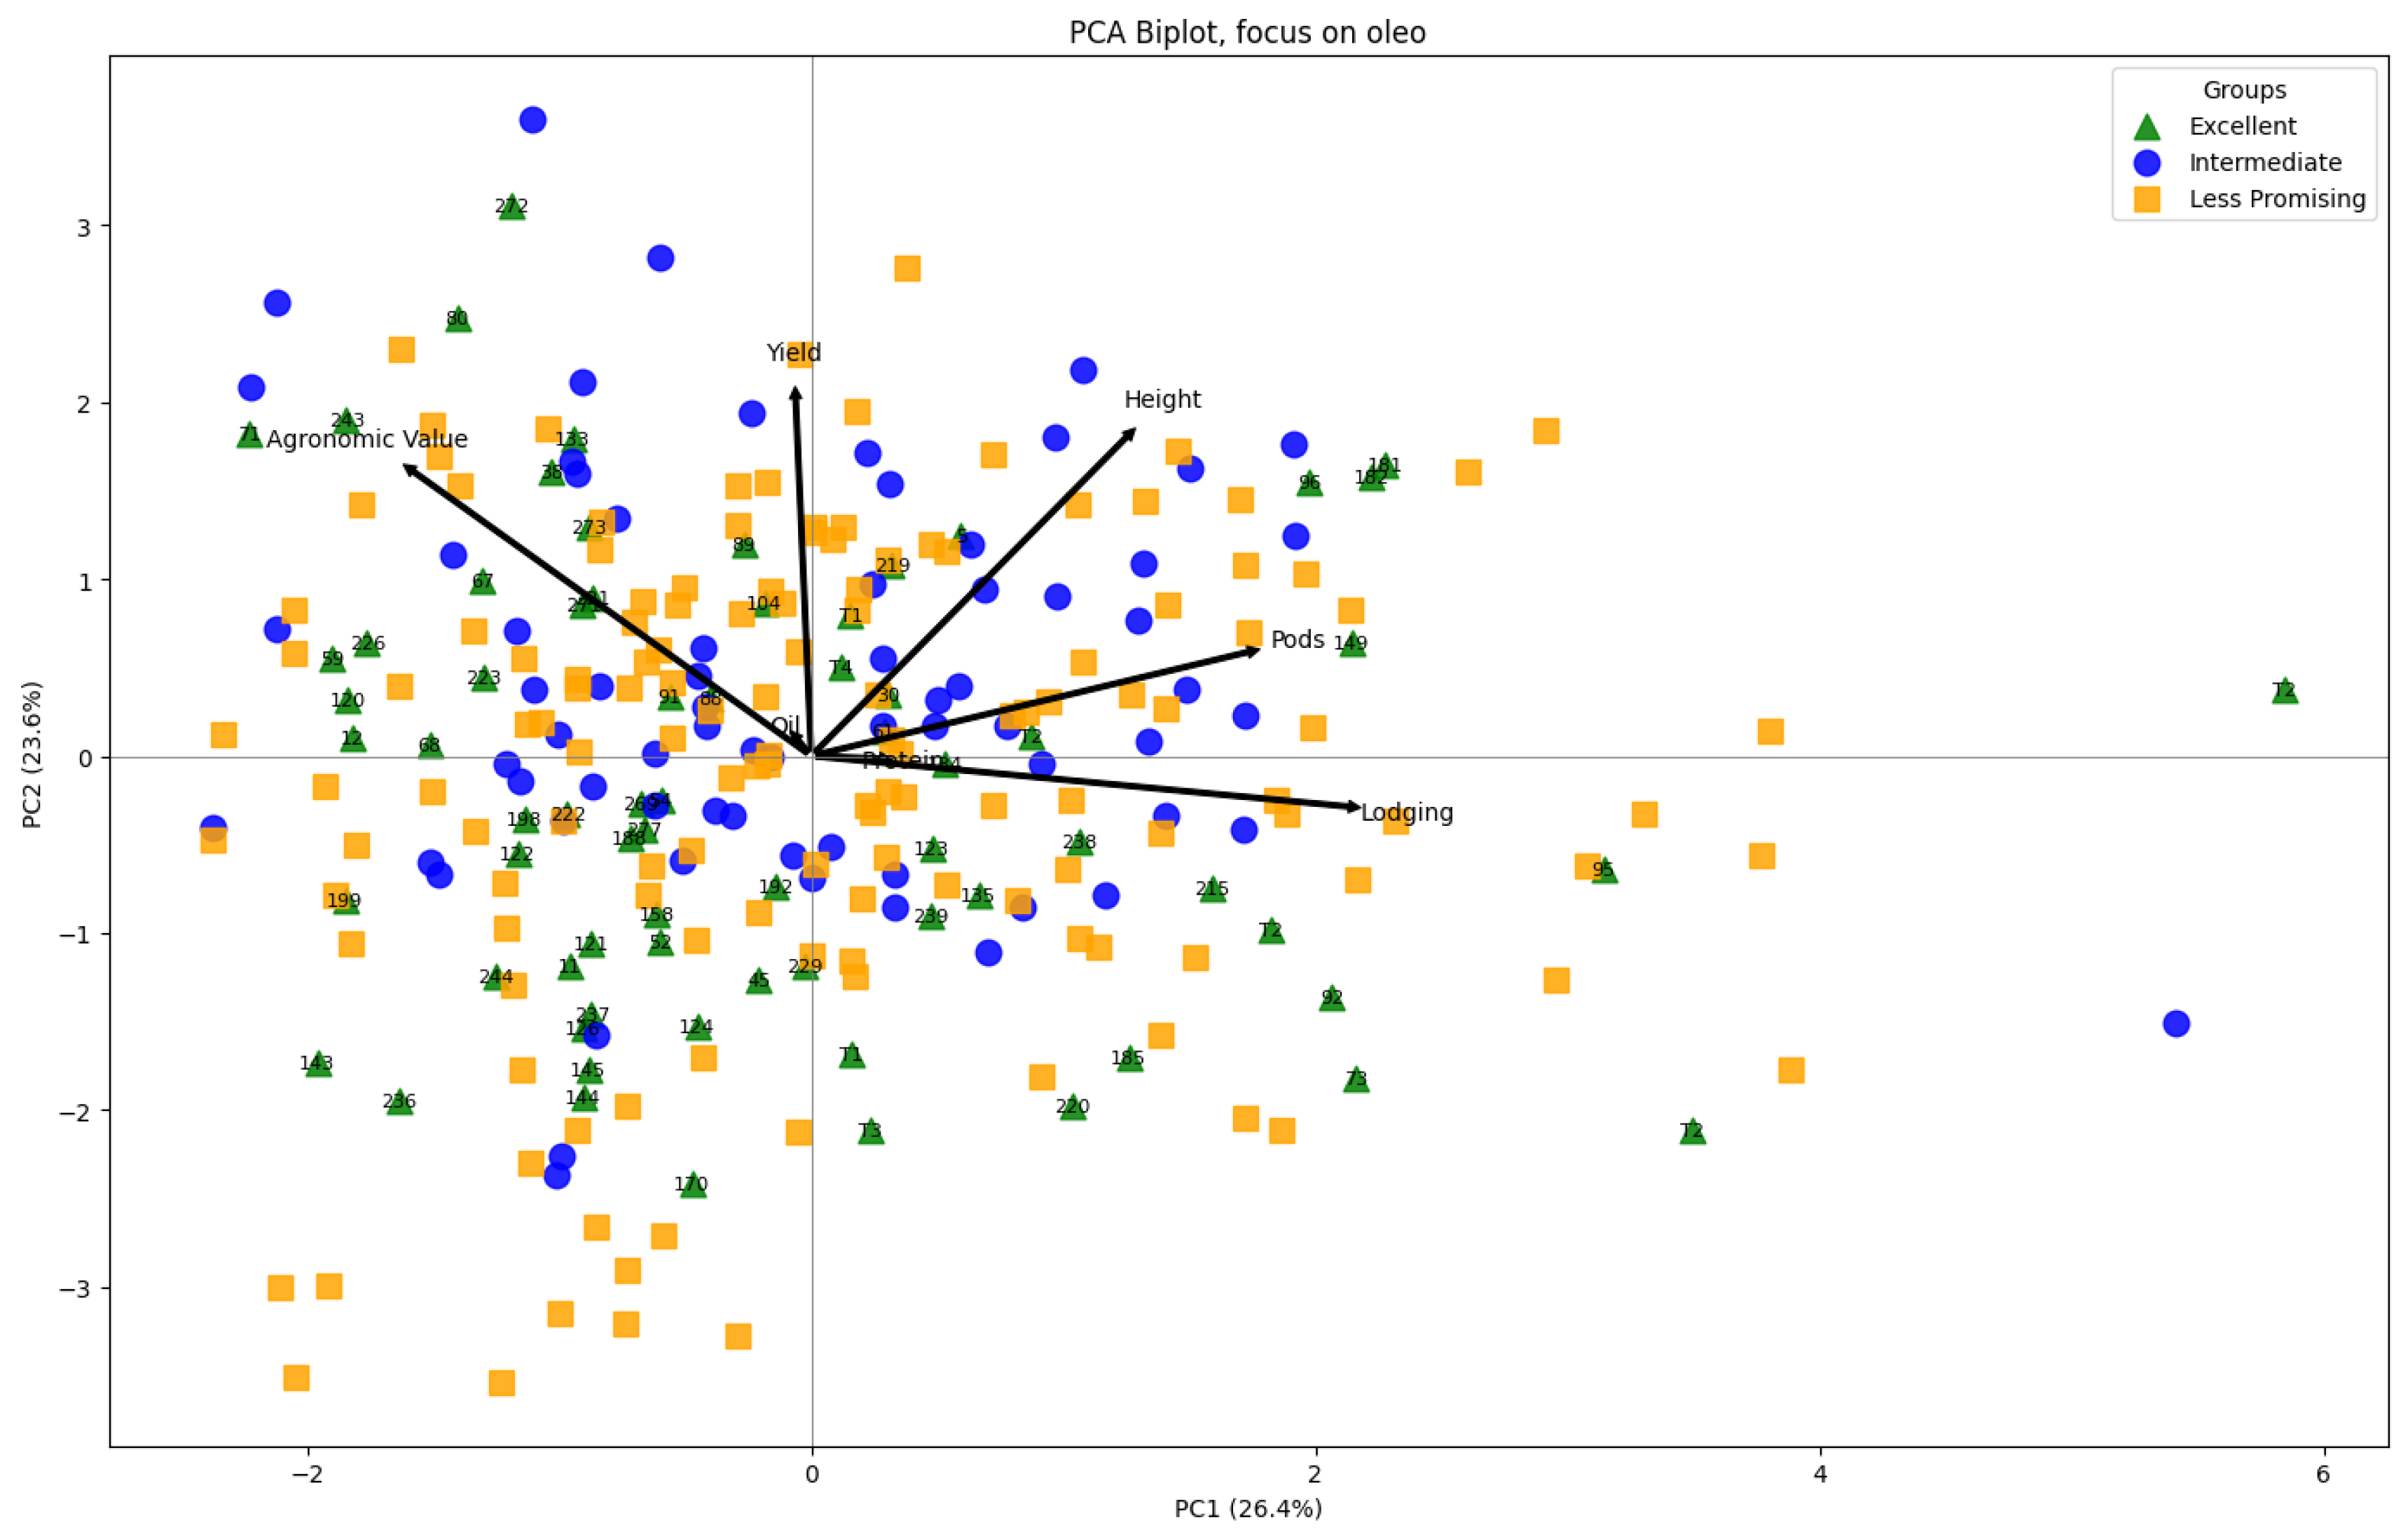
The PCA biplot for the oil-based grouping is shown in Figure 2. These values allow for the identification of the traits contributing most strongly to each component and facilitate biological interpretation of the multivariate structure. The first two principal components explained 50.0% of the total variation, with PC1 and PC2 accounting for 26.4% and 23.6%, respectively. Partial overlap occurred among the three operational groups. Grain yield, plant height, first-pod insertion height, lodging, and agronomic value contributed to the observed multivariate dispersion. Because the same standardized phenotypic matrix was used for PCA in all scenarios, this ordination is descriptive of the common dataset rather than an independent validation of the oil-based classification.
Figure 2.
Principal component analysis biplot for the oil-based classification. Plot-level phenotypic observations were distributed according to the first two principal components, which explained 26.4% and 23.6% of the total variation, respectively. Vectors indicate the contribution and direction of the evaluated traits to dispersion in the multivariate space.
The protein-based classification showed similarly high agreement with the predefined operational groups (Table 10). Precision and recall ranged from 99% to 100%, with F1-scores from 0.99 to 1.00. Overall, out-of-fold accuracy was 1.00. These metrics quantify classification consistency among the 281 observed plot-level records and should not be interpreted as the ability to estimate unknown protein content.
Table 10.
Performance metrics of the Random Forest classification based on protein content. Support refers to the number of plot-level observations in each operational class.
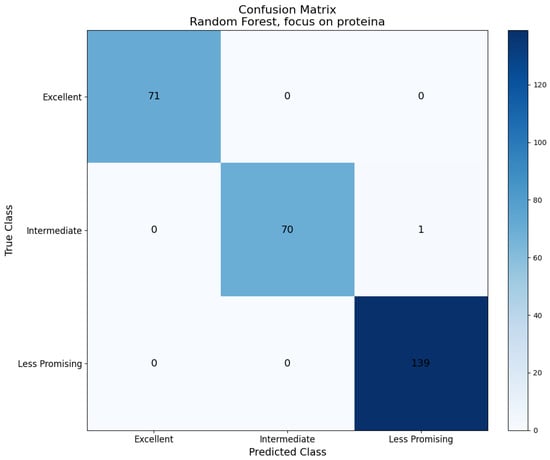
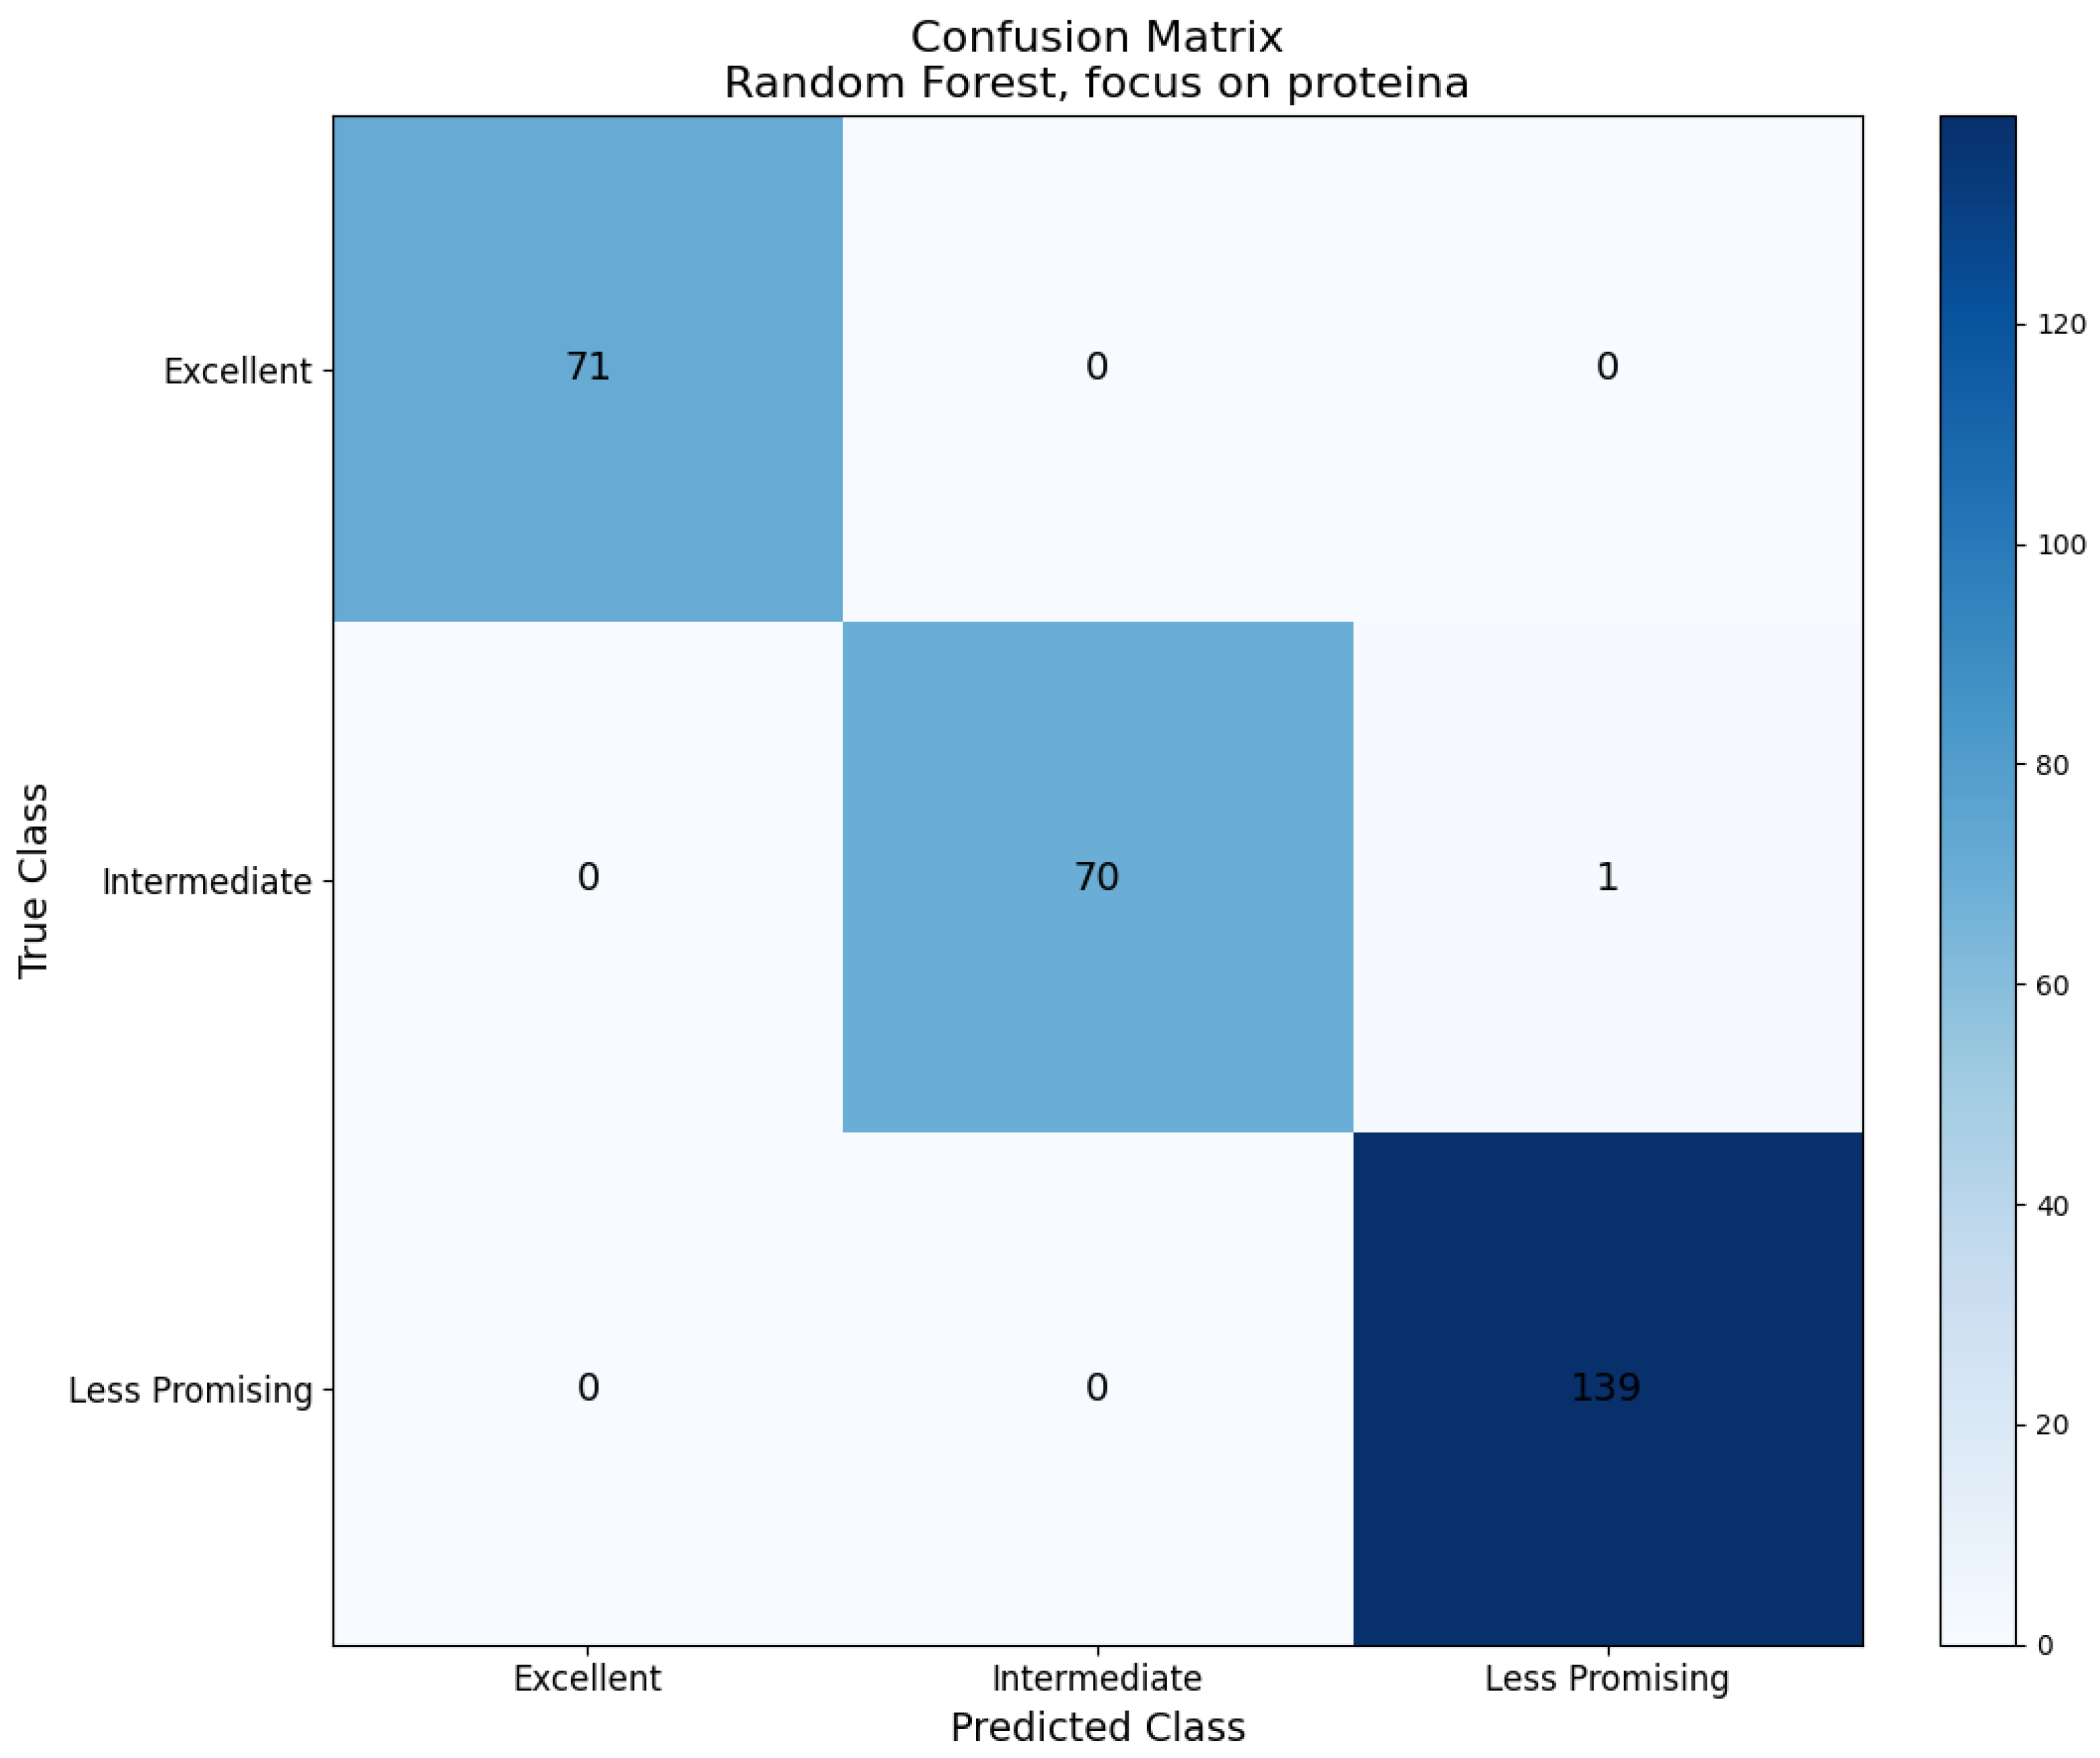
The aggregated out-of-fold confusion matrix for the protein-based classification is shown in Figure 3. All 71 Excellent observations and all 139 Less Promising observations were classified consistently with their predefined groups. Among the 71 Intermediate observations, 70 were classified accordingly, and one was assigned to Less Promising. The near-perfect diagonal pattern reflects strong internal consistency of the operational protein grouping within the evaluated phenotypic records.
Figure 3.
Aggregated out-of-fold confusion matrix for Random Forest classification in the protein-based scenario. The matrix summarizes agreement with the predefined operational groups within the evaluated dataset.
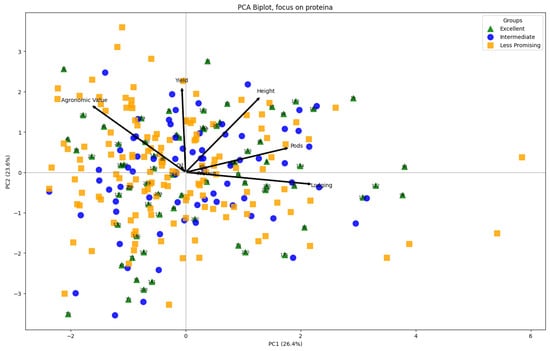
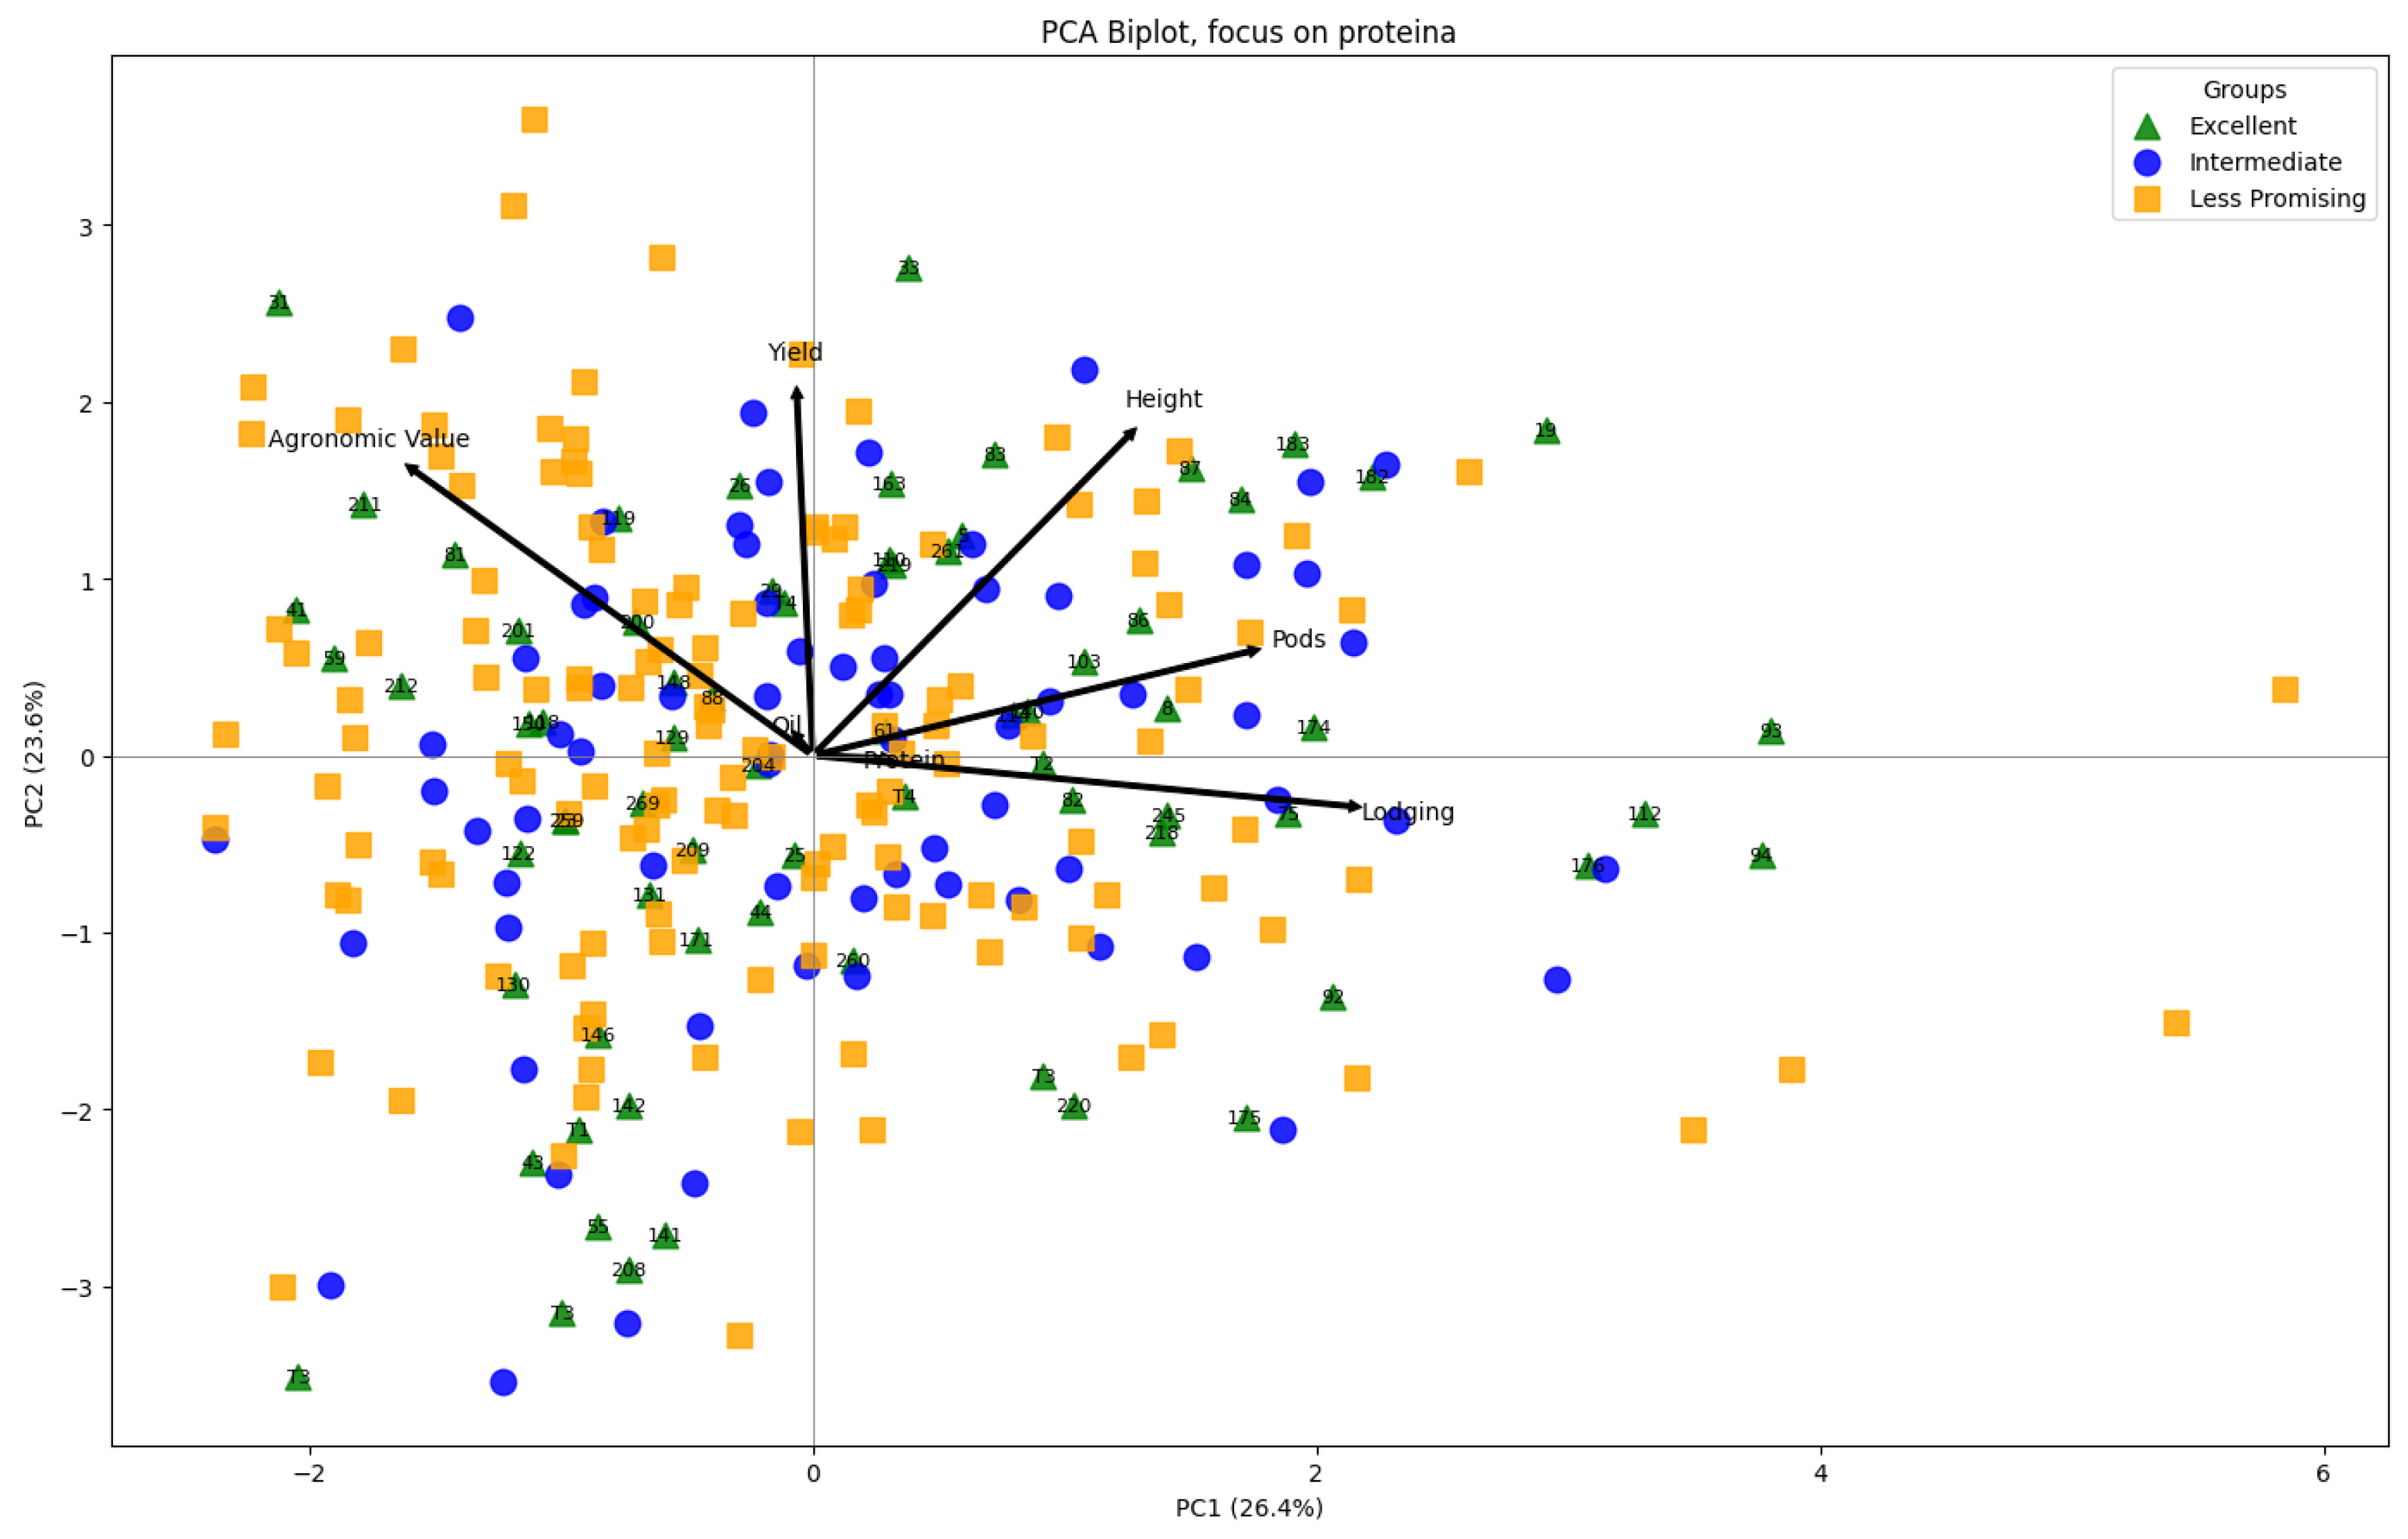
The PCA biplot for the protein-based grouping used the same common phenotypic ordination described above (Figure 4). PC1 and PC2 explained 26.4% and 23.6% of the total variation, respectively. The group labels differed from the oil-based scenario because they were defined by protein content, but the underlying PCA coordinates and loading structure were unchanged. The figure is therefore interpreted as a descriptive visualization of how protein-based groups occupy the common multivariate phenotypic space.
Figure 4.
Principal component analysis biplot showing protein-based operational groups on the common multivariate phenotypic ordination. PC1 and PC2 explained 26.4% and 23.6% of total variation, respectively.
The combined oil-plus-protein classification also showed high agreement with the predefined balance-based groups (Table 11). Precision ranged from 96% to 99%, recall from 96% to 100%, and F1-score from 0.96 to 1.00. Overall, out-of-fold accuracy was 0.98. In this scenario, the operational groups were derived from the standardized means of oil and protein penalized by the absolute imbalance between the two traits, thereby emphasizing observations associated with genotypes that combined favorable values rather than excelling in only one component.
Table 11.
Performance metrics of the Random Forest classification based on the combined oil + protein score. Support refers to the number of plot-level observations in each operational class.
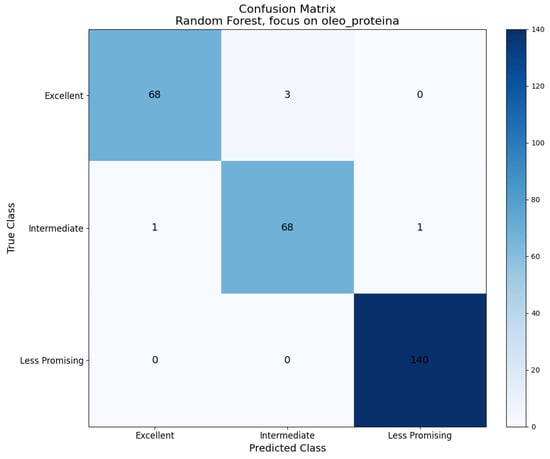
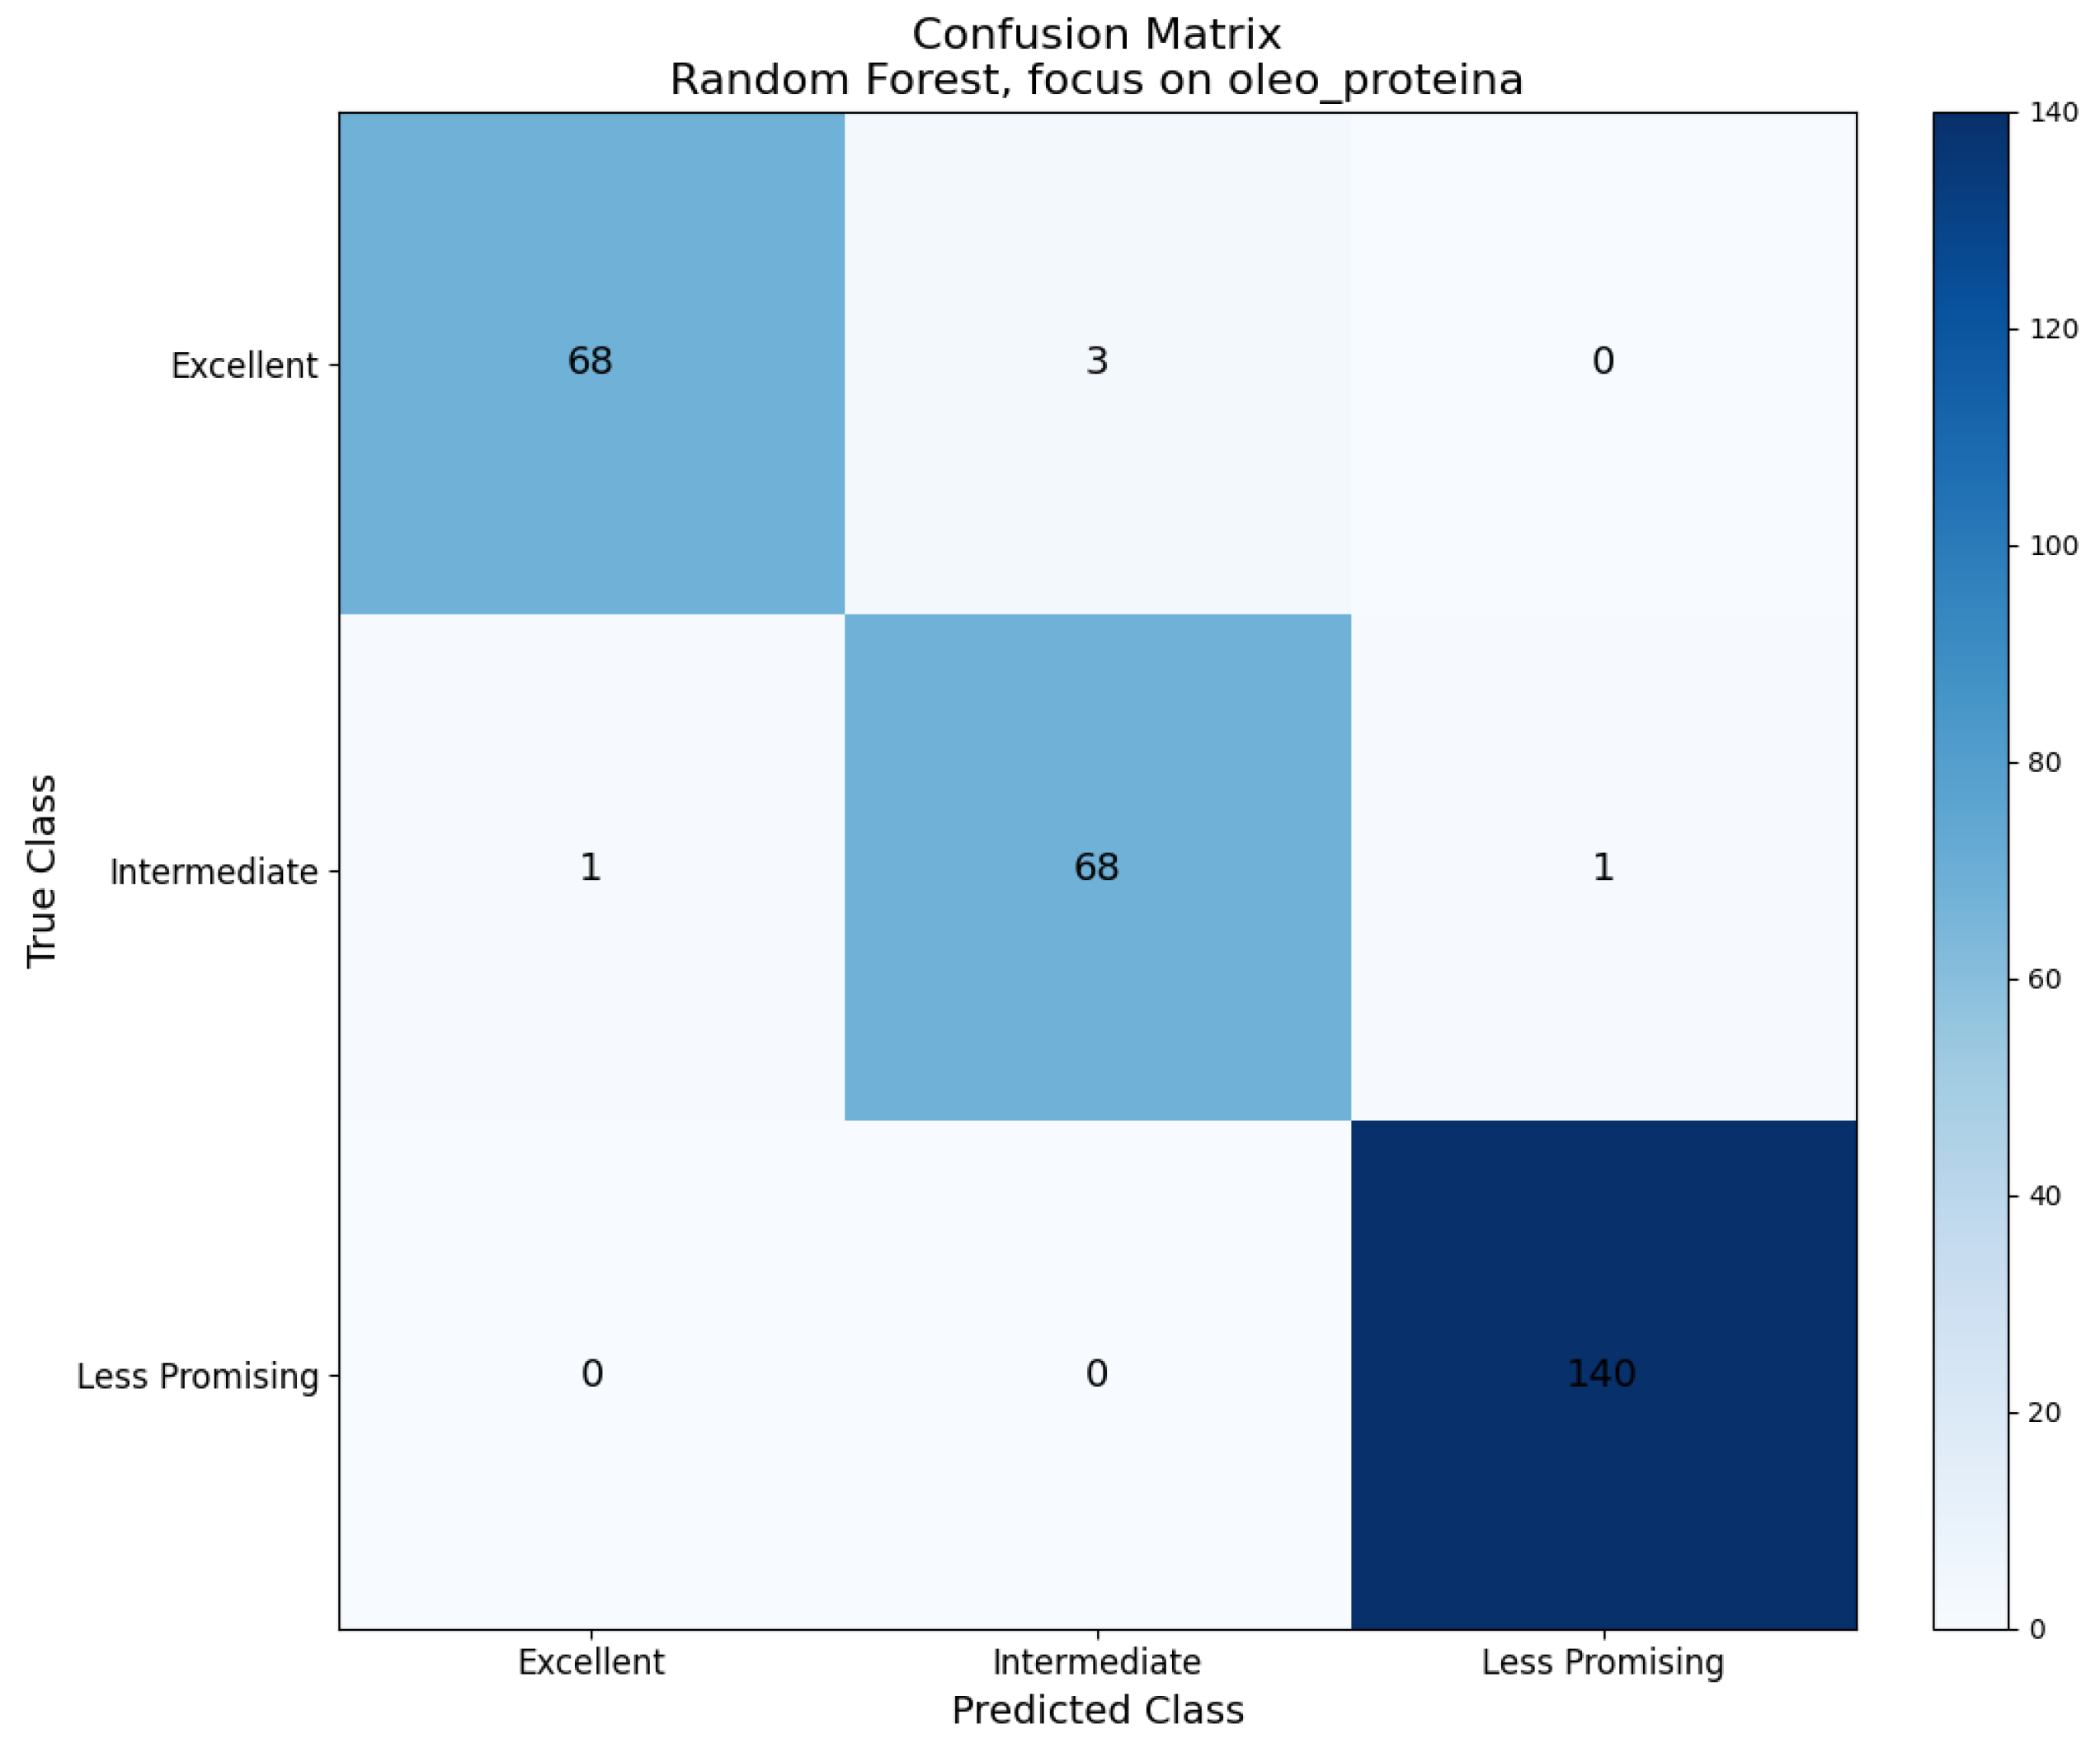
The aggregated out-of-fold confusion matrix for the combined classification is shown in Figure 5. Among 71 Excellent observations, 68 were classified accordingly, and three were assigned to Intermediate. Among 70 Intermediate observations, 68 were classified accordingly, one was assigned to Excellent, and one to Less Promising. All 140 Less Promising observations were classified consistently with the predefined group. The observed disagreements occurred primarily between adjacent performance groups.
Figure 5.
Aggregated out-of-fold confusion matrix for Random Forest classification based on the combined oil-plus-protein balance score.
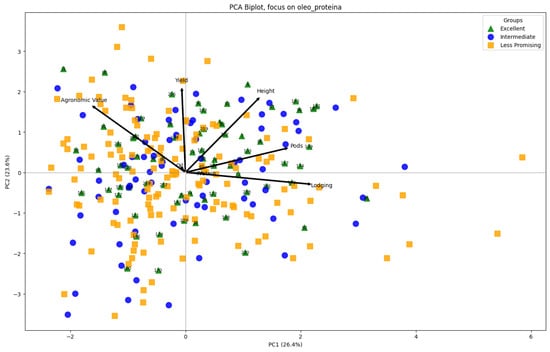
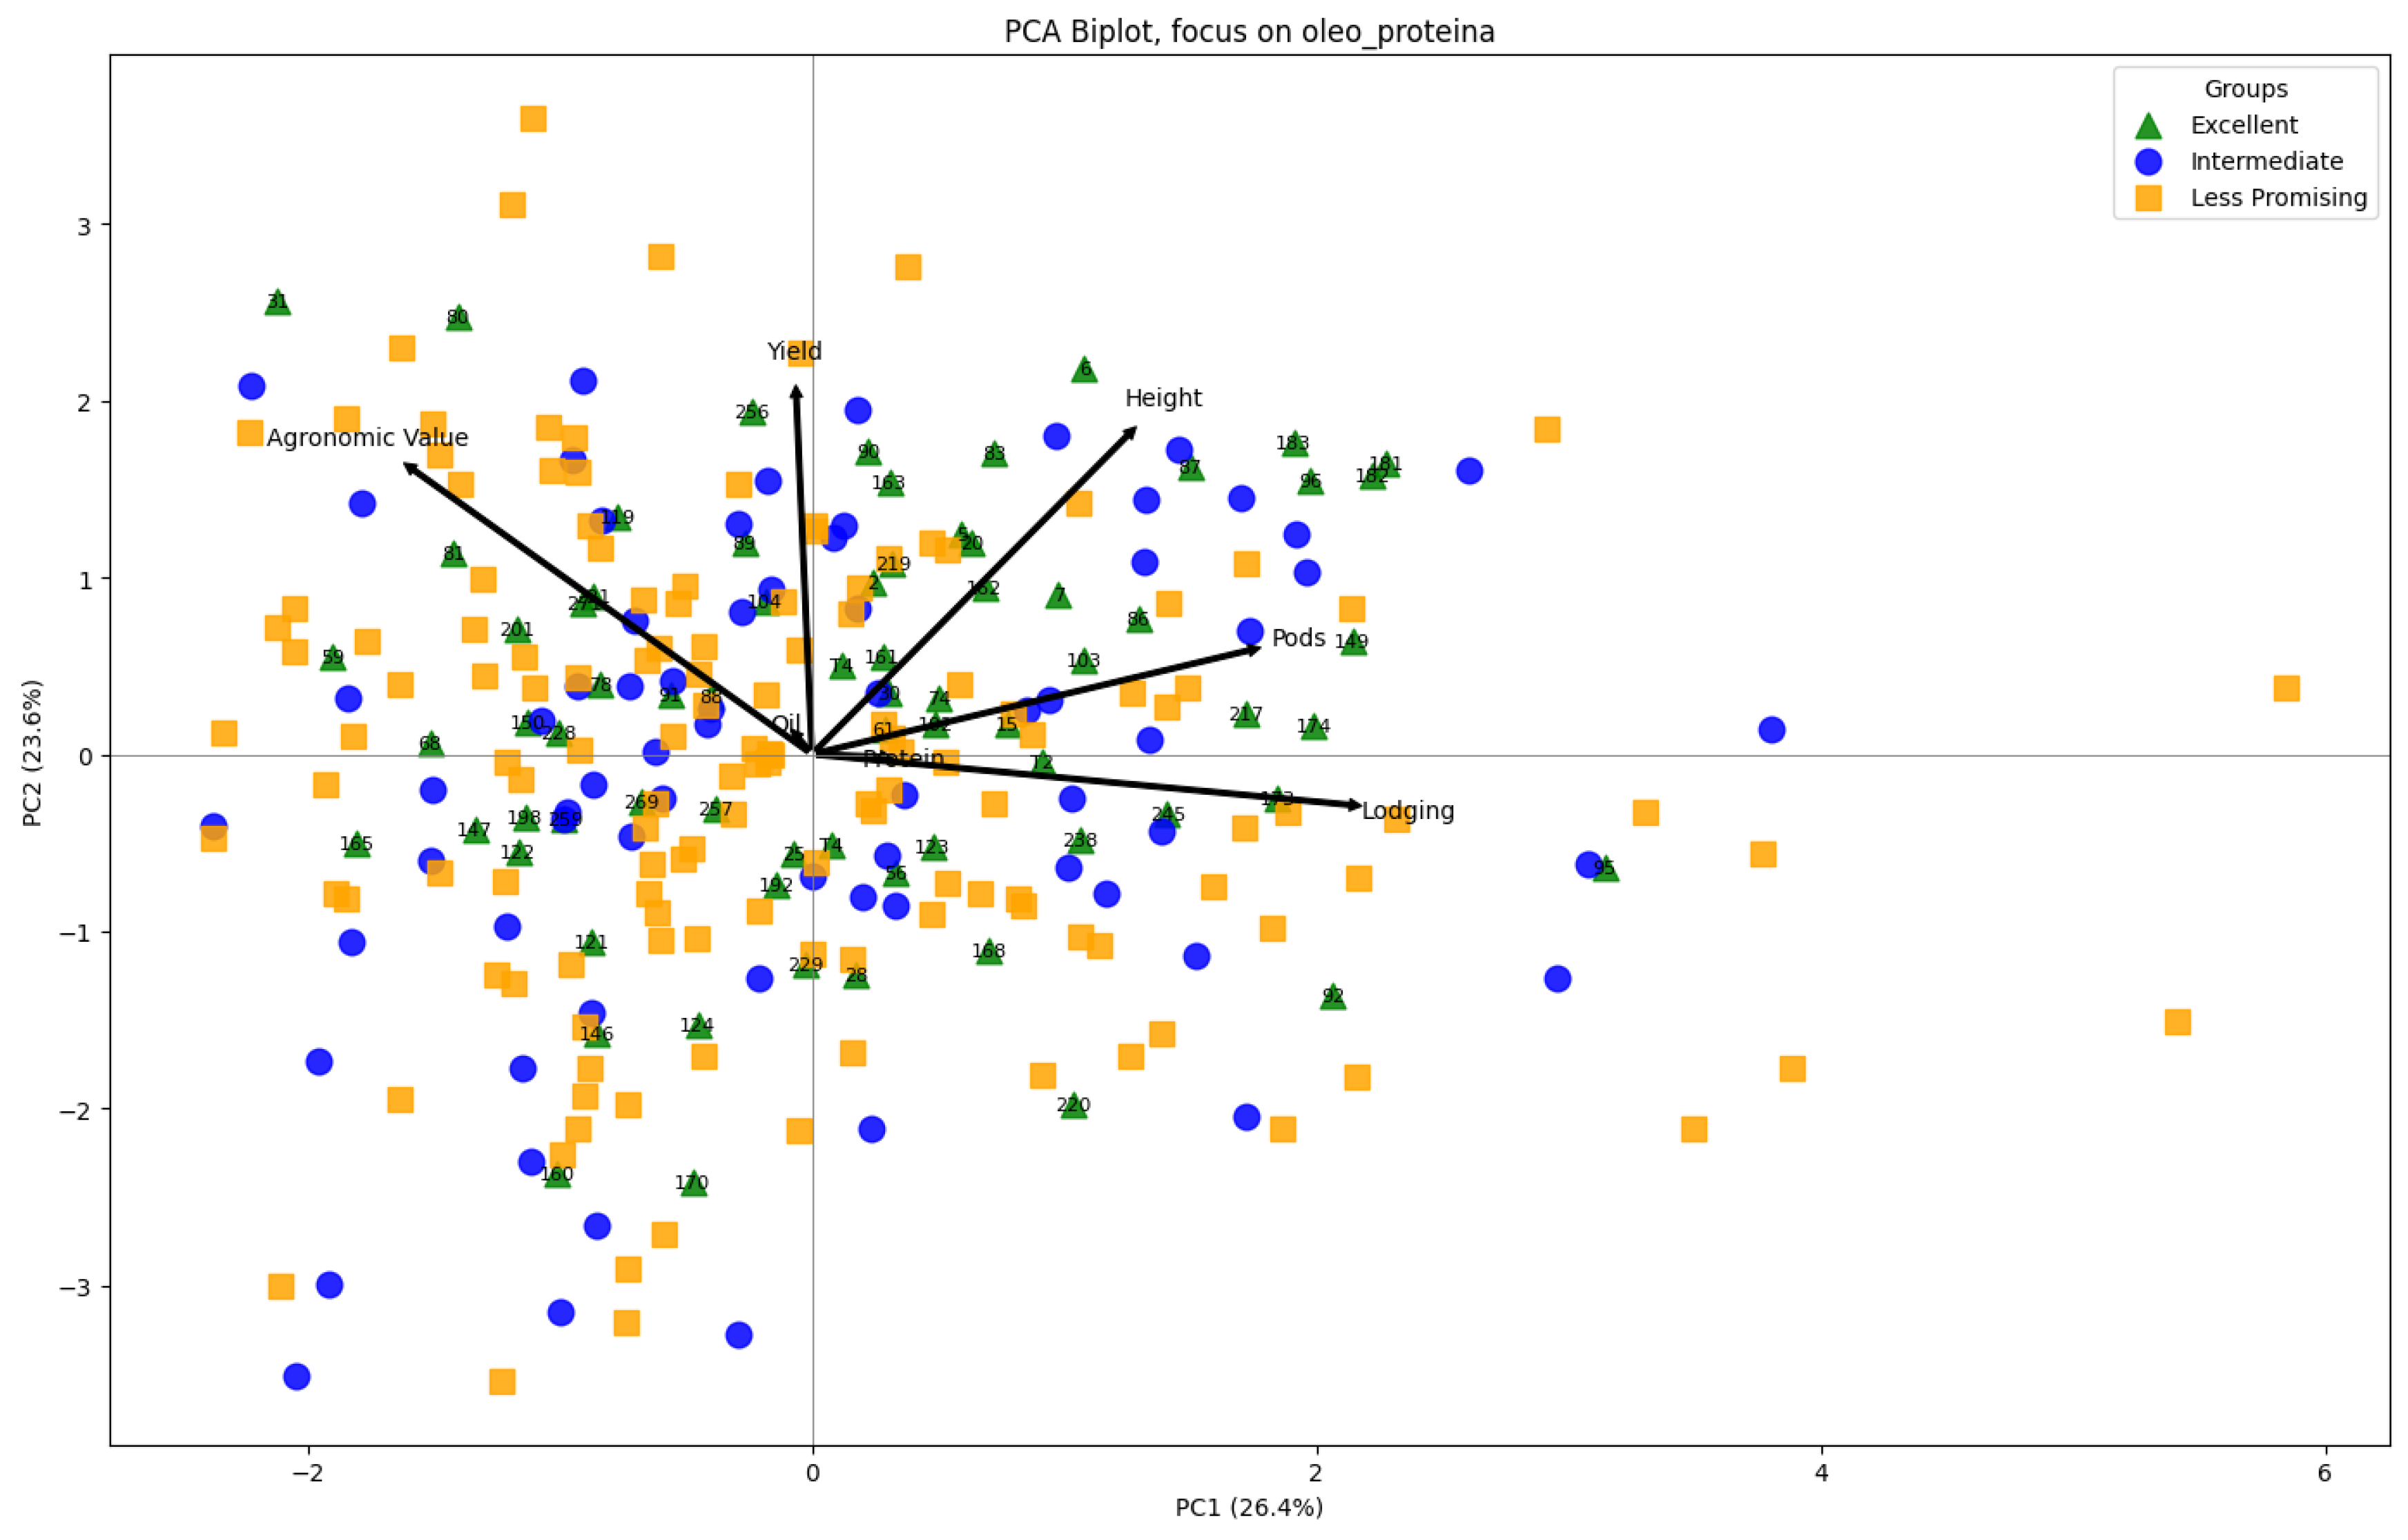
The PCA biplot for the combined scenario is shown in Figure 6. As in the oil and protein figures, it represents the same common phenotypic ordination, with PC1 and PC2 explaining 26.4% and 23.6% of total variation. The combined-score labels reveal how genotypes balancing oil and protein are distributed in the multivariate phenotypic space, while the trait vectors summarize the contribution of the measured variables to overall dispersion.
Figure 6.
Principal component analysis biplot showing combined oil-plus-protein operational groups on the common multivariate phenotypic ordination. PC1 and PC2 explained 26.4% and 23.6% of total variation, respectively.
4. Discussion
The deviance analyses indicated genetic variability among genotypes for several traits, whereas other traits showed low or null estimated genotypic variance in specific population-by-generation combinations. Because F5:6, F5:7, and F5:8 were evaluated in different crop years, the observed changes in variance components across successive evaluations cannot be attributed exclusively to selection. They are consistent with the combined influence of continued selection, increasing homozygosity, population-specific genetic structure, and environmental differences among years. Previous studies have shown that sustained selection can narrow genetic variation in soybean breeding populations [21,22], but the present design does not isolate this mechanism from year effects.
Environmental conditions may have also contributed to the differences among successive evaluations. This manuscript records problems during the 2020/2021 and 2021/2022 crop years, including chemical residues in the field and pest attacks in the experimental areas. Such events may increase residual variation and reduce the precision of genetic parameter estimates. Experimental coefficients of variation should therefore be interpreted trait by trait and population by population rather than through a single overall mean, particularly because the traits are measured on different scales.
Low or null estimates of genotypic variance can produce low heritability and selective accuracy for a given trait and population. These parameters are specific to the genetic material and environmental conditions under evaluation; therefore, low values do not by themselves demonstrate a permanently narrow genetic base. In the present study, they are best interpreted as evidence that the amount of exploitable variation differed among traits, populations, and generation-by-year combinations.
Resende and Duarte [18] emphasize that selective accuracy is a parameter that considers genetic variation in relation to residual variation, providing a more accurate measure of experimental quality. Selective accuracy is therefore a more appropriate measure for assessing experimental precision in cultivar evaluation experiments. This measure takes into account the proportions between the genetic and residual variations associated with the character being evaluated, as well as the magnitude of the residual variation.
Table 2, Table 3 and Table 4 show that several genotypic variance and accuracy estimates were lower in later evaluations than in F5:6. This pattern may be consistent with progressive selection and increasing fixation of the advanced lines; however, because generation and crop year were completely confounded, the contribution of selection cannot be separated from annual environmental effects. The same line identities were followed through F5:6, F5:7, and F5:8, allowing the breeding trajectory to be described, but the experimental design does not permit the effects of generation and year to be separated. Consequently, the temporal pattern should be interpreted as an observed change across successive generation-by-year combinations rather than as a causal estimate of selection-induced loss of variability.
Selection intensity, genetic properties of the population, and environmental conditions jointly influence response to selection [23]. Greater selection pressure can increase the selection differential while reducing the amount of variation retained for subsequent cycles. In advanced self-pollinated lines, increasing homozygosity also reduces within-line segregation. These principles are compatible with the pattern observed here, but they do not remove the generation-by-year confounding present in the current dataset.
The Z selection index was used to synthesize grain yield and oil content into a common standardized criterion. This type of index is operationally attractive because it places traits measured on different scales into comparable standardized units and allows for the simultaneous ranking of lines. Related standardized selection approaches have been reported in other crop breeding contexts [24,25].
Among the highest-ranked lines in each population, line 19 ranked first in population A, line 42 in population B, line 38 in population C, and line 27 in population D. These rankings reflect the simultaneous contribution of grain yield and oil content rather than superiority for either trait considered separately. This is evident from the different combinations observed among the highest-ranked materials. For example, in population B, line 37 showed higher grain yield than line 42, whereas line 42 had higher oil content and consequently achieved the highest combined Z index value. Similarly, in population C, line 7 had the highest oil content among the leading materials, whereas line 38 combined substantially higher grain yield with high oil content and therefore ranked first. These results illustrate the practical purpose of the index: to identify lines with a favorable balance between productivity and oil concentration rather than simply selecting the maximum value for a single trait. Across these population-specific rankings, genotype 38 from population C had the largest reported Z index value, 7.45. These rankings should be interpreted as combined grain yield and oil content performance according to the specified Z criterion, rather than as grain yield ranking alone.
The selected lines can advance to subsequent stages of the breeding program, where their performance should be tested under replicated preliminary yield trials and, later, in multi-environment VCU evaluations. The Z index ranking was based on mean performance across the three generation-by-year evaluations and was intended to identify lines combining favorable grain yield and oil content. The present analysis was not designed to test whether the selected lines consistently outperformed the repeated checks in each individual crop year, nor to quantify year-specific ranking stability. Therefore, the rankings should be interpreted as an overall multi-year selection criterion within each population rather than as evidence of stable superiority across individual environments. Such stages are necessary to determine adaptation, stability, and comparative performance relative to established cultivars before any commercial recommendation can be made.
The simultaneous improvement in grain yield, oil content, and protein content is a relevant breeding objective, but these traits may exhibit contrasting relationships. In soybean, oil and protein contents are frequently negatively associated, whereas their relationships with grain yield may vary according to genetic background and environmental conditions [26,27,28,29]. Consequently, selection based on a single trait may result in unfavorable responses in other economically important characteristics. In the present study, this biological trade-off reinforces the importance of evaluating productivity and seed composition jointly rather than independently. The Z selection index addressed this issue by combining grain yield and oil content, whereas the complementary multivariate analysis incorporated oil, protein, and agronomic traits to support a broader selection decision.
The observed reduction or disappearance of estimated genetic variance for some traits suggests that additional selection response may be limited within specific population-by-generation combinations. Introducing genetically diverse parents with complementary traits may be considered in future crossing cycles when the breeding objective requires renewed variability. However, the present data do not quantify future genetic gain and should not be used to infer that variability declined solely because of selection.
Complementary Classification Analysis Using Random Forest
The operational groups should be interpreted according to the breeding objective used to define each scenario. In the oil-based scenario, the groups primarily represent increasing levels of observed oil content; in the protein-based scenario, they represent increasing levels of observed protein content; and in the combined scenario, they represent increasingly favorable joint performance for oil and protein while penalizing imbalance between the two traits. Grain yield, plant height, first-pod insertion height, lodging, and agronomic value provide additional phenotypic context for these groups and allow the breeder to consider seed composition together with agronomic performance. Therefore, the biological meaning of the Random Forest analysis lies in the multivariate characterization of already phenotyped materials rather than in the prediction of an unknown biochemical phenotype.
Oil-Based Classification
The Random Forest analysis should be interpreted according to its intended role in this study. It was used after phenotyping as a complementary classification and decision-support procedure for organizing materials according to observed performance profiles, not as a model for predicting future oil content. Under this framework, the high oil-based classification metrics describe how consistently the multivariate algorithm reproduced the operational groups defined from the observed dataset.
Precision, recall, and F1-score were high for the oil-based grouping (Table 9). Because oil content itself contributed both to the operational group definition and to the multivariate feature set, these metrics should not be interpreted as independent evidence that Random Forest can infer unknown oil content. Their value in this study is instead procedural: they show that the selected phenotypic profile produced a stable internal organization of the already evaluated materials into contrasting breeding groups.
The Less Promising group showed complete classification consistency, whereas limited errors occurred mainly between the Excellent and Intermediate groups. This is compatible with the continuous nature of quantitative variation, in which entries close to operational percentile boundaries may have similar multivariate profiles. From a breeding perspective, such grouping can support either the retention of superior materials or the elimination of less suitable materials, depending on the selection objective.
The aggregated out-of-fold confusion matrix (Figure 1) provides an internal check of classification consistency across the five validation folds. It does not constitute temporal or external validation because all entries derive from the same observed phenotypic dataset. Accordingly, the results support the use of Random Forest as an organizational aid for selection within this dataset, while broader generalization would require independent material or a separately designed validation study.
PCA provided a descriptive representation of the multivariate phenotypic structure of the evaluated materials. The first two principal components jointly explained 50.0% of the total variation, with PC1 accounting for 26.4% and PC2 for 23.6% (Table S2). PC1 was primarily associated with lodging, first-pod insertion height, and agronomic value, which contributed 38.5%, 25.7%, and 21.3%, respectively (Table S1). Thus, PC1 mainly represented variation related to plant architecture, lodging behavior, and overall agronomic performance. In contrast, PC2 was dominated by grain yield, plant height, and agronomic value, with contributions of 39.8%, 31.2%, and 24.6%, respectively (Table S1), indicating that this component mainly represented productivity and plant-performance variation. Oil and protein contents made only minor contributions to the first two components (Table S1), indicating that the principal multivariate structure was driven predominantly by agronomic rather than seed-composition traits. Traits with vectors pointing in similar directions indicate positive associations within the ordination space, whereas vectors in opposite directions indicate contrasting phenotypic patterns. In breeding terms, the PCA complements the Random Forest classification by showing whether materials assigned to favorable operational groups also occupy regions of the multivariate space associated with desirable combinations of agronomic performance and seed composition. Because the same standardized phenotypic matrix was used in all three scenarios, the PCA should be interpreted as a common multivariate representation of the evaluated materials rather than as an independent validation of the Random Forest classification.
Quantitative loadings confirmed that PC1 was mainly associated with lodging, first-pod insertion height, and agronomic value, whereas PC2 was mainly associated with grain yield, plant height, and agronomic value.
Thus, the oil-based scenario is best viewed as an operational classification of already phenotyped soybean materials. Its usefulness lies in organizing the observed multivariate information for breeder decision making, not in replacing direct oil measurement or forecasting oil performance in future environments.
Protein-Based Classification
In the protein-based scenario, the same decision-support logic applies. Protein content was already measured and was used both to define the operational groups and as part of the multivariate phenotypic profile. Therefore, the near-perfect classification metrics quantify consistency of group assignment within the observed dataset rather than independent prediction of unknown protein content.
The precision, recall, and F1 values in Table 10 show that the protein-defined groups were highly stable under the multivariate Random Forest classification. This finding indicates a clear internal organization of the evaluated phenotypes, but it should not be extrapolated to predict protein content in unmeasured genotypes or future crop years.
The confusion matrix (Figure 3) contained only one off-diagonal assignment. This result shows strong internal agreement with the operational protein grouping. Biologically, the observed groups represent different combinations of seed-composition and agronomic traits in the evaluated materials; however, the present analysis does not test causality among these traits or establish external predictive performance.
The protein-based PCA figure uses the same common ordination as oil-based and combined scenarios. Its contribution is therefore descriptive: it shows where the protein-defined groups fall within the shared multivariate phenotypic space and which measured traits contribute to overall dispersion.
Overall, the protein-based classification provided a consistent way to organize already evaluated genotypes according to their observed performance profile. Its intended application is breeder decision support after phenotyping, rather than substitution of protein measurement or prediction of future performance.
Combined Oil + Protein Score-Based Classification
The combined oil-plus-protein scenario addresses a different breeding question from the single-trait groupings. From a breeding perspective, this antagonistic relationship means that selection for increased oil or protein content in isolation may shift the population away from genotypes that combine favorable levels of both traits. Therefore, the combined criterion is particularly useful for identifying lines that do not necessarily maximize either component individually but instead maintain a favorable balance between oil and protein while preserving an acceptable agronomic profile. Such materials may be especially relevant when the breeding objective requires simultaneous improvement in seed composition rather than extreme performance for a single quality trait. Oil and protein are commonly negatively associated, which makes simultaneous improvement challenging. The balance score used here explicitly rewards high standardized mean performance for both traits and penalizes divergence between them. Consequently, this scenario was designed to identify materials with a more favorable compromise between oil and protein rather than simply maximizing one component.
The combined grouping retained high precision, recall, and F1 values (Table 11), with slightly more disagreement between Excellent and Intermediate entries than in the protein scenario. This result is consistent with the greater restrictiveness of a criterion that requires favorable joint performance. Because the combined score itself is derived from oil and protein values that are also present in the multivariate feature set, the metrics again represent internal classification consistency and not independent prediction.
The confusion matrix (Figure 5) shows that errors were concentrated between adjacent performance groups, whereas the Less Promising group was classified consistently in all cases. For selection purposes, this pattern is informative because it indicates that the strongest ambiguity occurs near the operational boundary between superior and intermediate profiles, where different oil–protein combinations can produce similar balance scores.
The combined-score PCA figure (Figure 6) places these operational groups in the same common phenotypic space used in the other scenarios. The distribution illustrates how genotypes that balance oil and protein are situated relative to variation in plant height, first-pod insertion height, grain yield, agronomic value, lodging, oil, and protein. The figure therefore complements the classification by describing the phenotype structure of the selected groups.
Integration with the Main Study Results
Taken together, the three Random Forest scenarios provide complementary organizational views of the same set of already measured phenotypes. The oil and protein scenarios emphasize performance for each seed-composition trait separately, whereas the combined score explicitly targets balance between them. This use of machine learning is best understood as multivariate decision support for selection, not as a predictive model for future environments.
Within that scope, Random Forest adds a reproducible classification layer to the conventional quantitative genetic and selection index analyses. Mixed models address genetic parameter estimation, the Z index ranks lines for simultaneous grain yield and oil content, and the classification procedure organizes phenotyped materials according to oil, protein, and balanced seed-composition objectives. These analytical components answer related but distinct breeding questions and should not be interpreted as interchangeable forms of validation.
Study limitations
The principal limitation for comparisons across successive generations is the complete coincidence between generation and crop year, which prevents causal separation of selection effects from annual environmental variation. The Random Forest analysis has a different limitation: its operational groups were intentionally derived from observed oil and protein values that were also part of the multivariate feature matrix. Accordingly, the reported cross-validation metrics describe internal classification consistency and should not be interpreted as independent prediction of unmeasured genotypes or future environments. These limitations do not invalidate the use of the analyses as breeder decision-support tools within the evaluated material, but they delimit the scope of inference.
5. Conclusions
The evaluated populations contained exploitable variation for several agronomic and seed-composition traits, although the magnitude of genetic parameter estimates differed among populations and successive generation-by-year combinations. The Z selection index provided a direct ranking criterion for simultaneous grain yield and oil content, identifying the highest-ranked lines within each population. The complementary Random Forest analysis was used after phenotyping to organize the observed materials into oil-based, protein-based, and combined oil-plus-protein performance groups, with the combined score explicitly favoring balance between the two seed-composition traits. The high out-of-fold classification metrics describe internal consistency with these operational groups and should not be interpreted as prediction of future or unmeasured performance. Because generation and crop year coincided, changes in genetic variance across successive evaluations cannot be attributed exclusively to selection. Overall, this study supports the combined use of mixed models, standardized selection indices, and multivariate classification as distinct decision-support tools within a soybean breeding pipeline.
Supplementary Materials
The following supporting information can be downloaded at: https://www.mdpi.com/article/10.3390/agronomy16212252/s1, Table S1: Loadings and percentage contributions of agronomic and seed-composition traits to the first two principal components; Table S2: Eigenvalues and explained variance of the first two principal components; Table S3: Monthly meteorological conditions from November to April during the 2019/2020, 2020/2021, and 2021/2022 soybean crop seasons in Jaboticabal, São Paulo, Brazil.
Author Contributions
Conceptualization, J.S. and S.H.U.-T.; methodology, A.P.S., J.S., A.C.R.M., D.S.C., H.K.d.S., T.P.G. and S.H.U.-T.; software, J.S.; validation, J.S. and S.H.U.-T.; formal analysis, J.S.; investigation, A.P.S., J.S., A.C.R.M., D.S.C., H.K.d.S., T.P.G. and S.H.U.-T.; resources, S.H.U.-T.; data curation, J.S.; writing—original draft preparation, A.P.S. and J.S.; writing—review and editing, J.S., G.V.M. and S.H.U.-T.; visualization, J.S.; supervision, S.H.U.-T.; project administration, S.H.U.-T. All authors have read and agreed to the published version of the manuscript.
Funding
The authors acknowledge Fundação Araucária de Apoio ao Desenvolvimento Científico e Tecnológico do Estado do Paraná for its support.
Data Availability Statement
The data supporting the findings of this study are available from the corresponding authors upon reasonable request.
Acknowledgments
The authors thank São Paulo State University (UNESP) for the institutional and technical support provided during the development of this study.
Conflicts of Interest
The authors declare no conflicts of interest.
References
- Volpato, L.; Rocha, J.; Alves, R.; Ludke, W.H.; Borém, A.; Silva, F.D. Inference of population effect and progeny selection via a multi-trait index in soybean breeding. Acta Sci. Agron. 2020, 43, e44623. [Google Scholar] [CrossRef] [Scilit]
- Woyann, L.G.; Meira, D.; Matei, G.; Zdziarski, A.D.; Dallacorte, L.V.; Madella, L.; Benin, G. Selection indexes based on linear-bilinear models applied to soybean breeding. Agron. J. 2020, 112, 175–182. [Google Scholar] [CrossRef] [Scilit]
- Xavier, A.; Rainey, K. Quantitative genomic dissection of soybean yield components. G3 Genes Genomes Genet. 2019, 10, 665–675. [Google Scholar] [CrossRef] [Scilit]
- Diers, B.; Specht, J.; Rainey, K.; Cregan, P.; Song, Q.; Ramasubramanian, V.; Graef, G.; Nelson, R.; Schapaugh, W.; Wang, D.; et al. Genetic architecture of soybean yield and agronomic traits. G3 Genes Genomes Genet. 2018, 8, 3367–3375. [Google Scholar] [CrossRef] [Scilit]
- La, T.C.; Large, E.; Taliercio, E.; Song, Q.; Gillman, J.; Xu, D.; Nguyen, H.T.; Shannon, G.; Scaboo, A. Characterization of select wild soybean accessions in the USDA germplasm collection for seed composition and agronomic traits. Crop Sci. 2019, 59, 233–251. [Google Scholar] [CrossRef] [Scilit]
- Li, C.; Yang, Q.; Liu, B.; Shi, X.; Liu, Z.; Yang, C.; Wang, T.; Xiao, F.; Zhang, M.; Shi, A.; et al. Ability of genomic prediction to bi-parent-derived breeding population using public data for soybean oil and protein content. Plants 2024, 13, 1260. [Google Scholar] [CrossRef] [Scilit]
- Wartha, C.A.; Lorenz, A.J. Genomic predictions of genetic variances and correlations among traits for breeding crosses in soybean. Heredity 2024, 133, 173–185. [Google Scholar] [CrossRef] [Scilit]
- Volpato, L.; Alves, R.; Teodoro, P.; Resende, M.D.V.d.; Nascimento, M.; Nascimento, A.C.C.; Ludke, W.H.; Silva, F.L.d.; Borém, A. Multi-trait multi-environment models in the genetic selection of segregating soybean progeny. PLoS ONE 2019, 14, e0215315. [Google Scholar] [CrossRef] [Scilit]
- Pereira, F.d.C.; Bruzi, A.T.; Matos, J.W.D.; Rezende, B.A.; Prado, L.; Nunes, J.A.R. Implications of the population effect in the selection of soybean progeny. Plant Breed. 2017, 136, 679–687. [Google Scholar] [CrossRef] [Scilit]
- Ramírez, R.A.V.; Ardila, Y.S.T. Application of the BLUPe predictor in the selection of potential soybean varieties for Orinoquia. Agron. Colomb. 2022, 40, 101137. [Google Scholar] [CrossRef] [Scilit]
- Bernardeli, A.; Rocha, J.R.A.S.d.C.; Borém, A.; Lorenzoni, R.; Aguiar, R.; Silva, J.N.B.; Bueno, R.D.; Alves, R.S.; Jarquin, D.; Ribeiro, C.; et al. Modeling spatial trends and enhancing genetic selection: An approach to soybean seed composition breeding. Crop Sci. 2021, 61, 976–988. [Google Scholar] [CrossRef] [Scilit]
- Gonçalves, G.D.M.C.; Ferreira-Gomes, R.L.; Lopes, Â.C.D.A.; Vieira, P.F.M.J. Adaptability and yield stability of soybean genotypes by REML/BLUP and GGE Biplot. Crop Breed. Appl. Biotechnol. 2020, 20, a33. [Google Scholar] [CrossRef] [Scilit]
- Costa, A.P.L.; Moitinho, A.C.R.; Silva, A.P.; Amaral, L.O.; Souza, J.S.; Unêda-Trevisoli, S.H. Comparative analysis of adaptability and stability of soybean genotypes for cultivar registration and protection. Braz. J. Biol. 2025, 85, e286817. [Google Scholar] [CrossRef] [Scilit]
- Van der Laan, L.; Parmley, K.A.; Saadati, M.; Torres Pacin, H.; Panthulugiri, S.; Sarkar, S.; Ganapathysubramanian, B.; Lorenz, A.J.; Singh, A.K. Genomic and phenomic prediction for soybean seed yield, protein, and oil. Plant Genome 2024, 18, e70002. [Google Scholar] [CrossRef] [Scilit]
- Miranda, M.C.d.C.; Aono, A.; Fagundes, T.G.; Arduini, G.M.; Pinheiro, J. High-throughput phenotyping and machine learning techniques in soybean breeding: Exploring the potential of aerial imaging and vegetation indices. Agron. J. 2025, 117, 70012. [Google Scholar] [CrossRef] [Scilit]
- Teodoro, L.; Silva, M.O.; Santos, R.G.d.; Alcântara, J.F.d.; Coradi, P.; Biduski, B.; Silva Junior, C.A.d.; Torres, F.E.; Teodoro, P. Machine learning for classification of soybean populations for industrial technological variables based on agronomic traits. Euphytica 2024, 220, 1–10. [Google Scholar] [CrossRef] [Scilit]
- R Core Team. R: A Language and Environment for Statistical Computing; R Foundation for Statistical Computing: Vienna, Austria, 2021; Available online: https://www.R-project.org/ (accessed on 14 March 2023).
- Resende, M.D.V.; Duarte, J.B. Precisão e controle de qualidade em experimentos de avaliação de cultivares. Pesqui. Agropecu. Trop. 2007, 37, 182–194. [Google Scholar]
- Resende, M.D.V. SELEGEN-REML/BLUP: Sistema Estatístico e Seleção Genética Computadorizada via Modelos Lineares Mistos; Embrapa Florestas: Colombo, Brazil, 2007. [Google Scholar]
- Ramalho, M.A.P.; Ferreira, D.F.; Oliveira, A.C. Experimentação em Genética e Melhoramento de Plantas; UFLA: Lavras, Brazil, 2005; 326p. [Google Scholar]
- Andrade, A.C.B. Estratégias de Seleção de Genótipos de Soja por Meio de Modelos Mistos e Abordagens Multivariadas. Master’s Thesis, Universidade Estadual Paulista, Jaboticabal, Brazil, 2015. [Google Scholar]
- Wysmierski, P.T.; Vello, N.A. The genetic base of Brazilian soybean cultivars: Evolution over time and breeding implications. Genet. Mol. Biol. 2013, 36, 547–555. [Google Scholar] [CrossRef] [Scilit]
- Vencovsky, R.; Barriga, P. Genética Biométrica em Fitomelhoramento; Revista Brasileira de Genética: Ribeirão Preto, Brazil, 1992; 486p. [Google Scholar]
- Maia, L.G.S.; Silva, C.A.; Ramalho, M.A.P.; Abreu, Â.F.B. Variabilidade genética associada à germinação e vigor de sementes de linhagens de feijoeiro comum. Ciênc. Agrotecnol. 2011, 35, 361–367. [Google Scholar] [CrossRef] [Scilit][Green Version]
- Mendes, F.F.; Ramalho, M.A.P.; Abreu, Â.F.B. Índice de seleção para escolha de populações segregantes de feijoeiro-comum. Pesqui. Agropecu. Bras. 2009, 44, 1312–1318. [Google Scholar] [CrossRef] [Scilit]
- Peluzio, J.M.; Pires, L.P.M.; Cancellier, L.L.; Afférri, F.S.; Colombo, G.A.; Teixeira Júnior, T.; Ribeiro, G.R.D.S. Genetic divergence among soybean cultivars in irrigated lowland in the State of Tocantins. Ciênc. Rural 2012, 42, 395–400. [Google Scholar] [CrossRef] [Scilit][Green Version]
- Zhang, T.; Wu, T.; Wang, L.; Jiang, B.; Zhen, C.; Yuan, S.; Hou, W.; Wu, C.; Han, T.; Sun, S. Genetic mapping and functional genomics of soybean seed protein. Mol. Breed. 2023, 43, 48. [Google Scholar] [CrossRef] [Scilit]
- Haq, M.U.; Mallarino, A.P. Response of soybean grain oil and protein concentrations to foliar and soil fertilization. Agron. J. 2005, 97, 910–918. [Google Scholar] [CrossRef] [Scilit]
- Smith, A.J.; Rinne, R.W.; Seif, R.D. Phosphoenolpyruvate carboxylase and pyruvate kinase involvement in protein and oil biosynthesis during soybean seed development. Crop Sci. 1989, 29, 349–353. [Google Scholar] [CrossRef] [Scilit]

Disclaimer/Publisher’s Note: The statements, opinions and data contained in all publications are solely those of the individual author(s) and contributor(s) and not of MDPI and/or the editor(s). MDPI and/or the editor(s) disclaim responsibility for any injury to people or property resulting from any ideas, methods, instructions or products referred to in the content. |
© 2026 by the authors. Licensee MDPI, Basel, Switzerland. This article is an open access article distributed under the terms and conditions of the Creative Commons Attribution (CC BY) license.