


Abstract
Repeated penicillin application may alter citrus rhizosphere functioning. We compared nine soil biochemical variables and bacterial and fungal amplicon profiles among an untreated control and 1-, 2-, and 3-year trunk-infusion groups in one citrus orchard (three independent plots per group). All nine soil variables differed among groups after block adjustment (q ≤ 0.0086). Bacterial observed OTUs averaged 5315, 3582, 3772 and 4585, and Shannon indices averaged 7.421, 6.128, 6.215 and 6.876, respectively. Both indices were lower in treated groups than in controls, although the 3-year group exceeded the 1- and 2-year groups. Fungal richness did not differ significantly; the fungal Shannon result varied with the test. Bray–Curtis PERMANOVA detected bacterial and fungal group differences (R2 = 0.853 and 0.806; p = 0.00174), accompanied by heterogeneous multivariate dispersion. Trichoderma accounted for 57.57 ± 5.32% and 66.10 ± 6.23% of fungal reads in the 1- and 2-year groups and showed positive block-adjusted centred log-ratio contrasts. These findings indicate nonlinear associations between recorded treatment duration, soil biochemical potential and microbial community composition.
1. Introduction
The rhizosphere integrates root activity, nutrient availability, microbial metabolism, and orchard management. Citrus-associated bacterial and fungal communities contain recurrent members, but their composition varies with geography, soil conditions, host genotype, disease status, and management [1,2,3,4]. Huanglongbing (HLB) disrupts citrus health and can alter both rhizosphere functional potential and microbial recruitment to root surfaces [2,4]. The difficulty of controlling its phloem-associated bacterial pathogen has motivated studies of systemic antibiotic delivery, including trunk infusion, as a disease-management approach [5,6]. This creates a need to assess belowground responses alongside effects on the target pathogen.
Antibiotic applications may affect non-target soil microorganisms, depending on compound properties, delivery route and environmental conditions [7,8,9,10]. Sorption, transport and transformation influence environmental exposure. For β-lactams, hydrolysis of the β-lactam ring is an important degradation pathway; mineral-surface reactions, including zinc-mediated hydrolysis, can accelerate penicillin transformation [11].
Penicillin trunk infusion can deliver the compound to citrus tissues and alter associated bacterial communities [5,12]. Tissue translocation does not directly quantify active penicillin exposure in the rhizosphere. Previous citrus studies have examined penicillin residues and metabolites after infusion [13], while other systemic antibiotic treatments have been associated with rhizosphere microbial and plant-physiological changes [6,14]. Rhizosphere responses may therefore involve both microbial exposure and changes in root physiology or substrate supply.
Soil enzyme activities provide complementary indicators of biochemical potential. Acid phosphatase (ACP) hydrolyses organic phosphate esters, urease (URE) mediates urea hydrolysis, and sucrase (SUC) hydrolyses sucrose, linking these activities to phosphorus, nitrogen and labile-carbon turnover. Catalase (CAT) decomposes hydrogen peroxide and reflects peroxide-removal potential [15,16]. Activities vary with soil properties, substrate availability and enzyme sources [15,17,18]. Their relationship to repeated trunk-infusion treatment in citrus orchards remains poorly characterised.
This study compared rhizosphere biochemical properties and bacterial and fungal communities across untreated and consecutive 1-, 2-, and 3-year penicillin trunk-infusion groups in a Wogan mandarin orchard. We quantified soil biochemical indicators, alpha diversity, community structure, relative taxonomic composition and their associations, hypothesising a nonlinear relationship with treatment duration.
2. Materials and Methods
2.1. Experimental Site and Multi-Year Penicillin Treatments
The study was conducted in a commercial Wogan mandarin (Citrus reticulata Blanco) orchard in Maosang Village, Xiangxian Town, Shanglin County, Nanning, Guangxi, China (23.2863° N, 108.6395° E; approximately 160 m above sea level). Trees were 7–8 years old, spaced approximately 3 m within rows and 3–4 m between rows. Four treatment groups were defined: K-Y-0 (untreated control) and K-Y-1, K-Y-2 and K-Y-3 (penicillin applications over 1, 2 and 3 consecutive years). Following the trunk-infusion approach described by Shin et al. [5], penicillin G potassium salt(supplied by Sangon Biotech (Shanghai) Co., Ltd., Shanghai, China) was prepared at 6 mg mL−1 in sterile water. Two 5.5 mm holes were drilled immediately above the bud union and connected to a passive two-port IV-bag infusion system. Each application delivered 400–500 mL per tree (2.4–3.0 g penicillin G potassium salt) over approximately 24 h. Two applications were scheduled annually, at the beginning and end of spring flush. The resulting nominal cumulative doses were 4.8–6.0, 9.6–12.0 and 14.4–18.0 g per tree for the 1-, 2- and 3-year groups, respectively. Three spatial blocks each contained one approximately 5 × 5 m plot per treatment, with three focal trees in each plot (12 plots in total). Other orchard-management practices were similar among plots.
2.2. Rhizosphere Sampling
Rhizosphere soil was collected on 19 March 2025 and received by the laboratory on 24 March 2025 according to the field sample sheet. Fine roots were exposed approximately 50 cm from the trunk at a depth of approximately 20 cm. Loosely attached soil was shaken off, and soil adhering to fine roots was brushed into sterile collection bags. Equal soil contributions from three focal trees within each plot were combined into one composite sample, yielding three independent plot-level replicates per treatment (12 samples from 36 trees). Samples were held at 4 °C before processing.
2.3. Soil Biochemical Measurements
Nine rhizosphere soil variables were measured: ACP, CAT, URE, SUC, hydrolysable nitrogen (HN), available phosphorus (AP), available potassium (AK), humic acid (HA) and cation-exchange capacity (CEC). Soil was air-dried, ground and sieved through 30–50 mesh for enzyme assays or through 2 mm for the remaining biochemical analyses.
Soil ACP, CAT, URE and SUC activities were determined using Beijing Solarbio assay kits BC0140, BC0100, BC0120 and BC0240, respectively (Beijing Solarbio Science & Technology Co., Ltd., Beijing, China), according to the manufacturer’s instructions [19,20,21,22].
Three technical determinations were averaged for each independent plot composite before statistical analysis (n = 3 plots per treatment). Assayed soil masses were 0.100 g for ACP, 0.100 g for CAT, 0.250 g for URE and 0.100 g for SUC. The ACP, URE and SUC reactions were incubated at 37 °C for 24 h; CAT was measured at 25 °C for 20 min. ACP activity was determined by phenol colourimetry at 660 nm, CAT by H2O2 decomposition at 240 nm, URE by indophenol-blue detection at 630 nm and SUC by the 3,5-dinitrosalicylic-acid method at 540 nm. Kit-specific blanks and controls were used. Reaction volumes, calibration, dilution factors, calculation equations and unit definitions are given in Table S13. Activities are reported in U g−1 soil.
HN was measured by alkaline hydrolysis–diffusion (LY/T 1228-2015 [23]); AP by 0.50 mol L−1 NaHCO3 extraction (pH 8.5) and molybdenum–antimony spectrophotometry at 880 nm (HJ 704-2014 [24]); AK by 1 mol L−1 ammonium acetate extraction and flame photometry (NY/T 889-2004 [25]); HA by sodium pyrophosphate/NaOH extraction and potassium-dichromate oxidation (LY/T 1238-1999 [26]); and CEC by ammonium-acetate exchange, ethanol washing, steam distillation and titration (LY/T 1243-1999 [27]). HN, AP and AK were expressed as mg kg−1, HA as %, and CEC as cmol(+) kg−1.
2.4. DNA Extraction, Amplicon Sequencing, and Bioinformatics
Total soil DNA was extracted using the E.Z.N.A. Soil DNA Kit (Omega Bio-tek, Norcross, GA, USA). Bacterial 16S rRNA genes were amplified with primers 27F (5′-AGAGTTTGATCMTGGCTCAG-3′) and 1492R (5′-TACGGYTACCTTGTTACGACTT-3′), and fungal ITS regions with ITS1F (5′-CTTGGTCATTTAGAGGAAGTAA-3′) and ITS4 (5′-TCCTCCGCTTATTGATATGC-3′) [28,29,30]. Triplicate PCR products per sample were pooled for PacBio Sequel IIe sequencing (Shanghai LingEn Biotechnology Co., Ltd., Shanghai, China). SMRTbell libraries (kit version 3.0) were processed with SMRT Link v11 to obtain circular consensus reads (≥3 passes; predicted accuracy ≥ 0.99), followed by demultiplexing and primer removal. UPARSE v10 was used for chimera filtering and operational taxonomic unit (OTU) clustering at 98.65% sequence identity [31,32]. Taxonomy was assigned using UCLUST (confidence ≥ 0.80) against SILVA SSU 138.1 for bacteria and UNITE 8.2 for fungi [33,34]. Unresolved taxonomic assignments were retained as unclassified. The 16S rRNA gene and ITS data were deposited under BioProject PRJNA1498691 (BioSamples SAMN61854641–SAMN61854652).
2.5. Diversity, Taxonomic, and Functional Analyses
The depth-normalised bacterial and fungal OTU matrices contained 22,517 and 28,058 reads per sample, respectively. Observed OTU richness and Shannon entropy (natural logarithm) were calculated from these matrices for the primary alpha-diversity analysis. Simpson and Pielou indices are presented descriptively in Table S3.
Bray–Curtis distances were calculated from normalised OTU profiles, with original-count proportions used in a sensitivity analysis [35]. Relative taxonomic composition was summarised as per-sample percentages, then as mean ± sample SD across the three plots per group. Figure 4 shows the eight most abundant named phyla or ten genera in each domain, together with Unclassified and Other categories. Grouped categories were summed within samples before calculating means and SDs (Tables S5a–d and S14). FAPROTAX was used to predict bacterial functional groups from taxonomic assignments [36].
Compositional contrasts used original, non-rarefied taxon counts. Named taxa were retained at a prevalence of at least 3 of 12 samples and a mean read proportion ≥0.05%; a pseudocount of 0.5 was added before log2 centred log-ratio (CLR) transformation within each domain and taxonomic rank. The analysis included 15 bacterial phyla, 181 bacterial genera, 7 fungal phyla and 101 fungal genera. CLR contrasts were estimated using block-adjusted models; alternative pseudocount and prevalence thresholds were analysed for sensitivity (Tables S15–S17). Figure S3 presents all three treatment-versus-control contrasts for the ten abundant genera per domain shown in Figure 4.
2.6. Statistical Analysis
Each plot-level composite was one biological replicate (n = 3 per treatment). Soil variables and primary alpha indices were analysed using a fixed-effects model of response ~ block + treatment (treatment df = 3; residual df = 6). Pairwise Tukey comparisons used the model residual variance. Benjamini–Hochberg (BH) adjustment was applied across the nine soil variables and separately within each two-endpoint alpha-diversity family [37]. Exact sensitivity analyses enumerated all 13,824 within-block treatment-label allocations for model F statistics and Friedman ranks. CLR models used the same block adjustment, with BH correction separately within microbial domain and rank. The three treatment-versus-control contrasts were corrected across all retained taxa × three contrasts (543 bacterial-genus and 303 fungal-genus tests). Reported 95% confidence intervals are pointwise. Sensitivity analyses used pseudocount 1 and minimum prevalence 6.
Block-adjusted Bray–Curtis PERMANOVA included block before treatment and enumerated 13,824 permitted within-block allocations [38]. PERMDISP used distances to group spatial medians in positive and negative PCoA subspaces, with negative squared distances truncated to zero and no bias adjustment [39,40,41, 42]. Distances were fitted as distance ~ treatment (df = 3, 8). The residual-permutation test enumerated 13,823 non-identity within-block residual reallocations and the observed statistic. Centroid, normalisation and distance-based sensitivity analyses are reported in Tables S8 and S20.
Secondary analyses included db-RDA, Mantel tests, genus–soil Spearman correlations and taxon-based functional predictions. The db-RDA models included SUC, AP and HN for bacteria and SUC, AP and CAT for fungi; single-variable fits and variance-inflation factors are reported in Tables S9a–c. The db-RDA models and bacterial–fungal Mantel Spearman test used 9999 permutations. Spearman correlations were calculated across the 12 plot composites, with BH adjustment applied to 180 tests per domain (20 genus-level profiles × 9 soil variables; Table S10a). FAPROTAX-predicted relative functional profiles were compared using Kruskal–Wallis tests, with BH adjustment across 81 functions (Tables S11 and S12).
3. Results
3.1. Rhizosphere Biochemical Properties Differed Among Treatment Durations
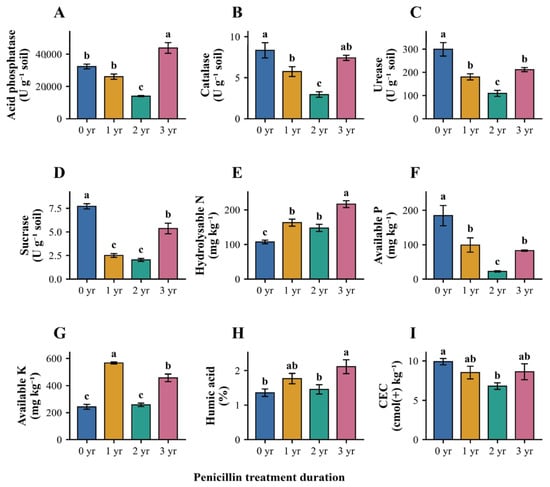
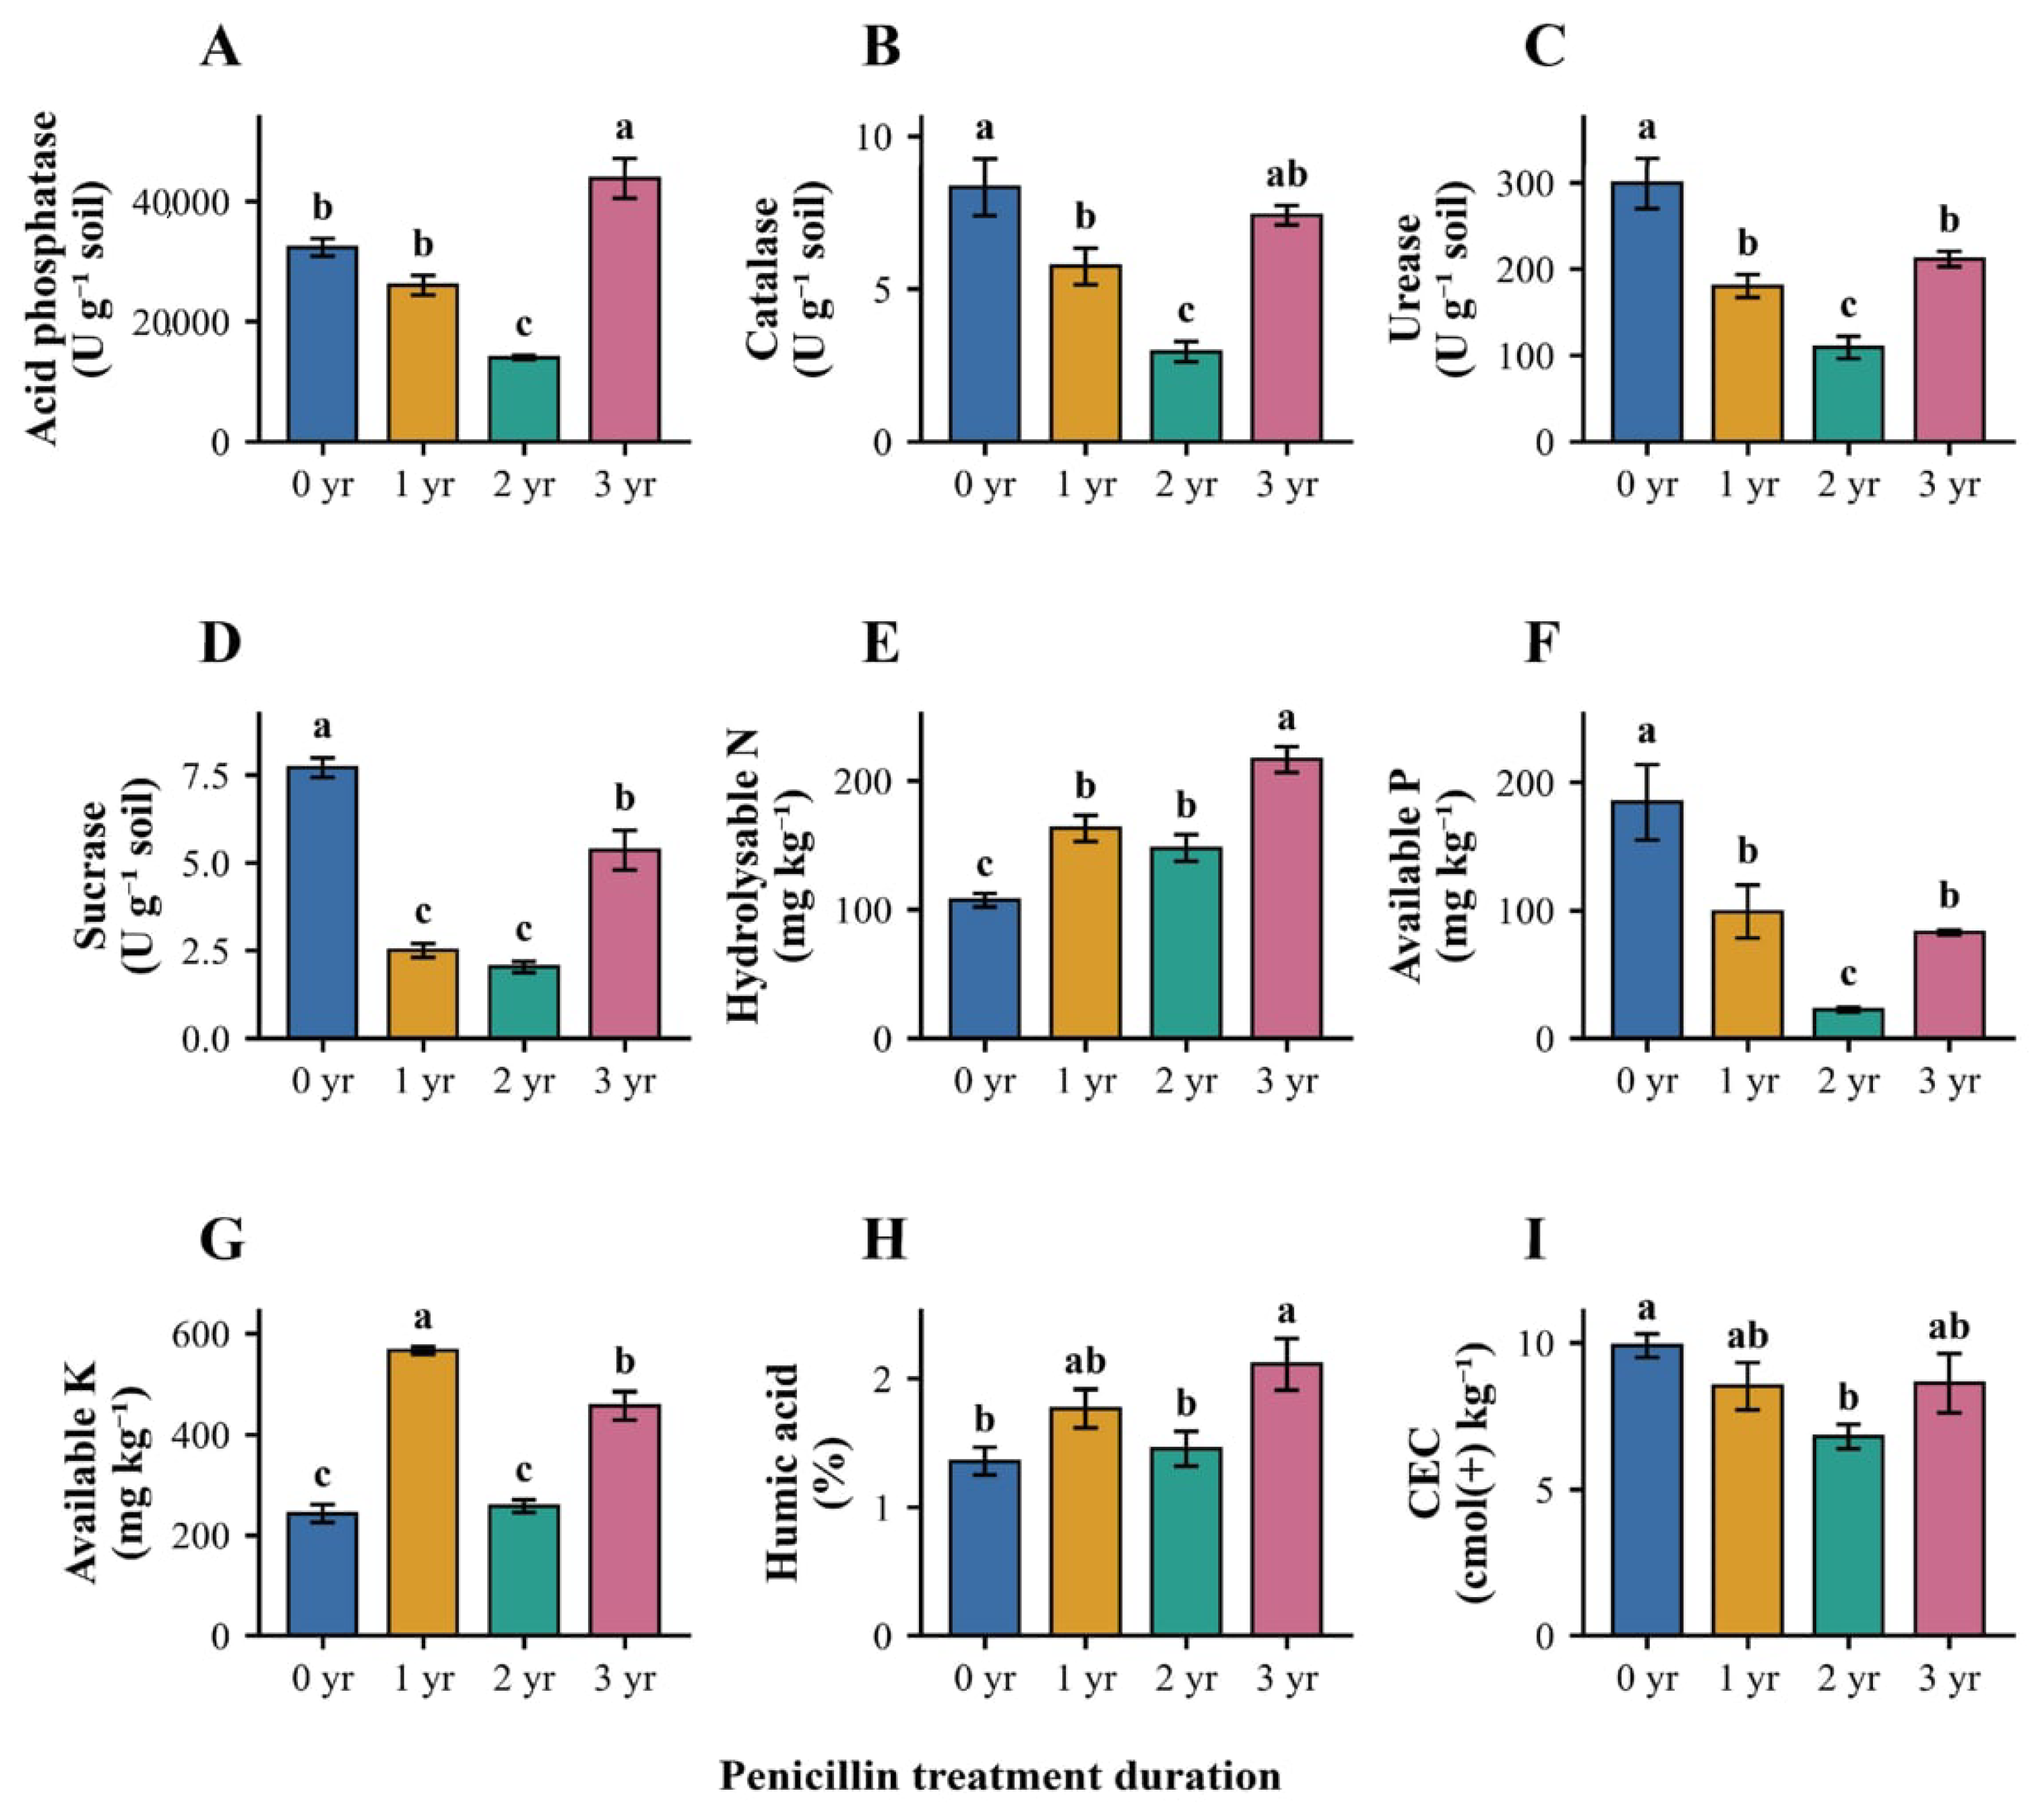
All nine soil biochemical variables differed across treatment groups in block-adjusted models (F3,6 = 10.42–235.64; BH q ≤ 0.0086; partial η2 = 0.839–0.992; Figure 1; Table S1b). Exact Friedman sensitivity tests also supported group differences (q ≤ 0.033). ACP, CAT, URE, SUC and AP had their lowest group means in the 2-year treatment, whereas several indicators were higher in the 3-year group. Plot-level values are given in Table S1a.
Figure 1.
Rhizosphere biochemical properties by penicillin-treatment duration. (A) Acid phosphatase; (B) catalase; (C) urease; (D) sucrase; (E) hydrolysable nitrogen; (F) available phosphorus; (G) available potassium; (H) humic acid; (I) cation-exchange capacity. Bars represent means ± SD from three independent plot composites per group; enzyme values are means of three technical determinations per composite. Colours denote 0, 1, 2 and 3 years. Letters indicate block-adjusted Tukey comparisons within each variable (p < 0.05); groups sharing a letter do not differ significantly. Individual data and enzyme-unit definitions appear in Tables S1a and S13.
ACP activity averaged 32,304.9 ± 1451.7, 26,027.6 ± 1589.1, 13,987.4 ± 368.7 and 43,835.8 ± 3317.7 U g−1 soil across the control and 1-, 2- and 3-year groups, respectively. The corresponding URE means were 299.4, 180.2, 109.0 and 211.3 U g−1 soil; CAT means were 8.33, 5.74, 2.94 and 7.41 U g−1 soil. SUC followed a similar nonmonotonic pattern. AP was lowest at 2 years, AK highest at 1 year, and HN and HA highest at 3 years (Figure 1; Table S1).
3.2. Bacterial and Fungal Alpha Diversity Differed Among Groups
The bacterial dataset contained 385,182 clean reads across 12 samples (30,446–34,200 reads per sample; mean read length approximately 1448 bp), while the fungal dataset contained 467,163 clean reads (31,924–44,119 reads per sample; mean read length approximately 632 bp; Supplementary Figure S2). All samples exceeded the domain-specific rarefaction depths.
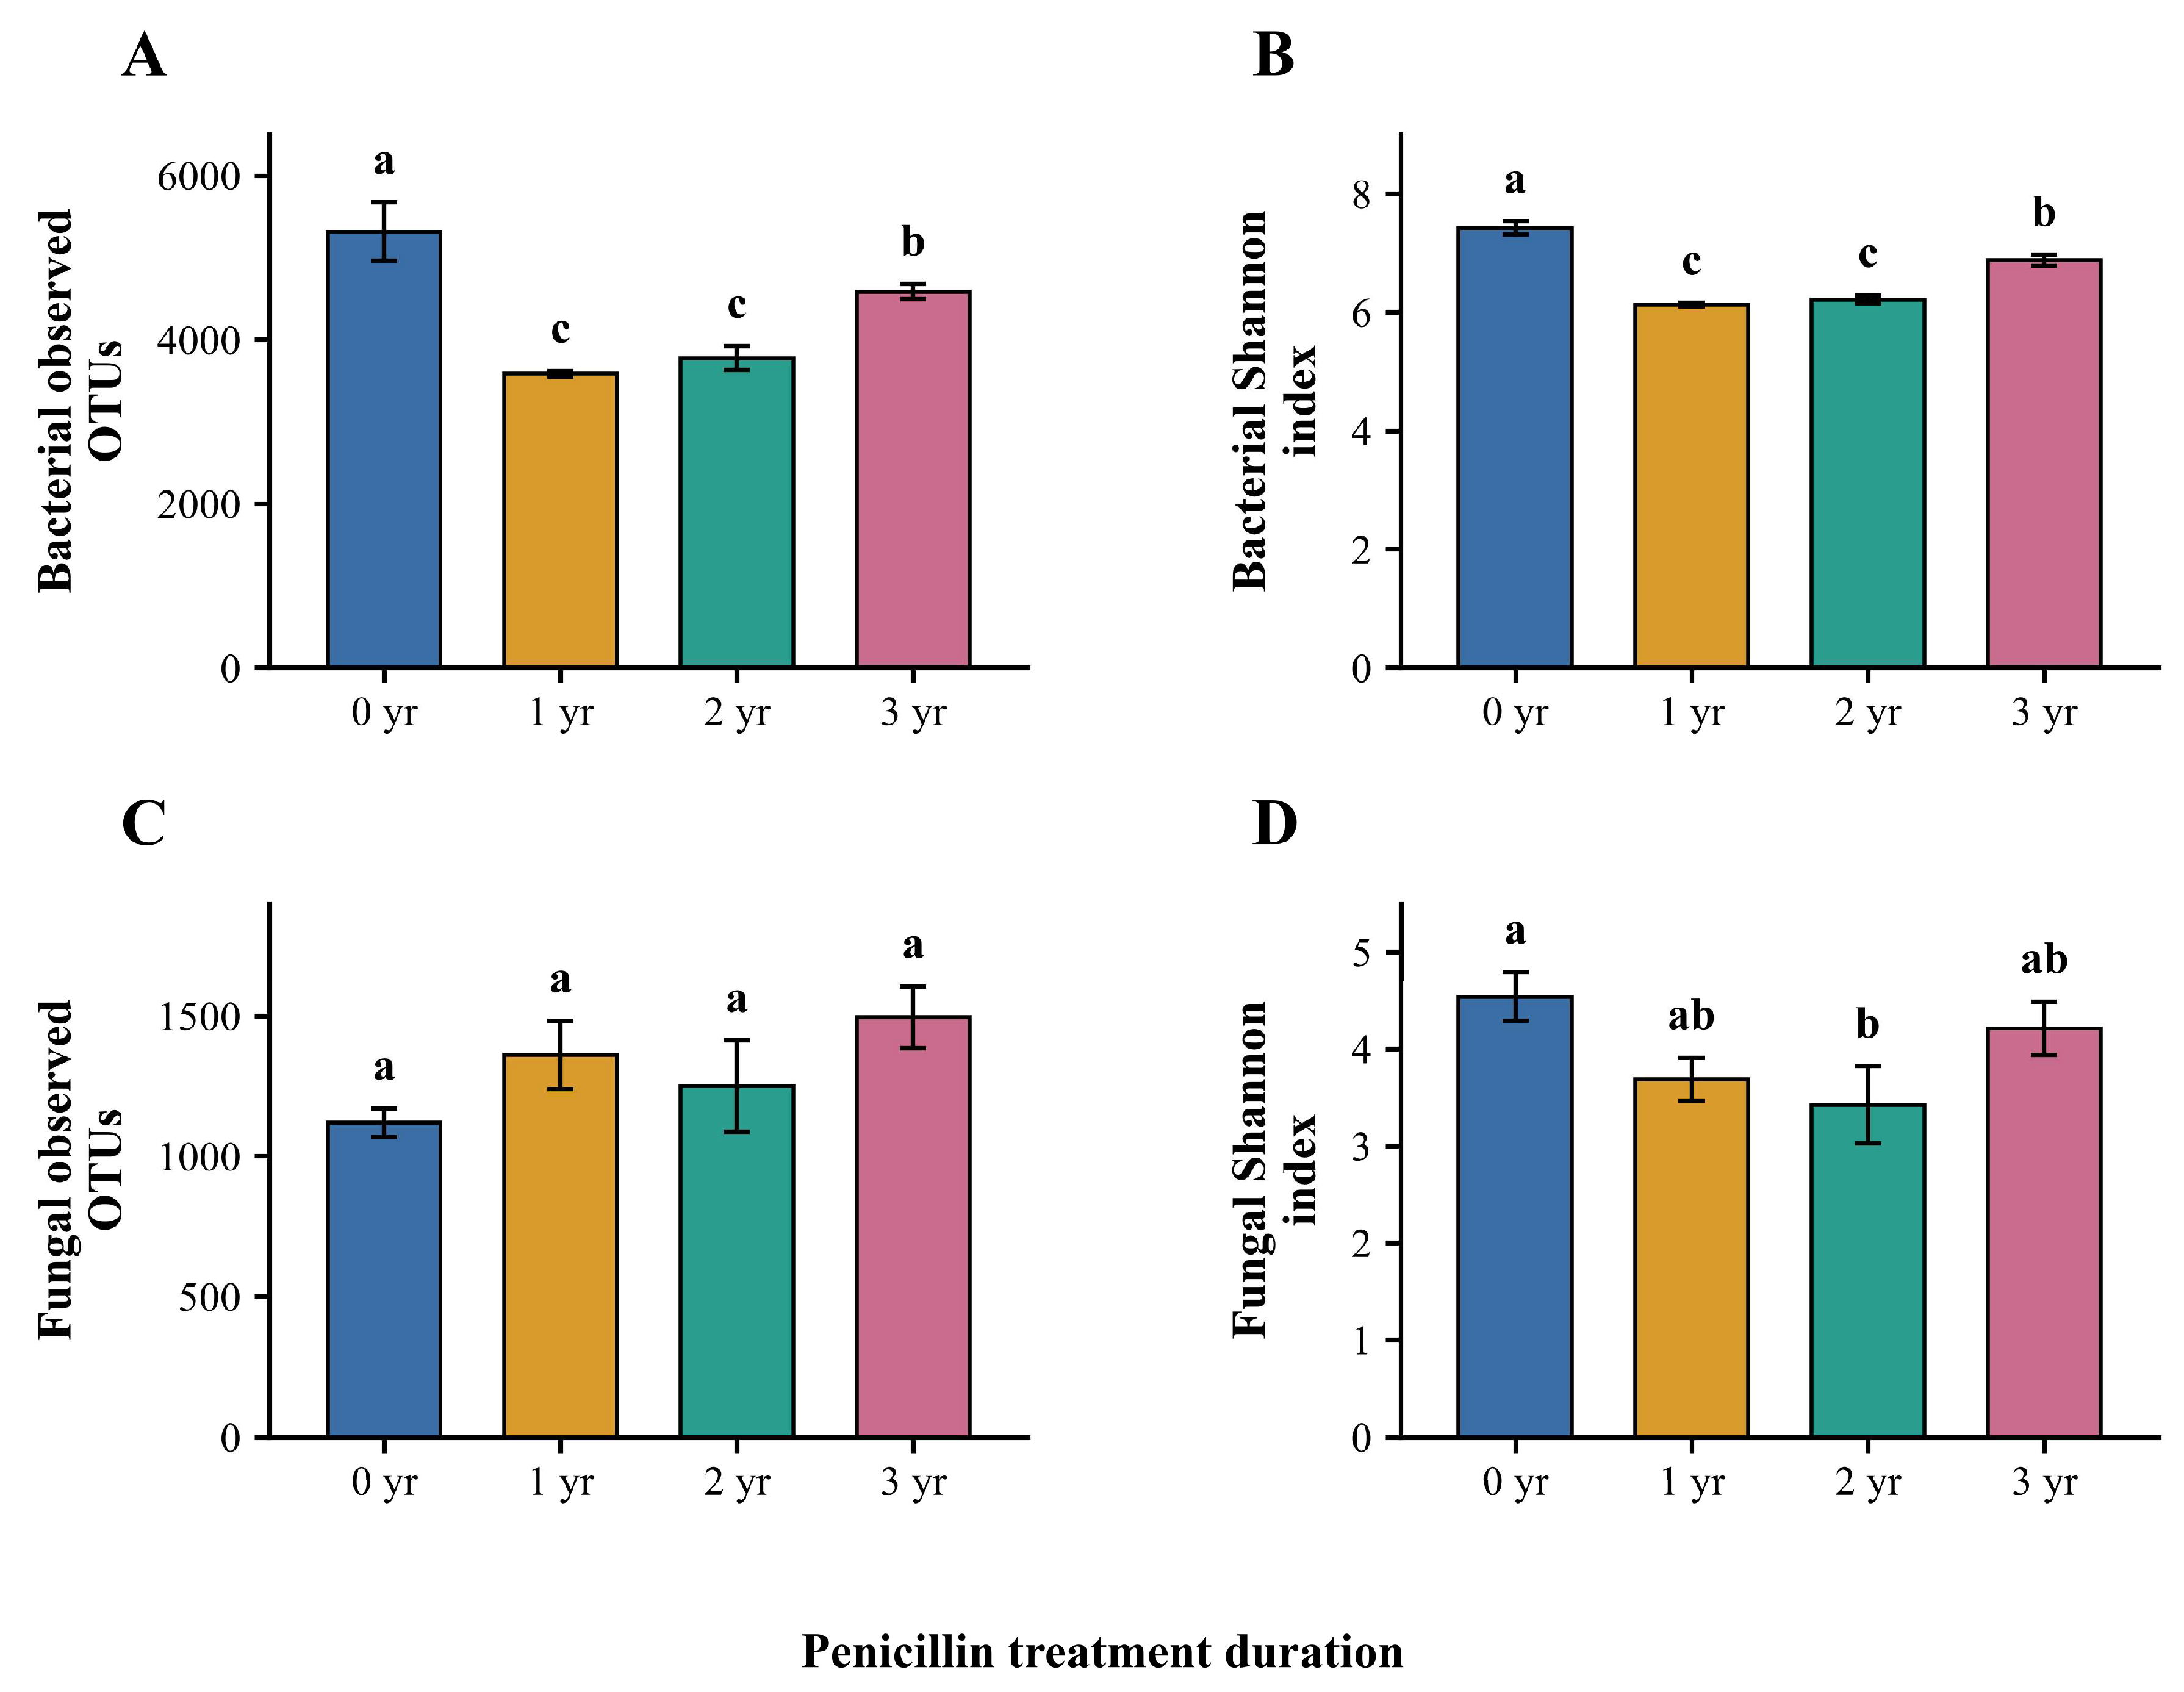
Bacterial observed OTUs averaged 5315.0 ± 357.4, 3581.7 ± 34.9, 3772.0 ± 145.4 and 4585.0 ± 92.5 for 0, 1, 2 and 3 years, respectively (F3,6 = 59.68; BH q = 0.0000737). Shannon indices averaged 7.421 ± 0.109, 6.128 ± 0.027, 6.215 ± 0.067 and 6.876 ± 0.095 (F3,6 = 149.57; BH q = 0.0000100). Both indices were lower in the treated groups than in controls, while the 3-year group exceeded the 1- and 2-year groups. Exact block-permutation sensitivity tests yielded q = 0.00347 for both endpoints (Figure 2; Tables S3 and S4).
Figure 2.
Bacterial and fungal alpha diversity by penicillin-treatment duration. (A) Bacterial observed OTUs; (B) bacterial Shannon index; (C) fungal observed OTUs; (D) fungal Shannon index. Bars represent means ± SD from three independent plots per group. Letters indicate block-adjusted Tukey comparisons within each endpoint (p < 0.05); groups sharing a letter do not differ significantly. The bacterial letters are a, c, c and b for 0, 1, 2 and 3 years. Fungal richness had no significant pairwise contrast; the primary BH-adjusted omnibus test for fungal Shannon was q = 0.05094. The count-derived data are provided in Table S3.
Fungal observed OTUs averaged 1118.3 ± 51.1, 1360.0 ± 121.6, 1249.0 ± 162.7 and 1494.0 ± 110.1 (F3,6 = 4.18; BH q = 0.0644), without significant pairwise contrasts. The corresponding Shannon means were 4.538 ± 0.254, 3.686 ± 0.224, 3.423 ± 0.399 and 4.211 ± 0.278 (F3,6 = 6.54; BH q = 0.05094). For Shannon, exact block-F and Friedman sensitivities yielded q = 0.0104 and 0.0347, respectively (Tables S3, S4 and S19).
3.3. Community Structure and Multivariate Dispersion Differed Among Treatments
The first two Bray–Curtis PCoA axes explained 46.23% and 26.60% of bacterial variation and 49.90% and 22.89% of fungal variation (Figure 3). PERMANOVA identified treatment-associated differences for bacteria (F = 15.46; R2 = 0.85280; p = 0.001736) and fungi (F = 11.11; R2 = 0.80576; p = 0.001736). Spatial-median PERMDISP also identified heterogeneous dispersion (F3,8 = 9.59 and 8.82, respectively; residual-permutation p = 0.0000723 for both). Centroid, normalisation and fixed-distance sensitivity tests supported dispersion differences (Tables S6–S8 and S20). These results show treatment-associated community dissimilarity alongside unequal dispersion, without isolating differences in group centroids.
Figure 3.
Bray–Curtis microbial community structure and dispersion. (A,B) Bacterial and fungal PCoA, respectively; each symbol represents one plot composite (n = 3 per treatment). Polygons join the observed samples and are not confidence regions. Colours and marker shapes denote 0, 1, 2 and 3 years. (C,D) Distances to group spatial medians; filled symbols show observations and open diamonds show means ± SD on a common vertical scale. PERMANOVA adjusted for spatial block; PERMDISP p values were obtained by within-block residual permutation. Associated statistics are reported in Table 1 and sensitivity analyses in Table S20.
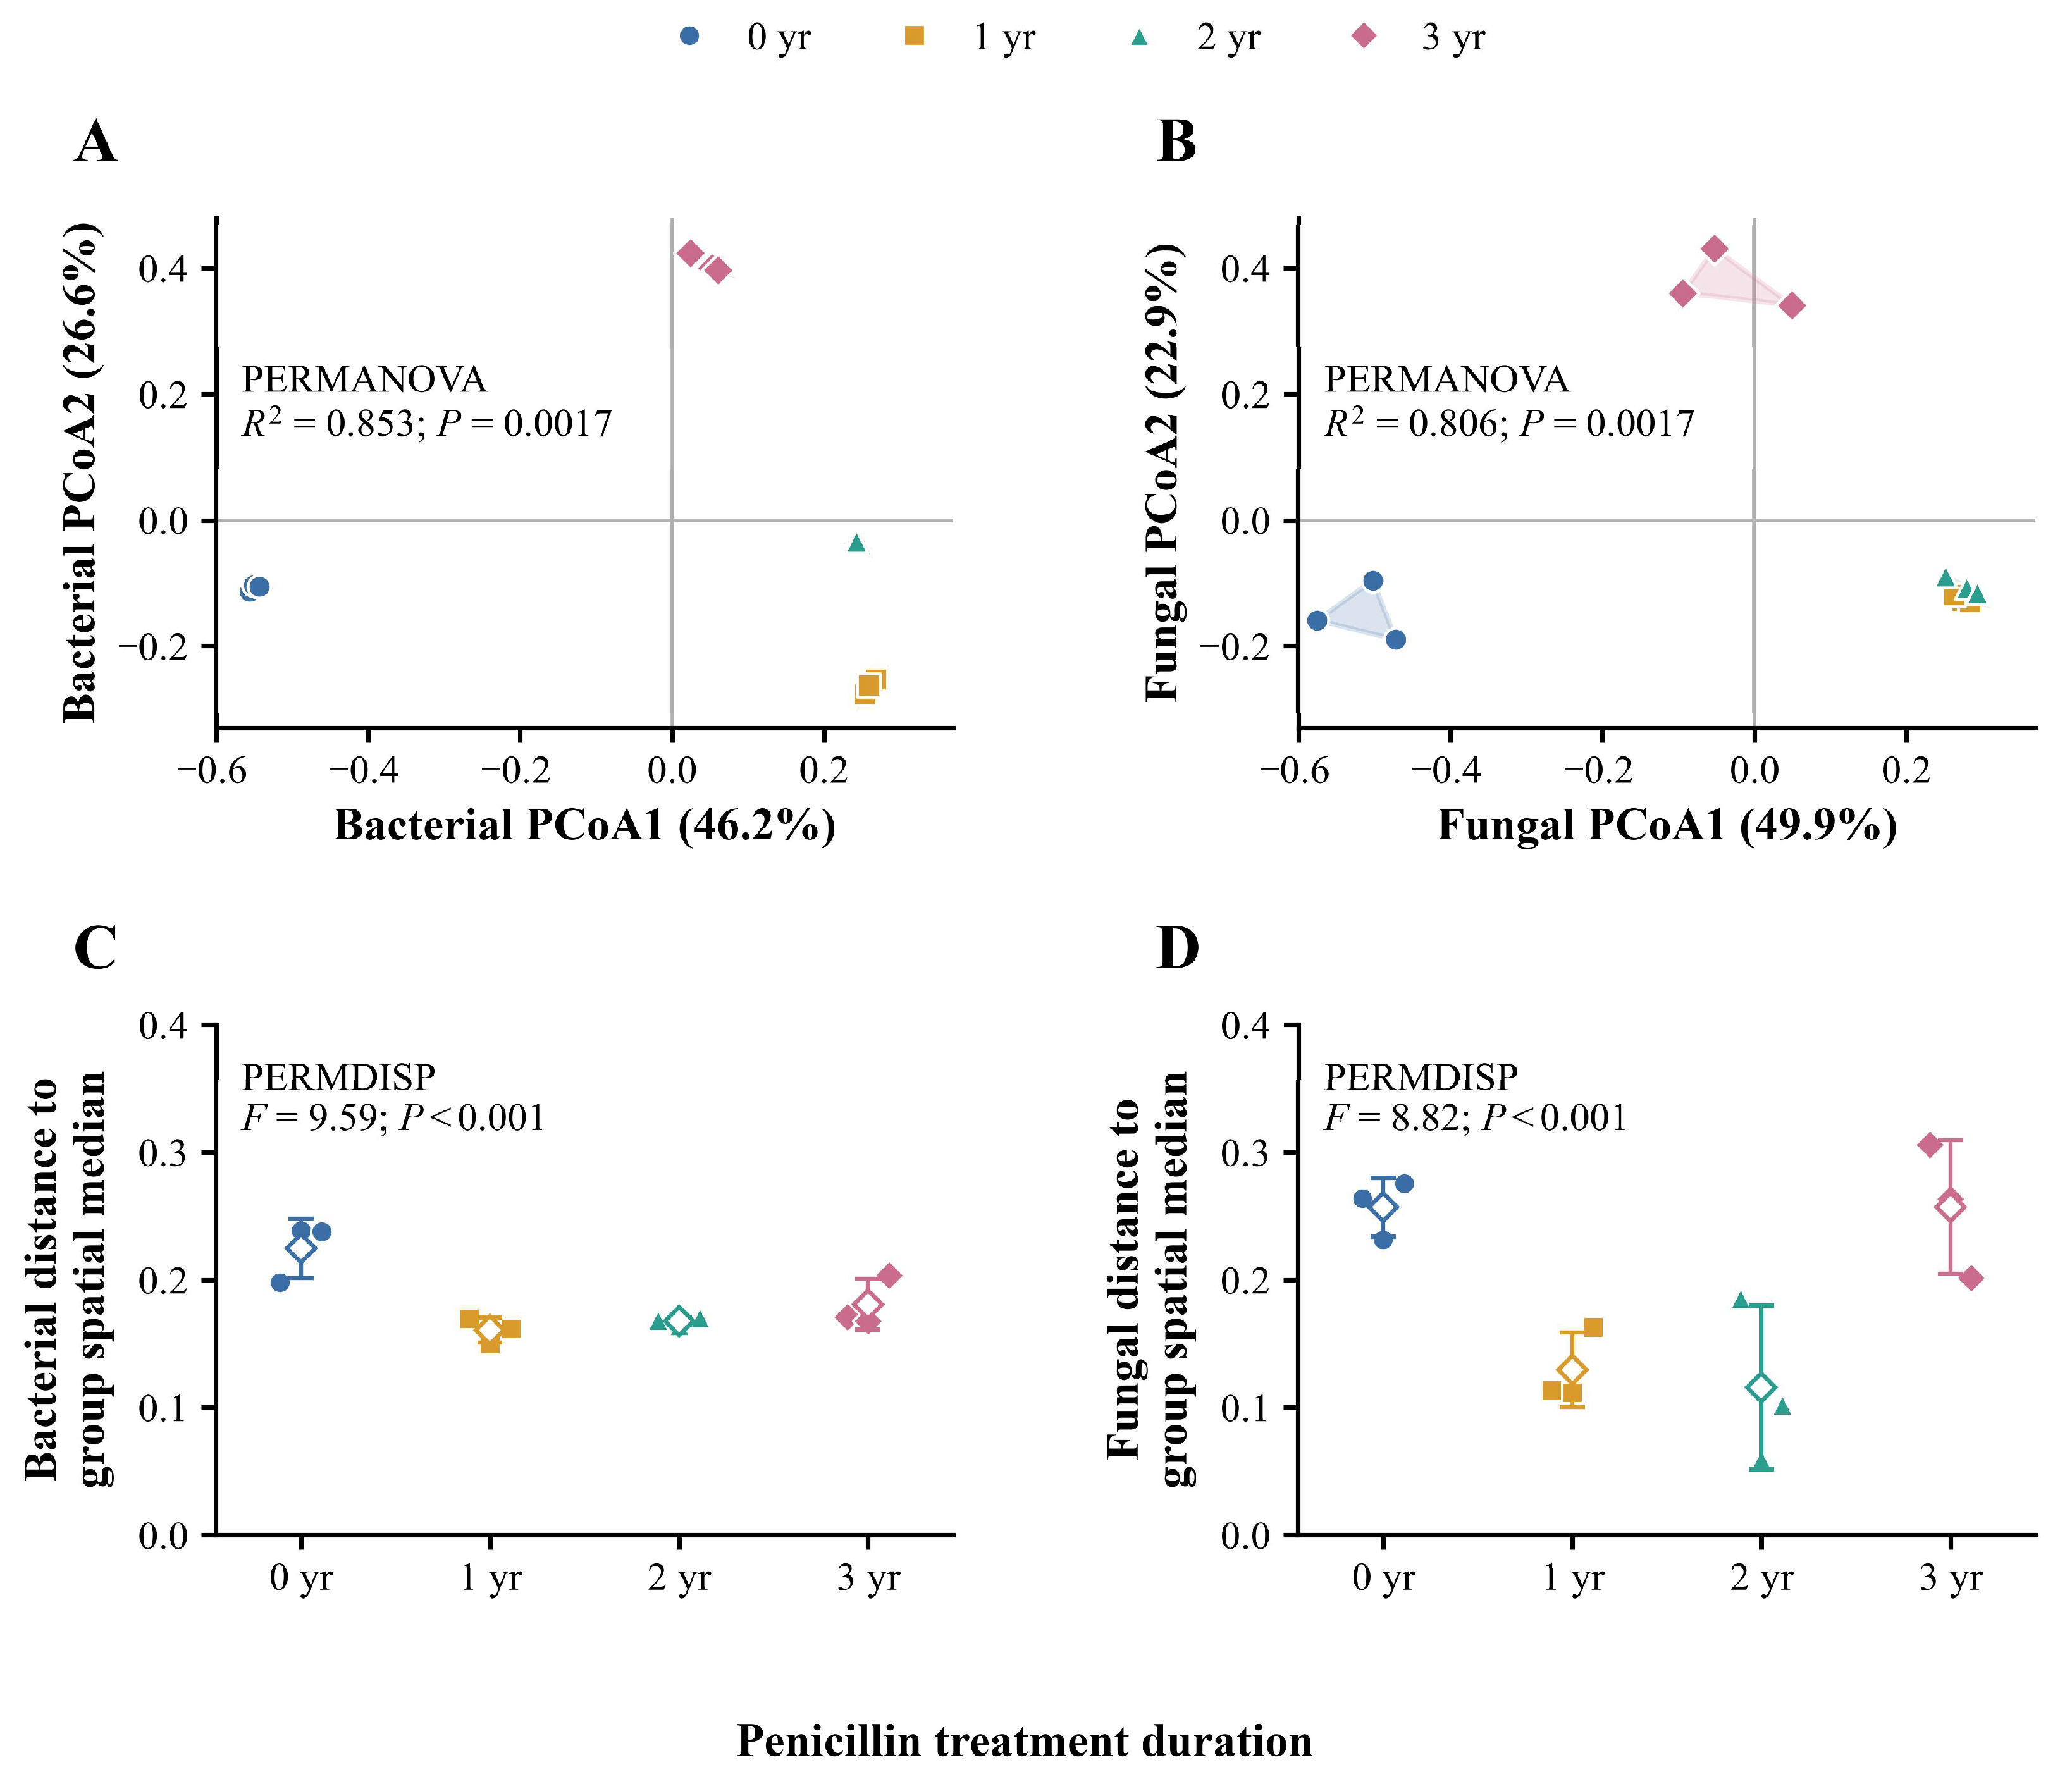
Table 1.
Bray–Curtis ordination, block-adjusted PERMANOVA and spatial-median PERMDISP. PERMANOVA used 13,824 within-block allocations. PERMDISP used an exhaustive within-block residual-permutation test (df = 3, 8). Sensitivity analyses are reported in Table S20.
3.4. Relative Taxonomic Profiles Differed Among Treatment Groups
Proteobacteria and Acidobacteria dominated the bacterial phylum profiles (Figure 4A). Proteobacteria represented 39.3%, 39.9%, 37.1% and 32.7% of reads across the control and 1-, 2- and 3-year groups, respectively, while Acidobacteria represented 23.3%, 31.3%, 32.2% and 40.0%. Candidatus Koribacter accounted for approximately 6.5%, 7.1%, 13.4% and 25.5% of bacterial reads (Figure 4C). Actinobacteria represented 2.43%, 3.35%, 3.02% and 1.41%, respectively (Table S5a).
Ascomycota represented 61.3%, 89.9%, 80.6% and 66.8% of fungal reads across groups (Figure 4B). Trichoderma proportions were 8.17 ± 3.39%, 57.57 ± 5.32%, 66.10 ± 6.23% and 28.40 ± 6.56% (Figure 4D; n = 3). Block-adjusted CLR analysis showed an overall Trichoderma association (F3,6 = 46.14; BH q = 0.000867; exact block-F q = 0.0260). Treatment-versus-control contrasts were 3.204, 3.563 and 2.265 log2 CLR units at 1, 2 and 3 years (q = 0.000581, 0.000462 and 0.00273). Fusarium CLR contrasts were lower at 1 and 2 years (q = 0.00470 and 0.00683), but not at 3 years after correction (q = 0.101). These relative associations were robust to the two specified filtering and pseudocount sensitivities (Tables S15–S17).
3.5. Soil Biochemical Gradients Were Associated with Community Variation
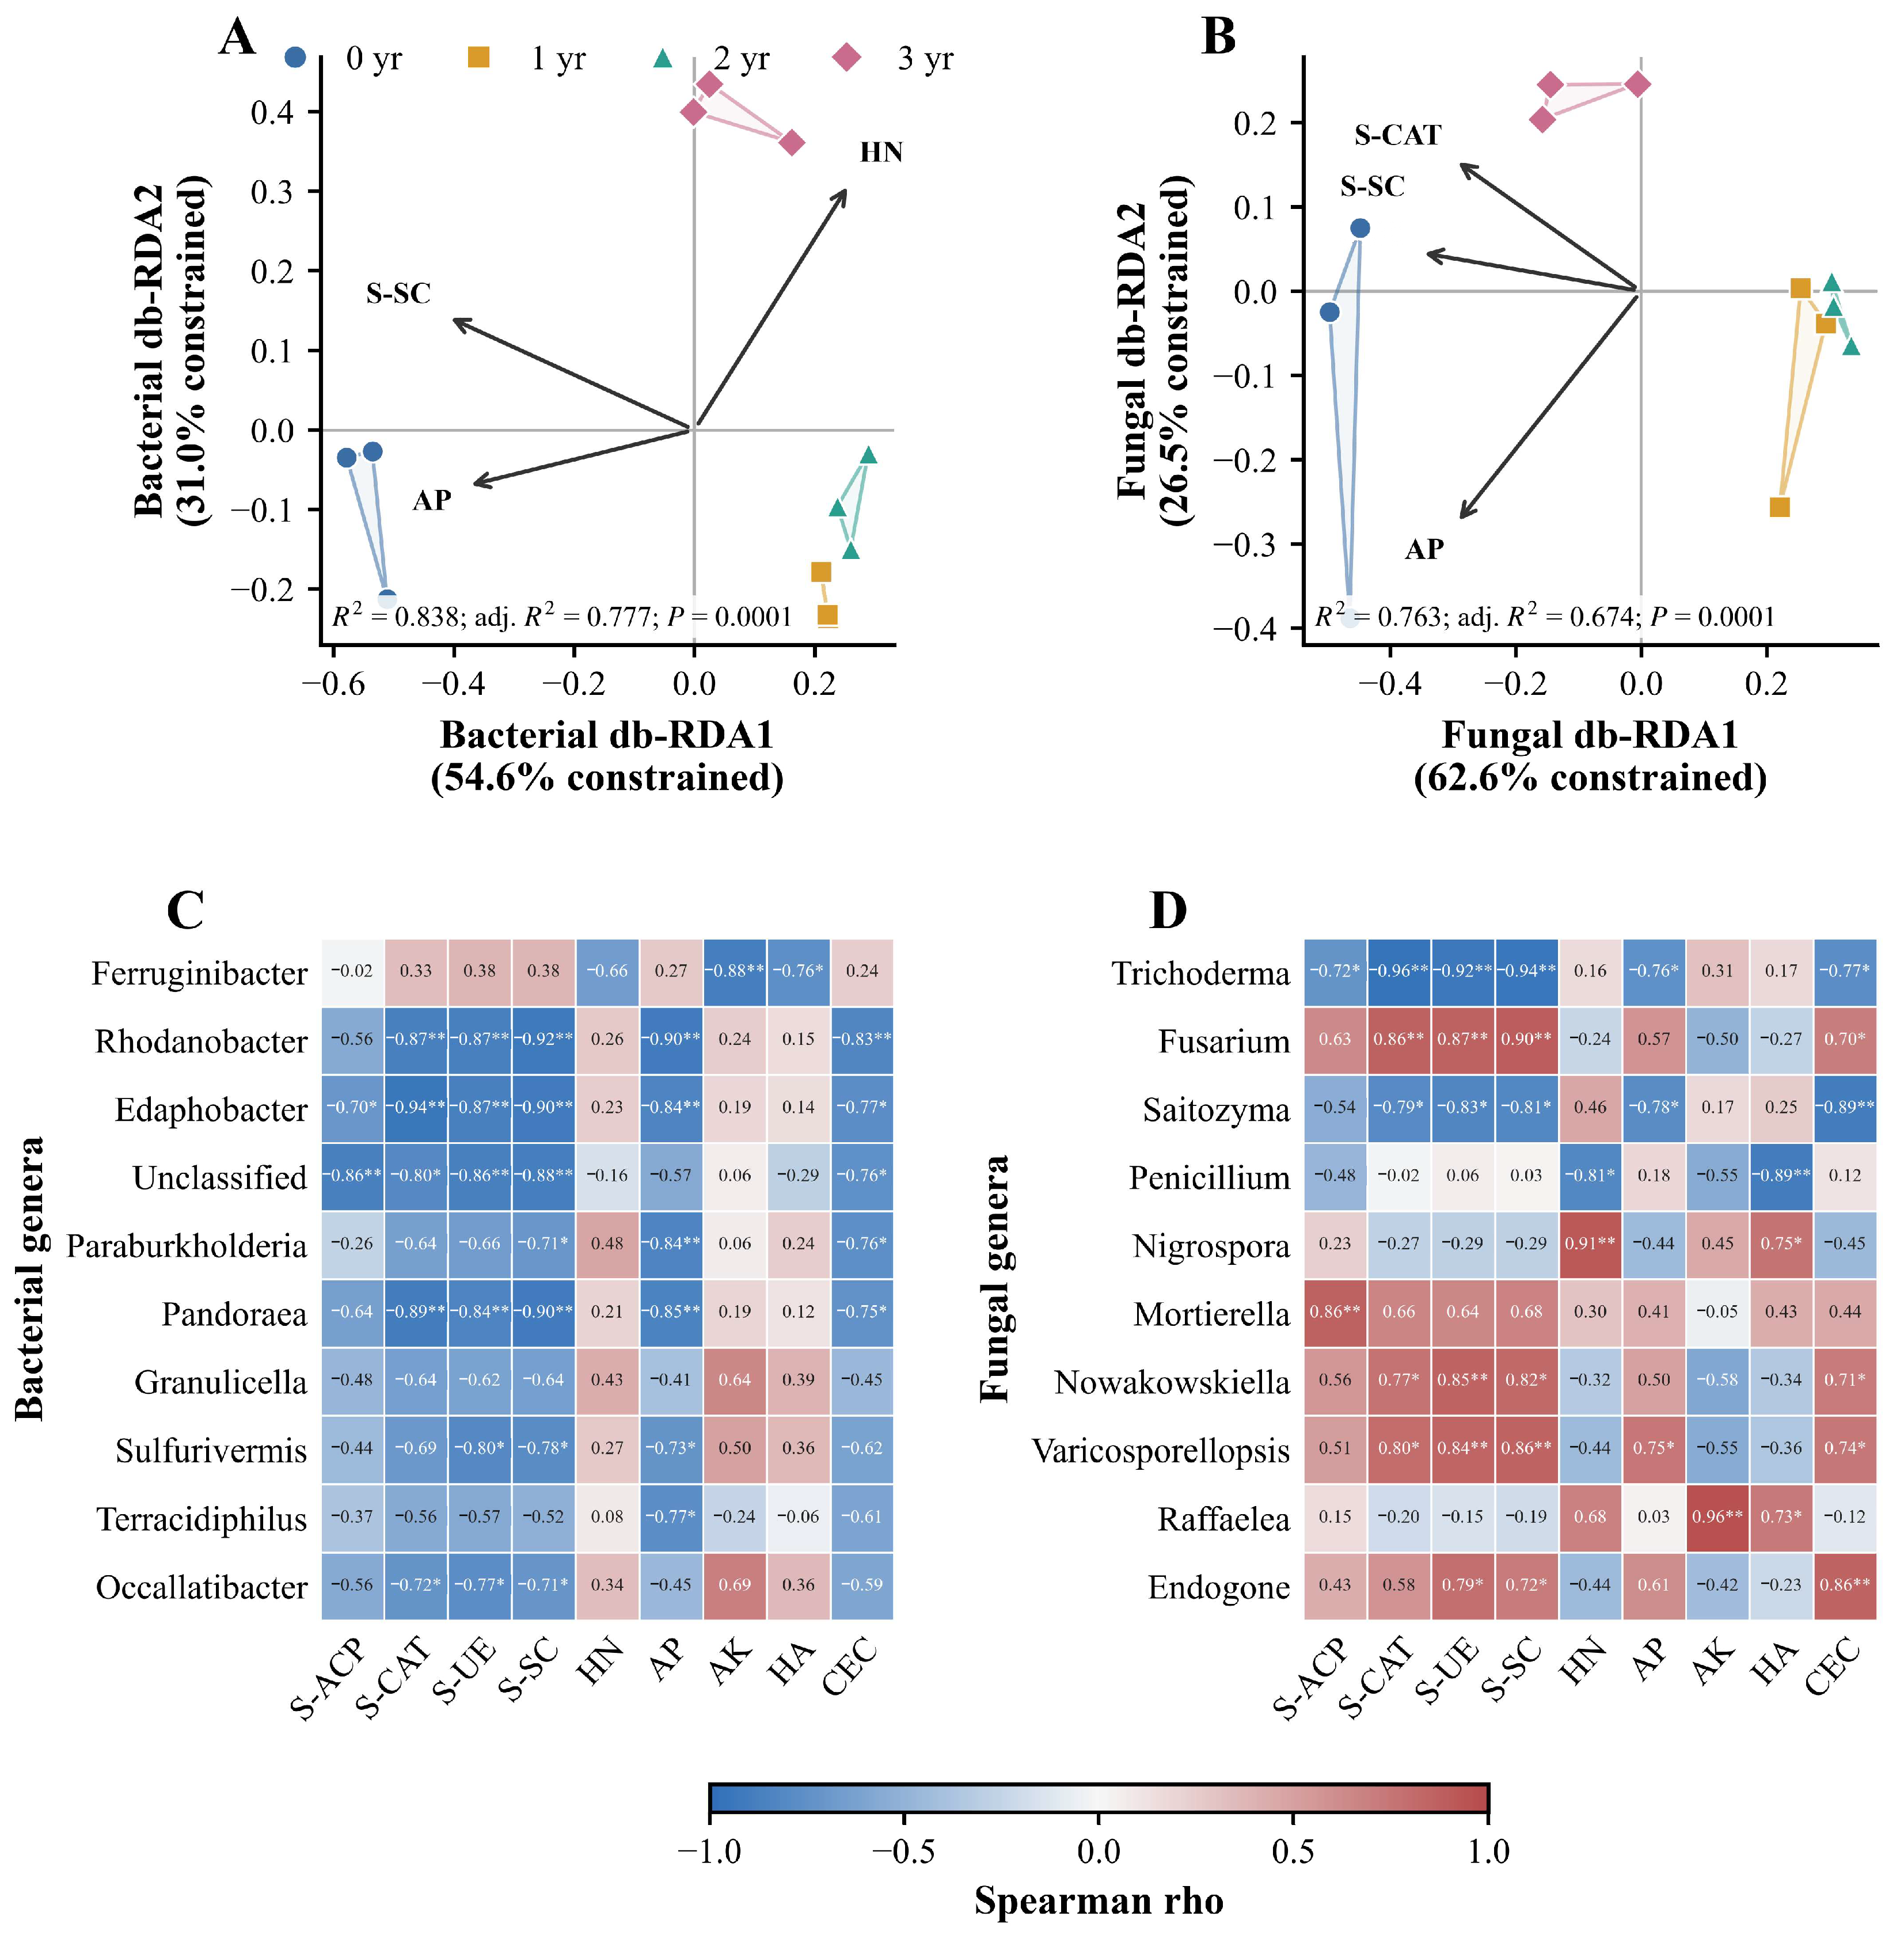
The db-RDA retained SUC, AP and HN for bacteria (pseudo-F = 13.80; R2 = 0.838; adjusted R2 = 0.777; p = 0.0001) and SUC, AP and CAT for fungi (pseudo-F = 8.58; R2 = 0.763; adjusted R2 = 0.674; p = 0.0001; Figure 5A,B). Genus–soil Spearman correlations indicated additional covariation between taxonomic profiles and soil variables (Figure 5C,D; Figure S5; Table S10a).
3.6. Bacterial and Fungal Distance Patterns Were Concordant
Bacterial and fungal Bray–Curtis distances were correlated (Mantel Spearman ρ = 0.926; p = 0.0001). None of the 81 FAPROTAX-predicted functions remained significant after BH adjustment (Figure S6).
Figure 4.
Mean relative taxonomic composition by treatment duration. (A) Bacterial phyla; (B) fungal phyla; (C) bacterial genera; (D) fungal genera. Eight abundant named phyla or ten named genera are shown, with Unclassified and Other categories. Proportions were calculated within each sample before obtaining treatment means (n = 3), and within-sample aggregation preceded SD estimation. Means ± SD and complete classifications are reported in Tables S14 and S5a–d.
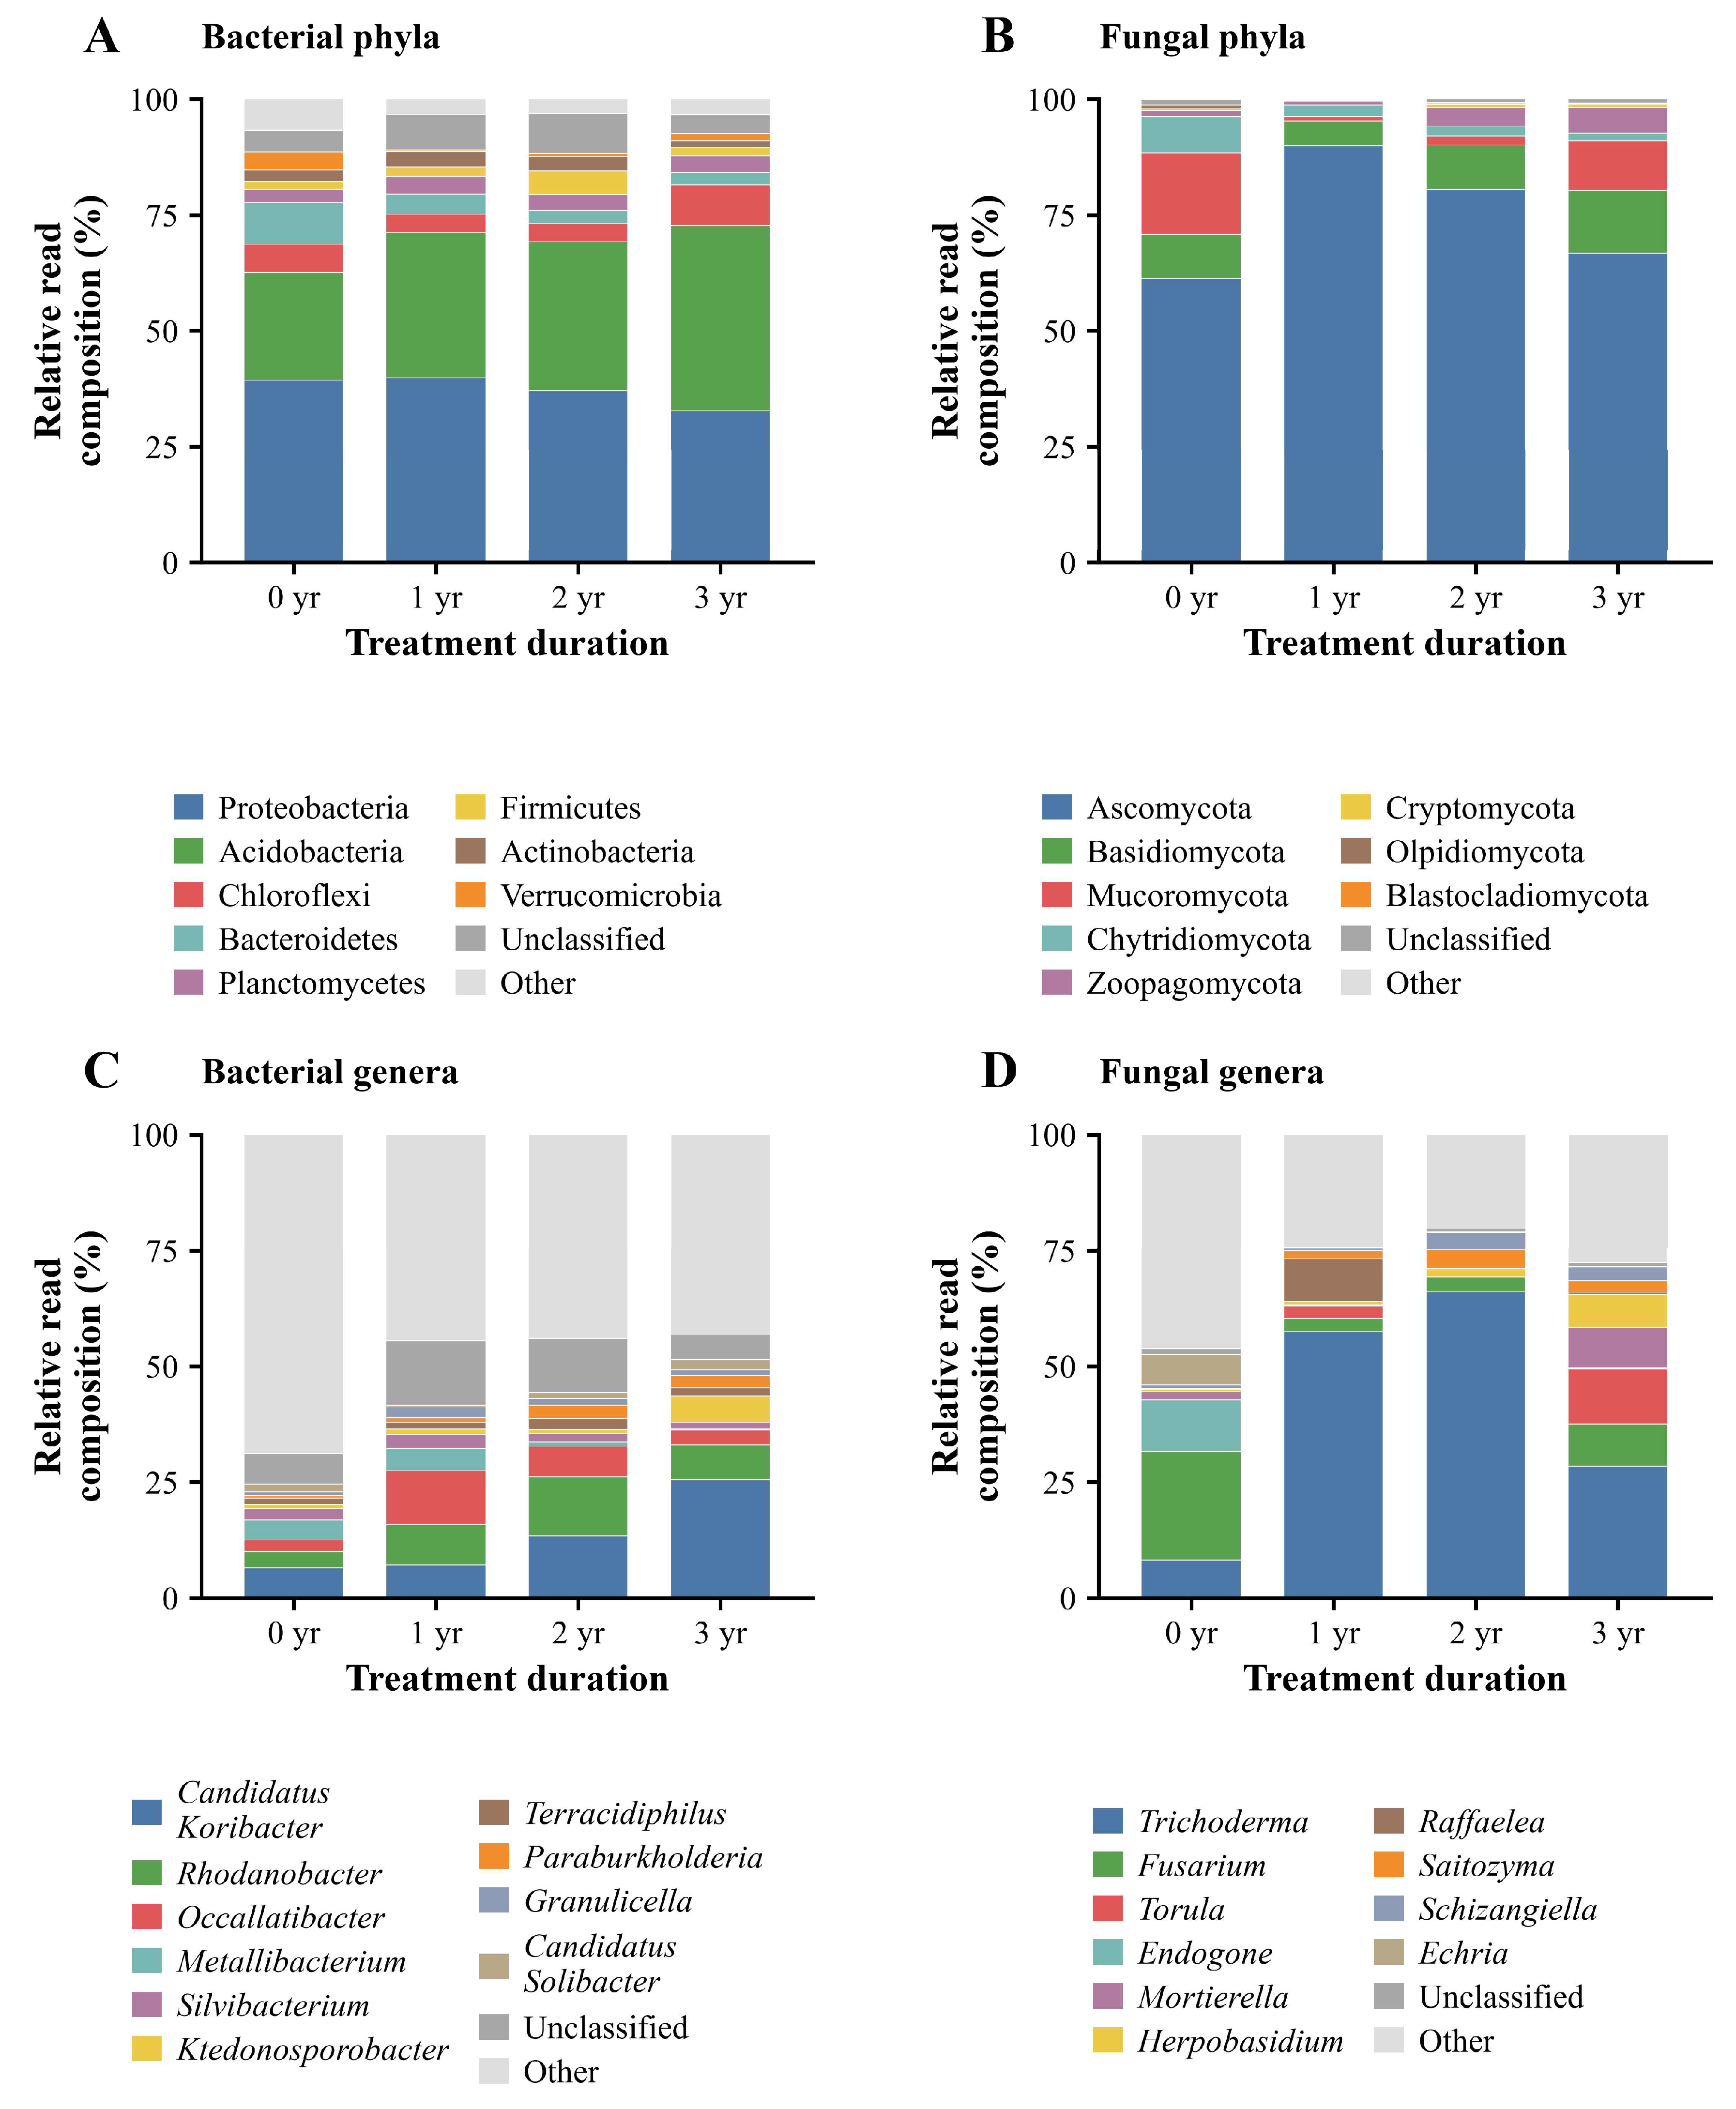
Figure 5.
Associations between rhizosphere microbial composition and soil biochemical properties. (A,B) Bacterial and fungal db-RDA, respectively; symbols represent plot composites and polygons connect observations. Percentages indicate constrained variance. (C,D) Spearman correlations between selected genus-level read profiles and nine soil variables (12 plots). Cell values are Spearman ρ; asterisks denote BH q < 0.05 (*) and q < 0.01 (**) across 180 correlations per microbial domain. S-ACP, acid phosphatase; S-CAT, catalase; S-UE, urease; S-SC, sucrase; HN, hydrolysable nitrogen; AP, available phosphorus; AK, available potassium; HA, humic acid; CEC, cation-exchange capacity. Full results are in Table S10a and Figure S5.
4. Discussion
4.1. A Nonlinear Groupwise Pattern Across Treatment Durations
Treatment duration showed nonlinear associations with rhizosphere chemistry and bacterial diversity. The 2-year group had the lowest mean ACP, CAT, URE, SUC and AP values, whereas bacterial richness and Shannon diversity were higher at 3 years than at 1 or 2 years but remained below controls. These cross-sectional patterns are consistent with treatment-associated changes in rhizosphere conditions, although the duration groups do not constitute a within-plot time series.
Penicillin can move into citrus tissues after trunk infusion and modify associated bacterial communities [5,12]. Rhizosphere responses may reflect direct microbial exposure, host physiological changes or altered root-derived substrates [6,13,14]. The present group comparison cannot distinguish these mechanisms, but it identifies the biochemical and community traits most strongly associated with recorded treatment duration.
4.2. Soil Biochemical Responses Indicate Reorganisation of Nutrient-Processing Potential
ACP mediates organic phosphorus hydrolysis, URE converts urea to ammoniacal nitrogen, and SUC hydrolyses readily available sucrose. Their lower assay activities at 2 years, together with lower AP, suggest differences in substrate-specific phosphorus, nitrogen and labile-carbon processing potential. These are assay potentials rather than direct field fluxes, and substrate availability and soil conditions are influential [15,18,19,21,22].
CAT catalyses hydrogen peroxide decomposition and provides an indicator of peroxide-removal potential in soil [16]. Its lower activity at 2 years may reflect shifts in enzyme production, persistence or substrate-related conditions. CAT alone does not quantify oxidative damage or microbial biomass.
Higher ACP, HN and HA means at 3 years were not accompanied by uniform changes in the other variables. Root-derived carbon, microbial turnover and nutrient immobilisation may contribute to these divergent patterns. Soil pH, moisture and baseline nutrient status are also plausible influences on enzyme activity and microbial composition.
4.3. Bacterial Diversity and Taxonomic Associations
Bacterial richness and Shannon diversity were lower under all recorded treatment durations than in controls, although group means at 3 years exceeded those at 1 and 2 years. Acidobacteria and several abundant genera also varied by group. Actinobacteria were detected throughout, although broad phylum-level proportions do not describe the activity or biomass of filamentous actinomycetes. Relative taxonomic differences complement the diversity patterns but cannot alone identify functional gains or losses (Tables S5a–d and S15–S17).
Citrus-associated communities vary with geography, root compartment, host genotype, management and plant health [1,43,44,45,46]. Spatial blocking accounted for part of the orchard’s structure, but the observed PERMANOVA differences occurred alongside substantial heterogeneity in dispersion. Consequently, the Bray–Curtis results reflect group-associated community dissimilarity without uniquely partitioning centroid displacement from dispersion [38,39,40].
4.4. Fungal Relative Composition and Its Interpretive Limits
Fungal observed richness was not significant in the primary analysis, whereas Shannon diversity was lowest at 2 years and showed test-dependent evidence (primary BH q = 0.05094). Trichoderma reached high relative read proportions at 1 and 2 years, with positive block-adjusted CLR contrasts and significant omnibus tests under both sensitivity settings (Figure S3; Tables S15–S17).
Because amplicon profiles are compositional, increases in the share of one taxon constrain the shares of others [47]. CLR contrasts quantify changes relative to the geometric mean of the retained taxa. Lower Fusarium CLR values at 1 and 2 years indicate relative shifts rather than measured population declines. Future quantitative assays could distinguish absolute changes from proportional differences; genus-level assignments alone do not establish antagonism or pathogenic function.
4.5. Associations Between Microbial Profiles and Soil Biochemistry
Across the 12 plots, community dissimilarities covaried with soil biochemical indicators. The fitted db-RDA models associated SUC, AP and HN with bacterial profiles and SUC, AP and CAT with fungal profiles. These ordinations and genus–soil correlations describe coordinated variation across treatment groups rather than independent effects of individual soil properties.
No FAPROTAX-predicted function remained significant after multiple-testing correction. Direct process measurements or functional-gene analyses would be needed to test the metabolic implications of the enzyme and taxonomic patterns [36].
4.6. Agronomic Implications and Study Scope
Repeated antibiotic application may influence non-target microbial assemblages and select for resistant organisms, with potential consequences for nutrient cycling and plant health. Citrus infusion studies have documented tissue translocation and explored antibiotic residues [5,13], but the present study did not quantify antibiotic residues, resistance determinants or transfer to fruit. These potential agronomic risks therefore warrant dedicated monitoring.
This single-orchard study included three independent plot composites per treatment and one sampling occasion. The modest replication restricts statistical power and generalisation, and duration groups represent different plots rather than repeated observations of the same plots.
Pre-treatment soil pH, texture, moisture, total carbon and total nitrogen were not recorded. Their potential influence on the observed treatment-group differences could not be estimated. Baseline soil characterisation and repeated post-infusion sampling would strengthen future field comparisons.
Penicillin exposure in the rhizosphere and any change in total microbial biomass require direct chemical and absolute-quantification measurements. Future multi-orchard trials should combine baseline soil characterisation, repeated sampling, residue monitoring and resistance-gene assays.
5. Conclusions
Recorded penicillin-treatment duration was associated with nonlinear variation in citrus rhizosphere biochemical indicators and microbial composition. ACP, CAT, URE, SUC and AP had their lowest means at 2 years; bacterial richness and Shannon diversity were higher at 3 years than at 1 or 2 years but remained below untreated controls. Fungal richness was not significant, and Shannon diversity depended on the statistical test. Bacterial and fungal communities differed among groups in Bray–Curtis analyses, accompanied by heterogeneous dispersion. Trichoderma showed large relative proportions and positive CLR contrasts in treated groups. These observations support treatment-duration associations in this orchard without establishing the direction or direct mechanism of microbial change.
The results support continued evaluation of the rhizosphere consequences of repeated antibiotic use. Residue, resistance and absolute microbial-abundance measurements will be important for assessing potential long-term agronomic and environmental effects.
Supplementary Materials
The following supporting information can be downloaded at: https://www.mdpi.com/article/10.3390/agronomy16212250/s1, Supplementary Table S1a. Plot information and soil biochemical observations; Supplementary Table S1b. Soil biochemical variable tests; Supplementary Table S1c. Pairwise soil biochemical comparisons; Supplementary Table S2. Sequencing depth and read characteristics; Supplementary Table S3. Observed OTUs and alpha-diversity indices; Supplementary Table S4a. Alpha-diversity tests; Supplementary Table S4b. Pairwise alpha-diversity comparisons; Supplementary Table S5a. Bacterial phylum relative read proportions (mean ± SD, n = 3); Supplementary Table S5b. Fungal phylum relative read proportions (mean ± SD, n = 3); Supplementary Table S5c. Bacterial genus relative read proportions (mean ± SD, n = 3); Supplementary Table S5d. Fungal genus relative read proportions (mean ± SD, n = 3); Supplementary Table S6. Block-adjusted Bray–Curtis PERMANOVA; Supplementary Table S7. Spatial-median multivariate dispersion; Supplementary Table S8. Community-analysis sensitivity to normalization; Supplementary Table S9a. Exploratory distance-based redundancy analysis; Supplementary Table S9b. Exploratory marginal environmental associations; Supplementary Table S9c. Variance-inflation factors; Supplementary Table S10a. Genus–soil Spearman correlations; Supplementary Table S10b. Bacterial–fungal Bray–Curtis concordance; Supplementary Table S11. Sample-level predicted functional counts; Supplementary Table S12. Predicted functional profiles and statistical tests; Supplementary Table S13. Soil enzyme assay procedures, controls and activity calculations; Supplementary Table S14. Figure 4 taxonomic mean proportions and sample SD; Supplementary Table S15. Block-adjusted phylum and genus CLR tests; Supplementary Table S16. Block-adjusted treatment-versus-control CLR contrasts; Supplementary Table S17. CLR sensitivity to pseudocount and prevalence thresholds; Supplementary Table S18. Soil and alpha-diversity means and sample SD; Supplementary Table S19. Block-adjusted soil and alpha-diversity tests; Supplementary Table S20. Community-dispersion sensitivity analysis; Figure S1. Sample-level heatmap of nine rhizosphere biochemical variables. Values are standardized within each variable and displayed as z scores for the 12 plot composites, grouped by treatment duration. CEC, cation-exchange capacity; Figure S2. Sequencing-depth and read-length summaries from bacterial and fungal PacBio amplicons; Figure S3. Block-adjusted genus-level CLR contrasts against untreated controls; Figure S4. Exploratory marginal environmental fits for bacterial (A) and fungal (B) community structure. Bars show marginal R2 values; labels give BH-adjusted q values. Coloured bars identify variables included in the multivariable db-RDA model. Model estimates and variance-inflation factors are in Tables S9a–S9c; Figure S5. Exploratory Spearman correlations between 20 genus-level relative-read profiles and nine soil biochemical variables in 12 plot composites; Figure S6. FAPROTAX-predicted bacterial functional profiles across penicillin-treatment groups and Supplementary Methods.
Author Contributions
Conceptualization, L.L. and B.S.; methodology, L.L., Y.Z., M.Q., Q.Q., Q.L., S.C. and Y.Q.; formal analysis, L.L., Y.Z., M.Q., Q.Q., Y.L., Q.L., S.C. and Y.Q.; investigation, Y.L. and Q.L.; data curation, L.L.; visualisation, Y.L.; writing—original draft preparation, L.L.; writing—review and editing, S.C. and B.S.; supervision, B.S.; project administration, B.S.; funding acquisition, B.S. All authors have read and agreed to the published version of the manuscript.
Funding
This research was funded by the Guangxi Major Science and Technology Program (Guike AA24263045); the Guangxi Key Research and Development Program (Guike FN2600640431); Research and Application Demonstration of Efficient, Eco-friendly, and Standardized Cultivation Techniques for Spring Honey Oranges (MJYH2023-0907); and the Special Fund for Basic Scientific Research of Guangxi Academy of Agricultural Sciences (GuiNongKe2026YT013).
Data Availability Statement
The bacterial 16S rRNA gene and fungal ITS sequence data are reported under BioProject PRJNA1498691 (BioSamples SAMN61854641–SAMN61854652). The accompanying supplementary data provide count-derived diversity measures, taxonomic summaries, statistical results and sample information.
Acknowledgments
The authors thank the orchard staff and technical personnel who assisted with field sampling, soil biochemical analyses, and amplicon sequencing.
Conflicts of Interest
The authors declare no conflicts of interest.
References
- Xu, J.; Zhang, Y.; Zhang, P.; Trivedi, P.; Riera, N.; Wang, Y.; Liu, X.; Fan, G.; Tang, J.; Coletta-Filho, H.D.; et al. The structure and function of the global citrus rhizosphere microbiome. Nat. Commun. 2018, 9, 4894. [Google Scholar] [CrossRef] [Scilit]
- Trivedi, P.; He, Z.; Van Nostrand, J.D.; Albrigo, G.; Zhou, J.; Wang, N. Huanglongbing alters the structure and functional diversity of microbial communities associated with citrus rhizosphere. ISME J. 2012, 6, 363–383. [Google Scholar] [CrossRef] [Scilit]
- Blaustein, R.A.; Lorca, G.L.; Meyer, J.L.; Gonzalez, C.F.; Teplitski, M. Defining the core citrus leaf- and root-associated microbiota: Factors associated with community structure and implications for managing Huanglongbing (citrus greening) disease. Appl. Environ. Microbiol. 2017, 83, e00210-17. [Google Scholar] [CrossRef] [Scilit]
- Zhang, Y.; Xu, J.; Riera, N.; Jin, T.; Li, J.; Wang, N. Huanglongbing impairs the rhizosphere-to-rhizoplane enrichment process of the citrus root-associated microbiome. Microbiome 2017, 5, 97. [Google Scholar] [CrossRef] [Scilit]
- Shin, K.; Ascunce, M.S.; Narouei-Khandan, H.A.; Sun, X.; Jones, D.; Kolawole, O.O.; Goss, E.M.; van Bruggen, A.H.C. Effects and side effects of penicillin injection in huanglongbing affected grapefruit trees. Crop Prot. 2016, 90, 106–116. [Google Scholar] [CrossRef] [Scilit]
- Castellano-Hinojosa, A.; González-López, J.; Tardivo, C.; Monus, B.D.; de Freitas, J.; Strauss, S.L.; Albrecht, U. Trunk injection of oxytetracycline improves plant performance and alters the active bark and rhizosphere microbiomes in huanglongbing-affected citrus trees. Biol. Fertil. Soils 2024, 60, 563–576. [Google Scholar] [CrossRef] [Scilit]
- McManus, P.S.; Stockwell, V.O.; Sundin, G.W.; Jones, A.L. Antibiotic use in plant agriculture. Annu. Rev. Phytopathol. 2002, 40, 443–465. [Google Scholar] [CrossRef] [Scilit]
- Cycoń, M.; Mrozik, A.; Piotrowska-Seget, Z. Antibiotics in the soil environment: Degradation and their impact on microbial activity and diversity. Front. Microbiol. 2019, 10, 338. [Google Scholar] [CrossRef] [Scilit]
- Batuman, O.; Britt-Ugartemendia, K.; Kunwar, S.; Yilmaz, S.; Fessler, L.; Redondo, A.; Chumachenko, K.; Chakravarty, S.; Wade, T. The use and impact of antibiotics in plant agriculture: A review. Phytopathology 2024, 114, 885–909. [Google Scholar] [CrossRef] [Scilit]
- Zhang, Q.; Kang, O.; Jabeen, S.; Dick, W.A. Alterations in soil microbial communities caused by treatments with penicillin or neomycin. Environ. Sci. Pollut. Res. 2017, 24, 18651–18662. [Google Scholar] [CrossRef] [Scilit]
- Sheng, F.; Ling, J.; Wang, C.; Jin, X.; Gu, X.; Li, H.; Zhao, J.; Wang, Y.; Gu, C. Rapid hydrolysis of penicillin antibiotics mediated by adsorbed zinc on goethite surfaces. Environ. Sci. Technol. 2019, 53, 10705–10713. [Google Scholar] [CrossRef] [Scilit]
- Ascunce, M.S.; Shin, K.; Huguet-Tapia, J.C.; Poudel, R.; Garrett, K.A.; van Bruggen, A.H.C.; Goss, E.M. Penicillin trunk injection affects bacterial community structure in citrus trees. Microb. Ecol. 2019, 78, 457–469. [Google Scholar] [CrossRef] [Scilit]
- McVay, J.; Sun, X.; Jones, D.; Urbina, H.; Aldeek, F.; Cook, J.M.; Jeyaprakash, A.; Hodges, G.; Smith, T. Limited persistence of residues and metabolites in fruit and juice following penicillin trunk infusion in citrus affected by Huanglongbing. Crop Prot. 2019, 125, 104753. [Google Scholar] [CrossRef] [Scilit]
- Ketehouli, T.; Goss, E.M.; Ascunce, M.S.; Martins, S.J. Metabolic and physiological effects of antibiotic-induced dysbiosis in citrus. Ecotoxicol. Environ. Saf. 2024, 287, 117325. [Google Scholar] [CrossRef] [Scilit]
- Sinsabaugh, R.L.; Lauber, C.L.; Weintraub, M.N.; Ahmed, B.; Allison, S.D.; Crenshaw, C.; Contosta, A.R.; Cusack, D.; Frey, S.; Gallo, M.E.; et al. Stoichiometry of soil enzyme activity at global scale. Ecol. Lett. 2008, 11, 1252–1264. [Google Scholar] [CrossRef] [Scilit]
- Chabot, M.; Morales, E.; Cummings, J.; Rios, N.; Giatpaiboon, S.; Mogul, R. Simple kinetics, assay, and trends for soil microbial catalases. Anal. Biochem. 2020, 610, 113901. [Google Scholar] [CrossRef] [Scilit]
- Wang, M.; Li, D.; Liu, X.; Chen, C.; Frey, B.; Sui, X.; Li, M.-H. Global hierarchical meta-analysis to identify the factors for controlling effects of antibiotics on soil microbiota. Environ. Int. 2024, 192, 109038. [Google Scholar] [CrossRef] [Scilit]
- Santás-Miguel, V.; Díaz-Raviña, M.; Martín, A.; García-Campos, E.; Barreiro, A.; Núñez-Delgado, A.; Álvarez-Rodríguez, E.; Arias-Estévez, M.; Fernández-Calviño, D. Soil enzymatic activities and microbial community structure in soils polluted with tetracycline antibiotics. Agronomy 2021, 11, 906. [Google Scholar] [CrossRef] [Scilit]
- Beijing Solarbio Science & Technology Co., Ltd. Soil Acid Phosphatase Activity Assay Kit BC0140. Manufacturer Reference Instructions. Available online: https://www.solarbio.com/pdf/9-SHSJH/1-ZW/BC0140.pdf (accessed on 26 October 2026).
- Beijing Solarbio Science & Technology Co., Ltd. Soil Catalase Activity Assay Kit BC0100. Manufacturer Reference Instructions. Available online: https://www.solarbio.com/pdf/9-SHSJH/1-ZW/BC0100.pdf (accessed on 26 October 2026).
- Beijing Solarbio Science & Technology Co., Ltd. Soil Urease Activity Assay Kit BC0120. Manufacturer Reference Instructions. Available online: https://www.solarbio.com/pdf/9-SHSJH/1-ZW/BC0120.pdf (accessed on 26 October 2026).
- Beijing Solarbio Science & Technology Co., Ltd. Soil Saccharase Activity Assay Kit BC0240. Manufacturer Reference Instructions. Available online: https://www.solarbio.com/pdf/9-SHSJH/1-ZW/BC0240.pdf (accessed on 26 October 2026).
- LY/T 1228-2015; Determination of Nitrogen in Forest Soils. Standards Press of China: Beijing, China, 2015.
- HJ 704-2014; Soil Quality—Determination of Available Phosphorus—Sodium Hydrogen Carbonate Solution–Mo–Sb Anti Spectrophotometric Method. China Environmental Science Press: Beijing, China, 2014.
- NY/T 889-2004; Determination of Available and Slowly Available Potassium Contents in Soil. China Agriculture Press: Beijing, China, 2005.
- LY/T 1238-1999; Determination of Humus Fractionation in Forest Soil. Standards Press of China: Beijing, China, 1999.
- LY/T 1243-1999; Determination of Cation Exchange Capacity in Forest Soil. Standards Press of China: Beijing, China, 1999.
- Lane, D.J. 16S/23S rRNA sequencing. In Nucleic Acid Techniques in Bacterial Systematics; Stackebrandt, E., Goodfellow, M., Eds.; John Wiley & Sons: Chichester, UK, 1991; pp. 115–175. [Google Scholar]
- White, T.J.; Bruns, T.; Lee, S.; Taylor, J. Amplification and direct sequencing of fungal ribosomal RNA genes for phylogenetics. In PCR Protocols: A Guide to Methods and Applications; Innis, M.A., Gelfand, D.H., Sninsky, J.J., White, T.J., Eds.; Academic Press: San Diego, CA, USA, 1990; pp. 315–322. [Google Scholar] [CrossRef] [Scilit]
- Gardes, M.; Bruns, T.D. ITS primers with enhanced specificity for basidiomycetes: Application to the identification of mycorrhizae and rusts. Mol. Ecol. 1993, 2, 113–118. [Google Scholar] [CrossRef] [Scilit]
- Edgar, R.C. UPARSE: Highly accurate OTU sequences from microbial amplicon reads. Nat. Methods 2013, 10, 996–998. [Google Scholar] [CrossRef] [Scilit]
- Edgar, R.C. Updating the 97% identity threshold for 16S ribosomal RNA OTUs. Bioinformatics 2018, 34, 2371–2375. [Google Scholar] [CrossRef] [Scilit]
- Quast, C.; Pruesse, E.; Yilmaz, P.; Gerken, J.; Schweer, T.; Yarza, P.; Peplies, J.; Glöckner, F.O. The SILVA ribosomal RNA gene database project: Improved data processing and web-based tools. Nucleic Acids Res. 2013, 41, D590–D596. [Google Scholar] [CrossRef] [Scilit]
- Nilsson, R.H.; Larsson, K.-H.; Taylor, A.F.S.; Bengtsson-Palme, J.; Jeppesen, T.S.; Schigel, D.; Kennedy, P.; Picard, K.; Glöckner, F.O.; Tedersoo, L.; et al. The UNITE database for molecular identification of fungi: Handling dark taxa and parallel taxonomic classifications. Nucleic Acids Res. 2019, 47, D259–D264. [Google Scholar] [CrossRef] [Scilit]
- McMurdie, P.J.; Holmes, S. Waste not, want not: Why rarefying microbiome data is inadmissible. PLoS Comput. Biol. 2014, 10, e1003531. [Google Scholar] [CrossRef] [Scilit]
- Louca, S.; Parfrey, L.W.; Doebeli, M. Decoupling function and taxonomy in the global ocean microbiome. Science 2016, 353, 1272–1277. [Google Scholar] [CrossRef] [Scilit]
- Benjamini, Y.; Hochberg, Y. Controlling the false discovery rate: A practical and powerful approach to multiple testing. J. R. Stat. Soc. Ser. B 1995, 57, 289–300. [Google Scholar] [CrossRef] [Scilit]
- Anderson, M.J. A new method for non-parametric multivariate analysis of variance. Austral Ecol. 2001, 26, 32–46. [Google Scholar] [CrossRef] [Scilit]
- Anderson, M.J. Distance-based tests for homogeneity of multivariate dispersions. Biometrics 2006, 62, 245–253. [Google Scholar] [CrossRef] [Scilit]
- Anderson, M.J.; Walsh, D.C.I. PERMANOVA, ANOSIM, and the Mantel test in the face of heterogeneous dispersions: What null hypothesis are you testing? Ecol. Monogr. 2013, 83, 557–574. [Google Scholar] [CrossRef] [Scilit]
- Vegan Development Team. Multivariate Homogeneity of Groups Dispersions (Variances). Available online: https://vegandevs.github.io/vegan/reference/betadisper.html (accessed on 26 October 2026).
- Vegan Development Team. Permutation Test of Multivariate Homogeneity of Groups Dispersions (Variances). Available online: https://vegandevs.github.io/vegan/reference/permutest.betadisper.html (accessed on 26 October 2026).
- Castellano-Hinojosa, A.; Albrecht, U.; Strauss, S.L. Interactions between rootstocks and compost influence the active rhizosphere bacterial communities in citrus. Microbiome 2023, 11, 79. [Google Scholar] [CrossRef] [Scilit]
- Lombardo, M.F.; Zhang, Y.; Xu, J.; Trivedi, P.; Zhang, P.; Riera, N.; Li, L.; Wang, Y.; Liu, X.; Fan, G.; et al. Global citrus root microbiota unravels assembly cues and core members. Front. Microbiol. 2024, 15, 1405751. [Google Scholar] [CrossRef] [Scilit]
- Xi, M.; Deyett, E.; Stajich, J.E.; El-Kereamy, A.; Roper, M.C.; Rolshausen, P.E. Microbiome diversity, composition and assembly in a California citrus orchard. Front. Microbiol. 2023, 14, 1100590. [Google Scholar] [CrossRef] [Scilit]
- Xu, J.; Wang, Y.; Zhang, Y.; Riera, N.; Li, J.; Clark, K.J.; Jin, T.; Chen, H.; Wen, J.; Ma, W.; et al. Host genetic traits underlying the composition and assembly of the citrus microbiome. Phytobiomes J. 2023, 7, 401–411. [Google Scholar] [CrossRef] [Scilit]
- Gloor, G.B.; Macklaim, J.M.; Pawlowsky-Glahn, V.; Egozcue, J.J. Microbiome datasets are compositional: And this is not optional. Front. Microbiol. 2017, 8, 2224. [Google Scholar] [CrossRef] [Scilit]
Disclaimer/Publisher’s Note: The statements, opinions and data contained in all publications are solely those of the individual author(s) and contributor(s) and not of MDPI and/or the editor(s). MDPI and/or the editor(s) disclaim responsibility for any injury to people or property resulting from any ideas, methods, instructions or products referred to in the content. |
© 2026 by the authors. Licensee MDPI, Basel, Switzerland. This article is an open access article distributed under the terms and conditions of the Creative Commons Attribution (CC BY) license.