


Abstract
Digestate, a by-product of methane fermentation in agricultural biogas plants, is a valuable source of nitrogen (D-N); however, the mode of action of this specific (mineral/organic) N carrier has not yet been elucidated. The influence of D-N on yield-forming action in winter oilseed rape (WOSR) was determined based on a three-year series of field experiments conducted between 2016 and 2018. The field experiments were arranged according to a two-factorial design. The first factor was the fertilization system (FS), based on two N carriers: (i) ammonium nitrate 34-0-0 (AN-FS) and (ii) digestate (D-FS). The second factor was the N dose, set as 0 (absolute N control), 60, 120, 180, or 240 kg ha−1. The (i) mass, (ii) balance, and (iii) remobilization quantity of various nutrients were determined at two stages defining the seed-filling period (S-FP), namely, the onset of flowering and physiological maturity. These traits and developed indices were used to predict the seed yield (SEY), the number of seeds in the pods of lateral branches (SeSB) per m2, and N mass at the onset of flowering (NAF) and at physiological maturity (NAH). The N source, averaged over N doses and years, did not significantly differentiate yield (2.68 vs. 2.78 t ha−1 under the AN-FS and D-FS, respectively). The increases in seed yield under the D-FS in comparison to the AN-FS were −0.01, 0.05, 0.09, and 0.35 t ha−1 at N doses of 60, 120, 180, and 240 kg N ha−1, respectively. The lower yield efficiency for ammonium nitrate compared to the digestate was explained by the higher unit productivity of the N accumulated by the crop at the onset of flowering (NAF) under the latter treatment; in particular, this difference amounted to approximately 20% in favor of the digestate system (15.8 vs. 18.9 kg of seeds per kg of N). The WOSR production strategy based on the use of AN, which was found to saturate the rapeseed canopy with N at the onset of flowering, proved ineffective for yield formation. The higher yield-forming efficiency under the D-FS resulted from the higher efficiency of canopy N due to both the interaction between N and K (remobilization) and the net soil uptake of phosphorus (P) and micronutrients—namely, zinc (Zn) and copper (Cu)—during the S-FP. This study’s results demonstrate that digestate can be considered a significant input for sustainable winter rapeseed production.
1. Introduction
Winter oilseed rape (WOSR) is a key source of vegetable oil in the Northern Hemisphere (e.g., Europe, China) [1,2]; however, its seed yields vary widely across regions and years [3]. This crop requires favorable growing conditions, including a suitable preceding crop. Although legumes are considered the best preceding crops, cereals currently predominate in farming practice [4]. Rapeseed is highly sensitive to the supply of phosphorus (P) and potassium (K), as well as magnesium (Mg) and sulfur (S) [5,6]. Calcium (Ca), most often associated with soil pH, is a nutrient that is rarely included in the list of critical nutrients [7,8]. Among the micronutrients, attention is most frequently placed on boron (B) and molybdenum, while others tend to receive less attention [9]. Each of these groups of nutrients plays essential roles in efficient nitrogen (N) management in WOSR from the onset of flowering to full physiological maturity [10].
Winter rapeseed has high soil fertility requirements, enabling the crop to rapidly absorb N during its intensive spring growth phase [10]. The long-term critical phase of N demand extends from late winter (vegetative regrowth) to the end of silique growth, while the short-term critical period for this crop covers from the start of the rosette stage to the onset of flowering [11]. During these periods, rapeseed plants are particularly sensitive to adverse weather conditions, especially water deficits. Soil drought disrupts not only inflorescence growth, but also the formation of silique primordia [12,13]. The efficiency of physiological processes governing yield-forming potential (seeds per m2; considered the “true physiological sink”) depends on the nutritional status of the plant during this period [14]. The size of the rosette and the amount of N accumulated determine the number and growth dynamics of lateral shoots, which subsequently develop into inflorescences [15,16], and the critical period for inflorescence formation coincides with the plant’s peak demand for N [17,18]. The dynamics of N uptake by crops are influenced by both the availability of nutrients in the soil and the nutritional status of the plant. In this context, potassium (K) plays a particularly important role. Between growth stages BBCH 31 and BBCH 59, the demand for K by WOSR exceeds that for N [19]. Maximum K accumulation occurs during the stem elongation phase, thus facilitating N uptake, which continues at a peak rate until full bloom. This process is associated with the formation of inflorescences on the lateral branches; in modern varieties, it is precisely these shoots that determine seed yield [20].
The second critical period for WOSR yield formation begins at the onset of flowering and extends until the pod growth phase. N is a key nutrient for photosynthesis in rapeseed during the post-flowering period [21]. Water and nutritional stresses lead to the shedding of secondary shoots and young pods, as well as abortion of the youngest seeds in the pod. The direct cause of a reduction in plant yield potential is insufficient production of assimilates by leaves and pods, as well as their delayed transport to the developing pods, and subsequently, the seeds [11,22]. In this context, N yield-forming functions depend on the supply of other nutrients, including micronutrients [10].
In light of the issues discussed above, the N fertilization strategy must target the critical stages of rapeseed yield formation. An analysis of N accumulation dynamics in WOSR indicates two main patterns. In the first, which manifests under optimal environmental (weather) and nutritional conditions, N accumulation peaks in the crop canopy just before flowering. In this model, the rapeseed canopy reaches a state of N saturation [15]. The optimal factors determining this type of N action include stress-free, ideal weather conditions and unrestricted uptake of N and K from the soil [15,19,20]. Under unfavorable environmental and/or poor nutritional conditions, N accumulation slows down and is prolonged during the post-flowering growth stages of rapeseed. This phenomenon typically occurs during years with adverse weather and when N supply to the plants is low, resulting in reduced seed yields [23].
In recent years, a new organic N source has emerged: digestate. The N in digestate occurs in two main forms—namely, organic and mineral—where the latter is in the form of ammonium nitrogen (N-NH4) [24,25]. The effectiveness of digestate stems not only from the mass of N and other nutrients it introduces into the soil, but also from its impacts on microbiological and geochemical processes within the soil/plant environment [26,27,28]. The effect of digestate on rapeseed yield appears to be either lower than or comparable to that of N from mineral fertilizers, although relevant scientific reports remain limited at present [29,30].
When assessing yield-forming functions and the forms of N fertilizers used in WOSR production, it is crucial to determine the mode of action of N, taking into account both mineral fertilizers and digestate. Given the known yield-forming roles of N derived from various N carriers, several issues regarding its supply from digestate need to be clarified. The first is to determine the yield-forming effect of N itself. The second issue concerns the factors that support or limit the effect—or, rather, the effectiveness—of digestate-derived N. It was assumed that the answers to these questions can only be obtained by analyzing the processes occurring from the beginning of flowering through to physiological maturity in rapeseed plants. As a research hypothesis, it is posited that there is no significant difference in the yield-forming effects of various N carriers used in WOSR production. Consequently, the following objectives were established for both the study and the subsequent data analysis. The primary objectives were to determine (i) the trend of N mass changes during the seed-filling period (S-FP) and its impact on crop biomass, yield structural components, and consequently, seed yield and (ii) nutrient economies during the S-FP, which determine the N management strategy. Meanwhile, the secondary objectives focused on (i) N mass at the beginning and end of the S-FP; (ii) the set of nutrients determining N mass at both these times; and (iii) seed yield prediction.
2. Materials and Methods
2.1. Experimental Site—Location, Soil, and Weather Characteristics
This study is based on field experiments with winter oilseed rape (Brassica napus L.) conducted across three growing seasons (2015/2016, 2016/2017, and 2017/2018) in Baniewice, Poland (53°05′ N, 14°36′ E). The trials took place on sandy loam soil classified as an Albic Luvisol [31,32]. The soil was characterized by low humus content (<2%), soil pH ranging from slightly acidic to neutral, low CEC, base saturation (ECEC) exceeding 70%, and low content of exchangeable Al (Table S1).
The study showed consistently high levels of available potassium (K) across all years. Available phosphorus (P) content was high during the first two growing seasons but dropped to medium in the third. Additionally, the available magnesium (Mg) levels were sufficient for rapeseed cultivation, whereas the available calcium (Ca) content remained low to very low (Table S2).
Characterized by a continental climate, the European study region frequently experiences droughts during the growing season [33]. The spring stage for WOSR generally begins in February, though weather indicators provide only a broad overview of the status. Each growing season exhibited significant variability in hydrothermal conditions. Negative Hydro-Thermal Index (HTC) values were recorded in February of 2018 due to sub-zero air temperatures; as a result, vegetative plant growth did not resume (Table 1, Figure S1). The 2015/2016 season was generally unfavorable for rapeseed growth due to prevailing drought; however, the plants were in good physiological condition in February and March. The conditions in the following season, 2016/2017, were optimal throughout the spring growing season. The third season, 2017/2018, was highly unfavorable for rapeseed growth, primarily due to low temperatures in February and March, which negatively affected plant density (i.e., causing plant stand thinning). The optimal hydrothermal conditions in April were unable to compensate for the plants’ growth dynamics, and a drastic deterioration in weather conditions (i.e., severe atmospheric drought) occurred in May and June.
Table 1.
Hydro-thermal coefficient of Selyaninov (HTC) during the spring phase of the winter oilseed rape growing cycle.
2.2. Investigation Framework
A two-factor randomized block design was employed, where treatments were randomized independently within each block. The first factor, the nitrogen fertilization system (FS), compared ammonium nitrate 34-0-0 (AN-FS) against digestate-based nitrogen (D-FS). These fertilizers were applied at five application rates: 0 (unfertilized control), 60, 120, 180, and 240 kg ha−1. The amount of N and doses of basic nutrients such as P and K are summarized in Table 2. Table S3 outlines the chemical composition of the digestate. With a digestate application rate of 8.3 m3 (corresponding to a 60 kg ha−1 N dose), the following amounts of nutrients were introduced into the soil per hectare: 600 kg of dry matter, 2.7 kg of Ca, 9.6 kg of Mg, 16.8 kg of S, 1.34 kg of Fe, 92 g of Mn, 73 g of Zn, and 13.5 g of Cu. The applied amounts of these nutrients increased in accordance with the N dose. The mass of nutrients for the AN-FS was not compensated, with the exception of P and K (Table 2). In each growing season, winter barley preceded winter oilseed rape.
Table 2.
Doses of basic nutrients applied to the soil.
The winter oilseed rape (WOSR) hybrid ‘Impression Cl’, known for its high yield potential in moderately fertile soils, served as the test variety. The crop was sown in late August at a seeding rate of 3.0 kg ha−1 (targeting a density of 40–45 plants per m2). It was harvested the following July from a 12 m2 plot once the seeds reached maturity at an 8% moisture content (dry weight basis).
2.3. Soil and Plant Analysis
Before establishing the field trial, topsoil samples (0–0.3 m) were collected to determine NH4-N and NO3-N content within 24 h of sampling [34,35]. The total inorganic nitrogen (Nmin) content is expressed in kg ha−1 [36]. Soil pH and electrical conductivity (EC) were determined using a 1 M KCl solution at a 1:2.5 (w/v) soil-to-solution ratio [37,38]. Cation exchange capacity (CEC) and soil exchangeable aluminum were determined via the ammonium chloride and ammonium acetate methods, respectively [39,40]. Plant-available concentrations of P, K, Mg, and Ca were quantified via the Mehlich 3 extraction method [41]. Phosphorus in the extract was measured colorimetrically using the molybdenum blue method, while potassium was analyzed by flame photometry. Magnesium and calcium concentrations were determined using flame atomic absorption spectroscopy (AAS). The available contents were evaluated using respective classification systems [42,43,44].
Plant samples were collected from a 1.0 m2 area to analyze dry matter and nutrient content. Sampling occurred at two growth stages: (i) the beginning of flowering (BBCH 60/61, with 10% of flowers open on the main stem) and (ii) full maturity (BBCH 89/90). Plant material was sampled from each plot (for a total of 120 samples). At the stage of physiological maturity, the plant sample was threshed, separating it into seeds and vegetative parts; that is, vegetative biomass (BV = stems + hulls).
Total nitrogen (N) content in the plant tissue was quantified using the standard macro-Kjeldahl method. To analyze mineral elements, the samples were oven-dried at 65 °C and ashed at 550 °C. The resulting ash was then dissolved in 33% HNO3. Phosphorus (P) concentration was determined colorimetrically at 436 nm via the vanadomolybdate method using a Specord 2XX/40 spectrophotometer (Analytik Jena, Jena, Germany). Concentrations of K, Mg, Fe, Mn, Zn, and Cu were measured using flame atomic absorption spectrometry (FAAS). All nutrient concentrations are reported on a dry weight basis.
2.4. Utilized Indices
- The hydro-thermal coefficient of Selyaninov (HTC) for determination of the degree of water stress in crop plants was calculated as follows [33]:
K = (P · 10)/Σt
The HTC classes are defined as follows: HTC < 0.4—extremely dry; 0.4 ≤ HTC < 0.8—very dry; 0.8 ≤ HTC < 1.1—dry; 1.1 ≤ HTC < 1.4—quite dry; 1.4 ≤ HTC < 1.7—optimal; 1.7 ≤ HTC < 2.1—quite humid; 2.1 ≤ HTC < 2.6—humid; 2.6 ≤ HTC < 3.0—very humid; and HTC ≥ 3.0—extremely humid.
- 2.
- The following indices of nutrient economics during the seed-filling period (S-FP) were developed for the purposes of this study.
- The N unit productivity at the onset of flowering (NAFP) and at harvest (NAHP) of rapeseed was calculated using the formula:
- Two new indices were created to assess nutrient dynamics across two key growth stages: the beginning of flowering (BBCH 60 = 60) and full plant maturity—harvest (BBCH 89/90 = 89).
2.1. Nutrient balance, NuB, defined as:2.2. Nutrient remobilization quantity, NuRQ, defined as:
2.5. Framework for N Economy Analysis in WOSR Canopy During the Seed-Filling Period
The nitrogen economy of the winter oilseed rape (WOSR) crops from the onset of flowering to physiological maturity was analyzed according to the flow diagram shown in Figure 1, from which it can be seen that components of the yield structure are essential elements of the analysis.
Figure 1.
Nitrogen flow pattern in a winter oilseed rape canopy during the seed-filling period—responses of yield-forming traits and seed yield. Legend: NAF and NAH—mass of N accumulated in WOSR canopy at the onset of flowering (F) and harvest (H), respectively; MB—main branch of WOSR; SB—secondary branches of WOSR.
2.6. Statistics
A two-way analysis of variance (ANOVA) evaluated the impact of the primary experimental factors—year (Y), nitrogen fertilization system (FS), and nitrogen dose (N)—along with their mutual interactions on yield and yield-forming traits. The complete dataset for each evaluated trait consisted of 120 observations, derived from a combination of 3 years, 2 fertilization systems, 5 N doses, and 4 replicates. Mean separation was performed using Tukey’s honest significant difference (HSD) test at a significance threshold of α = 0.05. All statistical evaluations were executed via STATISTICA 13® software (StatSoft, Inc., Tulsa, OK, USA, 2013). Subsequently, a stepwise regression analysis was deployed in the second diagnostic phase to identify the optimal predictors for the target rapeseed traits. This technique utilizes a backward elimination method to systematically remove statistically non-significant variables at each successive step. The variance inflation factor (VIF) was used to validate the resulting stepwise regression models [45]. VIF is an indicator of the increase in the variance of an estimated regression coefficient that occurs when independent variables are correlated with one another. The VIF is calculated as:
where R2 = coefficient of determination.
VIF ranges:
- (1)
- VIF = 1: There is no correlation between the predictor variable and the other independent variables (no multicollinearity);
- (2)
- 1 < VIF < 5: Moderate correlation exists, which is usually acceptable in most regression models;
- (3)
- 5 ≤ VIF ≤ 10: High multicollinearity exists among the predictors in the regression mode;
- (4)
- VIF > 10: Indicates that the regression coefficients are weakly estimated with the presence of multicollinearity.
3. Results
3.1. Seed Yield and Its Structural Components
The seed yield (SEY) of winter rapeseed depended significantly on the interactions between the experimental factors and the year factor. At the same time, N application, or more specifically, the overall fertilization regime, yielded no statistically significant impact. There was also no interaction between the FS and N dose (Table 3). With these relationships in mind, the rapeseed yield is presented separately for the year factor and for both experimental factors (Figure 2). In the first two growing seasons, mean yields across experimental factors remained statistically similar, slightly above 3 t ha−1. In contrast, the third season’s average yield fell significantly, reaching only 60% of the baseline set in the preceding years. The effect of FS, averaged over years and N doses, proved to be non-significant. The average yield was 2.75 t ha−1, and the average seed yield increase in the FS with digestate in comparison to that with AN was −0.01, 0.05, 0.09, and 0.35 t ha−1 at N doses of 60, 120, 180, and 240 kg N ha−1, respectively. The influence of the nitrogen treatment was substantial; notably, the 60 kg N ha−1 dosage resulted in a 77% yield increase relative to the control. The effects of subsequent N doses were considerably smaller but still significant. The highest yield was recorded on the plot with 180 kg N ha−1; compared to the 60 kg N ha−1 plot, the yield increased by approximately 14%.
Table 3.
Impact of nitrogen doses (N) and fertilization systems (FS) on winter oilseed rape productivity, seed yield, and canopy nitrogen mass at the beginning of flowering (F) and harvest (H).
Figure 2.
Variations in winter rapeseed seed yield in response to the experimental factors. Columns sharing a common letter do not differ significantly according to Tukey’s test. Error bars represent the standard error of the mean for each treatment. Abbreviations: AN, ammonium nitrate; D, digestate.
According to the stepwise regression analysis results, when analyzed in relation to its basic yield components, the seed yield was significantly driven by the number of seeds per m2 produced by the secondary branch inflorescences (SeSB). Yield variability depended on the variability of this crop trait to the extent of 81% (Table S4). Moreover, SeSB responded to the tested experimental factors in a manner analogous to SEY (Table 3). This biometric trait of rapeseed strongly influenced the total number of seeds per m2 (TSeNo; r = 0.996; Table S4), while the effect of seed number on the main inflorescence/branch (SeMB) on TSeNo was significant but weaker (r = 0.54 **; Table S4). The TSeNo was almost the same under the D-FS as for the AN-FS (−1.2%), with the lower SeSB value for the D-FS (−2.6%) not differing significantly from that for the AN-FS. This result stems from the higher number of seeds on the main inflorescence (SeMB) under the D-FS (+8.2%, statistically non-significant). The type of N carrier had a strong influence on SeSB (Figure 3); furthermore, the initial N dose significantly influenced the value of this trait, regardless of the N carrier. A stronger response was observed for the AN-FS than the D-FS, with increases of 123% and 71%, respectively. Under the AN-FS, the upward trend relative to the N rate was clearly evident at the 180 kg N ha−1 plot. Under the D-FS, the upward trend was progressive with N rates, up to the 180 kg N ha−1 level. For this reason, a better fit of the experimental data to the quadratic regression model was found for the D-FS compared to the AN-FS (R2 values of 0.82 and 0.995, respectively; Figure S2). The resulting regression models exhibited the following key characteristics: (i) the maximum SeSB values were 62,432 and 60,954 seeds m−2, respectively; and (ii) the optimal N rates were 152.5 and 212.4 kg N ha−1, respectively.
Figure 3.
Seed number per m2 as affected by the interaction of fertilization system (FS) and nitrogen dose (N). Columns sharing a common letter do not differ significantly according to Tukey’s test. Error bars represent the standard error of the mean for each treatment. Abbreviations: AN, ammonium nitrate; D, digestate.
The effects of N mass in the rapeseed crop at the beginning of flowering (NAF, BBCH 61) and at harvest (NAH, BBCH 89/90) on both SEY and SeSB were significant, where the coefficient of determination (R2) was significantly higher for NAH (0.94) than for NAF (0.55). NAF showed significant responses to both the experimental factors and their interaction (Table 3). Similarly to SEY and SeSB, the N masses at the analyzed rapeseed growth stages decreased by 34% and 42% in the dry 2017/2018 season compared to the 2016/2017 season. In addition, the average NAF under the D-FS was significantly lower (−14.4%) when compared to the AN-FS; however, NAH did not significantly differ between the FSs. At the beginning of rapeseed flowering, the AN-FS outperformed the D-FS at every N dose (Figure 4a), where the difference between the FSs was greatest for the 180 kg N ha−1 plot (+40%). A quadratic regression model provides the best description of rapeseed’s nitrogen accumulation patterns during early flowering (Figure S3). The maximum N mass reached 213 and 161.2 kg N ha−1 under the AN-FS and D-FS, which were obtained at N rates of 159.7 and 188.3 kg N ha−1, respectively. Compared to the beginning of flowering, the rapeseed canopy N mass at harvest (NAH) was higher during the first growing season but lower in subsequent seasons. NAH showed a significant increase in the treatment with 60 kg N ha−1 when compared to the control treatment. A significant advantage of the D-FS over the AN-FS was evident only for the plot with 240 kg N ha−1 (Figure 4b). The N mass for both FSs closely follows a quadratic trend with the same predictive value (R2 = 0.95) (Figure S4). However, the cardinal values of both models showed significant differences. The maximum N mass (NAFmax) values were 193.9 and 201.2 kg N ha−1, achieved at an optimal N rate (Nop) of 160.8 and 213 kg N ha−1 under the AN-FS and D-FS, respectively.
Figure 4.
Effects of the interaction between the fertilization system (FS) and nitrogen dose (N) on nitrogen mass in winter oilseed at (a) the beginning of flowering (NAF) and (b) physiological maturity (NAH). Columns sharing a common letter do not differ significantly according to Tukey’s test. Error bars represent the standard error of the mean for each treatment. Abbreviations: AN, ammonium nitrate; D, digestate.
The yield-forming value of N accumulated by rapeseed in both critical stages of growth was determined using the unit productivity (NAP) index (Table 3). NAPF held a performance advantage only during the opening season; thereafter, NAPH consistently led the field. A significant difference favoring the D-FS was observed only for NAPF (+19.6%). No significant effect of N dose on this index was found. Furthermore, their values were very similar, amounting to 17.4 ± 4.5 and 17.1 ± 1.4 kg of seed per 1 kg of N at the beginning of flowering and at harvest, respectively. The interaction between experimental factors was significant only for the NAPF (Figure 5). Nitrogen unit productivity followed a completely different pattern for the studied FSs. Under the AN-FS, it decreased in accordance with increasing N dose up to 180 kg N ha−1. In contrast, for the D-FS, it increased and reached its maximum at the 120 and 180 kg N ha−1 doses. For the AN-FS, the lowest productivity was 14.5 kg of seeds per kg of N, obtained at an N dose of 132.2 kg ha−1; conversely, for the D-FS, the maximum N productivity was 20.3 kg of seeds per kg of N at an N dose of 154.7 kg ha−1 (Figure S5).
Figure 5.
The interactive effect of fertilization system (FS) and nitrogen dose (N) on accumulated nitrogen productivity in winter oilseed rape at early flowering. Columns sharing a common letter do not differ significantly according to Tukey’s test. Error bars represent the standard error of the mean for each treatment. Abbreviations: AN, ammonium nitrate; D, digestate.
3.2. Nutrient Mass in Critical Stages of Yield Formation by Rapeseed
At the beginning of flowering, the nutrient mass in the winter rapeseed canopy showed high sensitivity to both experimental factors and annual seasonal variations (Table 4). Seed yield (SEY), seed number per m2 developed on secondary inflorescences (SeSB), and N mass at the stage of physiological maturity (NAH) were found to be determined by the interaction of N and Ca. The resulting models, developed using stepwise regression, are as follows:
Table 4.
Nutrient mass in winter oilseed rape canopy at the beginning of flowering (NAF) in response to nitrogen doses and fertilization systems (FSs).
Both diagnostic nutrients responded significantly to the interaction between the fertilization system (FS) and N dose (ND). In the set of equations presented above, the mass of N was in shortage, while the mass of Ca was in excess. The effect of the FS on Ca mass was highly specific (Figure A1); in particular, under the AN-FS, Ca mass increased in accordance with N dose up to 180 kg ha−1, subsequently stabilizing. In contrast, under the D-FS, the Ca mass remained stable regardless of the N dose (Figure S6). Consequently, the gap in Ca mass (ΔCa) widened as the N rate increased, as expressed by the following equation:
While Ca mass was significantly correlated with N/NAF and Zn, these relationships were weak (Table S5). Stepwise regression analysis for the N amount in the rapeseed canopy at the beginning of flowering (NAF), which was discussed in the previous section (Figure 4), indicated that NAF was determined (and, in fact, limited) by the contents of magnesium (Mg) and zinc (Zn). The resulting model is as follows:
It follows unequivocally from the above equation that a low mass of both of these nutrients significantly limited the N amount in the rapeseed canopy at the BBCH 61 stage. Mg was very strongly associated with K (r = 0.96 ***) and strongly correlated with N (r = 0.85) (Table S5). However, no significant correlation was found with Ca or any micronutrient aside from Cu (r = 0.64 ***). In contrast, the amount of Zn in rapeseed canopy was strongly associated with Mn and N, and moderately correlated with the other nutrients, excluding Mg (Table S5).
The masses of nutrients in the rapeseed canopy at physiological maturity (NAH) showed very high sensitivity to the experimental factors. They were all subject, with exception of Ca, to seasonal variation; that is, they were influenced by the year factor (Table 5). The key characteristics of rapeseed at this stage—such as SEY, SeSB, and NAH—showed specific responses to the assessed nutrients. The models derived via stepwise regression are as follows:
Table 5.
Nutrient mass in winter oilseed rape canopy at physiological maturity (NAH) in response to nitrogen doses and fertilization systems (FSs).
As indicated by the coefficient of determination (R2) values, the predictive value of nutrient masses at physiological maturity, with the exception of SeSB, were significantly higher than those noted at the onset of flowering. The models indicated that the masses of N exerted a strong impact on SEY. The N mass at this stage (NAH), as discussed in the previous section (Figure 4), showed strong correlations with all analyzed nutrients (Table S6). Within this set, K and Cu proved to be critical, with an increase in the mass of either nutrient leading to an increase in NAH. These masses also responded significantly to the FS × D interaction (Table 5).
The average potassium (K) mass in the rapeseed was slightly (and significantly) higher under the D-FS (+7.4%). It showed slightly greater variation under the AN-FS compared to the D-FS (CVs of 21.6% and 12.7%, respectively). A significant difference compared to the N control was observed, starting with the 60 kg N ha−1 dose (Figure A2a). Clear superiority of the D-FS over the AN-FS was evident at the 120 and 240 kg N ha−1 doses, with differences of 30 and 51 kg K ha−1, respectively. The K mass at the BBCH 89 stage was very strongly associated with N and Zn (Table S6). For this reason, the general model for K mass was analogous to that for N, as discussed previously. The cardinal values of K models for the studied FSs showed significant differences. The maximum K mass (Kmax) values were 238.2 and 269.3 kg K ha−1, achieved at optimal N rates (Nop) of 154.7 and 180.1 kg N ha−1 under the AN-FS and D-FS, respectively (Figure S7). The mass of Zn at rapeseed harvest was very strongly associated with N, P, and Cu (r ≥ 0.90 ***), and only slightly less strongly correlated with K and Mn (r = 0.88 ***) (Table S6). The strong correlation between Zn and K reflects a similar trend of Zn accumulation in relation to the N dose. This pattern was fully confirmed, and the superiority of the D-FS was observed at the 180 and 240 kg N ha−1 doses (Figure A2b). The maximum Zn mass (Znmax) values were 234.9 and 244.7 g Zn ha−1, achieved at the optimal N rates (Nop) of 157.1 and 194.7 kg N ha−1 for the AN-FS and D-FS, respectively (Figure S8).
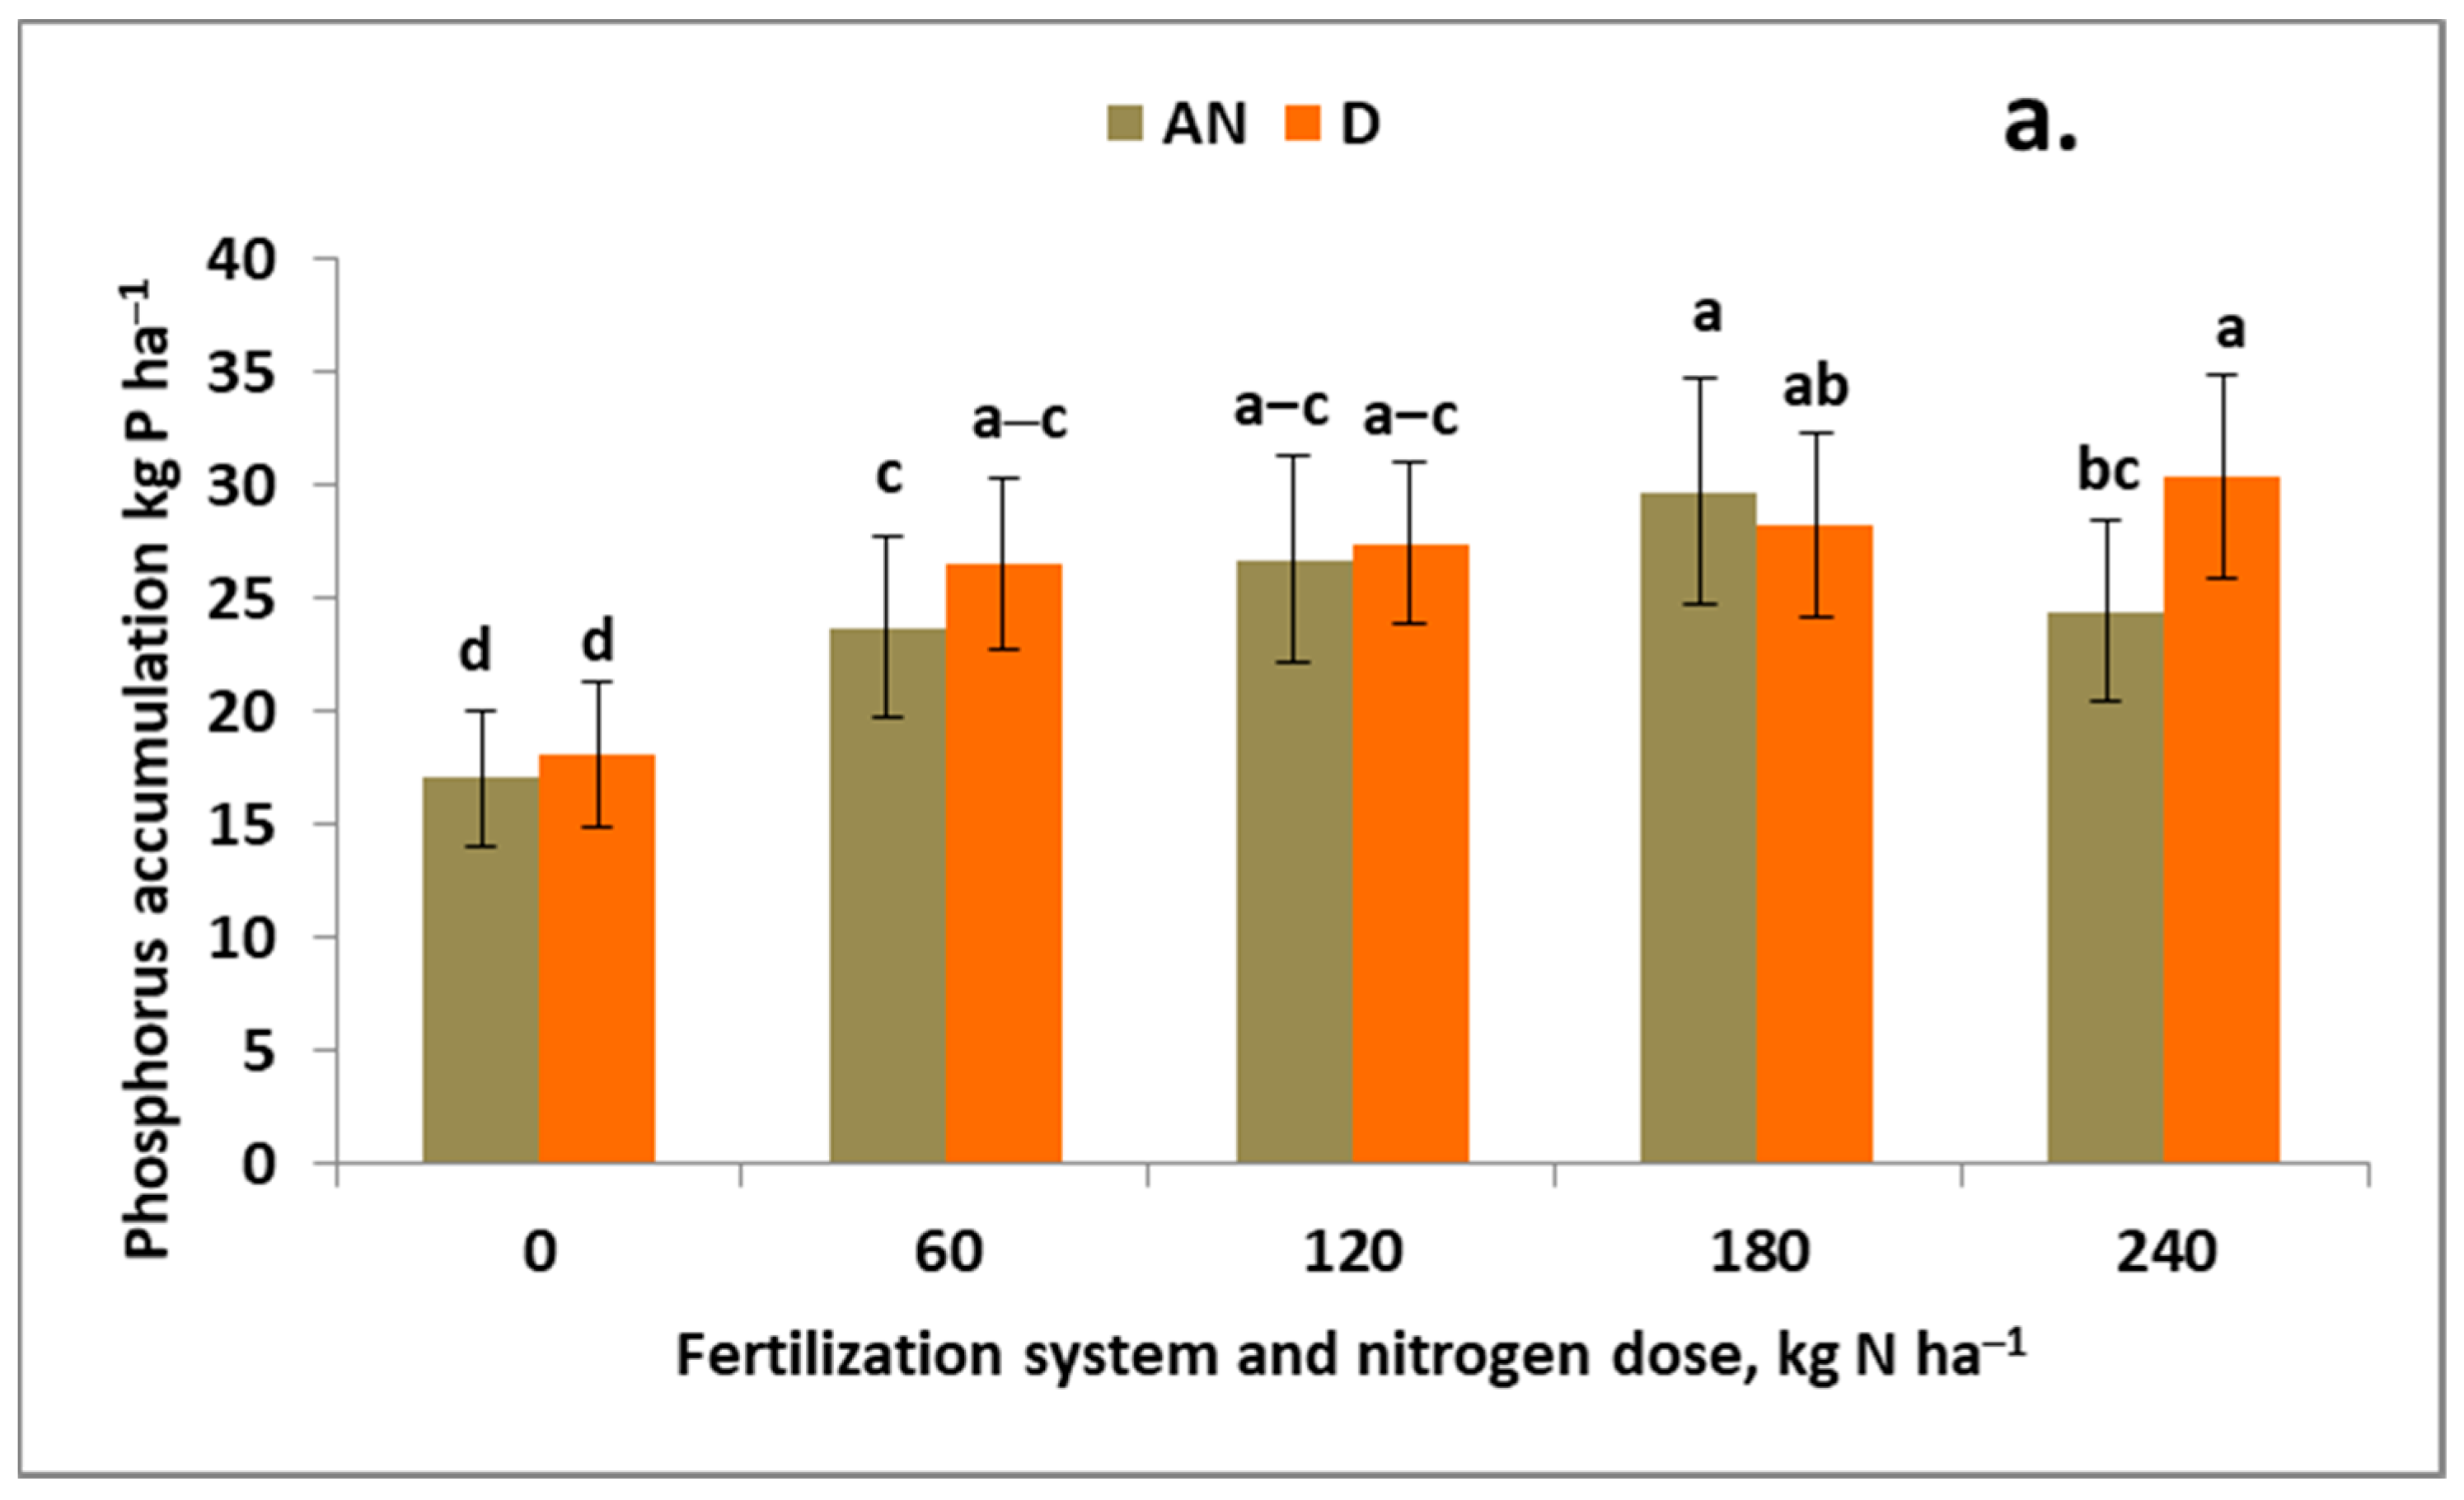
Stepwise regression analysis revealed that the mass of phosphorus (P) in rapeseed at harvest (PAH) was the critical factor influencing SeSB. The effect of N dose on this trait depended on the type of N carrier. Increasing the AN application rate up to 180 kg N ha−1 led to a corresponding rise in PAH, whereas with digestate (D), it increased progressively with increasing N dose. With the exception of the 180 kg N ha−1 plot, higher PAH was recorded with digestate (Figure A3a). The critical values for P mass, as derived from the regression models, varied depending on the FS. These maximum values reached 28.4 and 30.0 kg ha−1, which were achieved at optimal N rates (Nop) of 157.4 and 210 kg N ha−1, respectively (Figure S9).
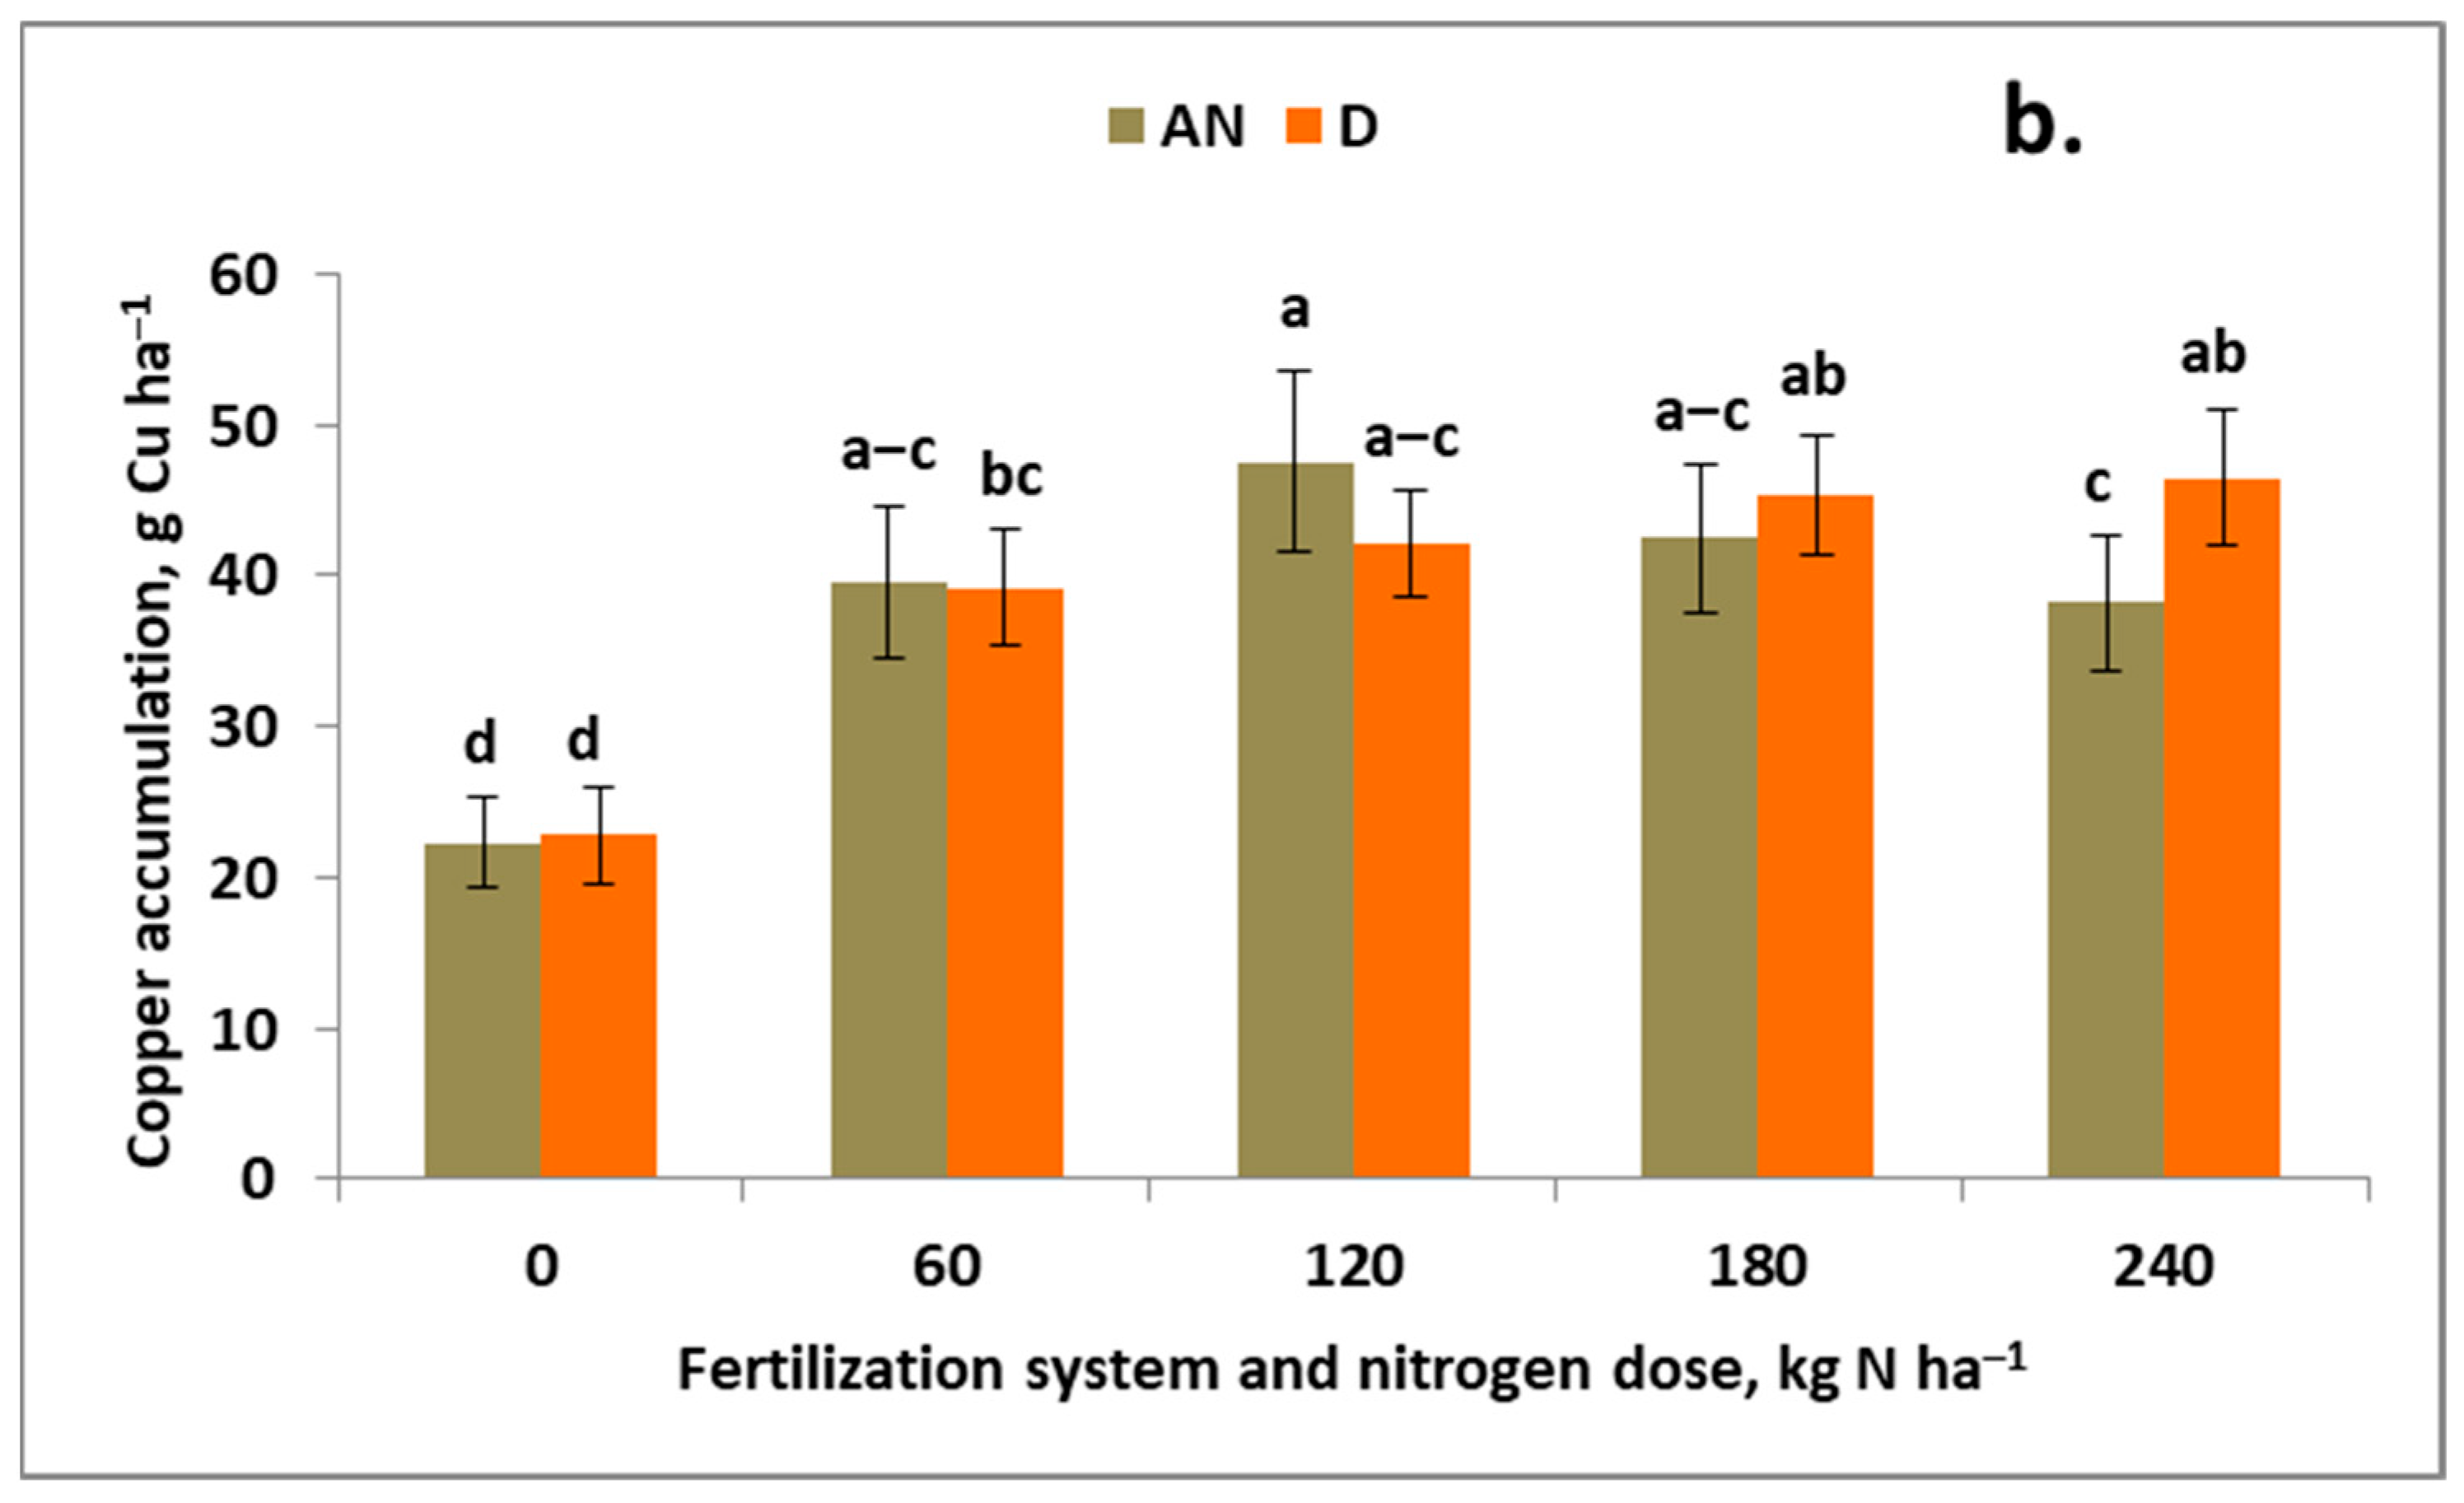
Copper mass at harvest (CuAH) responded differently to increasing nitrogen (N) rates depending on the fertilization system (FS). (Figure A3b). The dominance of the AN-FS was evident only at the 120 kg N ha−1 dose. In contrast, CuAH increased progressively with the N dose under the D-FS, and exceeded that under the AN-FS at the highest N dose. The regression models, obtained by fitting a quadratic function, showed identical maximum Cu masses (Cumax), albeit at different N doses. These Cumax values were 47.0 and 46.8 g Cu ha−1, which were achieved at optimal N doses (Nop) of 147.7 and 194.2 kg N ha−1, respectively (Figure S10).
3.3. Indices of Nutrient Utilization by the Rapeseed Canopy in the Reproductive Period
The nutrient economy in WOSR during the reproductive growth period (S-FP) was evaluated via a balance analysis. In the mass analysis of nutrient economy in the crop canopy—where time acts as a factor that determines a specific accumulation trend—a positive nutrient balance indicates a loss of mass; that is, a depletion of the nutrient within the plant. Conversely, a negative value of nutrient balance indicates an increase in the mass of the nutrient within the crop canopy. The key factor influencing this balance is the plant’s net uptake. Each of the analyzed nutrients showed net uptake for at least one growing season (Table 6). Of the nine elements analyzed, three (P, Mg, and Mn) showed net uptake in every growing season, regardless of weather conditions. Among this set of nutrients, significant and strong correlations with SEY and the main yield traits (SeSB, NAF, and NAH) were observed for P, moderate correlations for Mn, and no correlation for Mg. The P and Mn balances were very strongly correlated with each other (r = 0.80 ***) (Table S7). All nutrients in this set responded significantly to the Y × FS × N interaction, but did not prove to be predictors of yield or the main traits (Table 6). The stepwise regression analysis results clearly revealed that net Cu uptake (ΔCu) was the most important predictor in this regard. The resulting models are presented below.
Table 6.
Nutrient mass balance (Δ) in winter oilseed rape canopy during reproductive growth in response to fertilization systems and nitrogen doses.
The negative sign associated with Cu throughout the equations indicates that its net uptake by plants during the S-FP determined the WOSR traits driving seed yield, and consequently, yield itself. The Cu balance was subject only to the Y × N interaction. During the first two growing seasons, ΔCu increased in accordance with N doses up to 120 kg N ha−1 (Table 6). The Cu balance was strongly correlated with ΔP (r = 0.87 ***) and ΔZn (r = 0.88 ***) and—somewhat less strongly but still highly significantly—with the balances of N, Mg, and Ca (Table S7). Within this set of nutrients, the relationship between the P balance and the Cu and Zn balances warrants particular attention. P was the dominant component, with a negative ΔP value (i.e., net uptake) observed in every growing season (Table 6).
The N balance (ΔN) appeared in two out of the four regression models presented above and showed a response to the relation between experimental factors. The change in N balance values in response to increasing N rates followed completely different trends for the studied FSs (Figure 6). The ΔN under the AN-FS was positive, indicating a loss of N mass during the S-FP. In contrast, under the D-FS, the ΔN values were negative, indicating net accumulation (i.e., N uptake) during the S-FP. The ΔN values only fit a quadratic regression model for the AN-FS, with a ΔNmax of 23.1 kg ha−1 achieved at Nop of 154 kg N ha−1. For the D-FS, ΔN values decreased progressively with increasing N dose, indicating net N uptake (Figure S11). ΔN was significantly and strongly associated with ΔK (r = 0.84 ***) and ΔCa (r = 0.75 ***); moderately correlated with ΔCu (r = 0.66 ***); and weakly correlated with ΔP and ΔZn. No significant correlations were observed with the Mg, Fe, and Mn balances (Table S7).
Figure 6.
Influence of fertilization system (FS) and nitrogen dose (N) interactions on winter oilseed nitrogen balance during the seed-filling stage. Columns sharing a common letter do not differ significantly according to Tukey’s test. Error bars represent the standard error of the mean for each treatment. Abbreviations: AN, ammonium nitrate; D, digestate.
The second indicator of nutrient economy in the rapeseed canopy during the S-FP is the remobilization quantity (RQ), an indicator reflecting the quantity of vegetative plant biomass that has seemingly “disappeared” or increased during the specified time interval. Notably, a portion of this biomass is transferred to the plant’s seed-generative parts. The values of this index showed a significant response to the relation between experimental factors and the year factor (Table 7). The stepwise regression analysis results enabled the identification of a set of nutrients (N, K, Cu) that are critical for yield-determining traits in WOSR, as well as seed yield itself. The resulting models are as follows:
Table 7.
Nutrient remobilization quantity (NuRQ) in winter oilseed rape canopy during reproductive growth in response to nitrogen doses and fertilization systems (FSs).
The remobilization quantities (RQs) for N and Cu were not significantly correlated with each other (Table S8).
The amount of remobilized N (NRQ) from the vegetative parts of rapeseed during the S-FP was the highest in the second growing season; in relative terms, it was nearly twice as high as in the first season and more than one-third higher than in the third season. The NRQ, when averaged across the experimental factors, showed higher values under the AN-FS when compared to the D-FS (+39.5%) (Table 7). The difference between the treatments increased with the N dose up to 180 kg N ha−1 (Figure 7a). At this dose, the NRQ value was 64 kg N ha−1 higher for the AN-FS (+73.5%) relative to the D-FS. The general trend of N remobilization is most accurately modeled using a quadratic regression. (Figure S12). The NRQmax values were 139.3 and 89.2 kg N ha−1 for the AN-FS and D-FS, respectively, and the Nop values were similar, amounting to 156 and 158 kg N ha−1, respectively. The NRQ was strongly correlated with NAF (r = 0.86 ***) and weakly, but significantly, correlated with SeSB (r = 0.48 *). Furthermore, NRQ exhibited a strong correlation with K (r = 0.7 ***), alongside moderate correlations with P and Mg and weak correlations with Ca and Zn (Table S8).
Figure 7.
Effect of the relation between the fertilization system (FS) and nitrogen dose (N) on the remobilization quantity of (a) nitrogen and (b) copper in winter oilseed during the seed-filling period. Columns sharing a common letter do not differ significantly according to Tukey’s test. Error bars represent the standard error of the mean for each treatment. Abbreviations: AN, ammonium nitrate; D, digestate.
Regarding Cu, remobilization was only observed in the third growing season; in the other growing seasons, its net uptake from the soil predominated (Table 7). On average, net Cu uptake during the S-FP was more than twice as high under the D-FS compared to the AN-FS (+150%). The effect of N dose on CuRQ was highly stable for the D-FS but unstable for the AN-FS (Figure 7b). For the D-FS, the trend of CuRQ with respect to N dose was linear and positive, with the highest value recorded on the 240 kg N ha−1 plot (Figure S13). In contrast, for the AN-FS, very low index values were observed on plots with doses of 60 and 180 kg N ha−1, while values that were several times higher were observed for plots with doses of 120 and 240 kg N ha−1. Among the analyzed nutrients, Cu showed strong correlations with P and Zn (r = 0.77 *** and r = 0.75 ***), while no significant correlation was observed with either N or K (Table S8).
K remobilization took place during the second and third growing seasons. In the third season, it reached one-third of the level observed in the second season. Net K uptake was recorded only in the first season (Table 7). The response of KRQ to the N dose varied significantly, depending on the FS (Figure S14). Under the AN-FS, its values rose up to 120 kg N ha−1 and subsequently declined, whereas strong, significant fluctuations were observed under the D-FS. Net K uptake was observed only on the plot with 60 kg N ha−1; on the other plots, K remobilization predominated. Apart from the N control, these values were comparatively very low.
Phosphorus presents an interesting case. At physiological maturity, net P uptake (ΔP) was a significant limiting factor for the studied WOSR traits, and consequently for yield (Table S7). The ΔP value was negative in every growing season, indicating net uptake from the soil. The largest uptake was noted in 2016/2017, while the smallest was recorded in 2017/2018 (Table 6). ΔP was significantly correlated with other indices, with the strongest correlations (r > 0.9 ***) observed with the Cu, Zn, and N balances (Table S6). In the S-FP, P also underwent remobilization, which was greatest in the dry year of 2018 and minimal in 2016. These results are opposite to those obtained for ΔP (Table 6 and Table 7). As shown in Figure 8, net P remobilization amounted to 6.8 kg ha−1 in the absence of net uptake from the soil during the S-FP stage; with zero remobilization of this nutrient, net uptake was 18.4 kg N ha−1.
Figure 8.
The dependence of the remobilized quantity of phosphorus on its balance during the seed-filling period of winter oilseed rape growth.
4. Discussion
The analysis of sink–source relationships provides a tool for understanding yield formation strategies in crop plants [46,47]. In WOSR, this situation is complex, as the final yield formation process—that is, the seed-filling period (S-FP)—extends for approximately 10 weeks [48]. It has been demonstrated that the key factor driving seed yield in this crop during the S-FP is the N mass, which determines pod set and the growth of seeds within the pod [23,49]. The following discussion aims to explain the reasons for the lack of significant differences in WOSR yields—a parameter determined according to the seeds per m2—between N fertilization systems based on the use of ammonium nitrate (AN) and digestate (D).
4.1. Key Factors Determining Seed Yield
The year-to-year variability in WOSR yields depends heavily on the specific growing season’s weather conditions. The high sensitivity of rapeseed to weather conditions is a consequence of weather-related stresses during the inflorescence formation stage (BBCH 40–59) and the S-FP [1,12]. Consequently, in the 2017/2018 season—which was stressful for the plants due to drought—the average seed yield was only 60% of that achieved under optimal growing conditions. The seasonal yield trend mirrored national results, albeit at a higher level [50]. The yields obtained at least doubled in response to N fertilization, highlighting the pivotal role of N fertilization [51,52]; for example, the 77% increase in yield at a dose of 60 kg N ha−1 compared to the control treatment clearly indicates the key role of N fertilization [10].
The lack of a significant difference in the yield-forming effect when comparing digestate N to the standard N source for winter rapeseed (i.e., mineral N fertilizer) can be explained by processes occurring during the S-FP. It is an indisputable fact that N plays a dominant role in yield formation in winter oilseed rape, both prior to flowering and during the stem elongation and flowering phases [10,14,15]. During the pre-flowering stages, rapeseed plants take up N intensively, as it is an essential nutrient for both the growth of lateral shoots and the formation of inflorescences and pods on those shoots [21]. In this study, the pattern of N accumulation in rapeseed at the beginning of flowering differed significantly depending on the N carrier. Fertilization with ammonium nitrate (AN) resulted in higher N accumulation in the crop (≈210 kg N ha−1), with an optimal N dose of 160 kg ha−1. In comparison, rapeseed fertilized with digestate accumulated 25% less N (≈160 kg N ha−1), despite a higher Nop rate (188 kg N ha−1). The observed pattern regarding the effect of the form of applied N on the timing of maximum N mass in the WOSR canopy is analogous to that reported by Barłóg and Grzebisz [18]; in their study, the factor shifting the timing of maximum N accumulation to the S-FP was the presence of Ca in the N fertilizer (calcium nitrate, calcium–ammonium nitrate). A characteristic phenomenon recorded under the AN-FS in this study was a net decrease in the N mass in the S-FP compared to that at the beginning of flowering; this phenomenon was most pronounced for the treatment with 180 kg N ha−1, amounting to 45 kg N ha−1 (dN = −45 kg N ha−1). Net losses of N are caused by the shedding of leaves, as well as the youngest inflorescences and developing pods. In WOSR, the magnitude of N losses during the S-FP—regardless of the N dosage—has previously been reported to range from 23% to 39% of the total uptake [53]. These values are significantly higher than those presented in this study (21%). A contrasting pattern of N dynamics during the S-FP was observed under the digestate fertilization system (D-FS); namely, instead of a decline in N mass, a net increase (ΔN) was observed—one that progressed across the entire range of N doses. This is illustrated by the following equation:
The observed trend of progressive N accumulation during the S-FP significantly influenced the plants’ productivity, expressed here as unit productivity (NAPF). A significant reduction in this parameter was observed under the AN-FS; meanwhile, a completely different phenomenon occurred under the D-FS. Across the entire range of the applied N doses, unit productivity was higher under the D-FS, reaching almost 43% higher for the treatment with 180 kg N ha−1.
4.2. Nutrients Controlling the Action of N During the S-FP
At the onset of flowering, the nutritional traits determining the number of pods per m2 and seed yield were defined according to the masses of five nutrients: N and Ca (as key nutrients), as well as K, Mg, and Zn (as N-supporting nutrients). At the stage of physiological maturity, N mass was determined by K and Cu. K warrants special attention as, throughout the entire S-FP, its mass in the rapeseed biomass exceeded the mass of accumulated N. The K:N ratio remained at a level of 1.3:1 in both critical growth stages, despite variability associated with the N application rate. Moreover, this ratio was independent of the form of N fertilization. Therefore, the observed relationship should be regarded as a stable, characteristic trait of WOSR that determines high seed yields [19,54]. The yield-promoting effect of K is linked to the pivotal role of K+ ions in the plant’s uptake of nitrate nitrogen (NO3-N) [55]. When soil is rich in available K and high doses of mineral N, which promote nitrate formation in the soil, the vegetative mass of the oilseed rape tends to grow at an accelerated rate [56,57]. This phenomenon was observed specifically under the AN-FS, with the greatest increases occurring at lower N doses. However, higher rapeseed biomass during the pre-flowering period did not always result in an increased number of seeds per m2, particularly those produced by lateral shoots. Szczepaniak [15,20] has previously documented this process, linking excessive accumulation of K and N in the rapeseed canopy at the beginning of flowering with a reduction in pods setting on the lateral shoots. The cause of this phenomenon was reported to be an excess of vegetative mass (specifically, foliage) relative to the mass of the lateral shoots. Under the D-FS, a completely different trend in N and K accumulation was observed at the stage in question in response to increasing N dose; in particular, the observed pattern was similar to that observed in rapeseed canopies fertilized with urea, as well as cases involving the foliar application of Mg or microelements [58]. Foliar application of Mg or microelements has been shown to lead to an increase in pods setting and the number of seeds per m2; this increases the physiological sink (i.e., number of pods) for assimilate absorption, leading to an increase in yield [14].
At the onset of flowering, the negative impact of Ca accumulation on NAH and SeSB—and ultimately on seed yield—became apparent. This phenomenon was caused by drought during the 2017/2018 season, with Ca accumulation during the dry growing season being nearly twice that observed in the optimal 2015/2016 season. The increase in Ca mass led to a reduction in Mg mass first, followed by a decrease in K mass. In the dry year compared to the optimal 2016/2017 season, Mg mass decreased threefold while K mass decreased twofold. However, this phenomenon predominated under the AN-FS treatment, whereas digestate application stabilized the Ca mass regardless of the N application rate. Therefore, the antagonism between these nutrients is unequivocal. Higher concentrations of calcium cations in the soil are known to disrupt ion uptake and impair their long-distance transport within the plant [59,60,61]. A physiological consequence is the disruption of N metabolism, which drives the processes responsible for assimilate production in winter rapeseed during the critical flowering stage of the growing season; our research reveals that digestate slowed down this process. Narrowing of the Ca:N ratio serves as an indicator of the abovementioned disruption in N metabolism [62,63]. The Ca:N ratio, averaged over the studied experimental factors, was 0.5:1 in optimal years, whereas it was 1:1 in the dry year. The mean values of this ratio at the beginning of the flowering phase were 1:0.75 under the AN-FS and 1:0.47 under the D-FS, thus emphasizing the ameliorative effect of the digestate. This ratio, which is based solely on annual averages, was found to be an ideal predictor of seed yield. This relationship is described by the following equation:
A narrow Ca:N ratio proved to be beneficial for the plant. Calcium plays crucial roles in the formation of mechanical tissue in lateral shoots and pods, as well as in pod photosynthesis [64].
4.3. Indicators of Nutrient Economy During the S-FP
Effective management of N during the “yield finalization” mega-phase is a major challenge in winter rapeseed production [65]. The mechanisms of action of two different N sources—namely, ammonium nitrate (AN) and digestate (D)—were ultimately elucidated during the S-FP. An analysis of the nutrient balance between the onset of flowering and physiological maturity revealed specific patterns in how the nine studied nutrients responded to the N source. Generally, this set of nutrients falls into two main types. The first type comprised those for which net uptake occurred in the S-FP, regardless of weather conditions during the growing season. This set of nutrients included P, Mg, and Mn. Phosphorus (P) requires special attention, not least because its interaction with Mg is crucial for N uptake; furthermore, both of these nutrients are essential for the transport of assimilates during the formation of pods and seeds [66]. The study results clearly demonstrated that drought conditions at the time of the formation of key yield components resulted in reductions in the masses of major macronutrients. This reduction was most drastic for P, whose soil uptake by rapeseed during the S-FP was found to be highly sensitive to both weather conditions and the experimental factors. The highest P uptake occurred in growing seasons with optimal weather conditions. Drought reduced it to a minimum, but did not stop it completely. A reduction in net P uptake during the S-FP results in severe disruption of the yield-formation process [67]. The 50% reduction in SeSB observed in the dry 2017/2018 season compared to the optimal 2016/2017 season supports the proposed explanation for the diminished yield in the 2017/2018 growing season. Although digestate application increased net P uptake in the S-FP by 20%, whether this stems from a direct or indirect effect of the digestate on soil processes that increase the pool of available P remains unclear [68].
Trends in P accumulation—specifically, P uptake in the S-FP—were closely linked to trends in the net uptake of micronutrients, particularly Cu and Zn. These relationships were linear in nature, where increased P net balance (i.e., P uptake) stimulated the uptake of both elements and vice versa (Figure 9). Stronger correlations were observed for Zn; simultaneously, the net uptake of this nutrient by rapeseed plants under the D-FS was 2.5 times higher than that under the AN-FS. Therefore, P uptake serves as an indirect indicator of the digestate’s effect on micronutrient availability in the treated soil. Notably, the two nutrients above-mentioned are essential for efficient photosynthesis in both leaves and siliques, thereby influencing seed development [22,63].
Figure 9.
Phosphorus balance during the seed-filling period of winter oilseed rape growth as a factor determining micronutrient (zinc and copper) balance.
Unlike all other nutrients, soil uptake of Mg was higher in the dry year than in years with optimal weather conditions; however, this process did not directly affect either yield-determining WOSR traits or the yield itself. The results indicated that the Mg mass in rapeseed at the onset of flowering significantly determined N accumulation. The results obtained in this study confirm the positive results of previous field experiments involving soil and/or foliar application of these nutrients, particularly regarding Mg [58,69].
4.4. Impact of Nitrogen Carriers on Plant Nitrogen Yield-Forming Actions
Based on two groups of WOSR characteristics affected by the type of N carrier—namely, (i) N economy and (ii) the economy of nutrients supporting N during the S-FP—two N yield-forming strategies can be distinguished. The first group is characterized by (i) trends in N mass during the S-FP, (ii) the productivity of N accumulated at the onset of flowering, and (iii) no significant difference in seeds setting per m2 and seed yield. The second group comprises nutrients that showed greater net uptake in the S-FP under the D-FS, which includes P and certain micronutrients. As discussed above, increased P uptake was found to stimulate the uptake of Cu and Zn (Figure 9). Moreover, Cu uptake increased linearly with the N dose under the D-FS. Digestate application also resulted in a significant, specific ameliorative effect, showing no increase in Ca mass in response to increasing N dose; conversely, such an interaction was observed under the AN-FS. However, on average, the observed phenomena did not lead to any differentiation in the number of seeds per m2 on lateral shoots—or consequently in yield—between the considered N carriers.
The obtained results make it possible to determine strategies driving the yield-forming action of N, depending on the type of carrier. The first strategy—the effectiveness of which depends on a positive interaction between weather conditions (year) and the nutritional status of plants—was observed under the ammonium nitrate (AN) FS. Under such conditions, saturation of the rapeseed canopy with N occurred just prior to WOSR flowering. This model is fully consistent with the Rapeseed Canopy N Saturation Model described by Szczepaniak [15,20]. The insufficient conversion of N taken up by plants into yield components results from a disruption in the balance between vegetative mass (specifically, leaves) and the mass of flowering shoots [10,15]. This model of mineral fertilizer N action can thus be defined as the “Nitrogen Saturation Strategy” (NSS). As discussed above, this strategy does not work well on sites with medium soil fertility [23].
A completely different pattern of N dynamics was observed when digestate served as the N source. N accumulation occurred concurrently with the process of yield structure formation in the S-FP. Therefore, it can be defined as the “Nitrogen Sustainable Economy Strategy” (NSES). This strategy stems from at least two mutually complementary processes. The first is the control of N remobilization during the S-FP by K (R2 = 0.97). It was found that the increased amount of K released from the WOSR canopy during the S-FP resulted in greater N remobilization. This process stems from a fundamental function of K: the transport of assimilates via the phloem to new organs, including seeds [55]. The second group of processes relates to P dynamics, which significantly influence the uptake of Zn and Cu from the soil during the S-FP. As a result of these phenomena, N productivity in the rapeseed crop at the beginning of flowering was considerably higher in the digestate-treated plot than in that fertilized with AN. These phenomena, which can be termed the “digestate-N paradox”, resulted in a lack of difference in yield between the plots treated with these two N sources. The NSES likely also applies to other N fertilizers, such as those that contain calcium (e.g., calcium ammonium nitrate) or sulfur [10,18]. The NSES can also be used in farming practice through the regulation of N dynamics—either through the inclusion of other nutrients in the N carrier or via the foliar application of Mg, S, and/or micronutrients shortly before the beginning of WOSR flowering [14,70].
5. Conclusions
The insufficient conversion of N accumulated by the rapeseed crop at the onset of flowering into seed yield confirms the insufficient effectiveness of mineral N as a nitrogen carrier for this crop. In this context, the efficiency of mineral N can be enhanced by enriching the N carrier (i.e., fertilizer) with secondary nutrients (Ca, S) and/or the foliar application of macro- and micronutrients. An alternative approach is to incorporate by-products from the agri-food processing industry—such as spent wash from distilleries, which is rich in N mineral and organic N—into the fertilization system. In agricultural biogas plants, digestate is produced as a by-product during the anaerobic processing of organic waste. The use of such by-products requires appropriate agronomic logistics (e.g., regarding the timing and method of application) in order to minimize N losses to the atmosphere. An advantage of digestate is that the specific N composition of this carrier, comprising both mineral and organic forms, aligns with strategies for highly efficient yield-promoting N utilization in WOSR. Furthermore, studies have confirmed that digestate readily fits into models of sustainable agricultural production.
Supplementary Materials
The following supporting information can be downloaded at: https://www.mdpi.com/article/10.3390/agronomy16212238/s1, Figure S1: Weather conditions during successive growing seasons against the long-term background (meteorological station in Szczecin); Figure S2: Dependence of the seed density (SD) of winter oilseed rape on nitrogen doses against the background of two fertilization systems (FSs). Figure S3: Dependence of the nitrogen mass accumulated by winter oilseed rape canopy at the beginning of flowering on nitrogen doses against the background of two fertilization systems (FSs); Figure S4: Dependence of the nitrogen mass accumulated by winter oilseed rape canopy at harvest on nitrogen doses against the background of two fertilization systems (FSs); Figure S5: Dependence of the nitrogen productivity index at the beginning of flowering on nitrogen doses against the background of two fertilization systems (FSs); Figure S6: Dependence of the calcium accumulation by winter oilseed canopy at the beginning of flowering on nitrogen doses against the background of two fertilization systems (FSs); Figure S7: Dependence of the potassium accumulation by winter oilseed canopy at harvest on nitrogen doses against the background of two fertilization systems (FSs); Figure S8: Dependence of the zinc accumulation by winter oilseed canopy at harvest on nitrogen doses against the background of two fertilization systems (FSs); Figure S9: Dependence of the phosphorus accumulation by winter oilseed canopy at harvest on nitrogen doses against the background of two fertilization systems (FSs); Figure S10: Dependence of the copper accumulation by winter oilseed canopy at harvest on nitrogen doses against the background of two fertilization systems (FSs); Figure S11: Dependence of the nitrogen balance in winter oilseed canopy during the seed-filling period on nitrogen doses against the background of two fertilization systems (FSs); Figure S12: Dependence of the nitrogen remobilization quantity in winter oilseed canopy during the seed-filling period on nitrogen doses against the background of two fertilization systems (FSs); Figure S13: Dependence of the copper remobilization quantity in winter oilseed canopy during the seed-filling period on nitrogen doses against the background of two fertilization systems (FSs); Figure S14: Potassium remobilization quantity in winter oilseed canopy during the seed-filling period on nitrogen doses against the background of two fertilization systems (FSs). Table S1: The topsoil physical and chemical properties in subsequent growing seasons; Table S2: The content of available nutrients in soil layers in subsequent years of study; Table S3: Chemical composition of digestate used as nitrogen fertilizer; Table S4: Correlation matrix between seed yield, yield components and nitrogen mass in canopy of winter oilseed rape and its productivity at the onset of anthesis (F) and harvest (H); Table S5: Correlation matrix of the nutrient mass in the winter oilseed rape at the beginning of flowering and its relationships with yield and crop traits; Table S6: Correlation matrix of the nutrient mass in the winter oilseed rape at harvest and its relationships with yield and crop traits; Table S7: Correlation matrix of the nutrient mass balance in the winter oilseed rape during reproductive growth and relationships with yield and yield components; Table S8: Correlation matrix of the nutrient remobilization quota (NRQ) during reproductive growth and relationships with yield and yield components.
Author Contributions
Conceptualization, W.G. and R.Ł.; methodology, W.G.; software, R.Ł.; validation, W.G. and R.Ł. and M.B.; formal analysis, R.Ł.; investigation, R.Ł. and M.B.; resources, R.Ł.; data curation, M.B.; writing—original draft preparation, R.Ł.; writing—review and editing, W.G.; visualization, M.B.; supervision, W.G.; project administration, M.B. All authors have read and agreed to the published version of the manuscript.
Funding
This research received no external funding.
Data Availability Statement
The original contributions presented in the study are included in the article/Supplementary Materials, and further inquiries can be directed to the corresponding author.
Conflicts of Interest
The authors declare no conflicts of interest.
Appendix A
Figure A1.
Effect of the interaction between the fertilization system (FS) and nitrogen dose (N) on calcium accumulation by winter oilseed rape at the beginning of flowering. Columns sharing a common letter do not differ significantly according to Tukey’s test. Error bars represent the standard error of the mean for each treatment. Abbreviations: AN, ammonium nitrate; D, digestate.
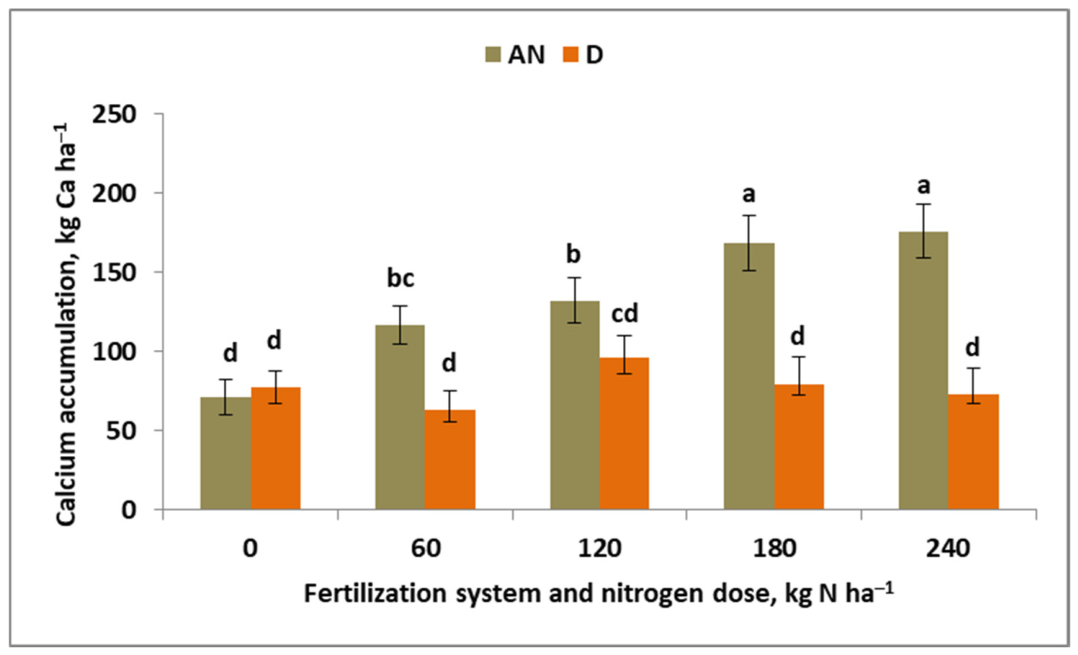
Figure A2.
Effect of the interaction between the fertilization system (FS) and nitrogen (N) rates on potassium (a) and zinc (b) accumulation in winter oilseed rape canopy at harvest. Columns sharing a common letter do not differ significantly according to Tukey’s test. Error bars represent the standard error of the mean for each treatment. Abbreviations: AN, ammonium nitrate; D, digestate.
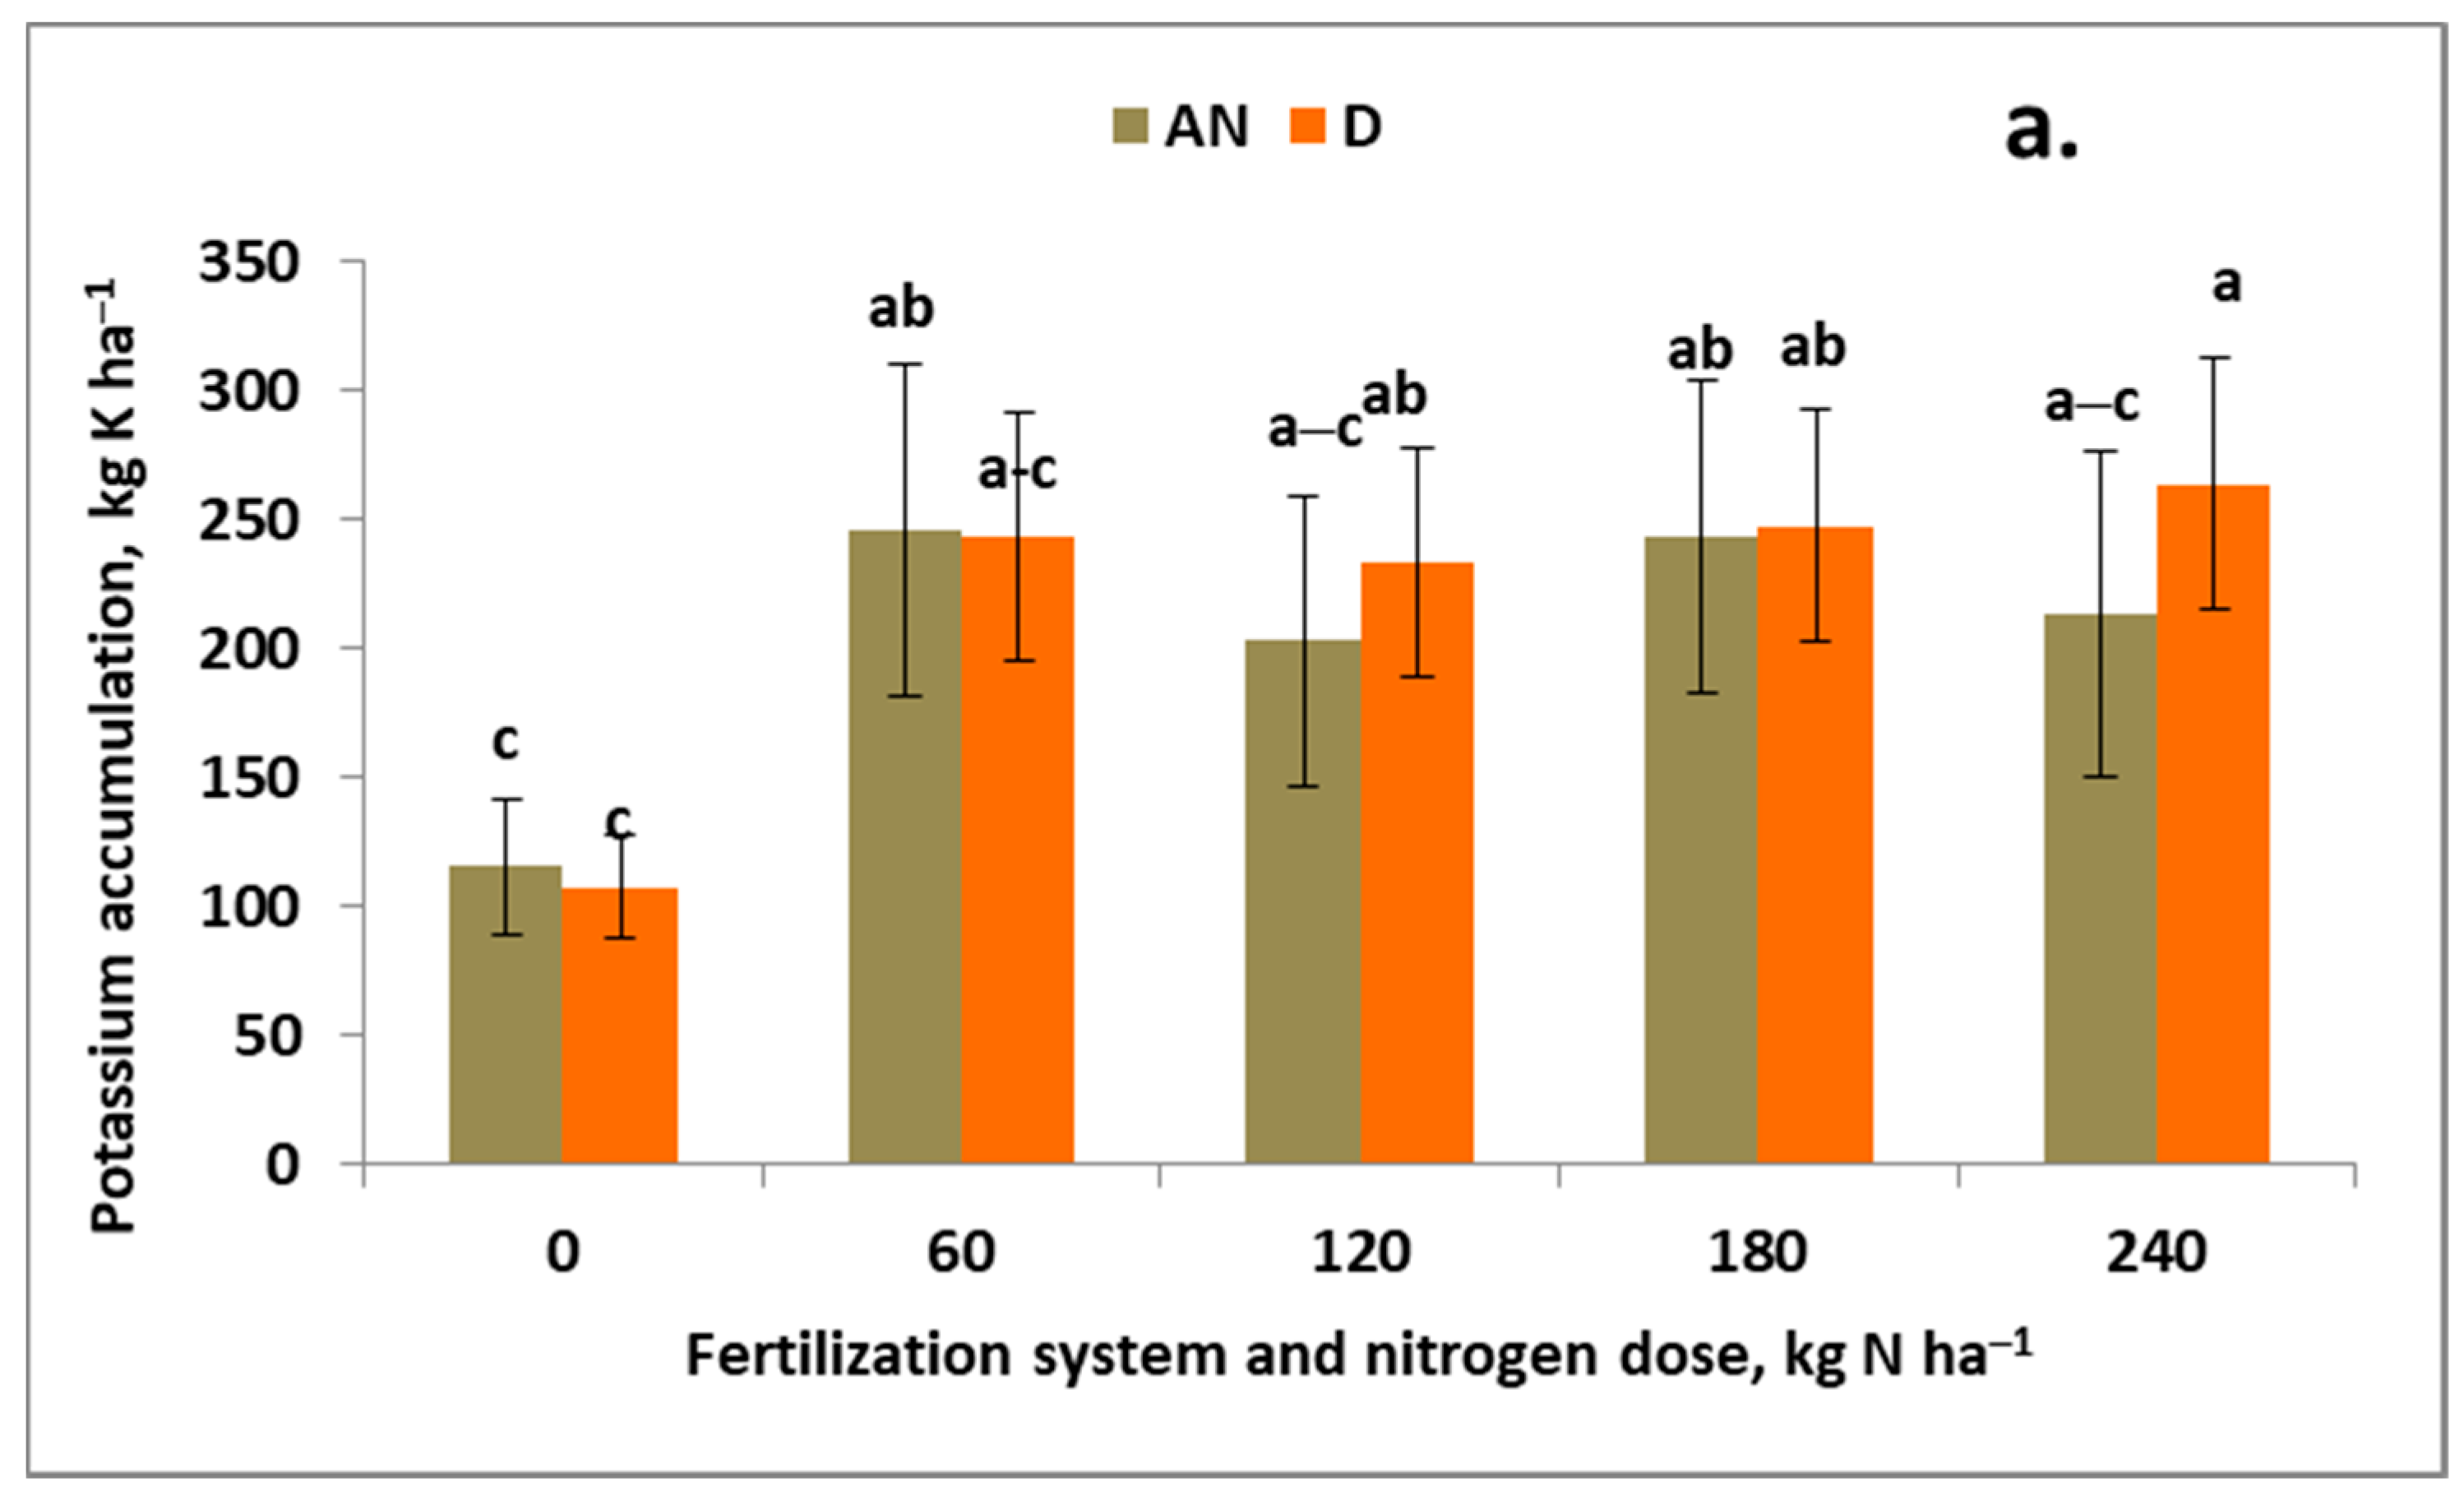
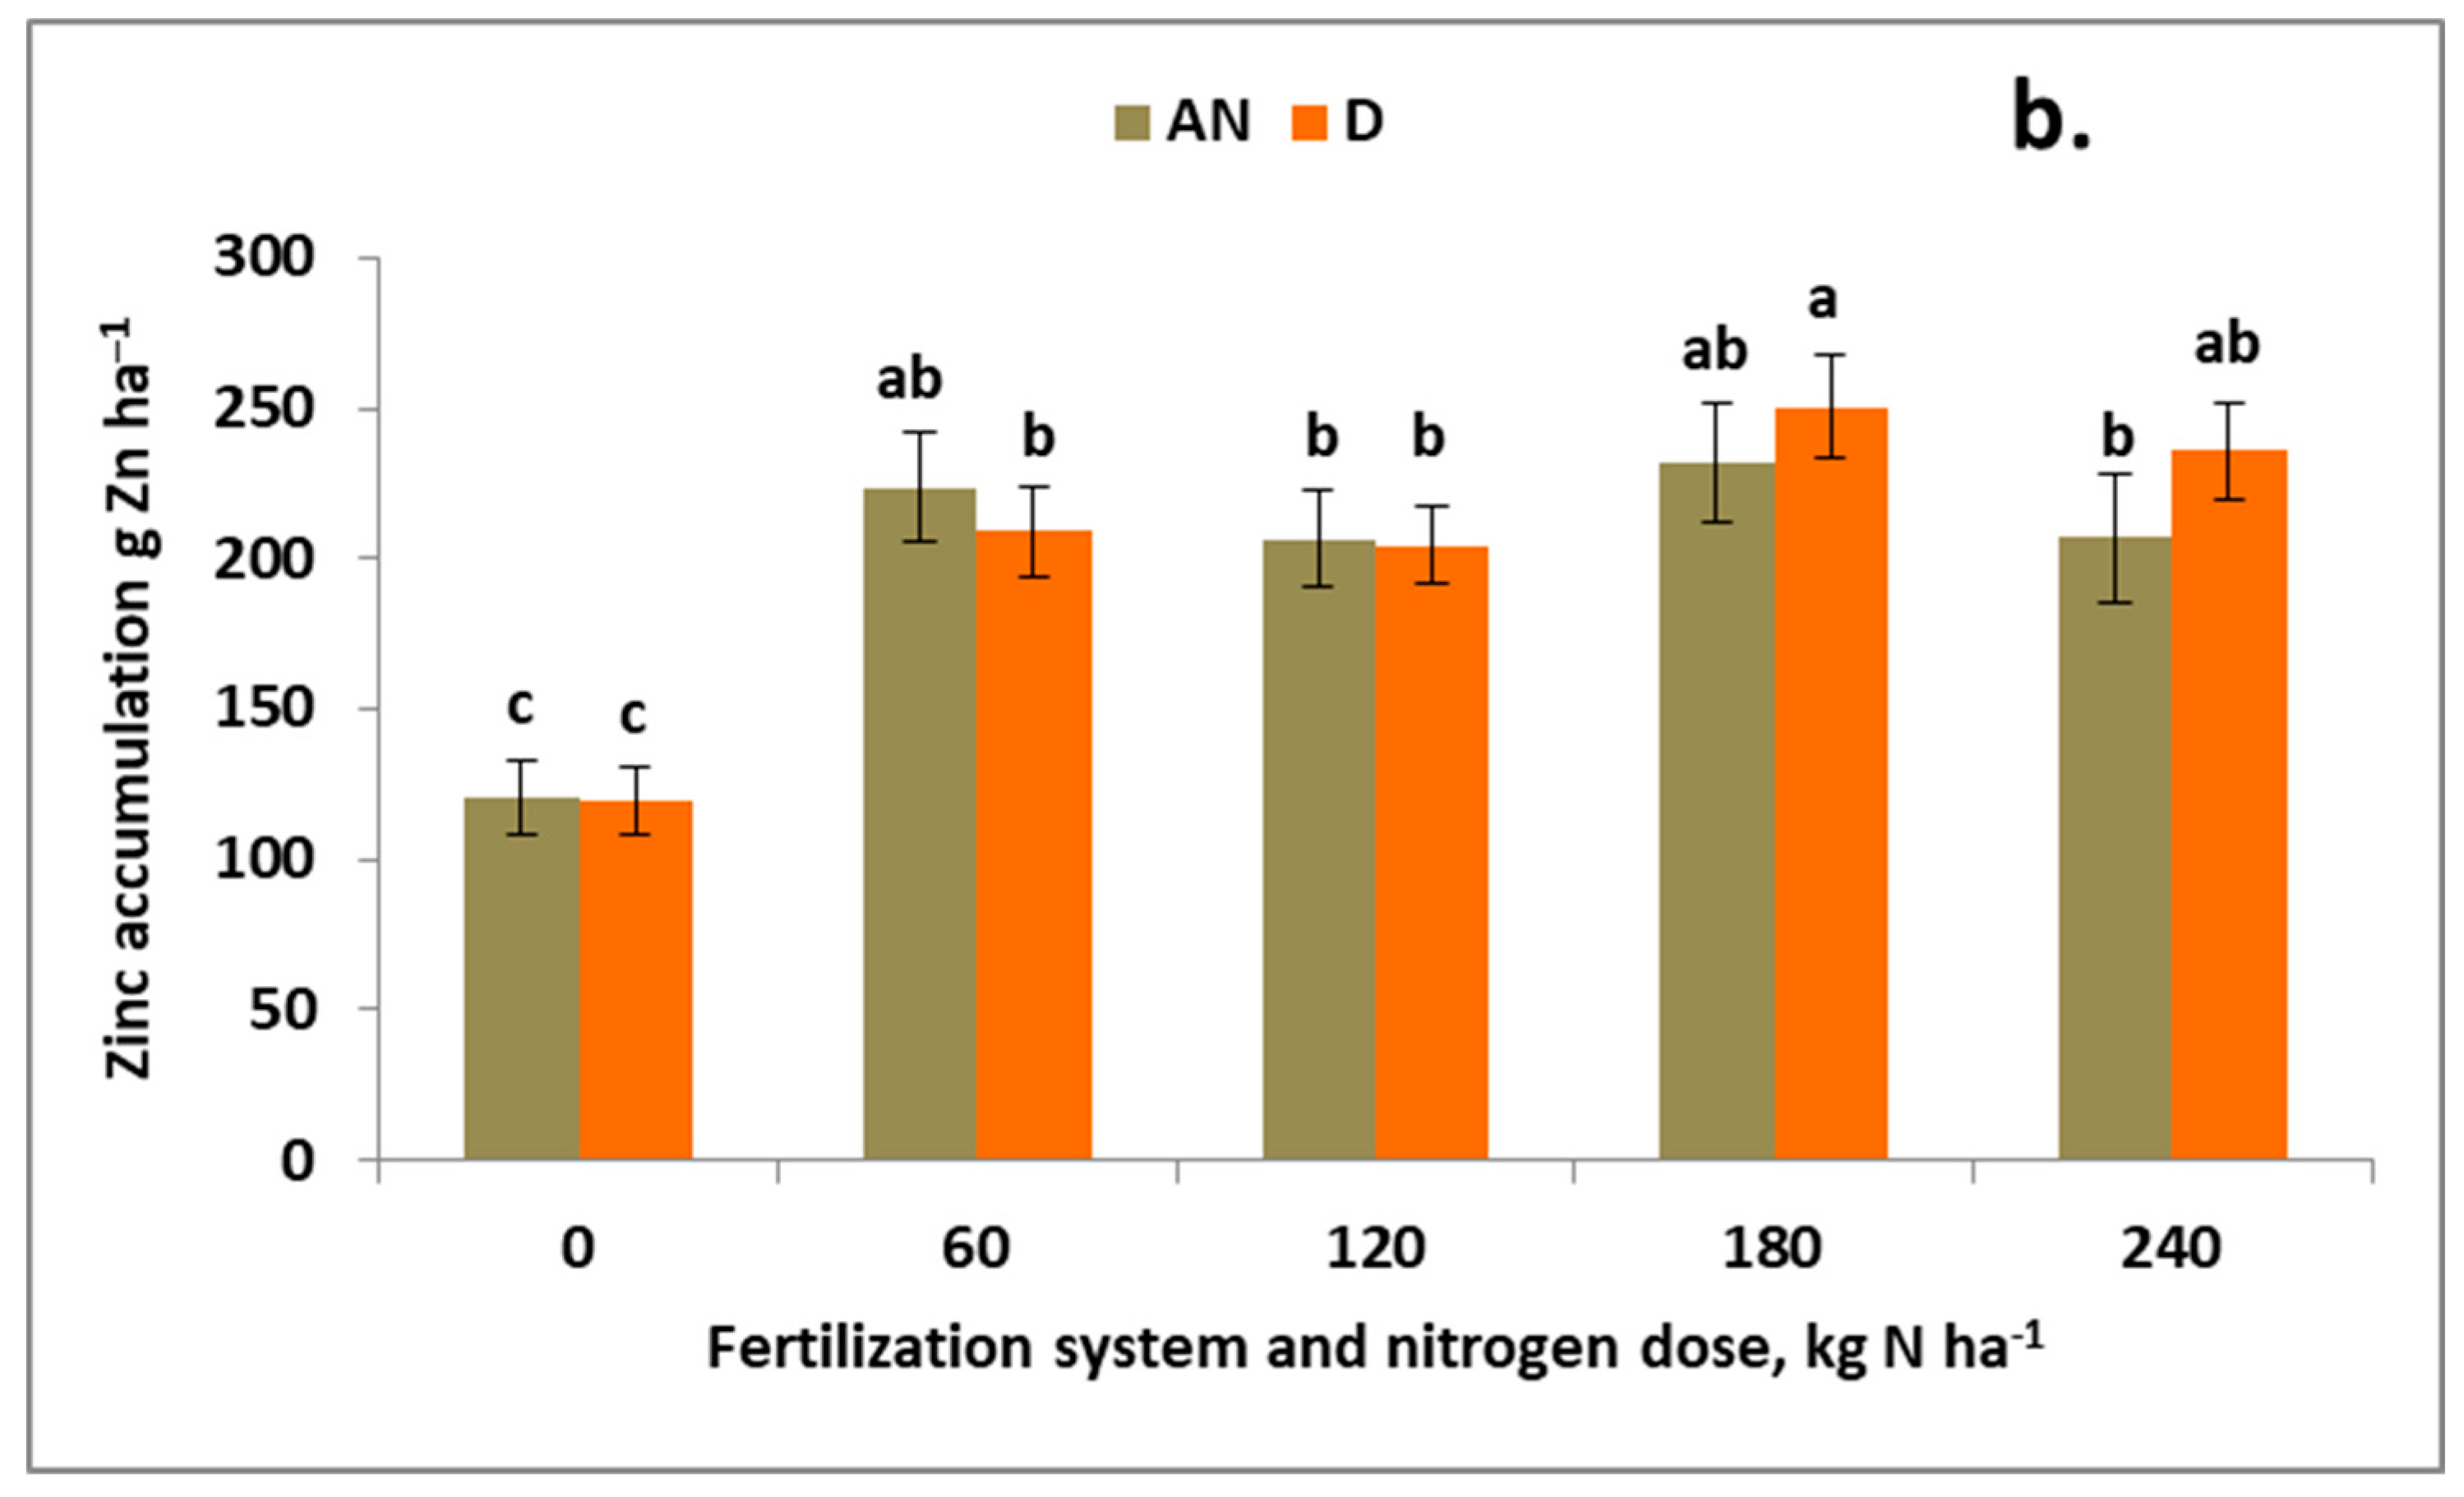
Figure A3.
Effect of the interaction between the fertilization system (FS) and nitrogen dose (N) on phosphorus (a) and copper (b) accumulation in winter oilseed rape canopy at harvest. Columns sharing a common letter do not differ significantly according to Tukey’s test. Error bars represent the standard error of the mean for each treatment. Abbreviations: AN, ammonium nitrate; D, digestate.
References
- Pullens, J.W.M.; Sharif, B.; Trnka, M.; Balek, J.; Semenov, M.A.; Olesen, J.E. Risk factor for European winter oilseed rape production under climate change. Agric. For. Meteor. 2019, 272–273, 30–39. [Google Scholar] [CrossRef] [Scilit]
- Shi, Y.; Zhu, Q.; Zhu, M.; Jiang, N.; Ren, L.; Lou, Y. Impact of climate change on the climatic suitability of oilseed rape (Brassica napus L.) planting in Jiangsu Province, China. Agriculture 2025, 15, 1900. [Google Scholar] [CrossRef] [Scilit]
- FAOSTAT. Food and Agriculture Organization of the United Nations. Available online: https://faostat.fao.org/site/567/default.aspx#ancor (accessed on 25 August 2026).
- Zając, T.; Klimek-Kopyra, A.; Oleksy, A.; Lorenc-Kozik, A.; Ratajczak, K. Analysis of yield and plant traits of oilseed rape (Brassica napus L.) cultivated in temperate region in light of the possibilities of sowing in arid areas. Acta Agrobot. 2016, 69, 1696. [Google Scholar] [CrossRef] [Scilit]
- Holmes, M.R.J. Nutrition of the Oilseed Rape Crop; Applied Science Publishers LTD: London, UK, 1980; 158p. [Google Scholar]
- Bartkowiak-Broda, I.; Jankowski, K. Oil plants. In Plant Culltivation; Kotecki, A., Ed.; Wyd. UP: Wrocław, Poland, 2020; Volume III, pp. 297–383. [Google Scholar]
- White, P.J.; Broadley, M.R. Calcium in plants. Ann. Bot. 2003, 92, 487–511. [Google Scholar] [CrossRef] [Scilit] [PubMed]
- Grzebisz, W.; Diatta, J.; Kaźmierowski, C.; Szczepaniak, W. Strategies for controlling acidity of arable soils—Sustainable liming systems. Agronomy 2026, 16, 483. [Google Scholar] [CrossRef] [Scilit]
- Sienkiewicz-Cholewa, U.; Kieloch, R. Effect of suphur and micronutrients fertilization on yield and fat content in winter rape seeds (Brassica napus L.). Plant Soil Environ. 2015, 61, 164–170. [Google Scholar] [CrossRef] [Scilit]
- Grzebisz, W.; Szczepaniak, W.; Grześ, S. Sources of nutrients for high-yielding winter oilseed rape (Brassica napus L.) during post-anthesis growth. Agronomy 2020, 10, 626. [Google Scholar] [CrossRef] [Scilit]
- Böttcher, U.; Rampin, E.; Hartmann, K.; Zanetti, F.; Flenet, F.; Morison, M.; Kage, H. A phenological model of winter oilseed rape according to the BBCH scale. Crop Pasture Sci. 2016, 67, 345–358. [Google Scholar] [CrossRef] [Scilit]
- Weymann, W.; Bottcher, U.; Sieling, K.; Kage, H. Effects of weather conditions during different growth phases on yield formation of winter oilseed rape. Field Crop. Res. 2015, 173, 41–48. [Google Scholar] [CrossRef] [Scilit]
- Mácová, K.; Prabhullachandran, U.; Štefková, M.; Spyroglou, J.; Pěnčik, A.; Endlová, L.; Novák, O.; Robert, H.S. Long-term high-temperature stress impacts embryo and seed development in Brassica napus. Front. Plant Sci. 2022, 13, 844292. [Google Scholar] [CrossRef] [Scilit] [PubMed]
- Szczepaniak, W.; Grzebisz, W.; Potarzycki, J.; Łukowiak, R.; Przygocka-Cyna, K. Nutritional status of winter oilseed rape in cardinal stages of growth as yield indicator. Plant Soil Environ. 2015, 61, 291–296. [Google Scholar] [CrossRef] [Scilit]
- Szczepaniak, W. A mineral profile of oilseed rape in critical stages of growth—Nitrogen. J. Elem. 2014, 19, 759–778. [Google Scholar] [CrossRef] [Scilit]
- Wang, Y.; Liu, T.; Li, X.; Ren, T.; Cong, R.; Lu, J. Nutrient deficiency limits population development, yield formation and nutrient uptake of direct sown winter oilseed rape. J. Integr. Agric. 2015, 14, 670–680. [Google Scholar] [CrossRef] [Scilit]
- Barłóg, P.; Grzebisz, W. Effect of timing and nitrogen fertilizer application on winter oilseed rape (Brassica napus L.). I. Growth dynamics and seed yield. J. Agron. Crop Sci. 2004, 190, 305–313. [Google Scholar] [CrossRef] [Scilit]
- Barłóg, P.; Grzebisz, W. Effect of timing and nitrogen fertilizer application on winter oilseed rape (Brassica napus L.). II. Nitrogen uptake dynamics and fertilizer efficiency. J. Agron. Crop Sci. 2004, 190, 314–323. [Google Scholar] [CrossRef] [Scilit]
- Barraclough, P.P. Root growth, macro-nutrient uptake dynamics and soil fertility requirements of a high-yielding winter oilseed rape crop. Plant Soil 1989, 119, 59–70. [Google Scholar] [CrossRef] [Scilit]
- Szczepaniak, W. The mineral profile of winter oilseed rape in critical growth stages—Potassium. J. Elem. 2014, 19, 203–215. [Google Scholar] [CrossRef] [Scilit]
- Malagoli, M.; Laine, P.; Rossato, L.; Ourry, A. Dynamics of nitrogen uptake and mobilization in field-grown winter oilseed rape (Brassica napus L.) from stem extension to harvest. I. Global N flows between vegetative and reproductive tissues in relations to leaf fall and their residual N. Ann. Bot. 2005, 95, 853–861. [Google Scholar] [CrossRef] [Scilit] [PubMed]
- Wang, X.; Mathieu, A.; Cournede, P.H.; Allirand, J.M.; Jullien, A.; de Reffye, P.; Zhang, B.G. Variability and regulation of the number of ovules, seeds, and pods according to assimilate availability in winter oilseed rape (Brassica napus L.). Field Crops Res. 2011, 122, 60–69. [Google Scholar] [CrossRef] [Scilit]
- Łukowiak, R.; Grzebisz, W. Effect of site specific nitrogen management on seed nitrogen—A driving factor of winter oilseed rape (Brassica napus L.) yield. Agronomy 2020, 10, 1364. [Google Scholar] [CrossRef] [Scilit]
- Gutser, R.; Ebertseder, T.; Weber, A.; Schraml, M.; Schmidhalter, U. Nitrogen release from organic fertilizers after short and long-term application to arable land. J. Plant Nutr. Soil Sci. 2005, 168, 439–446. [Google Scholar] [CrossRef] [Scilit]
- Makadi, M.; Tomocsik, A.; Orosz, V. Digestate: A new nutrient source—A review. In Biogas; Kumar, S., Ed.; InTech: Hong Kong, China, 2012; pp. 295–312. [Google Scholar]
- Barłóg, P.; Hlisnikovský, L.; Kunzová, E. Effect of digestate on soil organic carbon and plant-available nutrient content compared to cattle slurry and mineral fertilization. Agronomy 2020, 10, 379. [Google Scholar] [CrossRef] [Scilit]
- Doyeni, M.O.; Stulpinaite, U.; Baksinskaite, A.; Supronienie, S.; Tilvikiene, V. The effectiveness of digestate use for fertilization in an agricultural cropping system. Plants 2021, 10, 1734. [Google Scholar] [CrossRef] [Scilit] [PubMed]
- Siebielec, S.; Siebielec, G.; Woźniak, M. Potential of by means of digestate to regenerate and stimulate its biological life. Pol. J. Agron. 2023, 52, 157–170. [Google Scholar]
- Różyło, K.; Andruszczak, S.; Kwiecińska-Poppe, E.; Różyło, R.; Kraska, P. Effect of three years’ application of biogas digestate and mineral waste to soil on phytochemical quality of rapeseed. Pol. J. Environ. Stud. 2019, 28, 833–843. [Google Scholar] [CrossRef] [Scilit] [PubMed]
- Koszel, M.; Parafiniuk, S.; Szparaga, A.A.; Bochniak, A.; Kocira, S.; Zdravkov Atanasov, A.; Kovalyshyn, S. Impact of Digestate Application as a Fertilizer on the Yield and Quality of Winter Rape Seed. Agronomy 2020, 10, 878. [Google Scholar] [CrossRef] [Scilit]
- PTGleb. Particle size distribution and textural classes of soils and mineral materials–classification of Polish Society of Soil Sciences. Soil Sci. Ann. 2008, 60, 5–16. (In Polish) [Google Scholar]
- ISO 11277; Soil Quality–Determination of Particle Size Distribution in Mineral Soil Material. Method by Sieving and Sedimentation. ISO: Geneva, Switzerland, 2009.
- Miś, F. Thermal and precipitation conditions during the thermal growing season in Central and Northern Europe. Acta Geophys. 2016, 74, 18. [Google Scholar]
- Houba, V.J.G.; Temminghoff, E.J.M.; Gaikhorst, G.A.; van Vark, W. Soil analysis procedures using 0.01 M calcium chloride as extraction reagents. Commun. Soil Sci. Plant 2000, 31, 1299–1396. [Google Scholar] [CrossRef] [Scilit]
- PN-EN ISO 13395: 2001; Water Quality—Determination of Nitrate and Nitrate Nitrogen and Their Sum by Flow Analysis (CFA and FIA) with Spectrophotometric Detection. Polski Komitet Normalizacyjny: Warsaw, Poland, 2001.
- Fotyma, E.; Fotyma, M.; Pietruch, C. The content of mineral N in arable soils in Poland. Fertil. Fertil. 2004, 3, 11–54. [Google Scholar]
- PN-EN ISO 10523:2012; Water Quality–Soil PH Determination. Polski Komitet Normalizacyjny: Warsaw, Poland, 2012.
- PN-EN 27888:1999; Water Quality–Determination of Electrical Conductivity. Polski Komitet Normalizacyjny: Warsaw, Poland, 1999.
- Sumner, M.E.; Miller, W.P. Cation exchange capacity and exchange coefficients. In Methods of Soil Analysis: Part 3—Chemical Methods; Sparks, D.L., Page, A.L., Helmke, P.A., Loeppert, R.H., Soltanpour, P.N., Tabatabai, M.A., Johnston, C.T., Sumner, M.E., Eds.; Soil Science Society of America: Madison, WI, USA, 1996; pp. 1201–1229. [Google Scholar]
- Shuman, L.M.; Duncan, R.R. Soil exchangeable cations and aluminum measured by ammonium chloride, potassium chloride, and ammonium acetate. Comm. Soil Sci. Plant Anal. 1990, 21, 1217–1228. [Google Scholar] [CrossRef] [Scilit]
- Mehlich, A. Mehlich 3 soil test extractant: A modification of Mehlich 2 extractant. Commun. Soil Sci. Plant Anal. 1984, 15, 1409–1416. [Google Scholar] [CrossRef] [Scilit]
- Kęsik, K. Application of the Mehlich 3 method in the fertilizer advisory system. Stud. I Rap. IUNG-PIB 2016, 48, 95–104. (In Polish) [Google Scholar]
- Trávník, K.; Zbíral, J.; Němec, P. Agrochemical Soil Testing—Mehlich III; Central Institute for Supervising and Testing in Agriculture: Brno, Czech, 1999. (In Czech) [Google Scholar]
- Zbíral, J. Determination of plant-available micronutrients by the Mehlich 3 soil extractant—A proposal of critical values. Plant Soil Environ. 2016, 62, 527–531. [Google Scholar] [CrossRef] [Scilit]
- Shrestha, N. Detecting multicollinearity in regression analysis. Am. J. Appl. Math. Stat. 2020, 8, 39–42. [Google Scholar] [CrossRef] [Scilit]
- Körner, C. Paradigm shift in plant growth control. Curr. Opin. Plant Biol. 2015, 25, 107–114. [Google Scholar] [CrossRef] [Scilit] [PubMed]
- Smith, M.R.; Rao, I.M.; Merchant, A. Source-sink relationships in crop plants and their influence on yield development and nutritional quality. Front. Plant Sci. 2018, 9, 1889. [Google Scholar] [CrossRef] [Scilit]
- Diepenbrock, W. Yield analysis of winter oilseed rape (Brassica napus L.): A review. Field Crops Res. 2000, 67, 5–49. [Google Scholar] [CrossRef] [Scilit]
- Szczepaniak, W.; Łukowiak, R.; Klikocka, H. Impact of organic digestate on soil and crop nitrogen during critical periods of winter oilseed rape growth. Agronomy 2026, 16, 959. [Google Scholar] [CrossRef] [Scilit]
- Rozkrut, D. Statistical Yearbook of Agriculture—Poland; GUS: Warszawa, Poland, 2025; 431p. [Google Scholar]
- Berry, P.M.; Spink, J.; Foulkes, M.J.; White, P.J. The physiological basis of genotypic differences in nitrogen use effciency in oilseed rape (Brassica napus L.). Field Crops Res. 2010, 119, 365–373. [Google Scholar] [CrossRef] [Scilit]
- Rutkowska, A. Productivity of winter oilseed rape depending on its nitrogen and water use efficiency. Pol. J. Agron. 2019, 39, 10–15. [Google Scholar]
- Bodin Dresboll, D.; Skovby Rasmussesn, I.; Thorup-Kristensen, K. The significance of litter loss and root growth on nitrogen efficiency in normal and semi-dwarf winter oilseed rape genotypes. Field Crops Res. 2016, 186, 166–178. [Google Scholar] [CrossRef] [Scilit]
- Szczepaniak, W.; Barłóg, P.; Łukowiak, R.; Przygocka-Cyna, K. Effect of balanced nitrogen fertilization in four-year rotation on plant productivity. J. Cent. Eur. Agric. 2013, 14, 64–77. [Google Scholar] [CrossRef] [Scilit]
- Marschner, H.; Kirkby, E.A.; Cackmak, J. Effect of mineral nutritional status on shoot-root partitioning of Photo-assimilates and cycling of mineral nutrients. J. Exp. Bot. 1996, 47, 1255–1263. [Google Scholar] [CrossRef] [Scilit] [PubMed]
- Ren, T.; Lu, J.; Hui, L.; Zou, J.; Xu, H.; Liu, X.; Li, X. Potassium-fertilizer management in winter oilseed-rape production in China. J. Plant Nutr. Soil Sci. 2013, 176, 429–440. [Google Scholar] [CrossRef] [Scilit]
- Pan, Y.; Lu, Z.; Lu, J.; Li, X.; Cong, R. Effects of low sink demand on leaf photosynthesis under potassium deficiency. Plant Physiol. Bioch. 2017, 113, 110–121. [Google Scholar] [CrossRef] [Scilit] [PubMed]
- Geng, G.; Cakmak, I.; Tao, R.; Lu, Z.; Lu, J. Effect of magnesium fertilization on seed yield, seed quality, carbon assimilation and nutrient uptake of rapeseed plants. Field Crops Res. 2021, 264, 108082. [Google Scholar] [CrossRef] [Scilit]
- White, P. Long-distance transport in the xylem and phloem. In Marschner’s Mineral Nutrition of Higher Plants; Marschner, P., Ed.; Elsevier: Amsterdam, The Netherlands, 2012; pp. 49–70. [Google Scholar]
- Thor, K. Calcium—Nutrient and messenger. Front. Plant Sci. 2019, 10, 440. [Google Scholar] [CrossRef] [Scilit] [PubMed]
- Xie, K.; Cakmak, I.; Wang, I.; Zhang, F.; Guo, S. Synergistic and antagonistic interactions between potassium and magnesium in higher plants. Crop J. 2021, 9, 249–256. [Google Scholar] [CrossRef] [Scilit]
- Ourry, A. Leaf mineral nutrient remobilization during leaf senescence and modulation by nutrient deficiency. Front. Plant Sci. 2015, 6, 317. [Google Scholar] [CrossRef] [Scilit] [PubMed]
- Wang, C.; Yang, J.; Chen, W.; Zhao, X.; Wang, Z. Contribution of the leaf and silique photosynthesis to the seeds yield and quality of oilseed rape (Brassica napus L.) in reproductive stage. Sci. Rep. 2023, 13, 4721. [Google Scholar] [CrossRef] [Scilit] [PubMed]
- Wang, Y.; Ge, M.; Gao, G.; Shao, D.; Zeng, G.; Yu, Z.; Tan, J.; Gadisa, K.; Fu, Y.; Zhao, J.; et al. Calcium application synergizes lodging resistance and yield potential in rapeseed by cell wall strengthening and photosynthesis. Crop J. 2026, in press. [Google Scholar] [CrossRef] [Scilit]
- Sylvester-Bradley, R.; Lunn, G.; Foulkes, J.; Shearman, V.; Spink, J.; Ingram, J. Management Strategies for Yield of Cereals and Oilseed Rape. In Proceedings of the HGCA Conference: Agronomic Intelligence: The Basis for Profitable Production; HGCA: London, UK, 2002; Volume 18, Available online: www.hgca.com/publications (accessed on 14 August 2026).
- Krouk, G.; Kiba, T. Nitrogen and phosphorus interactions in plants: From agronomic to physiological and molecular insights. Curr. Opin. Plant Bio. 2020, 57, 104–109. [Google Scholar] [CrossRef] [Scilit] [PubMed]
- Grzebisz, W.; Szczepaniak, W.; Barłóg, P.; Przygocka-Cyna, K.; Potarzycki, J. Phosphorus sources for winter oilseed rape (Brassica napus L.) during reproductive growth—Magnesium sulfate management impact on P use efficiency. Arch. Agron. Soil Sci. 2018, 64, 1646–1662. [Google Scholar] [CrossRef] [Scilit]
- Van Midden, C.; Harris, J.; Shaw, L.; Sizmur, T.; Pawlett, M. The impact of anaerobic digestate on soil life; a review. Appl. Soil Ecol. 2023, 191, 105066. [Google Scholar] [CrossRef] [Scilit]
- Januszkiewicz, R.; Kulczycki, G.; Sacała, E. Effect of multi-nutrient foliar fertilizers on the yield and quality of oilseed rape grown on different types of soil. J. Elem. 2025, 30, 392–420. [Google Scholar] [CrossRef] [Scilit]
- Sikorska, A.; Gugała, M.; Zarzecka, K.; Mystkowska, I.; Findura, P.; Pristavka, M. Quality of winter rapeseeds (Brassica napus L.) depending on the genetic factor and on soil and foliar applications on mineral and organic substances. J. Elem. 2023, 28, 1175–1190. [Google Scholar] [CrossRef] [Scilit]
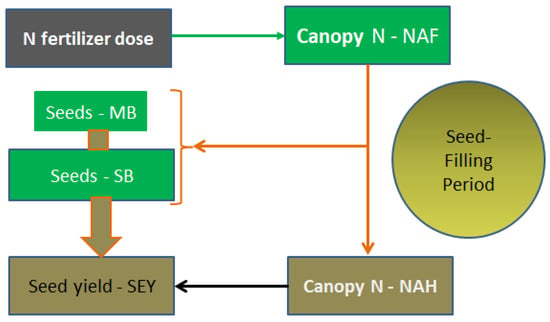
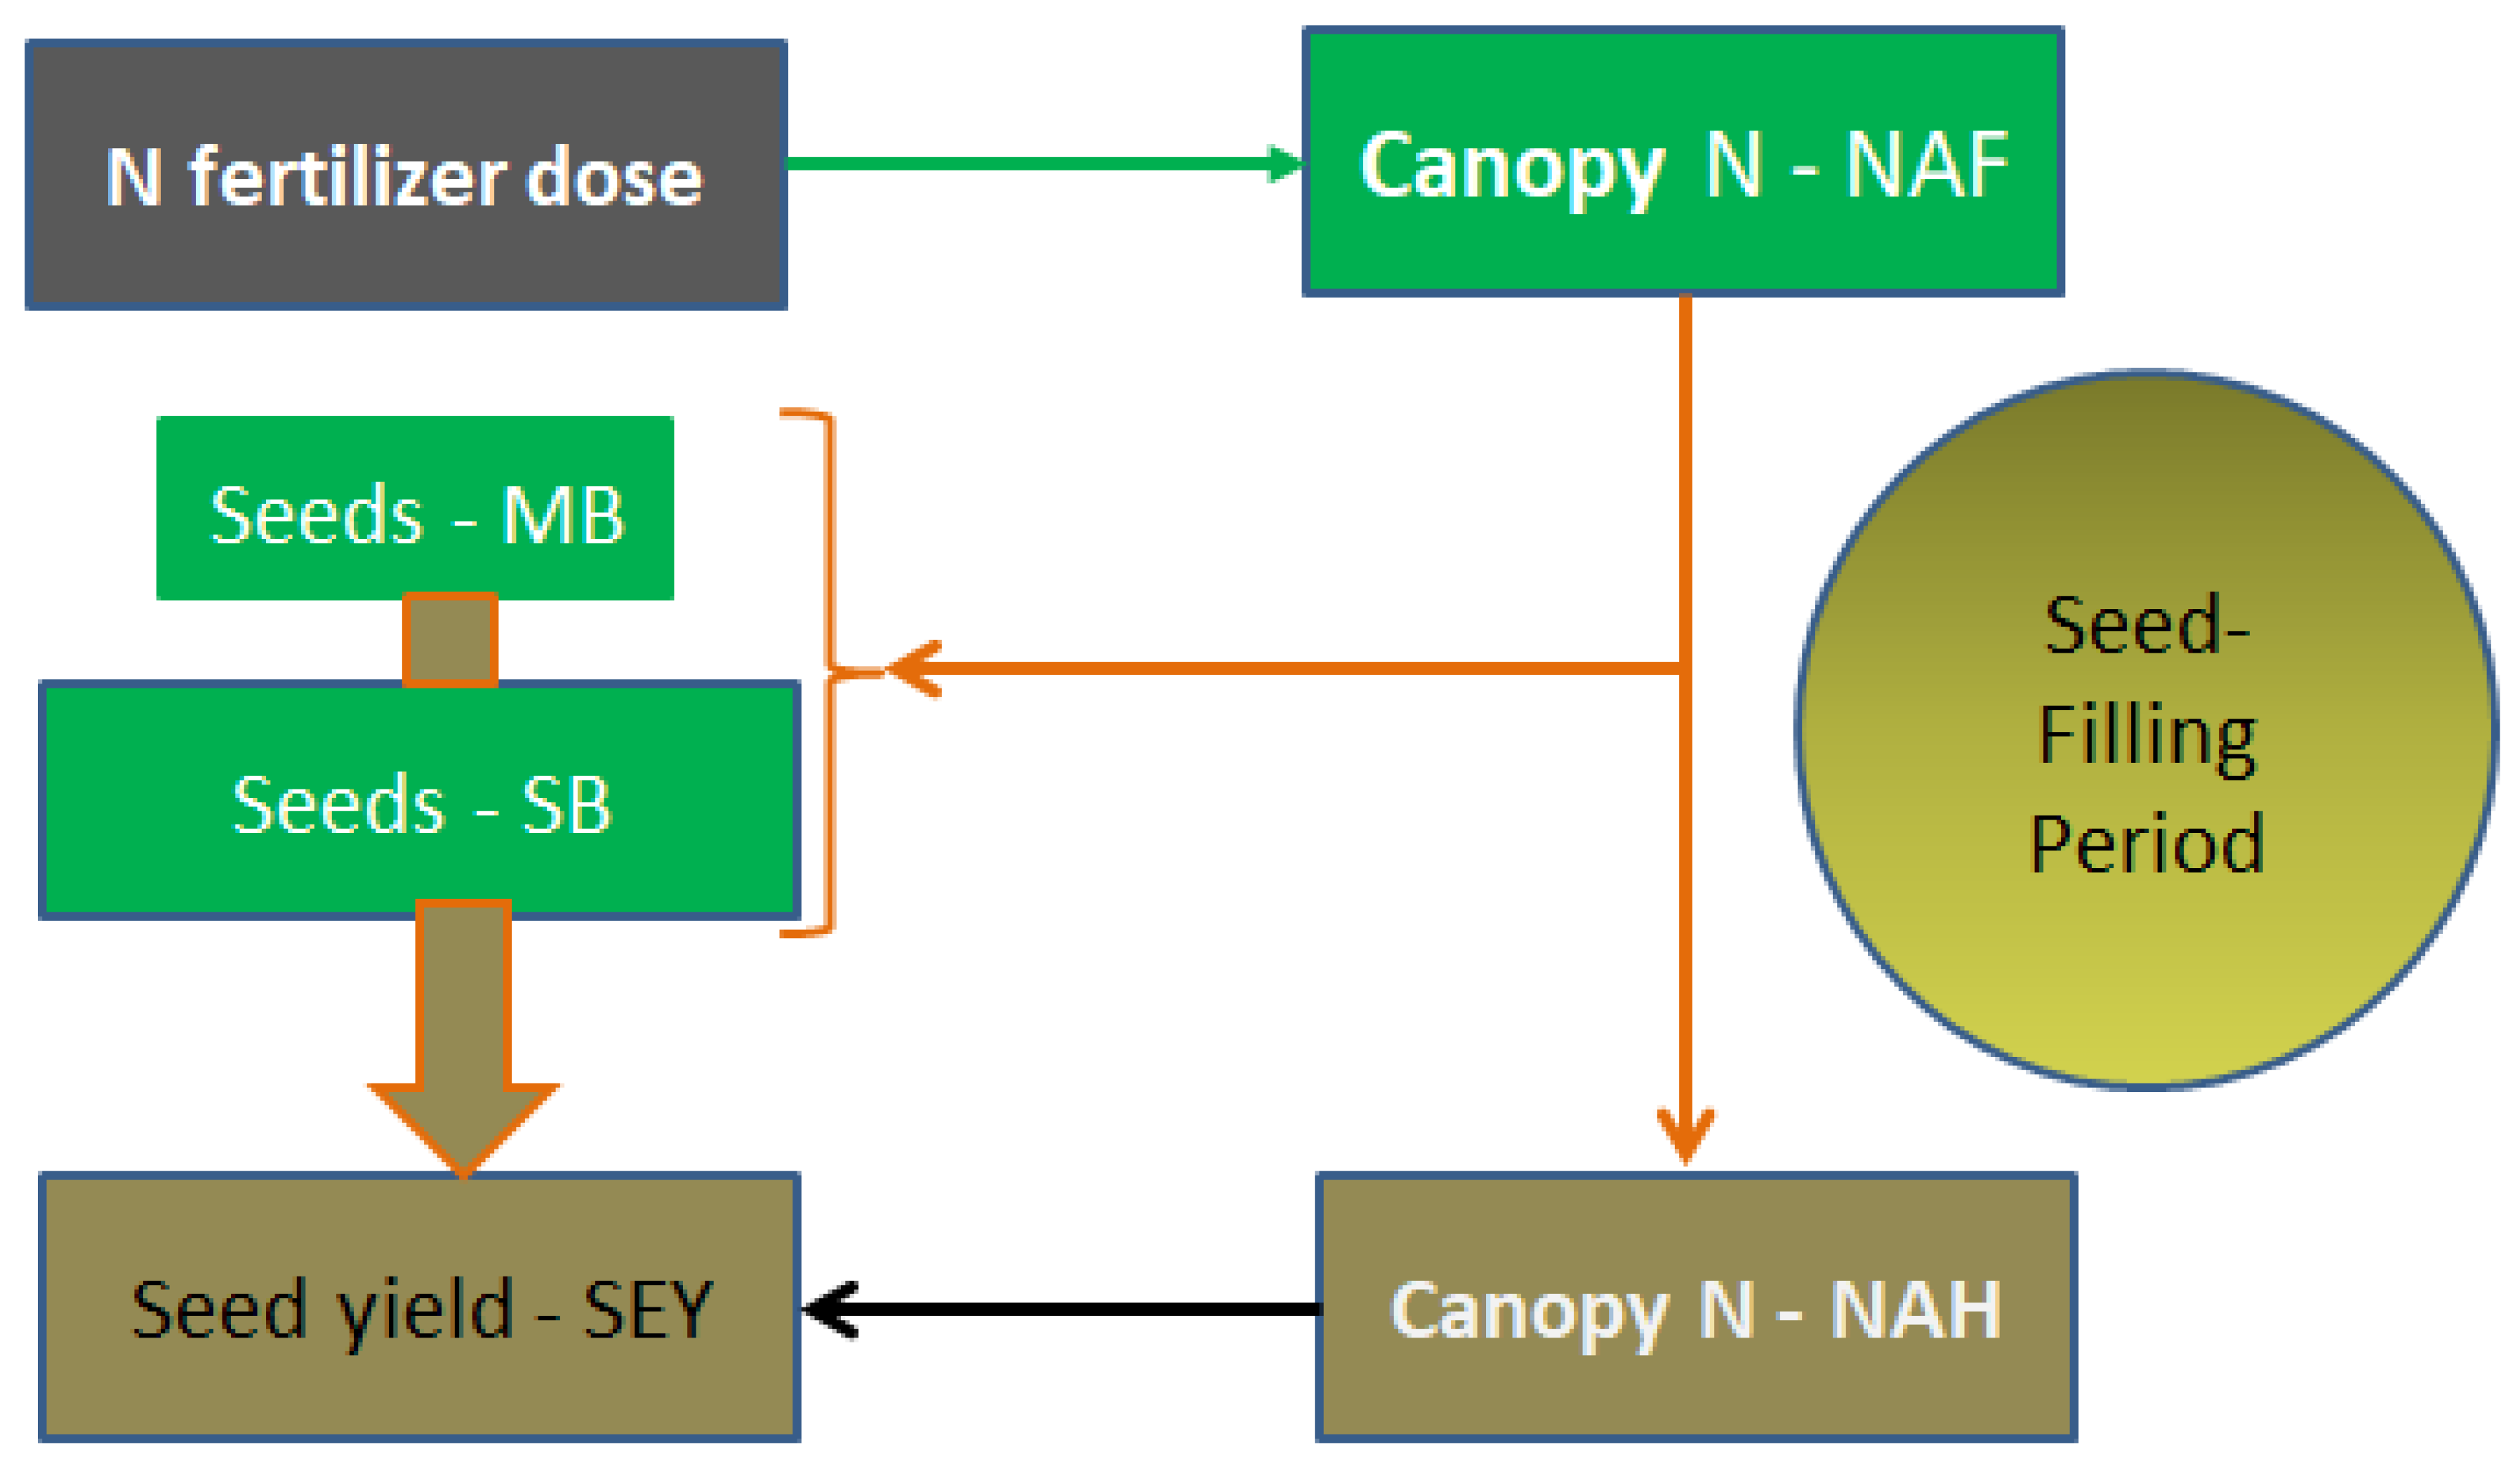
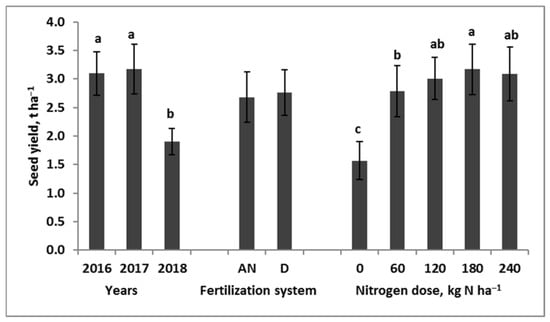
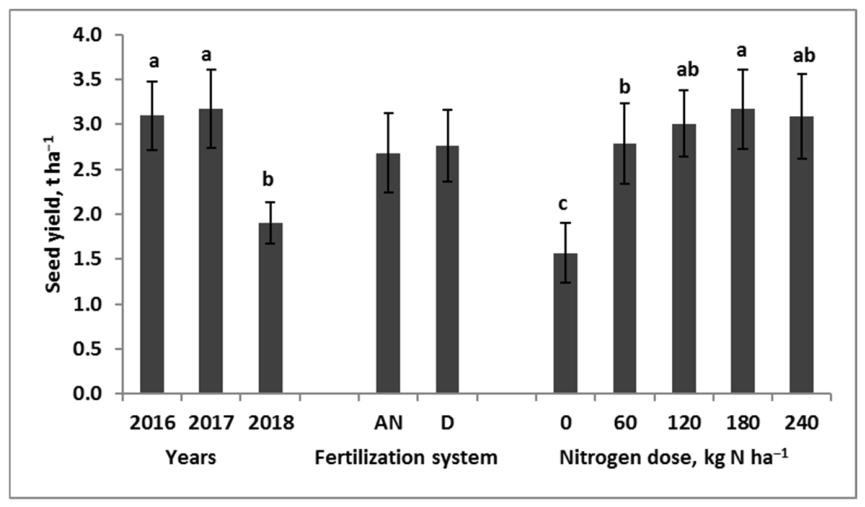
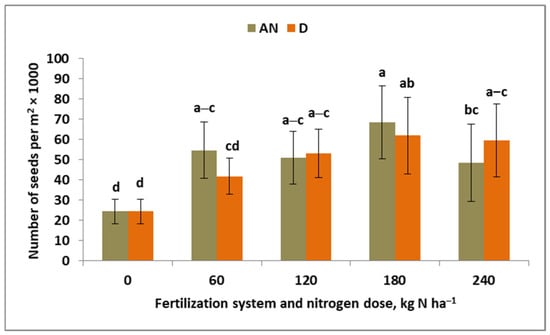
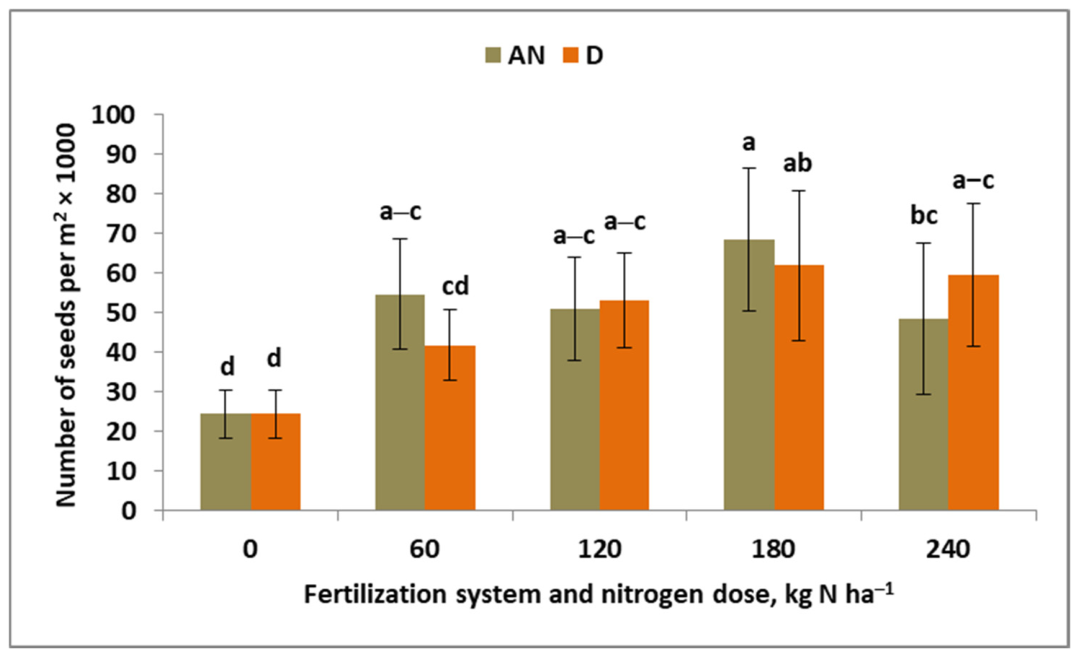
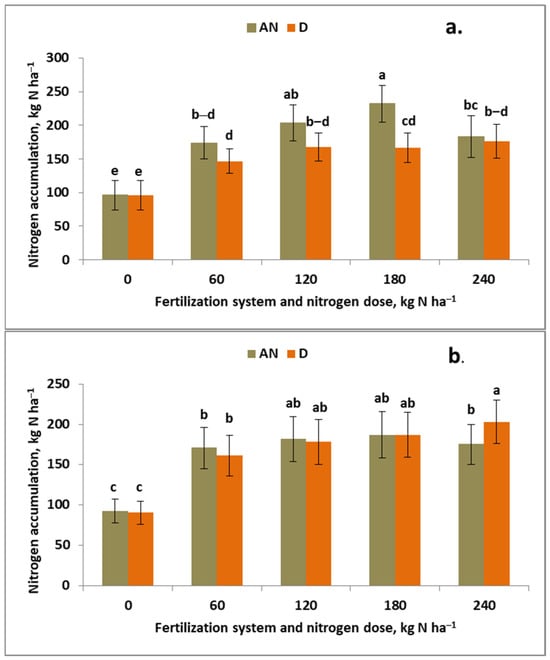
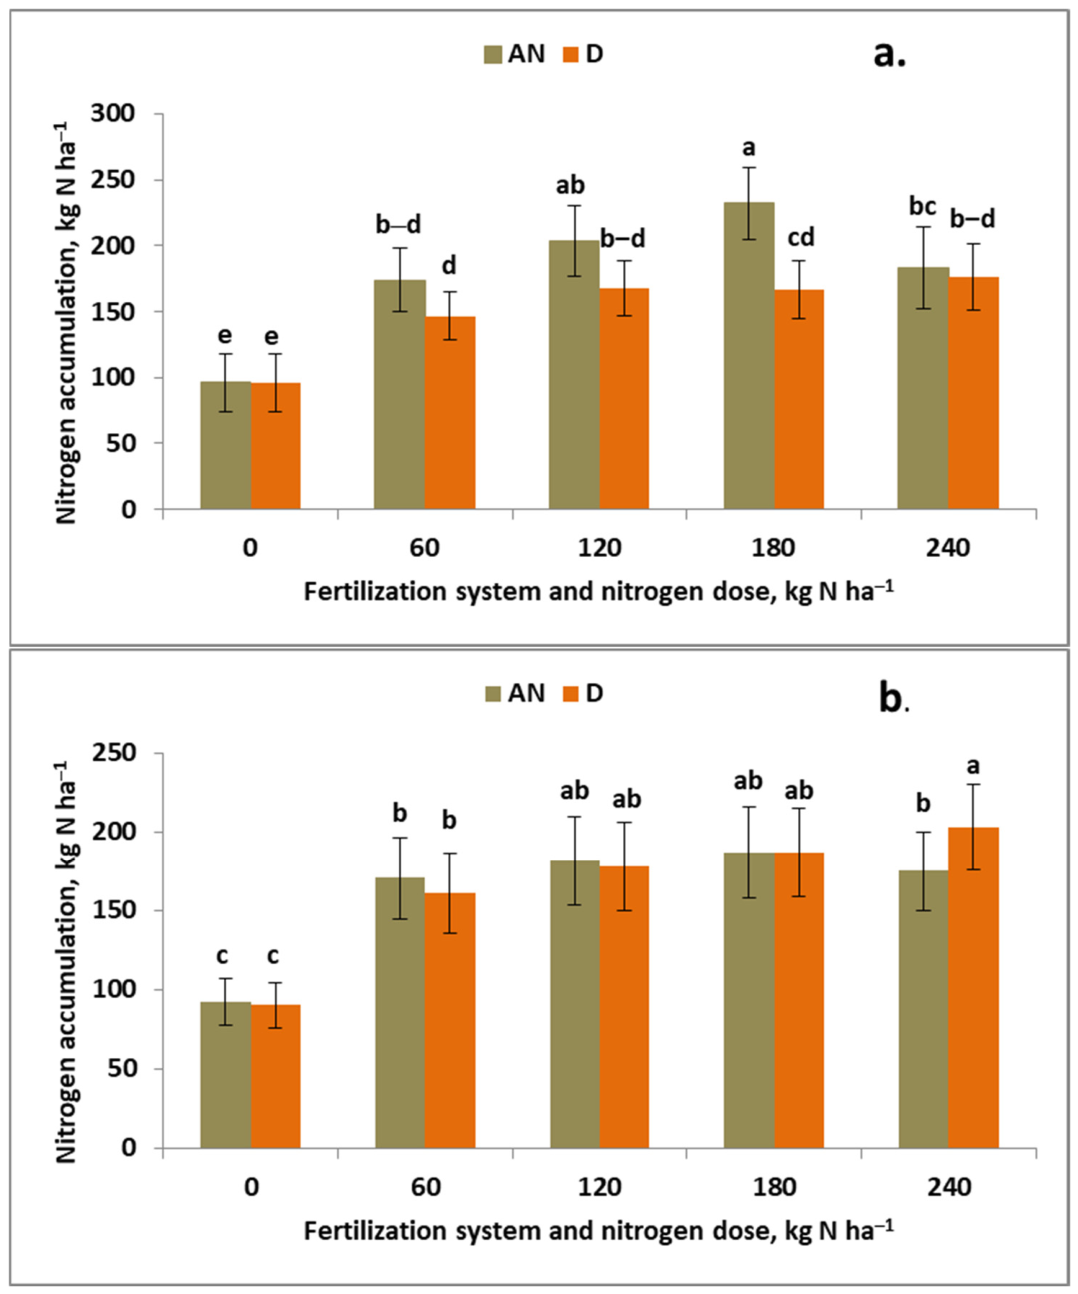
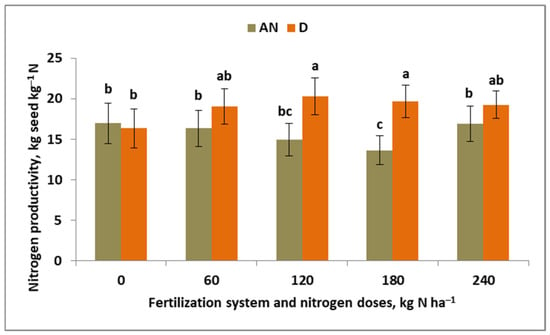
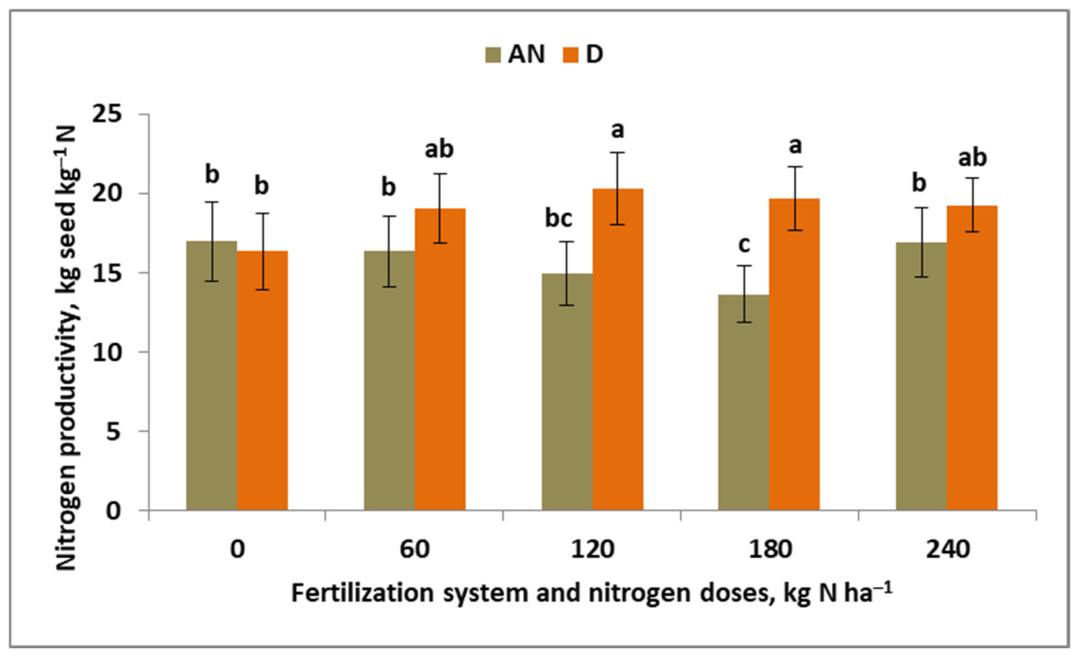
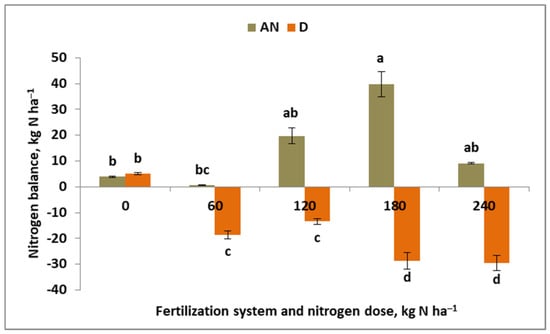
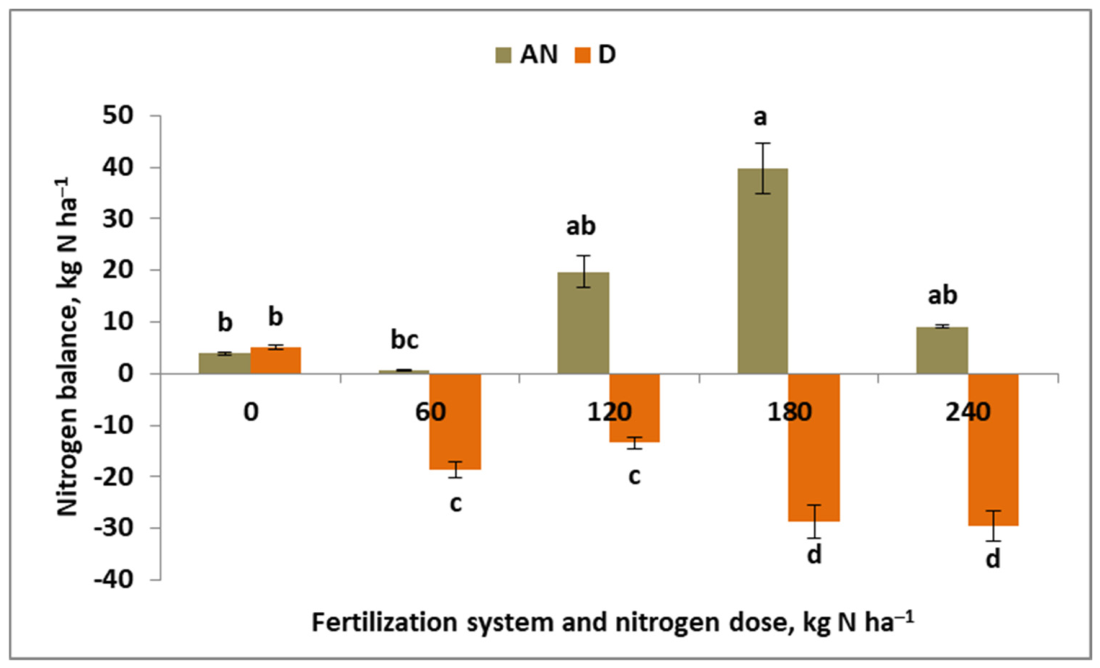
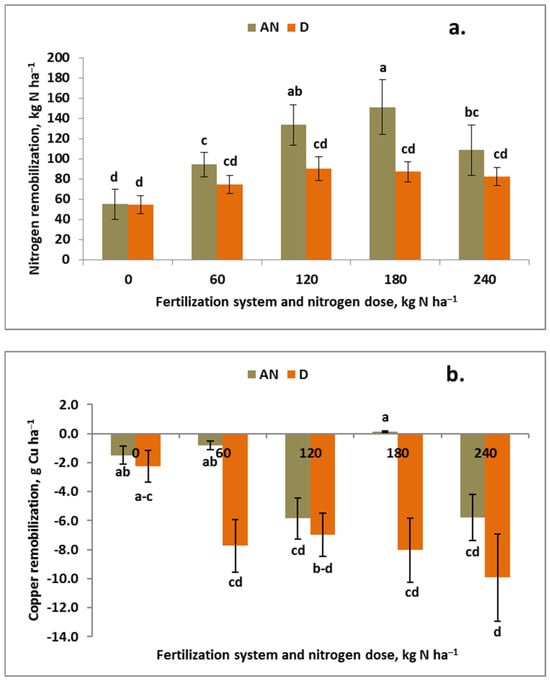
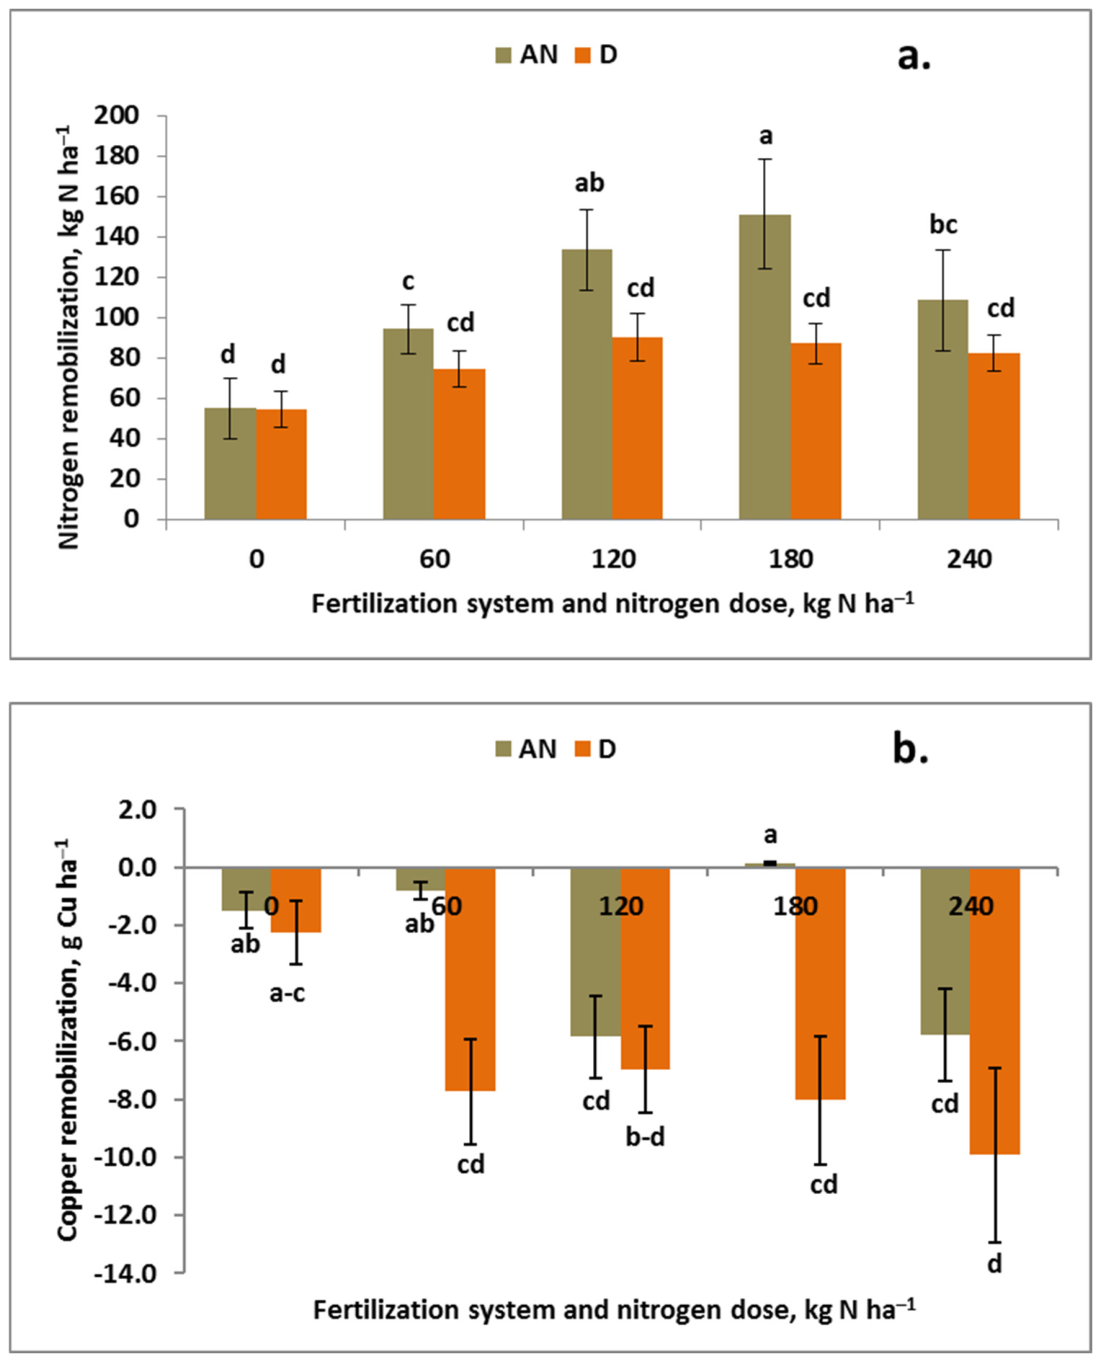
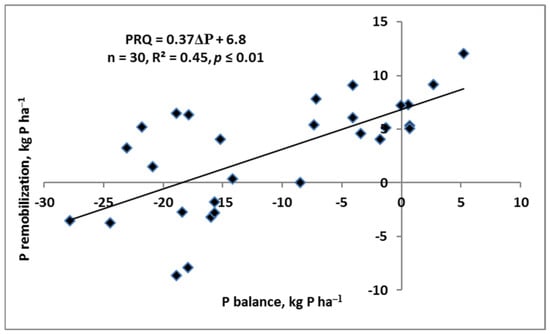
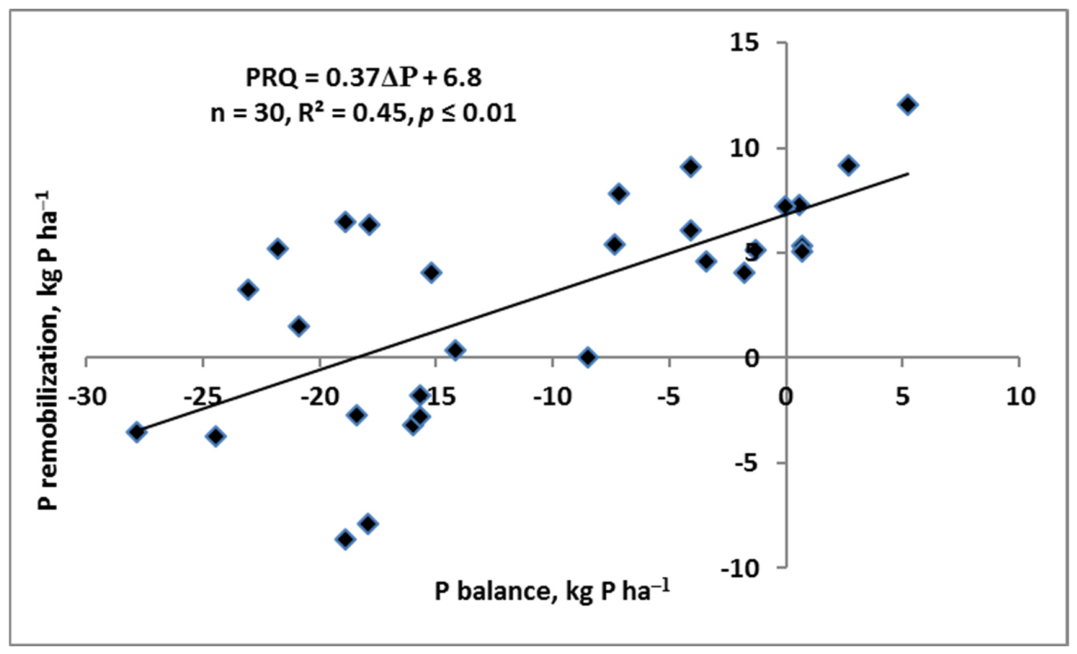
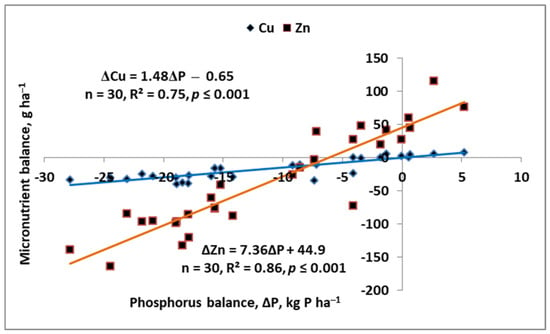
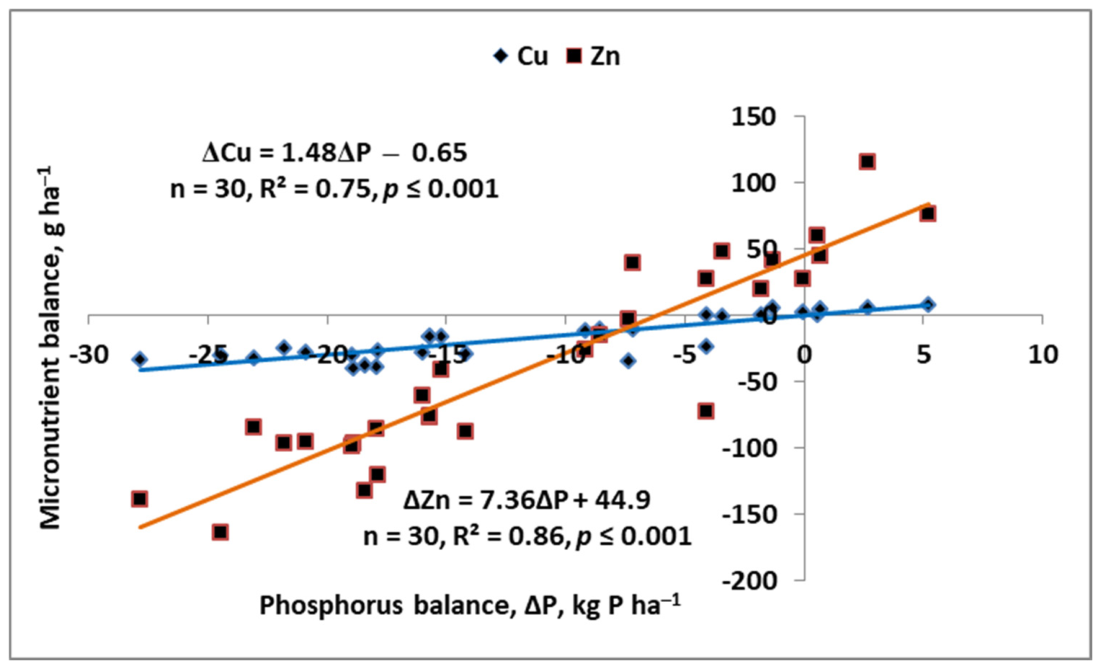

Disclaimer/Publisher’s Note: The statements, opinions and data contained in all publications are solely those of the individual author(s) and contributor(s) and not of MDPI and/or the editor(s). MDPI and/or the editor(s) disclaim responsibility for any injury to people or property resulting from any ideas, methods, instructions or products referred to in the content. |
© 2026 by the authors. Licensee MDPI, Basel, Switzerland. This article is an open access article distributed under the terms and conditions of the Creative Commons Attribution (CC BY) license.