


Abstract
Rice (Oryza sativa L.) suffers severe yield losses from the brown planthopper (Nilaparvata lugens Stål; BPH), a phloem-feeding insect pest, and durable host resistance is widely regarded as the most economical strategy for its management. Wild relatives of rice harbor rich but largely untapped reservoirs of resistance. However, the molecular and metabolic mechanisms that underlie their contrasting resistance phenotypes remain poorly understood. Here, we integrated insect bioassays, transcriptome profiling, and widely targeted metabolomics to compare the responses of the resistant Oryza nivara and the susceptible Oryza rufipogon to BPH feeding. BPH showed significantly reduced weight gain, honeydew excretion, and survival on O. nivara, consistent with strong antibiosis-based resistance. Transcriptomic and metabolomic analyses revealed that O. nivara preferentially activated jasmonic acid signaling and phenylpropanoid-flavonoid biosynthesis and accumulated flavonoids and lignans/coumarins, whereas O. rufipogon mainly induced ribosomal and primary-metabolism genes and accumulated amino acids, nucleotides, and lipids. Integrated analyses uncovered a coordinated shikimate-phenylpropanoid-flavonoid metabolic axis in O. nivara, coupled with elevated jasmonic acid and salicylic acid signaling and suppressed auxin biosynthesis. Exogenous application of jasmonic or salicylic acid enhanced resistance in the susceptible O. rufipogon. Our results reveal a coordinated defense strategy in wild rice against BPH and highlight key metabolic and regulatory nodes that can be targeted to breed durable resistance into cultivated rice.
1. Introduction
The brown planthopper (Nilaparvata lugens Stål; BPH) is one of the most destructive phloem-feeding insect pests of rice (Oryza sativa L.), causing severe yield losses and posing a major threat to rice production across Asia [1,2]. Nymphs and adults withdraw assimilates from the sieve elements; heavy infestations cause the yellowing and collapse of tillers, known as hopperburn; and the insect also transmits rice stunt viruses that further amplify yield losses [1,3]. Insecticide applications have long dominated control programs, but resistance to most registered active ingredients and concerns over non-target effects have eroded their reliability [4]. Consequently, the deployment of host plant resistance remains the most sustainable and environmentally sound strategy for managing BPH [4,5].
Resistance deployed in cultivated rice is frequently short-lived. BPH populations adapt rapidly, and new biotypes able to overcome major resistance genes appear within a few years of variety release [6,7]. Domestication and modern breeding have narrowed the genetic pool accessible to breeders, leaving elite germplasm with relatively few independent sources of resistance [7]. These limitations highlight the need for resistance mechanisms independent of single major genes and for germplasm that escapes the domestication bottleneck [6,7].
Wild rice species, which have coexisted with herbivorous insects under natural selection over thousands of years, harbor considerably higher levels of genetic and functional diversity than cultivated rice [7,8]. Species such as Oryza rufipogon and Oryza nivara are recognized as important progenitors of Asian cultivated rice and represent valuable reservoirs of resistance-related alleles [8,9]. Indeed, multiple BPH resistance loci have been identified in wild rice germplasm and derived breeding lines, underscoring the importance of wild rice in resistance breeding [9,10].
Wild relatives may also differ in the architecture of their defenses, rather than merely in their presence. O. nivara exhibits strong resistance to BPH, whereas O. rufipogon is comparatively susceptible, even though the two species are closely related and interfertile [8]. Comparing them therefore offers an opportunity to explore how a shared genomic background can be deployed to produce divergent defense outcomes at the physiological, transcriptional and metabolic levels.
Plant resistance to phloem-feeding insects involves complex and dynamic defense responses, including early signal perception, hormone-mediated signaling, transcriptional reprogramming, and the accumulation of defensive metabolites and structural barriers [11]. Studies on cultivated rice have shown that BPH feeding triggers extensive shifts in primary and secondary metabolism, and that resistant and susceptible genotypes exhibit distinct response patterns [12,13,14,15].
Secondary metabolic pathways, particularly those associated with phenylpropanoids and flavonoids, are frequently activated in resistant rice lines following BPH infestation [12,16,17,18]. These metabolic changes are frequently coordinated with the activation of the jasmonic acid (JA) and salicylic acid (SA) pathways and with modulation of auxin, abscisic acid, and ethylene signaling [14,19,20]. At the transcriptional level, several transcription factor families, including WRKY and MYB proteins, together with regulatory microRNAs, play central roles in shaping defense responses [21,22,23,24].
Chemical defenses are reinforced by structural barriers: callose deposition on sieve plates and lignin fortification of cell walls restrict stylet penetration and limit phloem access [25,26,27,28,29]. Susceptible rice frequently mounts these responses belatedly or weakly, and salivary effectors secreted during feeding can suppress or redirect host metabolism in ways that favor the insect [12,30,31].
Wild rice species, as the closest wild relatives of cultivated rice, offer a valuable yet underexplored genetic resource for enhancing pest resistance. While the molecular mechanisms of resistance in cultivated rice have been extensively studied, the defense strategies of wild rice species remain poorly understood, particularly at a systems level. In this study, we dissect the contrasting defense responses of O. nivara and O. rufipogon to BPH infestation. By integrating physiological, transcriptomic, and metabolomic data, we show that O. nivara employs a highly coordinated defense strategy that prioritizes secondary metabolism and hormonal signaling, whereas O. rufipogon shows a more generalized metabolic response. These findings not only broaden our understanding of defense mechanisms in wild rice but also open new avenues for improving BPH resistance in cultivated rice. The identification of key regulatory nodes, such as the shikimate–phenylpropanoid–flavonoid pathway and JA and SA signaling, provides a robust framework for breeding resilient rice varieties. Ultimately, this work lays the foundation for utilizing wild rice germplasm to develop durable pest-resistant rice, a critical step toward safeguarding global food security in the face of evolving pest pressures.
2. Materials and Methods
2.1. Plant Materials and Insect Rearing
Two wild rice species, Oryza rufipogon Griff. (ruf) and Oryza nivara Sharma et Shastry (niv), were used in this study. These species represent the ancestral gene pool of cultivated rice and exhibit contrasting resistance levels to the brown planthopper (BPH). Specifically, O. nivara is resistant to BPH, whereas O. rufipogon is susceptible. Seeds of both wild rice accessions were germinated and grown under greenhouse conditions for subsequent experiments. Throughout this study, a biological replicate denotes an independent experimental unit derived from separately grown plants, whereas a technical replicate denotes a repeated measurement of the same biological sample.
The BPH (Nilaparvata lugens Stål) population was initially collected from rice fields and maintained on the highly susceptible rice cultivar TN1 for multiple generations to ensure colony stability. All insects were reared under controlled environmental conditions at 26 ± 2 °C, 70–80% relative humidity, and a photoperiod of 16 h light/8 h dark, as previously described [12]. Only healthy and synchronized insects were used for all bioassays.
2.2. Assessment of Antibiosis Resistance
The antibiosis resistance of O. rufipogon and O. nivara to BPH was evaluated using honeydew excretion, adult female weight gain, and nymphal mortality as physiological indicators. Seeds were germinated and sown in plastic seedling cups (9 cm × 9 cm) filled with a commercial peat-based nutrient soil (Sweeper, Jiangsu Sweeper Biotechnology Co., Ltd., Nanjing, China), with six seedlings per cup. The plants were grown in a greenhouse for five weeks until they reached the vegetative stage.
Uniform seedlings were selected for bioassays. A honeydew collection chamber made of Parafilm (Bemis Company, Inc., Neenah, WI, USA) (1.5 cm × 2.0 cm) was carefully attached to the basal stem region, approximately 2–4 cm above the soil surface. Newly emerged female BPH adults were starved for 2 h prior to infestation and introduced individually into the chambers. The initial body weight of each insect (C1) and the initial weight of the honeydew collection bag (D1) were recorded using an analytical balance (Mettler Toledo, Columbus, OH, USA). After 48 h of feeding, the final insect body weight (C2) and honeydew bag weight (D2) were measured.
Adult weight gain was calculated as C2 – C1, and honeydew production was calculated as D2 – D1. Each treatment included ten biological replicates, following previously established protocols with minor modifications [12]. For the mortality assay, 20 BPH insects were placed on each pair of rice lines with 10 replicates per treatment.
2.3. BPH Infestation Treatment and Tissue Sampling
For transcriptomic and metabolomic analyses, BPH-infested and non-infested control treatments were established for both wild rice species. Seeds were sown in plastic pots (Taizhou Shengerda Plastic Co., Ltd., Taizhou, Zhejiang, China) (20 cm diameter), with 45 seeds per pot, and grown under greenhouse conditions for five weeks. Plants of uniform growth were selected and infested with ten second- to third-instar BPH nymphs per plant.
Plants were randomly assigned to a BPH-infested and a non-infested control group, and infestation was performed with synchronized second- to third-instar nymphs at a fixed density (10 nymphs/plant) to control for insect stage and density. Both the BPH-infested group and the uninfested control group were sampled at the same endpoint, 48 h after BPH introduction into the infestation group. For clarity, the uninfested control samples are designated as niv0 and ruf0, whereas samples collected after 48 h of BPH infestation are designated as niv48 and ruf48. After 48 h of infestation, leaf sheath tissues from the basal stem region were rapidly excised, immediately frozen in liquid nitrogen, and stored at −80 °C (Thermo Fisher Scientific, Waltham, MA, USA) until further analysis. Samples were collected under greenhouse conditions following established BPH bioassay protocols [12]. Each treatment included three independent biological replicates (n = 3) for RNA-seq and widely targeted metabolomics, with each replicate consisting of pooled leaf-sheath tissues from ten individual plants. Transcriptomic and metabolomic data were analyzed using stringent thresholds (transcriptomics: |log2FC| ≥ 1, FDR < 0.05; metabolomics: VIP ≥ 1, |log2FC| ≥ 1), and major findings were validated by independent qRT-PCR and consistency across the two omics platforms.
2.4. RNA Extraction, Library Preparation, and Transcriptome Analysis
Total RNA was extracted from frozen leaf sheath samples using the FastPure Plant Total RNA Isolation Kit (Vazyme Biotech Co., Ltd., Nanjing, China) according to the manufacturer’s instructions. RNA integrity, purity, and concentration were assessed prior to library construction. High-quality RNA samples were used for sequencing library preparation, and sequencing was performed on the Illumina NovaSeq platform (Illumina, San Diego, CA, USA).
Raw sequencing reads were filtered and quality-controlled using fastp (v0.23.4) [32] to obtain clean reads. Clean reads were aligned to the rice reference genome (MSU Rice Genome Annotation Project Release 7) using HISAT2 (v2.2.1) [33]. Gene expression levels were normalized as transcripts per million (TPM). Differentially expressed genes (DEGs) were identified using DESeq2 (v1.48.2) [34] with the criteria of adjusted p < 0.05 and |log2 fold change| ≥ 1. Identified DEGs were further subjected to Gene Ontology (GO) annotation and Kyoto Encyclopedia of Genes and Genomes (KEGG) pathway enrichment analyses. These thresholds were selected to balance false-discovery control with biological relevance: an adjusted p-value (FDR) < 0.05 controls the expected proportion of false positives across thousands of tested genes, while |log2 fold change| ≥ 1 (i.e., a two-fold change) retains genes with biologically meaningful regulation, following standard DESeq2 practice [34]. Exact adjusted p-values and fold changes for every DEG are listed in Tables S1 and S2, ensuring full transparency of the statistical evidence.
2.5. Metabolite Extraction and UPLC–MS/MS Analysis
Freeze-dried leaf sheath samples were finely ground, and 100 mg of powder from each sample was accurately weighed. Metabolites were extracted by adding 1.2 mL of 70% (v/v) methanol (Fisher Scientific, Waltham, MA, USA), followed by vortexing and overnight extraction at 4 °C. Extracts were centrifuged and filtered through 0.22 μm microporous membranes (SCAA‑104; ANPEL Laboratory Technologies Inc., Shanghai, China) prior to analysis.
Metabolite profiling was conducted using an ultrahigh-performance liquid chromatography–tandem mass spectrometry (UPLC–MS/MS) system equipped with a Waters ACQUITY UPLC HSS T3 column (Waters Corporation, Milford, MA, USA) (1.8 μm, 2.1 × 100 mm). The column temperature was maintained at 40 °C. The mobile phases consisted of solvent A (0.1% formic acid in water) and solvent B (0.1% formic acid in acetonitrile), and metabolites were separated using a binary gradient elution program with an increasing proportion of solvent B. Mass spectrometry detection was performed in both positive and negative electrospray ionization modes with an ion source temperature of 550 °C and a spray voltage of ±5500 V.
2.6. Metabolite Identification and Differential Accumulation Analysis
Metabolite identification was achieved by matching detected ions against the MWGB (metabolome-wide database) in-house database and publicly available mass spectral databases [35]. Relative quantification was performed using the multiple reaction monitoring (MRM) mode. Orthogonal partial least squares-discriminant analysis (OPLS-DA) combined with univariate statistical analysis was applied to identify differentially accumulated metabolites (DAMs). Metabolites with a variable importance in projection (VIP) score ≥ 1 and |log2 fold change| ≥ 1 were considered significantly altered. Identified DAMs were further annotated and subjected to KEGG pathway enrichment analysis. The VIP ≥ 1 threshold selects metabolites contributing most to OPLS-DA group separation, while |log2FC| ≥ 1 ensures quantitatively meaningful changes; both are widely used in targeted metabolomics to limit false positives while retaining biologically relevant signals [35]. Metabolites were annotated by matching accurate MS1 masses and MS/MS spectra against the MWGB in-house library and public repositories (HMDB, METLIN, KEGG). Confidence followed MSI levels: Level 1, MS/MS match to an authenticated standard; Level 2, putative MS/MS spectral/database match; and Level 3, putative compound-class assignment by MS1 mass and retention time. Key defense-related metabolites (e.g., representative flavonoids and phenolic acids) were further validated against reference standards where available, and identification details for all reported metabolites are provided in Table S9.
2.7. Quantitative Real-Time PCR Analysis
To validate the transcriptome sequencing results, quantitative real-time PCR (qRT-PCR) was performed for selected candidate genes. Total RNA was reverse-transcribed into cDNA using a commercial reverse transcription kit (HiScript II RT SuperMix, Vazyme Biotech Co., Ltd., Nanjing, China). qRT-PCR reactions were performed with gene-specific primers (Table S14) and SYBR Green Premix Ex Taq II (Takara Bio Inc., Kusatsu, Japan) chemistry on a real-time PCR system (CFX96, Bio-Rad Laboratories, Hercules, CA, USA). The rice Actin gene was used as an internal reference. Relative gene expression levels were calculated by the 2−ΔΔCt method. Each assay included three biological replicates, with three technical replicates per sample. The same assay was used to quantify four defense-related genes: phenylalanine ammonia-lyase (PAL; OsPAL2), 4-coumarate-CoA ligase (4CL; Os4CL2), hydroxycinnamoyl-CoA shikimate/quinate hydroxycinnamoyl transferase (HCT; OsHCT), and lipoxygenase (LOX; OsLOX). Leaf sheaths of BPH-infested plants and non-infested controls were harvested at the same time point (48 h) for RNA isolation.
2.8. Integrated Transcriptomic and Metabolomic Analysis
To explore gene-metabolite regulatory relationships underlying BPH resistance in wild rice, significantly enriched KEGG pathways were selected. Differentially expressed genes (DEGs) and differentially accumulated metabolites (DAMs) associated with these pathways were extracted for correlation analysis. Spearman’s rank correlation coefficients were calculated using the psych package (v2.4.6) in R v4.5.3 for all DEG-DAM pairs mapped to each enriched KEGG pathway; the total number of pairwise comparisons is provided in the supplementary source data. To minimize false positives caused by multiple testing, p-values were adjusted using the Benjamini–Hochberg false discovery rate (FDR) method. Correlations with adjusted p < 0.05 and |R| > 0.8 were retained as robust and biologically meaningful [36,37,38].
2.9. Functional Verification of JA/SA Signaling in Rice Resistance to BPH
Plants of O. nivara and O. rufipogon at the same growth stage were assigned to three treatment groups per species: a JA spraying group (100 μmol/L JA (Sigma-Aldrich, Merck KGaA, St. Louis, MO, USA)) applied to the leaf sheath and leaf surface, 10 mL per plant), an SA spraying group (50 μmol/L SA (Sigma-Aldrich, Merck KGaA, St. Louis, MO, USA) applied in the same way), and a control group sprayed with an equal volume of distilled water. At 24 h after spraying, 10 newly emerged female BPHs were inoculated per plant, with three biological replicates per group. After 48 h of feeding, BPH body weight gain, honeydew excretion, and mortality were measured, consistent with the method described in Section 2.2.
2.10. Statistical Analysis
All data are presented as mean ± standard error (SE). Differences between two groups were evaluated using Student’s t-test, and comparisons among multiple groups were performed using one-way analysis of variance (ANOVA) followed by Tukey’s honestly significant difference (HSD) post hoc tests. For factorial experiments with two interacting factors (cultivar × treatment for BPH performance traits; cultivar × time for defense gene expression), two-factor linear mixed models (LMMs) were used to test main effects and their interaction; pairwise comparisons were obtained from the fitted models with Tukey adjustment. Partial eta-squared (ηp2) was reported as the effect size. Statistical significance was set at p < 0.05 (*).
3. Results
3.1. Performance of BPH on the Two Wild Rice Species
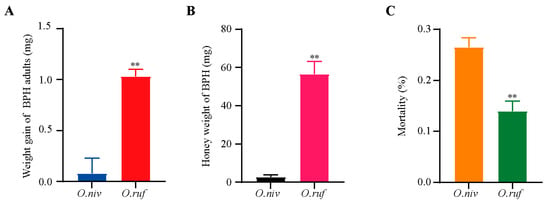
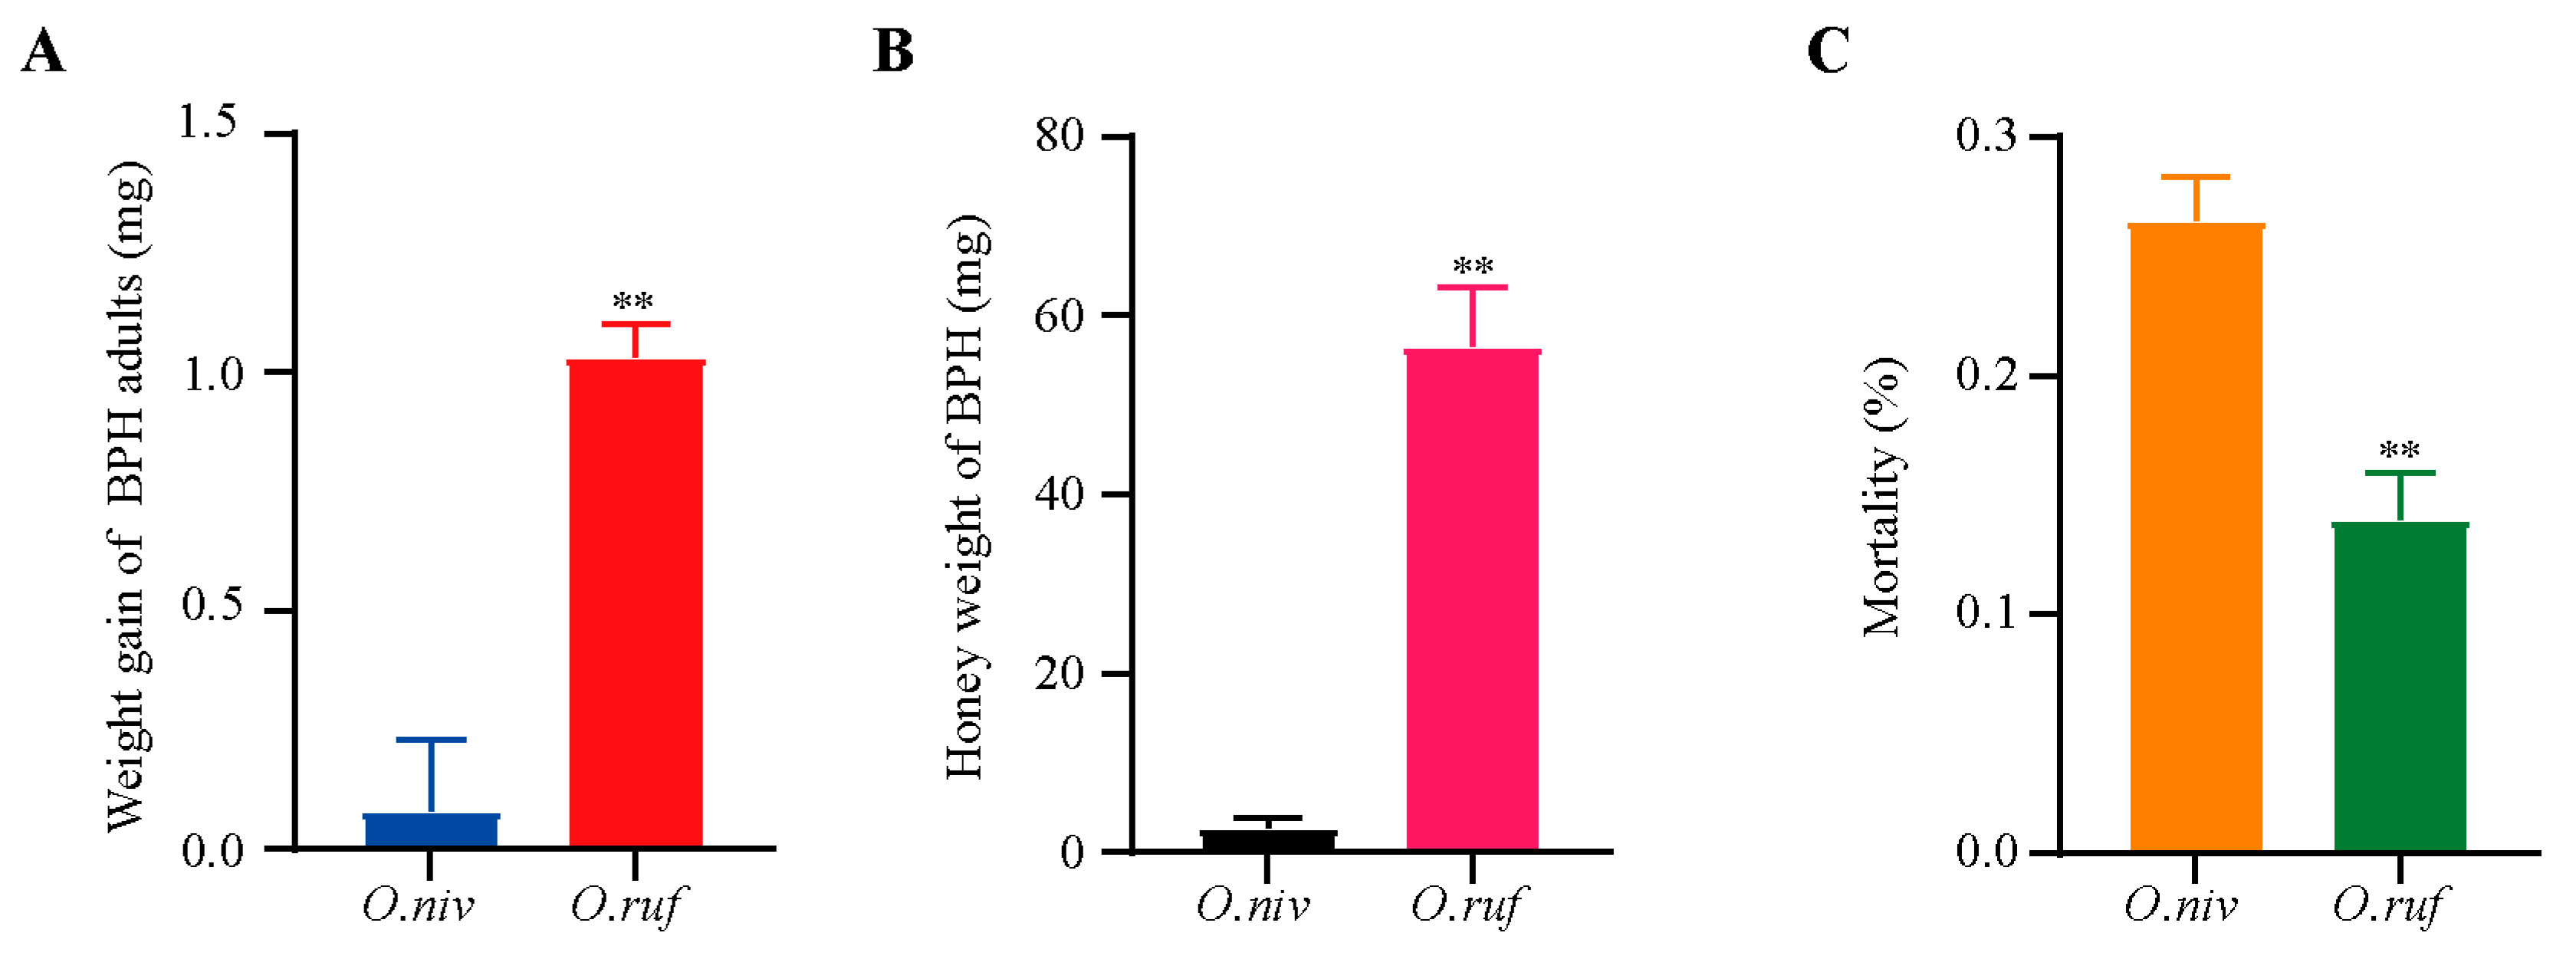
Antibiosis was first quantified by allowing newly emerged females to feed on both species for 48 h. Insects on O. nivara gained significantly less weight and produced significantly less honeydew than those on O. rufipogon (Figure 1A,B), and nymphal mortality was significantly higher on O. nivara (Figure 1C). These results demonstrated that O. nivara is resistant, whereas O. rufipogon is susceptible, and pointed to antibiosis rather than antixenosis as the main component of the resistance observed here.
Figure 1.
Performance of BPH on the wild rice species O. nivara and O. rufipogon. (A) Weight gain of newly emerged female adults after 48 h of feeding. (B) Honeydew excretion by newly emerged female adult BPHs fed on O. nivara and O. rufipogon for 48 h. (C) Mortality of BPH nymphs fed on O. nivara and O. rufipogon for 48 h. The experiments were repeated with 20 BPHs (A,B); 20 BPH insects were placed on each pair of rice lines, and 10 replicates were used for analysis (C). Error bars, mean ± SE. Asterisks indicate significant differences revealed by Student’s t-test, at p < 0.01 (**).
3.2. Transcriptomic Responses of O. nivara and O. rufipogon to BPH Feeding
To identify the transcriptional basis of this difference, leaf sheath tissues of O. nivara and O. rufipogon were profiled 48 h after BPH infestation, together with non-infested controls harvested at the same time (niv0, niv48, ruf0, and ruf48). RNA-seq generated 44.6–52.6 million raw reads per library, of which 43.9–51.8 million high-quality clean reads were retained after quality filtering. More than 89.5% of clean reads were successfully mapped to the Oryza sativa Nipponbare reference genome, and Q30 values exceeded 93% for all libraries, indicating that the dataset was of sufficient depth and quality for comparative analysis (Table 1). Clustering analyses further confirmed high consistency among biological replicates (Figure S1).
Table 1.
Statistics of sequencing reads and alignment to the reference genome.
With thresholds of |log2 fold change| ≥ 1 and FDR ≤ 0.05, 1080 DEGs were identified in O. nivara after feeding, including 904 upregulated and 176 downregulated genes (Figure S2A; Table S1). In comparison, 2828 DEGs were identified in O. rufipogon (2019 upregulated and 809 downregulated; Figure S2B; Table S2). The susceptible species therefore exhibited about 2.6-fold more DEGs than the resistant one, a pattern consistent with a broad but unfocused stress response rather than a targeted defense program.
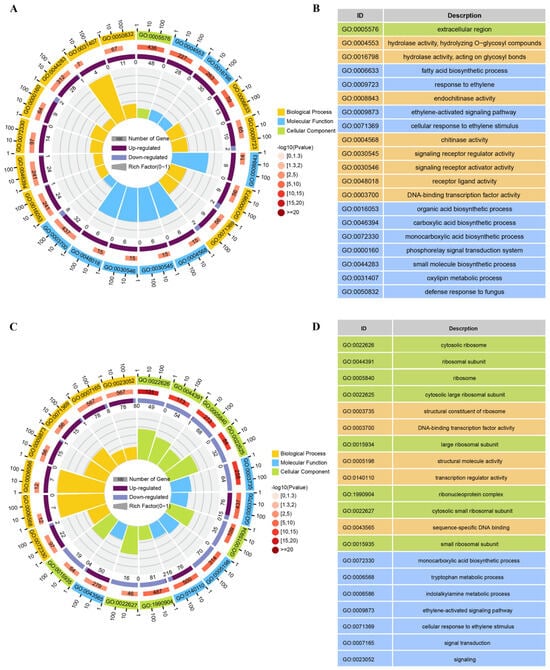
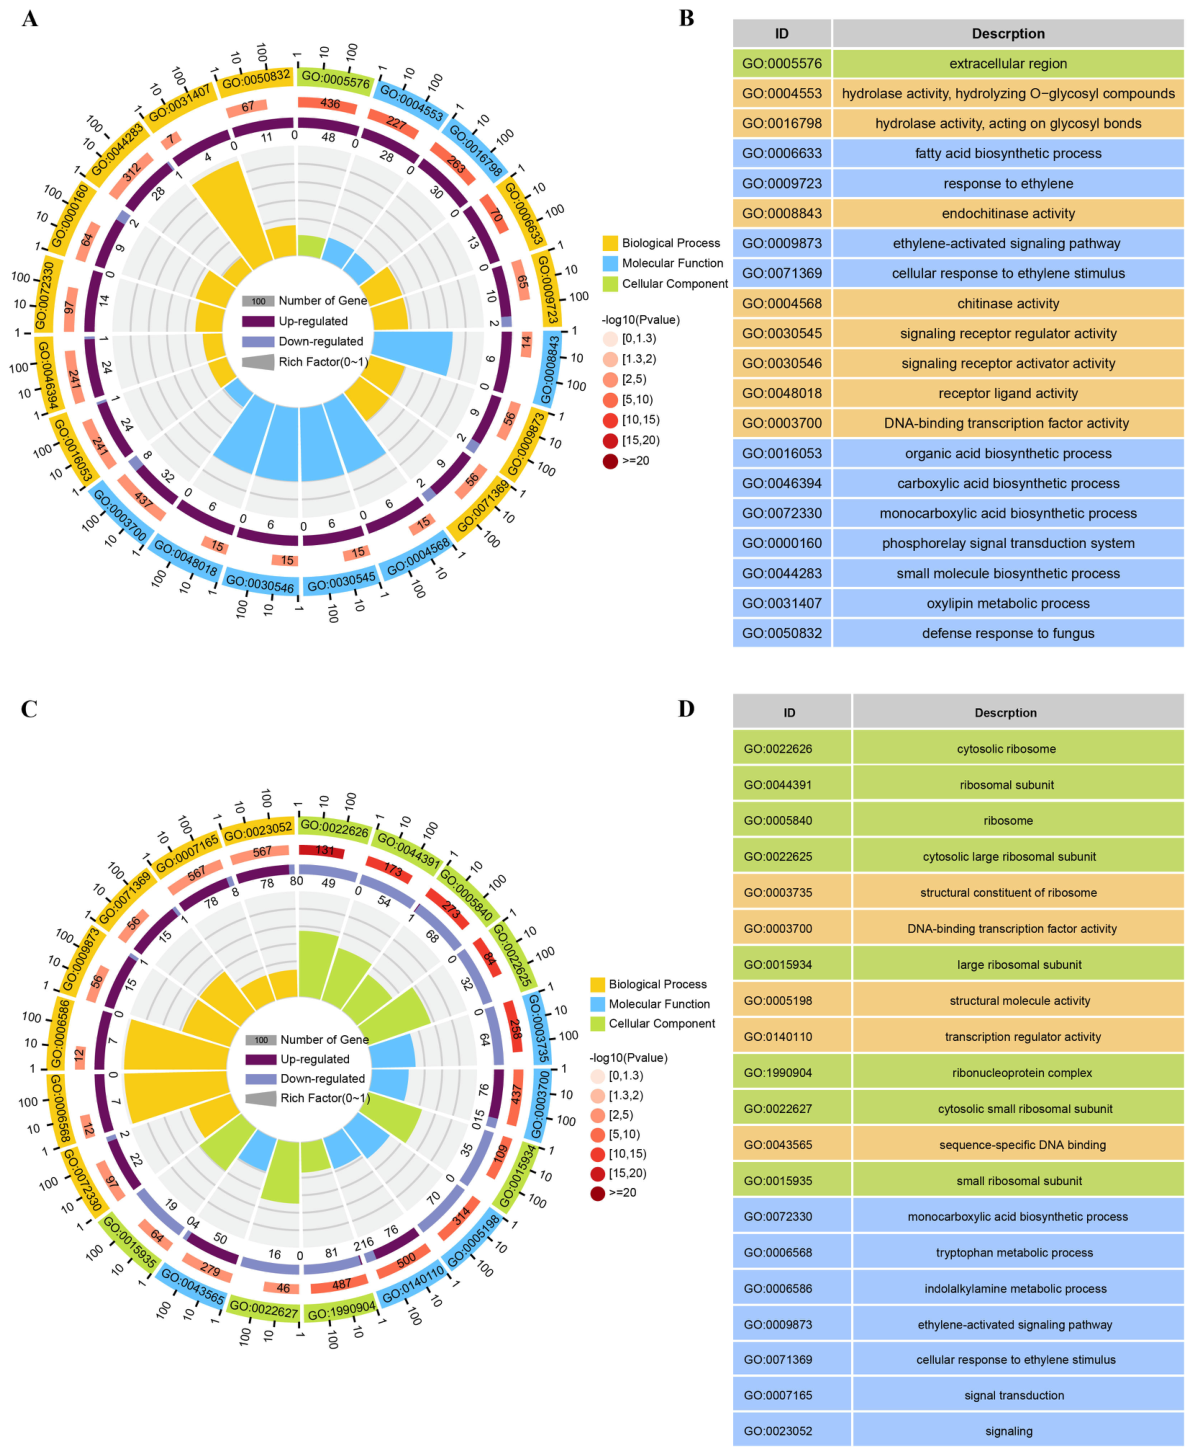
Gene Ontology (GO) enrichment analysis identified a small set of responses shared by both rice accessions after BPH feeding. Genes associated with the ethylene-activated signaling pathway, the cellular response to ethylene stimulus, the monocarboxylic acid biosynthetic process and DNA-binding transcription factor activity were enriched in both species (Figure 2A–D; Tables S3 and S4). Beyond this common core, the two species diverged sharply. In O. nivara, the most prominent terms included chitinase and endochitinase activity, the extracellular region, cellular component accompanied by fatty acid, organic acid, carboxylic acid and small molecule biosynthetic process, oxylipin metabolic process, defense response to fungus, phosphorelay signal transduction system and signaling receptor regulator activity and receptor ligand activities (Figure 2A,B; Table S3). In O. rufipogon, enrichment was dominated by cytosolic ribosome, ribosomal subunit, structural constituent of ribosome, ribonucleoprotein complex and small ribosomal subunit, together with tryptophan metabolic process, indolalkylamine metabolic process, sequence-specific DNA binding, and general signal transduction and signaling terms (Figure 2C,D; Table S4). The resistant species thus invested in chitin-degrading enzyme activity, secondary metabolite biosynthesis and antifungal defense, whereas the susceptible species mounted mainly ribosome- and protein-biosynthesis-related responses upon BPH feeding.
Figure 2.
GO (Gene Ontology) enrichment analysis of differentially expressed genes (DEGs) in rice after BPH feeding. (A) Circular GO enrichment plot of DEGs in O. nivara after BPH feeding. (B) Top 20 enriched GO terms of DEGs in O. nivara after BPH feeding. (C) Circular GO enrichment plot of DEGs in O. rufipogon after BPH feeding. (D) Top 20 enriched GO terms of DEGs in O. rufipogon after BPH feeding.
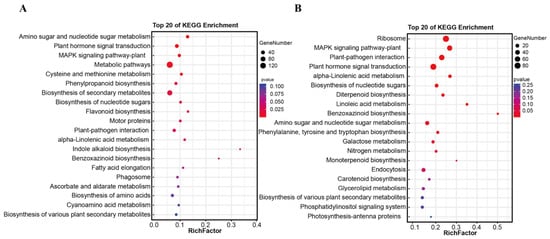
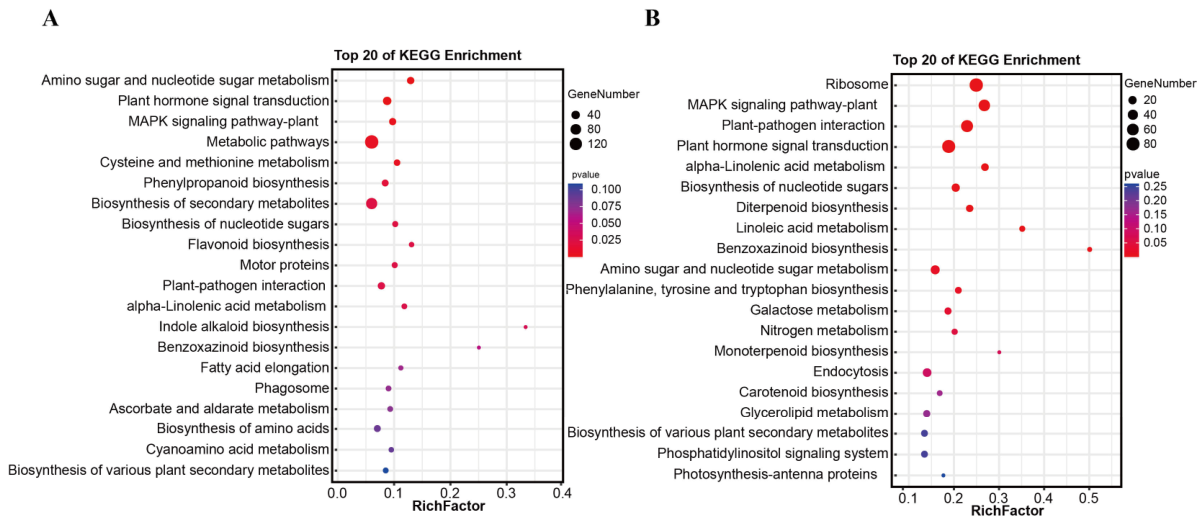
KEGG analysis of all DEGs gave the same contrast. In O. nivara (Figure 3A; Table S5), DEGs were significantly enriched in pathways associated with primary and secondary metabolism, including metabolic pathways, biosynthesis of secondary metabolites, phenylpropanoid biosynthesis, flavonoid biosynthesis, cysteine and methionine metabolism, amino sugar and nucleotide sugar metabolism, indole alkaloid biosynthesis, fatty acid elongation, ascorbate and aldarate metabolism, biosynthesis of amino acids, cyanoamino acid metabolism, and biosynthesis of various plant secondary metabolites. Additional enriched terms included motor proteins and phagosome. In contrast, DEGs in O. rufipogon (Figure 3B; Table S6) were uniquely enriched in ribosome, diterpenoid biosynthesis, linoleic acid metabolism, phenylalanine, tyrosine and tryptophan biosynthesis, galactose metabolism, nitrogen metabolism, monoterpenoid biosynthesis, endocytosis, carotenoid biosynthesis, glycerolipid metabolism, phosphatidylinositol signaling system, and photosynthesis-antenna proteins. Collectively, the KEGG enrichment results demonstrate that O. nivara selectively activates a defined set of primary metabolism and multiple secondary metabolite biosynthesis pathways upon BPH feeding, while O. rufipogon mainly triggers ribosome-related pathways together with terpenoid, amino acid and lipid metabolic responses.
Figure 3.
KEGG pathway enrichment analysis of differentially expressed genes (DEGs) in rice after BPH feeding. (A) KEGG enrichment results of DEGs in O. nivara. (B) KEGG enrichment results of DEGs in O. rufipogon. Each row represents an enriched KEGG pathway. The size of the circles indicates the number of DEGs enriched in each pathway, while the color represents the statistical significance of enrichment (p-value). Redder colors indicate more significant enrichment, and larger circles indicate a greater number of enriched genes.
3.3. Identification of DEGs Involved in BPH Resistance
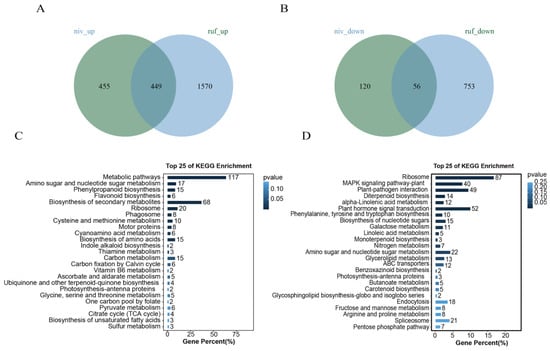
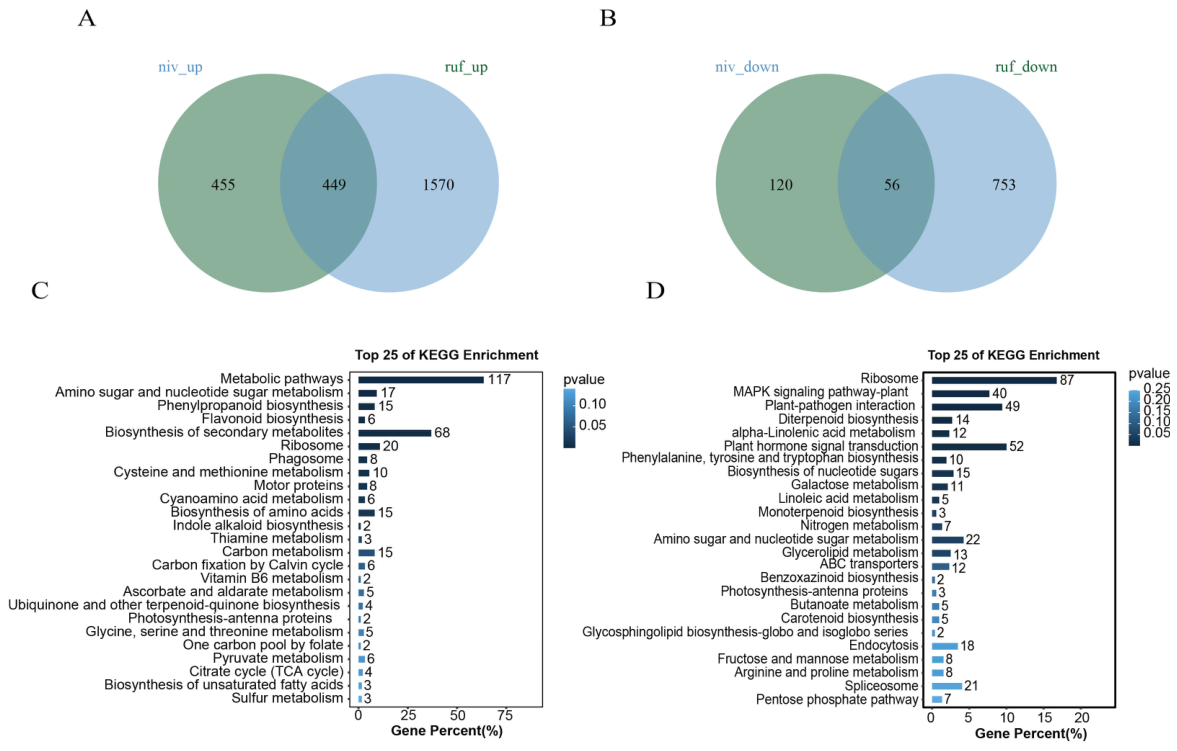
Venn diagrams were used to identify unique and overlapping DEGs between O. rufipogon and O. nivara plants, thereby revealing transcriptional shifts induced by BPH feeding. A total of 575 DEGs were uniquely identified in O. nivara after BPH infestation, including 455 upregulated and 120 downregulated genes, whereas 2323 DEGs were unique to O. rufipogon, of which 1570 were upregulated and 753 were downregulated (Figure 4A–D; Tables S7 and S8). During BPH infestation, 449 upregulated and 56 downregulated DEGs overlapped in both wild rice species (Figure 4A–D).
Figure 4.
Unique differentially expressed genes (DEGs) identified in O. nivara and O. rufipogon after brown planthopper (BPH) infestation. (A) Venn diagram showing upregulated DEGs in O. nivara and O. rufipogon after BPH feeding. (B) Venn diagram showing downregulated DEGs in O. nivara and O. rufipogon after BPH feeding. (C) KEGG pathway enrichment analysis of DEGs uniquely identified in O. nivara. (D) KEGG pathway enrichment analysis of DEGs uniquely identified in O. rufipogon. In the KEGG enrichment analyses, the color intensity represents the significance of enrichment (p-value), with darker colors indicating lower p-values and higher statistical significance.
KEGG pathway analysis demonstrated that accession-specific DEGs of O. nivara and O. rufipogon were overrepresented in separate functional pathways. In the resistant O. nivara, accession-specific DEGs were markedly enriched in secondary metabolic pathways responsible for defense compounds, notably phenylpropanoid and flavonoid biosynthesis (Figure 4C). Additional pathways specifically enriched in this resistant accession included metabolic pathways, amino sugar and nucleotide sugar metabolism, biosynthesis of secondary metabolites, phagosome, cysteine and methionine metabolism, motor proteins, biosynthesis of amino acids, carbon metabolism, indole alkaloid biosynthesis, thiamine metabolism, carbon fixation by Calvin cycle, vitamin B6 metabolism, ascorbate and aldarate metabolism, ubiquinone and other terpenoid–quinone biosynthesis, photosynthesis–antenna proteins, glycine, serine and threonine metabolism, one carbon pool by folate, pyruvate metabolism, citrate cycle (TCA cycle), biosynthesis of unsaturated fatty acids, and sulfur metabolism.
In contrast, accession-specific DEGs derived from susceptible O. rufipogon were largely overrepresented in ribosome, MAPK signaling pathway-plant, plant-pathogen interaction, diterpenoid biosynthesis, α-linolenic acid metabolism, plant hormone signal transduction, phenylalanine, tyrosine and tryptophan biosynthesis, biosynthesis of nucleotide sugars, galactose metabolism, linoleic acid metabolism, monoterpenoid biosynthesis, nitrogen metabolism, amino sugar and nucleotide sugar metabolism, glycerolipid metabolism, ABC transporters, benzoxazinoid biosynthesis, photosynthesis-ntenna proteins, butanoate metabolism, carotenoid biosynthesis, glycosphingolipid biosynthesisglobo and isoglobo series, endocytosis, fructose and mannose metabolism, arginine and proline metabolism, spliceosome, and pentose phosphate pathway (Figure 4D).
Collectively, these observations demonstrate that although resistant and susceptible wild rice genotypes trigger overlapping basal defensive cascades under BPH herbivory, the resistant accession selectively rewires a suite of primary and secondary metabolic routes linked to the production of defense metabolites, whereas the susceptible genotype primarily activates ribosomal functions, terpenoid biosynthesis processes and various lipid and amino acid metabolic pathways.
3.4. Metabolomic Analysis of the Response to BPH Feeding
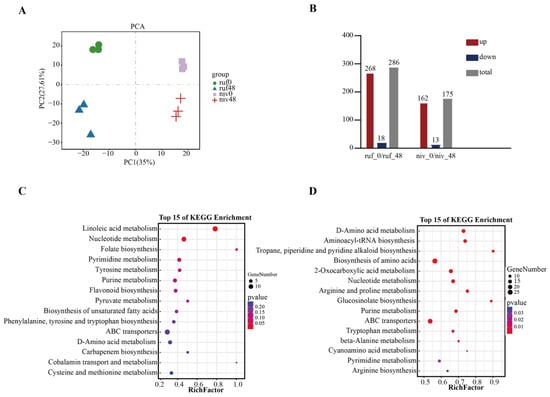
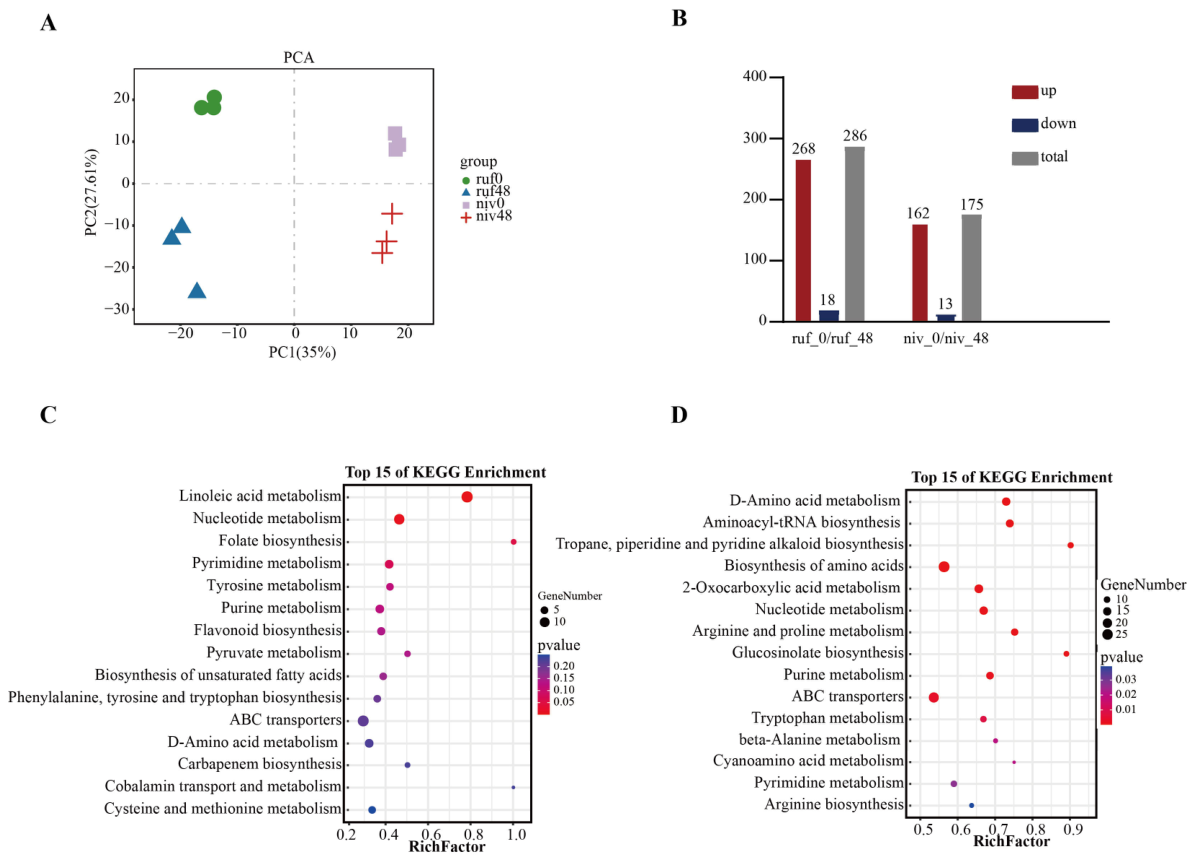
To further decipher rice responses to BPH feeding at the metabolic level, widely targeted metabolomic profiling was performed on resistant O. nivara and susceptible O. rufipogon. Leaf sheath tissues were harvested before infestation and 48 h after BPH treatment, together with time-matched non-infested controls, and analyzed by UPLC–MS/MS to resolve the BPH-induced metabolic rearrangement. In total, 962 metabolites grouped into 11 primary classes were detected across all samples (Table S9). Principal component analysis (PCA) showed clear separation among treatment groups, with biological replicates within each group clustering tightly (Figure 5A). These results confirm that the metabolomic dataset is reproducible and robust and thus suitable for downstream comparative analysis.
Figure 5.
Metabolic responses of O. nivara and O. rufipogon to BPH feeding. (A) Principal component analysis (PCA) of total detected metabolites in non-infested control (0 h) and BPH-infested (48 h) samples of O. nivara and O. rufipogon; both groups were harvested at the same time. (B) Numbers of total, upregulated, and downregulated DAMs identified in O. nivara (niv0 vs. niv48) and O. rufipogon (ruf0 vs. ruf48) following BPH feeding. (C) KEGG pathway enrichment analysis of DAMs in O. nivara in response to 48 h of BPH feeding for 48 h. (D) KEGG pathway enrichment analysis of DAMs in O. rufipogon in response to 48 h of BPH feeding for 48 h.
With |log2(fold change)| ≥ 1 and VIP ≥ 1 as thresholds, 175 differentially accumulated metabolites (DAMs) were identified between niv0 and niv48 (162 upregulated and 13 downregulated), and 286 DAMs between ruf0 and ruf48 (268 were upregulated and 18 were downregulated) (Figure 5B; Tables S10 and S11).
KEGG enrichment of the DAMs differed between species. In O. nivara, enriched pathways included linoleic acid metabolism, nucleotide metabolism, folate biosynthesis, pyrimidine metabolism, tyrosine metabolism, purine metabolism, flavonoid biosynthesis, pyruvate metabolism, biosynthesis of unsaturated fatty acids, phenylalanine, tyrosine and tryptophan biosynthesis, ABC transporters, D-amino acid metabolism, carbapenem biosynthesis, cobalamin transport and metabolism, and cysteine and methionine metabolism (Figure 5C). Several of these pathways channel intermediates into secondary metabolism and the production of bioactive defensive compounds.
In O. rufipogon, the enriched set comprised D-amino acid metabolism, aminoacyl-tRNA biosynthesis, tropane, piperidine and pyridine alkaloid biosynthesis, biosynthesis of amino acids, 2-oxocarboxylic acid metabolism, nucleotide metabolism, arginine and proline metabolism, glucosinolate biosynthesis, purine metabolism, ABC transporters, tryptophan metabolism, beta-alanine metabolism, cyanoamino acid metabolism, pyrimidine metabolism, and arginine biosynthesis (Figure 5D), pointing to a broad reorganization of amino acid, nucleotide and alkaloid metabolic pathways.
Collectively, the metabolomic profiling and KEGG enrichment analyses reveal distinct metabolic strategies in the susceptible and resistant wild rice accessions in response to BPH infestation. O. nivara couples BPH feeding to the activation of fatty acid and flavonoid-related secondary metabolic pathways, whereas O. rufipogon exhibits prominent changes in amino acid, nucleotide and alkaloid biosynthesis pathways. In O. nivara, this reconfiguration is consistent with the build-up of defense-related metabolites and with the antibiosis observed in the bioassay.
3.5. Identification of Metabolites That Mediate BPH Resistance
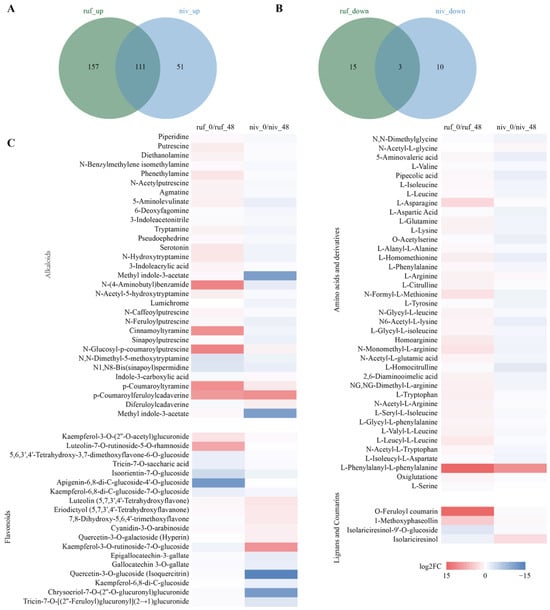
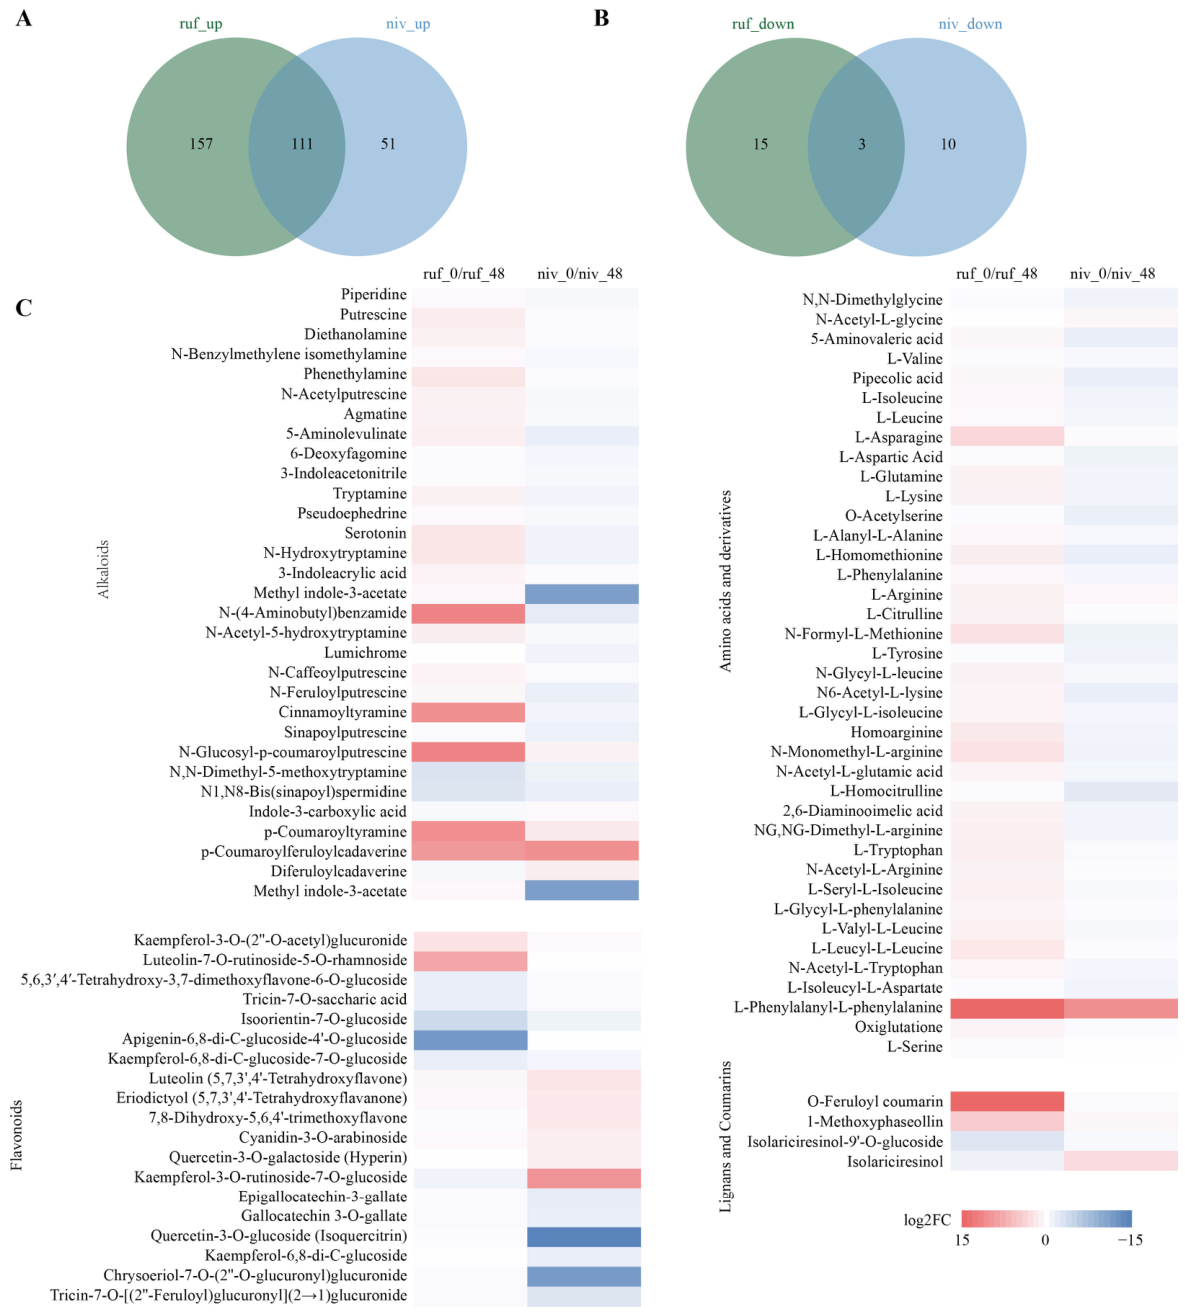
Shared and accession-specific metabolites were then separated. A total of 114 metabolites changed in both comparisons (ruf0 vs. ruf48 and niv0 vs. niv48): 3 flavonoids, 12 organic acids, 13 phenolic acids, 14 amino acids and derivatives, 14 nucleotides and derivatives, 16 alkaloids, 39 lipids, and 3 metabolites in other categories (Figure 6A,B; Tables S12 and S13). In O. rufipogon, 172 accession-specific metabolites were identified, of which 157 were upregulated and 15 were downregulated following BPH infestation (Figure 6A,B). In contrast, 61 accession-specific metabolites were detected in the resistant accession O. nivara, including 51 upregulated and 10 downregulated metabolites (Figure 6A,B). Hierarchical clustering of these accession-specific metabolites separated the two species: flavonoids and lignans/coumarins were strongly induced in O. nivara, while alkaloids, amino acids and their derivatives, lipids, and nucleotides and their derivatives were induced in O. rufipogon. In O. nivara, the majority of amino acid derivatives and lipid compounds showed no marked upregulation. By contrast, O. rufipogon exhibited elevated levels of numerous lipid metabolites post-feeding, alongside widespread activation of alkaloid and amino acid metabolism.
Figure 6.
Unique differentially accumulated metabolites (DAMs) in the two wild rice species (O. nivara and O. rufipogon) after 48 h of BPH feeding. (A) Venn diagram showing the unique upregulated DAMs in the two wild rice species after 48 h of BPH feeding. The overlapping region represents common upregulated metabolites between the two species, while the unique regions highlight metabolites specifically upregulated in either species. (B) Venn diagram showing the unique downregulated DAMs in the two wild rice species after 48 h of BPH feeding. Similar to panel A, the overlap indicates shared downregulated metabolites, with the unique regions representing metabolites specifically downregulated in either species. (C) Heatmap displaying the changes in metabolite fold changes (log2FC) between the non-infested control (0 h) and 48 h of BPH feeding. The heatmap highlights the following categories of metabolites: Alkaloids, Amino acids and derivatives, Flavonoids, and Lignans and Coumarins. The color scale represents the log2 fold change, with red indicating upregulation and blue indicating downregulation of metabolites in response to BPH feeding.
The heatmap thus shows that flavonoids and lignan/coumarin tend to accumulate in the resistant accession, whereas alkaloids, amino acid derivatives and lipids accumulate predominantly in the susceptible side.
3.6. Joint Analysis of the Transcriptome and Metabolome
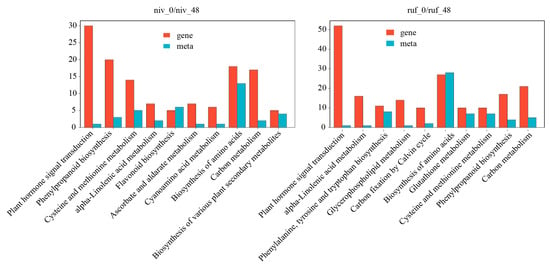
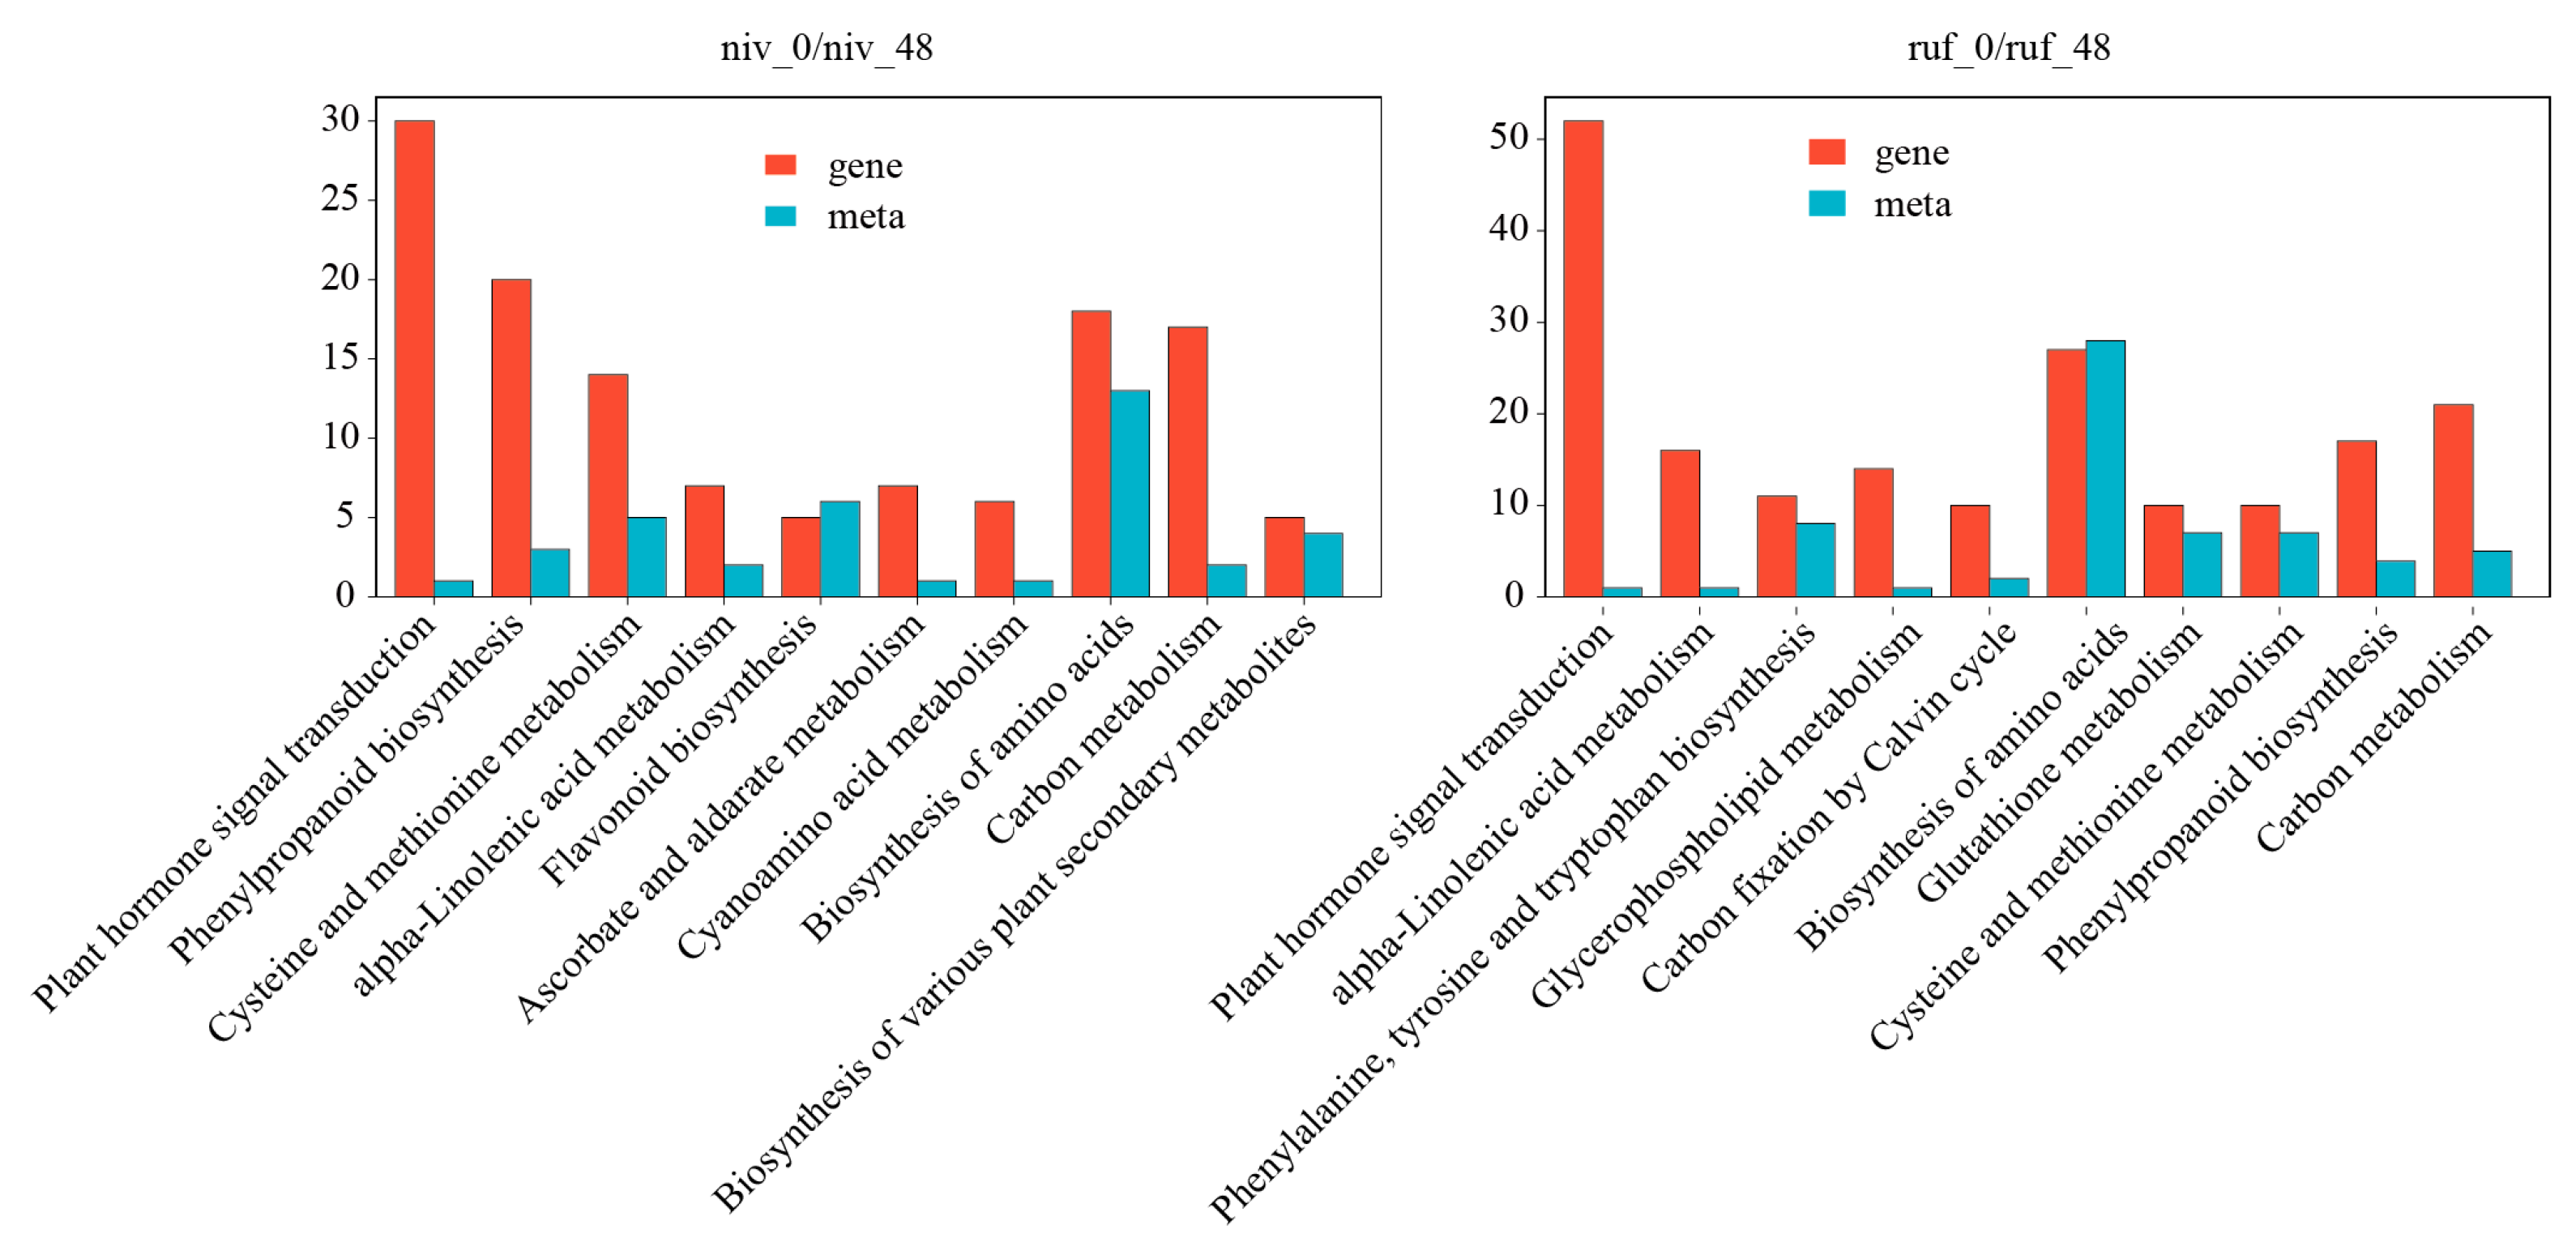
To further elucidate the regulatory networks underlying the responses of O. nivara and O. rufipogon to BPH infestation, a combined transcriptomic and metabolomic joint analysis was performed. KEGG enrichment analysis was conducted for DEGs and DAMs from niv0 vs. niv48 and ruf0 vs. ruf48 comparisons (Figure 7). Pathways enriched in both species included plant hormone signal transduction, α-linolenic acid metabolism, cysteine and methionine metabolism, phenylpropanoid biosynthesis, and carbon metabolism, and these pathways contained abundant DEGs. This shared set represents the conserved transcriptional responses to BPH feeding.
Figure 7.
Transcriptomic and metabolomic joint analysis of O. nivara and O. rufipogon after BPH infestation. KEGG enrichment analysis of DEGs and DAMs detected from niv0 vs. niv48 and ruf0 vs. ruf48 groups. The left panel represents the results for O. nivara (niv0 vs. niv48), and the right panel shows the results for O. rufipogon (ruf0 vs. ruf48). The x-axis indicates the enriched pathways, while the y-axis represents the number of DEGs and DAMs associated with each pathway.
Pathways enriched exclusively in O. nivara included flavonoid biosynthesis, ascorbate and aldarate metabolism, cyanoamino acid metabolism, biosynthesis of amino acids, and biosynthesis of various plant secondary metabolites. In each case, DEGs were accompanied by accumulated DAMs, indicating coordinated transcriptional and metabolic output toward secondary metabolite and redox homeostasis.
In O. rufipogon, the pathways unique to the species were phenylalanine, tyrosine and tryptophan biosynthesis, glycerophospholipid metabolism, carbon fixation by the Calvin cycle, biosynthesis of amino acids, glutathione metabolism, and methylpropanoid biosynthesis. In particular, glycerophospholipid metabolism contained many DEGs and DAMs, indicating strong perturbation of lipid metabolism at both the transcript and metabolite levels.
Collectively, the joint analysis shows that both species share the core signaling and metabolic modules that respond to BPH but differ in what is reprogrammed downstream: O. nivara coordinates genes and metabolite changes in flavonoid and other secondary metabolite biosynthesis pathways, whereas O. rufipogon remodels lipid and aromatic amino acid metabolism.
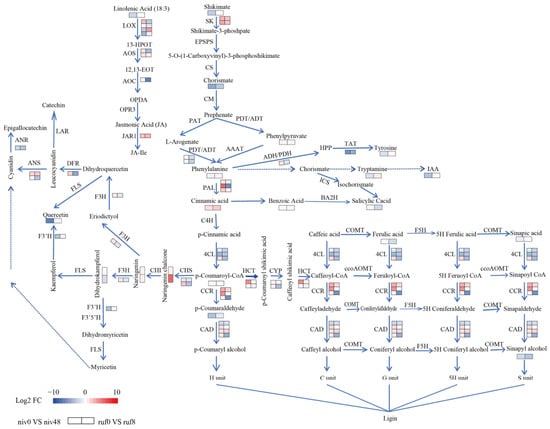
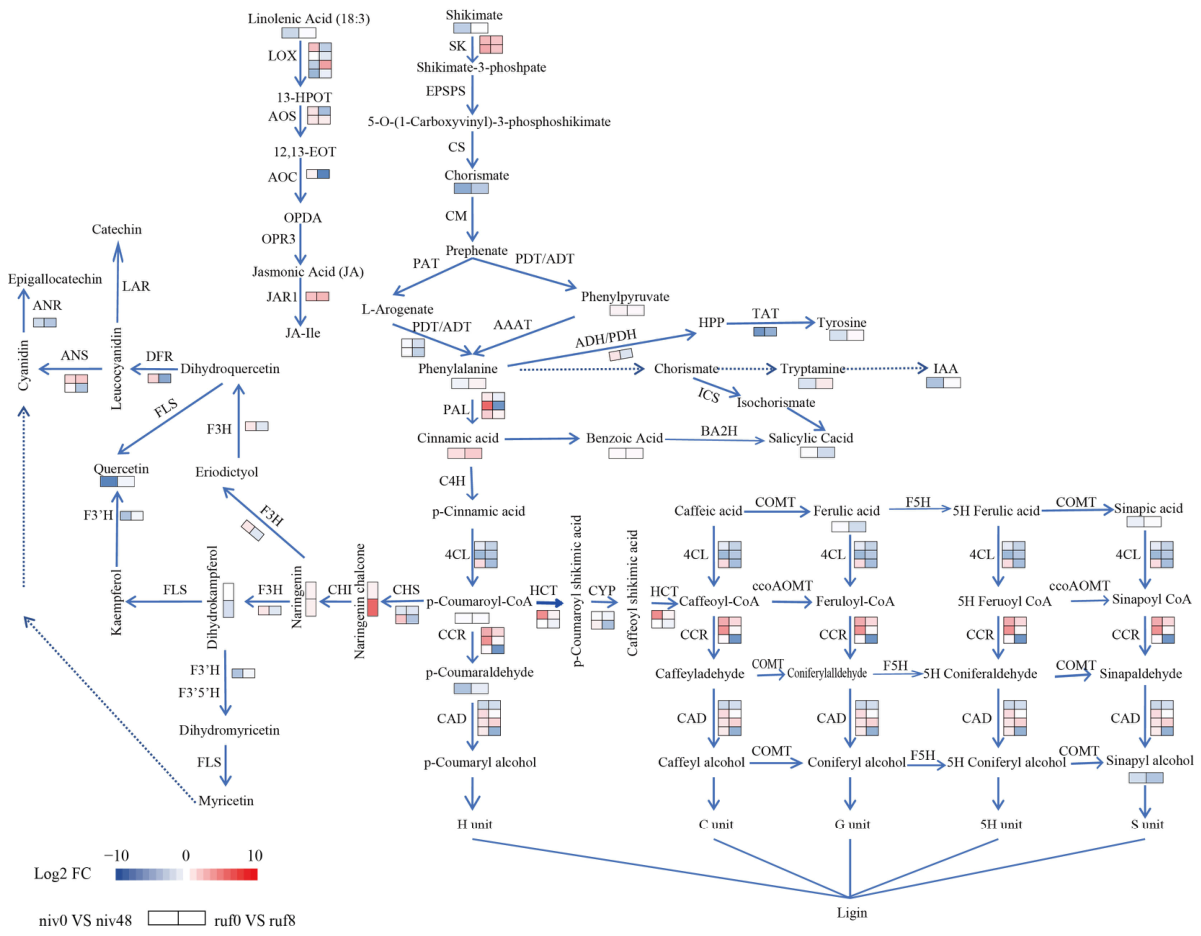
The phenylpropanoid pathway was then reconstructed from the joint data (Figure 8). It was enriched in both species, consistent with its central role in plant growth, development, and environmental interaction. Phenylalanine content declined in O. nivara after BPH feeding, whereas phenylalanine ammonia-lyase (PAL) genes were sharply induced, suggesting accelerated flux into downstream products. Notably, the BPH-induced PAL genes (OsPAL2, OsPAL3, and OsPAL4) showed differential expression patterns in the two species: OsPAL2 and OsPAL4 were upregulated in both species, although the magnitude of induction was significantly greater in the resistant O. nivara than in the susceptible O. rufipogon; whereas OsPAL3 was upregulated in O. nivara but showed no induction or downregulation in O. rufipogon.
Figure 8.
Reconstruction of BPH-resistance-related metabolic pathways integrating transcriptomic and metabolomic data from O. nivara and O. rufipogon after BPH infestation. Niv0 and niv48 indicate non-infested control and 48 h BPH-infested O. nivara plants, respectively, while ruf0 and ruf48 indicate the corresponding O. rufipogon samples, respectively. Color changes indicate the degree and direction of variation between 0 h and 48 h of BPH feeding.
Early phenylpropanoid genes followed the same trend: cinnamate 4-hydroxylase (C4H) converts cinnamic acid to p-coumaric acid, which was subsequently converted into p-coumaroyl-CoA by 4-coumarate-CoA ligase (4CL). Most 4CL genes exhibited strong upregulation in O. nivara, indicating increased precursor supply for downstream branches.
P-Coumaroyl-CoA represents the branch point between flavonoid and lignin biosynthesis. In the flavonoid branch, chalcone synthase (CHS) commits precursors to the pathway, and flavanone 3-hydroxylase (F3H), dihydroflavonol 4-reductase (DFR), anthocyanidin synthase (ANS), leucoanthocyanidin reductase (LAR), and anthocyanidin reductase (ANR) catalyze the subsequent steps. F3H (LOC_Os04g56700), DFR (LOC_Os01g44260), and ANS (LOC_Os06g42130) were strongly induced in O. nivara but markedly downregulated in O. rufipogon, indicating an O. nivara-specific activation of flavonoid biosynthesis in response to insect attack.
Lignin-related genes were more conservative. Two hydroxycinnamoyl-CoA shikimate/quinate hydroxycinnamoyl transferase (HCT) genes were induced in O. nivara but repressed or only weakly induced in O. rufipogon. By contrast, cinnamoyl-CoA reductase (CCR) and cinnamyl alcohol dehydrogenase (CAD) responded in both species, more strongly in O. nivara. Lignin biosynthesis therefore appears to form part of a shared basal defense response rather than a determinant of resistance.
Phenylpropanoid metabolism also intersects hormone biosynthesis. Plants synthesize SA through two separate routes: the ICS pathway from chorismate, and the PAL pathway, in which cinnamic acid serves as an intermediate for SA formation. Metabolite profiling showed accumulation of SA in O. nivara but a decline in O. rufipogon. Auxin precursors moved in the opposite direction: tyrosine, tryptamine, and indole-3-acetic acid (IAA) decreased in O. nivara but increased in O. rufipogon, indicating distinct hormonal reprogramming in the resistant and susceptible species.
Jasmonic acid (JA) biosynthesis from α-linolenic acid was strongly induced in O. nivara. Two lipoxygenase (LOX) genes (LOC_Os03g49260 and LOC_Os03g49380), two allene oxide synthase (AOS) genes (LOC_Os03g12500 and LOC_Os03g55800), allene oxide cyclase (AOC) genes (LOC_Os03g32314), and JASMONATE RESISTANT 1 (JAR1) (LOC_Os01g12160) were all upregulated in O. nivara, but downregulated or only weakly induced in O. rufipogon, consistent with the enhanced accumulation of JA-related metabolites in O. nivara.
Upstream of phenylpropanoid metabolism, Shikimate kinase (SK; LOC_Os02g43770) and arogenate/prephenate dehydratase (ADT/PDT; LOC_Os09g39230) were both strongly induced in O. nivara, supporting increased metabolic flux toward aromatic amino acid biosynthesis.
In summary, BPH feeding reprograms both primary and secondary metabolism in O. nivara, and activation of the shikimate–phenylpropanoid–flavonoid metabolic axis together with JA/SA responses accompanies resistance, whereas lignin biosynthesis appears to function as a shared basal defense in both species.
3.7. Functional Verification of Hormone Signaling and Expression of Defense-Related Genes
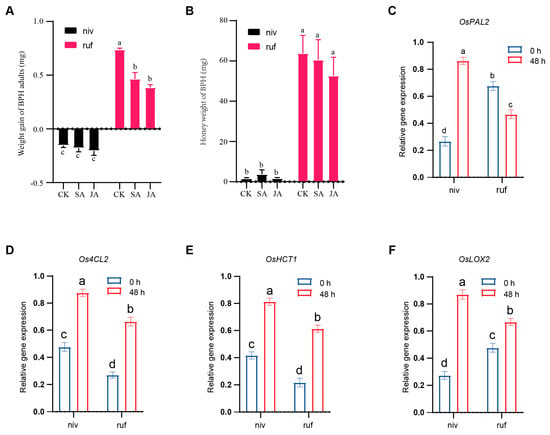
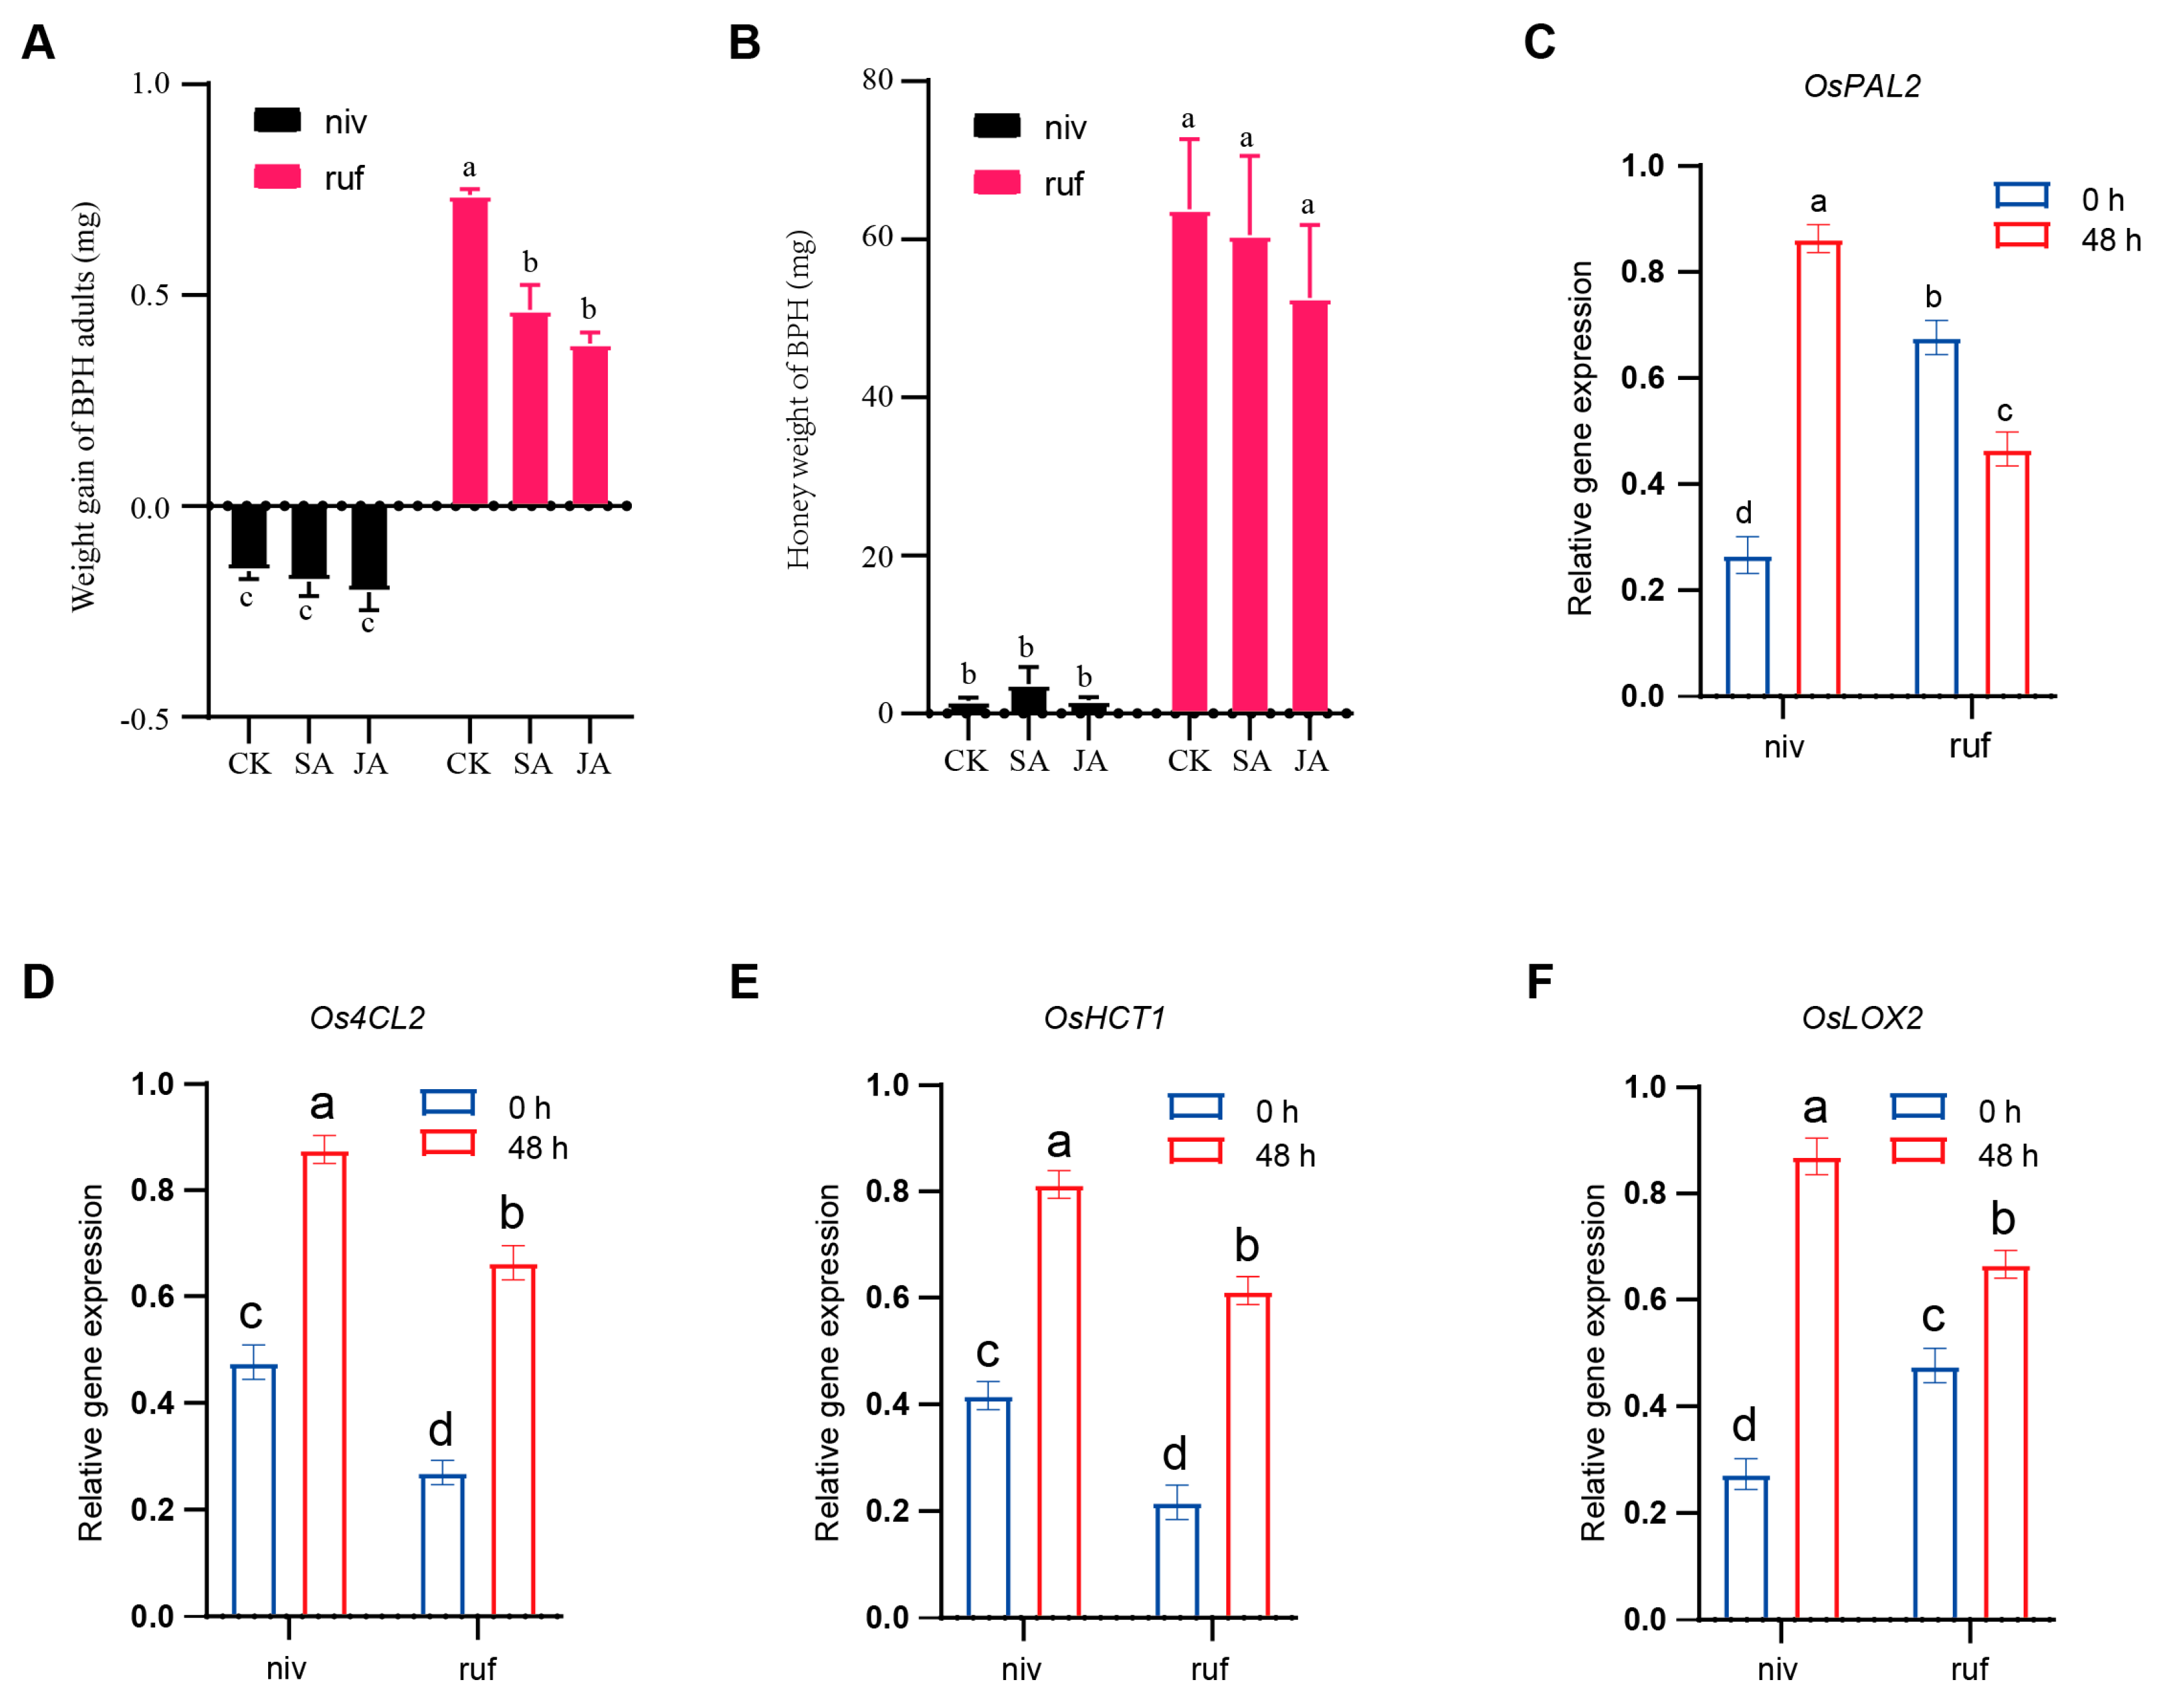
The transcriptomic, metabolomic, and combined analyses indicated that JA and SA likely play vital roles in the defense of O. nivara against BPH. To determine whether JA and SA mediate BPH resistance in O. nivara, we measured BPH performance on O. nivara and O. rufipogon seedlings treated with exogenous JA and SA. The body weight gain of BPHs was significantly lower on JA- and SA-treated O. rufipogon plants than on control plants, whereas honeydew excretion showed a decreasing trend but did not differ significantly among the three treatments (Figure 9A,B). For O. nivara, the BPH performance indices in the JA/SA spraying groups showed no significant difference from those of the control group. These findings indicate that exogenous JA or SA can effectively enhance resistance in the susceptible O. rufipogon, and they corroborate that the high endogenous JA/SA levels in O. nivara are crucial for its resistance, consistent with the hormone signaling enrichment observed in the transcriptome analysis. The enhancement of resistance in O. rufipogon by exogenous JA/SA was consistent across the three biological replicates, whereas no significant additional effect was detected in the already highly resistant O. nivara; exact p-values for these comparisons are provided in Figure 9A,B and the source data.
Figure 9.
Functional verification of jasmonic acid (JA) and salicylic acid (SA) signaling and qRT-PCR validation of defense-related genes in O. nivara and O. rufipogon. (A) Weight gain and (B) honeydew excretion of BPH adults fed for 48 h on plants sprayed with distilled water (CK), 100 μmol/L JA, or 50 μmol/L SA; different lowercase letters indicate significant differences among treatments (one-way ANOVA followed by Tukey’s HSD, p < 0.05). (C–F) Relative expression levels of OsPAL2 (C), Os4CL2 (D), OsHCT1 (E), and OsLOX2 (F) in O. nivara (niv) and O. rufipogon (ruf) in non-infested controls (0 h) and 48 h after BPH feeding, determined by qRT-PCR with the rice Actin gene as the internal reference. Data are presented as mean ± SE (n = 3); different lowercase letters indicate significant differences at p < 0.05 (one-way ANOVA).
To validate the transcriptomic results, the expression patterns of four representative defense-related genes (OsPAL2, Os4CL2, OsHCT1, and OsLOX2) were examined by qRT-PCR. At 48 h after BPH feeding, Os4CL2, OsHCT1, and OsLOX2 were upregulated in both accessions, whereas OsPAL2 was upregulated in O. nivara but downregulated in O. rufipogon. Despite this accession-specific difference in OsPAL2 expression, the qRT-PCR results were in good agreement with the RNA-seq data for all four genes (Figure 9C–F; Tables S14 and S15). The qRT-PCR results are presented in Figure 9C–F alongside the RNA-seq-derived expression trends; both the direction and relative magnitude of regulation were concordant between the two independent platforms for all four validated genes (Tables S14–S16), confirming the reliability of the transcriptomic profiling.
In parallel, the expression patterns of defense-related genes in O. nivara were markedly enhanced by BPH feeding: the activities of PAL and LOX increased, whereas the corresponding increases in O. rufipogon were significantly smaller. These results translate the upregulation of defense-related genes at the transcriptomic level into enhanced enzymatic activity, providing direct biochemical evidence for the transcriptional and metabolic reprogramming identified above.
4. Discussion
Resistance to phloem-feeding insects is a composite trait shaped by long-standing coevolution [11]. By combining antibiosis assays with transcriptome and metabolome profiling, we show that two closely related wild rice species deploy fundamentally different strategies against the same herbivore. Both activate a common basal program, but effective resistance in O. nivara is associated with a narrow, pathway-focused rearrangement of hormone signaling and phenylpropanoid metabolism rather than with a stronger overall response.
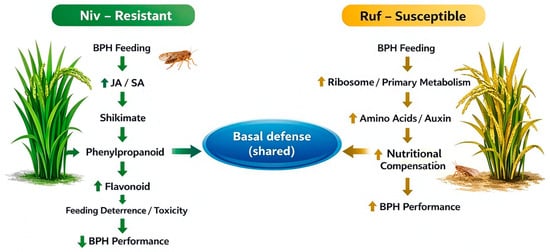
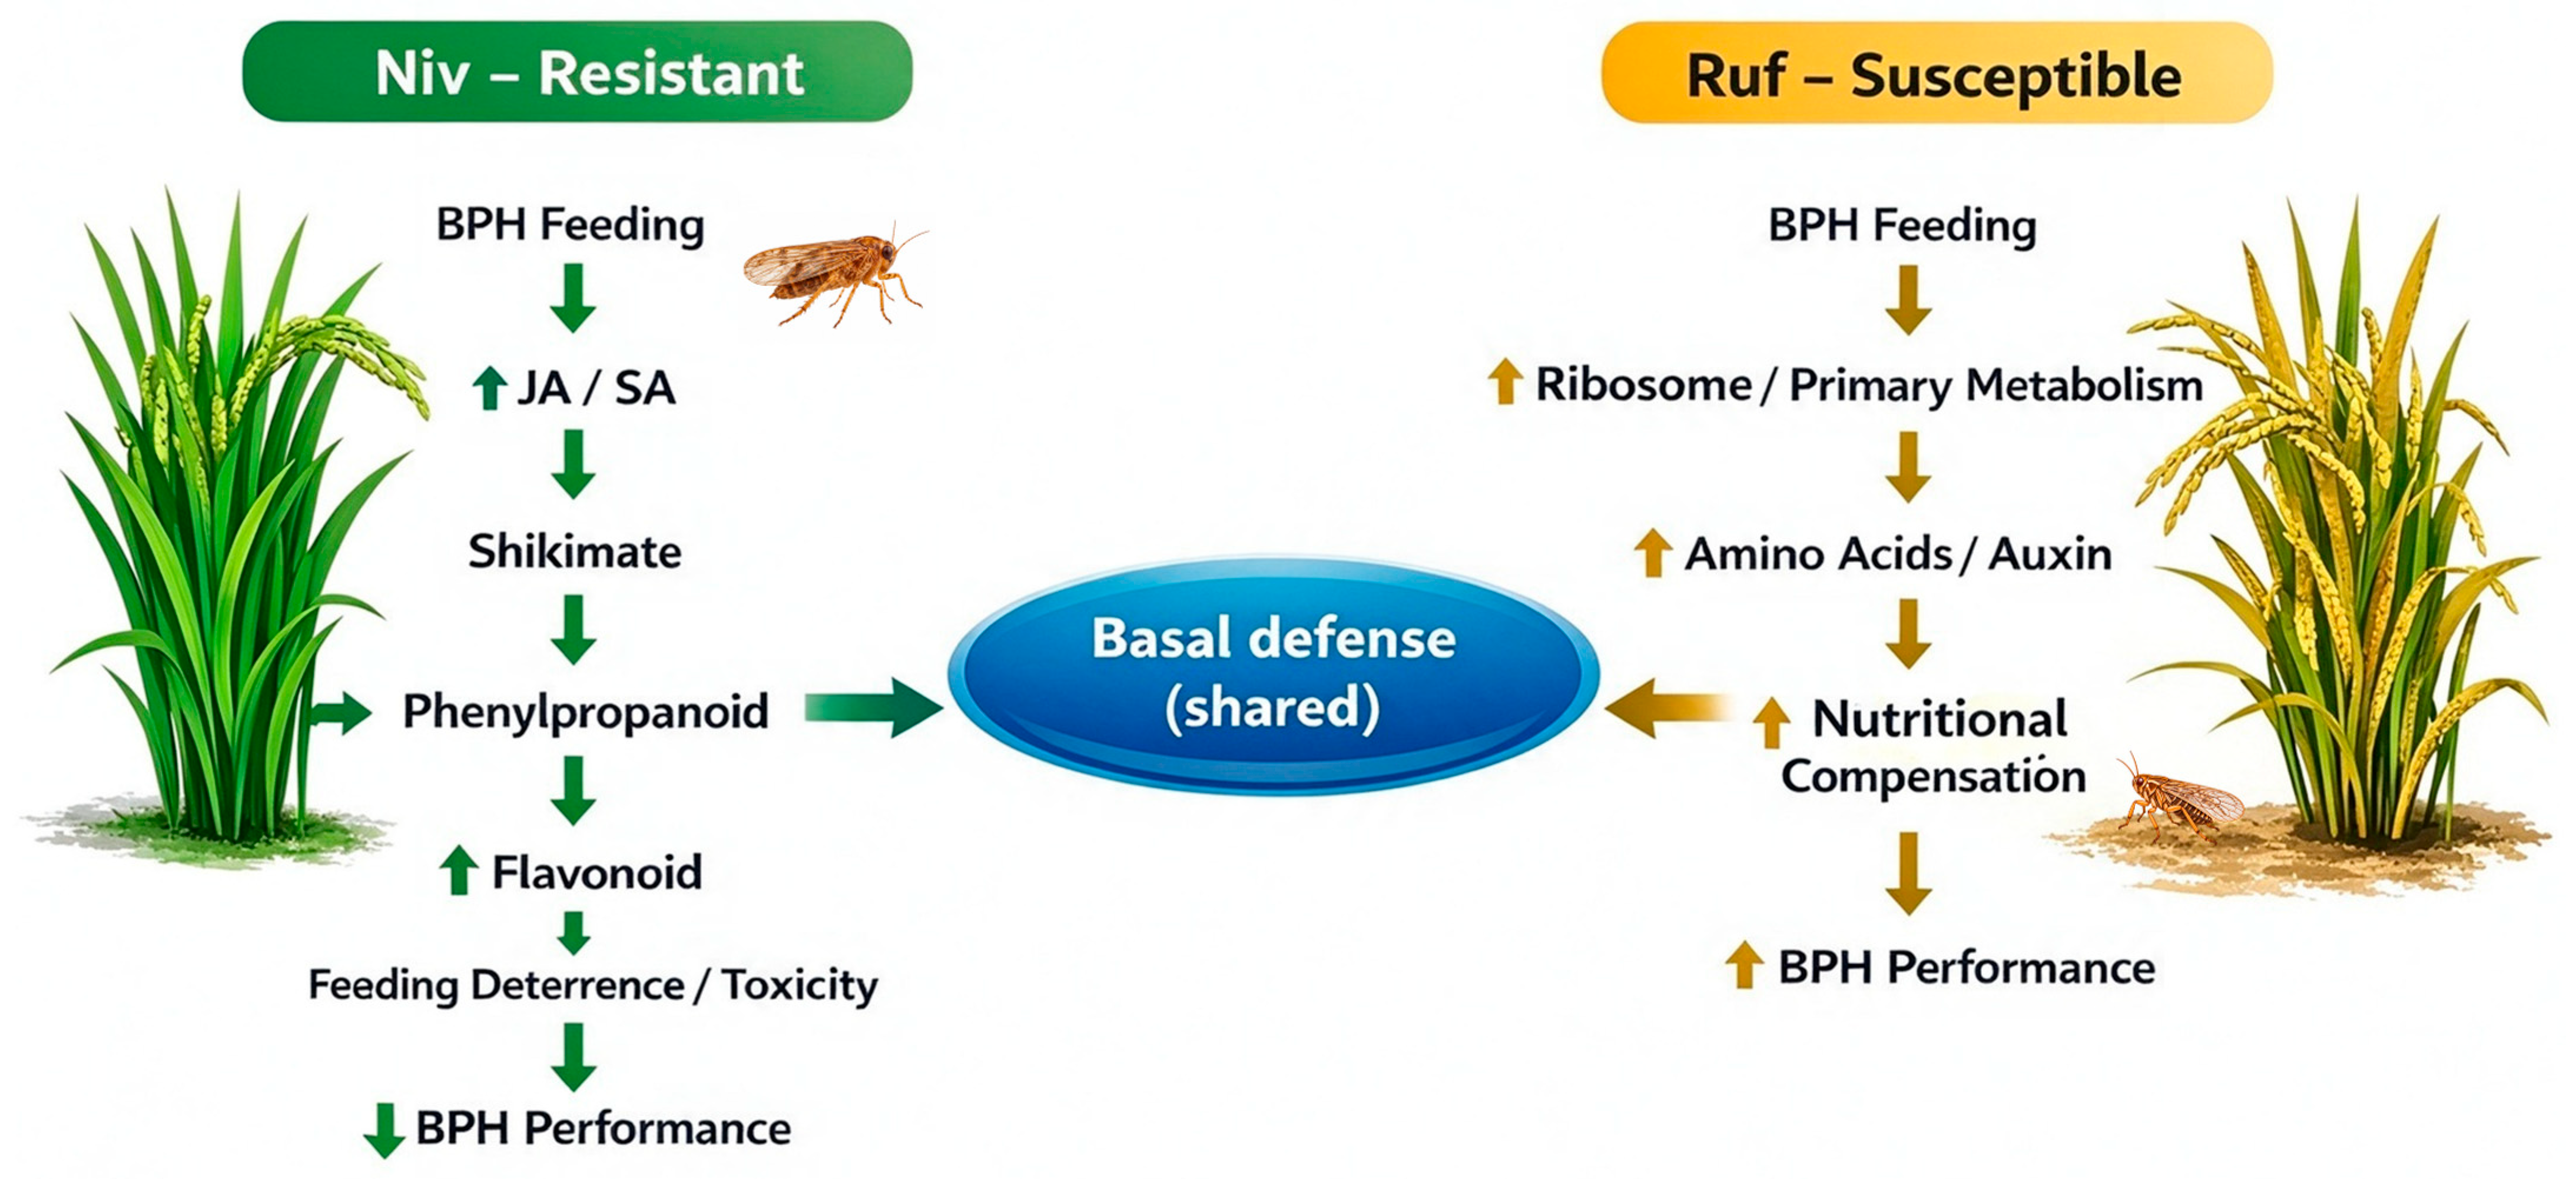
Consistent with its strong antibiosis against BPH, O. nivara exhibited markedly fewer differentially expressed genes and metabolites than O. rufipogon. This pattern echoes earlier work on rice near-isogenic lines carrying the resistance gene Bph30, in which the resistant genotype mounted a more focused and efficient defense response than the susceptible one [15,26]. Resistance therefore arises not from a stronger overall response, but from a more efficient prioritization of defense-related pathways. By contrast, the extensive transcriptional and metabolic changes observed in O. rufipogon are more consistent with a compensatory stress response that fails to restrict feeding (Figure 10).
Figure 10.
Interaction model between wild rice and BPH. In the O. nivara (resistant) species, BPH feeding triggers the accumulation of jasmonic acid (JA) and salicylic acid (SA), leading to the activation of the shikimate pathway, which increases phenylpropanoid and flavonoid production. This induces feeding deterrence and toxicity, resulting in reduced BPH performance. In the O. rufipogon (susceptible) species, BPH feeding enhances ribosomal activity and primary metabolism, leading to increased amino acid and auxin production. This process triggers nutritional compensation, improving BPH performance. The central pathway labeled “Basal defense (shared)” represents a common defense mechanism activated in both wild rice species during BPH interaction. Upward and downward arrows indicate increased and decreased levels, respectively.
The regulation of secondary metabolism is central to this difference. In O. nivara, BPH feeding strongly activated the shikimate-phenylpropanoid-flavonoid axis, as shown by the induction of biosynthetic genes and the accumulation of lignans/coumarins and flavonoids [39]. These compounds are widely reported to deter feeding, impair insect development and reinforce defense signaling [17,40,41]. Comparative metabolomics of rice-BPH interactions has likewise linked resistance to shikimate pathway activity [35], and Bph30-transgenic plants accumulated flavonoids while their amino acid derivatives declined after feeding [36]. In O. rufipogon, by contrast, the predominant accumulation of amino acids, nucleotides, and lipids points to a shift toward primary metabolism and nutrient turnover that may improve phloem quality for the insect. We emphasize that both this metabolic axis and JA-/SA-mediated resistance are inferred primarily from coordinated transcriptomic, metabolomic, and correlation evidence rather than from direct genetic or enzymatic perturbation. These conclusions therefore describe associative, systems-level mechanisms that await confirmation by targeted gene knockouts, complementation and enzymatic assays.
Hormonal reprogramming accompanies these metabolic differences. O. nivara displayed coordinated JA and SA signaling together with suppressed auxin biosynthesis [19], a configuration that favors defense over growth and is consistent with the strong induction of secondary metabolism. In O. rufipogon, JA/SA responses were weaker, and auxin levels rose, suggesting a growth-oriented response that compromises effective defense, consistent with reports that enhanced auxin signaling promotes susceptibility to various attackers [14,20,42,43]. These results underscore that resistance is determined not by individual hormone pathways, but by their integration and balance.
The two species also shared a conserved set of basal defense responses, including induction of WRKY and MYB transcription factors, MAPK signaling components, and lignin biosynthesis genes [21,22]. Lignin deposition probably reinforces tissue structure as a general defense, but its comparable induction in both species indicates that lignin alone cannot account for the difference in resistance [28,44]. Instead, resistance in O. nivara appears to arise from the selective amplification of specific downstream branches, particularly those producing defensive secondary metabolites. This is consistent with the distinct hormonal, structural, and metabolic routes through which major resistance genes such as Bph14, Bph6 and BPH15 act [25,45,46].
From an evolutionary perspective, the contrasting responses may reflect adaptation to different ecological niches [8]. As an annual species, O. nivara may have evolved a rapid, defense-focused strategy that efficiently deters herbivores, whereas the perennial O. rufipogon may rely more heavily on tolerance and regrowth. More broadly, these findings underscore that wild rice species represent not only reservoirs of individual resistance genes, but also sources of optimized regulatory and metabolic networks. Comparative genomic studies in cereals have documented extensive lineage-specific and whole-genome-duplication-driven expansion of gene families underlying stress responses and nutrient transport [47], providing substrate for such divergence.
Taken together, these results indicate that effective resistance to BPH in wild rice is associated with a coordinated defense strategy that integrates hormone signaling, transcriptional regulation, and secondary metabolism. The preferential activation of the shikimate-phenylpropanoid-flavonoid pathway, together with JA- and SA-centered hormonal reprogramming, underlies the strong resistance conferred by O. nivara. These insights provide a mechanistic framework for understanding the evolution of insect resistance in wild rice and offer valuable targets for the development of durable, pest-resistant cultivated rice varieties.
5. Conclusions
By integrating bioassays, transcriptomics, metabolomics, and pharmacological verification, this study reveals that the resistant wild rice species O. nivara defends against BPH through a shikimate-phenylpropanoid-flavonoid axis coupled with elevated JA/SA signaling and suppressed auxin biosynthesis, whereas the susceptible O. rufipogon mounts a generalized primary-metabolism response that fails to limit BPH feeding. These findings provide candidate metabolic and regulatory nodes for engineering durable BPH resistance into cultivated rice. These conclusions rest on integrative omics associations and exogenous-hormone functional assays; they describe coordinated defense patterns rather than definitive causal mechanisms and require further validation via targeted genetic and biochemical perturbation.
Supplementary Materials
The following supporting information can be downloaded at: https://www.mdpi.com/article/10.3390/agronomy16212220/s1. Figure S1: Heat map of gene expression profiles across all RNA-seq samples (Z-score normalized); Figure S2: Volcano plots of differentially expressed genes in rice response to BPH feeding.; Figure S3: Unique differentially accumulated metabolites (DAMs) in the two wild rice species (O. nivara and O. rufipogon) after 48 h of brown planthopper feeding.; Table S1: Differentially expressed genes in O.nivara after 48 h of brown planthopper feeding.; Table S2: Differentially expressed genes in O. rufipogon after 48 h of brown planthopper feeding.; Table S3 and Table S4: GO enrichment of DEGs in O. nivara and O. rufipogon; Table S5 and Table S6: KEGG enrichment of DEGs in O. nivara and O. rufipogon; Table S7 and Table S8: Venn diagram gene lists of up- and downregulated DEGs; Table S9: Metabolites detected by UPLC-MS/MS; Table S10 and Table S11: Differentially accumulated metabolites; Table S12 and Table S13: Accession-specific DAMs; Table S14: qRT-PCR amplification primers used in this study; Table S15: Group means (Mean ± SE), Tukey HSD letter markers and fixed-effect results of linear mixed models (LMMs) for all measured traits; Table S16: Comparison of expression changes in four selected genes detected by RNA-seq (TPM) and qRT-PCR.
Author Contributions
Conceptualization, methodology, software, validation, formal analysis, investigation, data curation, visualization, and writing—original draft preparation, Q.Z.; resources, supervision, funding acquisition, project administration and writing—review and editing, J.Z.; investigation, formal analysis, and data curation, K.Z.; investigation and formal analysis, Y.Z.; investigation and data curation, K.X.; investigation and validation support, Q.W.; investigation and visualization assistance, W.Y.; investigation and data sorting support, Z.W.; resources, supervision and writing—review and editing, B.D.; funding acquisition and writing—review and editing, W.X. All authors have read and agreed to the published version of the manuscript.
Funding
This work was supported by grants from the Natural Science Foundation of Hubei Province 2026AFC0529, the PhD Research Startup Foundation of Hubei University of Science and Technology (BK202327), the Open Research Fund of State Key Laboratory of Hybrid Rice (Wuhan University) KF202503, the Doctoral Research Program of Nanyang Normal University (218315), and the Open Research Fund of Hubei Key Laboratory of Grain Crop Germplasm Innovation and Genetic Improvement (2026lzjj12).
Institutional Review Board Statement
Not applicable.
Informed Consent Statement
Not applicable.
Data Availability Statement
All data supporting the findings of this study are included in the article and Supplementary Materials (Tables S1–S14, Figures S1–S3).
Conflicts of Interest
The authors declare no conflicts of interest.
Abbreviations
The following abbreviations are used in this manuscript:
| BPH | Brown planthopper |
| DEGs | Differentially expressed genes |
| DAMs | Differentially accumulated metabolites |
| GO | Gene Ontology |
| KEGG | Kyoto Encyclopedia of Genes and Genomes |
| JA | Jasmonic acid |
| SA | Salicylic acid |
| IAA | Indole-3-acetic acid |
| PAL | Phenylalanine ammonia-lyase |
| 4CL | 4-Coumarate-CoA ligase |
| CHI | Chalcone isomerase |
| C4H | Cinnamate 4-hydroxylase |
| HCT | Hydroxycinnamoyl-CoA shikimate/quinate hydroxycinnamoyl transferase |
| CHS | Chalcone synthase |
| F3H | Flavanone 3-hydroxylase |
| DFR | Dihydroflavonol 4-reductase |
| ANS | Anthocyanidin synthase |
| LAR | Leucoanthocyanidin reductase |
| ANR | Anthocyanidin reductase |
| CCR | Cinnamoyl-CoA reductase |
| CAD | Cinnamyl alcohol dehydrogenase |
| LOX | Lipoxygenase |
| AOS | Allene oxide synthase |
| AOC | Allene oxide cyclase |
| JAR1 | Jasmonate-resistant 1 |
| TPM | Transcripts per million |
| FDR | False discovery rate |
| PCA | Principal component analysis |
| OPLS-DA | Orthogonal partial least squares–discriminant analysis |
| VIP | Variable importance in projection |
| MRM | Multiple reaction monitoring |
| UPLC-MS/MS | Ultrahigh-performance liquid chromatography–tandem mass spectrometry |
| qRT-PCR | Quantitative real-time PCR |
| ANOVA | Analysis of variance |
| SE | Standard error |
References
- Cheng, X.; Zhu, L.; He, G. Towards Understanding of Molecular Interactions between Rice and the Brown Planthopper. Mol. Plant 2013, 6, 621–634. [Google Scholar] [CrossRef] [Scilit]
- Zheng, X.; Zhu, L.; He, G. Genetic and molecular understanding of host rice resistance and Nilaparvata lugens adaptation. Curr. Opin. Insect Sci. 2021, 45, 14–20. [Google Scholar] [CrossRef] [Scilit]
- Nanda, S.; Yuan, S.; Lai, F.; Wang, W.; Fu, Q.; Wan, P. Identification and analysis of miRNAs in IR56 rice in response to BPH infestations of different virulence levels. Sci. Rep. 2020, 10, 16313. [Google Scholar] [CrossRef] [Scilit]
- Li, Z.; Xue, Y.; Zhou, H.; Li, Y.; Usman, B.; Jiao, X.; Wang, X.; Liu, F.; Qin, B.; Li, R.; et al. High-resolution mapping and breeding application of a novel brown planthopper resistance gene derived from wild rice (Oryza rufipogon Griff). Rice 2019, 12, 41. [Google Scholar] [CrossRef] [Scilit]
- Muduli, L.; Pradhan, S.; Mishra, A.; Bastia, D.; Samal, K.; Agrawal, P.; Dash, M. Understanding Brown Planthopper Resistance in Rice: Genetics, Biochemical and Molecular Breeding Approaches. Rice Sci. 2021, 28, 532–546. [Google Scholar] [CrossRef] [Scilit]
- Zhao, Y.; Huang, J.; Wang, Z.; Jing, S.; Wang, Y.; Ouyang, Y.; Cai, B.; Xin, X.; Liu, X.; Zhang, C.; et al. Allelic diversity in an NLR gene BPH9 enables rice to combat planthopper variation. Proc. Natl. Acad. Sci. USA 2016, 113, 12850–12855. [Google Scholar] [CrossRef] [Scilit]
- Zhou, C.; Zhang, Q.; Chen, Y.; Huang, J.; Guo, Q.; Li, Y.; Wang, W.; Qiu, Y.; Guan, W.; Zhang, J.; et al. Balancing selection and wild gene pool contribute to resistance in global rice germplasm against planthopper. J. Integr. Plant Biol. 2021, 63, 1695–1711. [Google Scholar] [CrossRef] [Scilit]
- Sarao, P.; Sahi, G.; Neelam, K.; Mangat, G.; Patra, B.; Singh, K. Donors for Resistance to Brown Planthopper Nilaparvata lugens (Stål) from Wild Rice Species. Rice Sci. 2016, 23, 219–224. [Google Scholar] [CrossRef] [Scilit]
- Huang, Z.; He, G.; Shu, L.; Li, X.; Zhang, Q. Identification and mapping of two brown planthopper resistance genes in rice. Theor. Appl. Genet. 2001, 102, 929–934. [Google Scholar] [CrossRef] [Scilit]
- Tamura, Y.; Hattori, M.; Yoshioka, H.; Yoshioka, M.; Takahashi, A.; Wu, J.; Sentoku, N.; Yasui, H. Map-based Cloning and Characterization of a Brown Planthopper Resistance Gene BPH26 from Oryza sativa L. ssp. indica Cultivar ADR52. Sci. Rep. 2014, 4, 5872. [Google Scholar] [CrossRef] [Scilit]
- Howe, G.; Jander, G. Plant Immunity to Insect Herbivores. Annu. Rev. Plant Biol. 2008, 59, 41–66. [Google Scholar] [CrossRef] [Scilit]
- Li, C.; Xiong, Z.; Fang, C.; Liu, K. Transcriptome and metabolome analyses reveal the responses of brown planthoppers to RH resistant rice cultivar. Front. Physiol. 2022, 13, 1018470. [Google Scholar] [CrossRef] [Scilit]
- Uawisetwathana, U.; Graham, S.; Kamolsukyunyong, W.; Sukhaket, W.; Klanchui, A.; Toojinda, T.; Vanavichit, A.; Karoonuthaisiri, N.; Elliott, C. Quantitative 1H NMR metabolome profiling of Thai Jasmine rice (Oryza sativa) reveals primary metabolic response during brown planthopper infestation. Metabolomics 2015, 11, 1640–1655. [Google Scholar] [CrossRef] [Scilit]
- Zhang, Q.; Li, T.; Gao, M.; Ye, M.; Lin, M.; Wu, D.; Guo, J.; Guan, W.; Wang, J.; Yang, K.; et al. Transcriptome and Metabolome Profiling Reveal the Resistance Mechanisms of Rice against Brown Planthopper. Int. J. Mol. Sci. 2022, 23, 4083. [Google Scholar] [CrossRef] [Scilit]
- Li, T.; Zhang, Q.; Ye, M.; Cheng, Y.; Yang, J.; Wang, J.; Xing, B.; Guan, W.; Li, J.; Liu, C.; et al. Metabolome study of rice population and resistance to brown planthopper. J. Integr. Plant Biol. 2025, 67, 3093–3108. [Google Scholar] [CrossRef] [Scilit]
- Alamgir, K.; Hojo, Y.; Christeller, J.; Fukumoto, K.; Isshiki, R.; Shinya, T.; Baldwin, I.; Galis, I. Systematic analysis of rice (Oryza sativa) metabolic responses to herbivory. Plant Cell Environ. 2016, 39, 453–466. [Google Scholar] [CrossRef] [Scilit]
- Aboshi, T.; Ishiguri, S.; Shiono, Y.; Murayama, T. Flavonoid glycosides in Malabar spinach Basella alba inhibit the growth of Spodoptera litura larvae. Biosci. Biotechnol. Biochem. 2018, 82, 9–14. [Google Scholar] [CrossRef] [Scilit]
- Dong, N.; Lin, H. Contribution of phenylpropanoid metabolism to plant development and plant–environment interactions. J. Integr. Plant Biol. 2021, 63, 180–209. [Google Scholar] [CrossRef] [Scilit]
- Zhang, Y.; Li, X. Salicylic acid: Biosynthesis, perception, and contributions to plant immunity. Curr. Opin. Plant Biol. 2019, 50, 29–36. [Google Scholar] [CrossRef] [Scilit]
- Fu, J.; Wang, S. Insights into Auxin Signaling in Plant–Pathogen Interactions. Front. Plant Sci. 2011, 2, 74. [Google Scholar] [CrossRef] [Scilit]
- Huangfu, J.; Li, J.; Li, R.; Ye, M.; Kuai, P.; Zhang, T.; Lou, Y. The Transcription Factor OsWRKY45 Negatively Modulates the Resistance of Rice to the Brown Planthopper Nilaparvata lugens. Int. J. Mol. Sci. 2016, 17, 697. [Google Scholar] [CrossRef] [Scilit]
- He, J.; Liu, Y.; Yuan, D.; Duan, M.; Liu, Y.; Shen, Z.; Yang, C.; Qiu, Z.; Liu, D.; Wen, P.; et al. An R2R3 MYB transcription factor confers brown planthopper resistance by regulating the phenylalanine ammonia-lyase pathway in rice. Proc. Natl. Acad. Sci. USA 2020, 117, 271–277. [Google Scholar] [CrossRef] [Scilit]
- Tan, J.; Wu, Y.; Guo, J.; Li, H.; Zhu, L.; Chen, R.; He, G.; Du, B. A combined microRNA and transcriptome analyses illuminates the resistance response of rice against brown planthopper. BMC Genom. 2020, 21, 144. [Google Scholar] [CrossRef] [Scilit]
- Kumar, K.; Mandal, S.; Neelam, K.; de Los Reyes, B. MicroRNA-mediated host defense mechanisms against pathogens and herbivores in rice: Balancing gains from genetic resistance with trade-offs to productivity potential. BMC Plant Biol. 2022, 22, 351. [Google Scholar] [CrossRef] [Scilit]
- Du, B.; Zhang, W.; Liu, B.; Hu, J.; Wei, Z.; Shi, Z.; He, R.; Zhu, L.; Chen, R.; Han, B.; et al. Identification and characterization of Bph14, a gene conferring resistance to brown planthopper in rice. Proc. Natl. Acad. Sci. USA 2009, 106, 22163–22168. [Google Scholar] [CrossRef] [Scilit]
- Shi, S.; Wang, H.; Nie, L.; Tan, D.; Zhou, C.; Zhang, Q.; Li, Y.; Du, B.; Guo, J.; Huang, J.; et al. Bph30 confers resistance to brown planthopper by fortifying sclerenchyma in rice leaf sheaths. Mol. Plant 2021, 14, 1714–1732. [Google Scholar] [CrossRef] [Scilit]
- Wu, D.; Guo, J.; Zhang, Q.; Shi, S.; Guan, W.; Zhou, C.; Chen, R.; Du, B.; Zhu, L.; He, G. Necessity of rice resistance to planthoppers for OsEXO70H3 regulating SAMSL excretion and lignin deposition in cell walls. New Phytol. 2022, 234, 1031–1046. [Google Scholar] [CrossRef] [Scilit]
- Rao, X.; Barros, J. Modeling lignin biosynthesis: A pathway to renewable chemicals. Trends Plant Sci. 2024, 29, 546–559. [Google Scholar] [CrossRef] [Scilit]
- Wang, Y.; Sheng, L.; Zhang, H.; Du, X.; An, C.; Xia, X.; Chen, F.; Jiang, J.; Chen, S. CmMYB19 Over-Expression Improves Aphid Tolerance in Chrysanthemum by Promoting Lignin Synthesis. Int. J. Mol. Sci. 2017, 18, 619. [Google Scholar] [CrossRef] [Scilit]
- Gong, G.; Yuan, L.; Li, Y.; Xiao, H.; Li, Y.; Zhang, Y.; Wu, W.; Zhang, Z. Salivary protein 7 of the brown planthopper functions as an effector for mediating tricin metabolism in rice plants. Sci. Rep. 2022, 12, 3205. [Google Scholar] [CrossRef] [Scilit]
- Zhang, Z.; Cui, B.; Yan, S.; Li, Y.; Xiao, H.; Li, Y.; Zhang, Y. Evaluation of tricin, a stylet probing stimulant of brown planthopper, in infested and non-infested rice plants. J. Appl. Entomol. 2017, 141, 393–401. [Google Scholar] [CrossRef] [Scilit]
- Chen, S.; Zhou, Y.; Chen, Y.; Gu, J. Fastp: An ultra-fast all-in-one FASTQ preprocessor. Bioinformatics 2018, 34, i884–i890. [Google Scholar] [CrossRef] [Scilit]
- Kim, D.; Paggi, J.; Park, C.; Bennett, C.; Salzberg, S. Graph-based genome alignment and genotyping with HISAT2 and HISAT-genotype. Nat. Biotechnol. 2019, 37, 907–915. [Google Scholar] [CrossRef] [Scilit]
- Love, M.; Huber, W.; Anders, S. Moderated estimation of fold change and dispersion for RNA-seq data with DESeq2. Genome Biol. 2014, 15, 550. [Google Scholar] [CrossRef] [Scilit]
- Peng, L.; Zhao, Y.; Wang, H.; Zhang, J.; Song, C.; Shangguan, X.; Zhu, L.; He, G. Comparative metabolomics of the interaction between rice and the brown planthopper. Metabolomics 2016, 12, 132. [Google Scholar] [CrossRef] [Scilit]
- Shi, S.; Zha, W.; Yu, X.; Wu, Y.; Li, S.; Xu, H.; Li, P.; Li, C.; Liu, K.; Chen, J.; et al. Integrated transcriptomics and metabolomics analysis provide insight into the resistance response of rice against brown planthopper. Front. Plant Sci. 2023, 14, 1213257. [Google Scholar] [CrossRef] [Scilit]
- Tian, Y.; Wang, R.; Su, J.; Li, W.; Liu, P.; Luo, C.; Qian, J.; Zhang, D.; Li, P.; Wang, B.; et al. Multi-omics reveals that Sophora alopecuroides lysine decarboxylase (SaLDC)-mediated polyamine metabolism enhances salt tolerance and early flowering in Arabidopsis. Plant Sci. 2026, 364, 112891. [Google Scholar] [CrossRef] [Scilit]
- Zhang, Q.; Yang, J.; Zeng, X.; Chen, H.; Zhang, Y.; Zhang, G.; Li, Z.; Cai, X.; Zou, J. Integrated Transcriptome and Metabolome Analyses Reveal the Roles of MADS-Box Genes in Regulating Flower Development and Metabolite Accumulation in Osmanthus fragran. Curr. Issues Mol. Biol. 2025, 47, 819. [Google Scholar] [CrossRef] [Scilit]
- Dixon, R.; Paiva, N. Stress-Induced Phenylpropanoid Metabolism. Plant Cell 1995, 7, 1085–1097. [Google Scholar] [CrossRef] [Scilit]
- Lu, H.; Luo, T.; Fu, H.; Wang, L.; Tan, Y.; Huang, J.; Wang, Q.; Ye, G.; Gatehouse, A.; Lou, Y.; et al. Resistance of rice to insect pests mediated by suppression of serotonin biosynthesis. Nat. Plants 2018, 4, 338–344. [Google Scholar] [CrossRef] [Scilit]
- Erb, M.; Kliebenstein, D. Plant Secondary Metabolites as Defenses, Regulators, and Primary Metabolites: The Blurred Functional Trichotomy. Plant Physiol. 2020, 184, 39–52. [Google Scholar] [CrossRef] [Scilit]
- Kidd, B.; Kadoo, N.; Dombrecht, B.; Tekeoglu, M.; Gardiner, D.; Thatcher, L.; Aitken, E.; Schenk, P.; Manners, J.; Kazan, K. Auxin Signaling and Transport Promote Susceptibility to the Root-Infecting Fungal Pathogen Fusarium oxysporum in Arabidopsis. Mol. Plant Microbe Interact. 2011, 24, 733–748. [Google Scholar] [CrossRef] [Scilit]
- Su, P.; Zhao, L.; Li, W.; Zhao, J.; Yan, J.; Ma, X.; Li, A.; Wang, H.; Kong, L. Integrated metabolo-transcriptomics and functional characterization reveals that the wheat auxin receptor TIR1 negatively regulates defense against Fusarium graminearum. J. Integr. Plant Biol. 2021, 63, 340–352. [Google Scholar] [CrossRef] [Scilit]
- Gallego-Giraldo, L.; Posé, S.; Pattathil, S.; Peralta, A.; Hahn, M.; Ayre, B.; Sunuwar, J.; Hernandez, J.; Patel, M.; Shah, J.; et al. Elicitors and defense gene induction in plants with altered lignin compositions. New Phytol. 2018, 219, 1235–1251. [Google Scholar] [CrossRef] [Scilit]
- Guo, J.; Xu, C.; Wu, D.; Zhao, Y.; Qiu, Y.; Wang, X.; Ouyang, Y.; Cai, B.; Liu, X.; Jing, S.; et al. Bph6 encodes an exocyst-localized protein and confers broad resistance to planthoppers in rice. Nat. Genet. 2018, 50, 297–306. [Google Scholar] [CrossRef] [Scilit]
- Lv, W.; Du, B.; Shangguan, X.; Zhao, Y.; Pan, Y.; Zhu, L.; He, Y.; He, G. BAC and RNA sequencing reveal the brown planthopper resistance gene BPH15 in a recombination cold spot that mediates a unique defense mechanism. BMC Genom. 2014, 15, 674. [Google Scholar] [CrossRef] [Scilit]
- Zhang, Q.; Wen, X.; Li, H.; Zou, J.; Yang, J.; Cai, X.; Gong, X.; Zhang, Y.; Li, Z.; Chen, H.; et al. Evolutionary Expansion and Diversification of the GDSL Gene Family in Grasses. Biology 2026, 15, 1005. [Google Scholar] [CrossRef] [Scilit]

Disclaimer/Publisher’s Note: The statements, opinions and data contained in all publications are solely those of the individual author(s) and contributor(s) and not of MDPI and/or the editor(s). MDPI and/or the editor(s) disclaim responsibility for any injury to people or property resulting from any ideas, methods, instructions or products referred to in the content. |
© 2026 by the authors. Licensee MDPI, Basel, Switzerland. This article is an open access article distributed under the terms and conditions of the Creative Commons Attribution (CC BY) license.