


Abstract
Continuous sorghum cropping causes yield decline in semi-arid regions. In a two-year field experiment conducted on plots previously cropped with sorghum for two years, four fertilisation treatments—no fertiliser (SCK), chemical fertiliser (SCF), organic–inorganic compound fertiliser (SOIF) and compound microbial fertiliser (SCMF; SOIF supplemented with Bacillus subtilis and B. licheniformis)—were compared in terms of grain yield, soil physicochemical properties, potential enzyme activities and rhizosphere bacterial and fungal communities. Year, treatment and year × treatment effects were tested using mixed models that accounted for repeated measurements of the same plots. The complete SCMF formulation was associated with the highest grain yield (10,108.13 kg ha−1, in 2025), exceeding those unde SCK, SCF, and SOIF by 42.95%, 11.47%, and 3.59%, respectively. The SCMF-SOIF comparison, in which N, P2O5, K2O and organic-matter inputs were identical, isolates the microbial inoculants; its yield increment was small and not significant in either year (4.27% and 3.59%), so an inoculant-specific yield benefit was not demonstrated. Compared with SOIF, SCMF had higher alkaline phosphatase (ALP) activity in both years and higher sucrase (SUS) activity (+36.80%) and available nitrogen (AN; +21.11%) in 2025. In 2025, SOIF and SCMF reduced the topsoil bulk density relative to SCK and SCF, and SCMF shifted the aggregate-size distribution towards the 2–0.25-mm fraction (+47.45–112.62%). Fertilisation altered the composition, but not the alpha diversity, of rhizosphere communities; the treatment effect was larger and more independent of multivariate dispersion for fungi (R2 = 0.167, p = 0.009) than for bacteria (R2 = 0.113, p = 0.049). The fungal response represents an overall treatment-associated compositional difference with weaker statistical evidence in the second year, because treatment differences were significant only in 2024 when each year was tested separately. Nitrosospira, a genus containing members previously associated with ammonia oxidation, was consistently enriched under SCMF, although nitrification was not measured. Overall, the yield benefit was attributable mainly to organic–inorganic fertilisation, whereas inoculant-associated differences were found in potential enzyme activities and fungal community composition rather than in grain yield.
1. Introduction
Sorghum (Sorghum bicolor (L.) Moench) is the fifth most important cereal crop globally and is cultivated in over 100 countries owing to its remarkable tolerance to multiple abiotic stresses, including drought, waterlogging, salinity, alkalinity, low soil fertility, and high temperatures [1]. Fenyang–Lvliang, China, is a major sorghum-producing region, where production has become increasingly mechanised, larger in scale, and industrialised. Consequently, continuous monocropping has become the dominant cultivation practice in this area. However, long-term continuous sorghum cultivation has become a critical factor that restricts yield improvement and the sustainable development of local sorghum production.
The constraints associated with continuous cropping arise from systemic dysfunction within the soil–plant–microbiome system. Numerous studies have demonstrated that long-term continuous cropping suppresses plant growth and development, resulting in decreased biomass accumulation, grain yield and quality, and an increased incidence of diseases and pests [2,3]. At the soil ecosystem level, continuous cropping increases soil bulk density (SD), alters soil aggregate size and distribution, disrupts the nutrient balance, promotes the accumulation of autotoxins, and facilitates the proliferation of harmful rhizosphere microorganisms [3,4,5,6,7]. Further studies on continuous sorghum cultivation have revealed that prolonged monocropping decreases plant growth and yield, reduces bacterial richness, increases fungal diversity, enriches pathogenic microbes, and reduces the abundance of beneficial microorganisms in the rhizosphere [8].
Current agronomic practices for alleviating continuous-cropping constraints include crop rotation and intercropping [2,9,10]. Nevertheless, the adoption of these practices is often limited by economic considerations and the difficulties in changing traditional farming practices [11]. Fertilisation management, a core component of crop production systems, is widely recognised as an effective measure for mitigating continuous-cropping constraints [12,13,14,15,16,17]. Different fertiliser types and application strategies can improve the soil physical structure and nutrient availability of soil, regulate soil enzyme activities and microbial community composition, and restore degraded soil physicochemical properties and microbial balance disrupted by continuous cropping. These improvements ultimately promote crop growth, increase the yield, and alleviate continuous-cropping constraints.
In continuous-cropping systems for dryland crops such as maize, peanut, soybean, and wheat, the regulatory effects of chemical, organic, and microbial fertilisers, as well as their combined application, have been extensively investigated. The combined application of straw and nitrogen–phosphorus–potassium (NPK) fertilisers in maize cropping enhances soil fertility and stimulates microbial growth [18]. In continuous peanut cultivation, the addition of microbial inoculants or compound microbial fertilisers alongside NPK significantly increases urease, catalase, and acid phosphatase activities and promotes the abundance of potentially beneficial bacteria and fungi in the rhizosphere compared with the NPK application alone [11]. In continuously cropped soybeans, appropriate compound fertiliser application improves the light-use efficiency and nitrogen accumulation, thereby increasing the yield [19]. Similarly, in continuous wheat-cropping systems, the combined application of mineral fertilisers, straw, and organic manure, as well as the application of microbial fertilisers, significantly increases soil microbial biomass and optimises rhizosphere microbial community structure [20,21]. A study investigating the use of microbial inoculants against continuous-cropping constraints in sorghum also found that inoculation with Bacillus amyloliquefaciens in a pot experiment effectively inhibited the proliferation of the harmful fungus Tremellomycetes and alleviated growth inhibition associated with continuous cropping [8].
Although the effectiveness of fertilisation in alleviating continuous-cropping constraints has been demonstrated in various crops, current research on continuous sorghum cropping has mostly focused on single-inoculant or pot-based stimulation experiments, whereas systematic field-based evaluation remains scarce. Therefore, a two-year field experiment was conducted in Fenyang–Lvliang using sandy loam soil with a two-year history of continuous sorghum cropping. We investigated variations in sorghum yield and yield components, soil physical properties, and rhizosphere soil chemical properties and potential enzyme activities under four fertilisation treatments. Comparisons of the compound microbial fertiliser (SCMF) with no fertilisation (SCK) and conventional chemical fertilisation (SCF) evaluated the performance of the complete formulation, whereas its comparison with an organic–inorganic compound fertiliser (SOIF) that supplied identical N, P2O5, K2O and organic–matter inputs isolated the incremental effect of the microbial inoculants. Furthermore, high-throughput sequencing was used to characterise the composition and diversity of rhizosphere bacterial and fungal communities. This study provides insights into the relationships among fertilisation, soil properties, rhizosphere microbial communities, and sorghum yield and examines how different fertilisation strategies may alleviate the constraints of continuous cropping in sorghum. It also provides a theoretical basis and technical support for improving measured soil properties and achieving high yields in continuous sorghum cropping systems in Lvliang.
2. Materials and Methods
2.1. Experimental Site
The field experiment was conducted in Gaofeng Village, Xiaojiazhuang Town, Fenyang City, Shanxi Province, China (37°16′ N,111°56′ E). The experiment soil had a sandy loam texture, comprising 11.9% clay, 20.9% silt, and 67.2% sand. The site had been under continuous sorghum cultivation for two years before the experiment. The region is characterised by a typical temperate continental climate, and has an elevation of 731.9 m above sea level. In 2024, the annual rainfall, mean annual temperature, and annual sunshine duration were 454.7 mm, 13.1 °C, and 2414.3 h, respectively; the corresponding values in 2025 were 581.9 mm, 12.6 °C, and 2449.6 h. Before planting, a composite soil sample was collected and analysed for physicochemical properties (Table 1).
Table 1.
Physicochemical properties of the experimental soil before planting (2024).
2.2. Experimental Design and Crop Management
Brewing sorghum cultivar Jinza 22 was used as the experimental material, and the experiment was arranged in a randomised complete block design with four treatments: (1) SCK: no fertiliser application; (2) SCF: application of the farmers’ conventional fertiliser, with an N: P2O5: K2O fertiliser nutrient ratio of 26:12:10; (3) SOIF: application of an organic–inorganic compound fertiliser with an organic matter content ≥20% and an N: P2O5: K2O ratio of 15:6:4; (4) SCMF, application of a compound microbial fertiliser with an organic matter content ≥20% and an N:P2O5:K2O ratio of 15:6:4, supplemented with Bacillus subtilis and Bacillus licheniformis at a viable cell count ≥0.2 × 10⁸ colony-forming units (CFU g−1). Fertiliser application rates were calculated based on a pure N input of 225 kg ha−1, with three replicates per treatment. The 12 plots (four treatments × three blocks) were maintained throughout the whole experiment. Each plot received the same treatment in both 2024 and 2025 and was sampled in both years; therefore, observations from the two years constituted repeated measurements on the same plots. The application rates of N, P2O5, K2O, organic matter and microbial inoculants for each treatment are presented in Table 2.
Table 2.
Application rates of N, P2O5, K2O, organic matter and microbial inoculants under different treatments.
All fertilisers were supplied by Shanxi Liangyuan Jintudi Co., Ltd., Fenyang, China, and applied once in bands during sorghum sowing. Sorghum was planted at a density of 90,000 plants ha−1, with a row spacing of 50 cm. Each plot measured 7 m × 4 m. Sorghum was sown on 7 May and harvested on 3 October 2024; in 2025, sowing and harvesting took place on 1 May and 29 September, respectively. Pre-sowing irrigation was applied, and other field management practices, including intertillage and chemical pest control, followed local agronomic protocols.
2.3. Measurements and Analytical Procedures
2.3.1. Grain Yield and Yield Components
At maturity, 20 representative plants were sampled from each plot to determine the panicle grain weight and 1000-grain weight. Grain yield was measured by harvesting the entire plot and standardised to a grain moisture content of 14%. The number of grains per panicle was calculated as follows:
Grain number per panicle = Panicle grain weight/1000-grain weight × 1000
2.3.2. Soil Sampling Strategy
At maturity, six representative sorghum plants were selected from each plot. The shoots were removed at the soil’s surface, and the roots were carefully excavated using a spade.
Bulk soil: Loose soil was shaken from the roots, cleared of visible debris, air-dried, gently crushed, and sieved. A 1 kg subsample was obtained by quartering for water-stable aggregate (SP) analysis.
Rhizosphere soil: Approximately 20 g of rhizosphere soil tightly adhering to the root surfaces was collected using a sterile brush and placed into sterile sampling bags. The samples were immediately cooled in an ice box and transported to the laboratory, where they were stored at −80 °C for subsequent analyses of soil enzyme activities and microbial diversity. An additional 100 g of rhizosphere soil was collected, air-dried, ground, and sieved to determine soil chemical properties, including pH, TN, AN, SOM, AP, and AK. Rhizosphere soil collected from the six plants in each plot was pooled to form one composite sample per plot per year, yielding three samples per treatment per year and 24 samples in total.
2.3.3. Determination of Physicochemical Properties and Potential Enzyme Activities of Rhizosphere Soil
The SD in each plot was determined at maturity using the ring-knife method. SPs were separated using the wet-sieving method (Kemper and Rosenau 1986) [22]. Soil pH was measured using a pH meter. TN was measured using the Kjeldahl digestion method. AN was measured using the alkali diffusion method. SOM was determined using the potassium dichromate external heating volumetric method, with organic carbon converted to SOM using a conversion factor of 1.724. AK was extracted with ammonium acetate and measured using flame photometry. AP was extracted with sodium bicarbonate and quantified using the molybdenum–antimony antispectrophotometric method. All soil chemical properties were determined according to the procedures described by Page (1982) [23].
Enzyme activities were determined as potential activities under standardised laboratory assay conditions; they reflect the enzymatic capacity of the soil samples rather than in situ process rates. Catalase (CAT) activity was determined using ultraviolet spectrophotometry. Urease (UR) activity was measured using the indophenol blue colorimetric method. Alkaline phosphatase (ALP) activity was determined using the sodium phenylphosphate colorimetric method. Sucrase (SUS) activity was determined using the 3,5-dinitrosalicylic acid (DNS) colorimetric method. All soil enzyme activities were assayed as described by Tabatabai (1994) [24].
2.4. Soil DNA Extraction and Microbial Sequencing Data
Total genomic DNA was extracted from rhizosphere soil samples using the E.Z.N.A.® Soil DNA Kit (Omega Bio-tek, Norcross, GA, USA) following the manufacturer’s instructions. The extracted DNA concentration and purity were assessed using a NanoDrop 2000 spectrophotometer (Thermo Fisher Scientific, Wilmington, DE, USA), and DNA integrity was verified by 1% agarose gel electrophoresis. Barcoded primers targeting the bacterial V3–V4 region of the 16S rRNA gene and the fungal internal transcribed spacer (ITS)2R region were used for polymerase chain reaction (PCR) amplification. Reactions were performed in a final volume of 20 μL using TransStart FastPfu DNA Polymerase (TransGen Biotech, Beijing, China) on an ABI GeneAmp® 9700 thermal cycler (Applied Biosystems, Foster City, CA, USA). The thermal protocol consisted of initial denaturation at 95 °C for 3 min, followed by 27 cycles of denaturation at 95 °C for 30 s, annealing at 55 °C for 30 s, and extension at 72 °C for 30 s, followed by a final extension at 72 °C for 10 min. Amplicons were verified by 2% agarose gel electrophoresis, purified using an AxyPrep DNA Gel Extraction Kit (Axygen Biosciences, Union City, CA, USA), and eluted in Tris-HCl buffer. Purified PCR products were quantified using the QuantiFluor™-ST fluorometric system (Promega, Madison, WI, USA) and normalised according to the sequencing volume requirements. Library construction was performed using a TruSeq DNA Sample Prep Kit (Illumina, San Diego, CA, USA). Paired-end sequencing (2 × 300 bp) was subsequently performed on an Illumina NovaSeq 2000 platform (Illumina, San Diego, CA, USA). All sequencing services were provided by Shanghai Majorbio Bio-Pharm Technology Co., Ltd. (Shanghai, China) through its cloud platform. Raw sequence reads were quality-filtered and denoised to generate amplicon sequence variants (ASVs), which were taxonomically annotated using the SILVA database (version 138.1) for bacteria and the UNITE database(version 8.2) for fungi through standard pipelines on the Majorbio Cloud Platform.
2.5. Microbiome Data Analysis
All microbiome analyses were performed using the combined 2024–2025 dataset within an explicit year × treatment framework. Year was treated as a biologically meaningful fixed factor to account for inter-annual differences in climate, crop development and cumulative fertilisation. No batch correction was applied. Because samples from the two years were sequenced separately, potential run-to-run technical variation was confounded with the year effect and could not be separated from it. Year effects were therefore interpreted with caution, whereas treatment effects were evaluated within the same sequencing run (i.e., within each year) or through the year × treatment interaction.
Alpha diversity (observed richness, Chao1, Shannon and Simpson indices) was calculated from ASV tables rarefied to the minimum sequencing depth (43,239 reads for 16S rRNA and 50,753 reads for ITS), with each index averaged across 100 random rarefactions. Alpha diversity was analysed using the same linear mixed model as the soil variables (Section 2.7).
Beta diversity was quantified using Bray–Curtis dissimilarities calculated from ASV relative abundances and visualised by principal coordinate analysis (PCoA). Because the same plots were sampled in both years, treatment effects on community composition were tested using a split-plot (repeated-measures) permutational multivariate analysis of variance (PERMANOVA) [25] with block, treatment, block × treatment (plot), year and year × treatment included as terms. Treatment, a whole-plot factor, was tested against the block × treatment (plot) mean square by permuting whole plots within blocks while keeping both years together. Year and year × treatment, which varied within plots, were tested against the within-plot residual by permuting the two years within each plot. Both sets of permutations were enumerated completely (13,824 and 4096 permutations, respectively). Homogeneity of multivariate dispersion was assessed using PERMDISP (betadisper; distances to group centroids; 9999 permutations) [26] for year, treatment, and the eight year × treatment groups to distinguish differences in community location from differences in within-group dispersion [27]. Treatment effects were also tested separately for each year using PERMANOVA, with permutations restricted within blocks.
Treatment-associated (discriminative) genera were identified using the linear discriminant analysis effect size (LEfSe) [28], as implemented in microeco(version 1.10.0) [29]. Genus-level relative abundances were analysed using treatment as the class variable, a Kruskal–Wallis test (p < 0.05), and an LDA score threshold of ≥2.0. Microeco assigns each genus to the treatment with the highest median abundance. Because LEfSe pools data from both years, the treatment with the highest mean relative abundance was also determined separately for each year. A genus was considered year-consistent if it was enriched under the same treatment in both 2024 and 2025. As a complementary multivariate approach, random forest classifiers (randomForest; 1000 trees) [30] were fitted to genera present in at least 50% of the samples. Classification accuracy was evaluated using nested leave-one-plot-out cross-validation. In each of the 12 folds, both samples (2024 and 2025) from one plot were held out. Prevalence filtering, importance ranking and selection of the 20 most important genera were performed using only the training samples before the classifier was refitted and used to predict the held-out samples, thereby avoiding information leakage [31]. The significance of the cross-validated accuracy was assessed by repeating the entire procedure after permuting treatment labels among whole plots within blocks (99 permutations). Genera identified by LEfSe that were also year-consistent and ranked among the 20 most important random forest features were classified with consistently treatment-associated taxa. Because the LEfSe and random forest analyses were based on a small dataset (24 samples from 12 plots), these taxa were regarded as candidates statistically associated with treatments rather than as validated biomarkers; the analyses do not establish that such taxa are functional indicators or causal agents.
2.6. Co-Occurrence Networks, Mantel Tests and Structural Equation Model (SEM)
Co-occurrence networks were constructed separately for each treatment using an identical procedure. A common pool of candidate genera was defined using all 24 samples (prevalence ≥ 75% and mean relative abundance ≥ 0.1%; 184 bacterial and 73 fungal genera), ensuring that all treatment networks were based on the same taxa and sequencing data. Genus counts were centred log-ratio (CLR)-transformed using a pseudocount of 0.5 to account for the compositional nature of amplicon data [32]. Within each treatment (n = 6), CLR values were centred within each year to statistically adjust for year as a fixed factor and prevent inter-annual shifts from producing spurious correlations. Pairwise Spearman correlations were retained as edges when |ρ| ≥ 0.6 and p < 0.05 (with n = 6 this corresponds to |ρ| ≥ 0.83). To visualise the overall association structure, one network per kingdom was also constructed from all 24 samples with the same genus pool and thresholds after centring CLR values within each year (with n = 24, |ρ| ≥ 0.6 corresponds to p ≈ 0.002). The numbers of nodes, edges, positive and negative edges, as well as network density, average degree, average clustering coefficient and modularity were calculated with igraph. Because networks inferred from few samples are fragile [33], the number of edges expected by chance was estimated by shuffling the values of each genus within treatment × year (within year for the overall networks; 50 randomisations), and differences in edge number between pairs of treatments were tested by permuting treatment labels within years (400 permutations per pair). Given the small number of samples per treatment network, the network analysis was regarded as exploratory, and network properties were interpreted only as descriptors of inferred association patterns, not as evidence of biological interactions, improved microbial functioning or treatment-specific mechanisms.
Associations between community dissimilarity and individual soil chemical, enzyme, aggregate and yield-related variables, as well as the relative abundance of Bacillus, were tested using partial Mantel tests (Pearson correlation; Euclidean distances calculated from standardised variables) conditioned on a year distance matrix, with permutations restricted within years (4999 permutations). p values were adjusted using the Benjamini–Hochberg method within each dataset. Spearman correlations among variables were calculated after standardising each variable within year.
A structural equation model (SEM) was fitted to explore associations among fertilisation, soil chemical properties, potential enzyme activities, fungal community composition, and grain yield. To remove interannual differences in magnitude, particularly in potential enzyme activities, all variables were standardised within the year before composite variables were derived. Soil chemical properties (pH, SOM, TN, AN, AK and AP) and potential enzyme activities (log-transformed UR, ALP, SUS and CAT) were each summarised by their first principal component, which explained 64.1% and 54.5% of the variance, respectively. Fungal community composition was represented by the first axis of the year-centred PCoA coordinates, which explained 13.9% of the variance. Treatments were coded using three nested contrasts: fertilisation (Fert; SCF, SOIF, and SCMF vs. SCK), organic input (Org; SOIF and SCMF vs. SCF and SCK), and microbial inoculant (Inoc; SCMF vs. SOIF). To avoid suppression effects, a composite variable was not regressed simultaneously on the treatment contrasts and another composite largely determined by the same contrasts. Multicollinearity was assessed using variance inflation factors (VIFs), which were below 5 for all predictors. The model was fitted by maximum likelihood using lavaan [34]. The 95% confidence intervals of standardised coefficients were obtained from 1000 bootstrap resamples. The χ2 statistic, comparative fit index (CFI), Tucker–Lewis index (TLI), root mean square error of approximation (RMSEA), and standardised root mean square residual (SRMR) were reported. The model contained 16 free parameters (12 path coefficients and 4 residual variances) estimated from 24 plot-year observations. Because these observations came from only 12 plots, each sampled in both years, they are not independent; as a sensitivity analysis, each regression equation of the path model was therefore refitted by ordinary least squares with cluster-robust (CR1) standard errors clustered by plot, and coefficients were tested against a t distribution with 11 degrees of freedom (number of plots − 1). The SEM was regarded as a secondary, exploratory analysis subordinate to the experimental treatment comparisons.
2.7. Statistical Analysis
Grain yield, yield components, bulk density, aggregate fractions, soil chemical properties and enzyme activities were analysed using linear mixed models (lme4 and lmerTest [35]) with block, treatment, year and year × treatment as fixed effects and plot (block × treatment) as a random effect to account for the repeated measurements of the same plots in 2024 and 2025. F tests used Satterthwaite’s approximation for the denominator degrees of freedom; for this balanced design, these tests are equivalent to those from a split-plot-in-time analysis of variance. Potential enzyme activities were log-transformed before analysis because activities in 2025 were an order of magnitude higher than those in 2024 and the variance increased with the mean. On the log scale, the year × treatment term tests whether relative treatment responses differed between years. Because significant year × treatment interactions were detected for several variables, treatment means were compared separately within each year using a randomised-complete-block ANOVA followed by Fisher’s protected least significant difference (LSD) test (p < 0.05). These within-year comparisons are presented in Table 3 and Table S1 and Figure 1, Figure 2, Figure 3 and Figure 4. Comparisons of SCMF with SCK and SCF were interpreted as effects of the complete compound microbial fertiliser formulation, whereas the SCMF–SOIF comparison, in which nutrient and organic-matter inputs were identical, was used to evaluate the incremental effect of the microbial inoculants. Differences were considered statistically significant at p < 0.05. All analyses were performed in R (v4.2.1) with the packages lme4, lmerTest, emmeans, agricolae, vegan, permute, microeco, randomForest, igraph, lavaan, sandwich and lmtest; the complete R script is available from the corresponding author upon reasonable request. Figure 1, Figure 2 and Figure 3 were prepared using Origin 2022.
Table 3.
Yield components and yields of continuous-cropping sorghum under different fertilisation treatments.
Figure 1.
Soil bulk density in the 0–40 cm soil layer (A1,B1) and mass fractions of soil water-stable aggregates across different size classes (A2,B2) under different treatments in 2024 (A1,A2) and 2025 (B1,B2). Columns with different lowercase letters indicate significant differences among treatments within a year (randomised-complete-block ANOVA followed by Fisher’s protected LSD, p < 0.05). Error bars represent ± standard deviation (SD; n = 3).
Figure 2.
Effects of different treatments on soil pH (Aa,Ba), organic matter (Ab,Bb), total nitrogen (Ac,Bc), available nitrogen (Ad,Bd), available potassium (Ae,Be), and available phosphorus (Af,Bf) under continuous sorghum cropping in 2024 (A) and 2025 (B). Different lowercase letters indicate significant differences among treatments within a year (randomised-complete-block ANOVA followed by Fisher’s protected LSD, p < 0.05). Error bars represent standard deviations (SD; n = 3).
Figure 3.
Effects of different treatments on potential urease (Aa,Ba), alkaline phosphatase (Ab,Bb), sucrase (Ac,Bc), and catalase (Ad,Bd) activities in the rhizosphere soil of continuously cropped sorghum in 2024 (A) and 2025 (B). Different lowercase letters indicate significant differences among treatments within a year (randomised-complete-block ANOVA followed by Fisher’s protected LSD, p < 0.05). Error bars represent ± standard deviation (SD; n = 3).
Figure 4.
Rhizosphere bacterial (16S rRNA) and fungal (ITS) alpha and beta diversity in the two years. (A,B) Alpha diversity (Chao1, observed richness, Shannon and Simpson indices; rarefied, mean of 100 rarefactions) of bacteria (A) and fungi (B) in each treatment × year group (n = 3); group names ending in 3 and 4 denote 2024 and 2025, respectively. Different letters indicate significant differences among treatments within the same year (randomised-complete-block ANOVA followed by Fisher’s protected LSD, p < 0.05). Strip labels give the significance of year (Y), treatment (T) and year × treatment (Y × T) from linear mixed models with plot as a random effect (*** p < 0.001, ** p < 0.01, ns, not significant). (C,D) Principal coordinate analysis (PCoA) of Bray–Curtis dissimilarities of bacterial (C) and fungal (D) communities; ellipses are 95% confidence ellipses of each treatment × year group; results of the split-plot PERMANOVA (restricted permutations) and of PERMDISP among treatments are given below each panel. SCK, no fertiliser; SCF, chemical fertiliser; SOIF, organic–inorganic compound fertiliser; SCMF, compound microbial fertiliser.
3. Results
3.1. Effects of Different Treatments on Sorghum Grain Yield and Yield Components
Year, treatment and their interaction significantly affected panicle grain weight (all p < 0.001), grain number per panicle (Year and Treatment, p < 0.001; Year × Treatment, p = 0.006) and grain yield (Year, p = 0.001; Treatment and Year × Treatment, p < 0.001), whereas 1000-grain weight was affected only by year (p < 0.001; Treatment, p = 0.253; Year × Treatment, p = 0.110) (Table 3). In both years, SOIF and SCMF had higher panicle grain weight, grain number per panicle and grain yield than SCK and SCF. Relative to SCK, SCMF significantly increased grain yield by 17.89% in 2024 and 42.95% in 2025, respectively. Relative to SCF, SCMF increased panicle grain weight by 13.14% and 28.74%, grain number per panicle by 13.41% and 21.40%, and grain yield by 13.15% and 11.47% in 2024 and 2025, respectively. The yield advantage of SCMF over SOIF, which isolates the effect of the microbial inoculants, was small and not statistically significant in either year (4.27% in 2024 and 3.59% in 2025); thus, an additional yield benefit of the inoculants was not demonstrated. The significant year × treatment interaction for grain yield reflected contrasting interannual trends. From 2024 to 2025, the grain yield decreased by 10.77% under SCK (p < 0.001), whereas it increased by 9.83%, 8.90% and 8.19% under SCF, SOIF and SCMF, respectively (all p ≤ 0.001).
3.2. Effects of Different Treatments on Soil Physicochemical Properties
3.2.1. Effects of Different Treatments on Soil Physical Properties Under Continuous Sorghum Cropping
Soil bulk density in the 0–20 cm layer was significantly affected by the year (p < 0.001) and treatment (p = 0.003) but not by their interaction (p = 0.485). In the 20–40 cm layer, only year had a significant effect (p = 0.015; Treatment, p = 0.311; Year × Treatment, p = 0.410).
In 2024, soil bulk density did not differ significantly among treatments in either the 0–20 or the 20–40 cm soil layer, although it was numerically lowest under SCMF (4.46% and 3.07% lower than under SCK, respectively; Figure 1(A1)). In 2025, the SOIF and SCMF treatments significantly decreased soil bulk density relative to SCK, by 5.85% and 6.56% in the 0–20 cm layer and by 7.75% and 6.12% in the 20–40 cm layer, respectively, with no significant difference between SOIF and SCMF (Figure 1(B1)). In the 0–20 cm layer, both were also significantly lower than under SCF.
The proportion of aggregates in the >2 mm fraction was significantly affected by year, treatment and their interaction (all p < 0.001). The 2–0.25 mm fraction was affected by treatment and the year × treatment interaction (both p < 0.001) but not by year (p = 0.121). The 0.25–0.053 mm fraction was affected by year and treatment (both p < 0.001), but not by their interaction (p = 0.975). Similarly, the <0.053 mm fraction was affected by year and treatment (both p < 0.001), but not by their interaction (p = 0.120) (Table S2).
In 2025, after two consecutive years of fertiliser application, the proportions of aggregates in the >2 mm and <0.053 mm fractions under SCMF were 54.84% and 11.08% lower, respectively, than those under SCK. In contrast, the proportion in the 2–0.25 mm fraction under SCMF was 112.62% higher than that under SCK and 47.45–93.23% higher than those under the other fertilisation treatments (p < 0.05; Figure 1(B2) and Table S1). The proportion in the <0.053 mm fraction under SCMF was also 10.41–17.47% lower than that under SOIF and SCF (p < 0.05). As no integrated aggregate-stability index was measured, these findings are interpreted as a redistribution among aggregate-size classes rather than as evidence of a change in overall aggregate stability.
3.2.2. Effects of Different Treatments on the Chemical Properties of Rhizosphere Soil Under Continuous Sorghum Cropping
Soil TN (Year, p = 0.010; Treatment, p = 0.008), AN (p < 0.001; p = 0.001), AK (p < 0.001; p < 0.001) and AP (p = 0.002; p < 0.001) were significantly affected by both year and treatment, with significant year × treatment interactions for AN (p = 0.014) and AK (p = 0.018). SOM was affected by year (p < 0.001) but not by treatment (p = 0.260). Soil pH was affected by year (p < 0.001) and by the year × treatment interaction (p = 0.026) but not by treatment (p = 0.691). Soil pH increased from 2024 to 2025 under all treatments, with larger increases under the fertilised treatments (5.0–6.8%) than under SCK (2.7%). However, pH did not differ significantly among treatments within either year (p > 0.05).
In 2024, SOM and TN contents did not differ significantly among treatments (Figure 2(Ab,Ac)). After two consecutive years of fertilisation, the SOM content under SOIF and SCMF was significantly higher than that under SCK by 12.23% and 12.62%, respectively, and higher than that under SCF by 11.97% and 12.35%, respectively (p < 0.05; Figure 2(Bb)). Similarly, the TN content under SOIF and SCMF was significantly higher than that under SCK by 23.24% and 20.81%, respectively, and higher than that under SCF by 10.86% and 8.67%, respectively (p < 0.05; Figure 2(Bc)). In 2024, AN, AK and AP contents under SCMF were significantly higher than those under SCK by 52.22%, 18.90% and 117.90%, respectively, and higher than those under SCF by 18.66%, 10.64% and 51.83%, respectively (p < 0.05; Figure 2(Ad–Af)). These contents remained significantly higher under SCMF in 2025, with increases of 48.77%, 41.60% and 85.52%, respectively, relative to SCK, and 11.98%, 15.54% and 24.41%, respectively, relative to SCF (p < 0.05; Figure 2(Bd–Bf)). Moreover, AN under SCMF was 21.11% higher than under SOIF in 2025 (p < 0.05, Figure 2(Bd)), whereas the 6.13% higher AK under SCMF than under SOIF was not significant (Figure 2(Be)).
3.3. Effects of Different Treatments on Potential Rhizosphere Soil Enzyme Activities of Continuously Cropped Sorghum
Because potential enzyme activities in 2025 were approximately an order of magnitude higher than those in 2024, the data were analysed on a logarithmic scale. Year and treatment significantly affected UR (Year, p< 0.001; Treatment, p = 0.004), ALP (p < 0.001; p < 0.001) and SUS (p < 0.001; p < 0.001). However, the year × treatment interaction was not significant for any enzyme (UR, p = 0.091; ALP, p = 0.340; SUS, p = 0.066; CAT, p = 0.536), suggesting that relative treatment responses were similar in the two years. CAT activity was affected only by year (p < 0.001; Treatment, p = 0.308).
As shown in Figure 3, potential UR, ALP, and SUS activities under SCMF were numerically the highest in both years. In 2024, the UR, ALP, and SUS activities under SCMF significantly increased by 22.48%, 18.86%, and 16.17%, respectively, compared to those under SCK (Figure 3(Aa–Ac)); in 2025, the corresponding increases were 30.62%, 27.32%, and 45.23%, respectively (p < 0.05, Figure 3(Ba–Bc)). Compared with SCF, SCMF increased UR activity by 9.89% (not significant) and significantly increased ALP and SUS activities by 17.74% and 56.92% in 2024 (Figure 3(Aa–Ac)). In 2025, UR activity was 6.55% higher under SCMF than under SCF, but this difference was not significant; ALP and SUS activities were significantly higher by 28.67% and 63.39%, respectively (p < 0.05, Figure 3(Ba–Bc)). Compared with SOIF, SCMF had significantly higher UR and ALP activities in 2024, with increases of 28.43% and 24.74%, respectively (p < 0.05, Figure 3(Aa,Ab)); in 2025, ALP and SUS activities were significantly higher by 19.38% and 36.80%, respectively (p < 0.05, Figure 3(Bb,Bc)), whereas the 9.32% higher UR activity was not significant (Figure 3(Ba)).
3.4. Rhizosphere Microbial Communities of Continuously Cropped Sorghum Under Different Fertilisation Treatments
3.4.1. Rhizosphere Microbial Diversity and Community Composition in a Year × Treatment Framework
The 16S rRNA gene dataset contained 11,371 ASV features across 24 samples, with read counts ranging from 43,239 to 66,198 per sample. The ITS dataset contained 2856 ASV features across 24 samples, with read counts ranging from 50,753 to 87,518 per sample. Bacterial communities were dominated at the phylum level by Pseudomonadota, Actinomycetota, Chloroflexota, Acidobacteriota, and Bacillota (Figure S1A). Fungal communities were dominated by Ascomycota, followed by Basidiomycota, Mortierellomycota, and Chytridiomycota (Figure S1B).
Neither bacterial nor fungal alpha diversity was significantly affected by treatment (all p > 0.16) or by the year × treatment interaction (all p ≥ 0.09), and no differences among treatments were detected within either year (Figure 4A,B; Table S3). Observed richness and Chao1 of both kingdoms were lower in 2025 than in 2024 (Year, p ≤ 0.003), and the bacterial Simpson index was slightly higher in 2025 (p = 0.004), whereas the Shannon index of both kingdoms and the fungal Simpson index did not differ between years (p ≥ 0.19).
In the split-plot PERMANOVA, year explained the largest proportion of variation in bacterial community composition (R2 = 0.261, p < 0.001) and a substantial proportion in fungal community composition (R2 = 0.136, p < 0.001) (Figure 4C,D; Table S3). After accounting for the plot structure, fertilisation treatment significantly affected the composition of both fungal (R2 = 0.167, pseudo-F = 1.68, p = 0.009) and bacterial communities (R2 = 0.113, pseudo-F = 1.17, p = 0.049). However, the year × treatment interaction was not significant for either kingdom (fungi: R2 = 0.128, p = 0.245; bacteria: R2 = 0.101, p = 0.333). PERMDISP showed that multivariate dispersion did not differ among treatments for fungi (p = 0.573), suggesting that the fungal treatment effect reflected differences in community centroids rather than dispersion. For bacteria, dispersion differed among treatments (p = 0.035) and was greatest under SCMF; therefore, the bacterial treatment effect may partly reflect differences in within-treatment heterogeneity. Dispersion was greater in 2025 than in 2024 for fungi (p = 0.005), with a marginal difference for bacteria (p = 0.056). When each year was analysed separately, treatment effects were significant in 2024 (fungi: R2 = 0.477, p = 0.002; bacteria: R2 = 0.325, p = 0.019) but not in 2025 (fungi: R2 = 0.255, p = 0.498; bacteria: R2 = 0.263, p = 0.326). Overall, treatment-associated differences in community composition were detectable in the combined two-year dataset, particularly for fungi, for which the treatment effect was not accompanied by significant differences in dispersion. However, the year-specific analyses did not detect significant treatment effects in 2025, when within-treatment variability was greater. The fungal response is therefore described as an overall treatment-associated compositional difference with weaker statistical evidence in the second year; because each treatment had only three replicate plots, the non-significant year × treatment interaction does not establish that treatment responses were equivalent in the two years.
3.4.2. Co-Occurrence Networks and Treatment-Associated Taxa
Across all 24 samples, the overall bacterial network linked 152 genera by 474 edges (346 positive and 128 negative), far more than expected by chance (48 ± 8), whereas the overall fungal network was sparse, with 20 edges among 26 genera (chance level 9 ± 3) distributed over six unconnected components (Figure 5A,B). With identical construction procedures, the treatment-specific bacterial networks contained 1575–2528 edges among 184 candidate genera and the fungal networks 253–316 edges among 71–73 genera (Figure 5C,D; Table S4). The SCMF bacterial network had the most edges (2528), the highest average degree (27.5) and the highest density (0.150), and its edge number exceeded the chance level estimated from randomised data (1506 ± 44); the SOIF and SCK networks exceeded chance levels by smaller margins (1703 vs. 1512 ± 38 and 1790 vs. 1682 ± 44), and the SCF network did not (1575 vs. 1560 ± 49). In permutation tests, the number of bacterial edges under SCMF differed significantly from that under SCF (p = 0.020), but not from those under SOIF (p = 0.085) or SCK (p = 0.120). The fungal networks did not clearly exceed chance levels (observed 253–316 edges vs. 255–290 expected), and the SCMF fungal network did not differ from any other treatment (p ≥ 0.18); among fungal networks, only SCK and SCF differed (p = 0.035). Hence, with six samples per treatment, a large share of the inferred edges could arise by chance; and neither the bacterial (p = 0.085) nor the fungal (p = 0.705) SCMF network differed significantly from the corresponding SOIF network (Table S4); the network analysis therefore provides only an exploratory description of association patterns and does not indicate SCMF-specific restructuring of microbial associations.
Figure 5.
Co-occurrence networks and treatment-associated genera. (A,B) Overall genus co-occurrence networks of bacteria (A) and fungi (B) constructed from all 24 samples (CLR-transformed, centred within year; edges, Spearman |ρ| ≥ 0.6 and p < 0.05). Node size is proportional to degree and node colour to mean relative abundance; orange and blue edges denote positive and negative correlations; the ten most connected bacterial genera and, where space allowed, fungal genera are labelled. (C,D) Topology of the treatment-specific bacterial (C) and fungal (D) networks, constructed with an identical genus pool, CLR transformation, within-year centring and thresholds (n = 6 per network). Black markers and whiskers in the Edges panels show the number of edges expected by chance (mean ± 2 SD of 50 randomisations). In permutation tests, the number of bacterial edges under SCMF differed from that under SCF (p = 0.020) but not from those under SCK (p = 0.120) or SOIF (p = 0.085); fungal edge numbers under SCMF did not differ from any other treatment (p ≥ 0.18). (E,F) Genera identified by LEfSe (Kruskal–Wallis p < 0.05, LDA ≥ 2.0) for bacteria (E) and fungi (F), coloured by the treatment in which they were enriched; filled circles, enriched in the same treatment in both years (year-consistent); open circles, not year-consistent; asterisks, also among the 20 most important random forest features.
LEfSe identified 14 bacterial and 12 fungal genera that discriminated among treatments (Kruskal–Wallis p < 0.05, LDA ≥ 2.0; Figure 5E,F; Table S5). Of these, seven bacterial and six fungal genera were enriched in the same treatment in both years. Genera consistently enriched under SCMF were Nitrosospira (LDA = 3.19) among bacteria and unclassified Mortierellaceae (3.18), Plectosphaerella (2.77) and Ramicandelaber (2.07) among fungi; norank Desulfocapsaceae (2.43) and Melastiza (3.12) were consistently enriched under SOIF, Pelagibius and Bdellovibrio under SCF, and Paenisporosarcina, Dactylosporangium, Anaerocolumna, Scytalidium and Melanocarpus under SCK. Several genera with high LDA scores, including Trichoderma (SOIF), Gibellulopsis (SCMF) and Thiobacillus (SCK), were enriched under different treatments in the two years and were therefore not regarded as consistently treatment-associated.
Random forest classifiers indicated that the genus-level treatment signal was weak. Out-of-bag accuracies were 0.12 for bacteria (802 genera) and 0.33 for fungi (160 genera), compared with a random-classification expectation of 0.25. In nested leave-one-plot-out cross-validation, with feature selection within each training fold, accuracies were 0.33 for bacteria and 0.38 for fungi (permutation p = 0.010 for both). A linear discriminant classifier based on the 20 top-ranked genera and validated using the same procedure achieved accuracies of only 0.17 and 0.29 for bacteria and fungi, respectively. Genera combining LEfSe significance, year consistency and high random forest importance (consistently treatment-associated taxa) included unclassified Mortierellaceae and Plectosphaerella (SCMF) and Melastiza (SOIF) among fungi, and norank Desulfocapsaceae (SOIF), Pelagibius (SCF), Dactylosporangium and Anaerocolumna (SCK) among bacteria (Figure 5E,F; Figure S2). Given the small dataset, these genera are regarded as candidate treatment-associated taxa rather than validated biomarkers.
3.4.3. Associations of Microbial Community Composition with Soil, Enzyme and Yield Variables
After conditioning on year and restricting permutations to occur within years, none of the individual soil chemical, enzyme, aggregate or yield-related variables was significantly associated with bacterial or fungal community dissimilarity after FDR correction (all FDR ≥ 0.47; Figure 6). The strongest unadjusted associations were those of fungal community dissimilarity with 1000-grain weight (partial r = 0.364, p = 0.044) and the >2-mm aggregate fraction (r = 0.349, p = 0.045). For the bacterial community, the strongest association was with Bacillus relative abundance (r = 0.520, p = 0.051). This latter association was strongly influenced by a single SCMF sample from 2025 with high Bacillus abundance (2.7% compared with 0.05–0.33% in the other samples). Strong associations between community dissimilarity and potential enzyme activities were obtained only when the year was not accounted for (e.g., bacterial community vs. ALP: Mantel r = 0.67 without, but partial r = 0.02 with conditioning on year); i.e., they reflected concurrent between-year differences in community composition and in the measured variables rather than within-year, treatment-related covariation. Within years, the measured variables remained intercorrelated: grain yield was positively correlated with AN, AK, AP, UR, SUS and the 2–0.25-mm aggregate fraction and negatively correlated with bulk density in the 0–20 cm layer and the <0.053 mm aggregate fraction (Figure 6).
Figure 6.
Associations among measured variables and with microbial community composition. The lower triangle shows Spearman correlations among soil chemical properties, potential enzyme activities (log-transformed), bulk density (SD), aggregate-size fractions, yield traits and Bacillus relative abundance, calculated after standardising each variable within year (* p < 0.05, ** p < 0.01, *** p < 0.001). Lines link bacterial (16S, solid) and fungal (ITS, dashed) community composition to each variable; line colour indicates the Partial Mantel’s r between Bray–Curtis community dissimilarity and the Euclidean distance of the standardised variable, conditioned on year, with permutations restricted within years (4999 permutations), and line width indicates its unadjusted p-value. No association remained significant after Benjamini–Hochberg correction.
3.4.4. Structural Equation Model Linking Fertilisation, Soil Properties, Fungal Community Composition and Grain Yield
The exploratory structural equation model (Figure 7) was not rejected by the χ2 test (χ2(6) = 12.28, p = 0.056) and showed an acceptable comparative and residual fit (CFI = 0.957; SRMR = 0.025). However, the TLI (0.870) and RMSEA (0.209) indicated important limitations in model fit; because 16 free parameters were estimated from 24 plot-year observations of only 12 plots, the model was interpreted as exploratory and secondary to the experimental comparisons. All standardised path coefficients lay within [−1, 1] (maximum |β| = 0.84), and all VIFs were < 5. The fertilisation (β = 0.46, p < 0.001) and organic-input contrasts (β = 0.53, p < 0.001) were positively associated with the soil chemical composite, whereas the inoculant contrast (SCMF vs. SOIF) was not (β = 0.10, p = 0.276). Potential enzyme activity was strongly associated with the inoculant contrast (β = 0.74, p < 0.001; 95% bootstrap CI 0.47–0.97) and only weakly with soil chemistry (β = 0.21, p = 0.089). Fungal community composition was associated with organic input (β = 0.82, p < 0.001) and, in the opposite direction, with the inoculant contrast (β = −0.84, p < 0.001); i.e., the first axis of the year-centred fungal PCoA mainly separated SOIF from the other treatments. Within-year variation in grain yield (R2 = 0.86) was associated with the soil chemical composite (β = 0.56, p = 0.001; 95% CI 0.16–0.99) and the fertilisation contrast (β = 0.30, p = 0.018), but not with potential enzyme activity (β = 0.17, p = 0.131) or fungal community composition (β = −0.01, p = 0.934); thus, fungal community composition did not explain the yield response. When the dependence between the two observations of each plot was taken into account (plot-clustered standard errors, t tests with 11 degrees of freedom), the significant paths from the treatment contrasts to the soil chemical, enzyme and fungal composites and the path from the soil chemical composite to grain yield remained significant (all p ≤ 0.006), whereas the fertilisation → yield path became marginal (p = 0.056) and the enzyme (p = 0.062) and fungal (p = 0.95) paths to yield remained non-significant.
Figure 7.
Exploratory structural equation model (SEM) linking fertilisation contrasts, soil chemical properties, potential enzyme activities, fungal community composition and grain yield (n = 24). All variables were standardised within year before analysis. Treatments are coded as nested contrasts: Fert (SCF, SOIF and SCMF vs. SCK), Org (SOIF and SCMF vs. SCF and SCK) and Inoc (SCMF vs. SOIF). Soil chemical properties (pH, SOM, TN, AN, AK and AP) and potential enzyme activities (UR, ALP, SUS and CAT; log-transformed) are first principal components; fungal community composition is the first axis of year-centred PCoA coordinates. Numbers are standardised path coefficients (* p < 0.05 *** p < 0.001); red and blue solid arrows, significant positive and negative paths; grey dashed arrows and grey labels, non-significant paths. Red upward arrows in the lower part of each box indicate positive loadings of the variables on the composite. R2 is the variance explained for each endogenous variable. The model is exploratory: 16 free parameters were estimated from 24 plot-year observations of 12 plots, and the observations from the two years of each plot are not independent (see Section 3.4.4 for the plot-clustered sensitivity analysis).
4. Discussion
Across two consecutive seasons, the organic-based treatments (SOIF and SCMF) produced the highest grain yields. In 2025, the complete SCMF formulation yielded 42.95% more than SCK and 11.47% more than SCF, primarily through a greater panicle grain weight and grain number per panicle rather than the 1000-grain weight [36,37]. Similar responses to organic or biologically amended fertilisers have been reported in other continuous-cropping systems [38] and are generally attributed to an improved sink formation and grain filling [39,40]. Two components of this response should, however, be distinguished [16,41]. The first is the broader benefit associated with the organic-based fertilisation strategy: SOIF and SCMF both produced higher grain yields than SCF and SCK in both years and, in 2025, had higher SOM, TN, AP and AK contents and a greater proportion of aggregates in the 2–0.25 mm size class. Because SCF supplied more P2O5 and K2O than SOIF and SCMF but contained no organic matter, the differences between SCF and the organic-based treatments reflect both organic matter inputs and differences in mineral P and K supply; therefore, these differences cannot be attributed to the fertiliser type alone. The second is the additional effect specifically associated with the microbial inoculants, which can be evaluated only from the SCMF–SOIF comparison, because these treatments received identical N, P2O5, K2O and organic-matter inputs. This additional effect was modest and not significant for grain yield (+4.27% in 2024 and +3.59% in 2025), so an inoculant-specific yield benefit was not demonstrated, but it was clearer for some soil variables: compared with SOIF, SCMF had higher ALP activity in both years, higher UR activity in 2024, and higher SUS activity and a higher AN content in 2025. Consistently, in the path model, the inoculant contrast was strongly associated with enzyme activities but not with the soil chemical composite or, independently, with yield. Under the conditions of this two-year trial, the yield gain was therefore attributable mainly to the organic–inorganic fertilisation strategy, whereas the effects associated with the inoculants were expressed in potential enzyme activities rather than in grain yield.
The soil responses also require cautious interpretation. Continuous cropping is commonly associated with nutrient depletion and deterioration of the soil structure [4,42,43], and the higher SOM, TN, AP and AK contents under the organic-based treatments are consistent with their additional organic inputs. The reduction in topsoil bulk density under SOIF and SCMF was statistically significant in 2025, and the changes in aggregate size fractions under SCMF—fewer >2 mm and <0.053 mm aggregates and more 2–0.25 mm aggregates—represent a redistribution among size classes. Because no integrated stability index (e.g., mean weight diameter) was measured, these changes do not demonstrate improved aggregate stability. Similarly, the enzyme assays quantify potential activities under standardised conditions. Thus, the higher ALP, SUS and UR activities under SCMF indicate a greater potential for P mineralisation, carbohydrate hydrolysis and urea hydrolysis, respectively, rather than higher in situ rates of nutrient cycling.
When analysed with an explicit year × treatment framework, fertilisation affected the composition rather than the alpha diversity of rhizosphere communities. Year was the largest source of variation in bacterial community composition, whereas the treatment effect was greater for fungi (R2 = 0.167) than for bacteria (R2 = 0.113). The fungal effect was not accompanied by differences in multivariate dispersion and therefore reflects shifts in community location, whereas the bacterial effect coincided with greater heterogeneity under SCMF and should be interpreted more cautiously [27]. Stronger or more distinct responses of fungal than of bacterial communities to rhizosphere conditions and fertilisation have been reported previously [44,45,46], and fungi play central roles in residue decomposition and root-associated processes in continuously cropped soils [6]. The sensitivity of soil microbial communities to agricultural management is consistent with recent evidence showing that crop-management practices can alter bacterial and fungal community structure, reflecting the close coupling between management-induced changes in the soil environment and microbial community assembly [47]. The absence of a significant year × treatment interaction indicates that the treatment-associated differences did not differ significantly between years, but, with only three replicate plots per treatment, this does not establish that the responses were equivalent in the two years; nor does it indicate greater ecological stability of the fungal community [48]. Such fertilisation-dependent microbial responses are consistent with evidence showing that the fertiliser regime and application intensity can modify soil microbial diversity and functional profiles through concomitant changes in the soil chemical environment [49], with the view that fungal communities respond to management mainly through shifts in decomposer and root-associated guilds [50]. Indeed, when each year was tested separately, treatment effects were significant in 2024 but not in 2025, when within-treatment dispersion was greater. The fungal response is therefore best described as an overall treatment-associated compositional difference with weaker statistical evidence in the second year, rather than as a stable or persistent response, and longer observation is needed to establish whether these differences are maintained.
Co-occurrence network complexity has been related to crop growth and nutrient availability in other systems [51,52]. However, with only six samples per treatment, the networks inferred here were fragile [33]: a large share of the inferred edges could arise by chance, fungal networks were largely indistinguishable from chance-level association patterns, and neither the bacterial (p = 0.085) nor the fungal (p = 0.705) SCMF network differed significantly from the corresponding SOIF network. Moreover, positive and negative associations can arise from shared environmental preferences, indirect effects, common treatment responses or the compositional nature of sequencing data [32,33]. Such associations do not demonstrate cooperation, competition or improved microbial functioning. The network analysis is therefore retained only as an exploratory description of inferred association patterns; it provides no evidence of improved microbial interactions and does not identify a distinctive mechanism underlying the performance of SCMF.
Consistent with the modest cross-validated classification accuracies, relatively few genera discriminated among the treatments, and fewer still were enriched in the same treatment in both years. Nitrosospira, which contains members previously associated with ammonia oxidation and nitrification [53], was enriched under SCMF in both years. However, because nitrification rates, amoA gene abundance and N2O fluxes were not measured, this enrichment does not demonstrate that SCMF increased N cycling. Other discriminative taxa include members previously associated with sulphur transformations, such as Thiobacillus and Desulfocapsaceae [54,55]. The SCMF-associated fungi taxa, unclassified Mortierellaceae and Plectosphaerella, belong to groups previously associated with plant growth promotion, saprotrophy or plant association [56,57]. All such functional interpretations remain putative. These genera are therefore regarded as taxa consistently associated with particular treatments in a small dataset, not as validated biomarkers or as organisms with experimentally demonstrated functional effects; their enrichment does not demonstrate increased nitrification, nutrient cycling, pathogen suppression or beneficial microbial activity.
After accounting for the year, community dissimilarity was not significantly associated with any individual soil, enzyme or yield variable after FDR correction, although potential enzyme activities, aggregate fractions and yield traits remained intercorrelated within years. Combined organic and inorganic fertilisation has been reported to increase enzyme activities together with bacterial community changes [58]; in our exploratory structural equation model, which is secondary to the experimental comparisons, potential enzyme activity was mainly associated with the inoculant contrast, whereas within-year variation in grain yield was associated with the soil chemical composite and fertilisation rather than with potential enzyme activity or fungal community composition (β = −0.01). Thus, fungal restructuring does not explain the yield response. Inference from this model is further limited by the small number of observations relative to the 16 estimated parameters, by its imperfect fit (RMSEA = 0.209; TLI = 0.870) and by the dependence between the two observations from each of the 12 plots; although the main paths were robust to plot-clustered standard errors, the fertilisation → yield path then became marginal. These results do not support a causal sequence from inoculation through microbial restructuring and enzyme-mediated nutrient supply to yield. More broadly, these relationships are consistent with the concept that plant nutrition provides a functional interface linking changes in the soil–microbiome system with plant performance, although the direction and causality of these interactions require direct experimental validation [59].
Because the SCMF product contained Bacillus subtilis and B. licheniformis, Bacillus-related signals deserve separate consideration. Bacillus-containing inoculants have been linked to nutrient mobilisation and enzyme responses [60,61] and to broader changes in microbial communities [62,63]. In the present study, however, Bacillus relative abundance was only weakly associated with bacterial community dissimilarity after accounting for the year (p = 0.051), and this association was largely driven by a single SCMF sample. Moreover, genus-level 16S rRNA amplicon data cannot track the establishment, persistence or activity of the inoculated strains. Therefore, the community differences observed under SCMF cannot be attributed to the introduced strains, and Bacillus should not be regarded as a demonstrated driver of the treatment response.
Finally, SOIF and SCMF produced similar yields but different rhizosphere fungal compositions: the first axis of the year-centred fungal PCoA separated SOIF from the other treatments, and the inoculant contrast was associated with this axis in the direction opposite to that of the organic-input contrast. Organic fertilisers containing different additional components may thus be associated with overlapping yet distinct rhizosphere patterns [16,64,65]. This suggests that biologically oriented fertilisers do not necessarily influence the same components of the soil–plant–microbe system even when their yield benefits are comparable. However, the present design cannot separate the contribution of inoculant activity from that of other product properties.
This study has several limitations. First, the results are based on one site, two growing seasons and three replicate plots per treatment. Inter-annual weather differences may have influenced crop, soil and microbial responses, and the two-year duration is insufficient to evaluate the long-term sustainability of SCMF. Second, SCF received more P2O5 and K2O than SOIF and SCMF; therefore, comparisons involving SCF combine the effects of fertiliser type and nutrient rate. Third, year-related differences in the microbiome data may include sequencing-run variation, which cannot be separated from inter-annual biological variation. Fourth, the enzyme assays measured potential activities, which differed by approximately an order of magnitude between years; therefore, enzyme activities were compared within years and analysed on a logarithmic scale. Fifth, co-occurrence networks inferred from six samples per treatment are fragile, fungal networks were largely indistinguishable from chance-level association patterns, and SCMF networks did not differ significantly from SOIF networks. Sixth, all relationships among the microbiome, soil properties and yield are correlative; the roles of individual taxa, network properties and the inoculated Bacillus strains were not experimentally verified. Seventh, the SEM path model was fitted to 24 plot-year observations from only 12 plots; these observations are not independent, and with 16 free parameters and an imperfect fit, the model can only be regarded as exploratory. Future studies should combine longer-term field trials with strain-specific tracking, functional-gene or metagenomic analyses and controlled inoculation experiments.
5. Conclusions
Over two growing seasons of continuous sorghum cropping, organic–inorganic fertilisation with or without microbial inoculants (SOIF and SCMF) increased the grain yield relative to no fertilisation and conventional chemical fertilisation and, in the second year, was accompanied by higher SOM, TN, and available P and K, lower topsoil bulk density and, under SCMF, a redistribution of aggregates towards the 2–0.25 mm fraction. The complete SCMF formulation produced the highest grain yield, but its advantage over SOIF—the treatment with identical nutrient and organic-matter inputs, which isolates the inoculant effect—was small and not significant; an inoculant-specific yield benefit was therefore not demonstrated, and the additional effects associated with the inoculants were most evident as higher potential enzyme activities and higher available N in the second year. Fertilisation was associated with shifts in rhizosphere community composition rather than diversity, more clearly for fungi than for bacteria; the fungal shift represents an overall treatment-associated compositional difference with weaker statistical evidence in the second year. Co-occurrence networks, treatment-associated taxa and SEM path-model associations are exploratory and correlative and do not establish a causal sequence from inoculation through microbial restructuring and nutrient supply to yield. Given the two-year duration, SCMF cannot yet be regarded as a sustainable fertilisation strategy; it is nevertheless a promising option for continuous sorghum cropping in the Lvüliang region that warrants longer-term evaluation.
Supplementary Materials
The following supporting information can be downloaded at https://www.mdpi.com/article/10.3390/agronomy16212193/s1. Table S1 Mass fractions of soil water-stable aggregates across different size classes under different treatments; Table S2 Linear mixed-model tests of Year, Treatment and Year × Treatment for yield, soil physical and chemical properties and enzyme activities; Table S3 Effects of Year, Treatment and Year × Treatment on rhizosphere bacterial and fungal alpha diversity, community composition and multivariate dispersion; Table S4 Properties of the treatment-specific and overall co-occurrence networks, edge numbers expected by chance and permutation tests of differences in edge number; Table S5 Treatment-associated (discriminative) genera identified by LEfSe, with year consistency and random forest importance; Figure S1 Phylum-level composition of rhizosphere bacterial ((A); 16S rRNA) and fungal ((B); ITS) communities in each plot under the four fertilisation treatments in 2024 and 2025 (the ten most abundant phyla; remaining phyla pooled as Others). Group names ending in 3 and 4 denote 2024 and 2025, respectively; _1, _2 and _3 denote blocks. SCK, no fertiliser; SCF, chemical fertiliser; SOIF, organic–inorganic compound fertiliser; SCMF, compound microbial fertiliser; Figure S2 Random forest classification of fertilisation treatments from genus-level relative abundances. Bars show the 20 most important genera (mean decrease in Gini impurity; randomForest, 1000 trees) for bacteria (A) and fungi (B), shaded by importance. Out-of-bag and nested leave-one-plot-out cross-validated accuracies are given above each panel; permutation tests are reported in Section 3.4.2.
Author Contributions
X.L. (Xiaohong Liang): project administration, data curation, formal analysis, funding acquisition, investigation, methodology, writing—original draft. X.L. (Xiang Li): data curation, formal analysis, investigation. H.N.: data curation, investigation. C.X.: investigation. P.C.: validation. S.W.: formal analysis, investigation. J.L.: data curation, investigation. R.Z.: formal analysis. M.H.: data curation. X.C.: conceptualisation, funding acquisition, supervision, writing—review and editing. All authors have read and agreed to the published version of the manuscript.
Funding
This work was supported by the Lvliang Science and Technology Bureau (grant number 2023XDHZ07, Project title: Lvliang Science and Technology Research Program), the Department of Agriculture and Rural Affairs of Shanxi Province (grant number CYJSTX03-17, Project title: Shanxi Modern Agro-industry Technology Research System), and the Ministry of Agriculture and Rural Affairs of the People’s Republic of China (grant number CARS-06-14.5-B10, Project title: China Agriculture Research System of MOF and MARA).
Data Availability Statement
The data presented in this study are openly available in the Genome Sequence Archive in National Genomics Data Center, China National Center for Bioinformation (CNCB-NGDC), at https://ngdc.cncb.ac.cn/gsa (accessed on 16 October 2026), under the GSA accession number CRA049803.
Conflicts of Interest
The authors declare no conflicts of interest.
References
- Khalifa, M.; Eltahir, E.A.B. Assessment of global sorghum production, tolerance, and climate risk. Front. Sustain. Food Syst. 2023, 7, 1184373. [Google Scholar] [CrossRef] [Scilit]
- Bennett, A.J.; Bending, G.D.; Chandler, D.; Hilton, S.; Mills, P. Meeting the demand for crop production: The challenge of yield decline in crops grown in short rotations. Biol. Rev. 2012, 87, 52–71. [Google Scholar] [CrossRef] [Scilit]
- Wang, Y.; Zhang, Y.; Li, Z.; Zhao, Q.; Huang, X.; Huang, K. Effect of continuous cropping on the rhizosphere soil and growth of common buckwheat. Plant Prod. Sci. 2020, 23, 81–90. [Google Scholar] [CrossRef] [Scilit]
- Pervaiz, Z.H.; Iqbal, J.; Zhang, Q.; Chen, D.; Wei, H.; Saleem, M. Continuous cropping alters multiple biotic and abiotic indicators of soil health. Soil Syst. 2020, 4, 59. [Google Scholar] [CrossRef] [Scilit]
- Chen, Y.; Du, J.; Li, Y.; Tang, H.; Yin, Z.; Yang, L.; Ding, X. Evolutions and managements of soil microbial community structure drove by continuous cropping. Front. Microbiol. 2022, 13, 839494. [Google Scholar] [CrossRef] [Scilit]
- UI Haq, M.Z.; Yu, J.; Yao, G.; Yang, H.; Iqbal, H.A.; Tahir, H.; Cui, H.; Liu, Y.; Wu, Y. A systematic review on the continuous cropping obstacles and control strategies in medicinal plants. Int. J. Mol. Sci. 2023, 24, 12470. [Google Scholar] [CrossRef] [Scilit]
- Yang, B.; Feng, C.; Jiang, H.; Chen, Y.; Ding, M.; Dai, H.; Zhai, Z.; Yang, M.; Liang, T.; Zhang, Y. Effects of long-term continuous cropping on microbial community structure and function in tobacco rhizosphere soil. Front. Microbiol. 2025, 16, 1496385. [Google Scholar] [CrossRef] [Scilit]
- Wu, A.; Jiao, X.; Fan, F.; Wang, J.; Guo, J.; Dong, E.; Wang, L.; Shen, X. Effect of continuous sorghum cropping on the rhizosphere microbial community and the role of Bacillus amyloliquefaciens in altering the microbial composition. Plant Growth Regul. 2019, 89, 299–308. [Google Scholar] [CrossRef] [Scilit]
- Li, G.; Ren, A.; Anwar, S.; Shi, L.; Bai, W.; Zhang, Y.; Gao, Z. Optimizing soil health and sorghum productivity through crop rotation with Quinoa. Life 2024, 14, 745. [Google Scholar] [CrossRef] [Scilit]
- Dou, Y.; Yu, S.; Liu, S.; Cui, T.; Huang, R.; Wang, Y.; Wang, J.; Tan, K.; Li, X. Crop rotations reduce pathogenic fungi compared to continuous cropping. Rhizosphere 2025, 34, 101074. [Google Scholar] [CrossRef] [Scilit]
- Ahsan, T.; Tian, P.; Gao, J.; Wang, C.; Liu, C.; Huang, Y. Effects of microbial agent and microbial fertilizer input on soil microbial community structure and diversity in a peanut continuous cropping system. J. Adv. Res. 2023, 64, 1–13. [Google Scholar] [CrossRef] [Scilit]
- Wu, D.; Zhang, Y.; Gu, W.; Feng, Z.; Xiu, L.; Zhang, W.; Chen, W. Long term co-application of biochar and fertilizer could increase soybean yield under continuous cropping: Insights from photosynthetic physiology. J. Sci. Food Agric. 2023, 104, 3113–3122. [Google Scholar] [CrossRef] [Scilit]
- Zheng, X.; Wei, L.; Lv, W.; Zhang, H.; Zhang, Y.; Zhang, H.; Zhang, H.; Zhu, Z.; Ge, T.; Zhang, W. Long-term bioorganic and organic fertilization improved soil quality and multifunctionality under continuous cropping in watermelon. Agric. Ecosyst. Environ. 2024, 359, 108721. [Google Scholar] [CrossRef] [Scilit]
- Luo, X.; Xu, M.; Yan, X.; Xing, R.; Kang, Y.; Wang, H. Co-inoculation of Bacillus amyloliquefaciens and Pleurotus ostreatus alleviates replanting obstacles in continuously cropped soil by enhancing the soil nutrient cycle and beneficial microorganisms. Rhizosphere 2025, 36, 101175. [Google Scholar] [CrossRef] [Scilit]
- Qiu, D.; Wang, X.; Jiang, K.; Gong, G.; Bao, F. Effect of microbial fertilizers on soil microbial community structure in rotating and continuous cropping Glycyrrhiza uralensis. Front. Plant Sci. 2025, 15, 1452090. [Google Scholar] [CrossRef] [Scilit]
- Wang, L.; Liao, D.; Rengel, Z.; Shen, J. Soil–plant–microbe interactions in the rhizosphere: Incremental amplification induced by localized fertilization. Front. Agric. Sci. Eng. 2025, 12, 57–68. [Google Scholar] [CrossRef] [Scilit]
- Ma, Y.; Ding, J.; Nie, Z.; Qian, H.; Zheng, J.; Wang, H. Microbial inoculants alleviate continuous cropping obstacles in eggplant through soil properties and rhizosphere microbiota. Microorganisms 2026, 14, 672. [Google Scholar] [CrossRef] [Scilit]
- Shi, P.; Wang, S.; Jia, S.; Gao, Q. Effect of 25-year fertilization on soil microbial biomass and community structure in a continuous corn cropping system. Arch. Agron. Soil Sci. 2015, 61, 1303–1317. [Google Scholar] [CrossRef] [Scilit]
- Liu, W.; Rao, D.; Xie, F.; Wang, H.; Yao, X. Improved cultivars and the application of combined fertilizer improve the grain yield and the nitrogen uptake and utilization in continuously cropped soybean (Glycine max (L.) Merr.). Plants 2026, 15, 845. [Google Scholar] [CrossRef] [Scilit]
- Chen, S.; Gu, J.; Gao, H.; Qin, Q. Effect of microbial fertilizer on microbial activity and microbial community diversity in the rhizosphere of wheat growing on the Loess Plateau. Afr. J. Microbiol. Res. 2011, 5, 137–143. [Google Scholar] [CrossRef]
- Babulicová, M.; Faragová, N. The influence of winter wheat continuous cropping and fertilization on the crop yields and microbial soil diversity. Cereal Res. Commun. 2014, 42, 326–337. [Google Scholar] [CrossRef] [Scilit]
- Kemper, W.D.; Rosenau, R.C. Aggregate Stability and Size Distribution. In Methods of Soil Analysis: Part 1 Physical Methods; Page, A.L., Ed.; SSSA Book Series 5; Soil Science Society of America: Madison, WI, USA, 1986; pp. 425–442. [Google Scholar]
- Page, A.L.; Miller, R.H.; Keeney, D.R. (Eds.) Methods of Soil Analysis: Part 2 Chemical and Microbiological Properties, 2nd ed.; Soil Science Society of America: Madison, WI, USA, 1982. [Google Scholar]
- Tabatabai, M.A. Soil Enzymes. In Methods of Soil Analysis: Part 2 Microbiological and Biochemical Properties; Weaver, R.W., Angle, S., Bottomley, P., Bezdicek, D., Smith, A., Tabatabai, A., Wollum, A., Eds.; Soil Science Society of America: Madison, WI, USA, 1994; pp. 775–833. [Google Scholar]
- Anderson, M.J. A new method for non-parametric multivariate analysis of variance. Austral. Ecol. 2001, 26, 32–46. [Google Scholar] [CrossRef] [Scilit]
- Anderson, M.J. Distance-based tests for homogeneity of multivariate dispersions. Biometrics 2006, 62, 245–253. [Google Scholar] [CrossRef] [Scilit]
- Anderson, M.J.; Walsh, D.C.I. PERMANOVA, ANOSIM, and the Mantel test in the face of heterogeneous dispersions: What null hypothesis are you testing? Ecol. Monogr. 2013, 83, 557–574. [Google Scholar] [CrossRef] [Scilit]
- Segata, N.; Izard, J.; Waldron, L.; Gevers, D.; Miropolsky, L.; Garrett, W.S.; Huttenhower, C. Metagenomic biomarker discovery and explanation. Genome Biol. 2011, 12, R60. [Google Scholar] [CrossRef] [Scilit]
- Liu, C.; Cui, Y.; Li, X.; Yao, M. Microeco: An R package for data mining in microbial community ecology. FEMS Microbiol. Ecol. 2021, 97, fiaa255. [Google Scholar] [CrossRef] [Scilit]
- Breiman, L. Random forests. Mach. Learn. 2001, 45, 5–32. [Google Scholar] [CrossRef] [Scilit]
- Varma, S.; Simon, R. Bias in error estimation when using cross-validation for model selection. BMC Bioinform. 2006, 7, 91. [Google Scholar] [CrossRef] [Scilit]
- Gloor, G.B.; Macklaim, J.M.; Pawlowsky-Glahn, V.; Egozcue, J.J. Microbiome datasets are compositional: And this is not optional. Front. Microbiol. 2017, 8, 2224. [Google Scholar] [CrossRef] [Scilit]
- Berry, D.; Widder, S. Deciphering microbial interactions and detecting keystone species with co-occurrence networks. Front. Microbiol. 2014, 5, 219. [Google Scholar] [CrossRef] [Scilit]
- Rosseel, Y. lavaan: An R package for structural equation modeling. J. Stat. Softw. 2012, 48, 1–36. [Google Scholar] [CrossRef] [Scilit]
- Kuznetsova, A.; Brockhoff, P.B.; Christensen, R.H.B. lmerTest package: Tests in linear mixed effects models. J. Stat. Softw. 2017, 82, 1–26. [Google Scholar] [CrossRef] [Scilit]
- Kamaei, R.; Faramarzi, F.; Parsa, M.; Jahan, M. The effects of biological, chemical, and organic fertilizers application on root growth features and grain yield of Sorghum. J. Plant Nutr. 2019, 42, 2221–2233. [Google Scholar] [CrossRef] [Scilit]
- Ernst, O.R.; Kemanian, A.R.; Mazzilli, S.; Siri-Prieto, G.; Dogliotti, S. The dos and don’ts of no-till continuous cropping: Evidence from wheat yield and nitrogen use efficiency. Field Crops Res. 2020, 257, 107934. [Google Scholar] [CrossRef] [Scilit]
- Wang, D.; Chen, Y.; Yang, X.; Wan, C.; Zhang, Z.; Xu, J.; Xue, T.; Bo, C. Combining organic fertilizer with soil conditioner alleviates continuous cropping obstacles in protected cowpea by improving soil properties and microbiome. Sci. Rep. 2025, 15, 42094. [Google Scholar] [CrossRef] [Scilit]
- Ahmed, T.; Noman, M.; Qi, Y.; Shahid, M.; Hussain, S.; Masood, H.A.; Xu, L.; Ali, H.M.; Negm, S.; EI-Kott, A.F.; et al. Fertilization of microbial composts: A technology for improving stress resilience in plants. Plants 2023, 12, 3550. [Google Scholar] [CrossRef] [Scilit]
- Liang, X.; Wang, H.; Wang, C.; Qin, J.; Qiu, X.; Wen, Y.; Wang, J.; Mei, X. Biogas slurry topdressing enhances the comprehensive benefits of maize: New perspectives on grain filling process, yield, and endogenous microbiome. J. Agric. Food Res. 2025, 22, 102111. [Google Scholar] [CrossRef] [Scilit]
- Bargaz, A.; Lyamlouli, K.; Chtouki, M.; Zeroual, Y.; Dhiba, D. Soil microbial resources for improving fertilizers efficiency in an integrated plant nutrient management system. Front. Microbiol. 2018, 9, 1606. [Google Scholar] [CrossRef] [Scilit]
- Kartini, N.L.; Saifulloh, M.; Trigunasih, N.M.; Sukmawati, N.M.S.; Mega, I.M. Impact of long-term continuous cropping on soil nutrient depletion. Ecol. Eng. Environ. Technol. 2024, 25, 18–29. [Google Scholar] [CrossRef] [Scilit]
- Xia, H.; Jiang, C.; Riaz, M.; Yu, F.; Dong, Q.; Yan, Y.; Zu, C.; Zhou, C.; Wang, J.; Shen, J. Impacts of continuous cropping on soil fertility, microbial communities, and crop growth under different tobacco varieties in a field study. Environ. Sci. Eur. 2025, 37, 5. [Google Scholar] [CrossRef] [Scilit]
- Liu, J.; Tang, Y.; Bao, J.; Wang, H.; Peng, F.; Tan, P.; Chu, G.; Liu, S. A stronger rhizosphere impact on the fungal communities compared to the bacterial communities in pecan plantations. Front. Microbiol. 2022, 13, 899801. [Google Scholar] [CrossRef] [Scilit]
- Demoling, F.; Nilsson, L.O.; Bååth, E. Bacterial and fungal response to nitrogen fertilization in three coniferous forest soils. Soil Biol. Biochem. 2008, 40, 370–379. [Google Scholar] [CrossRef] [Scilit]
- Ai, C.; Zhang, S.; Zhang, X.; Guo, D.; Zhou, W.; Huang, S. Distinct responses of soil bacterial and fungal communities to changes in fertilization regime and crop rotation. Geoderma 2018, 319, 156–166. [Google Scholar] [CrossRef] [Scilit]
- Cezar, R.M.; Vezzani, F.M.; Joris, H.A.W.; Barth, G.; Kaschuk, G. Crop rotation restructures soil microbial communities in Subtropical Oxisol, South Brazil. Sci. Agric. 2025, 82, e20240134. [Google Scholar] [CrossRef] [Scilit]
- Li, D.; Wu, C.; Wu, J. Soil fungal community has higher network stability than bacterial community in response to warming and nitrogen addition in a subtropical primary forest. Appl. Environ. Microbiol. 2024, 90, e0000124. [Google Scholar] [CrossRef] [Scilit]
- Liu, Y.; Li, X.; Li, H.; Zhu, J.; Wang, X.; Shen, B. Soil microbial diversity and metabolic gene expression respond to long-term fertilizations in simulated field experiments. Sci. Agric. 2024, 83, e20240280. [Google Scholar] [CrossRef] [Scilit]
- Sun, S.; Li, S.; Avera, B.N.; Strahm, B.D.; Badgley, B.D. Soil bacterial and fungal communities show distinct recovery patterns during forest ecosystem restoration. Appl. Environ. Microbiol. 2017, 83, e00966-17. [Google Scholar] [CrossRef] [Scilit]
- Tao, J.; Meng, D.; Qin, C.; Liu, X.; Liang, Y.; Xiao, Y.; Liu, Z.; Gu, Y.; Li, J.; Yin, H. Integrated network analysis reveals the importance of microbial interactions for maize growth. Appl. Microbiol. Biotechnol. 2018, 102, 3805–3818. [Google Scholar] [CrossRef] [Scilit]
- Liao, X.; Tang, T.; Li, J.; Wang, J.; Neher, D.A.; Zhang, W.; Xiao, J.; Xiao, D.; Hu, P.; Wang, K.; et al. Nitrogen fertilization increases the niche breadth of soil nitrogen-cycling microbes and stabilizes their co-occurrence network in a karst agroecosystem. Agric. Ecosyst. Environ. 2024, 374, 109177. [Google Scholar] [CrossRef] [Scilit]
- Kowalchuk, G.A.; Stephen, J.R. Ammonia-oxidizing bacteria: A model for molecular microbial ecology. Annu. Rev. Microbiol. 2001, 55, 485–529. [Google Scholar] [CrossRef] [Scilit]
- Kumar, M.; Zeyad, M.T.; Choudhary, P.; Paul, S.; Chakdar, H.; Rajawat, M.V.S. Thiobacillus. In Beneficial Microbes in Agro-Ecology: Bacteria and Fungi; Amaresan, N., Senthil Kumar, M., Annapurna, K., Kumar, K., Sankaranarayanan, A., Eds.; Academic Press (Elsevier): Amsterdam, The Netherlands, 2020; pp. 545–557. [Google Scholar]
- Demin, K.A.; Prazdnova, E.V.; Minkina, T.M.; Gorovtsov, A.V. Sulfate-reducing bacteria unearthed: Ecological functions of the diverse prokaryotic group in terrestrial environments. Appl. Environ. Microbiol. 2024, 90, 20. [Google Scholar] [CrossRef] [Scilit]
- Ozimek, E.; Hanaka, A. Mortierella species as the plant growth-promoting fungi present in the agricultural soils. Agriculture 2021, 11, 7. [Google Scholar] [CrossRef] [Scilit]
- Faist, H.; Trognitz, F.; Antonielli, L.; Symanczik, S.; White, P.; Sessitsch, A. Potato root-associated microbiomes adapt to combined water and nutrient limitation and have a plant genotype-specific role for plant stress mitigation. Environ. Microbiome 2021, 18, 18. [Google Scholar] [CrossRef] [Scilit]
- Bo, H.; Li, Z.; Wang, W.; Zhang, R.; Wang, H.; Jin, D.; Xu, M.; Zhang, Q. Combining organic and inorganic fertilization enhances soil enzyme activity, the bacterial community, and molecular ecological network complexity in coal mine reclamation areas. Agronomy 2024, 14, 1427. [Google Scholar] [CrossRef] [Scilit]
- Thiengo, C.C.; Leonel, J.V.; Mendes, L.W.; Lavres, J. Separated for too long: Plant nutrition as the functional interface linking the plant-soil microbiome to plant performance. Sci. Agric. 2026, 83, e20260067. [Google Scholar] [CrossRef] [Scilit]
- Fonseca, M.d.C.d.; Bossolani, J.W.; Oliveira, S.L.d.; Moretti, L.G.; Portugal, J.R.; Scudeletti, D.; Oliveira, E.F.d.; Crusciol, C.A.C. Bacillus subtilis inoculation improves nutrient uptake and physiological activity in sugarcane under drought stress. Microorganisms 2022, 10, 809. [Google Scholar] [CrossRef] [Scilit]
- Zhao, M.; Zhang, J.; An, Q.; Ma, W.; Zhang, M.; Guo, Z.; Chen, X.; Yang, F.; Dai, L. Synergistic remediation of saline-alkali soil through inoculation of wheat with arbuscular mycorrhizal fungi and bacillus tropicus N5. J. Soil Sci. Plant Nutr. 2026, 26, 3790–3809. [Google Scholar] [CrossRef] [Scilit]
- Yang, Y.; Zou, Y.; Zeng, K.; Chen, D.; Li, Z.; Guo, H.; Huang, D.; Wang, X.; Luo, H. Effect of Bacillus subtilis fortified inoculation on the microbial communities in different niches of Daqu. J. Biosci. Bioeng. 2022, 134, 407–415. [Google Scholar] [CrossRef] [Scilit]
- Zhang, N.; Wang, Z.; Shao, J.; Xu, Z.; Liu, Y.; Xun, W.; Miao, Y.; Shen, R.; Zhang, R. Biocontrol mechanisms of Bacillus: Improving the efficiency of green agriculture. Microb. Biotechnol. 2023, 16, 2250–2263. [Google Scholar] [CrossRef] [Scilit]
- Liu, Z.; Song, Y.; Ge, L.; Pan, X.; Zhao, Y.; Cheng, L.; Li, Y.; Wang, W.; Liu, X. Impact of various organic fertilizers on the growth, yield, and soil environment of peanuts subjected to continuous cropping obstacles. Pol. J. Environ. Stud. 2023, 32, 3683–3693. [Google Scholar] [CrossRef] [Scilit]
- Wang, Y.; Song, T.; Liang, R.; Zhang, Y.; Wang, W.; Gao, L.; Li, L.; Lin, Y. Microbial inoculants alleviate continuous cropping obstacles in Gynostemma pentaphyllum (Thunb.) Makino by reshaping rhizosphere microbial communities. Ind. Crops Prod. 2026, 244, 123231. [Google Scholar] [CrossRef] [Scilit]
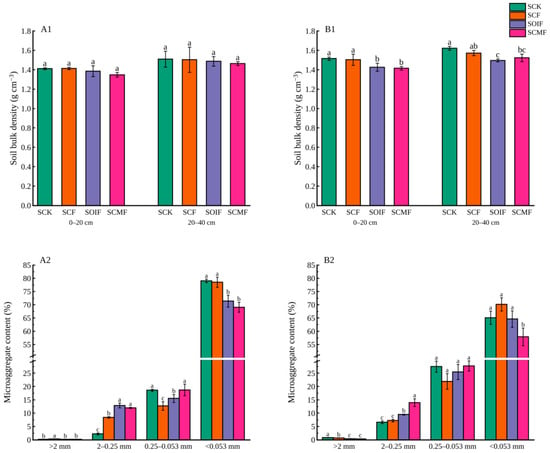
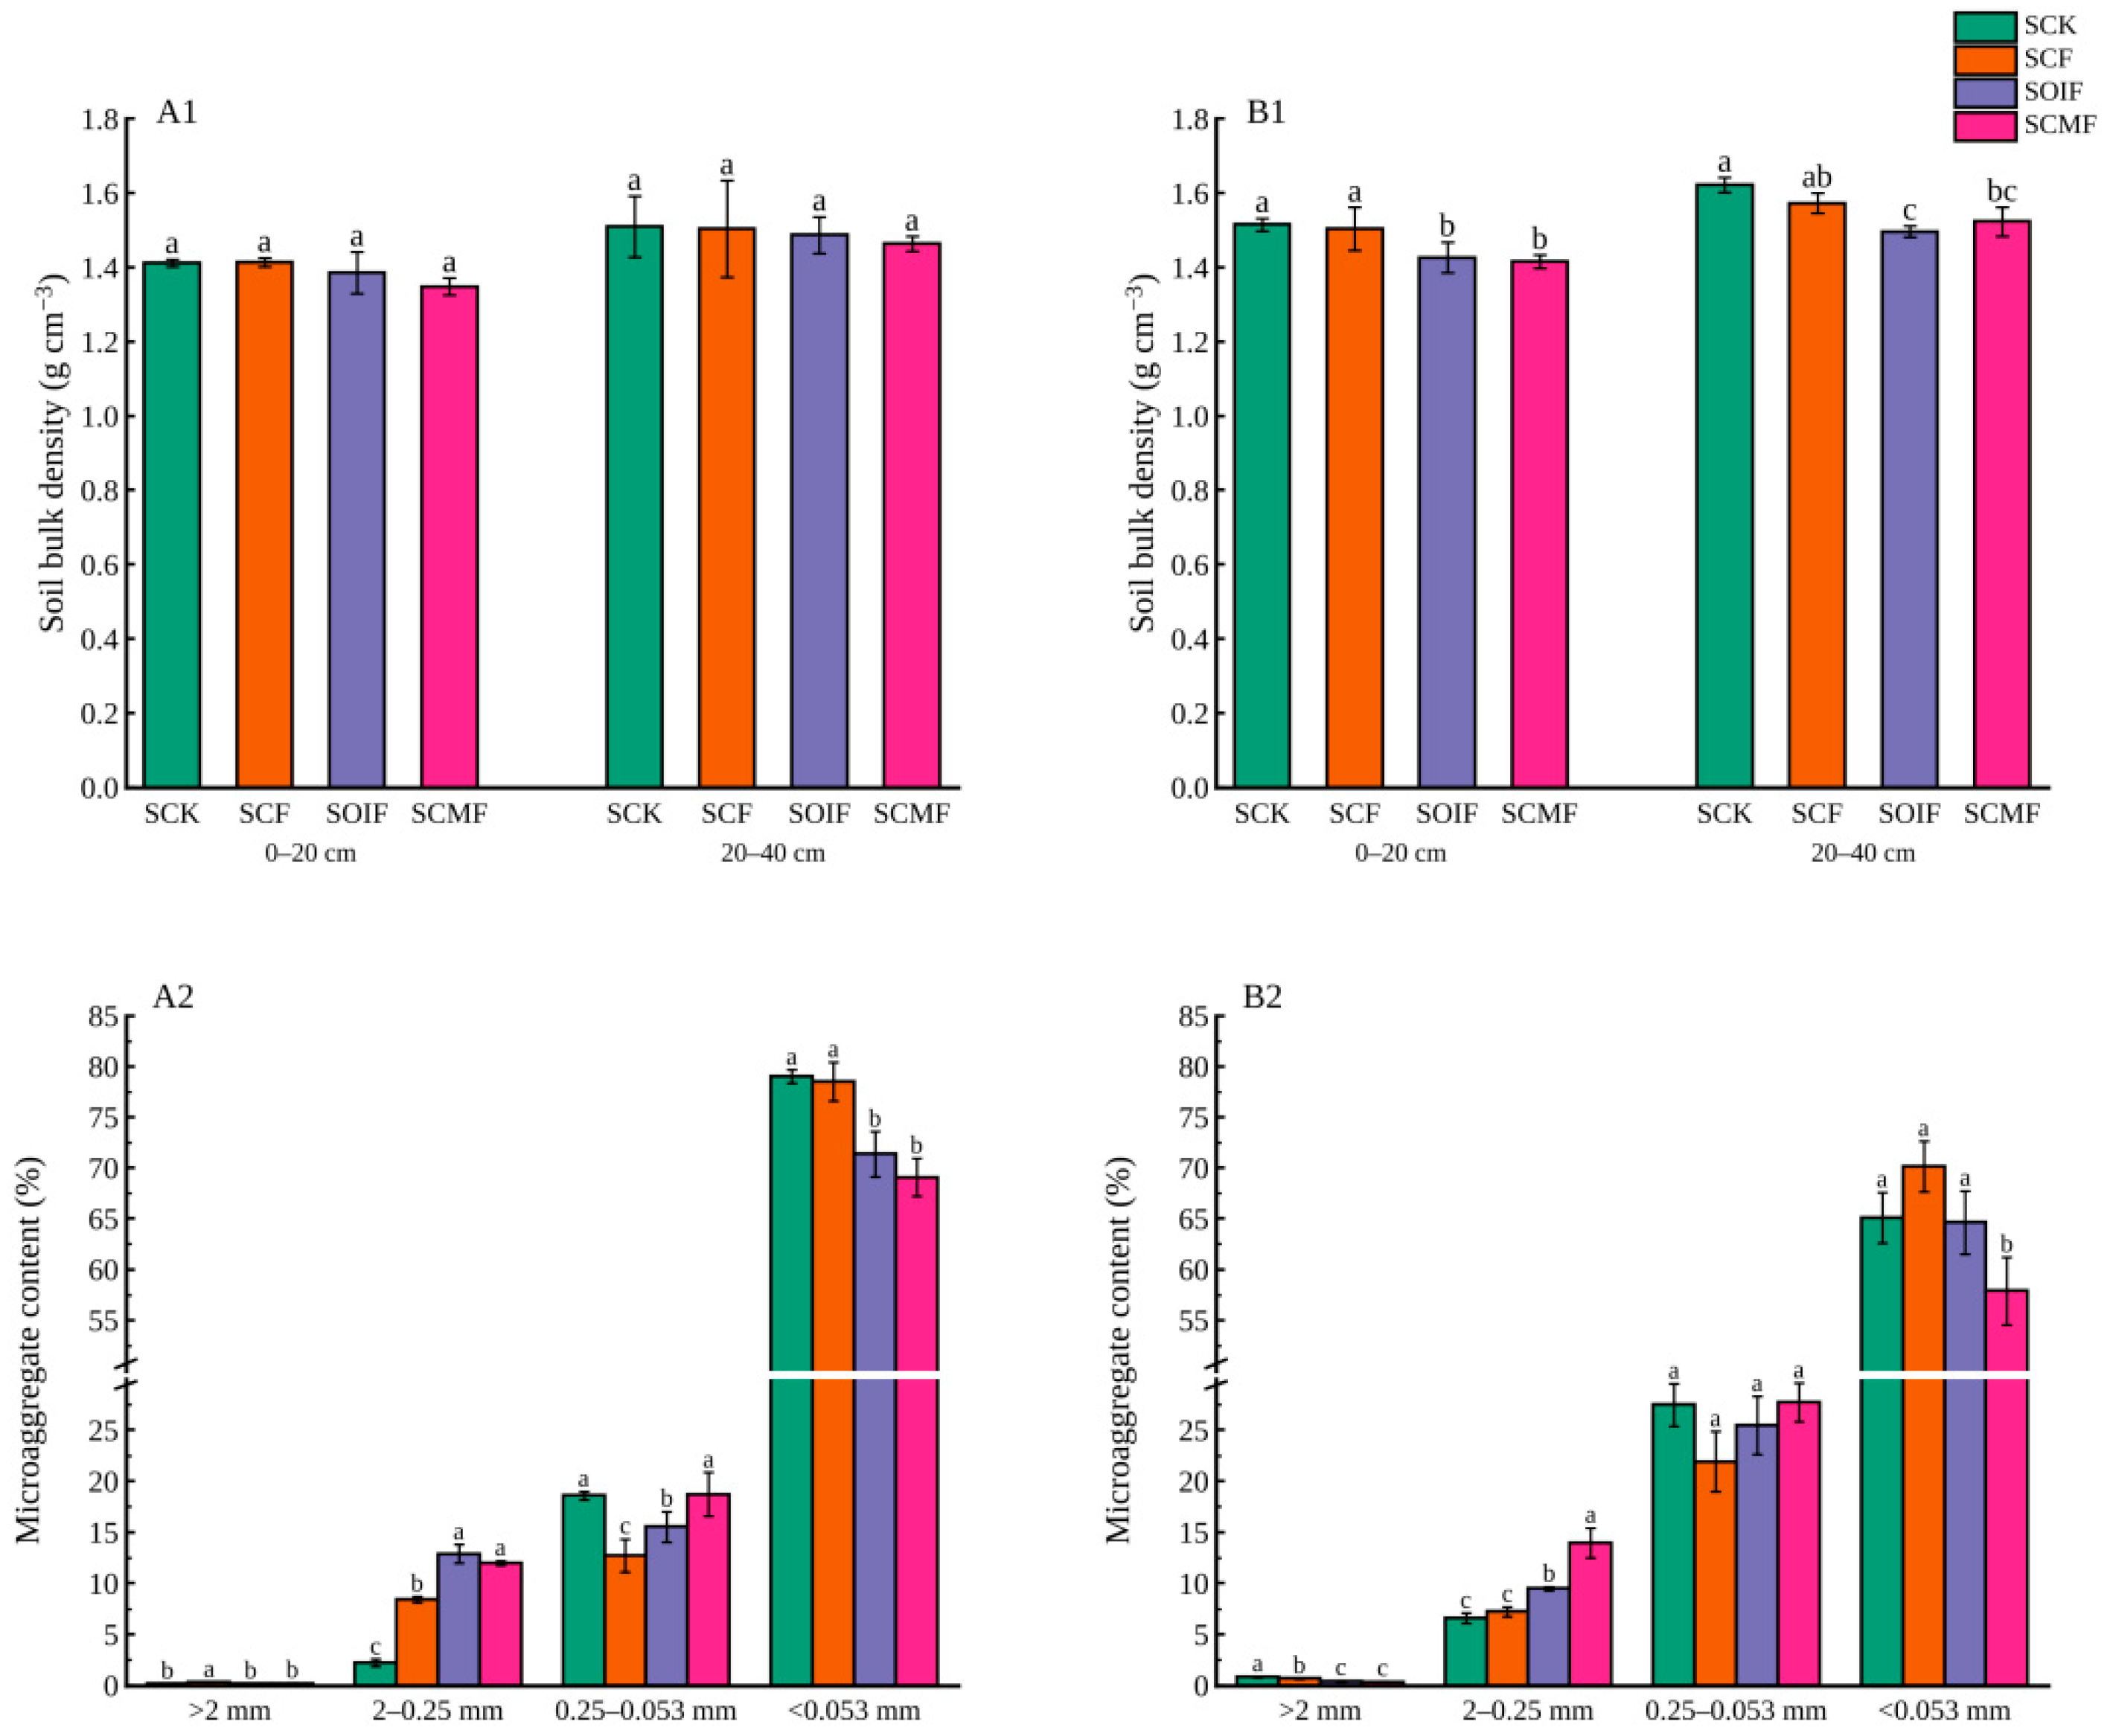
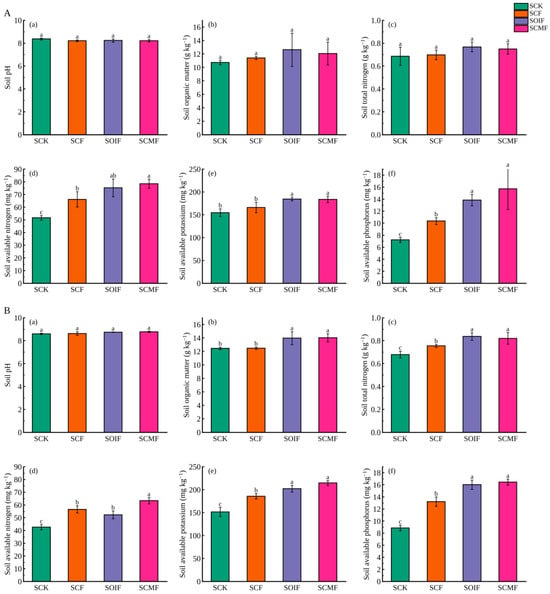
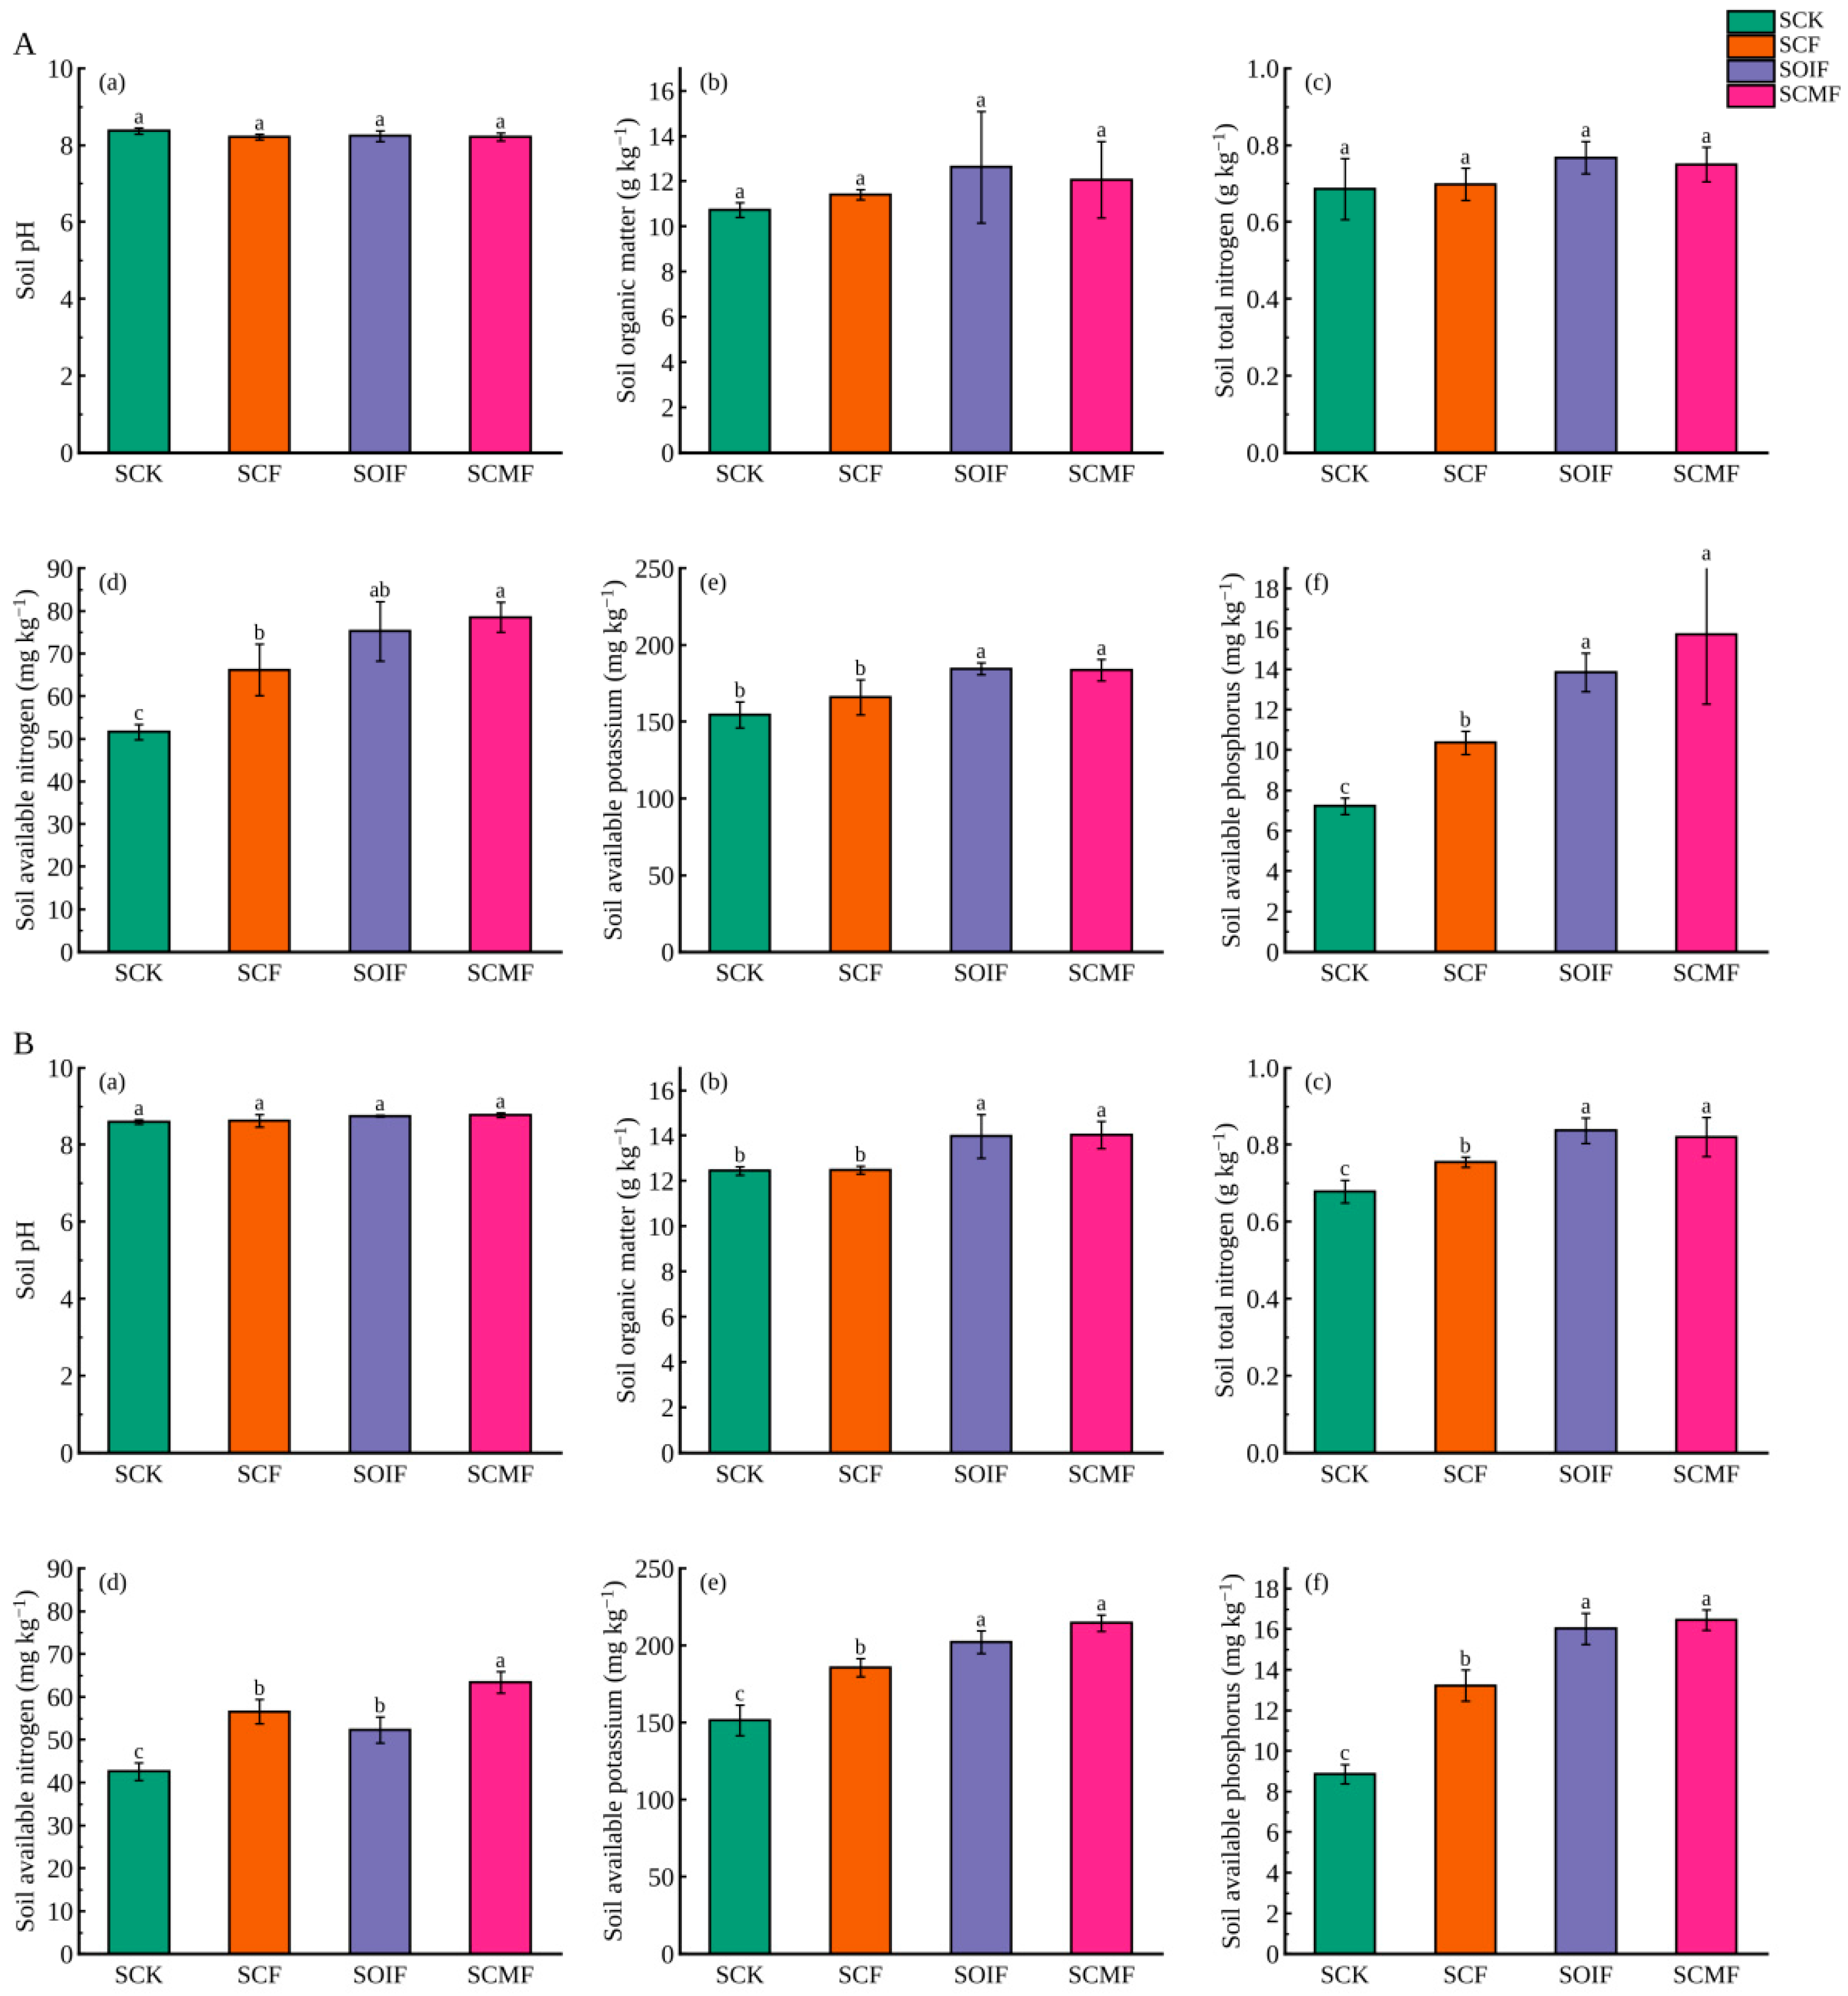
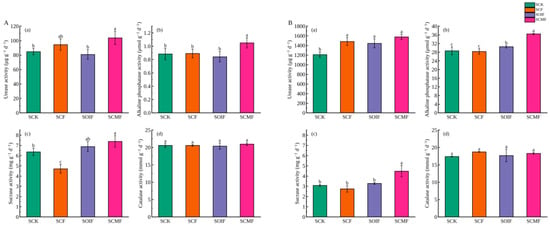
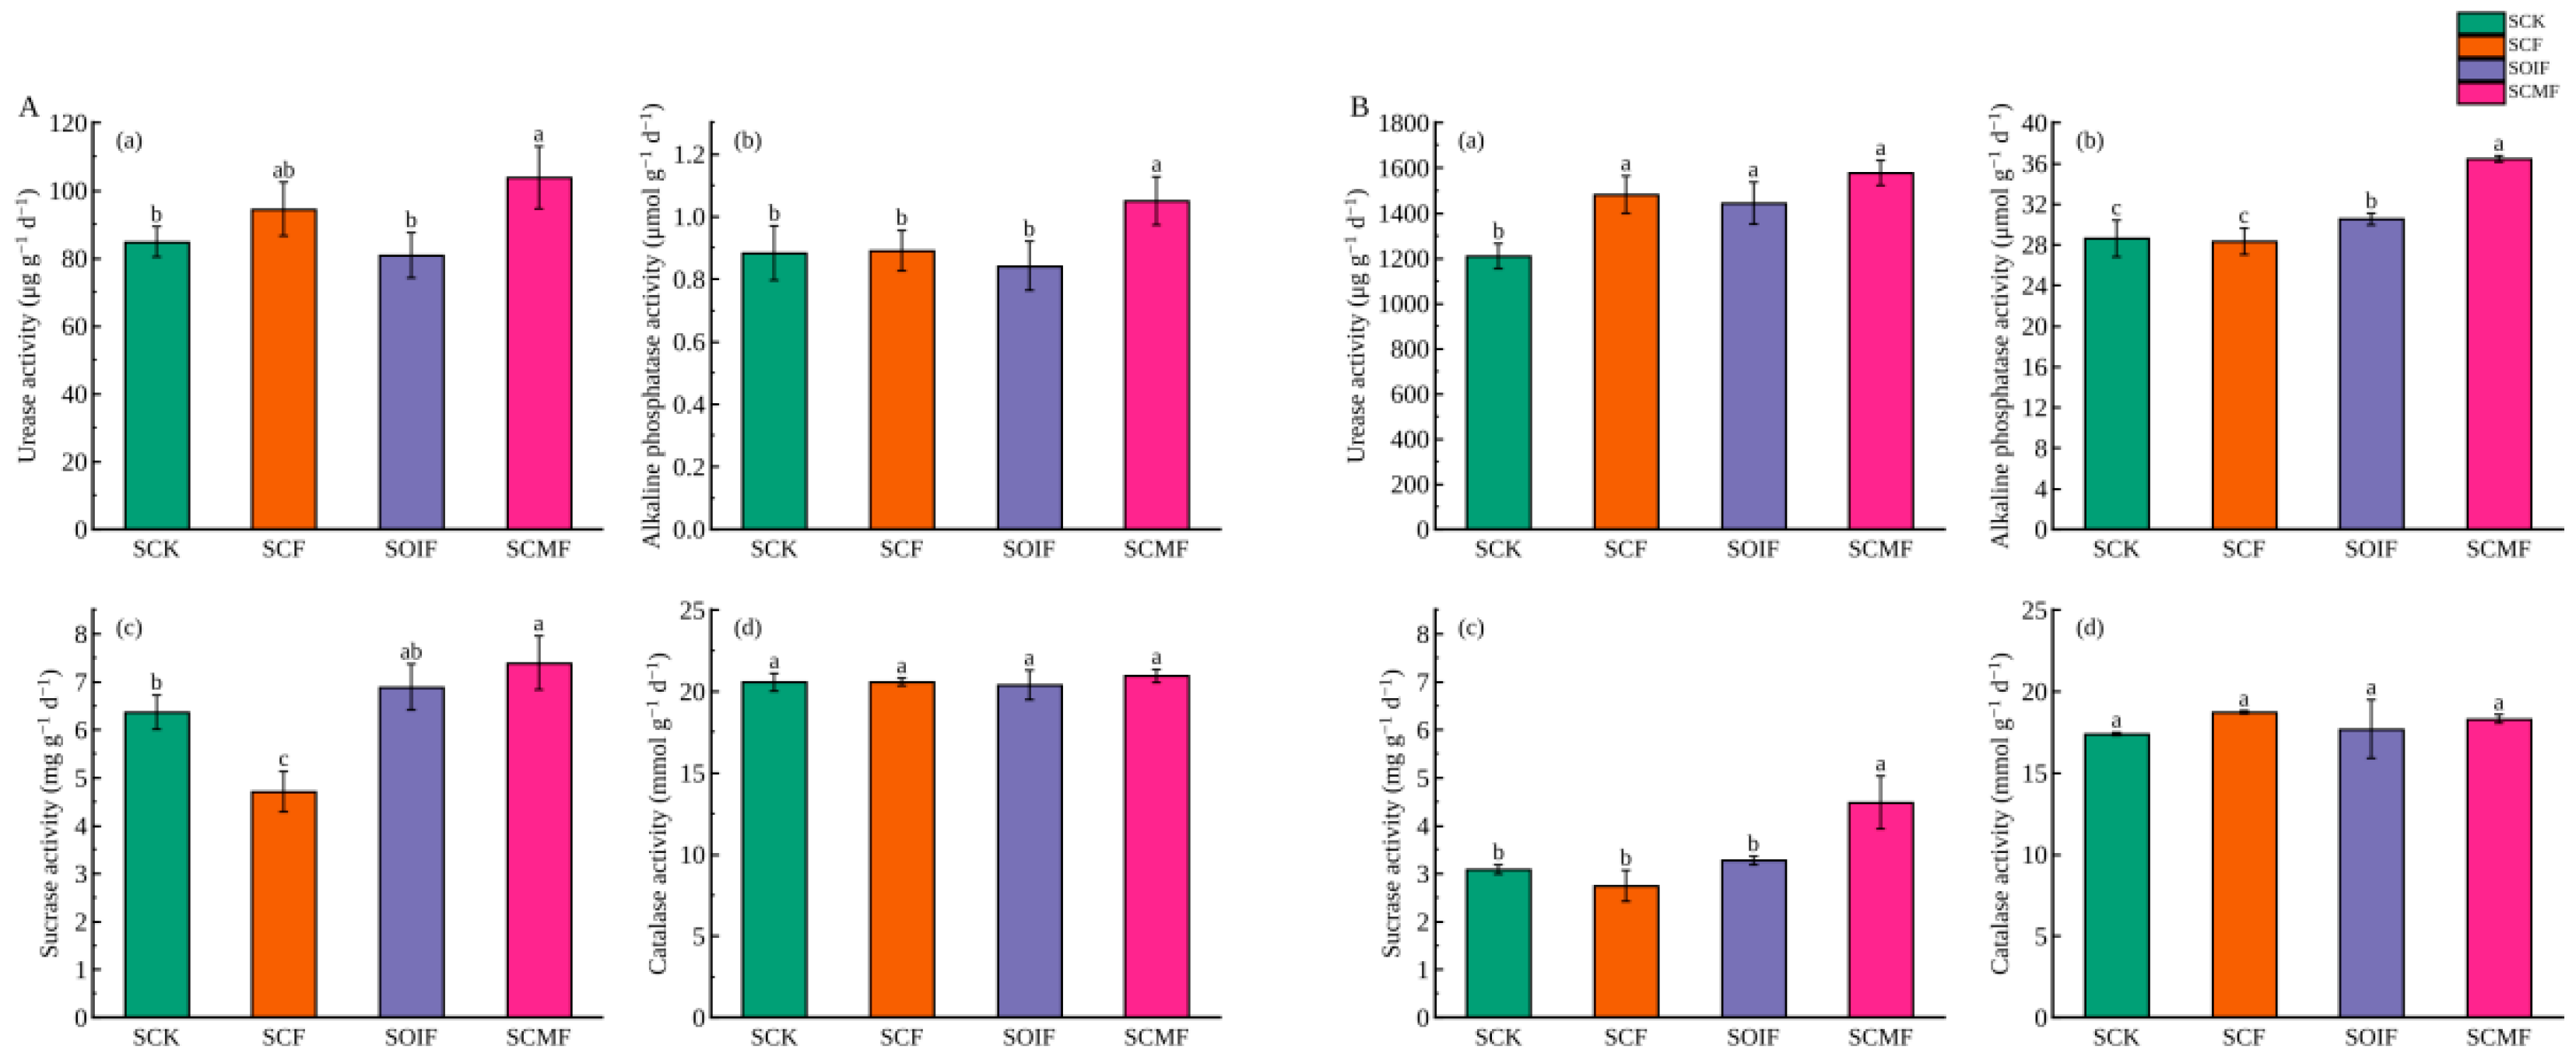
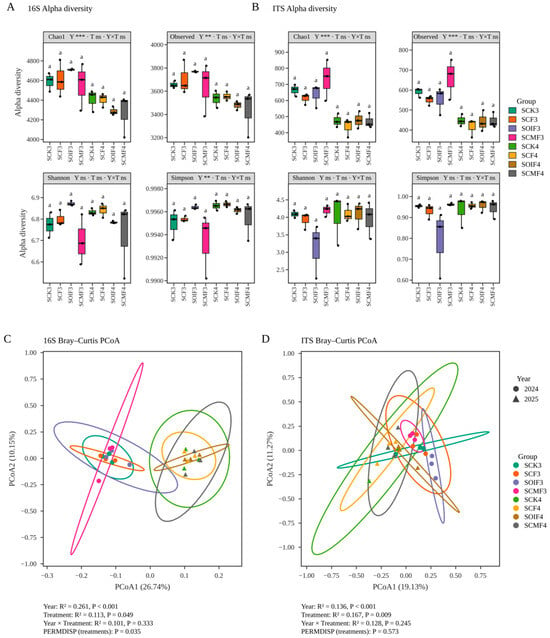
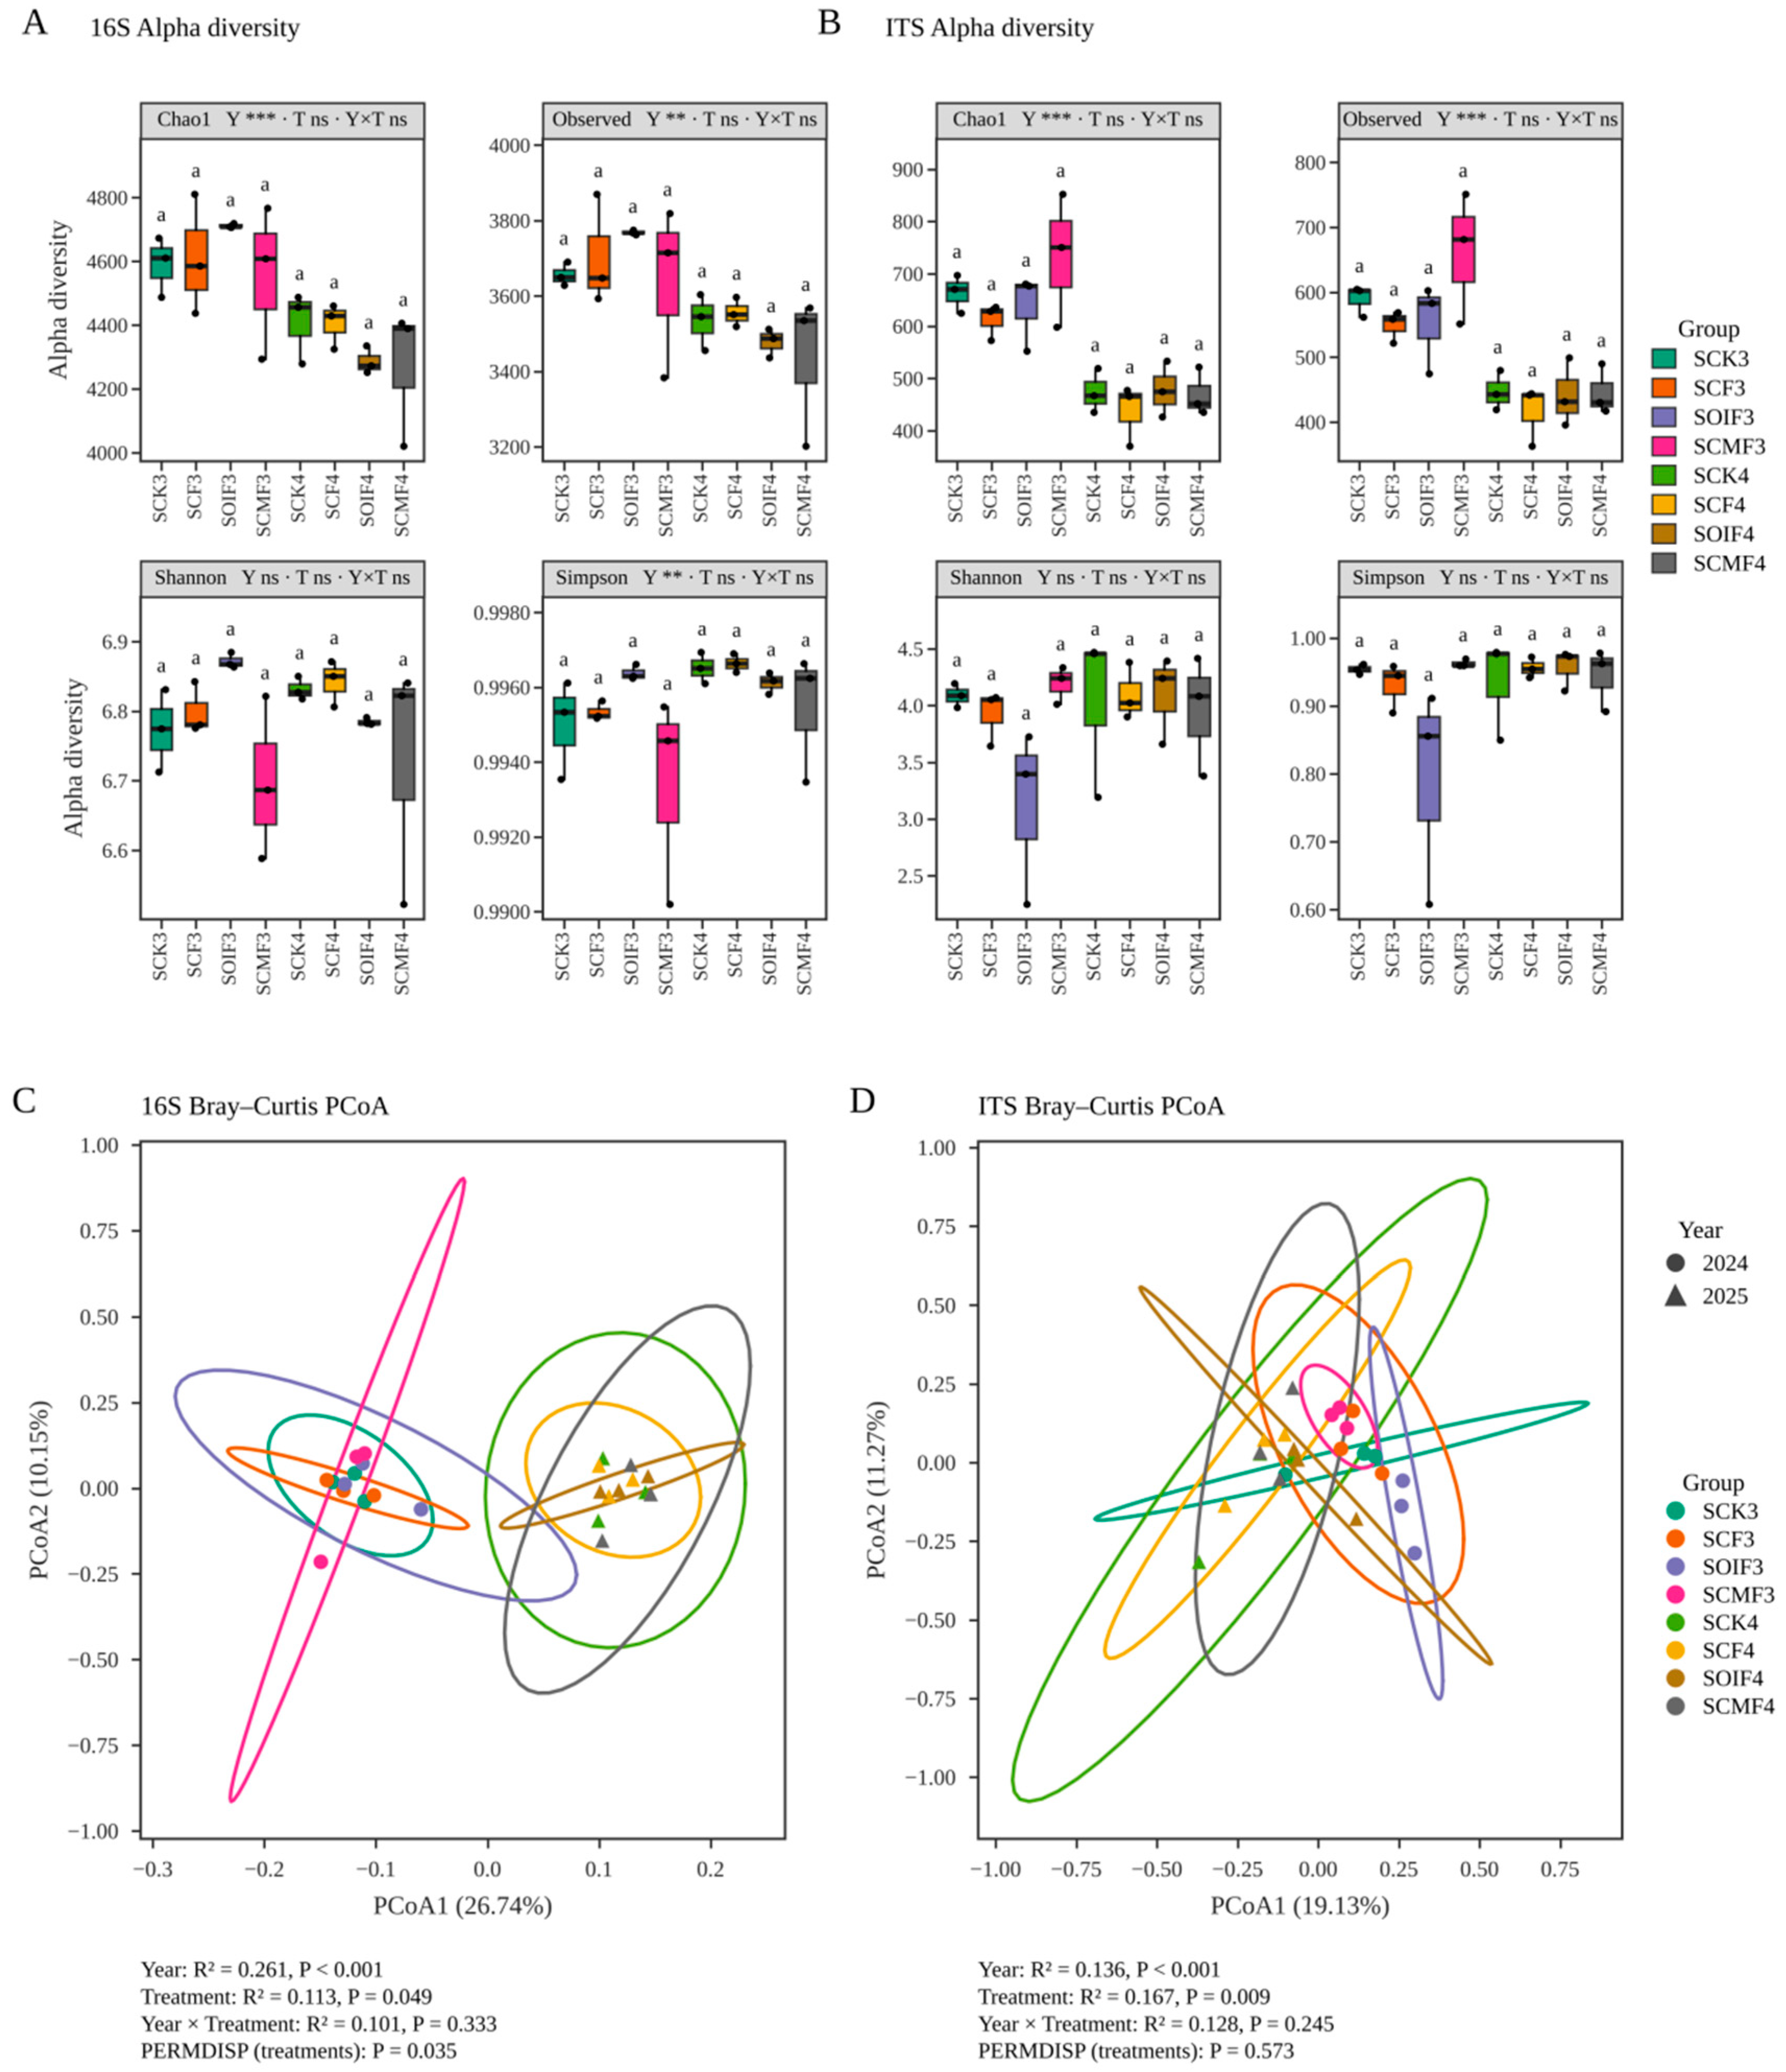
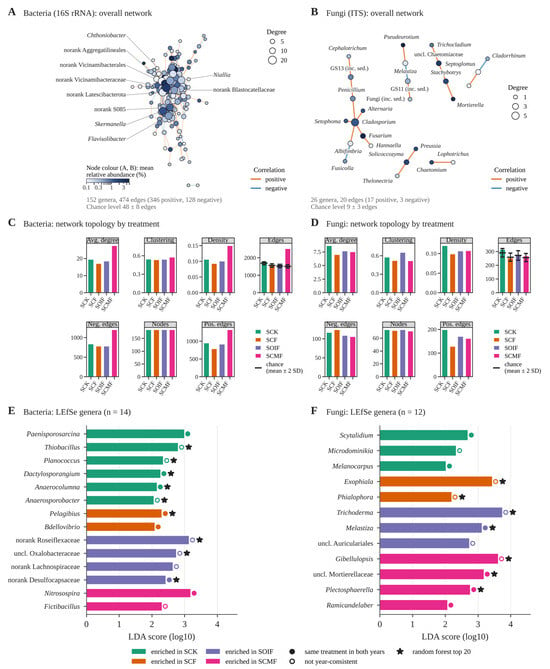
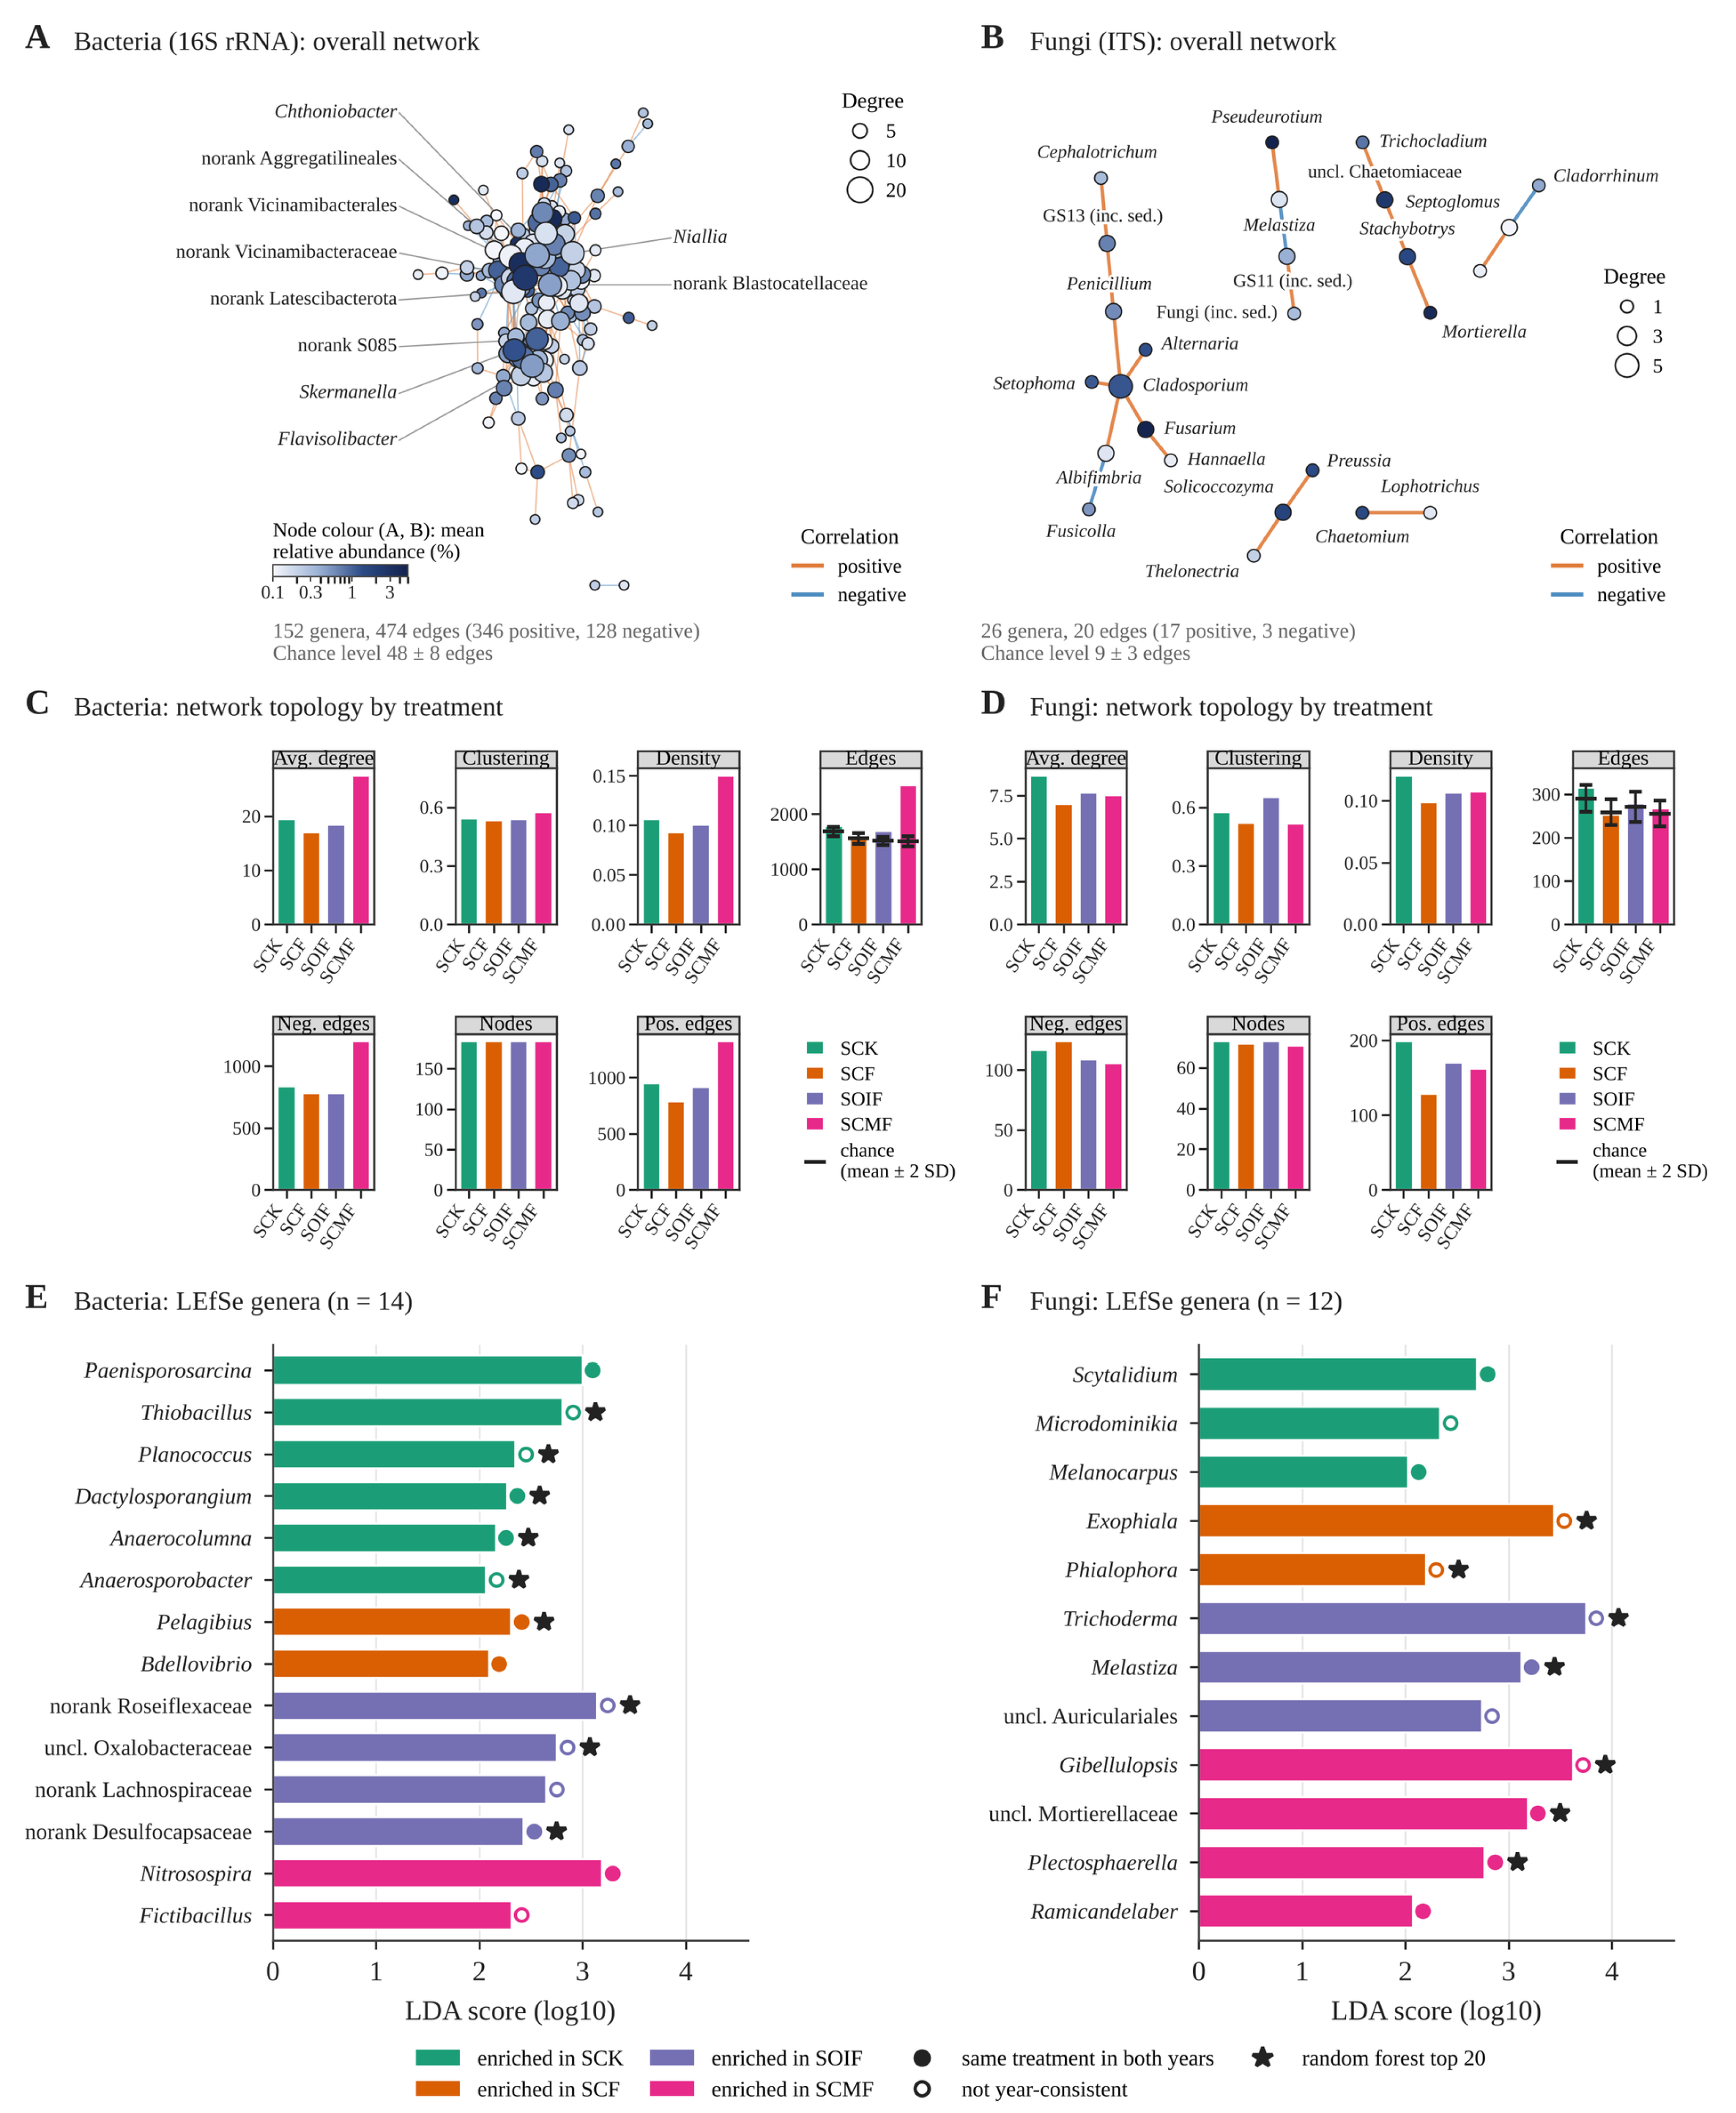
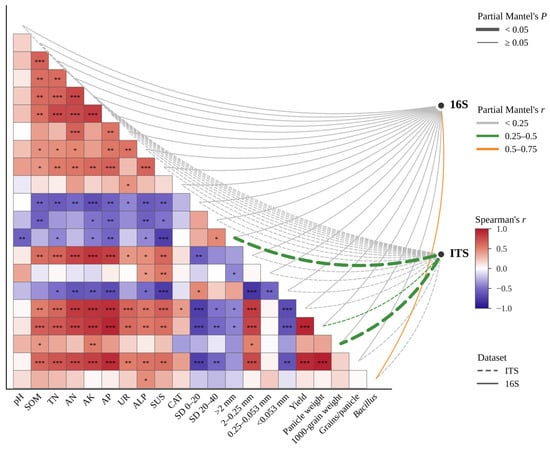
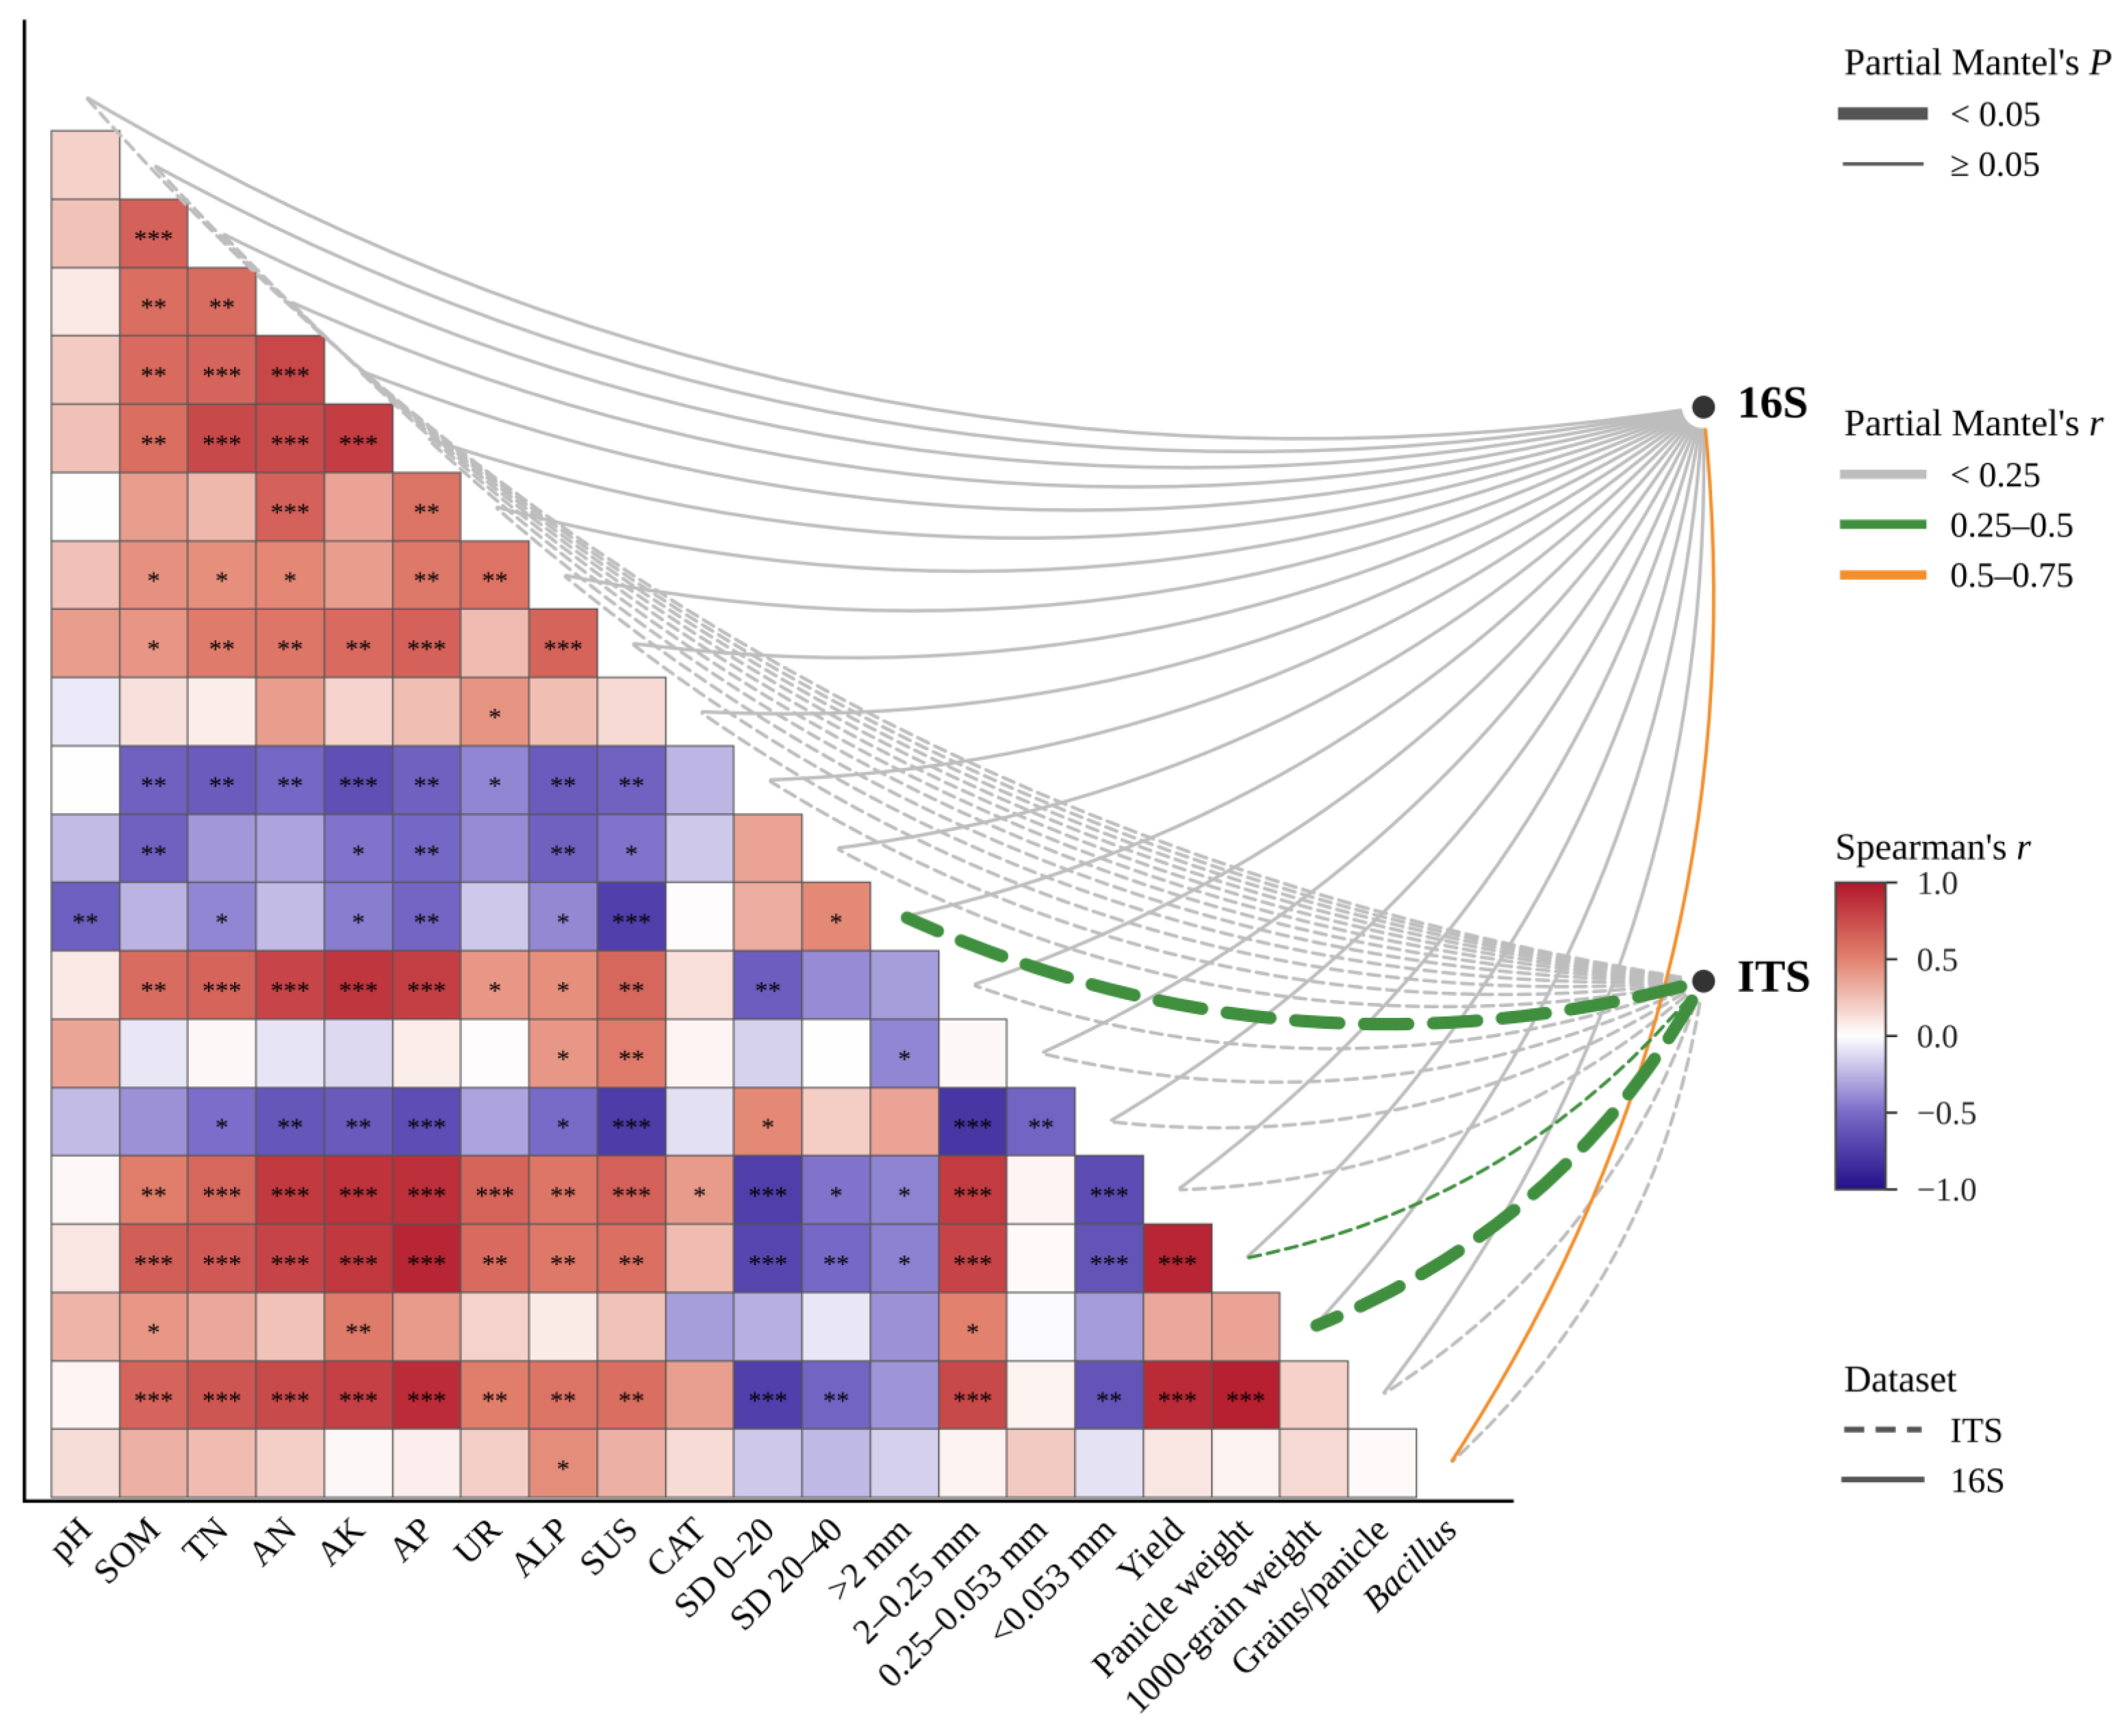
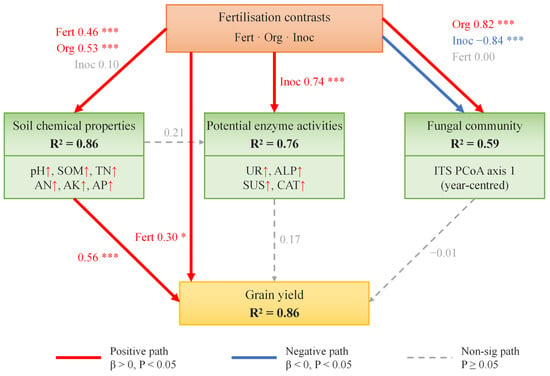
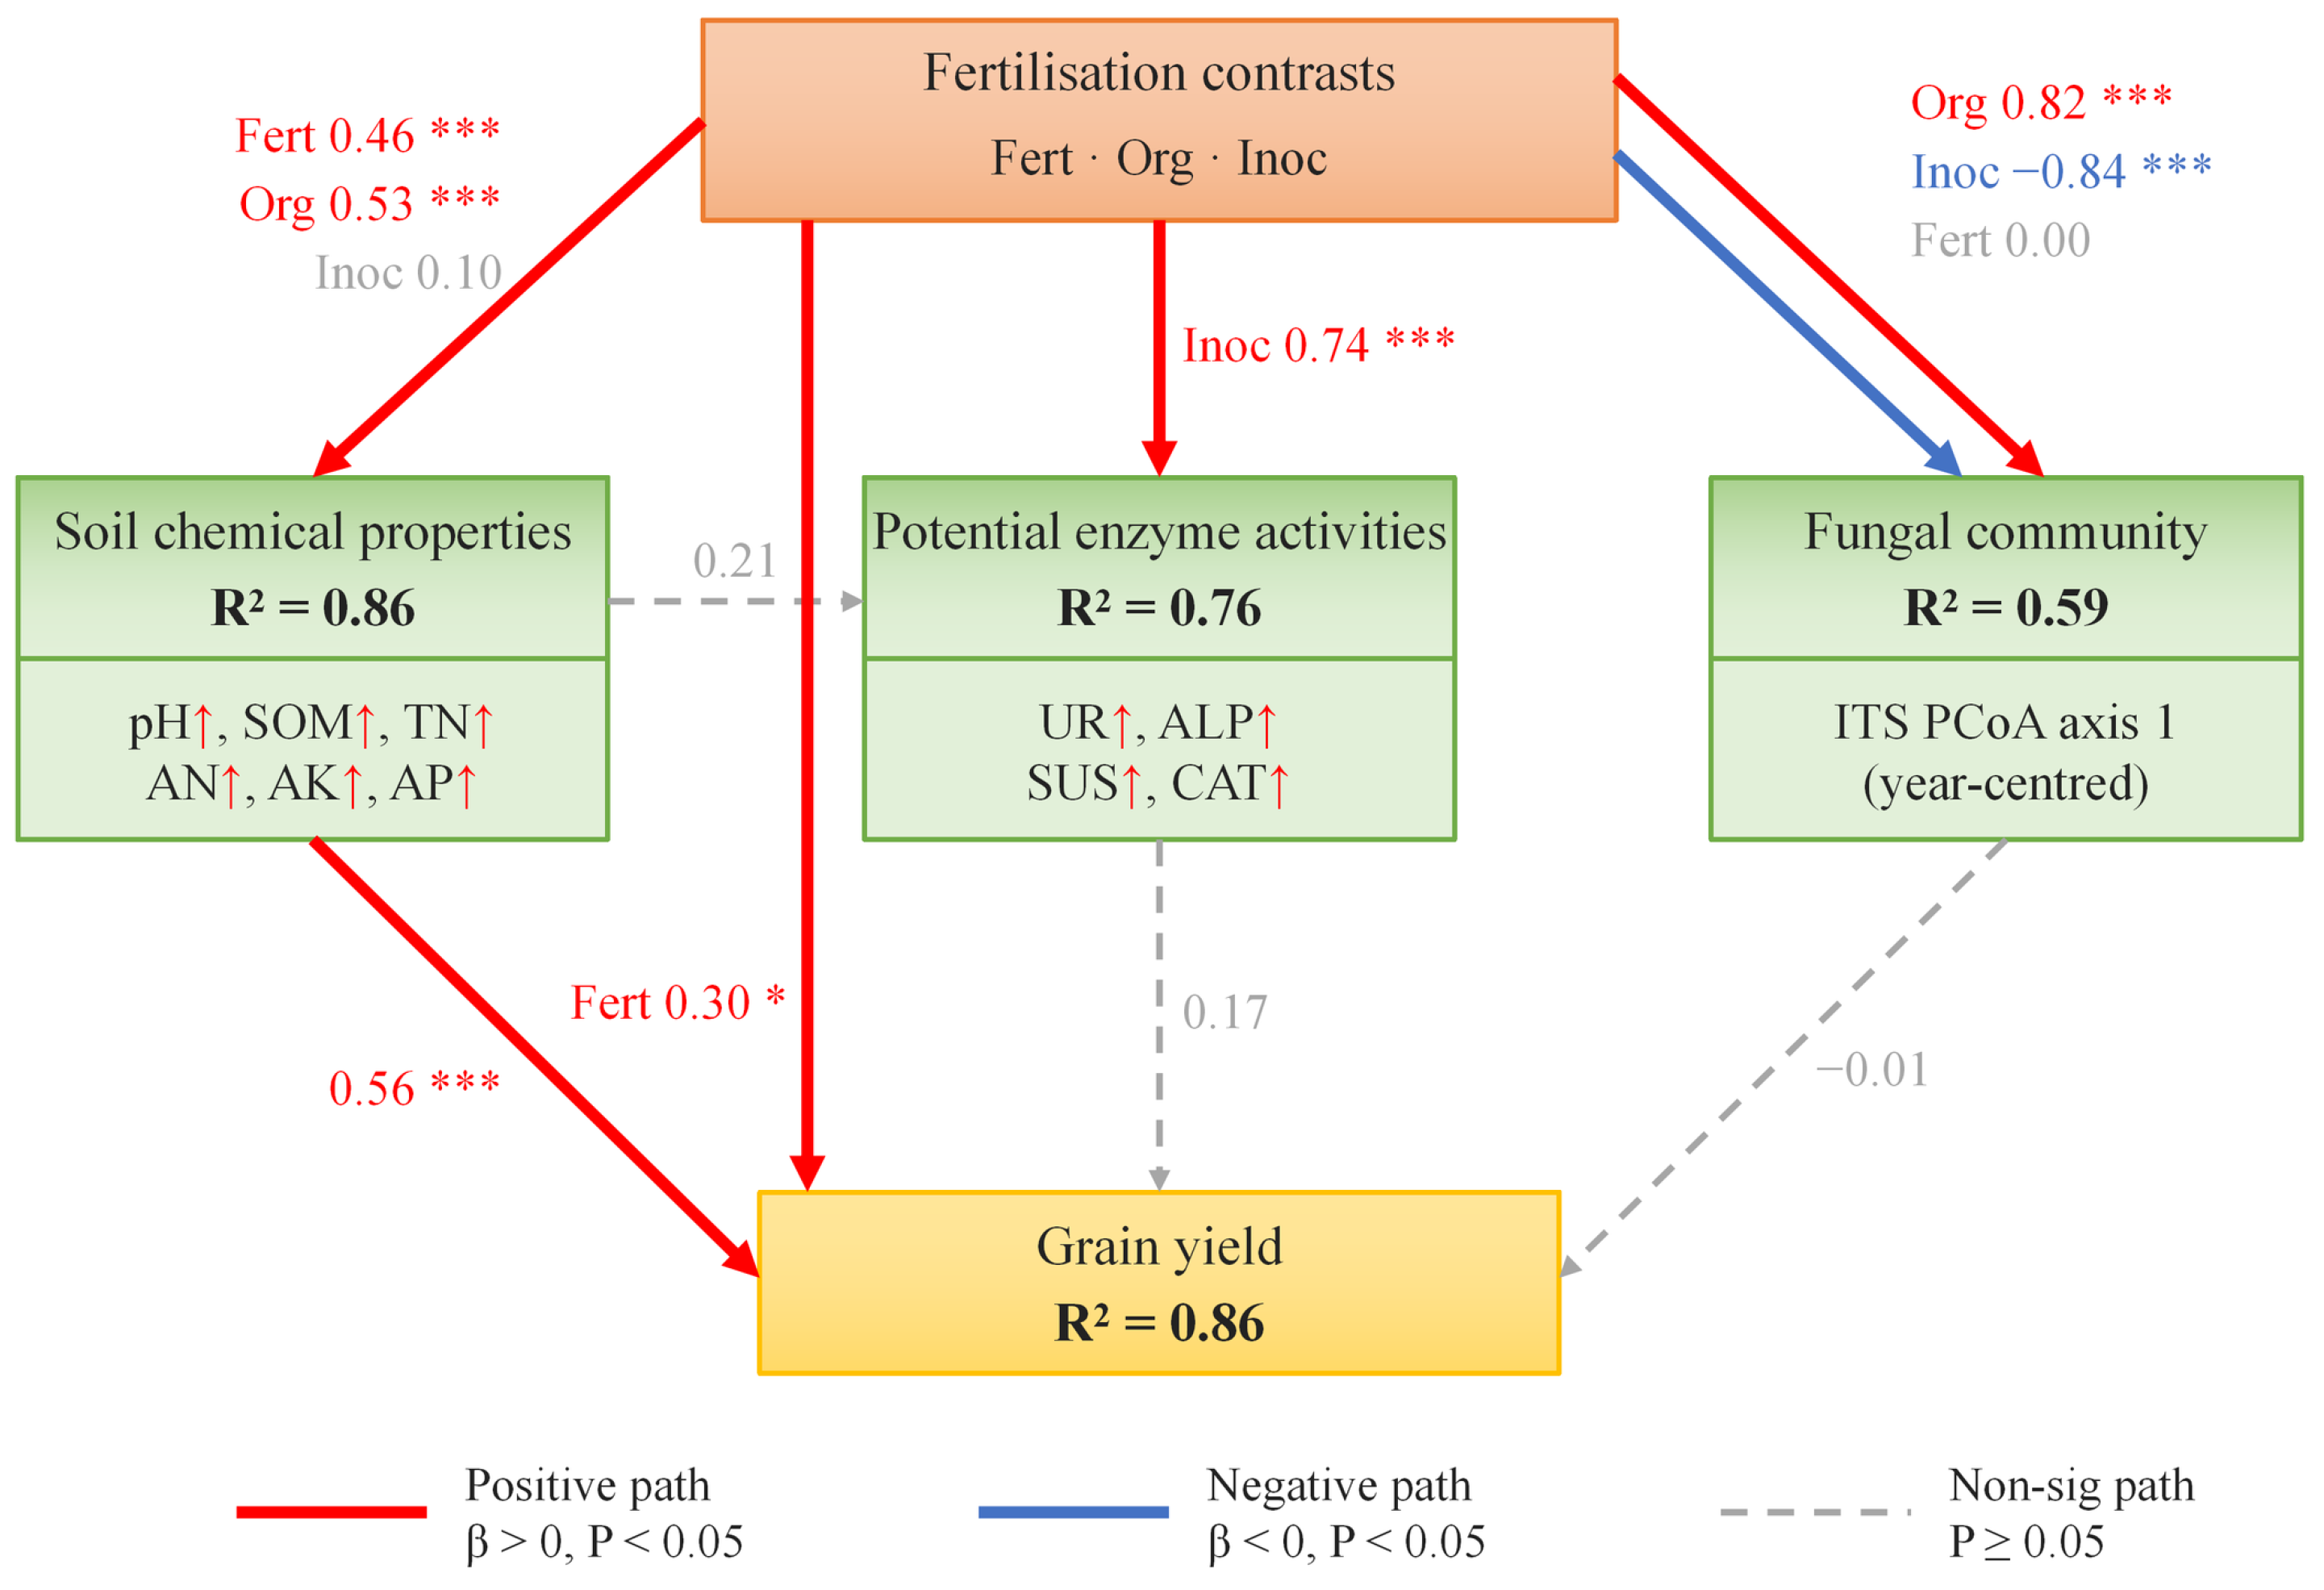

Disclaimer/Publisher’s Note: The statements, opinions and data contained in all publications are solely those of the individual author(s) and contributor(s) and not of MDPI and/or the editor(s). MDPI and/or the editor(s) disclaim responsibility for any injury to people or property resulting from any ideas, methods, instructions or products referred to in the content. |
© 2026 by the authors. Licensee MDPI, Basel, Switzerland. This article is an open access article distributed under the terms and conditions of the Creative Commons Attribution (CC BY) license.