


Abstract
To address the challenges of large-scale drought-resistance phenotyping in cotton—specifically the difficulty of assessment and the high cost of destructive sampling—this study developed a high-throughput evaluation framework for the Drought Resistance Coefficient of Effective Boll Number (DCEBN) in Gossypium hirsutum (upland cotton). This framework integrates time-series UAV-based multispectral technology with interpretable machine learning algorithms. Based on field drought experiments conducted in Xinjiang during 2023–2024 using 150 core germplasm accessions, we extracted and calculated the relative response ratios of canopy multispectral vegetation indices (DCVIs). We compared the predictive performance of K-Nearest Neighbors (KNN), Support Vector Regression (SVR), Random Forest (RF), and Stacking ensemble algorithms, while employing the SHapley Additive exPlanations (SHAP) framework to quantify the contribution of each vegetation index to DCEBN prediction. This framework provides a practical, non-destructive approach for large-scale DCEBN prediction and for identifying key spectral indicators of drought tolerance in cotton. The results demonstrated that time-series multispectral features sensitively captured the dynamic response of cotton to water deficit; notably, ensemble learning models (RF and Stacking) exhibited superior fitting accuracy and generalization capabilities in predicting DCEBN. SHAP analysis identified NRI, SCCCI, MTVI2, and EVI as the four key indices contributing most significantly to the predictions, offering interpretable guidance for reducing spectral redundancy in future phenotyping. Validation using extreme-phenotype genotypes further confirmed that changes in these four indices effectively reflected the decline in photosynthetic rate and the reduction in effective boll number under drought stress, demonstrating that the model can both predict DCEBN and identify extreme germplasm for breeding use.
1. Introduction
Cotton (Gossypium hirsutum L.) is a vital global natural fiber crop and a significant source of oil and protein; however, its growth and development are highly sensitive to water availability [1]. Amidst global warming, frequent extreme weather events, and dwindling groundwater resources, drought has emerged as the primary abiotic stress factor limiting stable, high cotton yields worldwide—particularly in arid and semi-arid regions such as Xinjiang, China’s largest cotton-producing area [2]. Water deficit induces stomatal closure, inhibits photosynthesis, and accelerates chlorophyll degradation [3], leading to the shedding of squares and bolls, which significantly reduces the effective boll number per plant and lint yield [4]. Consequently, in the context of climate change, the rapid and precise screening and breeding of drought-resistant germplasm have become key strategies for ensuring the sustainable development of the cotton industry [5].
Crop breeding is currently undergoing a pivotal transition from genomics to phenomics [6]. Traditional drought-resistance phenotyping relies heavily on manual field assessments—such as using portable instruments to measure gas exchange parameters, manually counting fruiting branches and bolls, and destructive sampling for yield estimation [7]. These methods are not only labor-intensive and costly but also prone to subjective error, making them inadequate for the high-throughput phenotyping demands of modern genome-wide association studies (GWAS) and large-scale breeding populations. The lag in phenotyping efficiency has become a significant bottleneck in elucidating the mechanisms underlying genotype–environment interactions [8].
In recent years, rapid advancements in low-altitude unmanned aerial vehicle (UAV) remote sensing and sensor technologies have provided transformative tools for high-throughput phenotyping of field crops [9]. UAVs equipped with multispectral cameras can rapidly acquire high-resolution canopy imagery; by extracting reflectance data from specific spectral bands (such as visible light, red-edge, and near-infrared) and calculating vegetation indices (VIs), researchers can sensitively monitor the physiological and biochemical status of crops [10]. Studies have shown that indices such as the Normalized Difference Vegetation Index (NDVI) are highly correlated with leaf area index (LAI) and biomass, whereas red-edge indices (e.g., NDRE, SCCCI) are more sensitive to changes in chlorophyll content and responses to water stress [11]. Although multispectral technology has been widely applied to crops such as wheat and maize [12], there remains a lack of systematic, quantitative, and in-depth research into the dynamic response mechanisms of multidimensional spectral characteristics in Gossypium hirsutum (upland cotton) populations—particularly under temporal drought stress.
With the acquisition of massive, high-dimensional remote sensing datasets, traditional linear regression models struggle to effectively handle the inherent non-linearity and multicollinearity of the data [13]. Machine learning (ML) algorithms offer an effective solution to this challenge [14]. Algorithms such as KNN, SVR, RF, and Stacking Ensemble learning excel at deciphering the non-linear mapping relationships between complex agronomic traits and spectral data [15]. However, complex ML models often lack interpretability regarding their internal operations [16]; while they achieve high prediction accuracy, quantifying the specific contribution mechanisms of individual spectral bands or features remains difficult, thereby limiting their deeper application in plant physiology and breeding [17]. To address this issue, the game theory-based SHAP method has emerged. SHAP quantifies the marginal contribution of each feature to the model output, enabling not only the global ranking of feature importance but also the revelation of how changes in feature values positively or negatively influence predictions, thus bridging the gap between data mining and plant physiological mechanisms [18]. This convergence of high-throughput phenotyping and AI-assisted prediction has recently been identified as a core enabler for precision breeding of climate-resilient cotton, underscoring the timeliness of the present work [19].
Previous studies have demonstrated the potential of UAV multispectral imagery for drought phenotyping in cotton; however, most relied on single-time-point observations or a limited number of vegetation indices, and the models used were often “black boxes” that provided little insight into which spectral features drive the prediction. Moreover, drought resistance evaluation has frequently been based on a single trait or a narrow set of indices, and the classification of germplasm has rarely been linked to dynamic canopy spectral responses across the growing season. These limitations hinder the identification of robust spectral markers and the translation of model outputs into breeding decisions. To address these gaps, this study utilized 150 upland cotton accessions in field drought stress experiments conducted in Xinjiang during 2023–2024. We first established a multi-index drought resistance evaluation system and classified the germplasm; we then used UAVs to acquire time-series multispectral data to analyze the dynamic response patterns of canopy vegetation indices. We compared the prediction accuracy of KNN, RF, SVR, and Stacking models for the DCEBN, employed the SHAP framework to analyze feature importance, and identified potential spectral markers by comparing genotypes with extreme drought resistance or sensitivity. By linking time-series spectral features, interpretable machine learning, and extreme-genotype validation, this study provides methodological support for high-throughput cotton phenotyping, the discovery of drought-resistance gene resources, and precise yield estimation.
2. Materials and Methods
2.1. Experimental Site Overview and Plant Materials
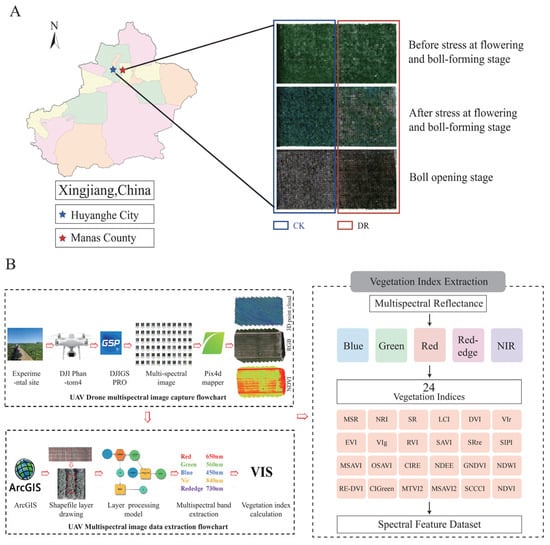
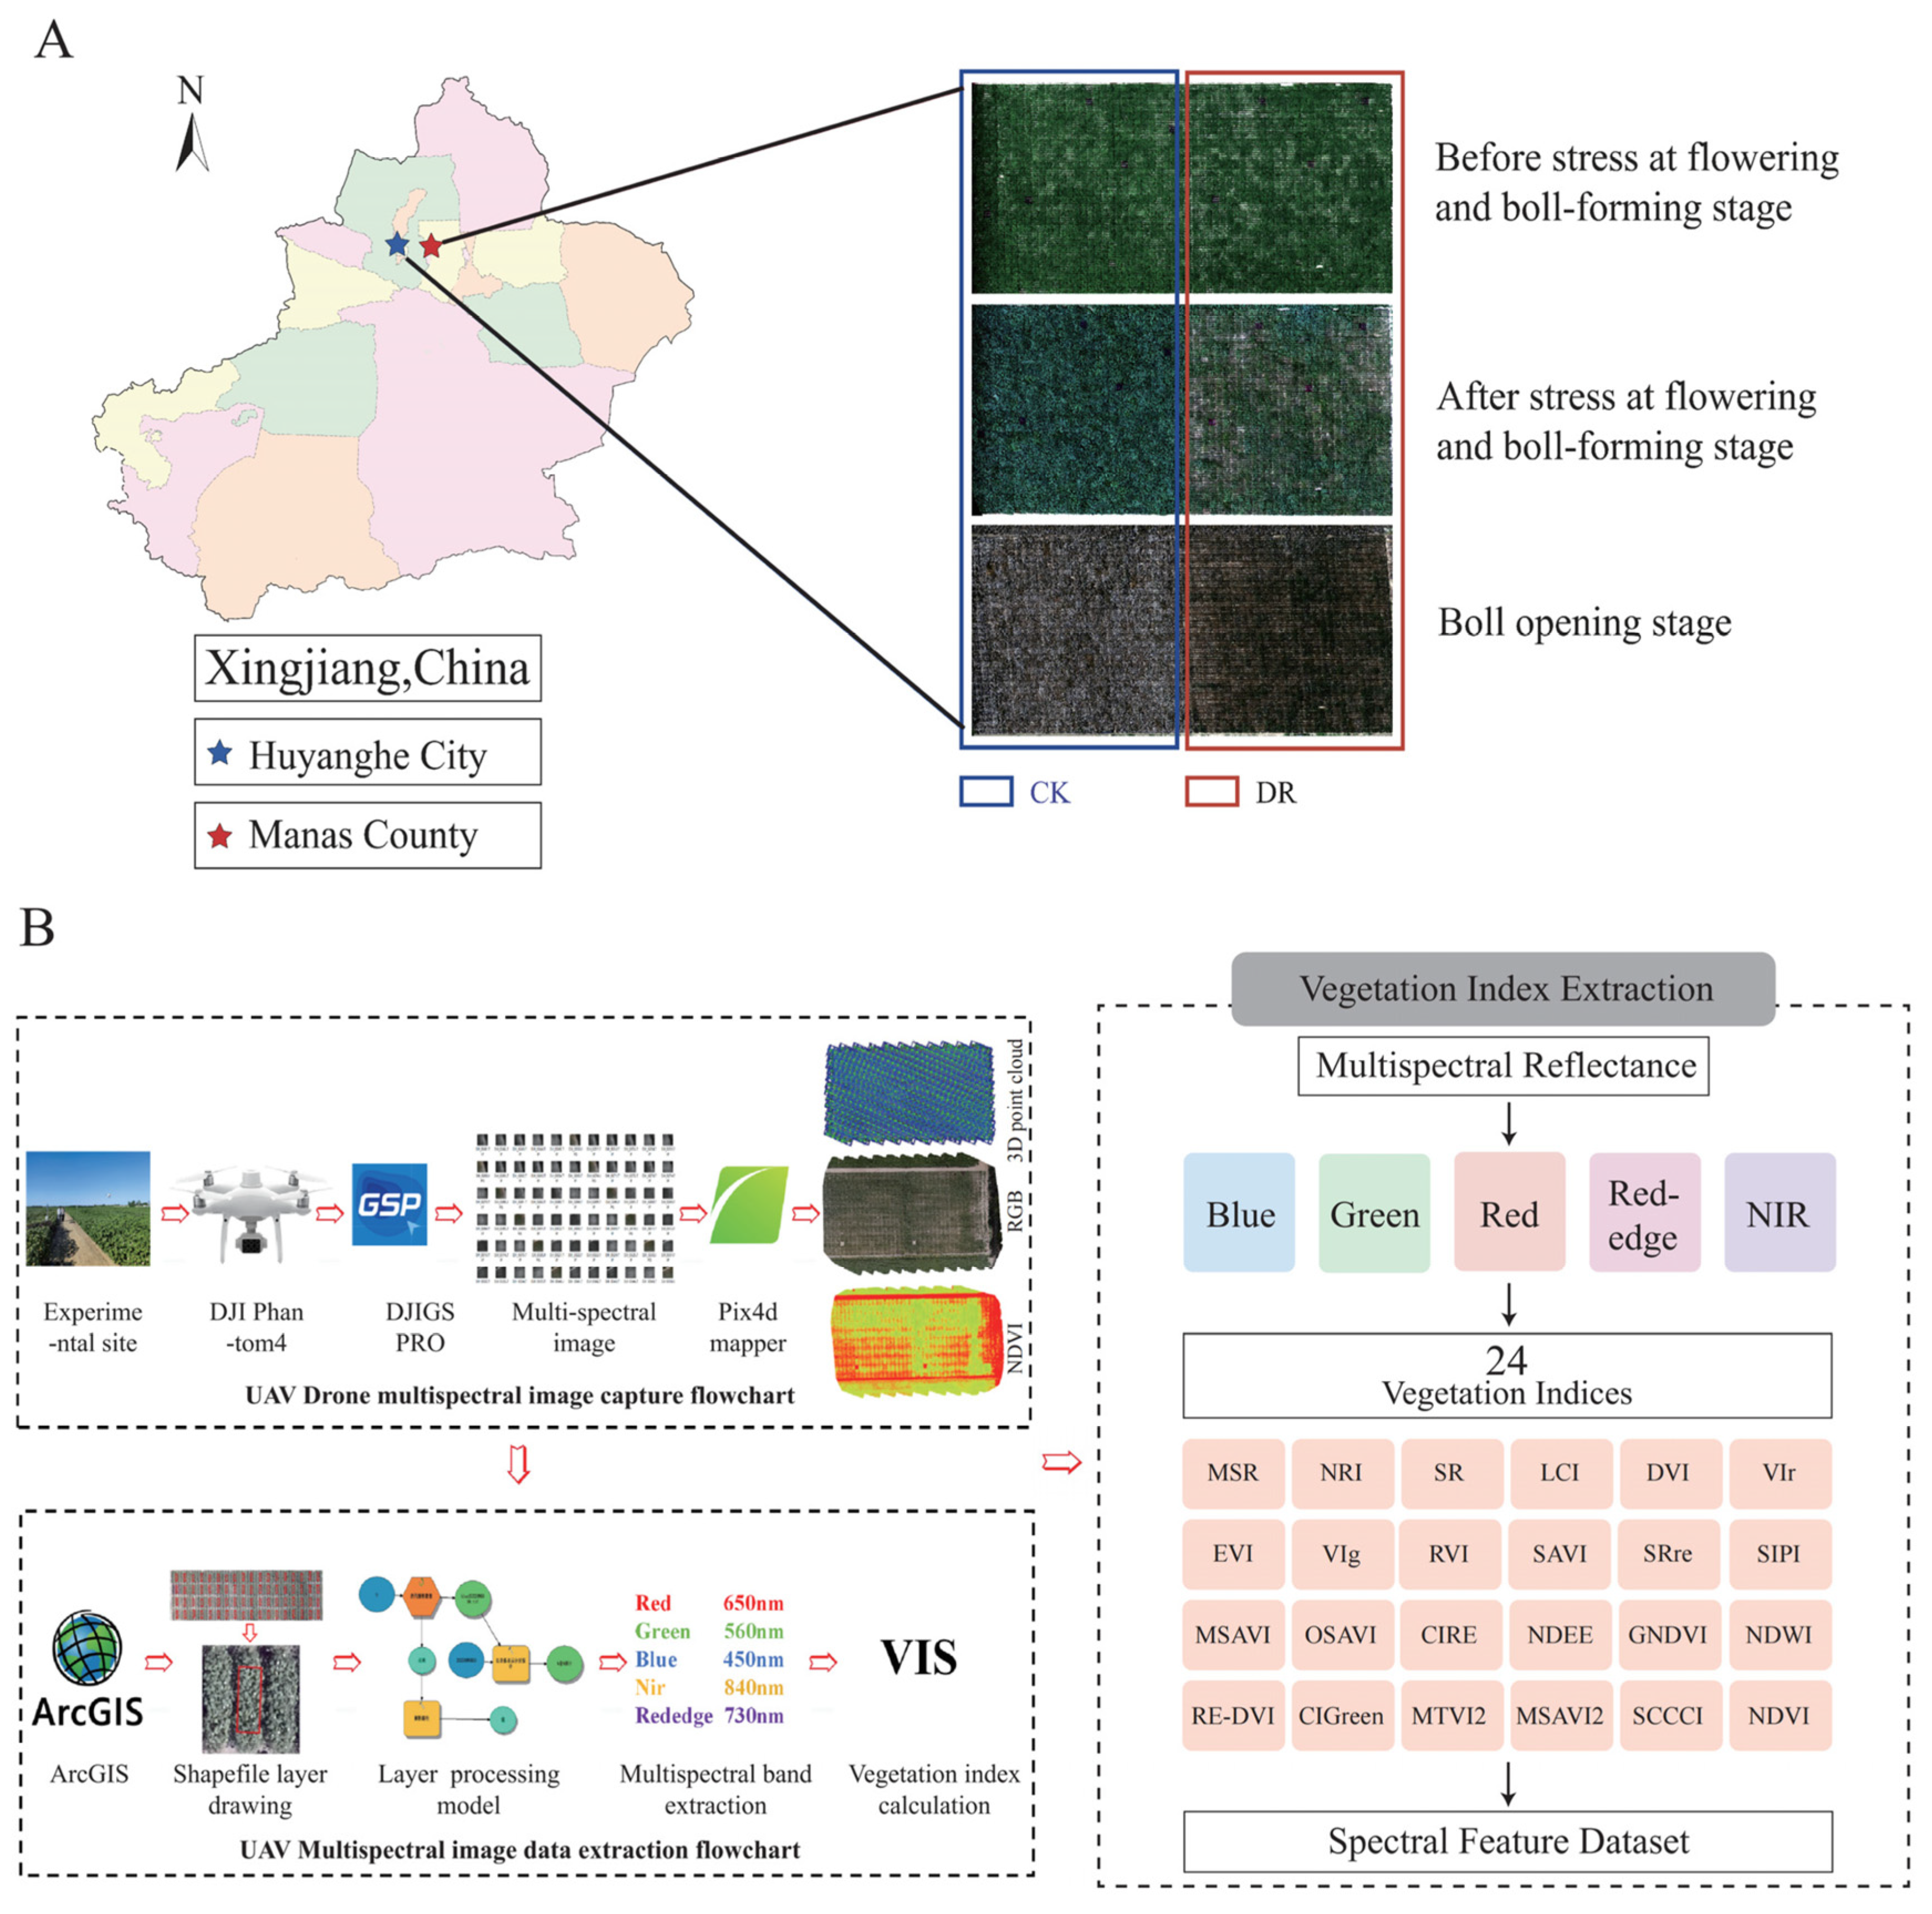
Field experiments were conducted in 2023 and 2024 at agricultural experimental stations in Manas County (44°17′ N, 86°13′ E) and Huyanghe City (44°43′ N, 84°44′ E), Xinjiang Uygur Autonomous Region, China (Figure 1A). At the Manas site, the annual precipitation was approximately 110.2 mm, lower than the long-term mean annual precipitation of Manas County (approximately 164.5–182.1 mm). Precipitation during the growing season (April–October) was approximately 96.2 mm, of which 44.7 mm occurred from June to August; in July, precipitation was only 0.5 mm and the mean maximum temperature reached 34 °C, indicating pronounced water deficit and high-temperature conditions during the critical cotton growth period. At the Huyanghe site, the annual precipitation was 158.3 mm, lower than the long-term mean annual precipitation of Huyanghe City (approximately 160.7–182.1 mm). Summer (June–August) precipitation was only 8.9 mm, markedly lower than the historical average for the same period. The mean summer temperature was 26.5 °C, and a prolonged high-temperature event with daily maximum temperatures above 35 °C persisted for more than two weeks from 13 to 28 July, with an extreme maximum temperature of 42.4 °C. Overall, the cotton growing seasons at both experimental sites were characterized by a drought-stress background of precipitation deficit combined with high temperatures. This region—characterized by long summer daylight hours, significant diurnal temperature differences, scarce precipitation, and high evaporation rates—serves as a natural ecological zone for screening cotton under drought stress [20]. For this study, 150 representative Gossypium hirsutum L. core germplasm accessions—diverse in geographic origin, growth period, and genetic background—were selected as test materials, providing a wide range of variation in drought resistance performance.
Figure 1.
Geographic location of the experimental sites and the workflow for UAV multispectral data acquisition and vegetation index extraction. (A) The study area in Xinjiang, China. The blue and red stars denote the experimental sites in Huyanghe City and Manas County, respectively. The true-color orthomosaics show the canopy growth of the CK and DR plots at the flowering and boll-forming stage (before and after stress) and the boll-opening stage. (B) The workflow of UAV data acquisition, image processing, and vegetation index extraction. Multispectral imagery was captured by a DJI Phantom 4 UAV (DJI, Shenzhen, China), processed in Pix4Dmapper, and extracted using ArcGIS, ultimately yielding a spectral feature dataset containing 24 vegetation indices derived from five spectral bands.
2.2. Experimental Design and Drought Stress Treatment
All germplasm resources were planted using a randomized complete block design. The field layout followed a “one-film, three-row” configuration, with single-row planting and a row length of 2 m. The experiment consisted of two treatments: a well-watered control (CK) and a drought stress treatment (DR), each with two replicates. All plots were managed using plastic-mulched drip irrigation. In the CK plots, conventional irrigation was applied throughout the entire growth period. In the DR plots, the same irrigation regime as that of the CK was applied until the flowering and boll-setting stage, after which irrigation was withheld for four irrigation cycles (approximately 28 days). Following the stress period, the DR plots resumed an irrigation schedule of once every 7 days. Except for the irrigation treatments, all other field management practices were identical for both the CK and DR groups. Net photosynthetic rate (A) was measured during the drought stress treatment at the flowering and boll-setting stage, while the number of effective fruiting branches per plant (EFBN), the number of effective bolls per plant (EBN), and the lint yield per plant (Lint) were assessed during the boll-opening stage.
2.3. Ground-Based Phenotypic Data Collection and Drought Resistance Evaluation
2.3.1. Measurement of Physiological and Yield Traits
Following the drought stress treatment during the flowering and boll-setting stage, measurements were taken on sunny mornings (10:00–12:00). A photosynthesis system (CIRAS-3, PP Systems, Amesbury, MA, USA) was used to measure the net photosynthetic rate (A) of the fourth fully expanded leaf from the top of the main stem on representative plants within each plot. Sampling and yield component analysis were conducted during the cotton boll-opening stage. Key yield-forming factors were surveyed and recorded, including the number of effective fruiting branches per plant, the number of effective bolls per plant, and lint yield per plant (Lint, g/plant). The survey methods followed the Descriptors and Data Standard for Cotton Germplasm Resources [21].
2.3.2. Comprehensive Drought Resistance Coefficient and Cluster Analysis
The drought resistance coefficient (DC) and comprehensive drought resistance coefficient (CDC) are indices used to assess drought impact based on the degree of reduction in specific traits under the drought stress imposed in this study, in which irrigation was withheld from plants in the flowering and boll-setting stage for four consecutive irrigation events (approximately 28 days; see Section 2.3.1); these indices serve to identify drought-tolerant genotypes. Descriptive statistical analysis of phenotypic data was performed using SPSS 25.0 software [22], while calculations for DC and CDC were carried out using Excel 2010 [23]. In the formulas, Xd represents the measured value of a specific trait under drought stress, and Xw represents the measured value of the same trait under normal control conditions. Based on these comprehensive evaluation values, hierarchical clustering was performed in the R environment using Euclidean distance, and a circular cluster dendrogram was generated [24].
DC = Xd/Xw
2.4. UAV Multispectral Data Acquisition and Image Pre-Processing
2.4.1. UAV Flight Platform
Drought stress treatments were implemented during the flowering and boll-forming stage of cotton. UAV multispectral data were collected 7, 10, 15, and 25 days after the onset of stress (designated as T1, T2, T3, and T4, respectively). A DJI Phantom 4 Multispectral (P4M) UAV equipped with a five-channel multispectral camera was used to capture high-resolution canopy imagery (Figure 1B). The P4M system comprises one visible light (RGB) sensor and five single-band multispectral sensors with center wavelengths of: Blue (450 ± 16 nm), Green (560 ± 16 nm), Red (650 ± 16 nm), Red-Edge (730 ± 16 nm), and Near-Infrared (NIR, 840 ± 26 nm). Flight missions were planned using DJI GS PRO software (v2.0.17). The flight altitude was set to approximately 30 m above the canopy to ensure ultra-high ground sampling distance (GSD). Both forward and side overlap rates were set to 80%. All flights were conducted around midday under cloud-free or partly cloudy conditions to minimize shadow errors caused by the solar elevation angle. Radiometric calibration was performed prior to flight using a standardized gray reflectance panel (Figure 1B).
2.4.2. Image Mosaicking and Region of Interest (ROI) Extraction
Raw multispectral images acquired during the flights were imported into Pix4Dmapper software Version 4.5.6 [25]. Based on photogrammetry and Structure-from-Motion (SfM) algorithms, the software automatically performed internal feature point matching, camera distortion correction, and radiometric calibration, ultimately generating a seamless, high-resolution orthomosaic with precise geographic coordinates. The orthomosaic was then imported into ArcGIS Pro 10.8 software [26]. Based on the actual field planting layout, polygon vector files (Figure 1B) were created—either manually drawn or semi-automatically generated—to precisely cover each experimental plot. Subsequently, the Zonal Statistics tool in ArcGIS was used to extract the average canopy reflectance within the shapefile mask of each plot, while filtering out soil background noise.
2.5. Calculation of Vegetation Indices (VIs)
Vegetation indices are mathematical combinations of multi-band surface reflectance designed to enhance specific physiological characteristics of vegetation while suppressing environmental background noise [27]. Based on the reflectance values extracted from the five spectral bands, this study calculated 24 vegetation indices widely used in the literature for assessing crop drought phenotypes [28,29,30]; the indices and their calculation formulas are presented in Table 1.
Table 1.
Calculation formulas for the 24 vegetation indices used in this study.
2.6. Construction of Machine Learning Prediction Models
2.6.1. Dataset Partitioning and Preprocessing
To eliminate genetic differences in the baseline phenotypes of various cotton germplasms and accurately quantify the plants’ true response to water deficit, this study utilized the drought resistance coefficient of each indicator as the input and prediction variable for machine learning. Specifically, the ratios of multispectral vegetation indices and measured effective boll numbers per plant under drought stress treatments relative to the normal control group were calculated (denoted as DCVIs and DCEBN, respectively). After cleaning the sample dataset—comprising the aforementioned ratio features—and removing extreme outliers, Z-score standardization was applied to transform all input features into a standard normal distribution with a mean of 0 and a variance of 1. Finally, the preprocessed dataset was randomly split into a training set (70%) and a test set (30%) to ensure the reliability of model construction and independent validation [31].
2.6.2. Model Construction, Optimization, and Validation Methods
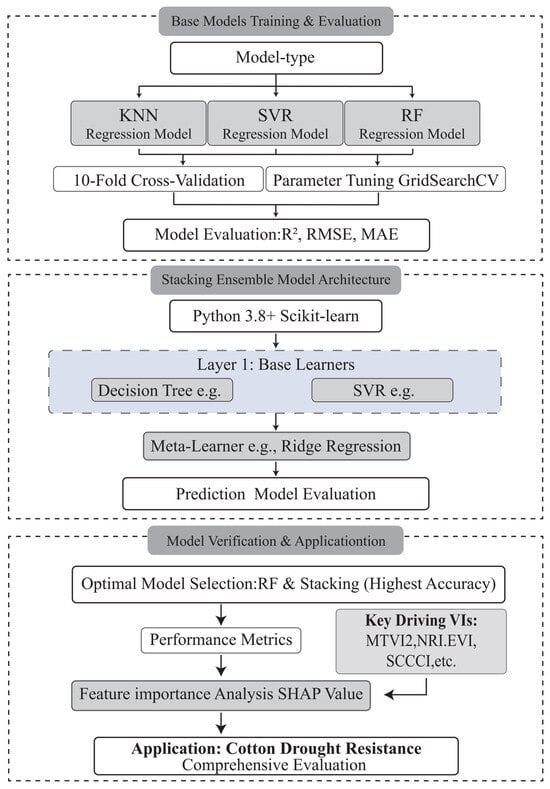
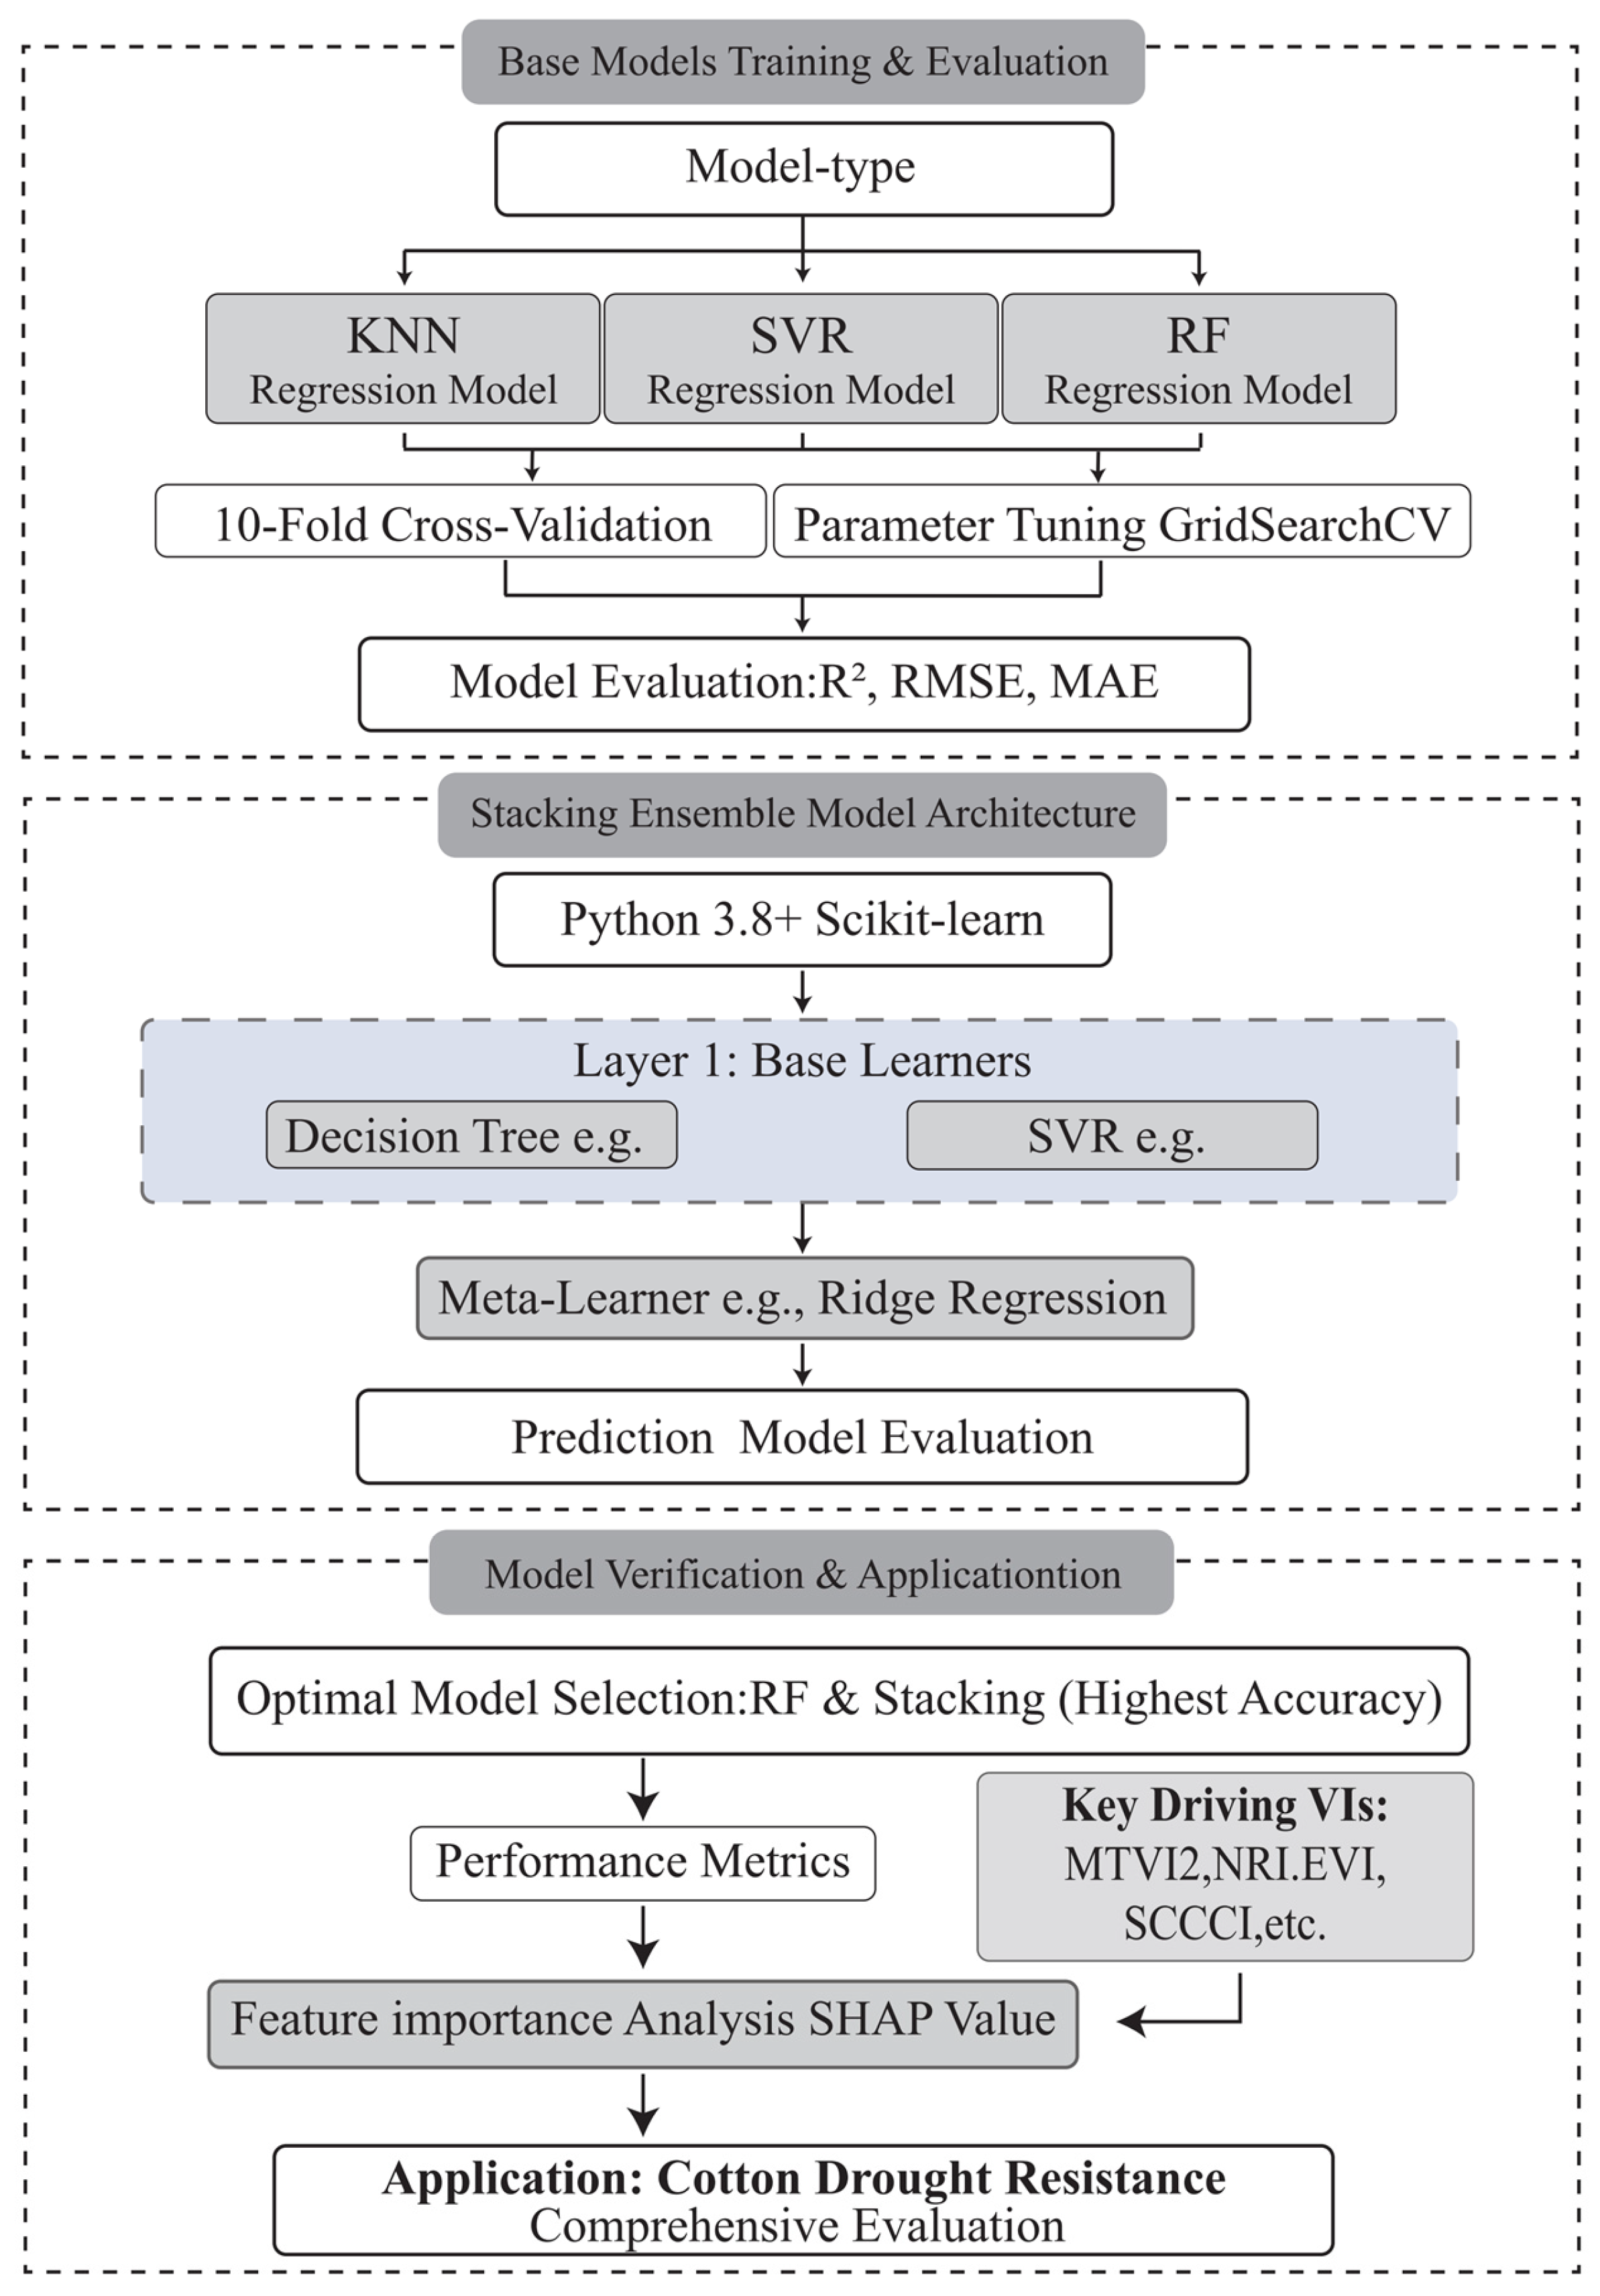
To achieve accurate prediction of DCEBN, this study constructed four regression models: KNN, SVR, RF, and Stacking Ensemble (Stacking). KNN and SVR leverage non-parametric mechanisms and the principle of structural risk minimization, respectively, to flexibly handle local non-linearity and high-dimensional data features. RF employs the Bagging strategy to effectively overcome the overfitting issues associated with single models and demonstrates strong adaptability to multicollinearity. Meanwhile, the two-layer Stacking architecture achieves deep fusion of multi-perspective features by using a meta-learner to perform secondary fitting on the outputs of base models. During model construction, a grid search combined with 10-fold cross-validation was employed for global hyperparameter optimization, ensuring the models could robustly capture the complex mapping relationship between growth parameters and EBN [32]. Finally, the coefficient of determination (R2), root mean square error (RMSE), and mean absolute error (MAE) were selected as the core evaluation metrics for the independent test set. These metrics comprehensively assess the model’s ability to explain data variation, its sensitivity to extreme errors, and its overall prediction bias, thereby validating the model’s accuracy and generalization performance. R2, RMSE, and MAE were calculated using Equations (3)–(5), where ymi and ypi represent the actual observed value and the model-predicted value for the i-th sample, respectively, and y denotes the arithmetic mean of the actual observed values (Figure 2).
Figure 2.
Workflow of the EBN prediction framework based on UAV multispectral data and machine learning. The framework includes three modules: (1) base model training and evaluation (KNN, SVR, and RF with 10-fold cross-validation and grid search, evaluated by R2, RMSE, and MAE); (2) the Stacking ensemble architecture (decision tree and SVR as base learners, Ridge Regression as the meta-learner); and (3) model verification and application (optimal model selection, SHAP-based feature importance analysis, and comprehensive drought resistance evaluation).
2.7. Statistical Analysis and Plotting
Standard one-way analysis of variance (ANOVA) and tests for significant differences (Student’s t-test; p < 0.05, p < 0.01, and p < 0.001 were considered significant) were performed using Origin [33] or R. Data visualization—including raincloud plots, heatmaps, and PCA scatter plots—was carried out to produce high-quality figures using OriginPro 2024, R packages 4.5.3 (such as ggplot2 and corrplot) [34], and Python 3.8 [35].
3. Results
3.1. Effects of Drought Stress on Agronomic and Physiological Traits of Upland Cotton
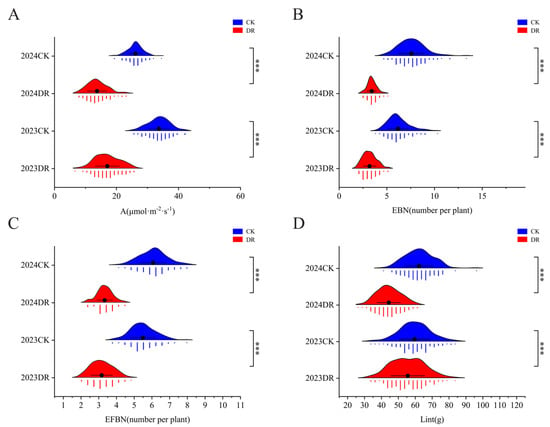
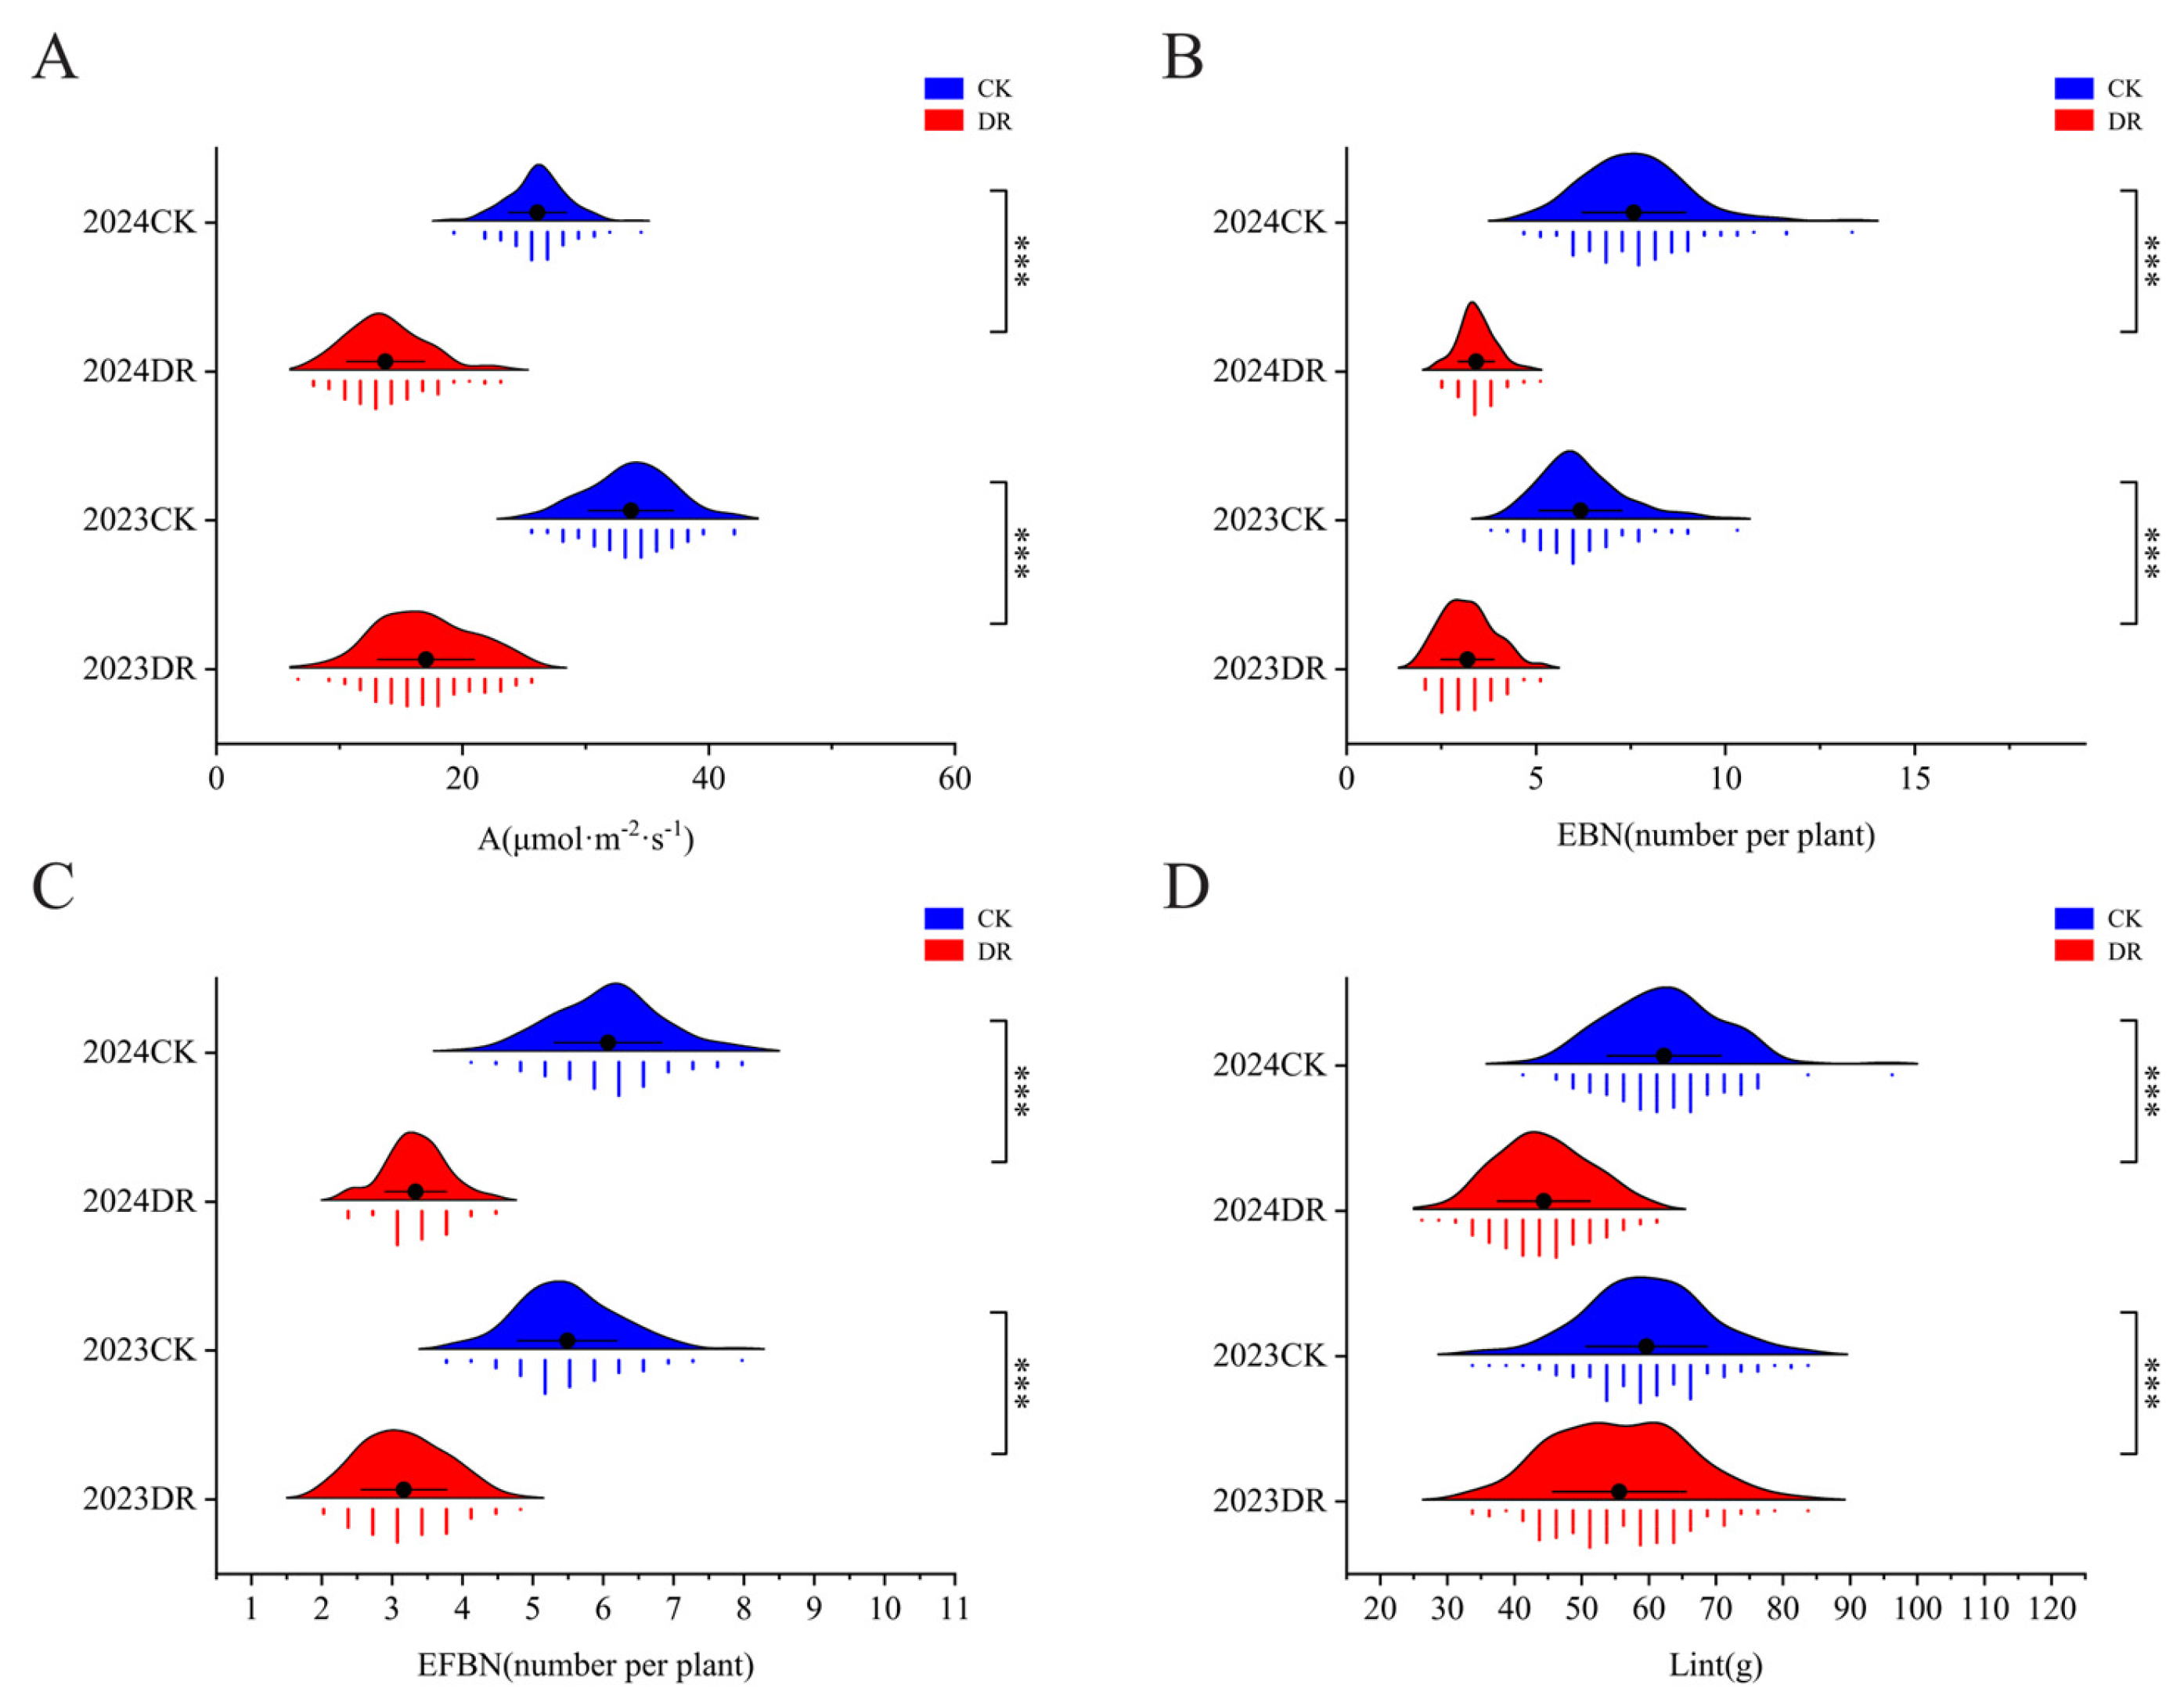
Across the two environments in 2023 and 2024, the results regarding key cotton phenotypic traits under normal water supply (CK) and drought stress (DR) treatments were highly consistent; drought stress caused a significant decline in all observed traits (p < 0.001). Specifically, under normal water conditions (CK), the net photosynthetic rate (Figure 3A) clustered in the 25–35 μmol·m−2·s−1 range, whereas the drought treatment (DR) shifted this distribution significantly to the left, into the 15–20 μmol·m−2·s−1 range, indicating that water deficit severely limited the photosynthetic carbon assimilation capacity of cotton leaves. This inhibitory effect was also evident in yield components and final yield (Figure 3B–D): compared to CK, the DR treatment resulted in markedly narrower distribution ranges and significantly lower mean values for the number of effective bolls per plant (Figure 3B) and the number of effective fruiting branches per plant (Figure 3C), reflecting impaired reproductive growth and canopy development; consequently, the peak of the distribution for lint yield per plant (Figure 3D) dropped from approximately 60 g in the CK group to around 45 g in the DR group. The significant differences in these phenotypic data confirm the effectiveness of the drought stress treatment in this study and provide ground-truth data with a sufficient gradient for the subsequent construction of remote sensing-based monitoring models.
Figure 3.
Statistical distribution of key physiological and yield traits of cotton under different water treatments in 2023 and 2024. (A) Net photosynthetic rate. (B) Number of effective bolls per plant. (C) Number of effective fruiting branches per plant. (D) Lint yield per plant. Asterisks above the bars indicate significant differences between treatments (Student’s t-test; *** p ≤ 0.001).
3.2. Evaluation of Drought Resistance and Population Classification of Upland Cotton Germplasm
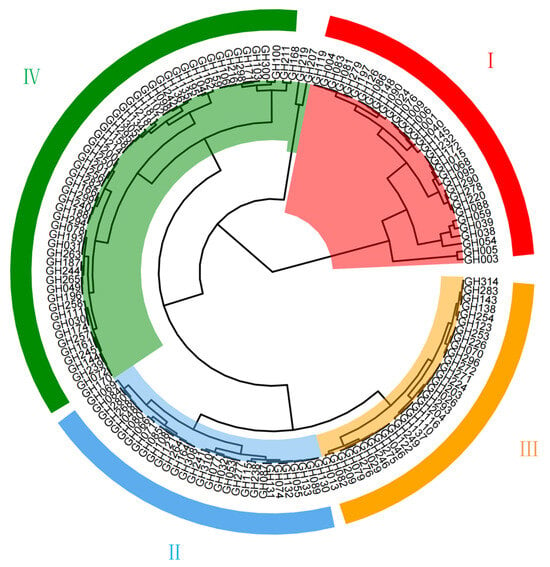
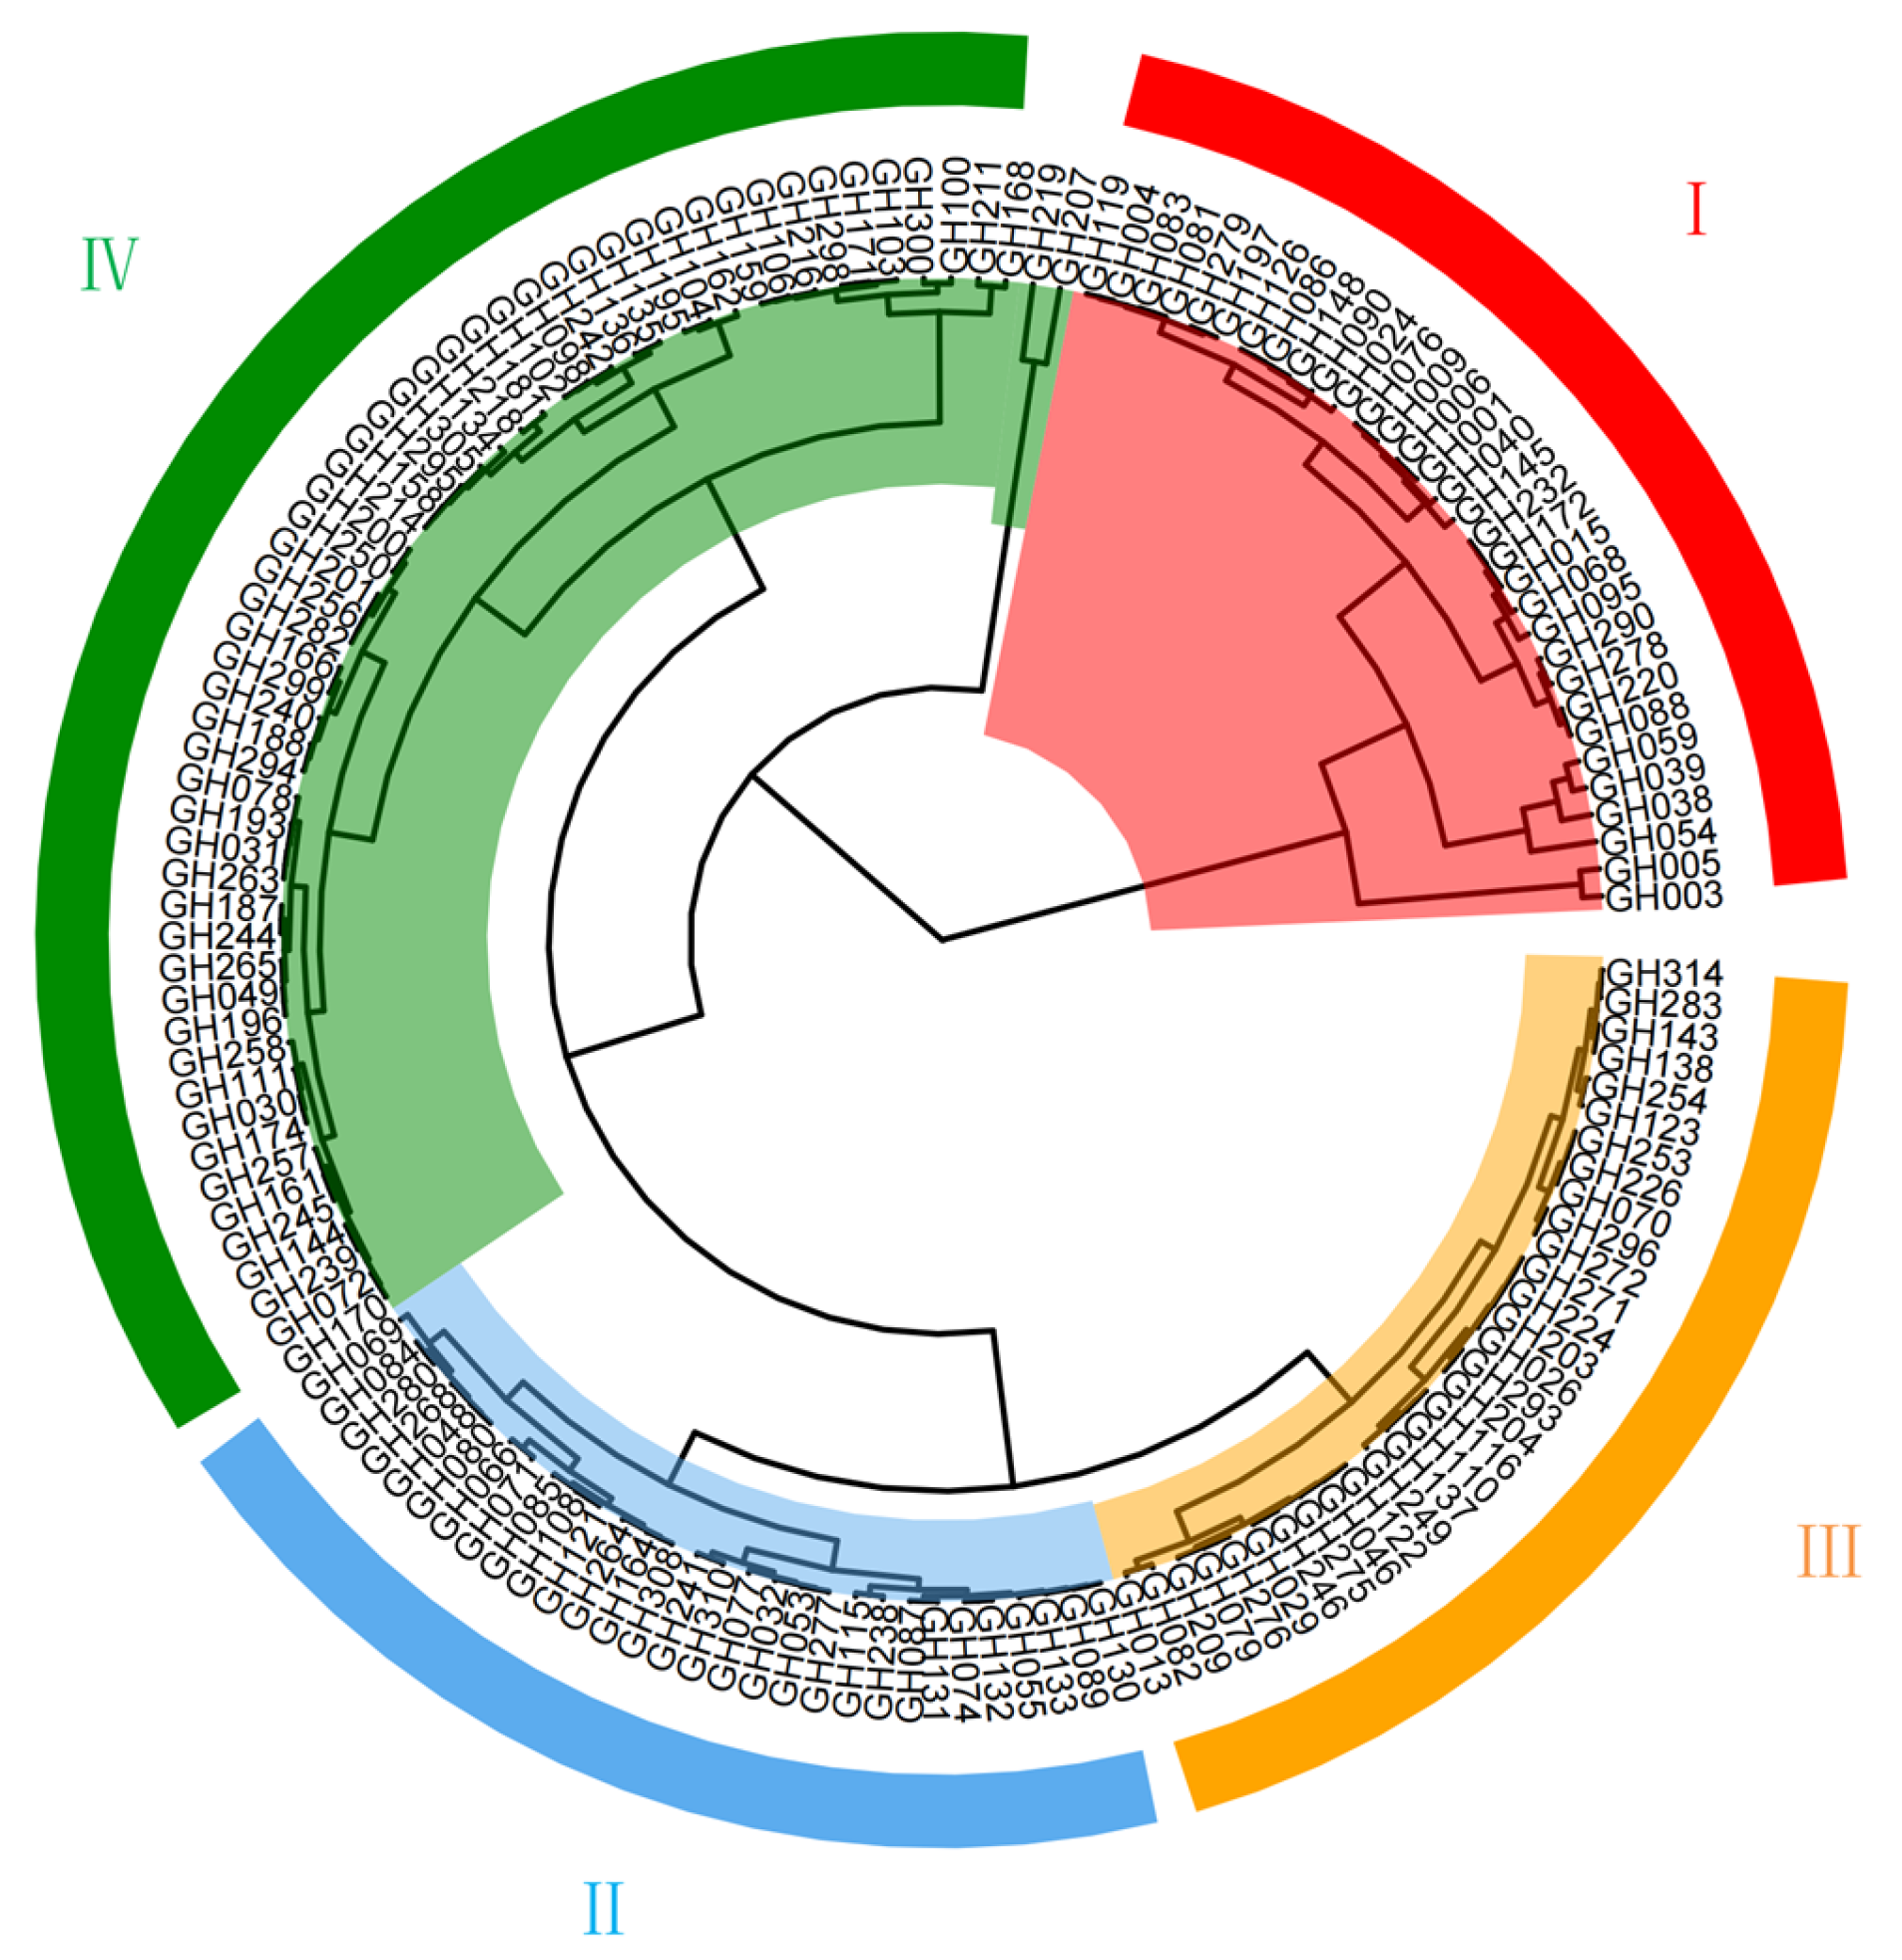
This study employed hierarchical clustering based on CDC to construct a classification map of drought resistance for 150 cotton germplasm accessions (Figure 4). In Figure 4, the dendrogram was cut at a Euclidean distance threshold that yielded four stable groups, and the sectors are colored according to the mean CDC of each group, with accessions ordered by their CDC values within each sector. The results revealed that the tested population was clearly divided into four main groups: Group I (red sector), comprising 32 accessions (including GH003 and GH038), exhibited the highest CDC values and superior overall drought tolerance, and was thus classified as highly resistant (HR). In contrast, Group IV (green sector), comprising 57 accessions, showed the most severe drought-induced inhibition and the poorest overall performance, and was classified as highly susceptible (HS). Groups II (blue sector) and III (yellow sector), containing 30 and 31 accessions respectively, represented intermediate types falling between these extremes. The four groups differed significantly in CDC (ANOVA, p < 0.001), with mean CDC decreasing from Group I to Group IV; the HR group accounted for only about 21% of the accessions, whereas the HS group accounted for about 38%, indicating that drought-susceptible materials predominated in this core collection. The intermediate groups (II and III) together comprised 61 accessions and showed overlapping CDC ranges, suggesting continuous rather than discrete variation in drought tolerance within the population. These clustering results quantitatively demonstrate the extensive phenotypic variation within the core germplasm population; by identifying accessions with contrasting responses (HR vs. HS), the study provides a scientific basis for selecting materials to validate the reliability of UAV-based spectral prediction models.
Figure 4.
Hierarchical clustering analysis of 150 cotton germplasm accessions based on CDC. Group I (red sector) represents HR accessions; Group II (blue sector) and Group III (yellow sector) represent intermediate types; Group IV (green sector) represents HS accessions.
3.3. Temporal Variations in Cotton Canopy Spectral Characteristics Under Drought Stress
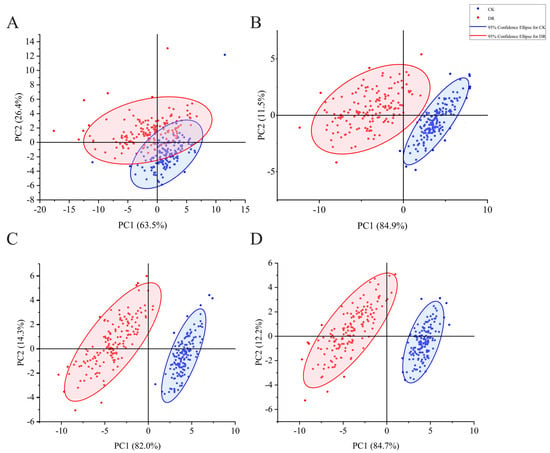
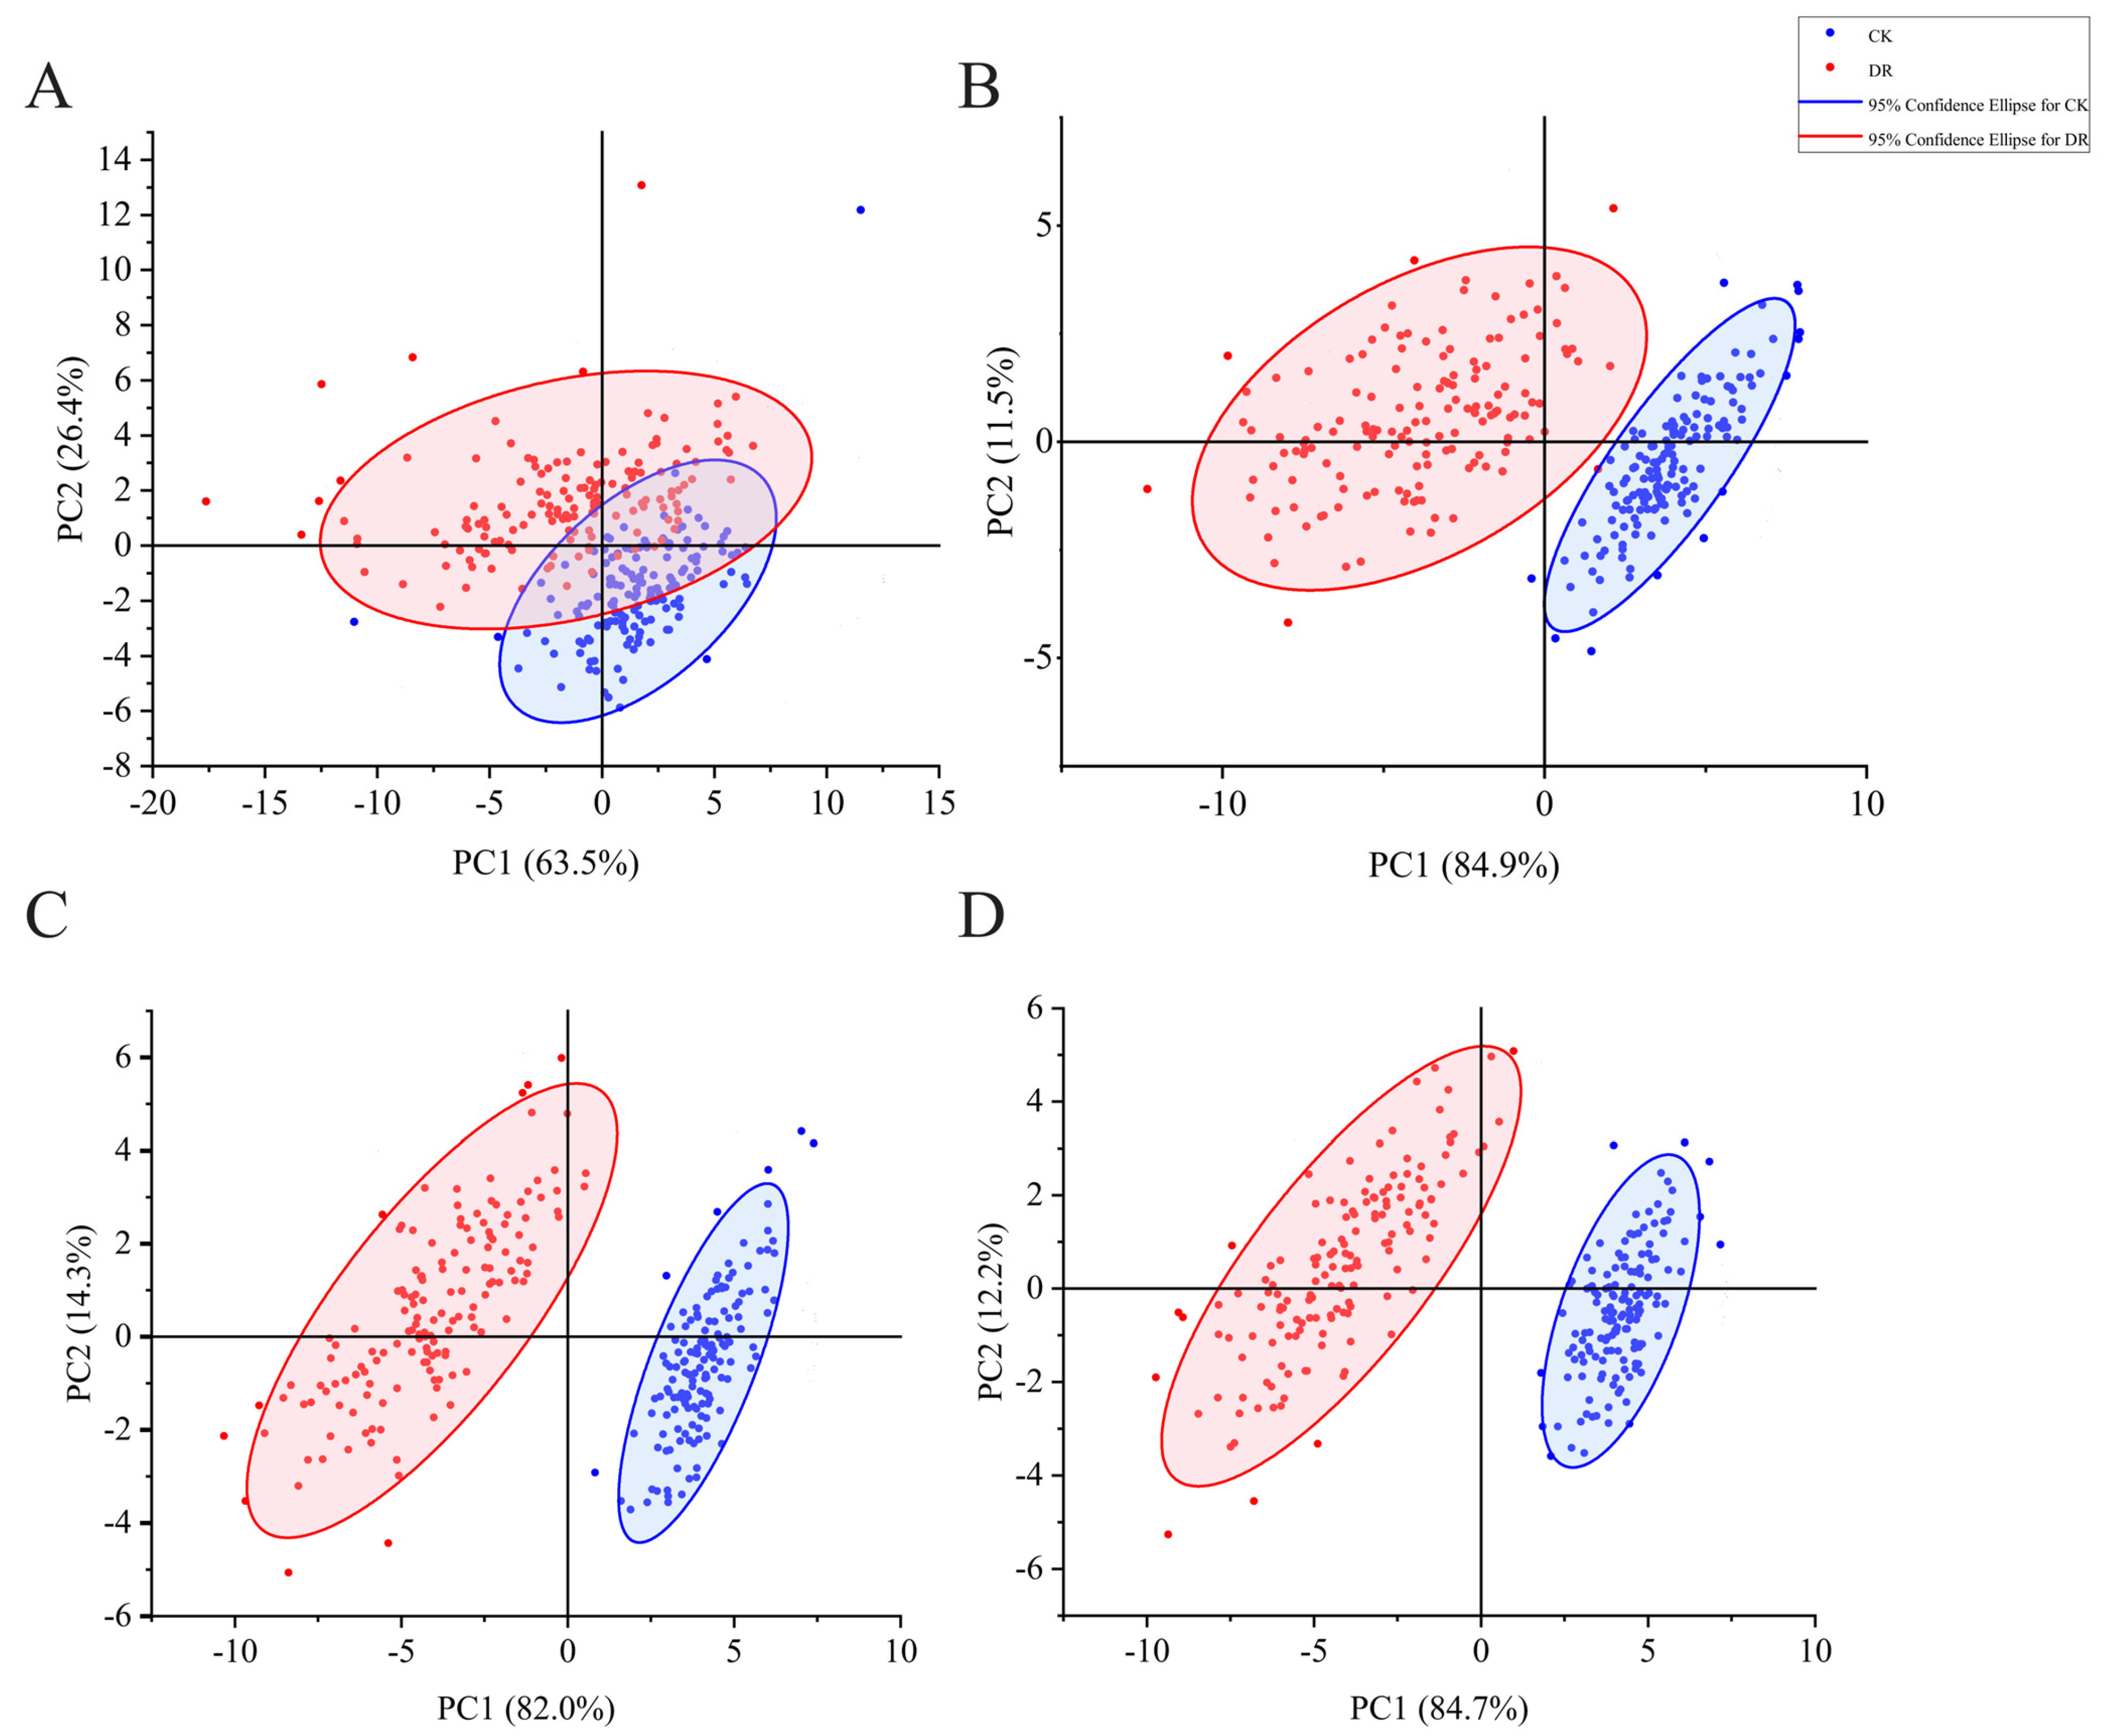
To investigate the dynamic evolution of cotton canopy multispectral characteristics as drought stress persisted, this study conducted Principal Component Analysis (PCA) on vegetation indices across four key stages (T1–T4). As shown in Figure 5, the distributions of the CK and DR treatments in the PCA space exhibited a clear trajectory of temporal separation as the duration of stress increased. In the early experimental stage (T1, Figure 5A), the 95% confidence ellipses of the CK and DR groups showed significant overlap, with the first principal component (PC1) explaining 63.5% of the data variance; this indicates that inter-group differences in spectral characteristics were not yet pronounced. As the drought intensified (T2, Figure 5B), the distribution centroids of the two datasets shifted significantly along the PC1 axis, and the variance contribution rate of PC1 rose to 84.9%, demonstrating that water treatment had become the dominant factor driving spectral variation. By the mid-to-late growth stages (T3–T4, Figure 5C,D), the cumulative effects of drought resulted in complete separation of the two sample groups in the two-dimensional space: the CK group clustered consistently on the positive side of the PC1 axis, while the DR group concentrated on the negative side, with PC1 maintaining an explanatory power of over 82.0%. These results indicate that UAV-based multispectral vegetation indices can sensitively capture the physiological and morphological changes in cotton subjected to drought and effectively distinguish canopy characteristics under different water regimes.
Figure 5.
Temporal PCA of cotton multispectral vegetation indices under different water treatments (T1−T4). (A) T1, 7 days after stress onset. (B) T2, 10 days after stress onset. (C) T3, 15 days after stress onset. (D) T4, 25 days after stress onset. CK: control; DR: drought treatment. The 95% confidence ellipses are shown for each group.
3.4. Correlation Analysis Between Vegetation Indices and Cotton Yield and Physiological Traits
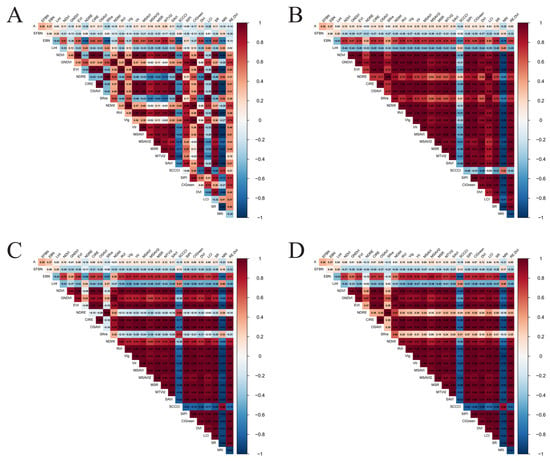
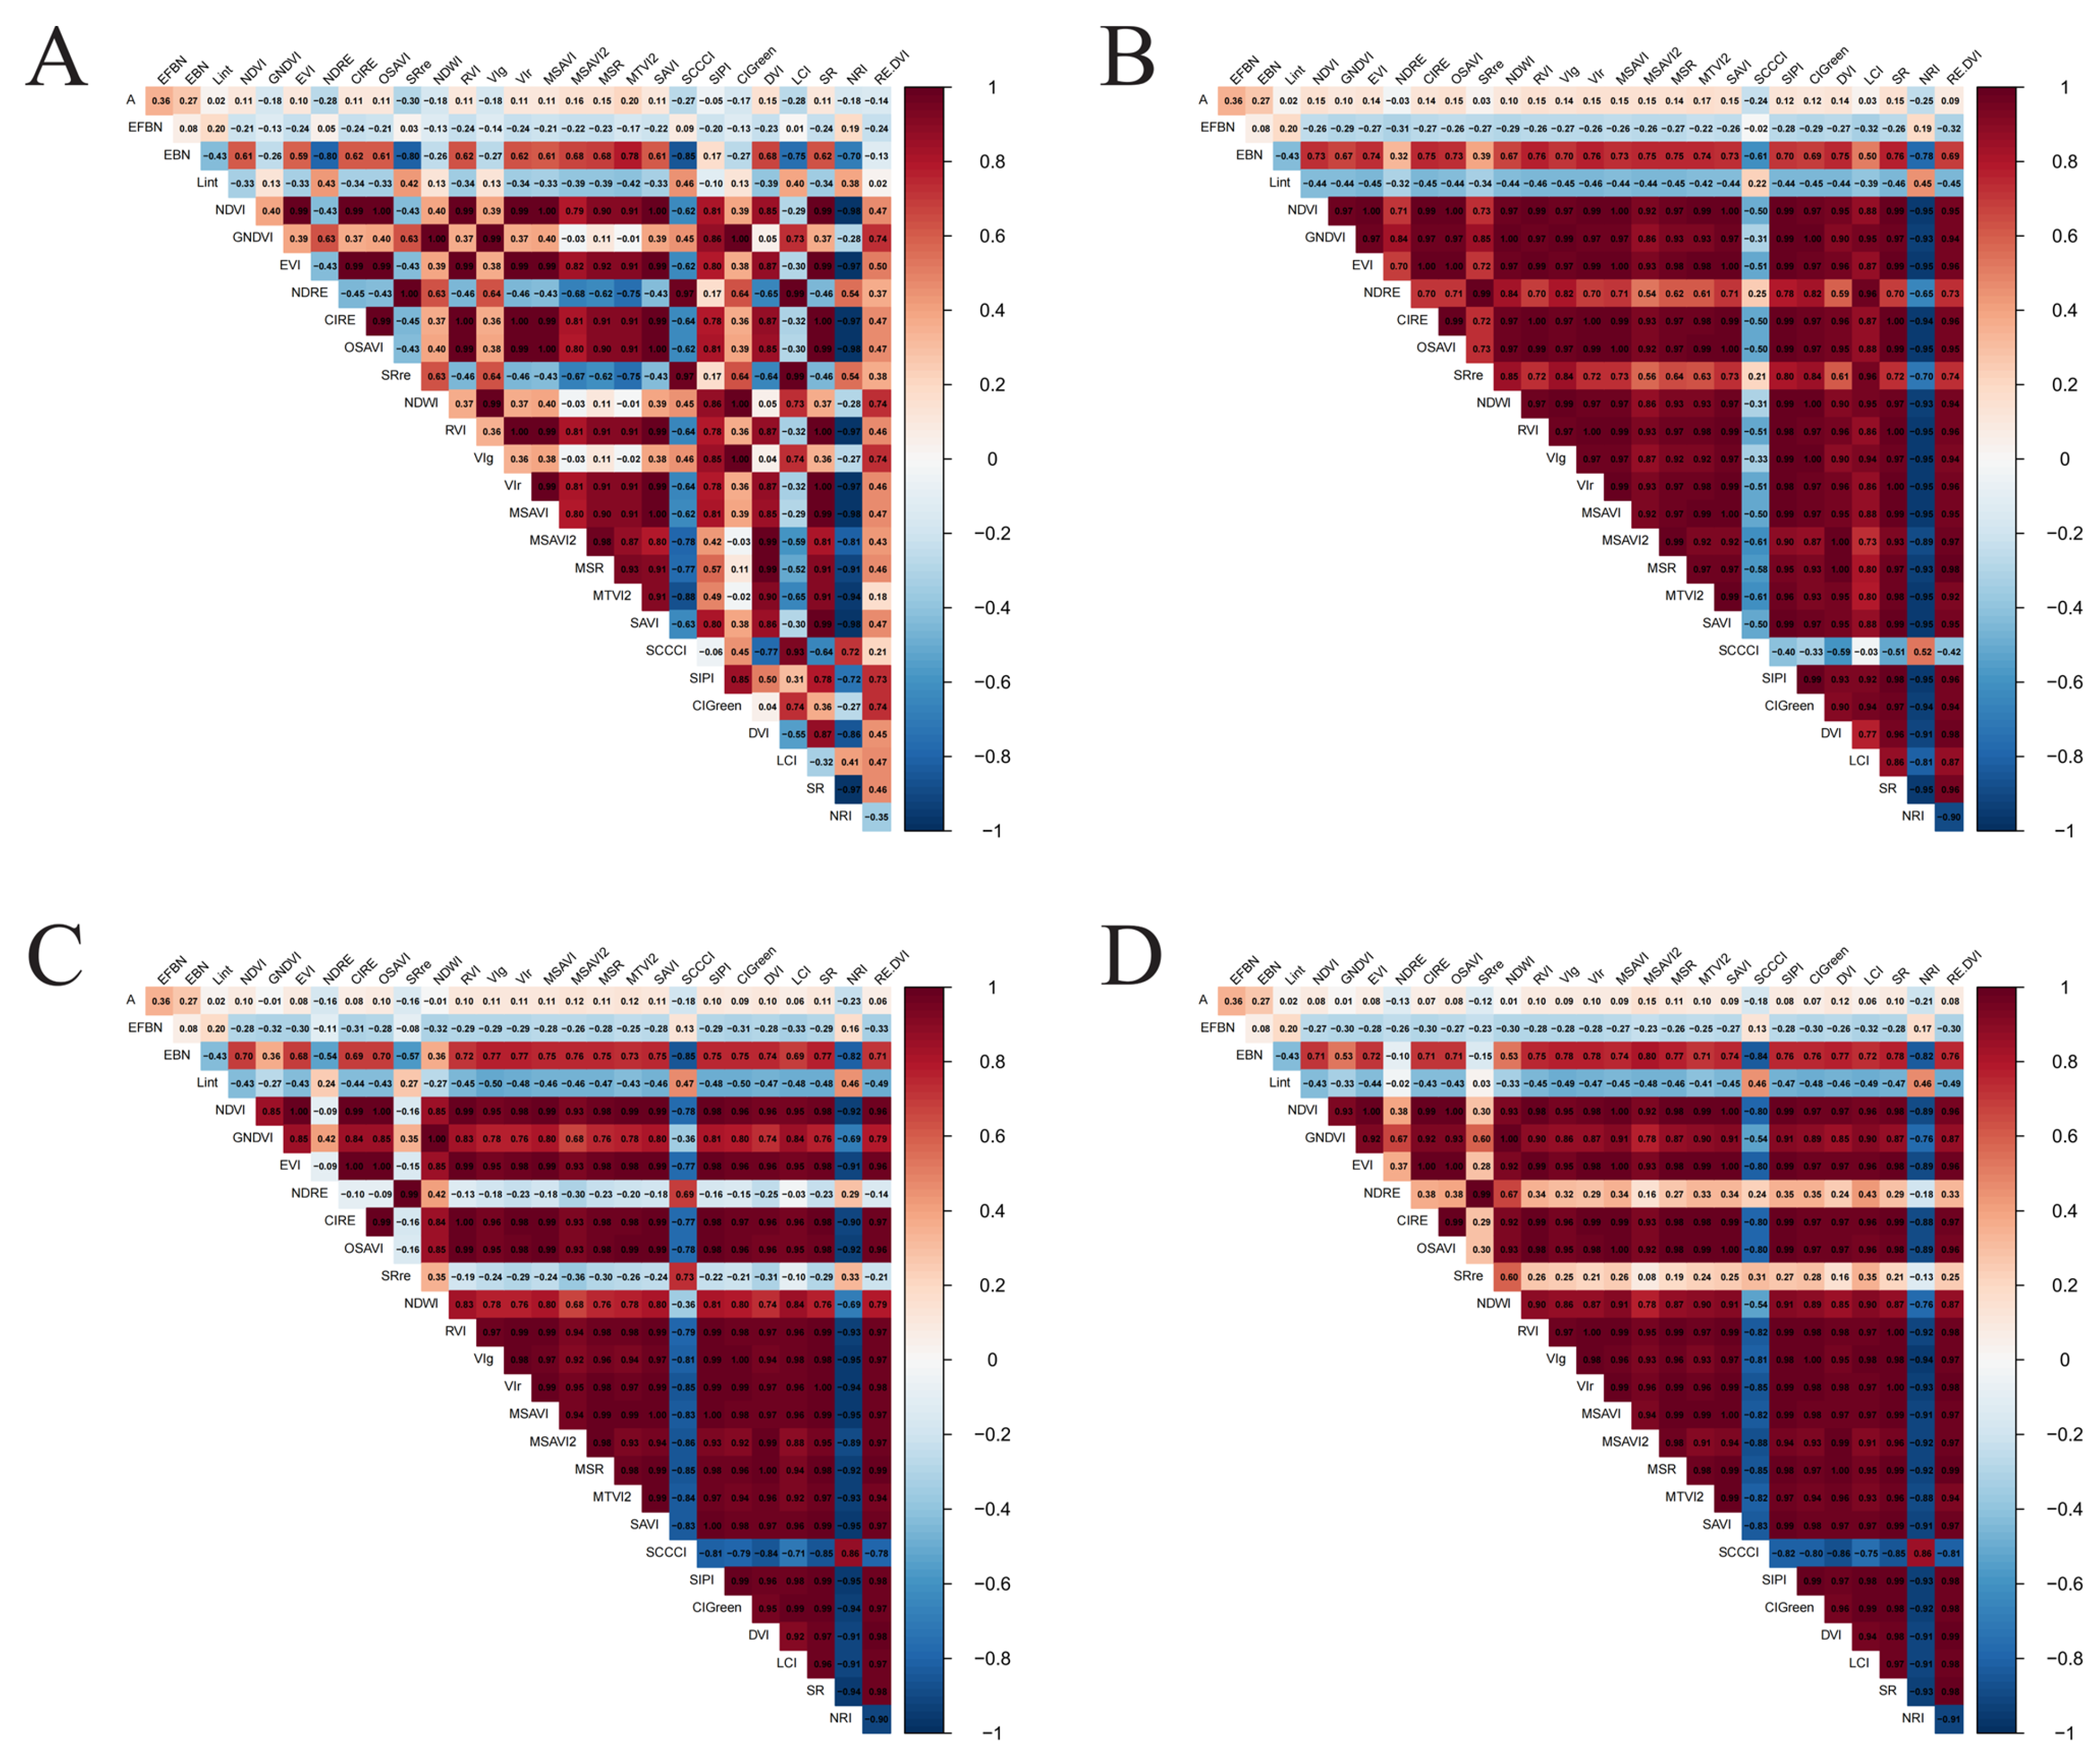
Establishing the link between spectral response patterns and yield variation under drought stress is a prerequisite for predicting drought resistance. To eliminate the influence of genetic background differences in baseline phenotypes and accurately reflect plant responses to water deficit, this section employs drought resistance coefficients (DC values—defined as the ratio of measurements under drought stress to those under normal control conditions) for correlation analysis. Figure 6A–D presents heatmaps of Pearson correlation coefficients between the relative changes in multispectral vegetation indices and the drought resistance coefficients of ground-measured agronomic and physiological traits (DCA, DCEFBN, DCEBN, DCLint).
Figure 6.
Heatmaps of Pearson correlations between drought resistance coefficients of cotton agronomic traits and multispectral vegetation indices at different growth stages. (A–D) Correlation matrices at stages T1–T4, respectively. DCA, DCEFBN, DCEBN, and DCLint represent the drought resistance coefficients of net photosynthetic rate, effective fruiting branch number, effective boll number, and lint yield per plant, respectively. DCVIs represent the drought resistance coefficients of vegetation indices.
The results reveal two key findings: First, there is high multicollinearity among the vegetation indices; for instance, the correlation coefficients (r) between DCNDVI and DCEVI and between DCMTVI2 and DCOSAVI generally exceed 0.8. Such high data redundancy limits the applicability of traditional multiple linear regression, indicating that subsequent modeling must utilize machine learning algorithms capable of handling multicollinearity. Second, the drought resistance levels of core yield indicators—such as the number of effective bolls per plant and lint yield—show significant correlations with the relative changes in various spectral features. The figures demonstrate that the drought resistance coefficient for DCEBN is strongly positively correlated with indices reflecting biomass maintenance capacity (e.g., DCGNDVI and DCEVI) while also showing negative correlations with certain other indices. These findings confirm that dynamic changes in cotton canopy spectral features effectively characterize crop biomass accumulation and stress resistance status under drought conditions, thereby providing a reliable data foundation for subsequent drought resistance prediction modeling.
3.5. Construction and Comparison of Machine Learning-Based Prediction Models for Effective Bolls per Plant
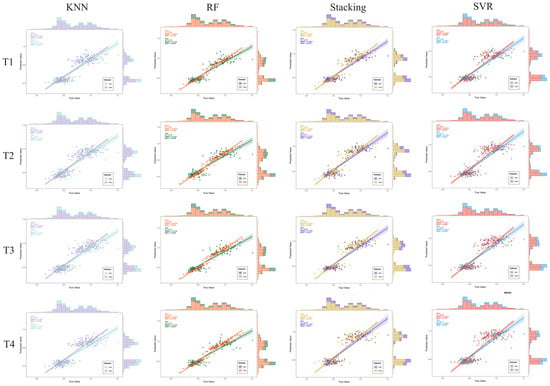
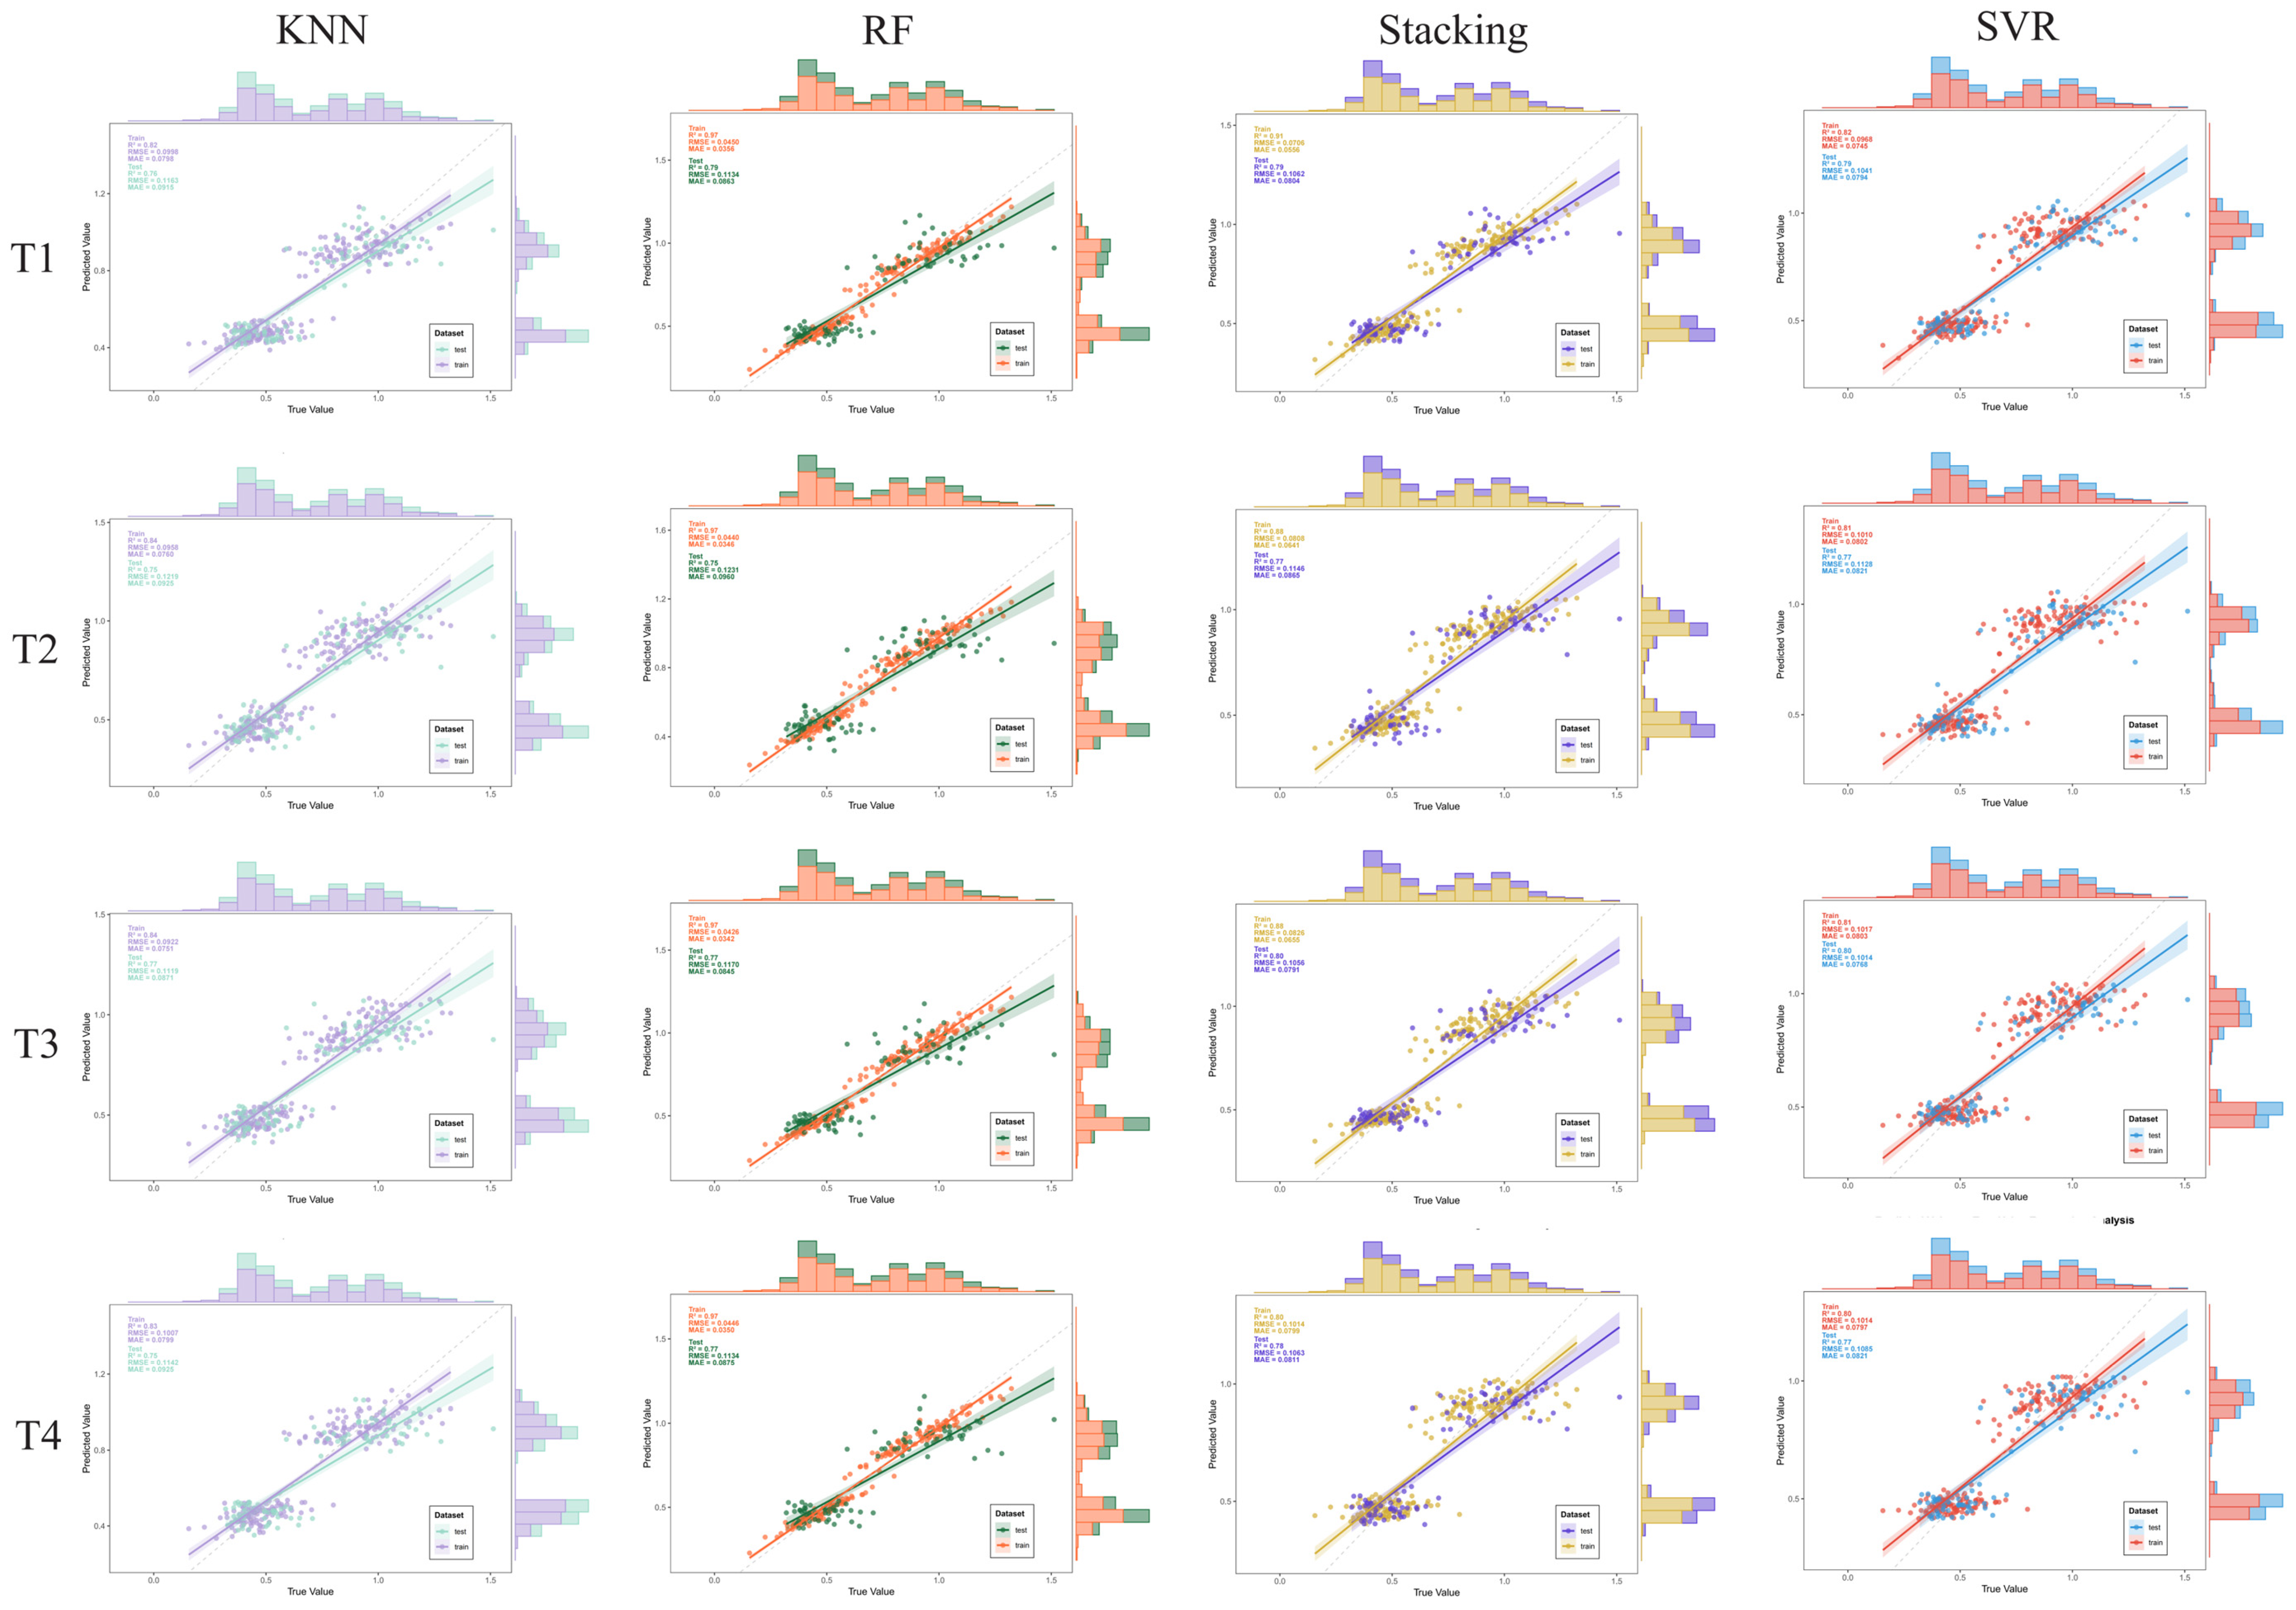
Prediction models for the DCEBN were constructed using four machine learning models (KNN, RF, Stacking, and SVR), with the drought resistance coefficients of vegetation indices from four growth stages (T1–T4) serving as input features (Figure 7). Significant performance differences were observed among the models based on scatter distributions and fitted regression lines. Ensemble tree models (RF and Stacking) demonstrated the highest prediction accuracy; the scatter points representing predicted versus actual values converged tightly around the ideal 1:1 diagonal line, and the fitted regression lines (solid lines) for the training and testing sets nearly overlapped, with slopes closest to 1. In contrast, the KNN and SVR models exhibited greater dispersion. The KNN model, in particular, showed a fitted line slope that deviated significantly from the diagonal, displaying a systematic underestimation in the high-DCEBN range (i.e., the range indicating stronger drought resistance).
Figure 7.
Scatter plots and marginal distribution characteristics of four machine learning models predicting the DCEBN based on vegetation indices across different periods. The columns represent the four regression models (KNN, RF, Stacking, SVR), and the rows represent the four periods (T1–T4). In each subplot, the x-axis represents the actual measured DCEBN value (True Value), and the y-axis represents the model-predicted value (Predicted Value). Colors distinguish data points from the training set (Train) and the test set (Test). The dashed line represents the ideal 1:1 prediction baseline (y = x), while the solid lines and semi-transparent shaded bands represent the linear regression fit lines and their respective confidence intervals. The histograms at the top and right of each subplot display the marginal frequency distributions of the actual and predicted values, respectively.
Regarding the temporal dimension, all four models maintained consistent fitting characteristics across stages T1 through T4 without significant performance degradation over time, indicating that drought resistance prediction models based on the relative changes in vegetation indices possess robust temporal stability. Furthermore, the marginal histograms indicate that the frequency distributions of the test set predictions from the RF and Stacking models closely replicated the data structure of the actual DCEBN values, further validating the superiority of these two ensemble models in avoiding overfitting and generalizing to unseen samples.
3.6. Model Interpretability and Feature Importance Analysis Based on the SHAP Method
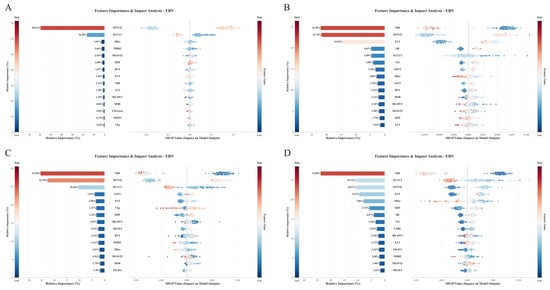
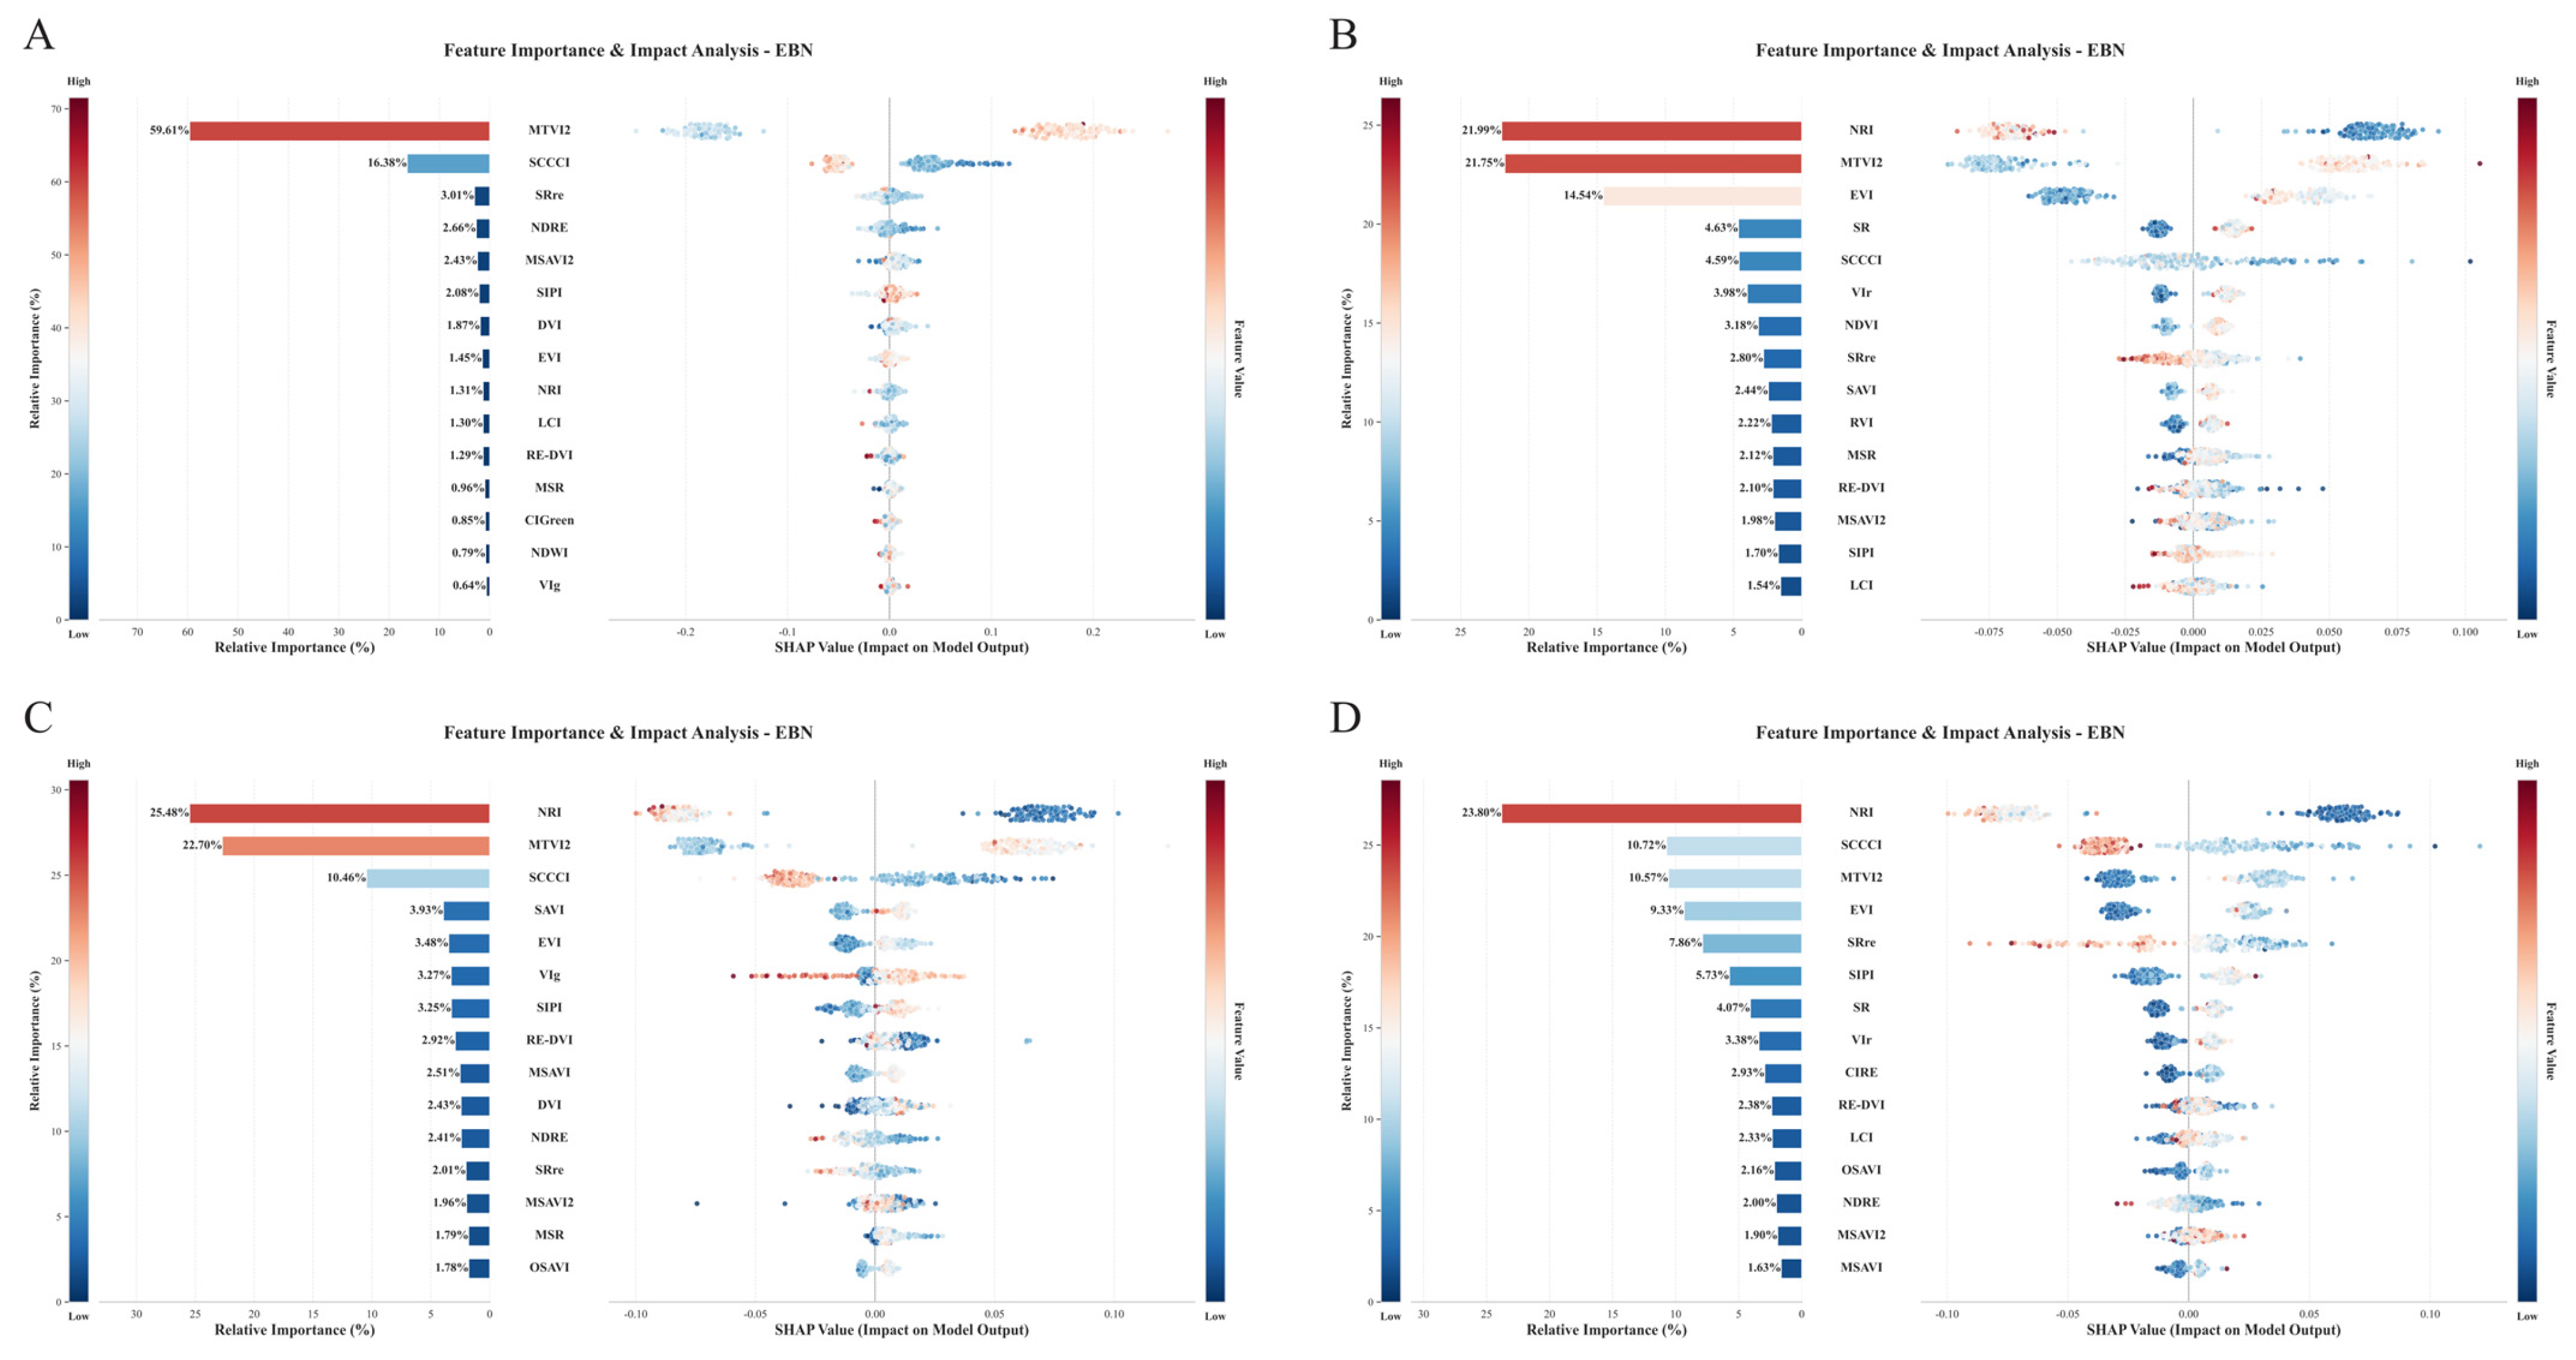
To evaluate the interpretability of the prediction model and explore the core drivers determining the DCEBN, this study employed the SHAP method (Figure 8A–D). The bar charts on the left illustrate the global relative importance of each input feature. The results indicate that a few key vegetation indices dominated the model’s decision-making process. Across the four distinct periods, features such as NRI, SCCCI, MTVI2, and EVI consistently ranked highest in importance. Specifically, in Figure 8A, the MTVI2 feature alone accounted for 44.45% of the relative contribution; however, in Figure 8B–D, NRI superseded MTVI2 as the most important predictor, reaching a peak weight of 19.37% (Figure 8D).
Figure 8.
Feature importance and impact analysis for the DCEBN prediction model based on the SHAP method. (A) SHAP analysis at stage T1. (B) SHAP analysis at stage T2. (C) SHAP analysis at stage T3. (D) SHAP analysis at stage T4. In each panel, the bar chart on the left indicates the global relative importance (%) of each vegetation index, and the beeswarm plot on the right illustrates the impact of each feature on the model output; individual points represent single samples, with red and blue colors indicating high and low raw feature values, respectively. SHAP values greater than 0 on the horizontal axis indicate a positive (increasing) effect on the prediction target, while values less than 0 indicate a negative (decreasing) effect.
The SHAP beeswarm plots on the right further reveal the specific direction of influence these core features exert on the model output. Colors represent the magnitude of the raw feature ratios (red for high, blue for low), while the horizontal axis represents SHAP values (values > 0 indicate a positive contribution to the predicted DCEBN, whereas values < 0 indicate a negative contribution). As shown in Figure 8A, samples with high MTVI2 and SCCCI ratios (red dots) are clearly concentrated on the positive side of the SHAP axis, while samples with low ratios (blue dots) cluster on the negative side. This indicates that under drought stress, greater canopy biomass and chlorophyll retention capacity exert a significant positive driving effect on the prediction of effective boll retention per plant. Conversely, Figure 8B–D clearly reveal a negative feedback pattern for specific indices (such as NRI): the vast majority of samples with abnormally high ratios are distributed on the negative side of the SHAP axis, demonstrating a significant negative correlation. The SHAP analysis results not only quantify the varying contributions of spectral feature ratios across different periods but also align closely with the patterns of cotton canopy senescence and biomass translocation under drought conditions.
3.7. Verification of Spectral and Agronomic Trait Differences Between Drought-Resistant and Drought-Sensitive Materials
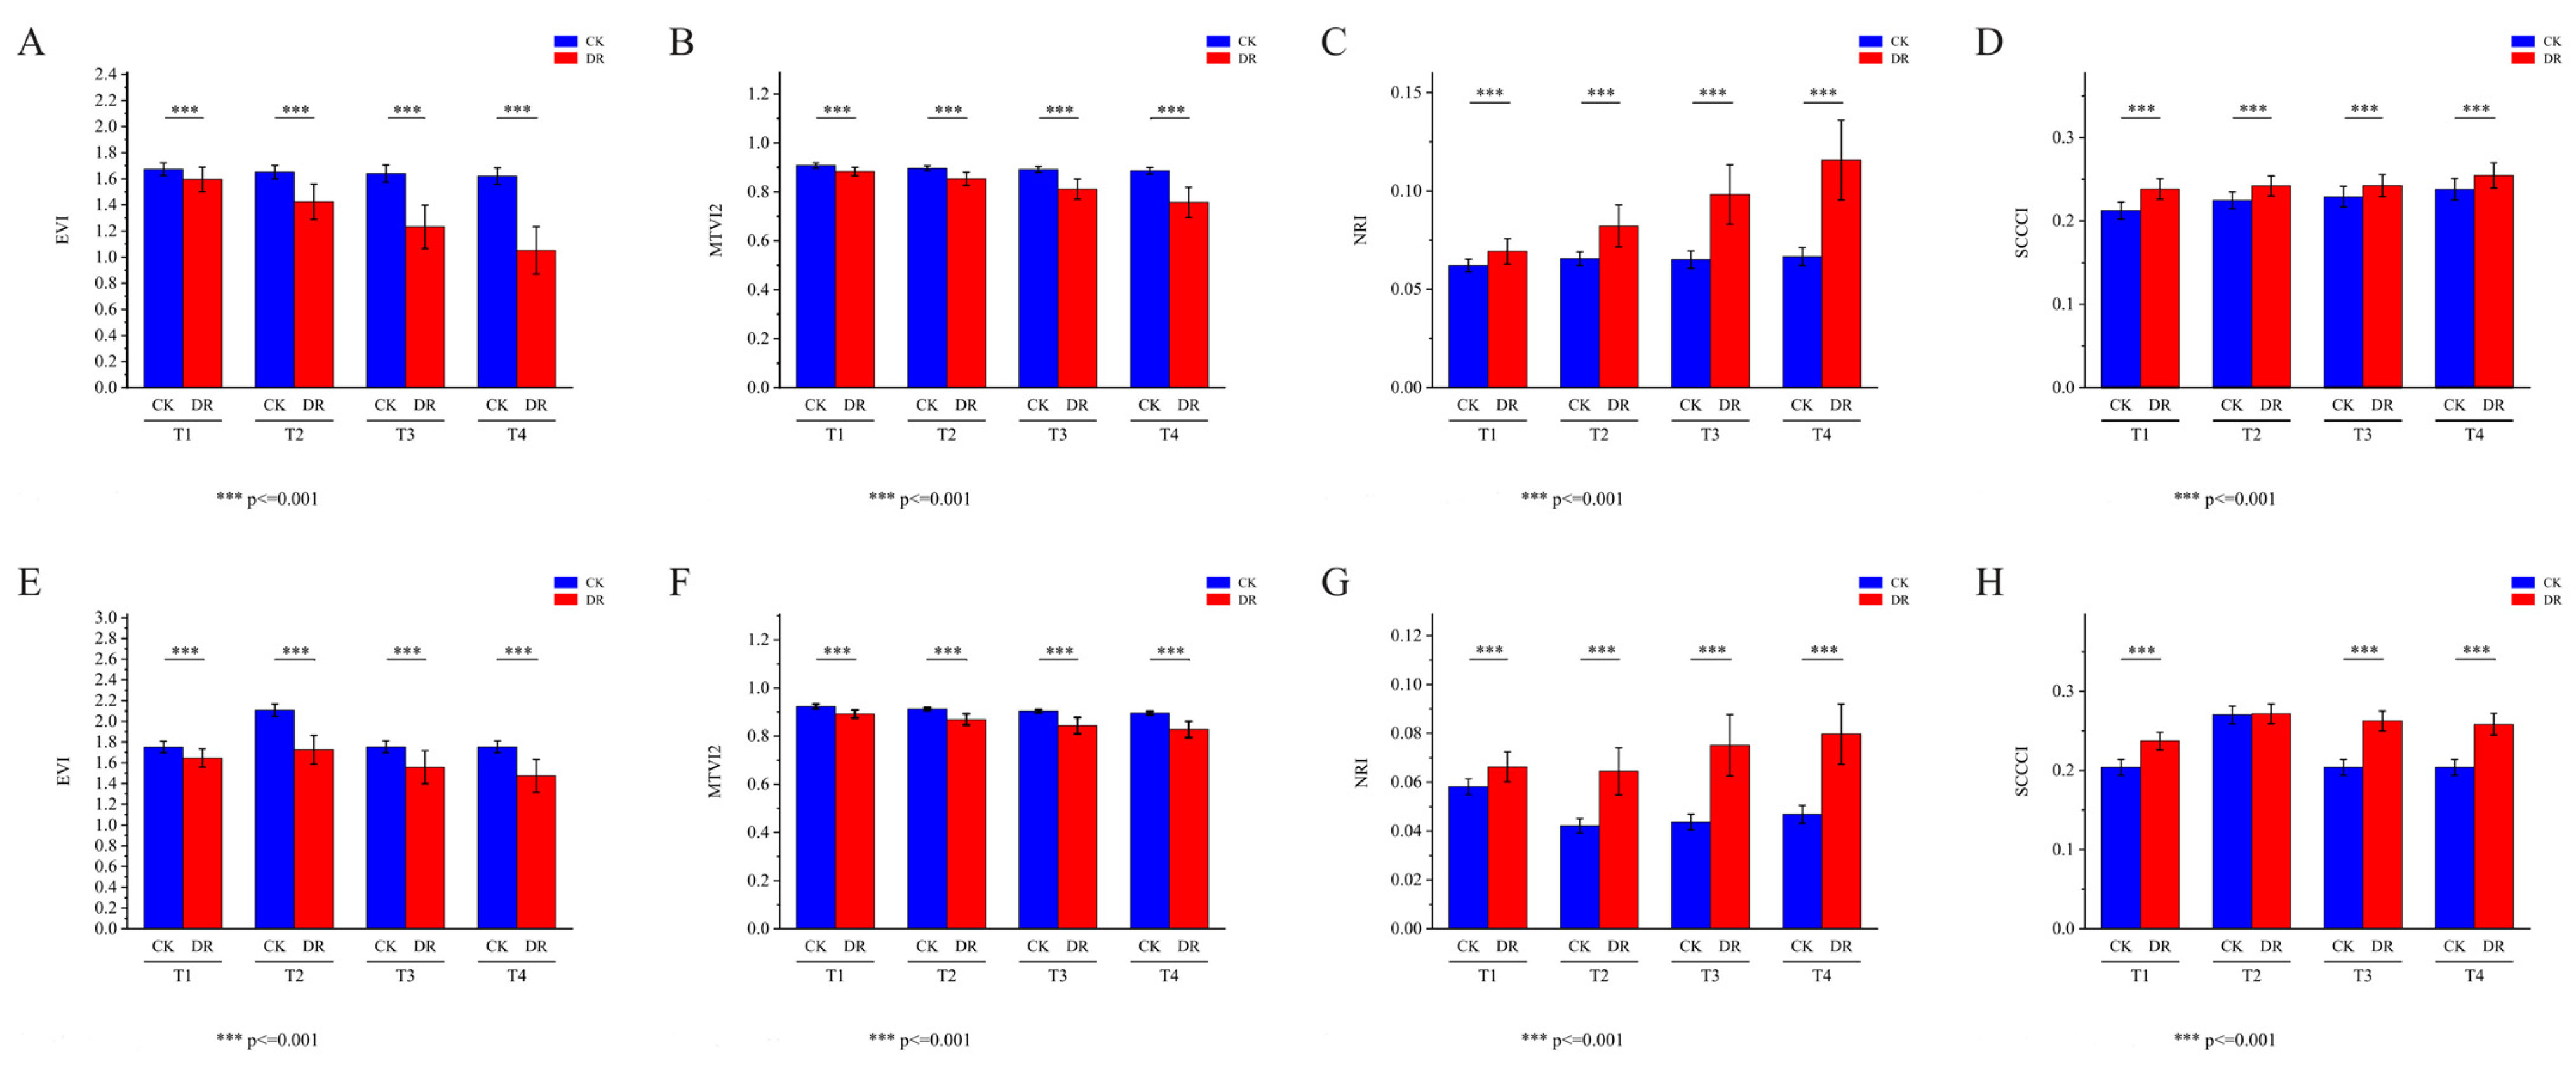
To evaluate the feasibility of using UAV-based multispectral monitoring for cotton water stress, Figure 9 compares the temporal dynamics of four multispectral vegetation indices under different water treatments across key cotton growth stages (T1–T4) over two consecutive years of experiments. The results indicate that drought stress had a highly significant impact (p < 0.001) on all measured indices. Although differences between treatments were relatively small during the initial stress phase (T1), the divergence in data trajectories between the CK and DR groups widened as the drought progressed, revealing two distinct response patterns. Specifically, EVI (Figure 9A,E) and MTVI2 (Figure 9B,F)—indices closely related to canopy structure and greenness—were markedly suppressed under drought conditions, with values declining sharply as the duration of stress increased. In contrast, NRI (Figure 9C,G) and SCCCI (Figure 9D,H) were significantly higher in the drought group than in the control group, exhibiting a marked and sustained upward trend. These characteristic patterns remained highly consistent across the two independent years of experiments, confirming that these four multispectral indices are minimally affected by inter-annual environmental variations and can sensitively and robustly capture and characterize the progression of cotton drought stress.
Figure 9.
Comparison of vegetation index changes between CK and DR groups across different growth stages (T1–T4). (A,E) Enhanced Vegetation Index (EVI). (B,F) Modified Triangular Vegetation Index 2 (MTVI2). (C,G) Normalized Redness Index (NRI). (D,H) Soil-Adjusted Canopy Chlorophyll Index (SCCCI). The top row (A–D) and bottom row (E–H) represent 2023 and 2024, respectively. T1–T4 represent four distinct growth stages. Asterisks above the bars indicate significant differences between treatments (Student’s t-test; *** p ≤ 0.001).
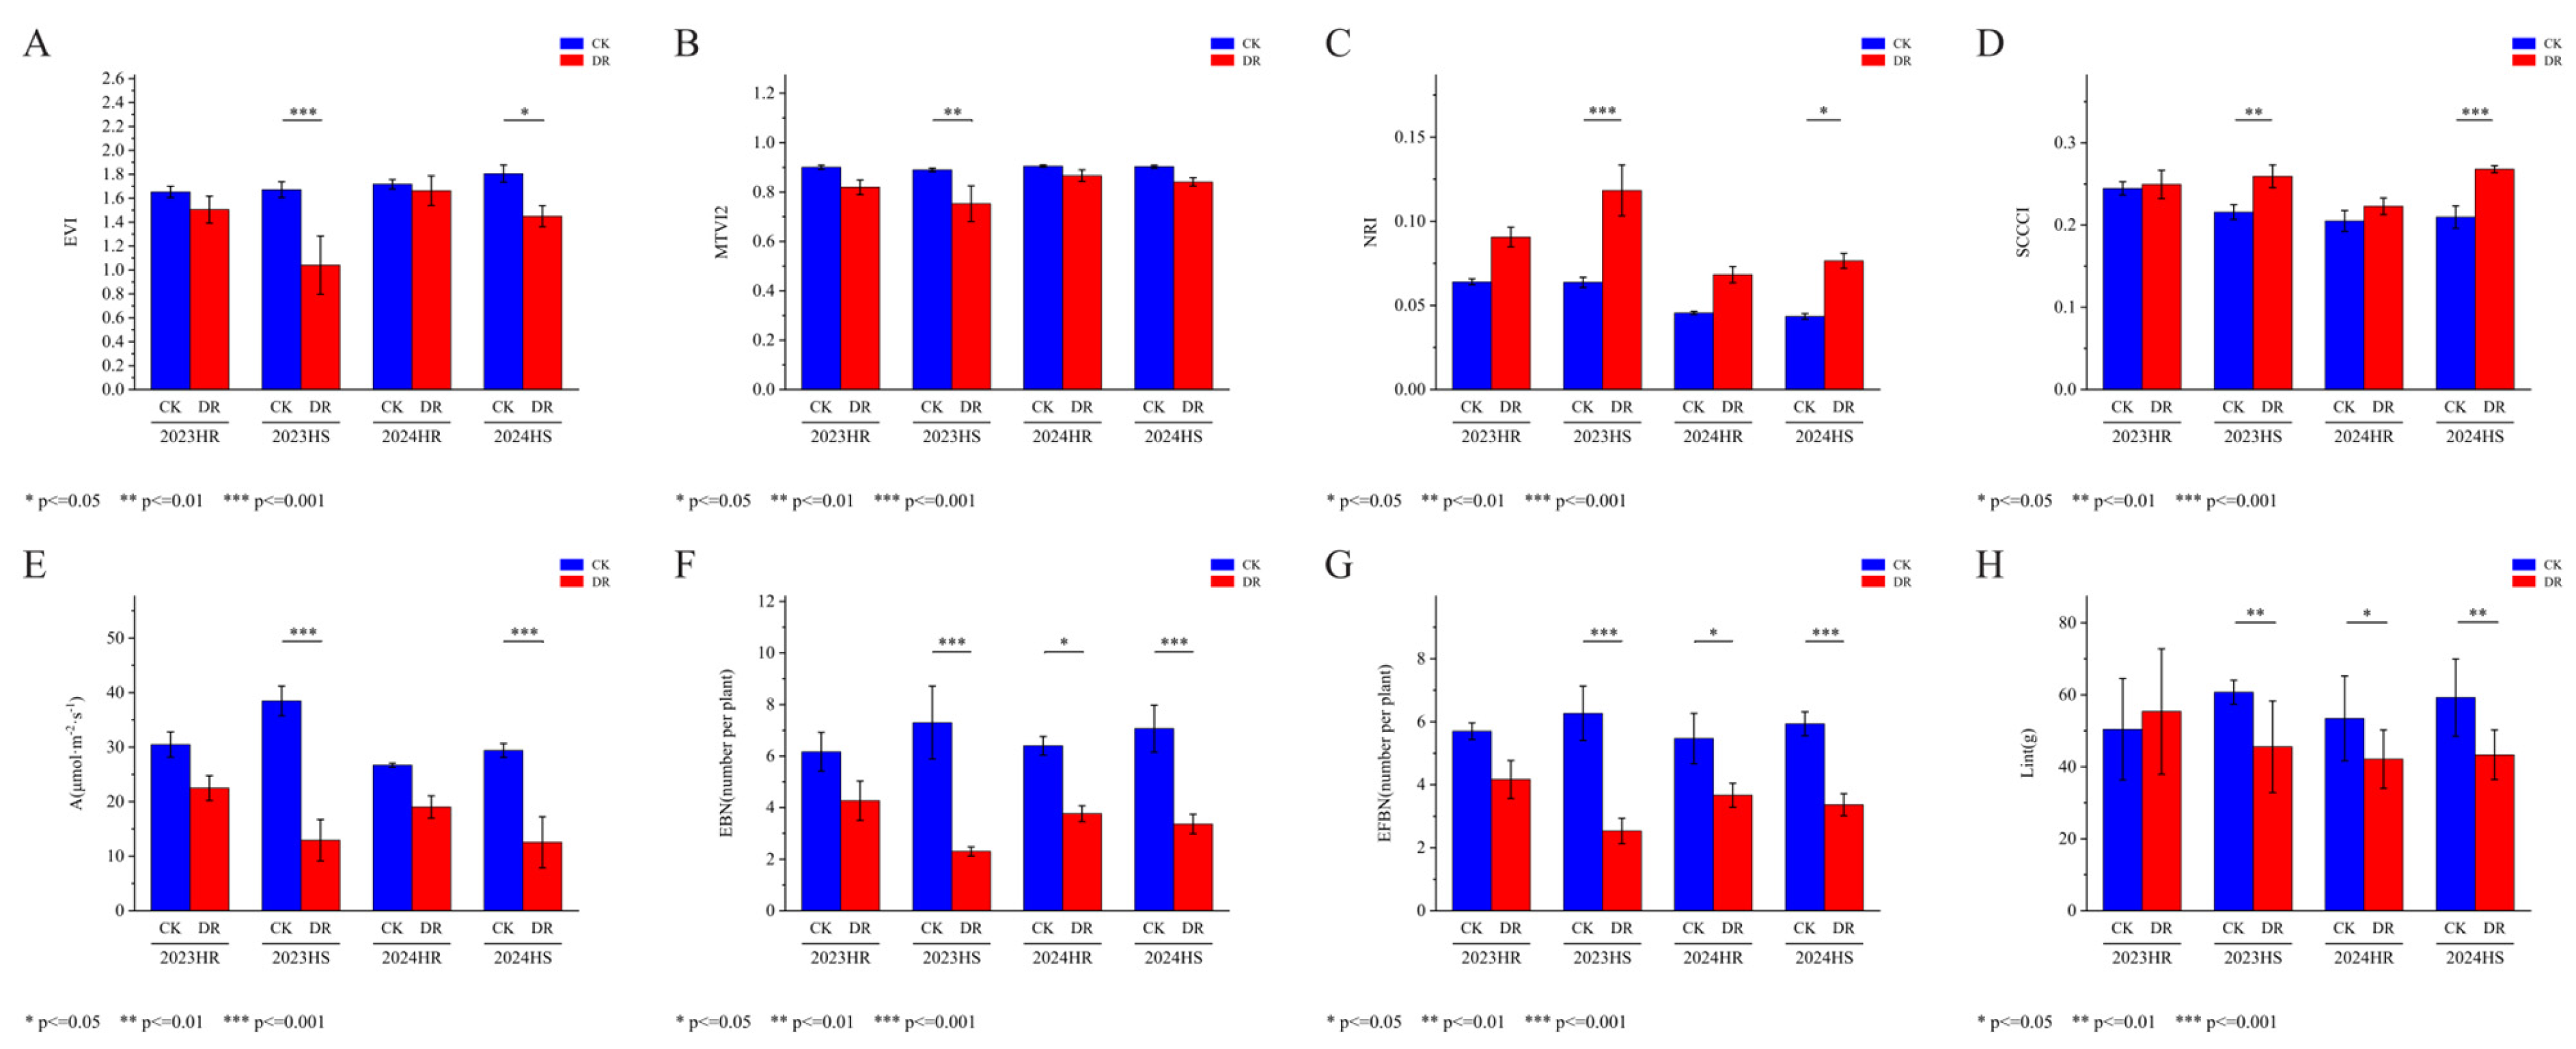
To validate the practical utility of the population clustering results in breeding, five HR genotypes and five HS genotypes were selected from Clusters I and IV, respectively, based on the classification shown in Figure 4. Their performance under CK and DR conditions was compared across 2023 and 2024. Regarding measured agronomic and physiological traits (Figure 10E–H), drought stress affected the two groups of materials differently. The HS materials were extremely sensitive to water deficit; their photosynthetic rate (A), effective boll number per plant, and final lint yield all showed highly significant declines under drought treatment (p < 0.01 or p < 0.001). In contrast, the HR materials demonstrated excellent yield stability; even under two consecutive years of drought stress, their key yield metric (Figure 10H) showed no statistically significant difference compared to the control group, and yield components such as effective boll number per plant remained stable. Regarding UAV-based spectral phenotyping at the T3 stage (Figure 10A–D), the trends in spectral indices were highly consistent with ground-based measurements. For HS materials, drought-induced physiological decline led to distinct changes in canopy spectral characteristics, with four key indices—EVI, MTVI2, NRI, and SCCCI—showing significant differences under drought treatment. Conversely, the HR materials exhibited no significant changes in these vegetation indices before and after drought stress, maintaining high spectral stability. These results confirm that UAV multispectral phenotyping at the T3 stage not only reflects the overall growth trends of cotton populations but also possesses the capability to accurately distinguish the drought-resistance potential of different genotypes. The stability of spectral indices can serve as a key indicator for screening drought-resistant germplasm, effectively facilitating field-based breeding evaluation.
Figure 10.
Comparison of spectral indices and agronomic-physiological traits between HR and HS cotton genotypes under CK and DR treatments. (A–D) Spectral indices: (A) EVI, (B) MTVI2, (C) NRI, (D) SCCCI; UAV multispectral data were collected at the T3 stage. (E–H) Agronomic and physiological traits: (E) net photosynthetic rate, (F) effective boll number per plant, (G) effective fruiting branch number per plant, (H) lint yield per plant. Data cover the 2023 and 2024 growing seasons. Asterisks above the bars indicate significant differences between treatments (Student’s t-test; * p ≤ 0.05, ** p ≤ 0.01, *** p ≤ 0.001).
4. Discussion
4.1. High-Throughput Analysis of Complex Yield Phenotypes and the Application of Ensemble Learning Algorithms
The number of effective bolls per plant is a core component determining final cotton yield [36]. Cotton is highly sensitive to water deficit during the flowering and boll-setting stages [37]; prolonged drought stress severely inhibits photosynthetic carbon assimilation efficiency and disrupts metabolic balance within the plant, thereby accelerating the shedding of reproductive organs and causing significant square and boll loss [38]. For example, Gao et al. [39] found that drought-induced reductions in effective boll number were strongly correlated with final yield loss in cotton, and Sharma et al. [36] demonstrated that boll number contributed more to irrigated cotton yield than boll mass. These reports support the use of DCEBN as a core indicator for drought-resistance evaluation. Consequently, the actual retention rate of effective bolls under drought conditions—quantified as the DCEBN—serves as the most direct and pivotal agronomic indicator for evaluating the drought resistance potential of cotton germplasm.
However, traditional field surveys of effective boll numbers rely heavily on manual, plant-by-plant counting and destructive yield measurements in the autumn [40]. These methods not only consume vast amounts of labor and resources but also preclude continuous monitoring of the same plant throughout its entire growth cycle, thereby severely constraining the large-scale screening of drought-resistant germplasm. UAV-based multispectral remote sensing technology offers a breakthrough for high-throughput phenotypic data acquisition [41]. Yet, when processing high-dimensional multispectral data, significant multicollinearity often exists among the numerous vegetation indices (e.g., NDVI and EVI, as shown in Figure 6). Such data redundancy causes variance inflation during parameter estimation in traditional single linear regression models, distorting feature weight coefficients and making it difficult to accurately model the complex mapping relationship between spectral reflectance variations and the mechanisms of cotton boll shedding.
Comparative analysis in this study confirms that decision tree-based ensemble algorithms—specifically Stacking and Random Forest—demonstrate remarkable suitability for addressing these challenges. The Random Forest algorithm effectively mitigates the interference of highly correlated features on model training and reduces the risk of overfitting through Bagging resampling strategies and random feature selection during node splitting. Meanwhile, the Stacking framework employs a meta-learner to perform secondary fusion of outputs from various base models; this approach fully integrates the independent data-interpretation capabilities of multiple algorithms and maximizes the extraction of non-linear patterns inherent in high-dimensional spectral data. This ensemble strategy establishes a robust algorithmic foundation for the subsequent accurate isolation and selection of key spectral indicators that characterize boll retention capacity under drought stress.
Notably, the predictive performance achieved in this study (Stacking test R2 = 0.77–0.80) aligns well with recent UAV-based drought phenotyping studies in other crops. For instance, Xiang et al. [42] developed a hybrid deep learning framework for wheat yield prediction under contrasting water regimes using UAV hyperspectral imagery across 535 genotypes, reporting an R2 of 0.73 when fusing four phenological stages. The Stacking model in our study achieved a comparable R2 of 0.80 at the T3 stage, indicating that ensemble learning can effectively capture the spectral–physiological relationship in cotton boll retention, yielding results consistent with deep learning approaches applied in wheat. Furthermore, Xiang et al. [42] noted that prediction accuracy under severe water stress was lower than under well-watered conditions. This aligns closely with the slight decline in model accuracy we observed at the T4 stage (e.g., Stacking R2 decreased from 0.80 at T3 to 0.78 at T4). This cross-crop consistency suggests that prolonged, severe drought ultimately causes irreversible canopy senescence and structural damage, which introduces biological noise and obscures the spectral–phenotypic relationship. Consequently, the T3 stage—prior to the onset of irreversible damage—represents an optimal window for reliable drought resistance evaluation.
4.2. Plant Physiological Relevance of the Quantified Feature Analysis Results
Previous studies utilizing machine learning for agricultural phenotype prediction have often prioritized improving model fitting accuracy, frequently failing to elucidate the specific mechanisms by which individual feature variables influence prediction outcomes. The SHAP feature attribution analysis introduced in this study not only provided a global quantitative ranking of the importance of 24 multispectral vegetation indices but also revealed the relationships between the directional changes in these indices and yield prediction, thereby grounding the data analysis results in clear plant physiological principles.
The analysis results indicate that NRI, SCCCI, MTVI2, and EVI are the core parameters driving the prediction of the number of effective bolls per plant. From a biological development perspective, MTVI2 and EVI primarily reflect the leaf area index (LAI) and green vegetative biomass of the cotton canopy, representing the plant’s potential source supply of photosynthates [43]. Under drought stress, plants typically inhibit leaf expansion or even shed older leaves to maintain water balance; varieties capable of maintaining higher biomass indices often possess superior deep-root water uptake capabilities or higher water-use efficiency [44], thereby ensuring the material basis for the translocation of photosynthates to the cotton bolls. This is in line with Zhao [45], who found that MTVI2 and EVI were among the indices most strongly correlated with cotton yield under different nitrogen levels, and with Wang et al. [46], who reported that biomass-related vegetation indices were more sensitive to early water stress than structural indices. The present study extends these findings by quantifying the positive contribution of MTVI2 and EVI to DCEBN prediction through SHAP values. In contrast, the NRI and the SCCCI are highly sensitive to decreases in intracellular chlorophyll concentration and changes in leaf water status. Drought induces the accumulation of reactive oxygen species (ROS) in cotton leaves, leading to the destruction of photosynthetic pigments and premature cellular senescence, which subsequently causes nutrient deprivation in reproductive organs and significant shedding of squares and bolls [47]. The SHAP model accurately captured the significant negative correlation between the increase in these two senescence-related red-edge indices and the predicted reduction in the number of effective bolls per plant. This demonstrates that the selected key features align well with the physiological and metabolic processes of cotton in response to drought, rather than being the result of coincidental data fitting.
4.3. Dynamic Evolution of Multispectral Features in Response to Drought over Time
Crop response to environmental water deficit is a time-series process that evolves from microscopic physiological and metabolic disturbances to macroscopic changes in morphological structure. The time-series principal component analysis conducted in this study (Figure 5) provides a comprehensive and objective record of these dynamic population-level characteristics. During the initial stage of drought stress (Stage T1), cotton plants primarily respond to water deficits through micro-level mechanisms such as active stomatal closure and the accumulation of osmoregulatory substances [48]. At this stage, the physical structure of leaf cells remains largely intact, resulting in significant overlap between the canopy spectral characteristics of the treatment group and the normal control group; consequently, morphological damage is not visually apparent or detectable via preliminary remote sensing.
As soil moisture is continuously depleted and the duration of drought extends (Stages T2 through T4), the plants’ physiological compensatory capacity reaches its limit; leaves begin to wilt and yellow, and canopy spectral characteristics diverge sharply within the principal component space. Continuous monitoring of HR and HS genotypes (Figure 10) reveals that spectral parameters in drought-sensitive materials degrade significantly faster than in drought-resistant ones, with an anomalous rise in the red-edge index often preceding actual yield loss. This demonstrates that time-series multispectral monitoring can overcome the time-lag issues associated with manual visual field assessments. By capturing subtle early-stage variations in canopy reflectance, it is possible to dynamically track the drought status of field populations before irreversible, substantial yield loss occurs, thereby providing data to support irrigation timing decisions in precision agriculture.
Using extreme genotypes to validate remote sensing models is a well-established strategy in crop phenotyping. Wang et al. [5] compared drought-resistant and drought-sensitive cotton accessions at the germination stage and found that physiological differences between extreme genotypes could reach 2–3-fold; Zhang et al. [32] similarly pointed out that extreme-sample validation is critical for assessing model generalization. The consistent spectral stability of HR materials and the significant spectral changes in HS materials observed here further support the feasibility of this strategy for cotton drought-resistance breeding.
5. Conclusions
This study established a non-destructive, high-throughput framework for evaluating cotton drought tolerance by integrating UAV-based time-series multispectral remote sensing with interpretable machine learning. Based on two consecutive years of field water-stress experiments using 150 Gossypium hirsutum accessions, time-series multispectral imagery sensitively captured the dynamic response of cotton to water deficit across growth stages, overcoming the time-lag limitations of manual observation. Ensemble learning models (RF and Stacking) outperformed KNN and SVR in predicting DCEBN, showing higher accuracy and stronger generalization. SHAP analysis identified MTVI2, EVI, NRI, and SCCCI as the four key spectral markers, whose variation patterns were closely associated with canopy source–sink regulation and leaf senescence under drought stress. Validation using extreme drought-resistant and drought-sensitive genotypes confirmed that these four indices effectively distinguished contrasting drought-resistance levels. Together, these findings provide a reliable and interpretable spectral basis for high-throughput drought-resistant germplasm screening in cotton breeding.
Author Contributions
Conceptualization, Q.C. (Qin Chen) and Q.C. (Quanjia Chen); data curation, X.M.; formal analysis, Q.C. (Qin Chen) and H.Z.; funding acquisition, Q.C. (Quanjia Chen); methodology, Q.C. (Qin Chen); project administration, J.Z.; software, X.M. and H.Z.; supervision, J.Z. and Q.C. (Quanjia Chen); writing—original draft, Q.C. (Qin Chen) and X.M.; writing—review and editing, Q.C. (Qin Chen), H.Z., S.Y., Q.C. (Qiyu Chang), J.W., W.G., J.Z. and Q.C. (Quanjia Chen). All authors have read and agreed to the published version of the manuscript.
Funding
Funding was provided by Finance science and technology project of Xinjiang Uyghur Autonomous Region (2023A01-3); and the National Key R&D Program of China (2024YFD1200300).
Institutional Review Board Statement
Not applicable.
Data Availability Statement
If necessary, the data of this study can be obtained from the author upon request. The data are part of an ongoing study, and due to privacy restrictions, they are not publicly available.
Conflicts of Interest
We declare that this article does not have any competitive interest conflicts.
References
- Ul-Allah, S.; Rehman, A.; Hussain, M.; Farooq, M. Fiber yield and quality in cotton under drought: Effects and management. Agric. Water Manag. 2021, 255, 106994. [Google Scholar] [CrossRef] [Scilit]
- Patil, A.M.; Pawar, B.D.; Wagh, S.G.; Shinde, H.; Shelake, R.M.; Markad, N.R.; Bhute, N.K.; Červený, J.; Wagh, R.S. Abiotic stress in cotton: Insights into plant responses and biotechnological solutions. Agriculture 2024, 14, 1638. [Google Scholar] [CrossRef] [Scilit]
- Rehman, A.; Farooq, M. Morphology, physiology and ecology of cotton. In Cotton Production; Wiley: Hoboken, NJ, USA, 2019; pp. 23–46. [Google Scholar]
- Yu, H.; Luo, Y.; Cao, N.; Wang, S.; Zhou, Z.; Hu, W. Drought-induced cell wall degradation in the base of pedicel is associated with accelerated cotton square shedding. Plant Physiol. Biochem. 2024, 214, 108894. [Google Scholar] [CrossRef] [Scilit]
- Wang, Y.; Huang, Q.; Liu, L.; Li, H.; Wang, X.; Si, A.; Yu, Y. Screening and comprehensive evaluation of drought resistance in cotton germplasm resources at the germination stage. Plants 2025, 14, 2191. [Google Scholar] [CrossRef] [Scilit]
- Yang, W.; Feng, H.; Zhang, X.; Zhang, J.; Doonan, J.H.; Batchelor, W.D.; Xiong, L.; Yan, J. Crop phenomics and high-throughput phenotyping: Past decades, current challenges, and future perspectives. Mol. Plant 2020, 13, 187–214. [Google Scholar] [CrossRef] [Scilit]
- Hein, N.T.; Ciampitti, I.A.; Jagadish, S.K. Bottlenecks and opportunities in field-based high-throughput phenotyping for heat and drought stress. J. Exp. Bot. 2021, 72, 5102–5116. [Google Scholar] [CrossRef] [Scilit]
- Großkinsky, D.K.; Svensgaard, J.; Christensen, S.; Roitsch, T. Plant phenomics and the need for physiological phenotyping across scales to narrow the genotype-to-phenotype knowledge gap. J. Exp. Bot. 2015, 66, 5429–5440. [Google Scholar] [CrossRef] [Scilit]
- Gano, B.; Bhadra, S.; Vilbig, J.M.; Ahmed, N.; Sagan, V.; Shakoor, N. Drone-based imaging sensors, techniques, and applications in plant phenotyping for crop breeding: A comprehensive review. Plant Phenomics 2024, 7, e20100. [Google Scholar] [CrossRef] [Scilit]
- Yang, X.; Chen, J.; Lu, X.; Liu, H.; Liu, Y.; Bai, X.; Qian, L.; Zhang, Z. Advances in UAV remote sensing for monitoring crop water and nutrient status: Modeling methods, influencing factors, and challenges. Plants 2025, 14, 2544. [Google Scholar] [CrossRef] [Scilit]
- Carracelas, G.; Hornbuckle, J.; Ballester, C. Impact of Standing Water Level and Observation Time on Remote-Sensed Canopy Indices for Rice Nitrogen Status Monitoring. Remote Sens. 2025, 17, 1045. [Google Scholar] [CrossRef] [Scilit]
- Chivasa, W.; Mutanga, O.; Biradar, C. UAV-based multispectral phenotyping for disease resistance to accelerate crop improvement under changing climate conditions. Remote Sens. 2020, 12, 2445. [Google Scholar] [CrossRef] [Scilit]
- Li, H.; Jin, J.; Dong, F.; Zhang, J.; Li, L.; Zhang, Y. Gully erosion susceptibility prediction using high-resolution data: Evaluation, comparison, and improvement of multiple machine learning models. Remote Sens. 2024, 16, 4742. [Google Scholar] [CrossRef] [Scilit]
- Sarker, I.H. Machine learning: Algorithms, real-world applications and research directions. SN Comput. Sci. 2021, 2, 160. [Google Scholar] [CrossRef] [Scilit]
- Frimpong, S.A.; Han, M.; Zheng, W.; Li, X.; Akpaku, E.; Obeng, A.P. Machine and deep learning in agricultural engineering: A comprehensive survey and meta-analysis of techniques, applications, and challenges. Computers 2025, 14, 438. [Google Scholar] [CrossRef] [Scilit]
- Gilpin, L.H.; Bau, D.; Yuan, B.Z.; Bajwa, A.; Specter, M.; Kagal, L. Explaining explanations: An overview of interpretability of machine learning. In Proceedings of the 2018 IEEE 5th International Conference on Data Science and Advanced Analytics (DSAA), Turin, Italy, 1–4 October 2018; IEEE: New York, NY, USA, 2018. [Google Scholar]
- Han, S.; Wang, H. Application of deep learning technology in monitoring plant attribute changes. Sustainability 2025, 17, 7602. [Google Scholar] [CrossRef] [Scilit]
- Kashifi, M.T. Robust spatiotemporal crash risk prediction with gated recurrent convolution network and interpretable insights from SHapley additive explanations. Eng. Appl. Artif. Intell. 2024, 127, 107379. [Google Scholar] [CrossRef] [Scilit]
- Hamid, R.; Ghorbanzadeh, Z.; Panahi, B. Regulatory networks underpinning climate resilience in cotton: From molecular mechanisms to precision breeding. Plant Stress 2026, 23, 101501. [Google Scholar] [CrossRef] [Scilit]
- Saini, D.K.; Impa, S.M.; McCallister, D.; Patil, G.B.; Abidi, N.; Ritchie, G.; Jaconis, S.Y.; Jagadish, K.S.V. High day and night temperatures impact on cotton yield and quality—Current status and future research direction. J. Cotton Res. 2023, 6, 16. [Google Scholar] [CrossRef] [Scilit]
- Jia, Y.; Sun, J.; Du, X. Cotton germplasm resources in China. In World Cotton Germplasm Resources; IntechOpen: London, UK, 2014; pp. 35–53. [Google Scholar]
- Hinton, P.R.; McMurray, I.; Brownlow, C. SPSS Explained; Routledge: Abingdon-on-Thames, UK, 2014. [Google Scholar]
- Katz, A. Beginning Microsoft Excel 2010; Apress: New York, NY, USA, 2010; pp. 21–39. [Google Scholar]
- Crawley, M.J. The R Book; John Wiley & Sons: Hoboken, NJ, USA, 2012. [Google Scholar]
- Koto, A.G. Pengolahan Foto Udara Drone Menggunakan Perangkat Lunak Pix4DMAPPER. J. Sains Inf. Geogr. 2021, 4, 50–57. [Google Scholar]
- Scott, L.M.; Janikas, M.V. Spatial statistics in ArcGIS. In Handbook of Applied Spatial Analysis: Software Tools, Methods and Applications; Springer: Berlin/Heidelberg, Germany, 2009; pp. 27–41. [Google Scholar]
- Xue, J.; Su, B. Significant remote sensing vegetation indices: A review of developments and applications. J. Sens. 2017, 2017, 1353691. [Google Scholar] [CrossRef] [Scilit]
- Yan, K.; Gao, S.; Yan, G.; Ma, X.; Chen, X.; Zhu, P.; Li, J.; Gao, S.; Gastellu-Etchegorry, J.-P.; Myneni, R.B.; et al. A global systematic review of the remote sensing vegetation indices. Int. J. Appl. Earth Obs. Geoinf. 2025, 139, 104560. [Google Scholar] [CrossRef] [Scilit]
- Vidican, R.; Mălinaș, A.; Ranta, O.; Moldovan, C.; Marian, O.; Ghețe, A.; Ghișe, C.R.; Popovici, F.; Cătunescu, G.M. Using remote sensing vegetation indices for the discrimination and monitoring of agricultural crops: A critical review. Agronomy 2023, 13, 3040. [Google Scholar] [CrossRef] [Scilit]
- Tayade, R.; Yoon, J.; Lay, L.; Khan, A.L.; Yoon, Y.; Kim, Y. Utilization of spectral indices for high-throughput phenotyping. Plants 2022, 11, 1712. [Google Scholar] [CrossRef] [Scilit]
- Lopez, E.; Gorla, G.; Etxebarria-Elezgarai, J.; Amigo, J.M.; Seifert, A. The importance of choosing a proper validation strategy in predictive models. Part 2: Recipes for (avoiding) overfitting. Anal. Chim. Acta 2025, 1384, 344838. [Google Scholar] [CrossRef] [Scilit]
- Zhang, Y.; Liu, J.; Shen, W. A review of ensemble learning algorithms used in remote sensing applications. Appl. Sci. 2022, 12, 8654. [Google Scholar] [CrossRef] [Scilit]
- Seifert, E. OriginPro 9.1: Scientific data analysis and graphing software—Software review. J. Chem. Inf. Model. 2014, 54, 1552. [Google Scholar] [CrossRef] [Scilit]
- Wickham, H.; Sievert, C. Ggplot2: Elegant Graphics for Data Analysis; Springer: New York, NY, USA, 2009; Volume 10. [Google Scholar]
- Phillips, D. Python 3 Object-Oriented Programming: Build Robust and Maintainable Software with Object-Oriented Design Patterns in Python 3.8; Packt Publishing Ltd.: Birmingham, UK, 2018. [Google Scholar]
- Sharma, B.; Mills, C.I.; Snowden, C.; Ritchie, G.L. Contribution of boll mass and boll number to irrigated cotton yield. Agron. J. 2015, 107, 1845–1853. [Google Scholar] [CrossRef] [Scilit]
- Lin, M.; Wang, L.; Lv, G.; Gao, C.; Zhao, Y.; Li, X.; He, L.; Sun, W. Deficit irrigation effects on cotton growth cycle and preliminary optimization of irrigation strategies in arid environment. Plants 2024, 13, 1403. [Google Scholar] [CrossRef] [Scilit]
- Khan, A.; Pan, X.; Najeeb, U.; Tan, D.K.Y.; Fahad, S.; Zahoor, R.; Luo, H. Coping with drought: Stress and adaptive mechanisms, and management through cultural and molecular alternatives in cotton as vital constituents for plant stress resilience and fitness. Biol. Res. 2018, 51, 47. [Google Scholar] [CrossRef] [Scilit]
- Gao, M.; Xu, B.; Wang, Y.; Zhou, Z.; Hu, W. Quantifying individual and interactive effects of elevated temperature and drought stress on cotton yield and fibre quality. J. Agron. Crop Sci. 2021, 207, 422–436. [Google Scholar] [CrossRef] [Scilit]
- Dube, N.; Bryant, B.; Sari-Sarraf, H.; Ritchie, G.L. Cotton boll distribution and yield estimation using three-dimensional point cloud data. Agron. J. 2020, 112, 4976–4989. [Google Scholar] [CrossRef] [Scilit]
- Ampatzidis, Y.; Partel, V. UAV-based high throughput phenotyping in citrus utilizing multispectral imaging and artificial intelligence. Remote Sens. 2019, 11, 410. [Google Scholar] [CrossRef] [Scilit]
- Xiang, J.; Li, L.; Liu, J.; Zhang, Y.; Wang, H.; Li, J.; Chen, Z.; Lei, T.; Xiao, Y.; He, Y. Cypnet enabled spatiotemporal modeling of UAV hyperspectral imagery for wheat yield prediction and drought tolerant genotype identification. Comput. Electron. Agric. 2026, 249, 111858. [Google Scholar] [CrossRef] [Scilit]
- Pokhrel, A. Quantifying Physiological Contributions to Yield Loss and Predicting Yield-Driving Traits Using UAV-Based Imagery in Cotton at Different Nitrogen Levels. Ph.D. Thesis, University of Georgia, Atlanta, GA, USA, 2023. [Google Scholar]
- Anjum, S.A.; Ashraf, U.; Zohaib, A.; Tanveer, M.; Naeem, M.; Ali, I.; Tabassum, T.; Nazir, U. Growth and development responses of crop plants under drought stress: A review. Zemdirb.-Agric. 2017, 104, 267–276. [Google Scholar] [CrossRef] [Scilit]
- Zhao, D.; Reddy, K.R.; Kakani, V.G.; Read, J.J.; Koti, S. Canopy reflectance in cotton for growth assessment and lint yield prediction. Eur. J. Agron. 2007, 26, 335–344. [Google Scholar] [CrossRef] [Scilit]
- Wang, Z.; Li, Y.; Zhang, H.; He, Y.; Qiao, X.; Tong, J.; Feng, M.; Yang, W.; Wang, C.; Yang, S. Hyperspectral monitoring of winter wheat aboveground biomass and net primary productivity under controlled water-deficit conditions. Agric. Water Manag. 2026, 332, 110518. [Google Scholar] [CrossRef] [Scilit]
- Perveen, A.; Sheheryar, S.; Ahmad, F.; Mustafa, G.; Moura, A.A.; Campos, F.A.P.; Domont, G.B.; Nishan, U.; Ullah, R.; Ibrahim, M.A.; et al. Integrative physiological, biochemical, and proteomic analysis of the leaves of two cotton genotypes under heat stress. PLoS ONE 2025, 20, e0316630. [Google Scholar] [CrossRef]
- Arunachalam, P.; Govindaraj, M.; Pandian, K.; Sritharan, N. Tailoring of abiotic stress adaptive traits to diminish the effect of changing climate on crop productivity. In Crop Improvement in the Era of Climate Change, 1st ed; Roychowdhury, R., Ed.; I.K. International Publishing: New Delhi, India, 2014. [Google Scholar]

Disclaimer/Publisher’s Note: The statements, opinions and data contained in all publications are solely those of the individual author(s) and contributor(s) and not of MDPI and/or the editor(s). MDPI and/or the editor(s) disclaim responsibility for any injury to people or property resulting from any ideas, methods, instructions or products referred to in the content. |
© 2026 by the authors. Licensee MDPI, Basel, Switzerland. This article is an open access article distributed under the terms and conditions of the Creative Commons Attribution (CC BY) license.