


Abstract
Water-saving irrigation can substantially reduce water inputs in rice production, but excessive soil drying may impair physiological activity during grain filling and reduce yield. This study evaluated continuous flooding (CF), moderate water-saving irrigation (SW; −20 kPa), and intensified water-saving irrigation (IW; −40 kPa) in rice. Flag-leaf relative chlorophyll content and net photosynthetic rate, superior-grain development, yield components, grain yield, irrigation water input, and water productivity (WP) were evaluated. SW reduced irrigation water input by 57.4% relative to CF while maintaining a comparable grain yield (4545.0 vs. 4550.7 kg ha−1), resulting in the highest WP (0.54 kg m−3). In contrast, IW reduced grain yield to 3694.4 kg ha−1. During late grain filling, SW maintained flag-leaf chlorophyll status and photosynthetic activity comparable to CF, whereas IW showed greater reductions at 28 and 35 days after flowering. IW also exhibited lower relative grain volume during the middle-to-late grain-filling period. Plot-level regression analyses showed positive associations among flag-leaf chlorophyll status, photosynthetic rate, relative grain volume, and final grain yield. These results indicate that moderate soil water tension can substantially reduce irrigation requirements while maintaining late-stage physiological activity, grain development, and yield, whereas intensified soil drying provides limited additional water savings at the expense of crop productivity.
1. Introduction
Rice (Oryza sativa L.) is one of the world’s most important staple crops and provides the primary source of dietary energy for more than half of the global population [1]. However, conventional lowland rice cultivation relies heavily on continuous flooding, resulting in high irrigation water consumption and relatively low water productivity [2,3]. Increasing competition for freshwater resources and the growing impacts of climate change have highlighted the need for irrigation strategies that reduce water use while maintaining stable grain production. Consequently, improving water productivity without compromising grain yield has become a major objective of sustainable rice production.
Among various water-saving irrigation practices, irrigation scheduling based on soil water status has attracted considerable attention because it allows irrigation to be applied according to crop water demand rather than maintaining continuous flooding. Previous studies have shown that moderate soil drying can substantially reduce irrigation water use while maintaining grain yield and improving water productivity [4,5,6,7]. In contrast, excessive soil drying often accelerates leaf senescence, suppresses photosynthesis, restricts assimilate production, and ultimately reduces grain yield [8,9]. These findings indicate that the degree of soil drying, rather than water reduction alone, plays a critical role in determining crop performance.
During grain filling, successful yield formation depends on the coordination between source activity and sink development. The flag leaf serves as the primary photosynthetic source after heading, supplying assimilates required for grain filling, whereas superior grains exhibit stronger sink activity and contribute substantially to final grain weight. Maintaining flag-leaf physiological function is therefore essential for sustaining assimilate supply and supporting grain development under water-saving irrigation.
Although previous studies have independently investigated leaf physiological traits, grain filling, grain yield, or water productivity, few have simultaneously examined their temporal relationships throughout grain filling under well-defined soil water tension thresholds. Moreover, the physiological linkage between flag-leaf function, superior grain development, and final grain yield under different irrigation intensities remains insufficiently understood. Clarifying these relationships would improve our understanding of how moderate soil drying sustains rice productivity while reducing irrigation water use.
Therefore, this study evaluated three irrigation regimes based on soil water tension, including continuous flooding (CF), moderate water-saving irrigation (SW, −20 kPa), and intensified water-saving irrigation (IW, −40 kPa). Temporal changes in flag-leaf relative chlorophyll content, net photosynthetic rate, superior grain development, grain yield, and water productivity were investigated throughout grain filling. We hypothesized that moderate soil drying would maintain flag-leaf physiological activity and superior grain development at levels comparable to continuous flooding, thereby sustaining grain yield while improving water productivity, whereas intensified soil drying would accelerate physiological decline and reduce grain filling and yield.
2. Materials and Methods
2.1. Experimental Site and Climatic Conditions
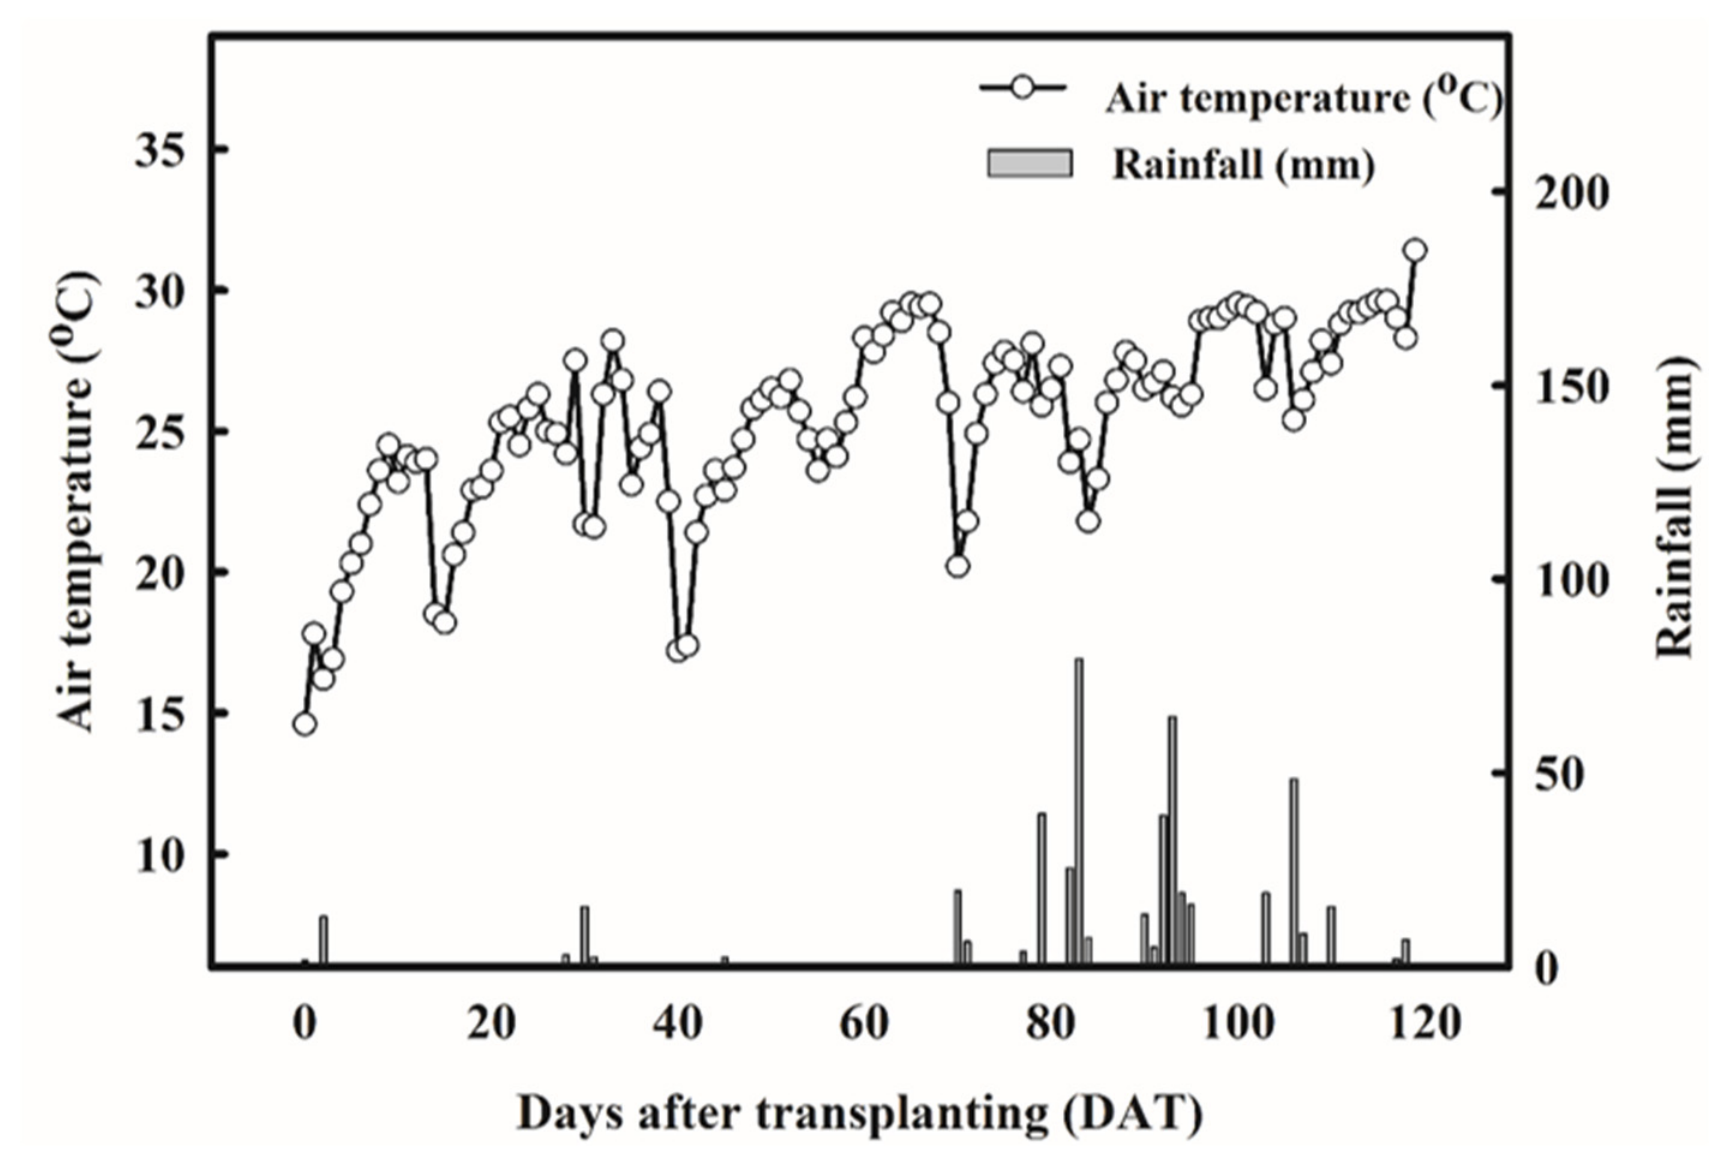
The field experiment was conducted at the Student Experimental Farm of National Pingtung University of Science and Technology, Pingtung, Taiwan (22°38′55.6″ N, 120°37′01.9″ E). Daily air temperature and precipitation were recorded throughout the experimental period and are presented in Figure 1.
Figure 1.
Daily rainfall and mean air temperature during the rice growing period.
The experiment was conducted from 24 February to 17 June 2022, with a total growth duration of 119 days after transplanting (DAT). During the growing season, the mean air temperature was 25.3 °C, and cumulative precipitation was 483.0 mm.
The experimental field covered approximately 450 m2. Before transplanting, soil samples were collected to characterize the initial soil conditions. The soil was classified as clay loam, and its initial physicochemical properties are summarized in Table 1. The japonica rice cultivar Tainung 71, commonly grown in Taiwan, was used in the experiment and transplanted following local cultivation practices.
Table 1.
Initial physicochemical properties of the experimental soil before rice transplanting.
2.2. Experimental Design
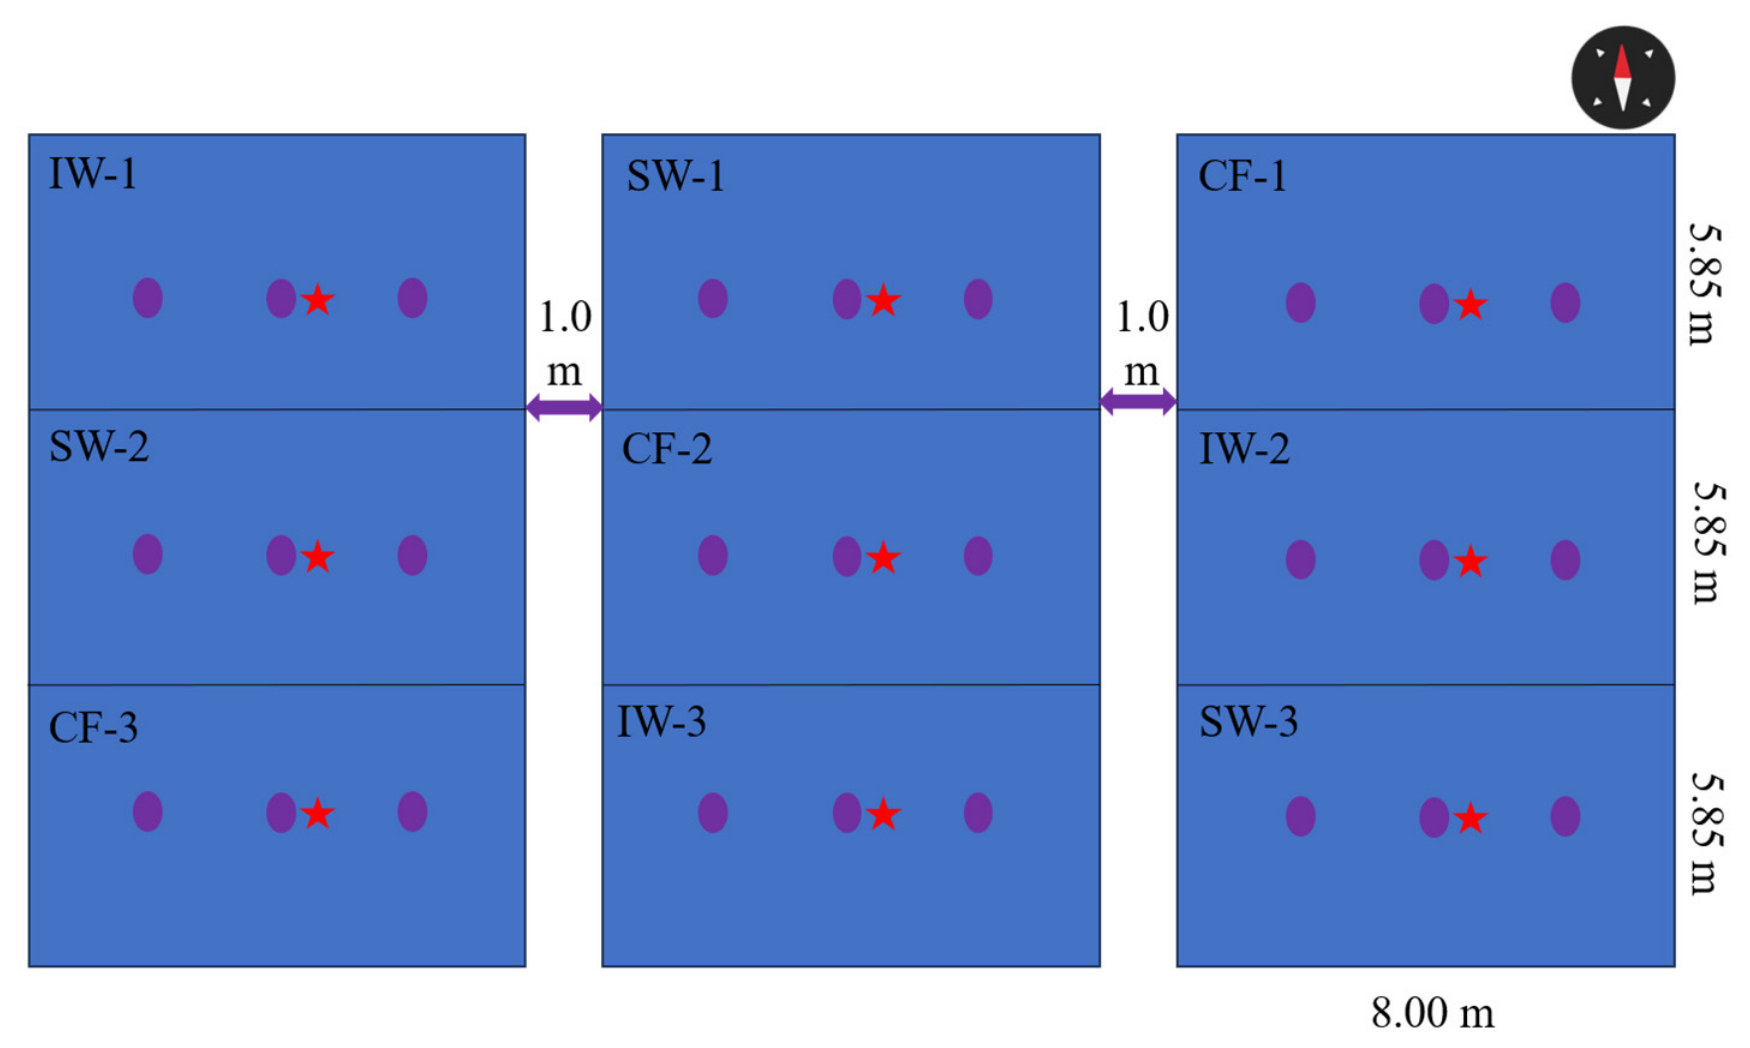
A field experiment was conducted to compare three irrigation regimes: CF, SW, and IW. The experimental field (approximately 450 m2) was divided into nine independent experimental plots, with three replicate plots randomly assigned to each irrigation treatment (n = 3). The plots were distributed among three adjacent field sections, with each section containing one plot of each irrigation treatment (Figure 2). The three adjacent field sections were separated by 1.0 m-wide intervals, while individual plots within each section were separated by 0.6 m-wide boundaries.
Figure 2.
Experimental layout of the nine independent field plots under continuous flooding (CF), moderate water-saving irrigation (SW), and intensified water-saving irrigation (IW). Each irrigation treatment consisted of three independent experimental plots (n = 3). The three adjacent field sections were separated by 1.0 m-wide intervals, and individual plots within each section were separated by 0.6 m-wide boundaries. Purple circles indicate soil water tension monitoring locations, red stars indicate physiological measurement location.
Permanent sampling locations were established within each experimental plot before heading and remained unchanged throughout the grain-filling period. Representative rice plants in each plot were permanently tagged for repeated physiological and grain development measurements. Measurements obtained from multiple plants within the same plot were treated as subsamples and averaged to obtain a single plot-level value at each sampling date. Therefore, the three independent experimental plots, rather than individual plants or within-plot sampling locations, served as the biological replicates for statistical analysis (n = 3 per irrigation treatment).
2.3. Irrigation Management
During the first 10 days after transplanting (DAT), all plots were maintained at a water depth of approximately 2–3 cm to ensure seedling establishment. Thereafter, irrigation was managed according to the designated soil water tension threshold of each treatment. Soil water tension was continuously monitored using tensiometers (Model 6420, Spectrum Technologies Inc., Aurora, IL, USA) installed at a depth of 10 cm below the soil surface.
For the SW treatment, irrigation was applied whenever soil water tension reached −20 kPa, whereas irrigation for the IW treatment was triggered at −40 kPa. These thresholds were selected based on our previous unpublished field observations, in which soil water tensions of approximately −20 to −30 kPa generally allowed rice yield to be maintained, whereas more severe soil drying beyond −40 kPa was associated with a pronounced yield reduction. Accordingly, −20 kPa was selected to represent a moderate soil-drying threshold, while −40 kPa was used to represent an intensified soil-drying condition. After each irrigation event, water was applied until a water depth of approximately 2–3 cm was reached, after which irrigation was terminated, and the soil was allowed to dry naturally until the designated soil water tension threshold was reached again.
In contrast, the CF treatment was maintained under continuous flooding throughout most of the growing season. A water depth of approximately 2–3 cm was maintained during the vegetative stage and subsequently maintained according to conventional rice cultivation practices in Taiwan. Standard mid-season drainage was conducted during the maximum tillering stage, followed by re-flooding until approximately two weeks before harvest to facilitate grain maturation.
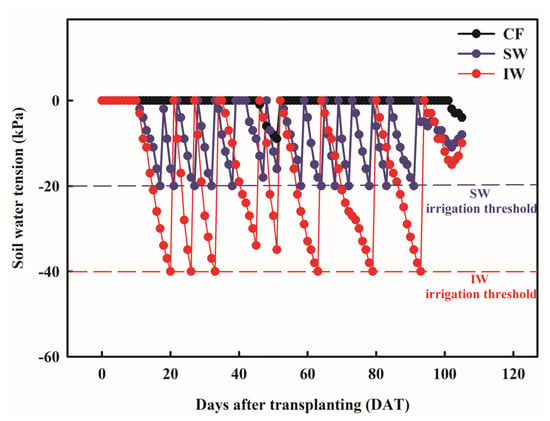
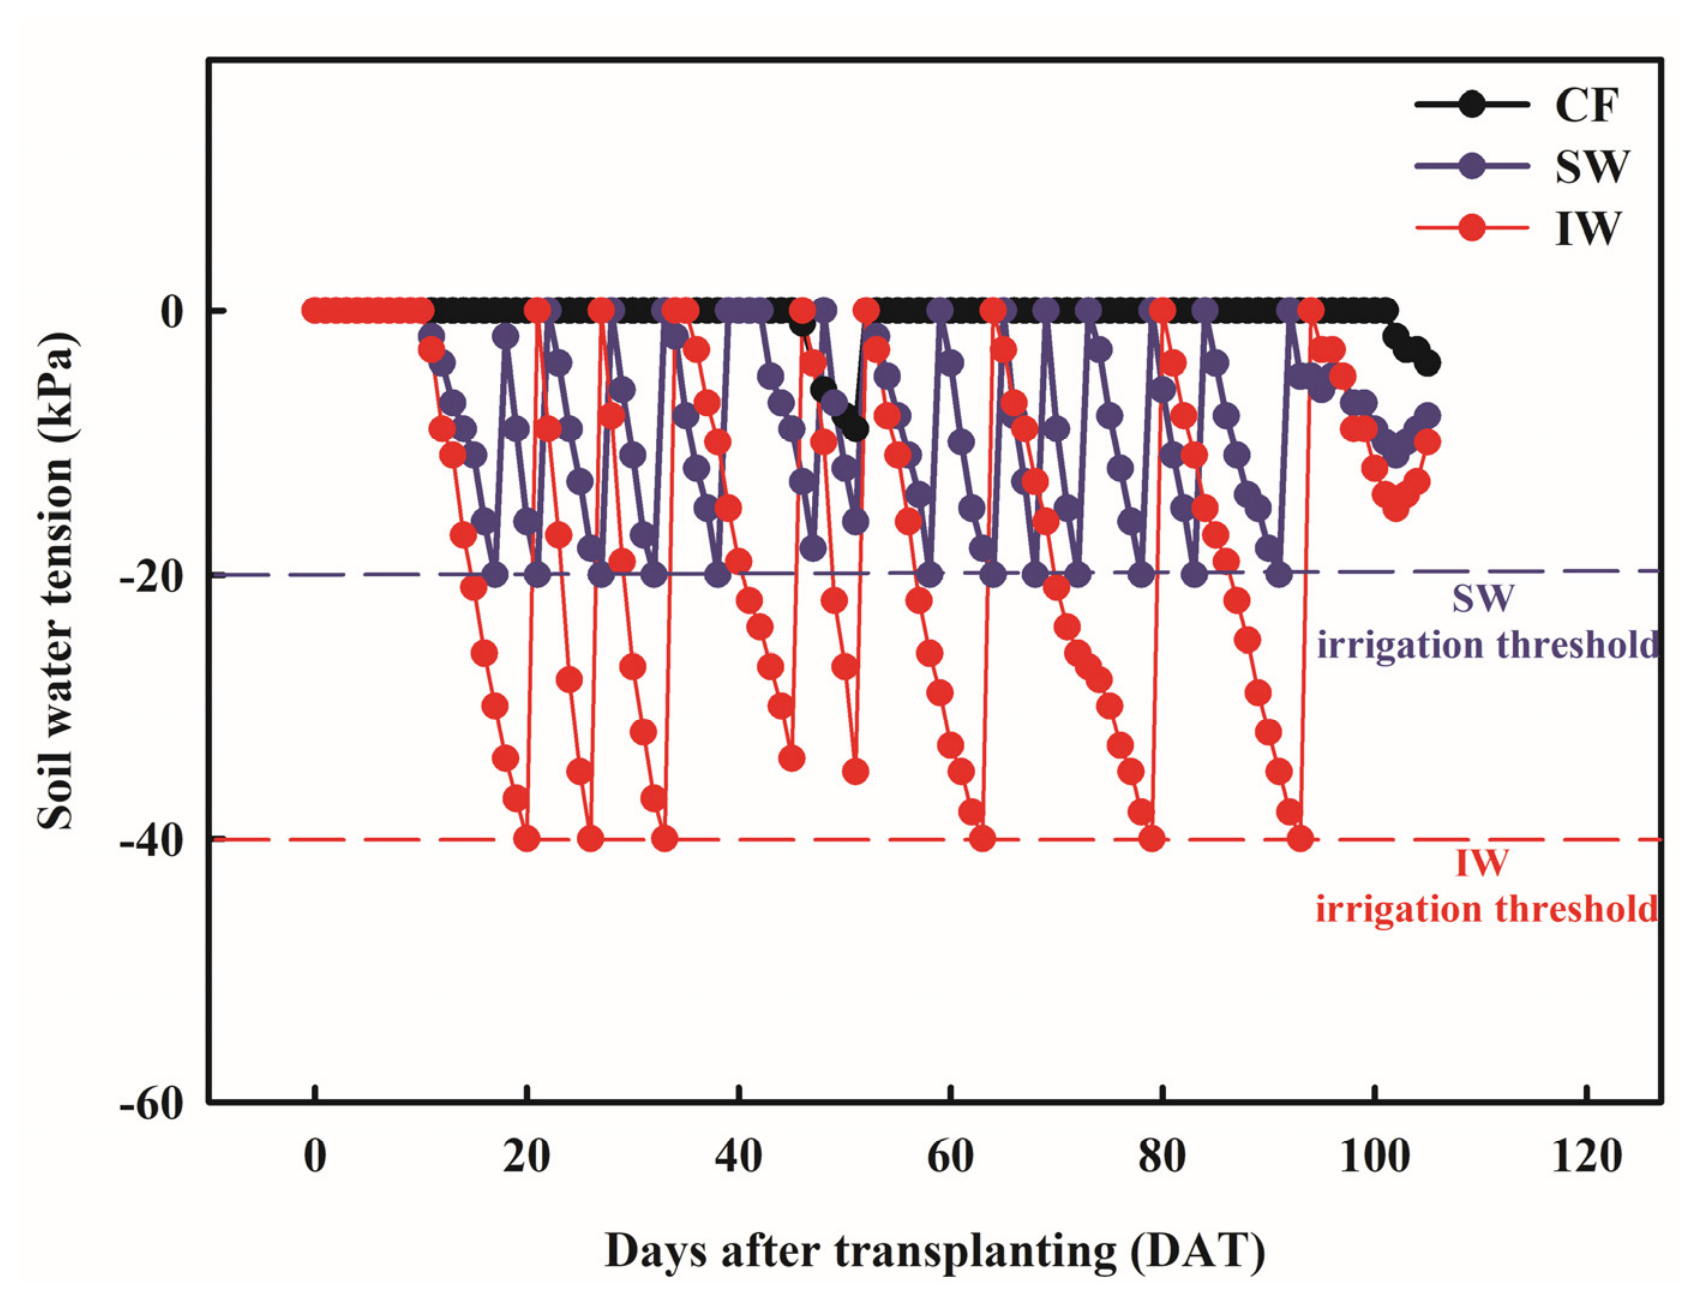
The temporal dynamics of soil water tension recorded during the experimental period are presented in Figure 3. The observed soil water tension patterns reflected the contrasting irrigation regimes, with SW and IW undergoing repeated drying and re-irrigation cycles according to their respective irrigation thresholds.
Figure 3.
Temporal dynamics of soil water tension under continuous flooding (CF), moderate water-saving irrigation (SW), and intensified water-saving irrigation (IW) throughout the rice-growing period. Soil water tension was monitored at a depth of 10 cm. Irrigation was triggered when soil water tension reached −20 kPa under SW and −40 kPa under IW, followed by re-irrigation to saturated conditions. CF was maintained under flooded conditions except during scheduled drainage periods.
2.4. Measurements of Flag-Leaf Physiological Traits
Flag-leaf physiological traits were evaluated throughout the grain-filling period by measuring flag-leaf relative chlorophyll content and net photosynthetic rate (A). Within each experimental plot, three permanent quadrats were established before the first sampling. At 0 days after flowering (DAF), five representative rice plants were randomly selected and permanently tagged within each quadrat, and the same plants were subsequently monitored throughout the grain-filling period. Thus, each experimental plot contained three permanent quadrats with five tagged plants per quadrat (15 plants per plot), and measurements were conducted at 0, 7, 14, 21, 28, and 35 DAF.
Leaf relative chlorophyll content was determined using a portable chlorophyll meter (SPAD-502 Plus, Konica Minolta, Osaka, Japan). Flag-leaf relative chlorophyll content measurements were performed on the flag leaf approximately 5–6 cm below the leaf tip, following the procedure described by Su et al. [10].
Net photosynthetic rate (A) was measured on the same flag leaf using a portable photosynthesis system (LI-6800, LI-COR Biosciences, Lincoln, NE, USA) on clear days between 09:00 and 12:00 h. Instrument settings included a flow rate of 200 μmol s−1, a reference CO2 concentration of 400 μmol mol−1, relative humidity of 60%, fan speed of 10,000 rpm, automatic temperature control, and an integrated LED light source providing a photosynthetic photon flux density (PPFD) of 200 μmol photons m−2 s−1, with approximately 90% red and 10% blue light. Measurements were recorded after gas exchange parameters had stabilized, and the average stable reading was used for subsequent analyses. The measurement procedures followed those described by Chen et al. [11] and Su et al. [10].
For each sampling date, measurements from the five tagged plants within each quadrat were first averaged to obtain a quadrat-level mean, and the three quadrat means within each experimental plot were subsequently averaged to obtain a single plot-level value. The quadrats and individual plants were therefore treated as subsamples, whereas the three independent experimental plots assigned to each irrigation treatment constituted the experimental replicates used for statistical analysis (n = 3). Because the same tagged plants were repeatedly measured throughout grain filling, the temporal dependence among sampling dates was accounted for using a repeated-measures analysis as described in Section 2.7.
2.5. Superior Grain Development
Superior grain development was evaluated throughout the grain-filling period using destructive sampling at 0, 7, 14, 21, 28, and 35 days after flowering (DAF). Within each experimental plot, three fixed sampling quadrats were established before heading. For each quadrat, 18 rice plants were designated in advance to provide three plants for destructive sampling at each of the six sampling dates. Thus, a total of 54 plants were designated in each experimental plot for grain development measurements.
Superior grains located on the primary rachis branches were selected because they generally flower earlier and exhibit more stable grain-filling characteristics than inferior grains [12,13]. At each sampling date, three plants were destructively sampled from each fixed quadrat, and superior grains at corresponding predefined positions on the primary rachis branches were consistently selected for morphological measurements.
Grain length (L), grain width (W), and grain thickness (T) were determined using a digital caliper (Bravo-u, Taoyuan City, Taiwan). Measurements obtained from the three sampled plants within each quadrat were averaged to obtain one quadrat-level value. The three quadrat-level values within each experimental plot were subsequently averaged to obtain a single plot-level value at each sampling date. Thus, the three independent experimental plots assigned to each irrigation treatment constituted the experimental replicates used for statistical analysis (n = 3).
To comprehensively characterize superior grain development, relative grain volume (RGV) was calculated as:
where L, W, and T represent grain length, grain width, and grain thickness, respectively. RGV was used as a relative developmental index to compare temporal changes in superior grain growth among irrigation treatments rather than as a direct measurement of true grain volume.
RGV(mm3) = L × W × T
For each sampled panicle, five superior grains at predefined corresponding positions on the primary rachis branches were measured. Measurements obtained from the three destructively sampled plants within each quadrat were averaged to obtain one quadrat-level value, and the three quadrat means within each experimental plot were subsequently averaged to obtain one plot-level value for statistical analysis.
At 35 DAF, quantitative morphological measurements could not be obtained for the IW treatment because natural grain shedding had resulted in an insufficient number of superior grains at the predefined sampling positions before the scheduled observation. Therefore, the IW data at 35 DAF were treated as missing values and were not replaced with zeros. Consequently, statistical comparison at 35 DAF was restricted to CF and SW. Although different plants were destructively sampled at each sampling date, measurements were summarized at the plot level, with the experimental plot serving as the experimental unit across sampling dates. The temporal structure of the plot-level observations was accounted for in the repeated-measures analysis described in Section 2.7.
Representative superior grains obtained from the same destructive sampling procedure were also observed using a stereomicroscope (SZN71, WenXin Instrument, New Taipei City, Taiwan) to qualitatively document grain developmental progression at each sampling date. Superior grains at corresponding predefined positions on the primary rachis branches were used to ensure consistency among irrigation treatments and sampling dates. The stereomicroscopic observations were used solely for qualitative illustration and were not included in the statistical analyses.
2.6. Yield and Water Productivity
At physiological maturity, grain yield and yield components were determined from three harvest quadrats (10 × 10 plants) established within each experimental plot. Sampling quadrats were located within each plot, and plants along plot margins were excluded to minimize potential border effects. Yield components, including effective tillers, fertility, and 1000-grain weight adjusted to 13% moisture content, were determined together with grain yield. Measurements obtained from each harvest quadrat were first summarized at the quadrat level, and the three quadrat-level values within each experimental plot were subsequently averaged to obtain a single plot-level value. Thus, the three independent experimental plots assigned to each irrigation treatment constituted the experimental replicates used for statistical analysis (n = 3). Grain yield was expressed on a hectare basis using the following equation:
where G is the grain number per unit area (no. m−2), and TGW is the thousand-grain weight (g per 1000 grains).
Irrigation water applied to each irrigation regime was measured throughout the growing season using water meters installed on the irrigation pipelines. Total irrigation water was calculated by summing all irrigation events during the growing season. Total water input was defined as the sum of cumulative irrigation water and precipitation recorded throughout the experimental period. Water productivity (WP) was calculated as follows:
where total water input represents the combined amount of cumulative precipitation and irrigation water applied throughout the rice growing season. Therefore, WP represents grain yield per unit of total water input rather than irrigation water productivity based solely on irrigation water.
2.7. Statistical Analysis
All statistical analyses were performed using SAS software (Version 9.4; SAS Institute Inc., Cary, NC, USA). The experimental plot was considered the experimental unit. Measurements from individual plants or sampling quadrats within each plot were treated as subsamples and averaged to obtain a single plot-level value, yielding three independent observations (n = 3) per irrigation treatment.
Temporal responses of flag-leaf relative chlorophyll content, A, grain morphological traits, and RGV were analyzed using repeated-measures linear mixed models. Irrigation treatment, sampling date (DAF), and their interaction were included as fixed effects, with experimental plot specified as the subject. Compound symmetry (CS), first-order autoregressive [AR(1)], and unstructured (UN) covariance structures were evaluated, and the structure with the lowest corrected Akaike information criterion (AICC) among successfully converged models was selected for each response variable. Degrees of freedom were estimated using the Kenward–Roger method. To identify treatment differences at individual sampling dates, one-way ANOVA followed by Tukey’s honestly significant difference (HSD) test was performed at p < 0.05.
For grain morphological traits and RGV, independent plants were destructively sampled at each DAF and averaged at the plot level before analysis. At 35 DAF, comparisons were restricted to CF and SW because quantitative measurements for IW were unavailable due to natural grain shedding. Yield components, grain yield, and WP were analyzed using one-way ANOVA followed by Tukey’s HSD test at p < 0.05 when treatment effects were significant.
Simple linear regression was used to examine associations between flag-leaf relative chlorophyll content and A, between A and RGV, and between RGV and final grain yield. The physiological and grain-development variables were based on plot-level measurements at 28 DAF, the latest sampling date with complete observations across all treatments. Each regression therefore included nine independent plot-level observations (n = 9). Regression equations, coefficients of determination (R2), and p-values were reported, and the relationships were interpreted as associations rather than evidence of causality.
3. Results
3.1. Temporal Changes in Flag-Leaf Physiological Traits During Grain Filling
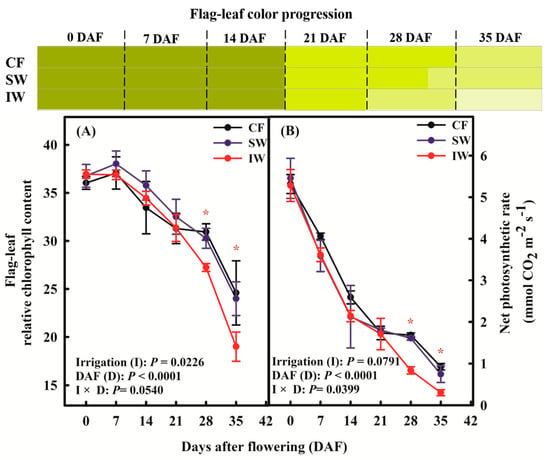
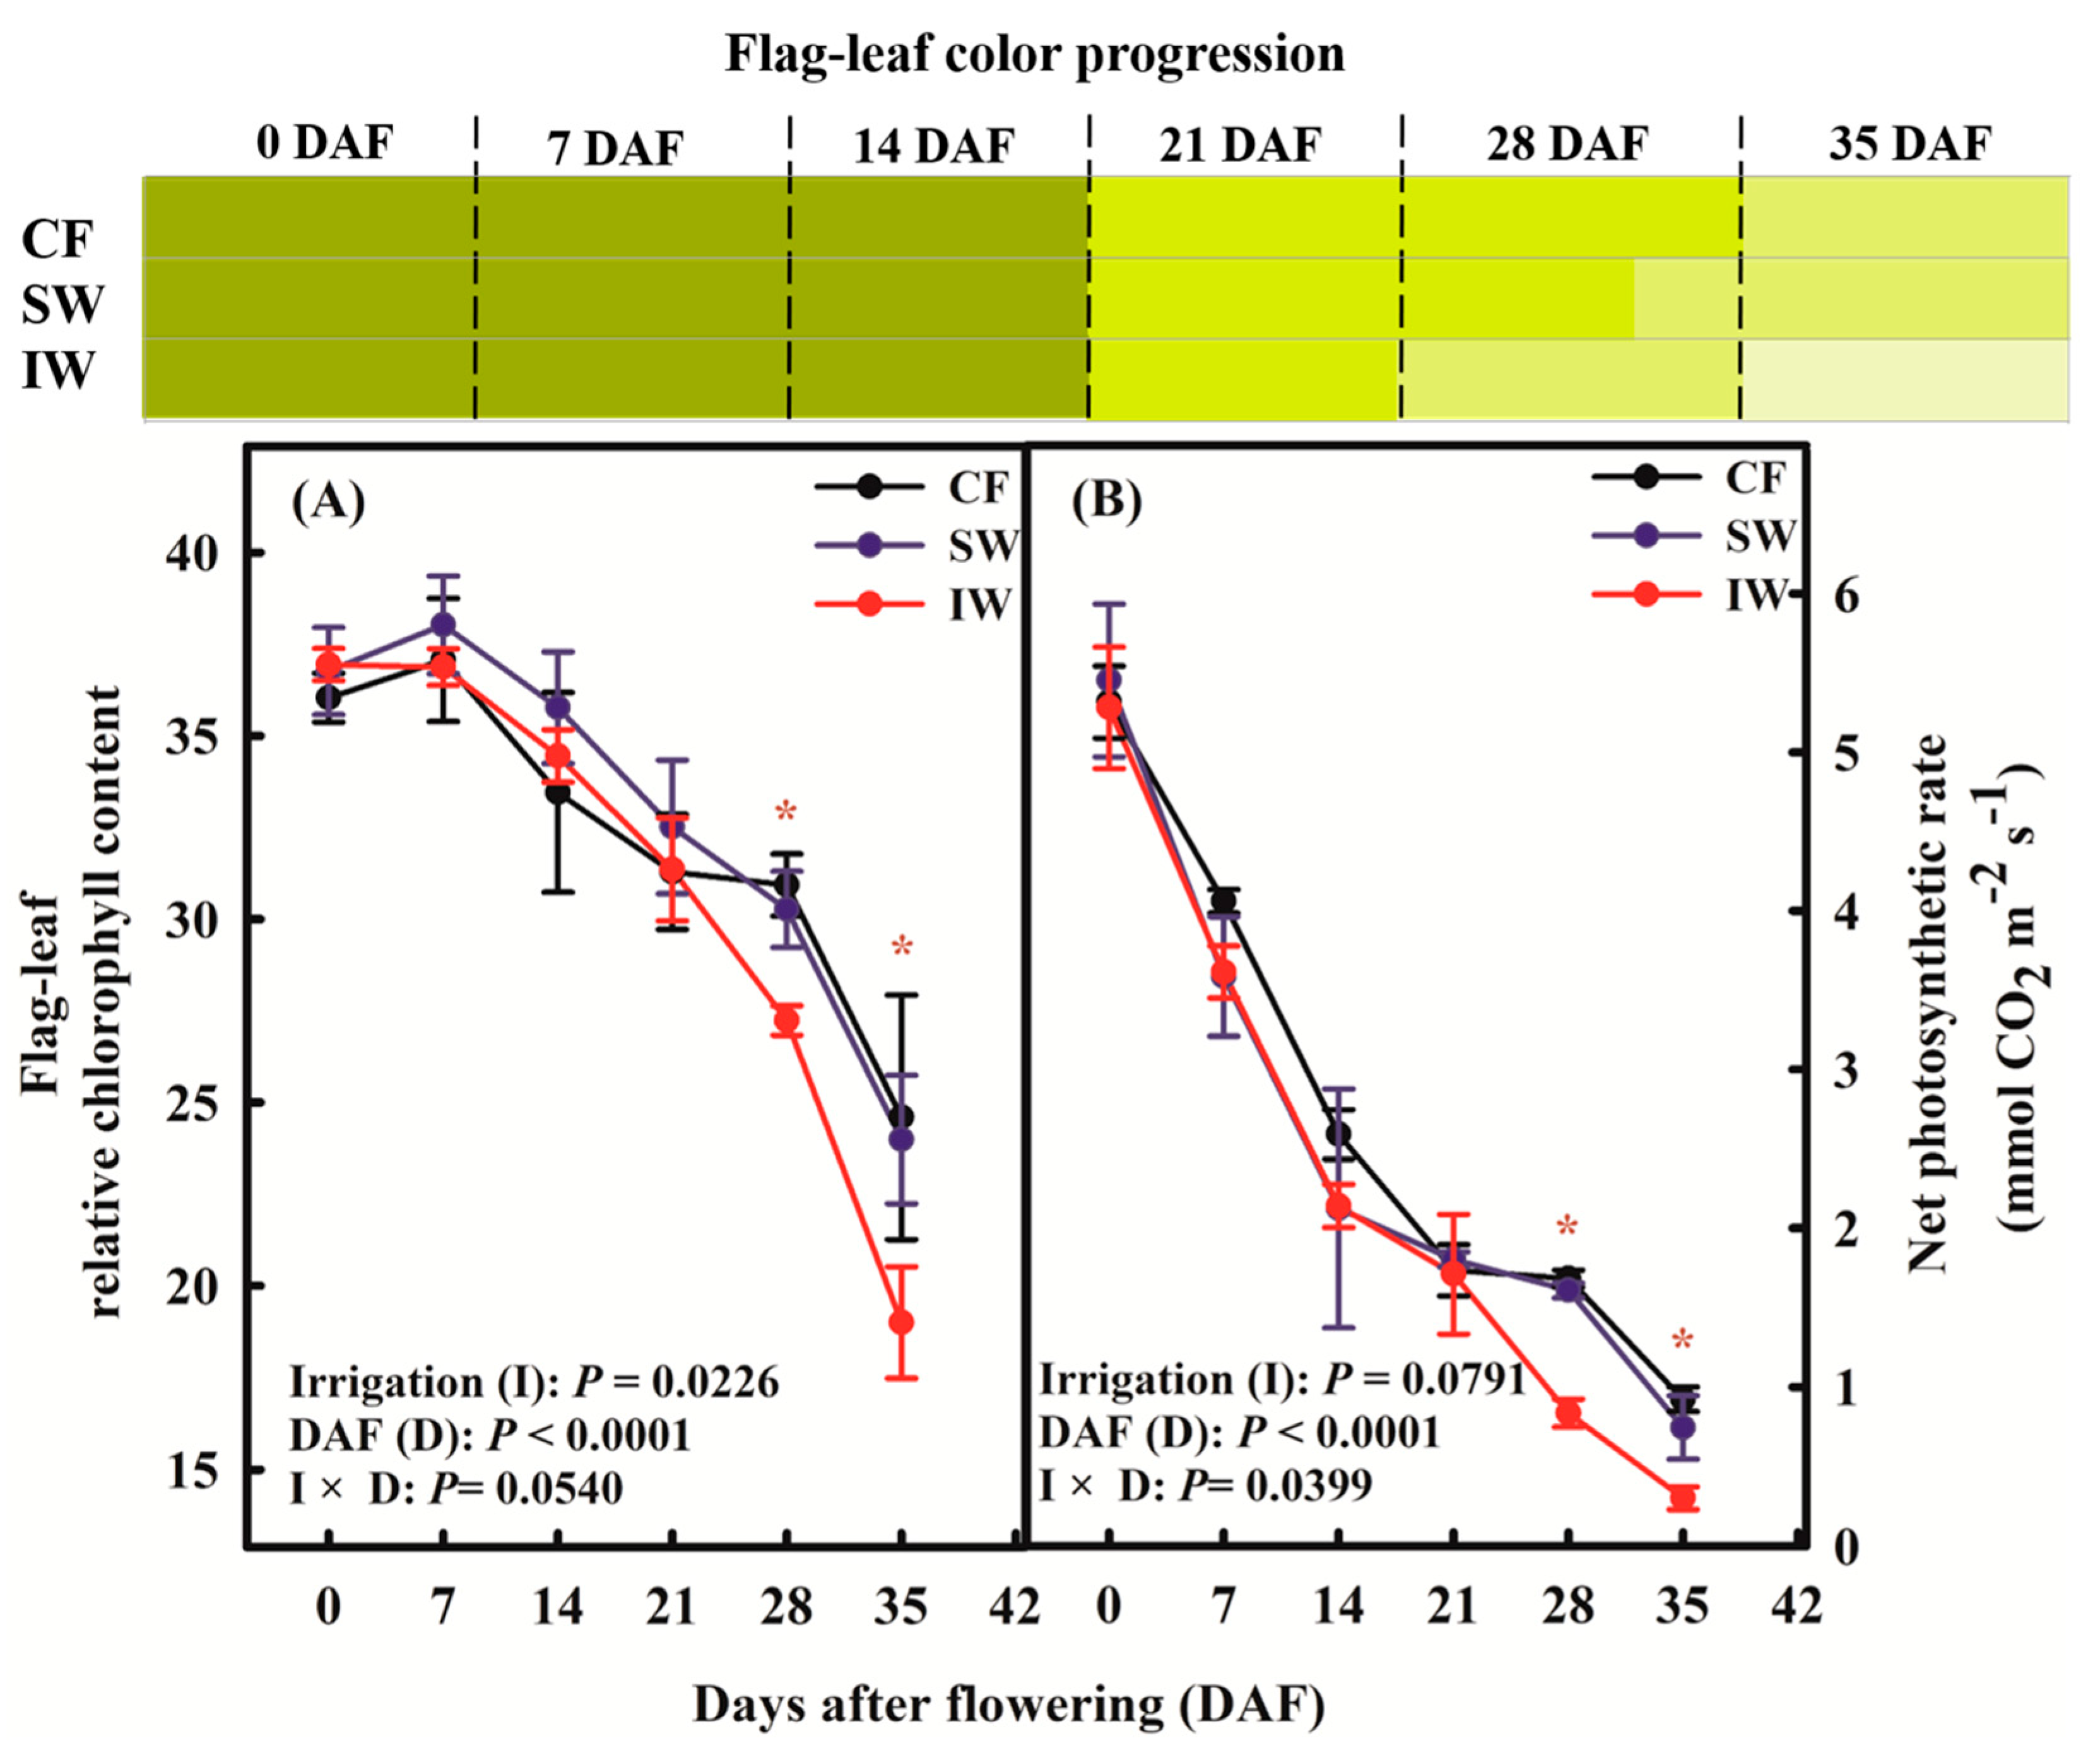
Temporal changes in flag-leaf relative chlorophyll content and net photosynthetic rate (A) under different irrigation regimes during grain filling are presented in Figure 4. Repeated-measures analysis showed significant effects of irrigation treatment (I; F = 5.63, p = 0.0226) and DAF (D; F = 98.10, p < 0.0001) on flag-leaf relative chlorophyll content, whereas the I × D interaction was not significant (F = 2.18, p = 0.0540) (Figure 4A). For net photosynthetic rate, DAF (F = 30.97, p < 0.0001) and the I × D interaction (F = 2.43, p = 0.0399) were significant, whereas the overall effect of irrigation treatment was not significant (F = 3.34, p = 0.0791) (Figure 4B).
Figure 4.
Temporal changes in flag-leaf physiological traits during grain filling under different irrigation regimes. (A) Flag−leaf relative chlorophyll content and (B) net photosynthetic rate (A). Data are presented as mean ± SE of three independent experimental plots (n = 3). The effects of irrigation regime (I), days after flowering (D), and their interaction (I × D) were evaluated using a repeated-measures linear mixed model. Differences among irrigation treatments within each sampling date were evaluated using one−way ANOVA followed by Tukey’s HSD test. The gradual transition from green to yellowish green represents the visual progression of leaf senescence under each irrigation treatment. * indicate significant differences among irrigation treatments at the same sampling date according to Tukey’s HSD test (p < 0.05).
Flag-leaf relative chlorophyll content gradually decreased throughout the grain-filling period under all irrigation treatments (Figure 4A). No significant differences among irrigation treatments were detected from 0 to 21 DAF (p > 0.05). At 28 DAF, IW exhibited significantly lower flag-leaf relative chlorophyll content than CF (p < 0.05), whereas SW did not differ significantly from either treatment. At 35 DAF, IW exhibited the lowest value (19.0), which was significantly lower than those of CF (24.6) and SW (24.0) (p < 0.05), while no significant difference was detected between CF and SW.
Net photosynthetic rate progressively declined throughout grain filling under all irrigation treatments (Figure 4B). No significant differences among irrigation treatments were detected from 0 to 21 DAF (p > 0.05). At 28 DAF, IW exhibited a significantly lower net photosynthetic rate than CF and SW (p < 0.05), whereas no significant difference was detected between CF and SW. The same pattern was observed at 35 DAF, with IW remaining significantly lower than CF and SW (p < 0.05), while CF and SW did not differ significantly.
3.2. Superior Grain Development During Grain Filling
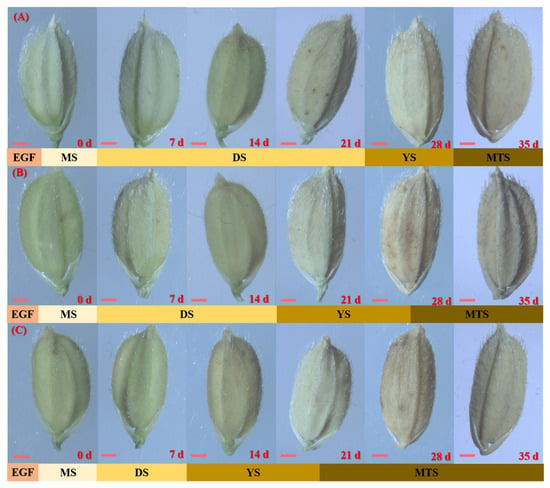
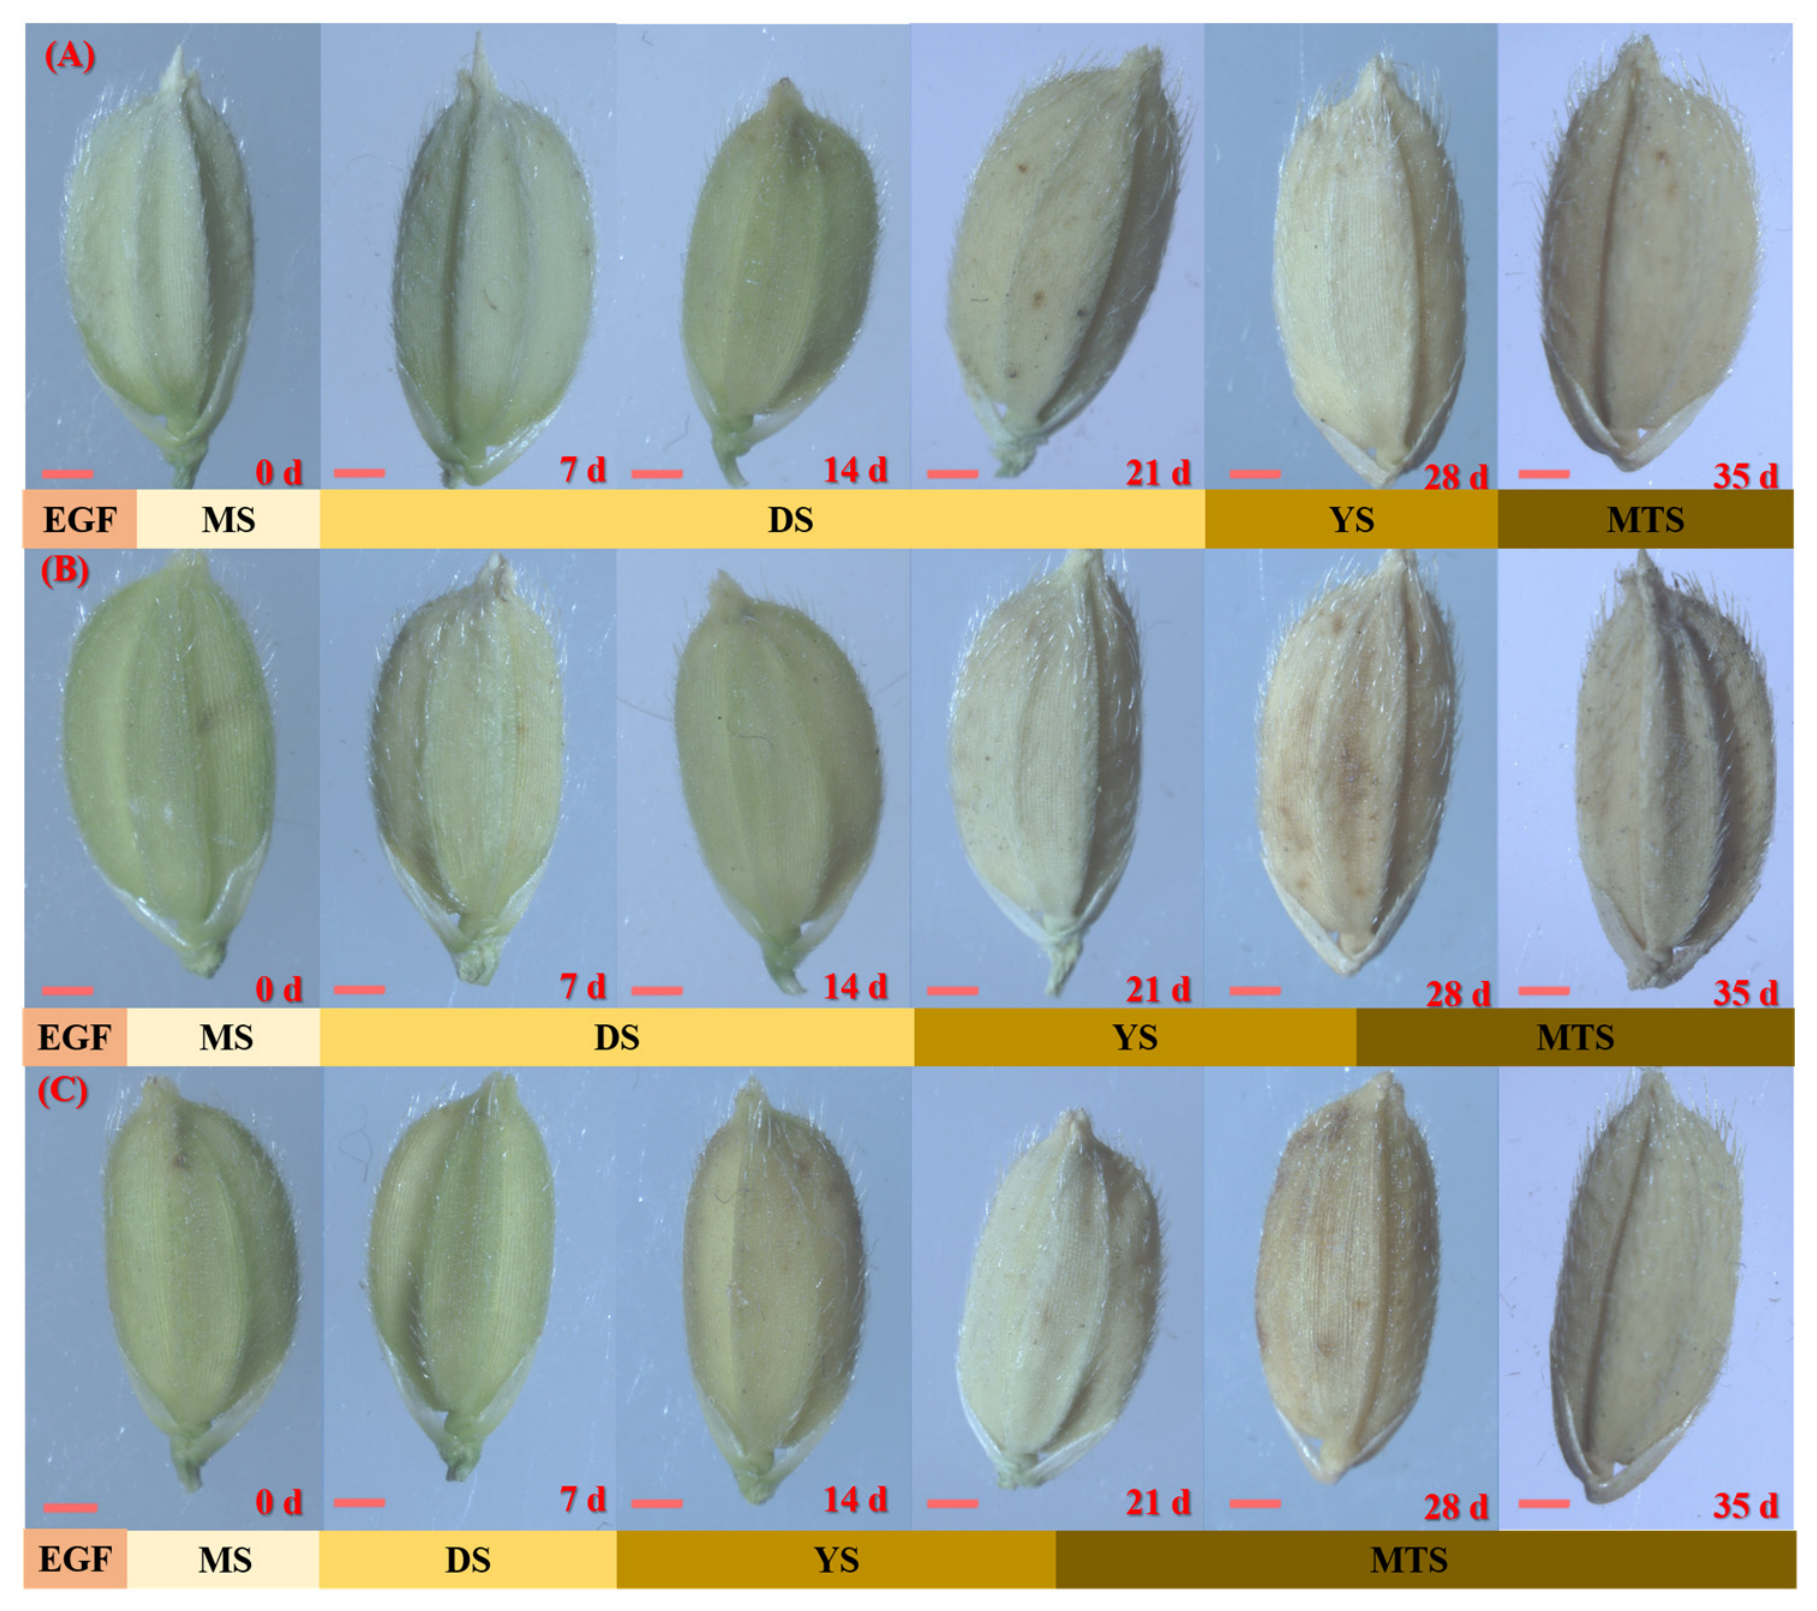
Changes in superior grain morphology during grain filling are summarized in Table 2, and representative stereomicroscope images are presented in Figure 5. Repeated-measures analysis indicated significant effects of DAF (D) and the irrigation × DAF interaction (I × D) on all grain morphological traits and RGV (Table 2). For grain length, the effects of DAF (F = 31.01, p < 0.0001) and I × D (F = 8.45, p < 0.0001) were significant, whereas the main effect of irrigation treatment was not significant (F = 3.00, p = 0.0689). For grain width, significant effects of irrigation (F = 7.88, p = 0.0033), DAF (F = 17.29, p < 0.0001), and I × D (F = 6.59, p < 0.0001) were detected. Grain thickness was also significantly affected by irrigation (F = 9.26, p = 0.0013), DAF (F = 10.96, p < 0.0001), and I × D (F = 6.82, p < 0.0001). Similarly, RGV showed significant effects of irrigation (F = 47.95, p = 0.0002), DAF (F = 158.08, p < 0.0001), and I × D (F = 65.14, p < 0.0001).
Table 2.
Temporal changes in the morphological characteristics and relative grain volume (RGV) of superior grains during grain filling under different irrigation regimes.
Figure 5.
Temporal changes in superior grain development during grain filling under different irrigation regimes. Representative stereomicroscope images were obtained at 0, 7, 14, 21, 28, and 35 days after flowering (DAF). (A) Continuous flooding (CF), (B) moderate water-saving irrigation (SW), and (C) intensified water-saving irrigation (IW). Grain developmental stages are indicated as early grain filling (EGF), milk stage (MS), dough stage (DS), yellow stage (YS), and mature stage (MTS). Orange bars represent a 1 mm scale. Quantitative measurements of grain length, grain width, grain thickness, and relative grain volume (RGV) are summarized in Table 2. The IW treatment was not included in the quantitative analysis at 35 DAF because natural grain shedding yielded too few superior grains for reliable measurement.
Grain length, width, thickness, and RGV generally increased as grain filling progressed, although the magnitude and temporal pattern of change differed among irrigation treatments. For RGV, no significant differences among irrigation treatments were detected at 0 or 7 DAF (p > 0.05). At 14 DAF, RGV did not differ significantly among CF (47.6 mm3), SW (52.9 mm3), and IW (53.2 mm3), despite the numerically higher values observed under SW and IW. At 21 DAF, RGV differed significantly among all three irrigation treatments, with SW exhibiting the highest value (61.5 mm3), followed by CF (49.4 mm3) and IW (45.5 mm3) (p < 0.05). At 28 DAF, CF (60.1 mm3) and SW (55.1 mm3) did not differ significantly from each other, whereas both treatments exhibited significantly greater RGV than IW (45.0 mm3) (p < 0.05). At 35 DAF, no significant difference in RGV was detected between CF (55.3 mm3) and SW (53.4 mm3). Quantitative morphological data were unavailable for IW because superior grains designated for sampling had undergone natural grain shedding before the scheduled observation; therefore, IW was treated as missing at 35 DAF and was excluded from the statistical comparison.
Representative stereomicroscope images in Figure 5 visually illustrate the progression of superior grain development from early grain filling to maturity under the three irrigation regimes. Differences among irrigation treatments became more apparent during the later grain-filling period, particularly under IW, and were consistent with the quantitative trends in grain morphology and RGV shown in Table 2.
3.3. Effects of Irrigation Management on Grain Yield and Water Productivity
The effects of irrigation regimes on yield components and grain yield are presented in Table 3, while irrigation water input and WP are summarized in Table 4.
Table 3.
Effects of different irrigation regimes on yield components and grain yield in rice.
Table 4.
Effects of different irrigation regimes on irrigation water input and water productivity (WP) in rice.
Grain yield differed significantly among irrigation treatments (Table 3). No significant difference was observed between CF (4550.7 kg ha−1) and SW (4545.0 kg ha−1), whereas IW produced a significantly lower grain yield (3694.4 kg ha−1) than both CF and SW (p < 0.05). Relative to CF, grain yield under IW was reduced by approximately 18.8%, while that under SW differed by less than 1%.
Significant differences were also observed in several yield components (Table 3). Effective tiller number was significantly lower under IW (23.8 plant−1) than under CF (28.0 plant−1) and SW (27.1 plant−1), whereas CF and SW did not differ significantly. Fertility was highest under CF (75.6%) and lowest under IW (58.4%), with SW (73.5%) intermediate. The 1000-grain weight ranged from 25.3 to 26.8 g. IW had a significantly lower 1000-grain weight than CF, whereas SW did not differ significantly from either CF or IW (p < 0.05).
Cumulative irrigation water input was 8271.4 m3 ha−1 under CF, 3521.4 m3 ha−1 under SW, and 3364.3 m3 ha−1 under IW (Table 4), corresponding to reductions of 57.4% and 59.3% under SW and IW, respectively, relative to CF. Irrigation frequency also differed between the two water-saving treatments, with SW receiving 14 irrigation events and IW receiving 8 irrigation events during the growing season. Cumulative precipitation during the experimental period was 4830.0 m3 ha−1 for all treatments. Accordingly, total water input was 13,101.4, 8351.4, and 8194.3 m3 ha−1 under CF, SW, and IW, respectively.
Water productivity differed significantly among irrigation treatments (Table 4). SW exhibited the highest WP (0.54 kg m−3), followed by IW (0.45 kg m−3) and CF (0.35 kg m−3), with significant differences among the three treatments (p < 0.05).
3.4. Associations Among Flag-Leaf Physiological Traits, Superior Grain Development, and Grain Yield
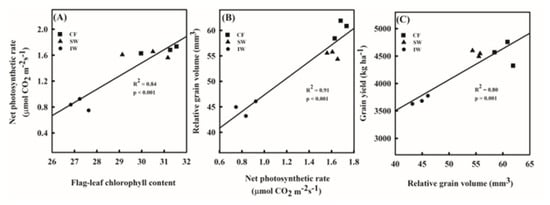
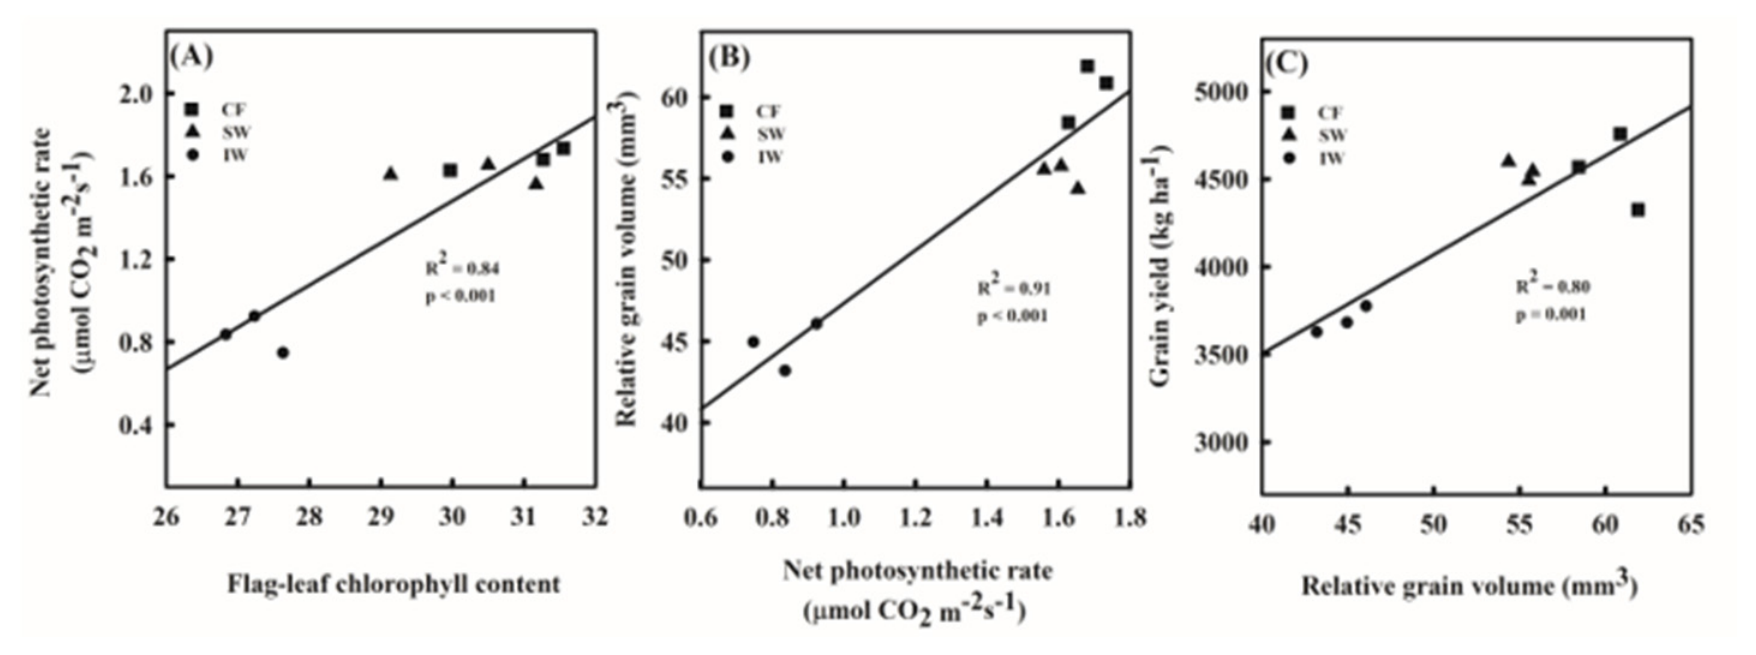
The associations among flag-leaf physiological traits, superior grain development, and final grain yield are presented in Figure 6. Regression analyses were based on plot-level observations of flag-leaf relative chlorophyll content, A, and RGV measured at 28 DAF, together with final grain yield determined at harvest (n = 9).
Figure 6.
Relationships among flag-leaf physiological traits, superior−grain development, and grain yield under different irrigation regimes. (A) Relationship between flag-leaf relative chlorophyll content and net photosynthetic rate; (B) relationship between net photosynthetic rate and relative grain volume (RGV); and (C) relationship between RGV and final grain yield. Flag-leaf relative chlorophyll content, net photosynthetic rate, and RGV were measured at 28 days after flowering (DAF), the latest sampling date for which complete observations were available across all three irrigation treatments. Final grain yield was determined at harvest. Each point represents an independent experimental plot, with three plots per irrigation regime (CF, SW, and IW; n = 9). Solid lines represent linear regression fits, and the corresponding regression equations, coefficients of determination (R2), and p-values are shown in each panel.
Flag-leaf relative chlorophyll content was positively associated with net photosynthetic rate (Figure 6A; R2 = 0.839, p < 0.001). Net photosynthetic rate was also positively associated with RGV (Figure 6B; R2 = 0.907, p < 0.001). In addition, RGV at 28 DAF was positively associated with final grain yield (Figure 6C; R2 = 0.800, p = 0.001).
Overall, the regression analyses showed consistent positive associations among flag-leaf relative chlorophyll content, net photosynthetic rate, superior grain development, and final grain yield across the nine experimental plots.
4. Discussion
4.1. Responses of Flag-Leaf Physiological Traits to Different Irrigation Regimes
Grain filling is a critical developmental stage during which maintenance of flag-leaf function contributes to the assimilate supply required for grain development. In the present study, flag-leaf relative chlorophyll content and net photosynthetic rate (A) declined progressively under all irrigation regimes as grain filling advanced, but their responses to irrigation differed. The absolute A values measured in this study were relatively low compared with values commonly reported for rice under high irradiance. The relatively low measured photosynthetic photon flux density (PPFD; 200 μmol photons m−2 s−1) likely contributed to these comparatively low A values because measurements were conducted well below light-saturating irradiance. Therefore, the A values reported here should be interpreted as net photosynthetic rates under the standardized low-light measurement condition rather than as light-saturated photosynthetic capacity. Relative chlorophyll content was significantly affected by irrigation and DAF, whereas the irrigation × DAF interaction was not significant, indicating overall treatment differences without sufficient evidence that the temporal pattern of chlorophyll decline differed among irrigation regimes. In contrast, A showed a significant effect of DAF and a significant irrigation × DAF interaction, whereas the main effect of irrigation was not significant. The significant interaction indicates that the response of A to irrigation depended on the stage of grain filling, with treatment differences becoming evident at 28 and 35 DAF.
Leaf senescence during grain filling involves changes in chlorophyll degradation, photosynthetic activity, and nutrient remobilization [14,15], and water deficit can accelerate this process and shorten leaf functional duration when stress becomes sufficiently severe [14,16]. In the present study, relative chlorophyll content differed among irrigation treatments at 28 and 35 DAF, with IW showing lower values than CF and SW, whereas SW maintained values comparable to CF during late grain filling. Although the irrigation × DAF interaction for relative chlorophyll content was not significant, these individual-date comparisons indicate that the lower chlorophyll status under IW became particularly apparent during the later sampling dates. A similar but statistically clearer stage-dependent response was observed for A. Photosynthetic rates did not differ significantly among irrigation treatments from 0 to 21 DAF but were significantly lower under IW than under CF and SW at 28 and 35 DAF. Thus, the progressive decline observed in all treatments reflects the normal age-related reduction in flag-leaf physiological activity during grain filling, whereas the greater late-stage reductions under IW were associated with intensified soil drying. Increasing water deficit can constrain photosynthesis through both stomatal and non-stomatal limitations [17]. However, because the present study did not quantify stomatal conductance and related biochemical characteristics, the specific processes responsible for the reduction in A under IW cannot be distinguished. Similarly, although hormonal signaling and oxidative processes have been implicated in drought-induced leaf senescence, we did not directly measure these mechanisms and therefore cannot confirm them as causes of the observed responses.
The plot-level regression analysis at 28 DAF further supported the relationship between chlorophyll status and photosynthetic activity. Flag-leaf relative chlorophyll content was positively associated with A (R2 = 0.839, p < 0.001; Figure 6A), indicating that plots retaining higher chlorophyll levels at this stage also tended to maintain greater photosynthetic activity. This association is consistent with previous reports linking delayed leaf senescence with prolonged photosynthetic function during grain filling [14,18]. Nevertheless, the regression represents an association across irrigation treatments and does not demonstrate that chlorophyll retention directly caused the maintenance of photosynthetic activity.
Collectively, moderate water-saving irrigation did not prevent the normal decline in flag-leaf physiological activity during grain filling. Instead, SW maintained late-stage chlorophyll status and net photosynthetic rate at levels comparable to CF, whereas IW showed greater reductions in both traits at later sampling dates. The physiological advantage of SW therefore appears to lie in avoiding the accelerated loss of flag-leaf function associated with more severe soil drying rather than in enhancing physiological activity above that under continuous flooding. These late-stage physiological responses provide a basis for examining their associations with superior-grain development in Section 4.2, while the underlying mechanisms regulating senescence and photosynthetic limitation require further direct physiological measurements.
4.2. Associations Between Flag-Leaf Physiological Traits and Superior Grain Development Under Different Irrigation Regimes
Superior grain development showed a clear temporal response to irrigation management. During early grain filling, RGV did not differ significantly among irrigation treatments at 0 and 7 DAF, whereas treatment differences became more pronounced as grain filling progressed. The significant irrigation × DAF interactions for grain length, width, thickness, and RGV indicate that the effects of irrigation on superior-grain development varied with grain-filling stage. At 21 DAF, SW exhibited the greatest RGV, whereas IW showed the lowest value. By 28 DAF, RGV under IW remained significantly lower than under CF and SW. These results indicate that intensified soil drying had relatively limited effects during early grain filling but became increasingly associated with restricted superior-grain development during the middle-to-late grain-filling period.
Grain filling depends on the availability of assimilates from current photosynthesis as well as reserves accumulated in vegetative tissues before anthesis [13,15,19]. Maintenance of photosynthetic activity during reproductive development can therefore contribute to the carbon supply available for grain growth. In the present study, the emergence of differences in superior-grain development broadly coincided with the later-stage physiological differences described in Section 4.1. The significant irrigation × DAF interaction for net photosynthetic rate indicates that the photosynthetic response to irrigation varied with grain-filling stage, with IW exhibiting lower values than CF and SW at 28 and 35 DAF. Flag-leaf relative chlorophyll content also showed lower values under IW during late grain filling, although its irrigation × DAF interaction was not significant. Together with the reduced RGV observed under IW during the middle-to-late grain-filling period, these patterns suggest a temporal association between maintenance of flag-leaf physiological activity and continued superior-grain development under reduced irrigation.
The plot-level regression analysis at 28 DAF provides additional support for this association. Net photosynthetic rate was positively associated with RGV (R2 = 0.907, p < 0.001; Figure 6B), indicating that plots with greater photosynthetic activity at this stage also tended to exhibit greater superior-grain development. This relationship is consistent with the established importance of assimilate availability for grain filling [13,15]. However, because the regression combined observations across irrigation treatments and was based on a single common sampling date, it should be interpreted as an association rather than evidence that higher photosynthetic rate directly caused greater grain expansion. Treatment-related differences may contribute to the observed relationship.
Carbon reserve remobilization and sink activity may also contribute to grain development under water-limited conditions. Stem non-structural carbohydrates can provide an additional carbon source for developing grains when current photosynthesis becomes insufficient, and previous studies have reported that water management can influence reserve mobilization and assimilate translocation during grain filling [13,15,19]. Similarly, the capacity of superior spikelets to utilize imported assimilates is an important determinant of grain filling [13,20]. These processes provide plausible physiological explanations for differences in grain development under contrasting water regimes. However, stem non-structural carbohydrates, assimilate translocation, nitrogen remobilization, and sink metabolic activity were not measured in the present study. Therefore, whether SW directly affected these processes cannot be determined from the present data.
Taken together, the temporal grain-development data and plot-level associations indicate that the principal difference between moderate and intensified water-saving irrigation emerged during the middle-to-late grain-filling period. SW maintained superior grain development broadly comparable to CF while substantially reducing irrigation input, whereas IW was associated with reduced late-stage flag-leaf physiological activity and restricted grain expansion. The significant stage-dependent responses of net photosynthetic rate and superior-grain morphological development support a temporal correspondence between flag-leaf physiological activity and superior-grain development, but do not demonstrate direct preservation of source–sink coordination. Further measurements of stem carbohydrate dynamics, assimilate translocation, and sink activity would be required to determine the mechanisms underlying this association.
4.3. Physiological Basis for Yield Maintenance Under Moderate Water-Saving Irrigation
The agronomic responses observed in the present study demonstrate a clear contrast between moderate and intensified water-saving irrigation. SW reduced irrigation water input by 57.4% relative to CF while maintaining a comparable grain yield (4545.0 vs. 4550.7 kg ha−1). Consequently, WP increased from 0.35 kg m−3 under CF to 0.54 kg m−3 under SW. In contrast, IW further reduced irrigation water input only slightly relative to SW (3364.3 vs. 3521.4 m3 ha−1), but grain yield decreased to 3694.4 kg ha−1. These results indicate that the agronomic benefit of water-saving irrigation depended on the intensity of soil drying, with moderate soil water tension providing substantial irrigation-water savings without a detectable yield penalty under the conditions of this experiment.
Although the seasonal irrigation inputs of SW and IW differed by only 157.1 m3 ha−1 (approximately 4.5%), cumulative irrigation volume alone does not fully represent the soil water conditions experienced by the crop. SW was re-irrigated at −20 kPa and received 14 irrigation events, whereas IW was allowed to dry to −40 kPa before re-irrigation and received only 8 irrigation events. Thus, despite similar cumulative irrigation inputs, the two treatments differed markedly in irrigation frequency and the intensity of soil drying between irrigation events, as reflected in the temporal soil water tension dynamics (Figure 3). These contrasting water-management patterns were associated with the stronger late-stage physiological decline and reduced grain development observed under IW, which coincided with its lower final grain yield.
The yield response was consistent with the observed differences in yield components and grain development. IW significantly reduced effective tiller number and fertility relative to CF and SW and also produced a lower 1000-grain weight than CF. In contrast, SW maintained these yield components at levels generally comparable to CF. The plot-level regression analysis further showed a positive association between RGV at 28 DAF and final grain yield (R2 = 0.800, p = 0.001; Figure 6C), indicating that plots with greater superior-grain development at this stage tended to achieve higher final grain yield. Together with the associations between flag-leaf relative chlorophyll content, net photosynthetic rate, and RGV shown in Figure 6A,B, these results are consistent with a linkage between maintenance of late-stage physiological activity, superior-grain development, and final productivity. However, these regressions represent associations across irrigation treatments and should not be interpreted as evidence of direct causal relationships.
Previous studies have similarly shown that appropriately controlled water-saving irrigation can improve water productivity without necessarily reducing rice yield, whereas more severe water deficits can impair reproductive development and yield formation [4,5,8]. The contrasting responses of SW and IW observed here further suggest that the magnitude of water deficit is critical. Maintaining the moderate soil water tension threshold of −20 kPa under SW was associated with late-stage flag-leaf physiological activity, superior-grain development, and final yield broadly comparable to CF, whereas the more severe soil drying imposed under IW (−40 kPa) was associated with reduced late-stage photosynthetic activity, restricted superior-grain development, and lower grain yield. In particular, the significant irrigation × DAF interactions for net photosynthetic rate and RGV indicate that irrigation responses varied with grain-filling stage, with differences becoming more evident during the later reproductive period. Similar trade-offs between water saving and crop performance have been reported under deficit irrigation and alternate wetting and drying systems [4,,11,21]. Thus, increasing the degree of soil drying does not necessarily yield a proportional agronomic benefit, because additional irrigation water savings may be offset by reductions in crop productivity.
From an agronomic perspective, these findings support the use of moderate soil water tension as a potential strategy for reducing irrigation requirements while maintaining rice productivity. Importantly, the present study does not directly demonstrate the mechanisms responsible for the observed relationships among leaf physiological activity, grain development, and yield. Processes such as stem non-structural carbohydrate remobilization, assimilate translocation, nitrogen redistribution, hormonal regulation, and sink metabolic activity were not quantified. Therefore, the present results should be interpreted as evidence of coordinated temporal responses among the measured physiological and agronomic traits rather than as a direct demonstration of source–sink coordination. Further studies incorporating these processes, together with independently replicated multi-season and multi-site experiments, will be necessary to determine whether the −20 kPa threshold and the associated responses are consistent across cultivars, soil types, and environmental conditions. Such multi-environment datasets could further integrate temporal soil water tension dynamics with meteorological variables, such as temperature and rainfall, soil characteristics, and crop physiological and yield responses. These integrated data could provide a basis for developing and validating predictive models to identify site- and environment-specific soil water tension thresholds rather than relying on a fixed threshold across production environments. In the longer term, such models could support sensor-based precision irrigation and climate-adaptive water management in rice production.
5. Conclusions
This study showed that moderate water-saving irrigation substantially reduced irrigation water input while maintaining rice grain yield under the conditions of this experiment. Compared with CF, SW reduced irrigation water input by 57.4% while maintaining a comparable grain yield, resulting in higher water productivity. In contrast, IW provided only a limited additional reduction in irrigation water input but was associated with significant reductions in grain yield and several yield components.
During grain filling, SW maintained late-stage flag-leaf relative chlorophyll content and net photosynthetic rate at levels generally comparable to CF, whereas greater reductions were observed under IW at 28 and 35 DAF. The significant irrigation × DAF interaction for net photosynthetic rate indicated that the response to irrigation varied with grain-filling stage, with treatment differences becoming evident during late grain filling. Superior-grain development also showed significant irrigation × DAF interactions, with differences among irrigation regimes becoming more apparent during the middle-to-late grain-filling period and IW exhibiting reduced RGV at 21 and 28 DAF. Plot-level regression analyses further showed positive associations among flag-leaf chlorophyll status, net photosynthetic rate, superior-grain development, and final grain yield. Collectively, these relationships indicate a temporal association between maintenance of late-stage leaf physiological activity, continued grain development, and yield formation, although they do not establish direct causal relationships or demonstrate source–sink coordination.
The contrasting responses between SW and IW further suggest that irrigation timing and frequency during the reproductive period may be important in addition to total seasonal irrigation input. In particular, the limited irrigation frequency under IW after heading coincided with the emergence of greater reductions in flag-leaf photosynthetic activity and superior-grain development during middle-to-late grain filling. Although the present experiment was not designed to independently separate pre- and post-heading irrigation effects, these results suggest that excessive restriction of water supply after heading should be avoided when implementing water-saving irrigation in rice.
Overall, the results indicate that moderate soil water tension can provide substantial irrigation water savings without a detectable yield penalty, whereas intensifying soil drying beyond this level may provide little additional water saving while increasing the risk of physiological and yield reductions. The −20 kPa threshold identified here should therefore be regarded as effective under the specific cultivar, soil, and environmental conditions of this experiment rather than as a universally optimal irrigation threshold. Further multi-season and multi-site studies incorporating direct measurements of assimilate translocation, stem carbohydrate remobilization, nitrogen redistribution, and sink activity are needed to determine the mechanisms underlying these responses and to evaluate the broader applicability of this irrigation strategy.ㄌ
Author Contributions
Conceptualization, C.-S.W., K.-Y.C. and T.-C.L.; methodology, C.-S.W. and K.-Y.C.; software, C.-S.W.; validation, C.-S.W. and T.-C.L.; formal analysis, C.-S.W.; investigation, C.-S.W.; resources, T.-C.L.; data curation, C.-S.W.; writing—original draft preparation, C.-S.W.; writing—review and editing, T.-C.L.; visualization, K.-Y.C. and T.-C.L.; supervision, T.-C.L.; project administration, K.-Y.C. and T.-C.L.; funding acquisition, T.-C.L. All authors have read and agreed to the published version of the manuscript.
Funding
This research received no external funding.
Data Availability Statement
The original contributions presented in this study are included in the article. Further inquiries can be directed to the corresponding author.
Conflicts of Interest
The authors declare no conflicts of interest.
References
- Mohidem, N.A.; Hashim, N.; Shamsudin, R.; Che Man, H. Rice for food security: Revisiting its production, diversity, rice milling process and nutrient content. Agriculture 2022, 12, 741. [Google Scholar] [CrossRef] [Scilit]
- Bwire, D.; Saito, H.; Mugisha, M.; Nabunya, V. Water productivity and harvest index response of paddy rice with alternate wetting and drying practice for adaptation to climate change. Water 2022, 14, 3368. [Google Scholar] [CrossRef] [Scilit]
- Mote, K.; Rao, V.P.; Ramulu, V.; Kumar, K.A.; Devi, M.U. Performance of rice (Oryza sativa (L.)) under AWD irrigation practice—A brief review. Paddy Water Environ. 2022, 20, 1–21. [Google Scholar] [CrossRef] [Scilit]
- Hu, T.H.; Wu, C.S.; Ting, W.Y.; Lin, T.C. Responses of grain yield, water use efficiency, and greenhouse gas emissions of rice to alternate wetting and drying irrigation. Water Supply 2025, 25, 1629–1643. [Google Scholar] [CrossRef] [Scilit]
- Yang, J.; Zhou, Q.; Zhang, J. Moderate wetting and drying increases rice yield and reduces water use, grain arsenic level, and methane emission. Crop J. 2017, 5, 151–158. [Google Scholar] [CrossRef] [Scilit]
- Çebi, U.; Özer, S.; Öztürk, O.; Aydın, B.; Çakır, R. Yield and water productivity of rice grown under different irrigation methods. J. Agric. Sci. 2023, 161, 387–397. [Google Scholar] [CrossRef] [Scilit]
- Du, S.; Zhang, Z.; Song, J.; Liu, M.; Chen, P.; Qi, Z.; Li, T.; Han, Y.; Xu, D. Water-saving irrigation and N reduction increased the rice harvest index, enhanced yield and resource use efficiency in northeast China. Agronomy 2024, 14, 1324. [Google Scholar] [CrossRef] [Scilit]
- Qi, D.; Chen, S.; Yue, W.; Duan, Y. Leaf senescence characteristics and economic benefits of rice under alternate wetting and drying irrigation and blended use of polymer-coated and common urea. Front. Plant Sci. 2024, 15, 1444819. [Google Scholar] [CrossRef] [Scilit]
- Yang, X.; Wang, X.; Li, Y.; Yang, L.; Hu, L.; Han, Y.; Wang, B. Effects of drought stress at the booting stage on leaf physiological characteristics and yield of rice. Plants 2024, 13, 3464. [Google Scholar] [CrossRef] [Scilit]
- Su, H.; Wang, W.; Lu, T.; Hu, W.; Lin, J.; Fu, W.; Liang, Y.; Zeng, Y.; Fu, G.; Xiong, J.; et al. Increased Photosynthetic Capacity and Energy Status Contribute to Higher Grain Yield in Early Rice. Int. J. Mol. Sci. 2025, 26, 1508. [Google Scholar] [CrossRef] [Scilit]
- Chen, K.; Ma, T.; Ding, J.; Yu, S.E.; Dai, Y.; He, P.; Ma, T. Effects of straw return with nitrogen fertilizer reduction on rice (Oryza sativa L.) morphology, photosynthetic capacity, yield and water–nitrogen use efficiency traits under different water regimes. Agronomy 2022, 13, 133. [Google Scholar] [CrossRef] [Scilit]
- Zhang, J.; Zhang, Y.Y.; Huang, S. Response of grain-filling rate and grain quality of mid-season indica rice to nitrogen application. J. Integr. Agric. 2021, 20, 1465–1473. [Google Scholar] [CrossRef] [Scilit]
- Yang, J.; Zhang, J. Grain filling of cereals under soil drying. New Phytol. 2006, 169, 223–236. [Google Scholar] [CrossRef] [Scilit]
- Lee, S.; Masclaux-Daubresse, C. Current understanding of leaf senescence in rice. Int. J. Mol. Sci. 2021, 22, 4515. [Google Scholar] [CrossRef] [Scilit]
- Yang, J.; Zhang, J. Grain-filling problem in ‘super’rice. J. Exp. Bot. 2010, 61, 1–5. [Google Scholar] [CrossRef] [Scilit]
- Hajibarat, Z.; Saidi, A. Senescence-associated proteins and nitrogen remobilization in grain filling under drought stress condition. J. Genet. Eng. Biotechnol. 2022, 20, 101. [Google Scholar] [CrossRef] [Scilit]
- Chaves, M.M.; Flexas, J.; Pinheiro, C. Photosynthesis under drought and salt stress: Regulation mechanisms from whole plant to cell. Ann. Bot. 2009, 103, 551–560. [Google Scholar] [CrossRef] [Scilit]
- Tao, Y.; Xu, Y.; Ye, C.; Zhu, J.; Xiao, D.; Liao, W.; Zhu, Y.; Chu, G.; Xu, X.; Wang, D. Exogenous N supply on N transportation and reuse during the rice grain-filling stage and its relationship with leaf color-changing parameters. Agronomy 2024, 14, 2321. [Google Scholar] [CrossRef] [Scilit]
- Fang, L.; Struik, P.C.; Girousse, C.; Yin, X.; Martre, P. Source–sink relationships during grain filling in wheat in response to various temperature, water deficit, and nitrogen deficit regimes. J. Exp. Bot. 2024, 75, 6563–6578. [Google Scholar] [CrossRef] [Scilit]
- Wakabayashi, Y.; Morita, R.; Aoki, N. Metabolic factors restricting sink strength in superior and inferior spikelets in high-yielding rice cultivars. J. Plant Physiol. 2021, 266, 153536. [Google Scholar] [CrossRef] [Scilit]
- Zhu, H.; He, X.; Wang, X.; Long, P. Increasing hybrid rice yield, water productivity, and nitrogen use efficiency: Optimization strategies for irrigation and fertilizer management. Plants 2024, 13, 1717. [Google Scholar] [CrossRef] [Scilit]

Disclaimer/Publisher’s Note: The statements, opinions and data contained in all publications are solely those of the individual author(s) and contributor(s) and not of MDPI and/or the editor(s). MDPI and/or the editor(s) disclaim responsibility for any injury to people or property resulting from any ideas, methods, instructions or products referred to in the content. |
© 2026 by the authors. Licensee MDPI, Basel, Switzerland. This article is an open access article distributed under the terms and conditions of the Creative Commons Attribution (CC BY) license.