


Abstract
To address unclear particle ejection behavior and poor spreading uniformity in reciprocating sweeping spreaders for agricultural UAVs, this study analyzed particle motion and optimized the key structural parameters of the sweeping disc. The particle–vane contact process was first analyzed to determine the forces acting on the particles and the evolution of particle velocity during contact, thereby clarifying the effects of vane structural parameters on particle ejection. Single-factor simulations based on the discrete element method (DEM) were then conducted to identify the vane groups and structural parameters that strongly affected particle deposition. Results indicated that vane groups 1 and 2 significantly affected lateral deposition distribution. Their width, spacing, and tilt angle were therefore selected as six factors for the subsequent response surface optimization. To overcome the limitations of the CV in capturing local peak variations, three supplementary evaluation parameters were introduced: peak consistency (PC), relative peak intensity (IP), and central filling ratio (RC), with PC and IP set as multi-objective optimization targets. After parameter optimization, insufficient deposition remained in the central region of the single-layer disc. A dual-layer vane structure with coordinated inner and outer vanes was therefore developed to further improve the particle deposition distribution. Field tests were conducted using an XAG P150 Agricultural UAV. The relative errors between the measured and simulated values of PC, IP, and RC were 3.15%, 6.08%, and 8.51%, respectively, while the CV decreased from 29.75% to 19.02%. These results can support the structural optimization of reciprocating sweeping spreading devices for agricultural UAVs and the improvement of spreading uniformity.
1. Introduction
Agricultural unmanned aerial vehicles (UAVs) are flexible, precise, and highly efficient. They have been widely used for seeding [1], fertilizing [2], feeding [3], and other agricultural operations [4,5,6]. Due to the characteristics of their non-contact operation, UAVs offer clear advantages in complex terrains like hills and wetlands [7,8,9]. However, compared with ground*based spreading equipment, UAV platforms have limited payload capacity and installation space, so the size and mass of spreading devices must be controlled more strictly. Low-altitude and high-speed operation also requires stable particle ejection and deposition [10,11]. Therefore, spreading devices need to combine effective ejection and uniform distribution with a lightweight and compact design, which makes structural design and parameter optimization more difficult [12].
Currently, centrifugal disc spreaders are still the most widely used configuration for UAV spreading in agriculture [13,14,15]. This design comes from ground-based fertilizing machinery and relies on high-speed disc rotation to generate centrifugal force, giving particles an initial radial velocity for dispersal [16]. Previous studies have examined centrifugal spreaders from the perspectives of particle motion, operating parameters, and structural modification [17,18,19]. Coetzee et al. [20] and Van Liedekerke et al. [21] developed discrete element method (DEM) models of fertilizer particle motion, which made it possible to visualize particle trajectories and deposition patterns. Wu et al. [22] combined DEM simulation with response surface methodology to study how flight height, disc rotational speed, and guide structure parameters affect spreading uniformity. Gao [23] used orthogonal tests to examine the effects of seed-metering speed, disc rotational speed, and flight velocity on spreading uniformity. In terms of structural optimization, Li et al. [24] added a retaining ring to change particle rebound trajectories and improve deposition uniformity. Wang et al. [25] developed a spreader for high-rate UAV fertilizer application by combining curved and straight vanes with raised guide structures; the design improved particle distribution through delayed release and collision-induced rebound. These studies indicate that particle motion analysis and structural parameter optimization can improve the performance of spreaders [26,27]. In addition to centrifugal disc spreaders, oscillating-tube and pneumatic devices have been developed to control particle transport and release direction. Chen et al. [28] proposed a UAV-mounted centrifugal oscillating-tube seeding device that distributes seeds laterally through an oscillating tube and an outlet distribution structure. Zhu et al. [29] designed and tested a UAV-based oscillating-tube broadcasting device and examined the effects of tube geometry and motion parameters on spreading performance. Song et al. [30] developed a pneumatic rice-seeding device for UAVs, using a fluted roller for seed metering and airflow through guide channels to transport seeds in different directions. They also conducted parameter optimization and experimental evaluation. These studies demonstrate alternative approaches to improving UAV spreading uniformity by modifying particle transport and release.
In recent years, a reciprocating sweeping spreader has been adopted for UAV granular material spreading [31,32]. Unlike a centrifugal disc that rotates continuously, this disc swings back and forth. The vanes divide the continuous particle stream into clusters and accelerate them during the sweeping motion. The ejected particles form a strip-shaped deposition pattern on the ground. An analysis of this configuration therefore needs to consider both particle-stream division and particle acceleration. However, systematic research on this device is still limited. It remains unclear how vane structural parameters change particle-cluster formation and the initial ejection state, and how these changes affect lateral deposition. Preliminary tests showed local particle accumulation and insufficient deposition in the central region. These observations indicate that local deposition features need to be considered alongside overall uniformity.
To address these issues, this study focuses on the reciprocating sweeping disc and examines the relationship between vane structural parameters, particle ejection characteristics, and the resulting deposition distribution. The main objective is to clarify how changes in vane width, spacing, and tilt angle affect particle-vane interaction, particle–cluster formation, and the initial ejection state. The study also examines how these changes are reflected in the lateral deposition pattern. A particle-motion model was first established to analyze the particle-vane interaction and ejection process. DEM simulations were then used to identify the vane groups and structural parameters with greater effects on particle deposition. The selected parameters were optimized using response surface methodology. Because the optimized single-layer disc still showed insufficient central deposition, a dual-layer vane structure was further introduced to improve central filling. Finally, field tests were conducted to evaluate the optimized design.
2. Materials and Methods
2.1. Device Structure and Operating Principle
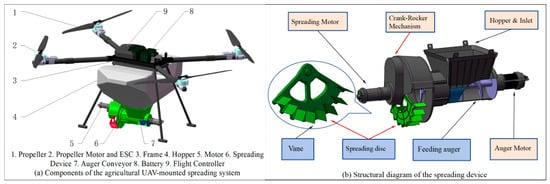
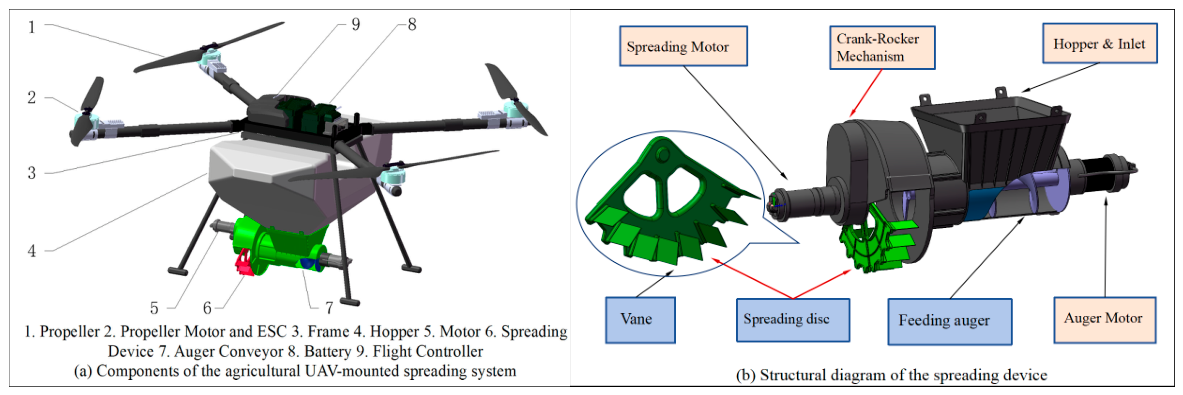
The overall structure of the UAV platform and reciprocating sweeping spreader is illustrated in Figure 1. The spreader mainly consists of a material feeding system and a reciprocating sweeping disc assembly. A hopper is connected to the upper part of the spreader, which is mounted beneath the UAV. Granular material is continuously conveyed into the sweeping disc region by a 250 mm long auger, and the feeding rate is controlled by the rotational speed of the auger motor. The reciprocating sweeping disc is the key component that determines particle ejection characteristics. The disc features a fan-shaped geometry, with several groups of straight vanes mounted vertically on its surface and arranged radially at specified intervals. The disc is driven by a motor through a crank-rocker mechanism. This mechanism converts the continuous rotation of the motor into high-frequency reciprocating motion of the disc for sweeping spreading.
Figure 1.
Overall view of the UAV and structural diagram of the sweeping spreading device.
The working principle of this device relies on the interaction between the particle stream and the vane structure during the sweeping process. The intervals between vane groups mechanically divide the continuous particle stream delivered by the auger into smaller particle clusters, achieving the initial dispersion of the particle flow. The particle clusters are accelerated by the vanes and ejected successively along the sweeping direction. They are deposited sequentially on the ground, where adjacent particle clusters connect end-to-end in the lateral direction, forming a continuous strip*shaped deposition band. As the UAV moves forward, the deposition strips are continuously extended along the flight direction, finally forming the spreading area. Therefore, optimizing the disc structure and improving particle deposition distribution are essential for enhancing the performance of the reciprocating sweeping spreader.
2.2. Design of Reciprocating Sweeping Disc and Analysis of Particle Motion
2.2.1. Disc Structural Design
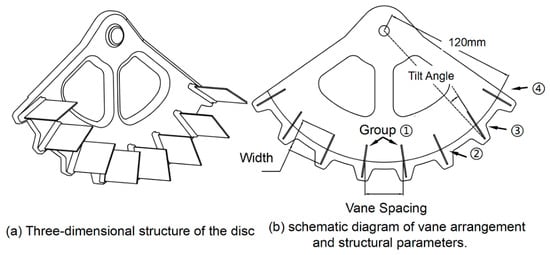
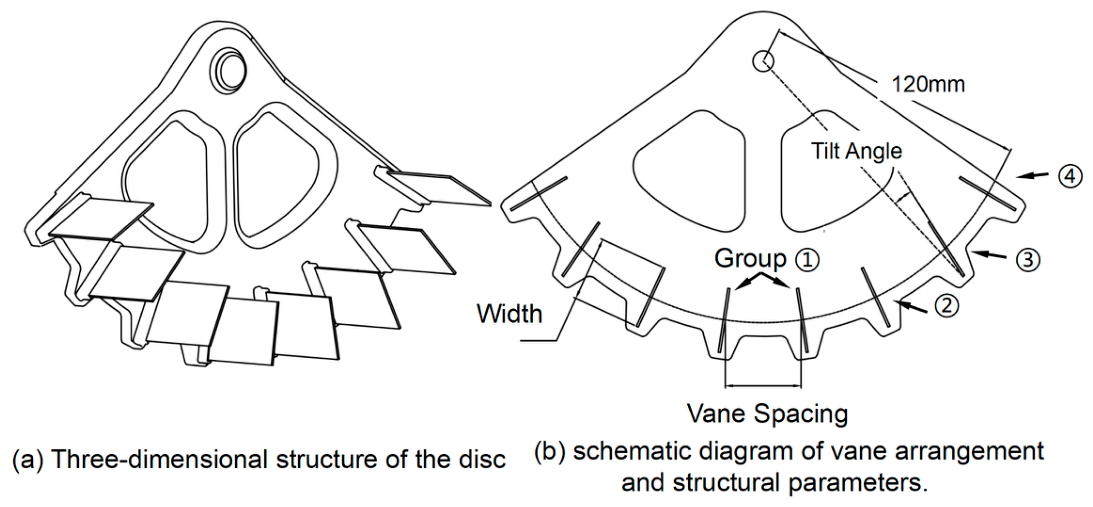
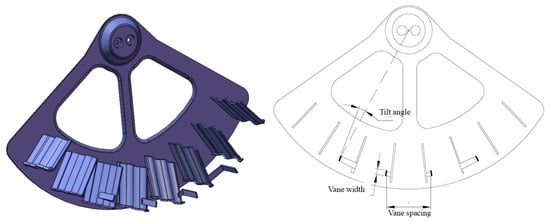
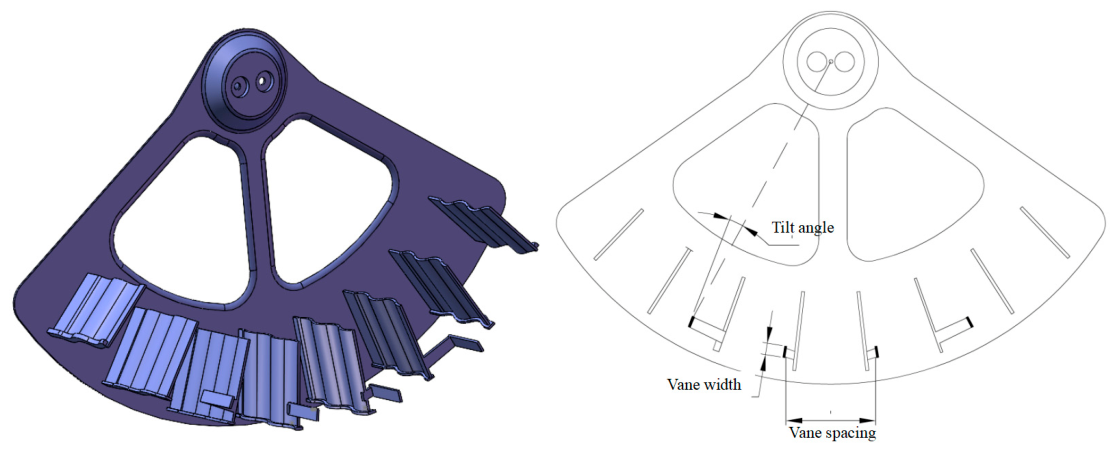
The structure of the reciprocating sweeping disc is illustrated in Figure 2. Given the symmetrical configuration of the disc, left and right vanes sharing identical radial positions are defined as a group. These groups are numbered in sequence from 1 to n according to their radial locations from the inner to the outer periphery (where n represents the total number of vane pairs on one side). To analyze how the vane structural parameters affect particle motion, the motion of particles on the disc was examined.
Figure 2.
Schematic diagram of the reciprocating sweeping disc. Numbers 1–4 denote the four vane groups, each consisting of a pair of symmetrically arranged vanes.
2.2.2. Particle Dynamics Analysis and Exit Velocity Formation Mechanism
- Dynamics Analysis
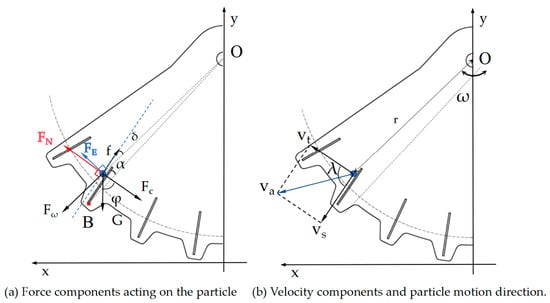
To elucidate the acceleration and ejection mechanisms of particles on the reciprocating sweeping disc, a force and velocity model was established using the vane surface moving with the disc as the reference frame. As illustrated in Figure 3, during its motion along the vane surface, the particle is subjected to the combined action of gravity (G), the normal support force from the vane (FN), friction force (f), centrifugal inertial force (Fω), Coriolis force (FC), and Euler inertial force (FE). Among these, the centrifugal inertial force stems from the radial inertial effect generated by the particle moving with the sweeping mechanism around the rotation axis; the Coriolis force arises from the relative sliding motion of the particle along the vane surface. The Euler inertial force results from the changing angular velocity of the disc and acts in the circumferential tangential direction at the particle position. Its direction changes with the angular acceleration.
Figure 3.
Force analysis of a particle moving along the vane surface.
When moving along the vane direction, the component of the centrifugal inertial force along the vane provides the main driving force for particle motion. The forces normal to the vane determine the particle–vane contact state and the magnitude of friction. According to the definitions of inertial forces [16], the centrifugal, Coriolis, and Euler inertial forces acting on the particle can be expressed as follows:
where m is the particle mass, ω is the instantaneous angular velocity of the disc, is the angular acceleration of the disc, r is the radial distance from the disc axis to the particle at the particle’s position, and Vs is the sliding velocity of the particle relative to the vane surface.
Fω = mω2r
FC = 2mωVs
To examine how vane geometry affects lateral particle ejection, particle motion during vane contact is analysed along the vane and in the normal direction.
Let O, B, and P denote the disc axis, vane end, and particle position, respectively, with R = OB and r = OP. The particle coordinate sp is measured along the vane towards B, with sp = 0 at B and sp < 0 before the particle reaches B. The fixed angle α and instantaneous angle δ are measured from the positive vane direction to OB and OP, respectively. The positive normal follows FN. Both angles and positive rotation are directed towards this normal. For the straight vane segment, the geometric relations are:
r(sp)cos δ(sp) = R cos α + sp
r(sp)sin δ(sp) = R sin α
Equations (4)–(6) determine the radial distance and projection angle from the particle position. At the vane end, sp = 0, r = R and δ = α. Applying Newton’s second law along the vane and in its normal direction gives:
FN = FC + mgcos φ + mω2rsin δ + FEcos δ
Both ω and its time derivative follow the prescribed rotation sign convention. The angle φ is the instantaneous angle from the negative normal direction to gravity, measured towards the positive vane direction, and is determined by the prescribed disc orientation. During outward sliding, f = μFN, where μ is the sliding friction coefficient. Substituting the inertial-force expressions, Equation (8), and the geometric relations into Equation (7) gives:
The contact stage starts with the initial conditions:
where t0 marks the start of sliding contact. The initial position and relative sliding velocity are s0 and u0, respectively. Equation (9) relates particle acceleration to vane geometry and disc motion. Subsequent simulations examine how vane width, spacing, and tilt angle affect particle deposition.
- 2.
- Ejection Velocity Analysis
A particle is released when it slides outwards past the vane end or loses normal support before reaching it. Early detachment occurs when the normal force required by Equation (8) reaches zero, and continued contact would require tension. The first event determines the release instant.
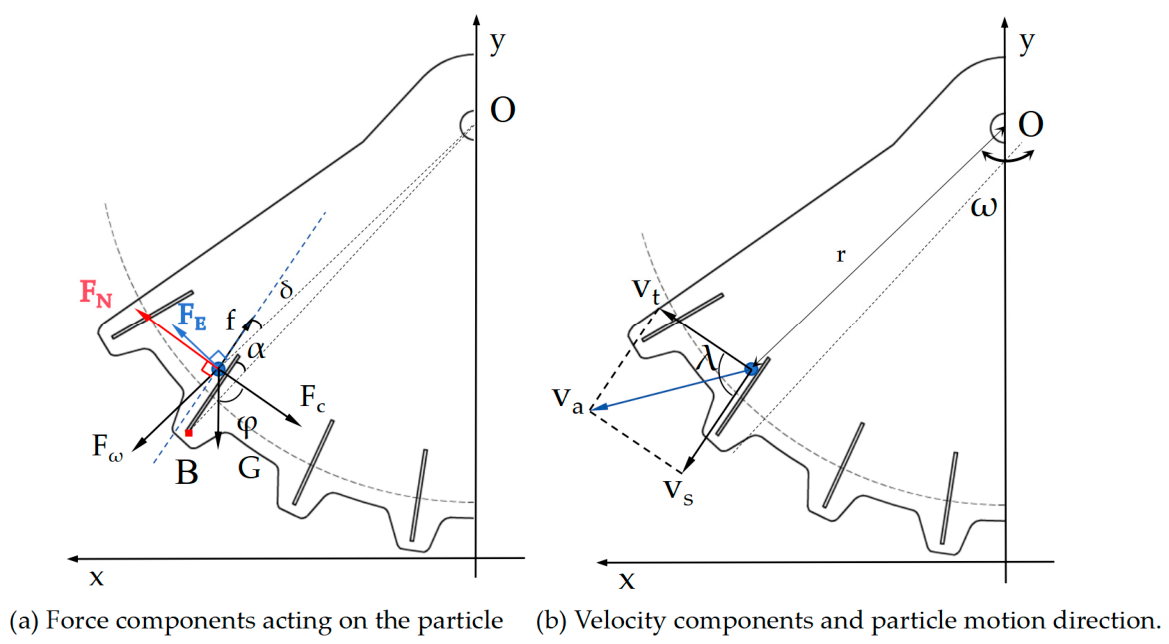
The relative and transport velocities are evaluated at this instant. Let Vs denote the relative sliding speed of the particle along the vane, and Vt the local tangential speed of the vane due to disc rotation. In a nonrotating frame translating with the disc axis, the release velocity is the vector sum of these two components:
Let the angle between Vs and Vt be λ; then the magnitude of the exit velocity is expressed as:
From the above dynamic and velocity analyses, the velocity vector of a particle at the instant it leaves the vane is an important parameter describing its ejection state. Its magnitude and direction are affected by the vane structure. Vane width affects the particle–vane contact range and the acceleration process. Vane spacing affects the segmentation of the continuous particle stream and the size of the resulting particle clusters. Vane tilt angle changes the force direction and the direction of particle ejection. Therefore, vane width, spacing, and tilt angle were selected as the structural factors for the subsequent simulation and optimization tests.
3. Spreading Simulation Tests
The UAV spreading process can be divided into three stages: particle ejection, aerial trajectory motion, and ground deposition. This study focuses on the effect of the spreading device on particle motion and examines how vane structural parameters affect particle ejection and deposition distribution.
3.1. DEM Model of the Reciprocating Sweeping Spreader
To investigate the effects of the sweeping disc structure on particle ejection and deposition, a DEM model was established in EDEM 2023. A simplified three-dimensional model of the spreading device was first created in SolidWorks 2023 and imported into EDEM. A compound fertilizer particle model was then established. The Hertz-Mindlin (no-slip) contact model was used for particle-particle, particle-disc, and particle--ground interactions, and a standard rolling friction model was used to account for rolling resistance. Some material properties were adopted from relevant literature, while the remaining fertilizer properties and the fertilizer–fertilizer and fertilizer-disc contact parameters were determined through experimental measurements and calibration. Comparisons between simulated and experimental results were used to assess the model’s reliability. The adopted parameters are listed in Table 1 [26,33,34].
Table 1.
Parameters of the simulation model.
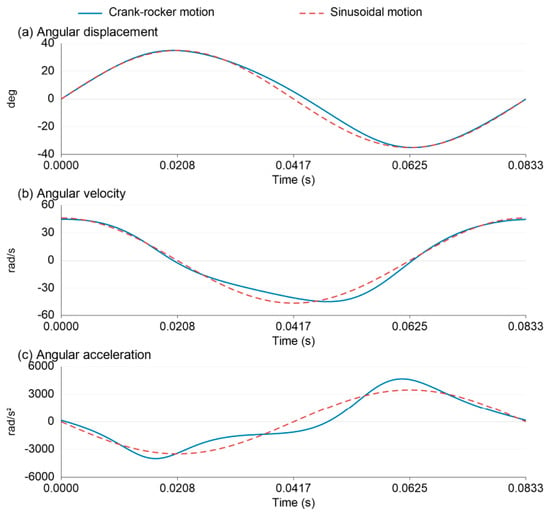
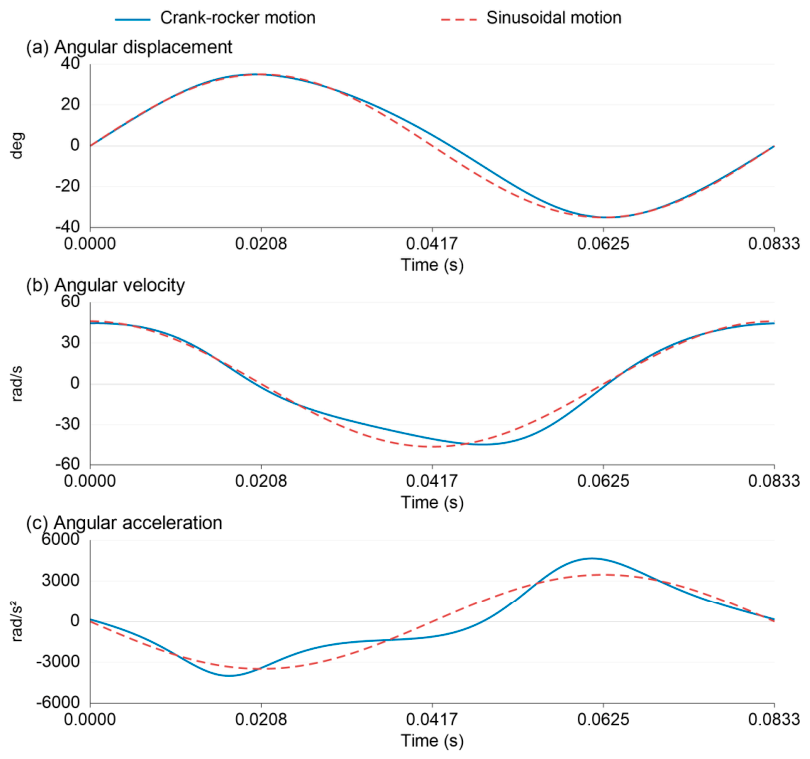
Model simplification is an important step in improving computational efficiency. To simplify the DEM simulations, prescribed sinusoidal motion in EDEM was considered as an approximation to the disc motion generated by a crank-rocker mechanism. A supplementary kinematic analysis was therefore conducted to compare the angular displacement, angular velocity, and angular acceleration of the newly proposed crank-rocker configuration with those of a sinusoidal reference having an angular amplitude of 35° and a frequency of 12 Hz (Figure 4). Both motions were aligned at their positive-going angular midpoint crossings, with the same time alignment retained for angular velocity and acceleration. The two motions had the same oscillation period and closely matched displacement amplitudes. Over one complete cycle, the mean absolute errors in angular displacement, angular velocity, and angular acceleration were 1.448°, 3.260 rad/s, and 617.73 rad/s2, respectively. Normalized by the corresponding peak absolute values of the sinusoidal reference, these errors were 4.14%, 7.08%, and 17.78%.
Figure 4.
Comparison between the calculated motion of the proposed crank-rocker configuration and the sinusoidal reference at 12 Hz.
To assess the effect of the motion simplification on deposition performance, a separate DEM comparison was conducted using the same spreading-disc geometry under the original crank-rocker motion and the sinusoidal input. Under the tested conditions, the absolute difference in deposition CV did not exceed 0.75 percentage points, indicating a limited effect of the simplification on this response.
Given the study’s focus on deposition uniformity and the limited change in deposition CV observed in this comparison, sinusoidal motion was adopted as a computationally efficient approximation for the DEM simulations. The disc was prescribed to oscillate about its central axis with an angular amplitude of 35° and a frequency of 12 Hz. Its angular displacement is expressed as:
where θ(t) is the instantaneous sweep angle of the disc, the angular amplitude of 35° corresponds to 35π/180 ≈ 0.611 rad. At a sweeping frequency of 12 Hz, the angular frequency is 2πf = 24π rad/s.
θ(t) = 0.611sin(24πt)
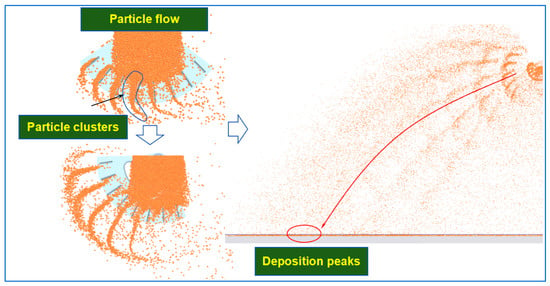
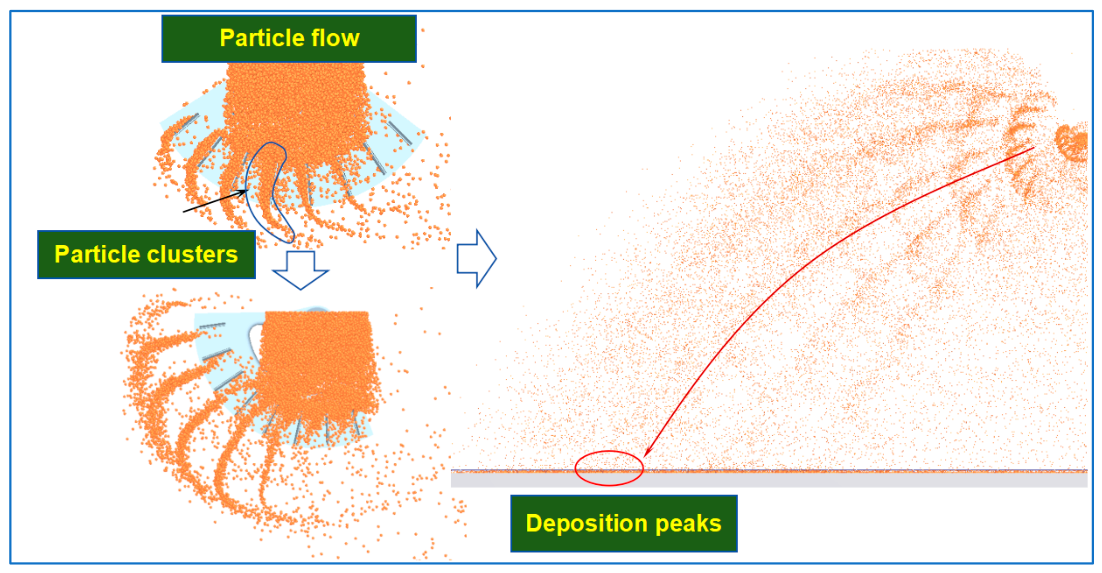
The working altitude was set to 3.5 m to mimic field conditions. To improve the statistical accuracy of landing locations and reduce ground rebound effects, we set the ground’s coefficient of restitution to 0.01 and the friction coefficient to 0.99. This suppressed secondary bouncing and rolling after particles landed. The particle generation rate was set at 1.5 kg/s, and the simulation ran for 3 s. Figure 5 shows how the continuous particle stream is divided by the vanes into discrete clusters, which then connect on the ground into a strip-shaped deposition pattern.
Figure 5.
Visualization of particle cluster formation and deposition peak distribution in the simulated spreading process.
3.2. Evaluation Metrics and Measurement Methods
3.2.1. Data Collection and Processing Methods
In the EDEM post-processing module, the Grid Bin Group feature was employed to establish a data collection grid matrix. To balance data stability and field sampling, the sampling area was divided into 300 mm × 300 mm square cells, covering the entire effective swath width. After the simulation, particle counts in each cell were extracted and fitted to produce lateral deposition distribution curves.
3.2.2. Evaluation Metrics
General Evaluation Metric: Spreading Coefficient of Variation
The coefficient of variation (CV) for spreading uniformity was utilized to quantify the fertilizer distribution uniformity across the effective swath width [35]. The formula is as follows:
where xi is the deposition mass in the i-sampling zone; is the sample mean; S is the standard deviation; n is the total number of sampling zones; and CV is the coefficient of variation for spreading uniformity.
Evaluation Parameters for Deposition Characteristics
- (1)
- Applicability of the CV Metric
The CV is a common metric for spreading uniformity; it reflects the overall data dispersion within the effective spreading width. However, the lateral deposition pattern produced by reciprocating sweeping usually shows multiple peaks and insufficient deposition in the central region. The CV cannot adequately describe these local distribution differences.
- (2)
- Deposition Characteristics and Evaluation Parameters
Preliminary tests showed that the particle deposition pattern produced by reciprocating sweeping exhibited a distinct M-shaped multi-peak profile. Multiple peaks and valleys appeared on both sides of the distribution, while deposition in the central region was relatively low. To quantitatively characterize these distribution features, peak consistency (PC), relative peak intensity (IP), and center filling ratio (RC) were introduced.
① Peak consistency. Peak consistency (PC)was defined in this study based on the relative standard deviation of representative deposition peak values to evaluate the consistency of peak heights in the lateral deposition distribution. The effective swath is evenly divided into 10 sections along the width direction, and the maximum value in each section is taken as its peak value. The relative standard deviation of these representative peak values is then calculated as PC. A smaller PC value indicates greater consistency among the peak heights.
where Hj is the peak value of the jth section; is the mean of the 10 peak values; and m = 10.
② Relative peak intensity. This parameter characterizes the prominence of deposition peaks relative to the overall mean deposition level. A smaller IP value signifies less prominent deposition peaks and reduced local particle accumulation.
where is the mean of the peak values from the 10 sections, and is the mean of all sampling points.
③ Central filling ratio. This parameter evaluates the particle deposition level in the central region of the spreading swath. A larger RC indicates a higher degree of central filling.
where is the mean of the 10 sampling values in the central region of the spreading swath, is the mean of all sampling points.
3.3. Design of Simulation Experiments
3.3.1. Single-Factor Experiments
Experimental Methods
(1) This study adopted a single-factor experimental design method, conducting simulation experiments following the strategy of vane configuration selection followed by structural parameter analysis.
(2) Vane number screening. First, taking the vane number as the variable, gradient experiments were conducted within the range of 6 to 10 vanes to determine the optimal quantity balancing spreading uniformity and structural lightweight design.
(3) Structural parameter analysis. After the vane number was determined, the width, spacing, and tilt angle of each vane group were examined group by group. In each test, only the parameters of the i-vane group were adjusted while keeping those of the remaining groups at their baseline values, thereby screening out the critical groups and parameter ranges that significantly affect spreading performance. The level gradients for each experimental factor are presented in Table 2.
Table 2.
Structural parameters and test levels for performance testing.
Single-Factor Simulation Results
Figure 6 presents the lateral deposition distribution of fertilizer particles. Overall, the particles show a strip-shaped distribution, but non-uniform features are still evident within the effective swath width: a low-deposition region appeared near the center, and periodic peaks and valleys formed on both sides. Analysis indicated that particle clusters, released at intervals by the vanes, produced deposition peaks on the ground. If the deposited clusters were spaced too closely, they overlapped and accumulated locally; if spaced too far apart, the deposition strip became discontinuous.
Figure 6.
Lateral distribution of fertilizer particle deposition on the ground surface.
- (1)
- Effect of vane number on spreading uniformity
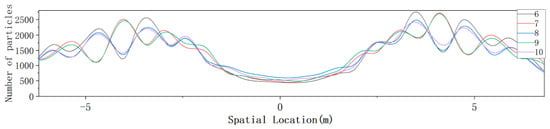
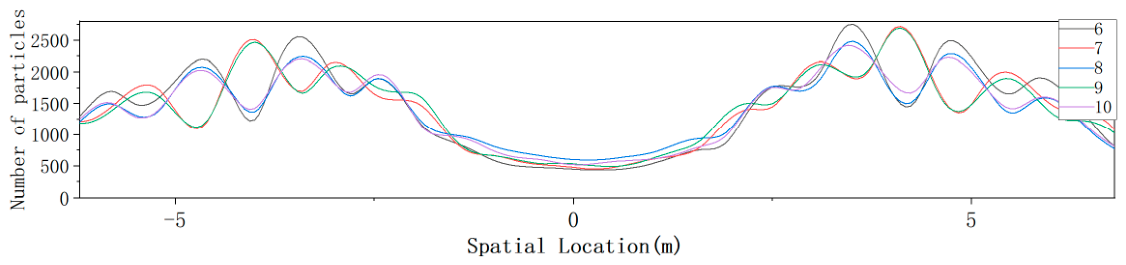
Figure 7 shows that increasing the vane number from 6 to 8 gradually flattens the lateral deposition distribution, reduces peak-to-valley differences, and improves spreading uniformity. When the vane number was further raised to 9 and 10, the deposition curves largely overlapped with those for 7 and 8 vanes, meaning that additional vanes brought only marginal gains in uniformity. Considering both spreading uniformity and the need for a lightweight structure, we selected an 8-vane configuration for subsequent tests.
Figure 7.
Effect of vane number on lateral particle deposition distribution.
- (2)
- Effect of vane structure on spreading uniformity
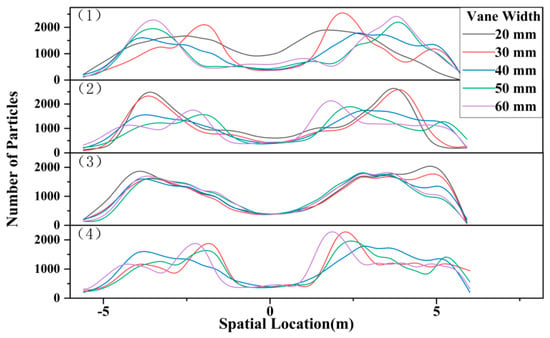
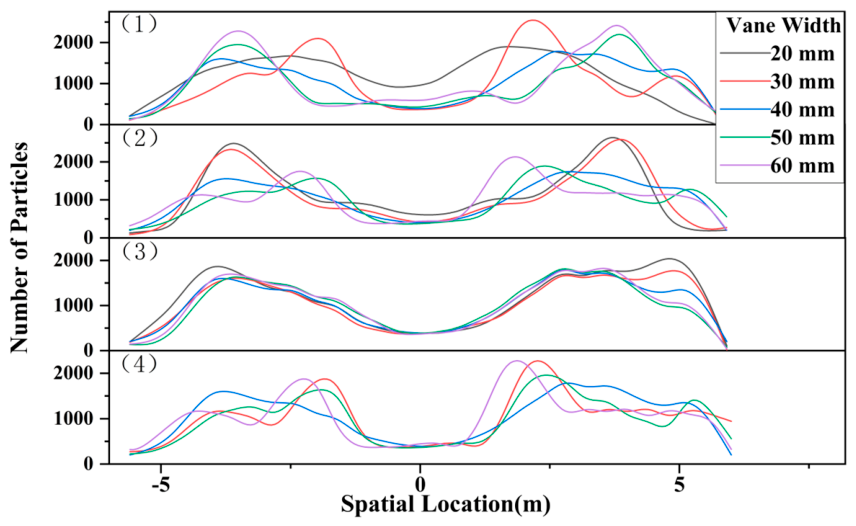
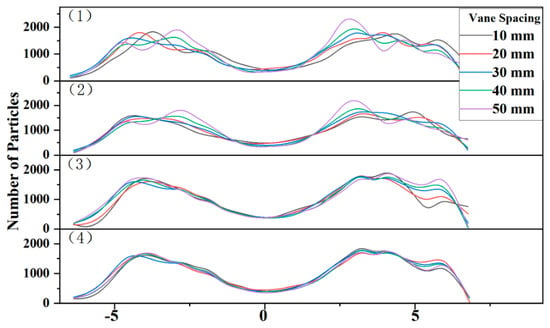
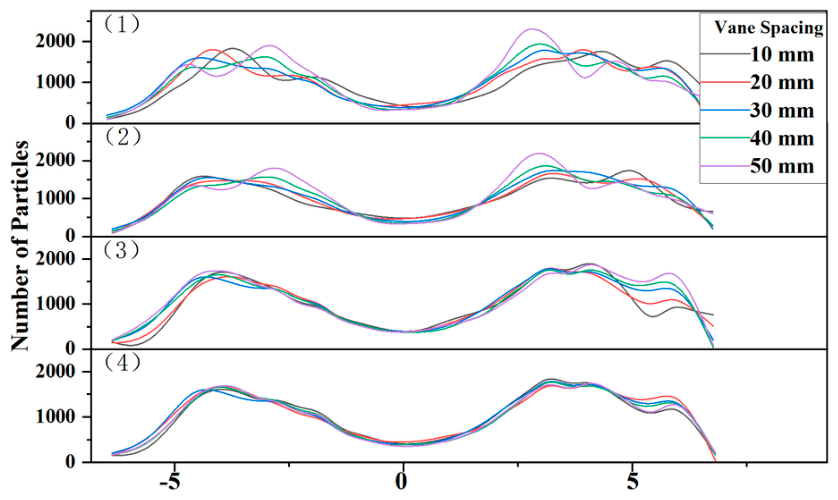
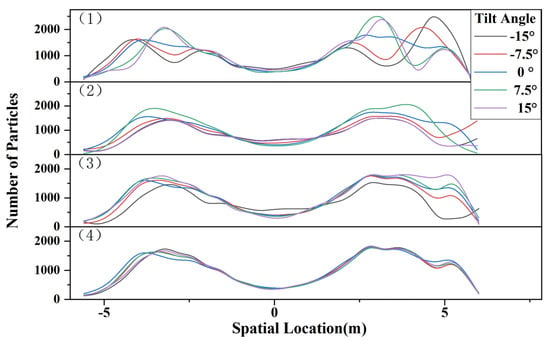
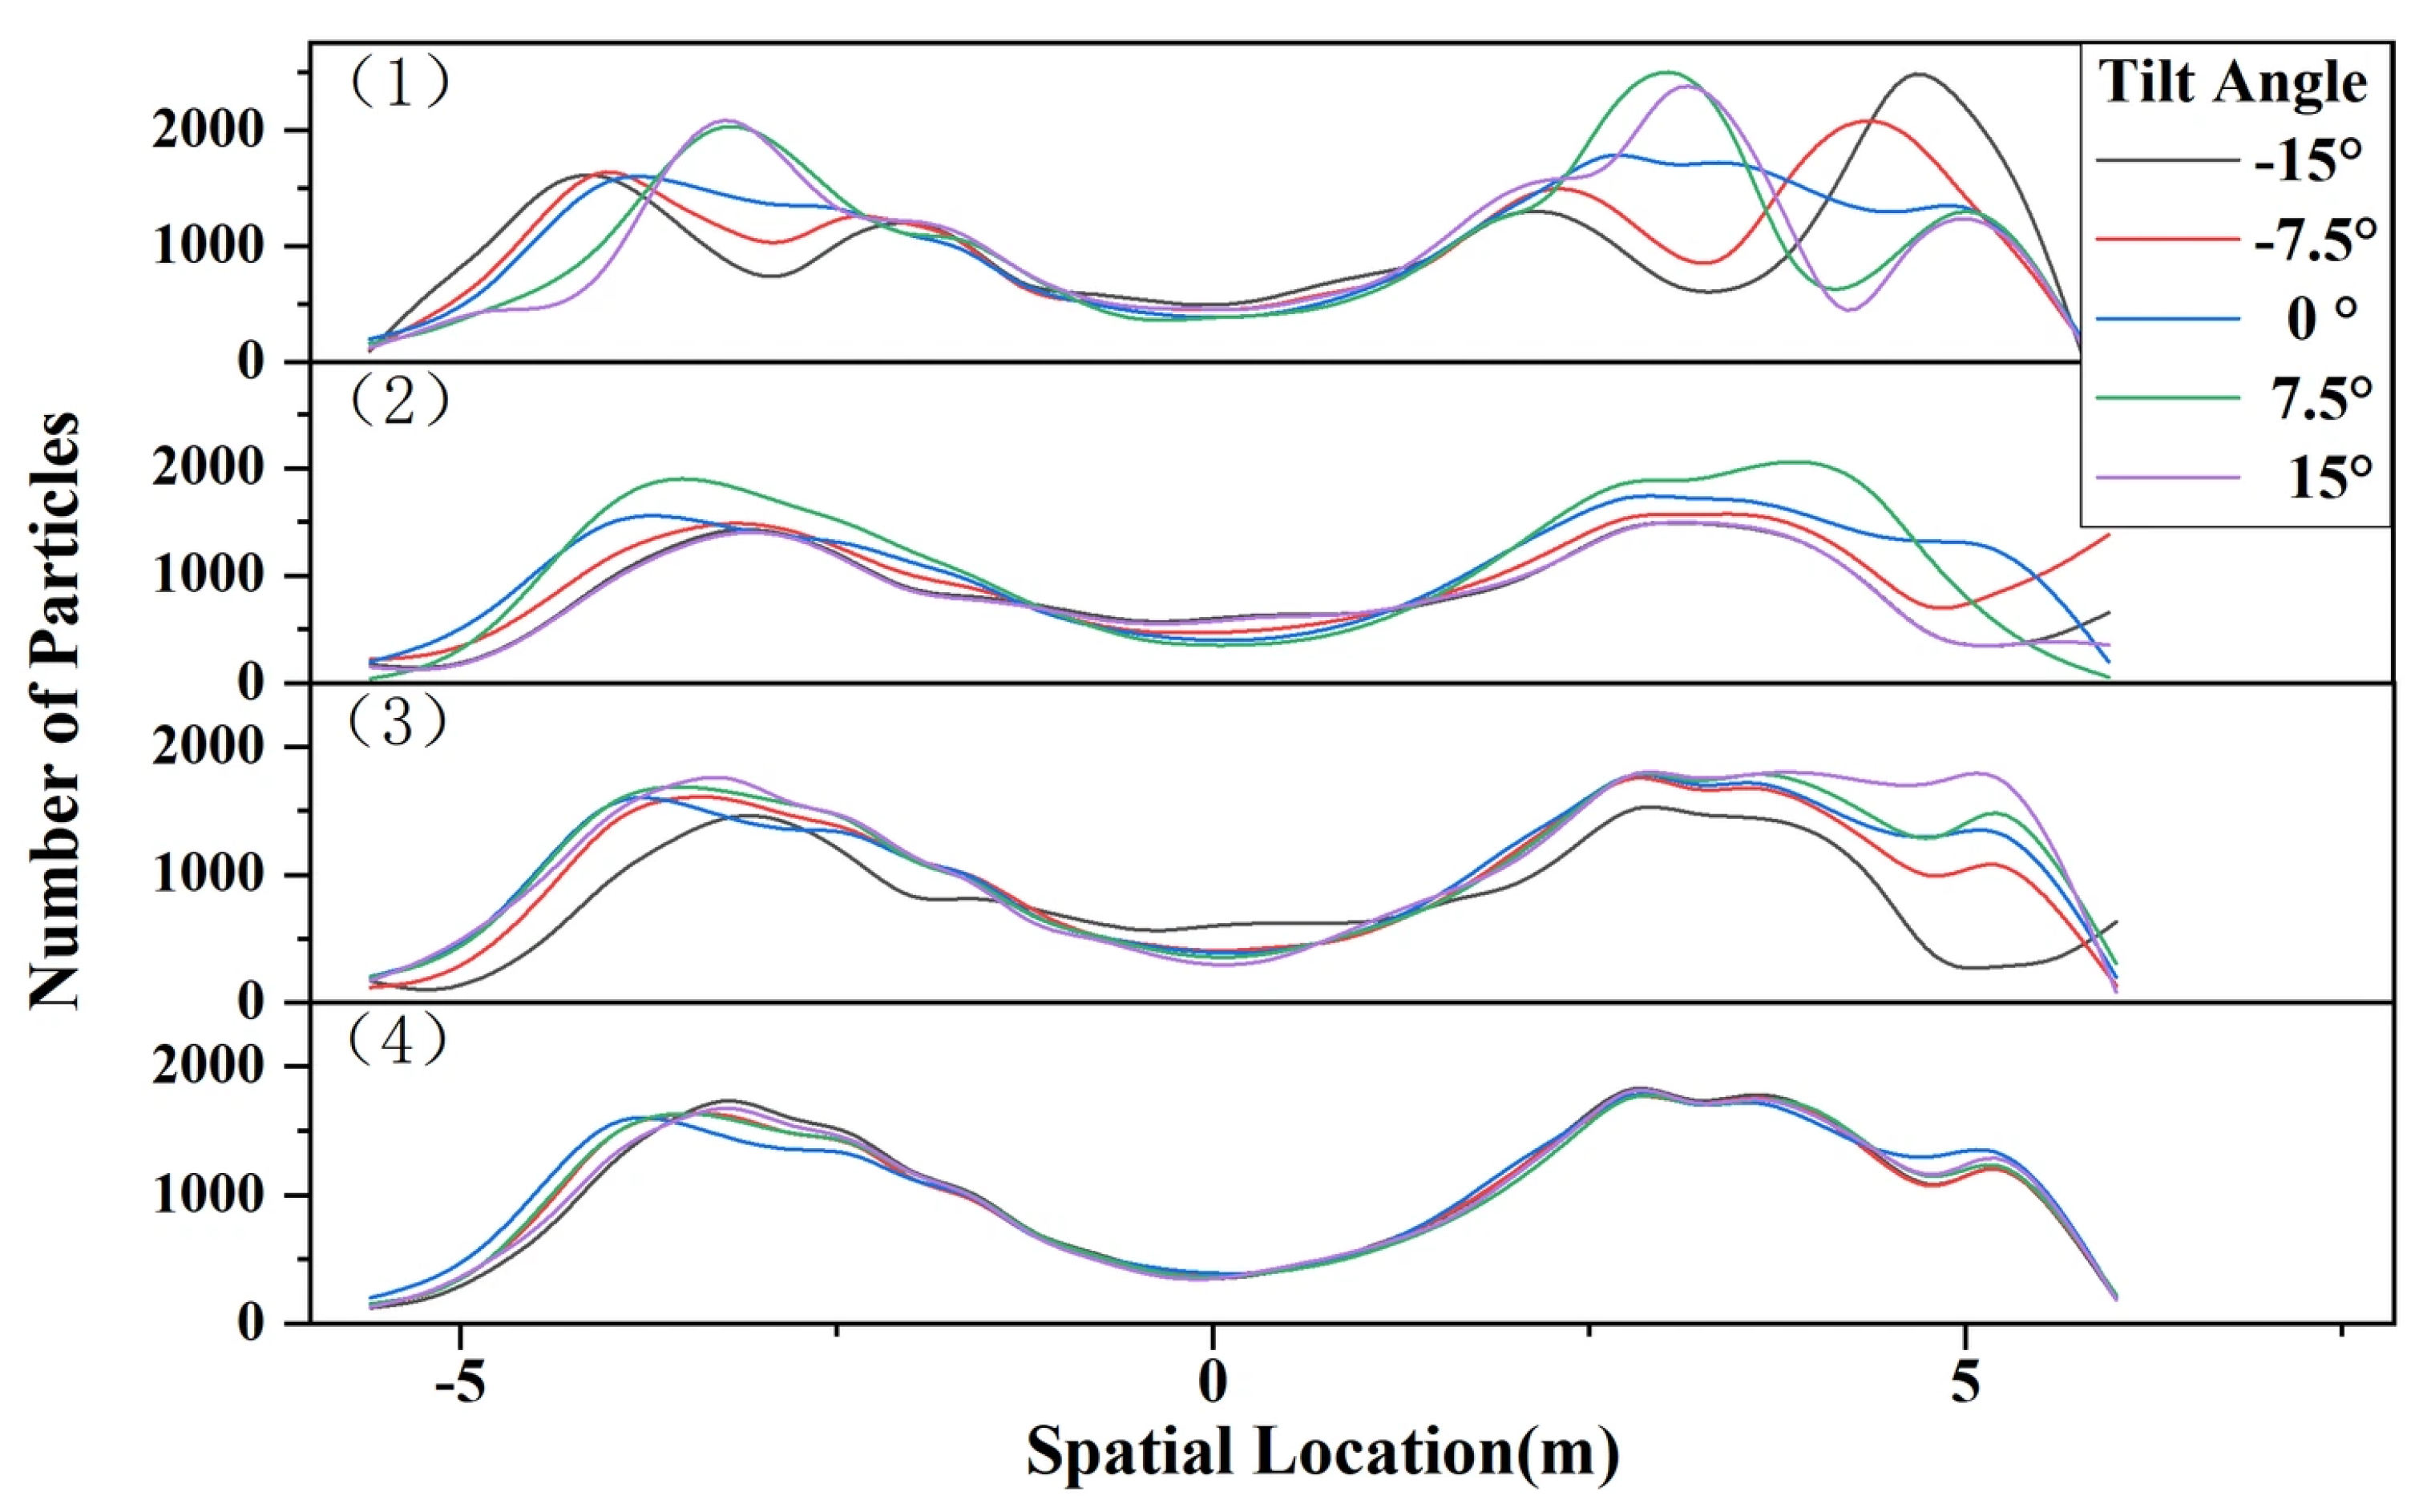
Figure 8, Figure 9 and Figure 10 illustrate how vane width, spacing, and tilt angle affect the lateral deposition distribution of particles. The results show similar patterns for all three parameters: changing the 1st and 2nd vane groups markedly altered the shape of the deposition curves, shifting peak positions and intensities. In contrast, curves for the 3rd and 4th vane groups overlapped largely at all parameter levels, indicating little effect on lateral deposition.
Figure 8.
Effect of vane width on lateral particle deposition distribution. Panels (1)–(4) show the effects of varying the vane width in groups 1–4, respectively.
Figure 9.
Effect of vane spacing on lateral particle deposition distribution. Panels (1)–(4) show the effects of varying the vane spacing in groups 1–4, respectively.
Figure 10.
Effect of vane tilt angle on lateral particle deposition distribution. Panels (1)–(4) show the effects of varying the vane tilt angle in groups 1–4, respectively.
Based on these results, an 8*vane structure was selected as the baseline configuration. Vane groups 1 and 2 had greater effects on particle deposition in terms of width, spacing, and tilt angle, while groups 3 and 4 showed smaller effects. Therefore, these six structural parameters were selected for the subsequent response surface tests. The remaining parameters were fixed at their selected levels.
3.3.2. Structural Parameter Optimization
Test Method
For the subsequent test design and analysis, the six structural parameters were defined as follows: The widths of vane groups 1 and 2 (X1, X4) were the projected lengths perpendicular to the radial direction; the vane spacings (X2, X5) were the circumferential mounting distances between adjacent vane groups; and the vane tilt angles (X3, X6) were the angles between the vane surface tangent and the radial direction. A six-factor, five-level rotatable central composite design (CCD) with a one-half fractional factorial portion was used for the response surface tests. Taking the newly defined PC, IP, and RC as supplementary evaluation parameters, the experimental matrix comprised 52 runs in total. Table 3 presents the factor levels and coding matrix, and the experimental results are provided in Appendix A Table A1.
Table 3.
Factors and levels of the response surface test.
Experimental Results and Analysis
The statistical data were analyzed using Design*Expert 13.0 software, and the ANOVA results are presented in Table 4. Because DEM simulations are highly deterministic, the variation among repeated center points was small. This resulted in a low estimate of pure error and made the lack-of-fit test sensitive to minor model deviations. Therefore, the optimization results were evaluated together with the response surface trends and subsequent validation results. The response surfaces describe fitted relationships between vane structural parameters and DEM-derived deposition responses. The associated mechanistic explanations are proposed by interpreting these trends together with the particle-motion analysis in Section 2.2.2.
Table 4.
ANOVA results for the response surface models.
- (1)
- Peak consistency
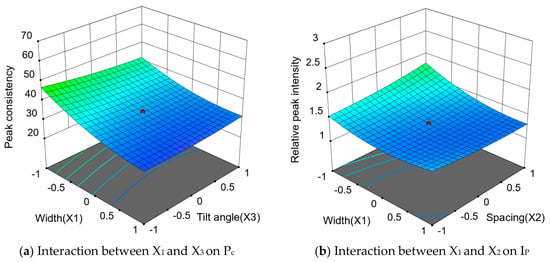
Based on the ANOVA results for PC, a regression model was established, as expressed in Equation (20). The regression model for peak consistency was highly significant (p < 0.001), with a coefficient of determination R2 of 0.957, indicating that the model explained 95.7% of the variation in PC. This demonstrates strong explanatory capacity, rendering the model suitable for analyzing how individual factors influence peak consistency. The order of main effect significance among the factors was X1 = X4 > X2 > X3. The p-values for X1 and X4 were both less than 0.001, indicating a highly significant effect, while X2 and X3 also had significant effects (p < 0.05).
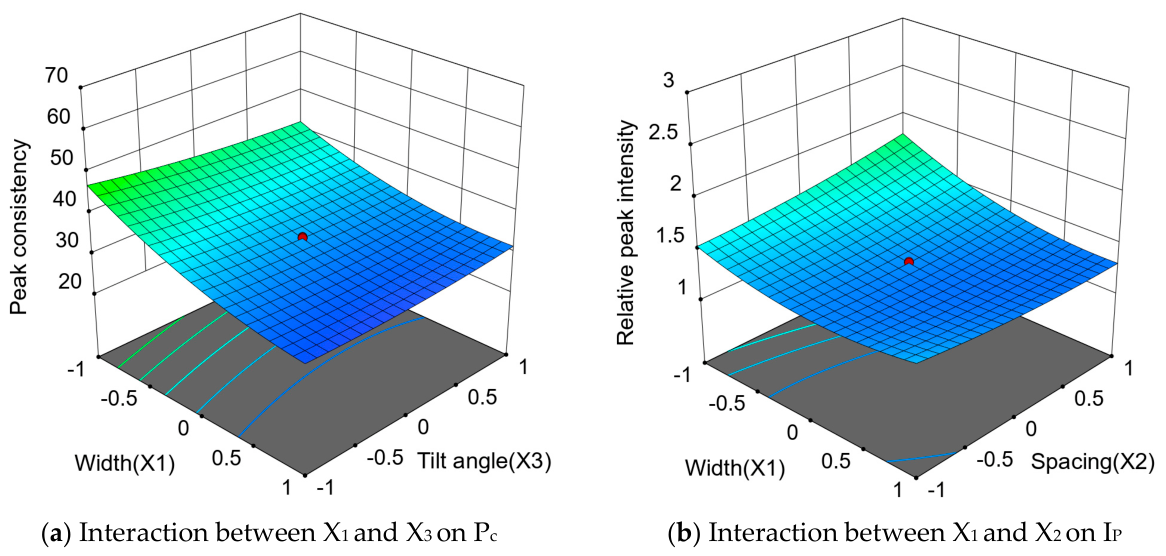
Figure 11a shows the response surface of the interaction between X1 and X3 on PC. The interaction X1X3 had a significant effect on PC (p = 0.0008). Within the plotted range, PC generally decreased with increasing vane width, but the decrease gradually leveled off. The decrease was more pronounced at lower tilt angles. This may be because vane width affects the particle-vane contact path and acceleration process, while the tilt angle changes the particle ejection direction. Together, these parameters may affect where particle clusters land and overlap, thereby changing the differences in deposition peak heights.
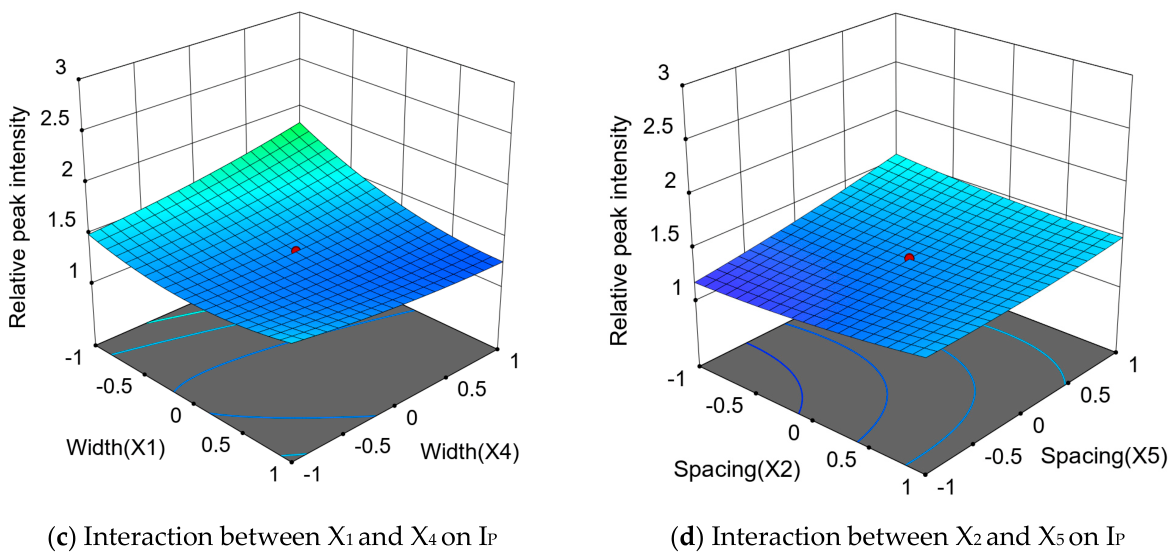
Figure 11.
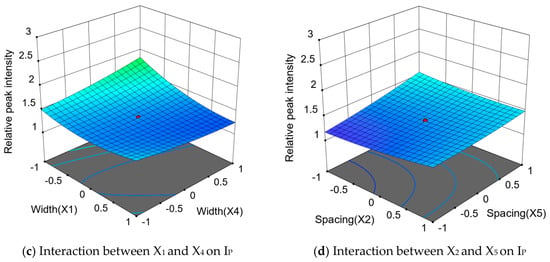
Response surfaces of the interactions between structural parameters.
- (2)
- Relative peak intensity
Based on the ANOVA results for IP, a regression model was established, as expressed in Equation (21).
The regression model for relative peak intensity was highly significant (p < 0.01), with a coefficient of determination R2 = 0.865, indicating that the model can effectively reflect the trend of how structural parameters influence relative peak intensity, and is suitable for subsequent parameter optimization analysis. The main effect of X1 on IP reached a highly significant level, while those of X3 and X5 were significant.
Figure 11b–d show the response surfaces of the interactions X1X2, X1X4 and X2X5 on IP, respectively. All three interaction terms had significant effects on relative peak intensity (p < 0.05), with X1X4 having the strongest effect (p < 0.01). In Figure 11b, IP was relatively high at small X1 and large X2. Increasing X1 markedly reduced IP at larger spacings, whereas at smaller spacings, IP first decreased and then increased slightly. This may be because spacing affects the portion of the particle stream entering the vane working region, while width affects particle acceleration and release. In Figure 11c, increasing X4 raised IP at small X1, but this trend weakened or reversed at larger X1. A narrow group-1 vane may allow more particles to reach group 2. Widening group 2 may then increase the amount intercepted, raising IP if these particles land within a concentrated area. Increasing X1 changes this allocation and thus the effect of X4. In Figure 11d, increasing X2 raised IP at small X5, whereas this trend weakened or reversed at larger X5. Changes in group-1 spacing may alter the particle stream entering group 2. At small X5, increasing X2 may make particle allocation between adjacent clusters less even, producing more pronounced deposition peaks.
- (3)
- Center filling ratio
Table 4 presents the analysis of variance results for the RC. Although the model p-value indicates statistical significance, the coefficient of determination R2 is 0.747, and the adjusted coefficient of determination is only 0.463, indicating limited predictive performance. Therefore, the RC model will not serve as an independent predictive model in parameter search during the response surface optimization process.
This may be related to the non-uniform angular velocity during the reciprocating motion of the disc. The disc moves faster in the middle of the sweeping range and slower near the reversal positions, which tends to result in insufficient deposition in the central region. Adjusting the vane structural parameters alone makes it difficult to simultaneously maintain a large effective spreading width, good deposition uniformity, and sufficient central filling.
Parameter Optimization
Based on the definitions of the evaluation parameters, lower PC and IP values indicate better peak consistency and weaker local peak accumulation, respectively. Therefore, PC and IP were both set as minimization objectives in the response surface optimization. Their importance levels in Design*Expert were set to 4 and 5, respectively, as indicated by ++++ and +++++ in Equation (22). This gives greater priority to reducing local peak intensity. The ranges of the six structural parameters determined in the preceding tests were used as constraints.
The optimization was performed using the desirability function approach in Design-Expert. The individual desirabilities of PC and IP were combined using a weighted geometric mean. The candidate solution with the highest overall desirability within the specified factor ranges was selected. The optimized values were rounded considering manufacturing feasibility. The finalized structural parameters for vane groups 1 and 2 were determined as follows: widths of 38.2 mm and 36.9 mm, spacings of 27.1 mm and 26.5 mm, and tilt angles of −0.5° and 1.8°, respectively. This parameter combination was used for the subsequent structural improvement and simulation tests. An independent DEM simulation at the optimized parameter combination yielded PC = 29.205% and IP = 1.166, compared with regression predictions of 28.413% and 1.191, respectively. The absolute relative deviations from the predicted values were 2.79% and 2.10%, respectively.
3.3.3. Structural Improvement of Dual-Layer Disc
- (1)
- Overall Structure
To address the central deposition deficit remaining after main-vane parameter optimization, a second layer of inner compensation vanes was introduced without changing the overall motion of the disc (Figure 12). The optimized main vanes were retained to maintain lateral spreading, while the inner compensation vanes were intended to redistribute part of the particle stream towards the central region.
Figure 12.
Schematic diagram of the dual-layer vane disc.
The particle-motion analysis in Section 2.2.2 provides a theoretical basis for interpreting how vane geometry may affect particle contact and release. The structural parameters of the inner compensation vanes were therefore investigated through single-factor simulations to evaluate their effects on the deposition distribution in the central region.
- (2)
- Test Methods and Results
Single-factor simulations were conducted using the DEM model described in Section 3.1 to investigate the effects of inner compensation-vane width, spacing, and tilt angle on central particle deposition. Particle properties, contact parameters, feeding conditions, disc motion parameters, and the optimized main-vane parameters were kept unchanged. Each inner-vane parameter was varied individually while the remaining parameters were held constant.
A central region extending 5 m across the spreading swath was selected to evaluate the compensation effect. This region was divided into 25 sampling bins, each measuring 200 mm in the lateral direction and 2000 mm in the longitudinal direction. Particle counts in these bins were extracted to characterize the central deposition distribution under different parameter settings. Figure 13 illustrates the sampling arrangement in the central region.
Figure 13.
Schematic of the sampling arrangement for evaluating central particle deposition.
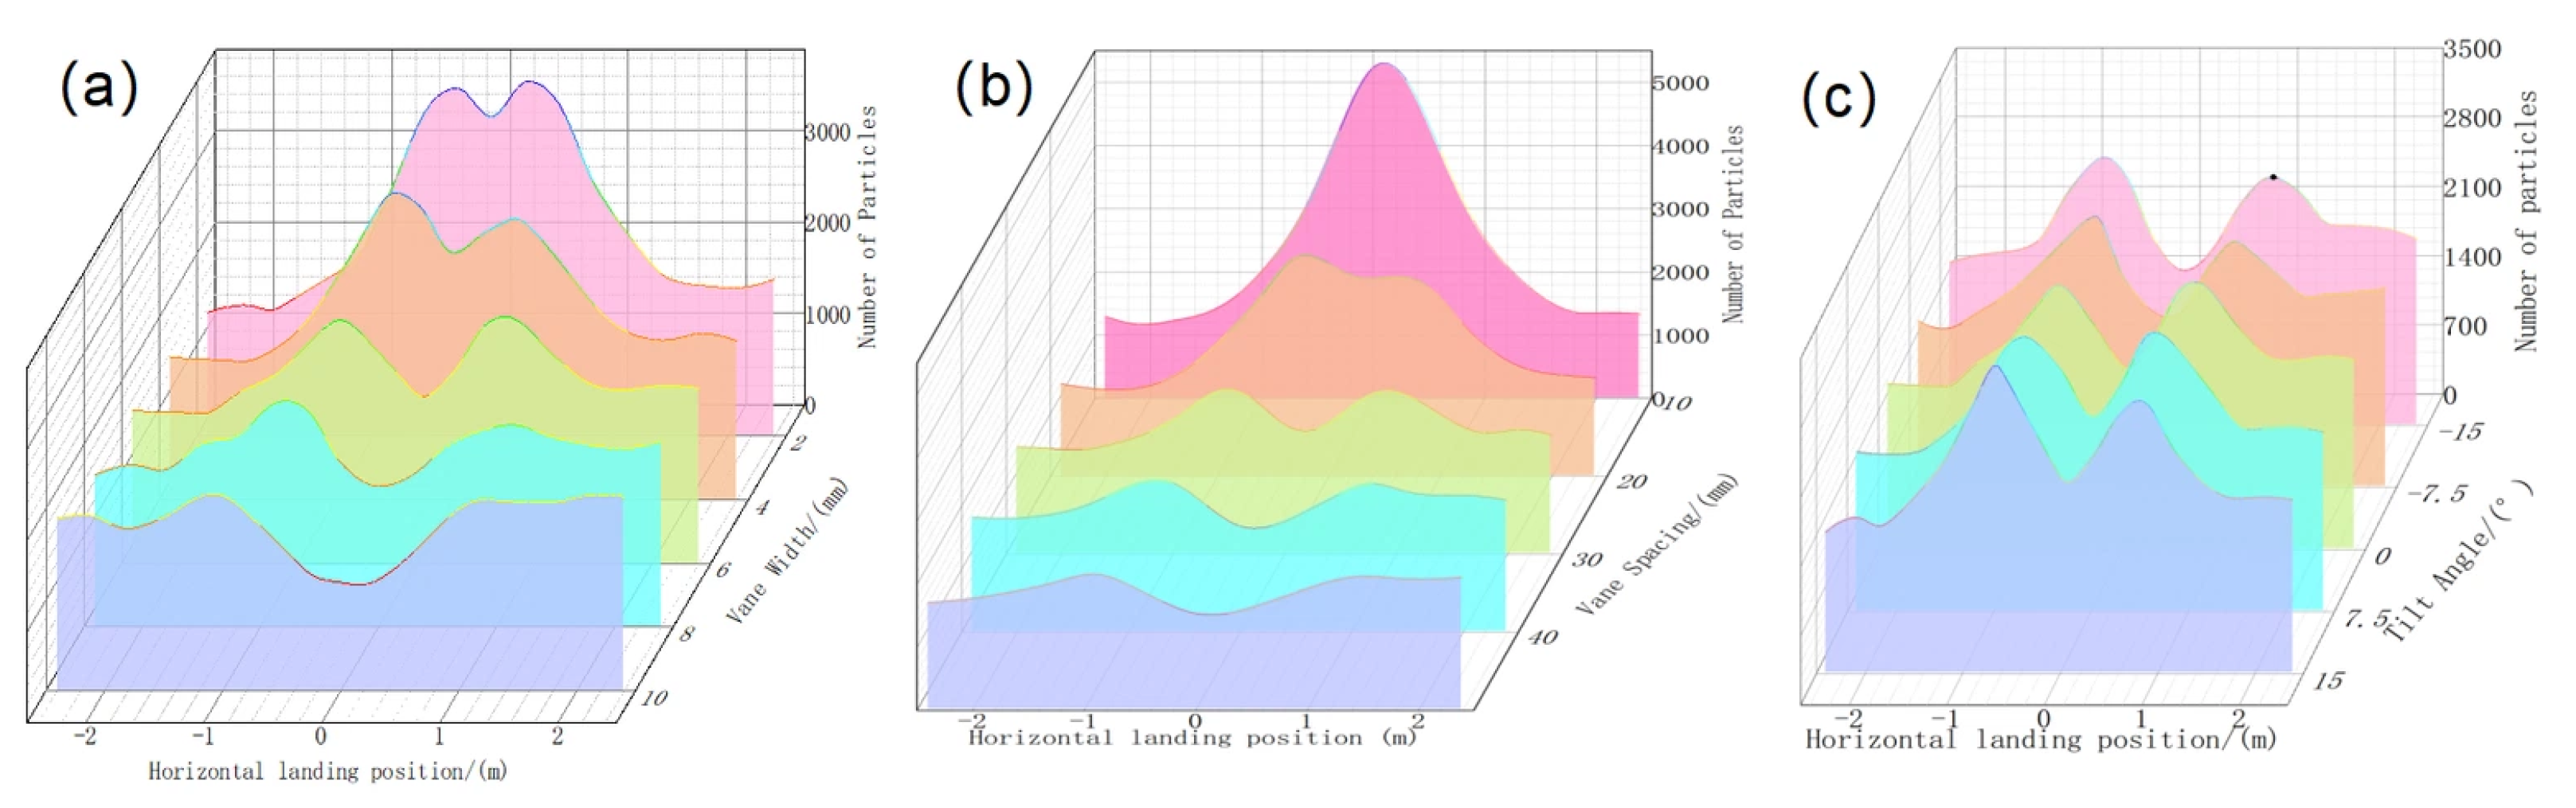
As shown in Figure 14, vane width and spacing altered the peak heights and spatial distribution of particle deposition in the central region. These changes may be associated with differences in particle interception, particle-vane contact, and release conditions. Variations in vane tilt angle had a relatively limited effect on central deposition. Based on the single-factor simulation results, a vane width of 5 mm, a spacing of 40 mm, and a tilt angle of 0° were selected for the inner compensation vanes.
Figure 14.
Effects of inner compensation-vane parameters on particle deposition within the central region. (a) vane width; (b) vane spacing; (c) vane tilt angle.
3.4. Comparison of Optimization Results
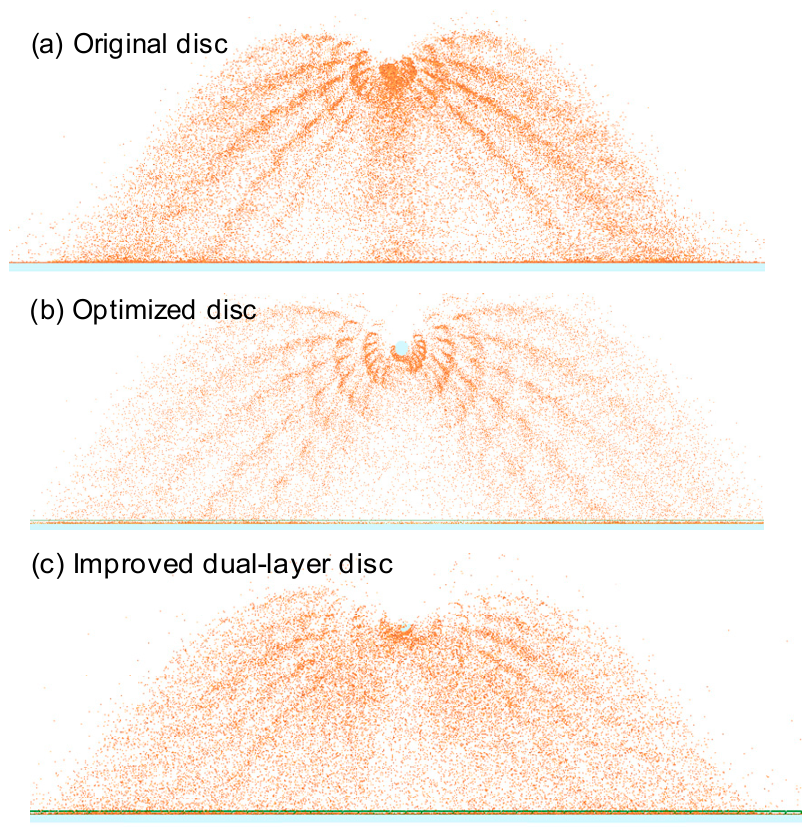
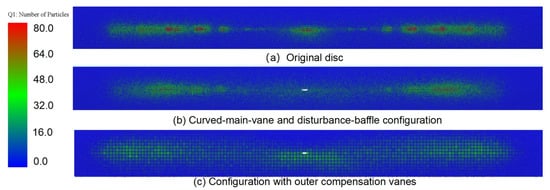
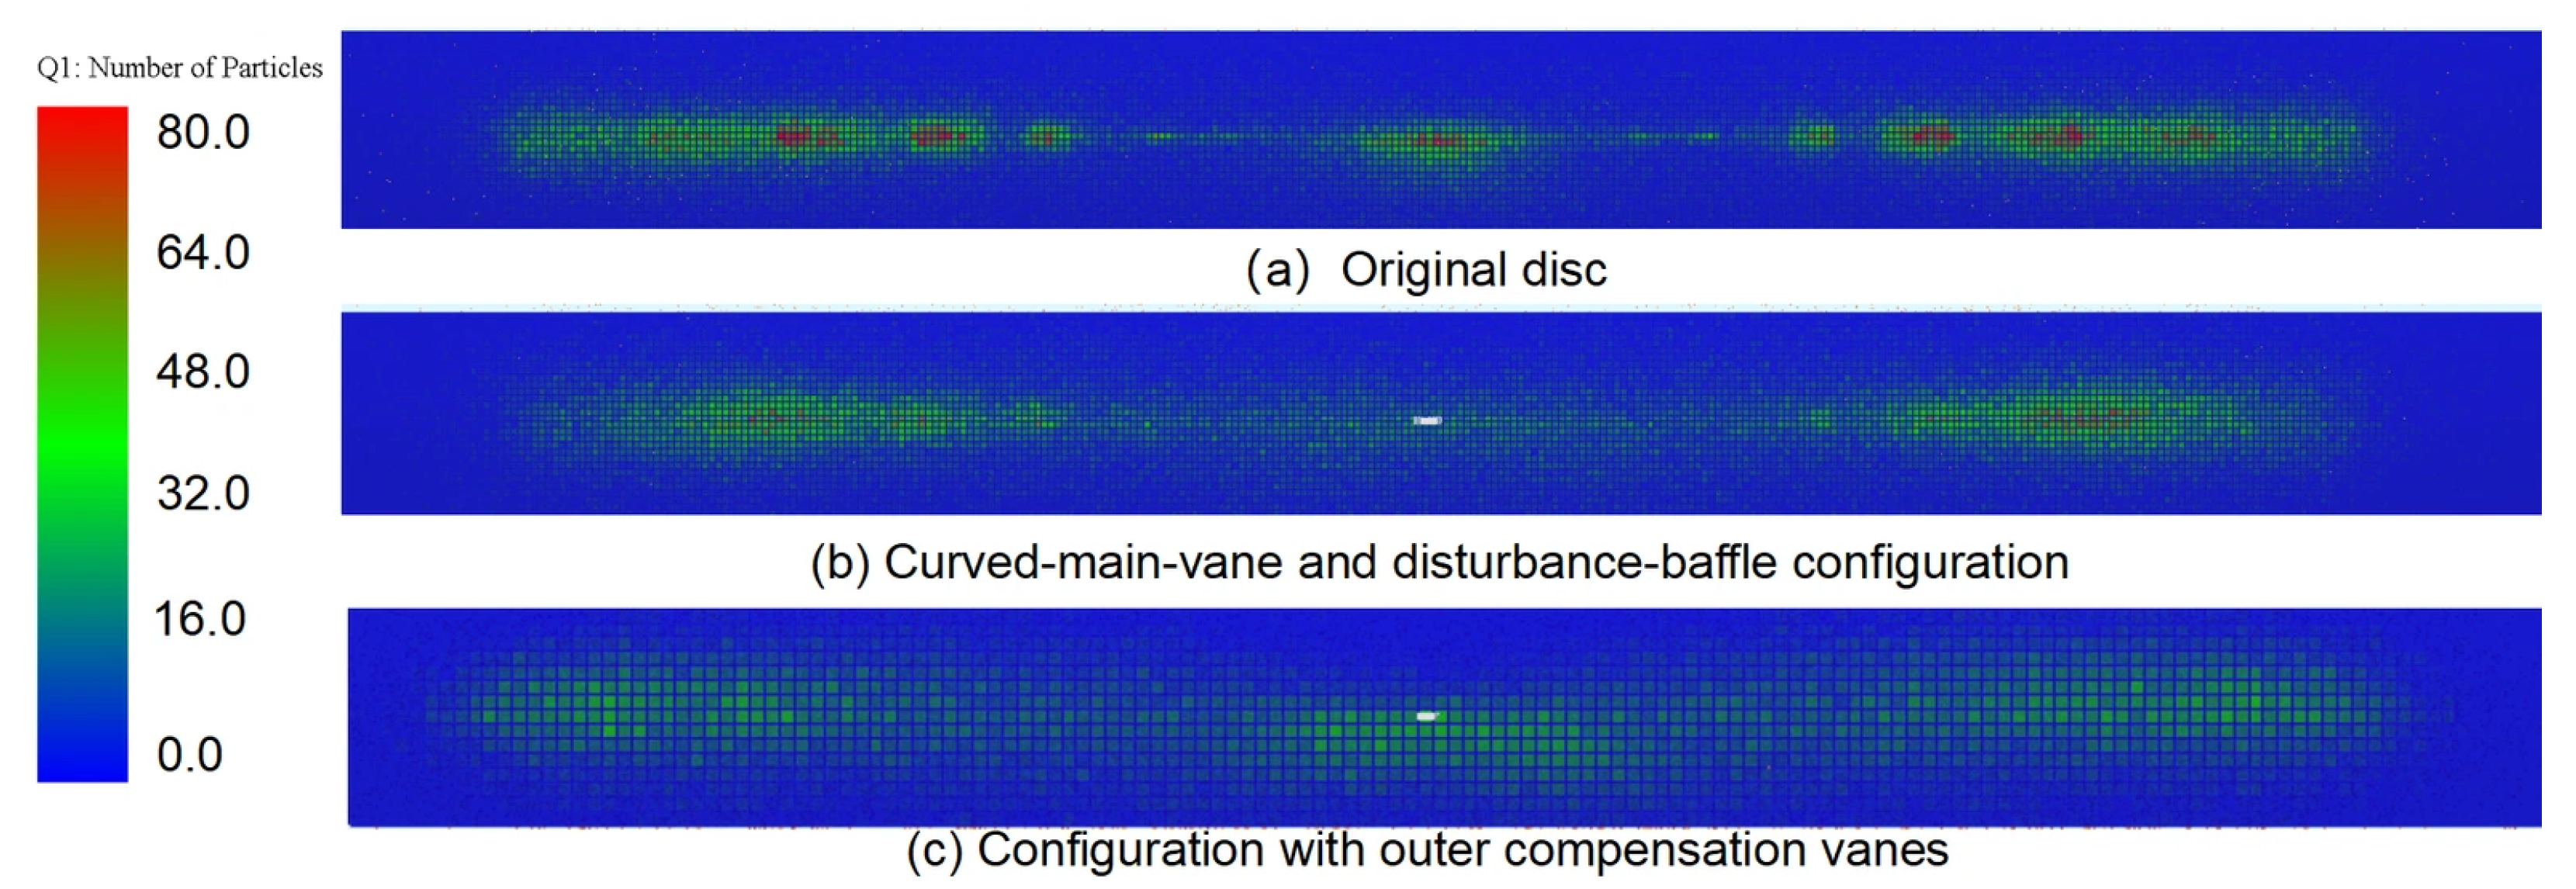
As shown in Figure 15 and Figure 16, panels (a), (b), and (c) correspond to the original disc, the response-surface-optimized disc, and the dual-layer disc, respectively. Figure 15 shows the simulated spreading process, while Figure 16 shows the corresponding particle deposition distributions. In Figure 16a, the particle clusters vary considerably in size, with overlapping deposition and insufficient deposition in the central region. After parameter optimization, the particle clusters in Figure 16b become more consistent, and their spacing becomes more regular. However, insufficient deposition in the central region remains evident. Figure 16c shows a further improvement, with increased particle deposition in the central region. Simulation results show that, after the final structural improvement, PC decreased from 35.57% to 27.76%, IP decreased from 1.373 to 1.122, and RC increased from 0.33 to 0.51.
Figure 15.
Comparison of simulated particle ejection trajectories for different disc configurations.
Figure 16.
Comparison of ground particle deposition distributions for different disc configurations.
4. Field Validation
4.1. Test Conditions and Methods
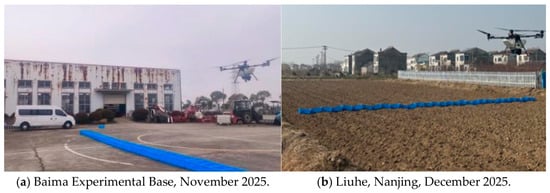
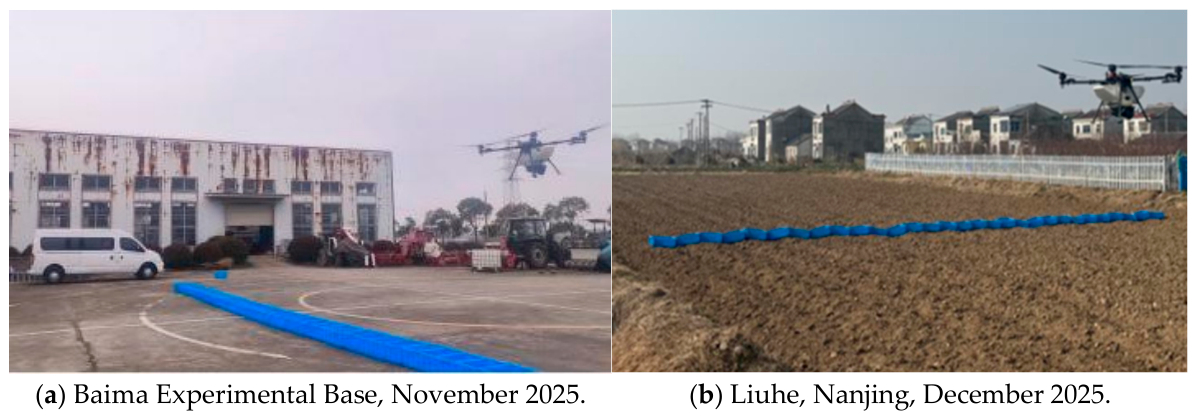
Field flight tests were conducted to validate the optimized design and evaluate its effect on particle deposition uniformity. The tests were carried out with reference to NY/T 3881–2021 and related methods for assessing spreading performance [35,36,37]. Field tests were conducted at two sites: the Baima Experimental Base of the Nanjing Institute of Agricultural Mechanization, Ministry of Agriculture and Rural Affairs, in November 2025, and Liuhe, Nanjing, in December 2025 (Figure 17).
Figure 17.
Field validation tests of the optimized spreading disc at two sites.
A back-and-forth flight pattern along a single flight line was used. The flight speed was 4 m/s, and the operating height was 3.5 m. The fertilizer discharge was calibrated before each test, and the target application rate was set to 375 kg/ha. Thirty rectangular collection trays (500 mm × 350 mm × 300 mm) were arranged in a single row perpendicular to the flight direction, covering a total sampling width of 15 m. Metal weights were placed in the trays to prevent them from being displaced by rotor downwash.
4.2. Field Test Results
Table 5 compares the field measurements with the simulation results for the final optimized disc. The experimental results are summarized as means ± standard deviations, together with approximate 95% confidence intervals for the means. The relatively narrow confidence intervals indicated that the experimental averages were estimated with relatively high precision. The mean measured values of PC, IP, and RC were 26.91%, 1.195, and 0.470, respectively. The corresponding simulation values were 27.76%, 1.122, and 0.510, with relative errors of 3.15%, 6.08%, and 8.51%. The small relative errors between the simulated and measured values indicated reasonably good prediction accuracy for the three deposition indices of the optimized spreading device under the tested conditions.
Table 5.
Comparison of simulated and measured deposition parameters for the optimized spreader.
These discrepancies may partly arise from differences between the simulation and field conditions. In the stationary simulations, particles accumulated over repeated sweeping cycles within a fixed sampling area to facilitate identification of local deposition features. During field operation, UAV movement and unmodeled airflow effects may alter particle trajectories and the spatial overlap of successive deposits. Differences in particle characteristics and sampling arrangements may further affect the estimated peak values and central filling, contributing to the observed discrepancies.
The field-test results showed that the deposition CV decreased from 29.75% before optimization to 19.02% after optimization, indicating improved spreading uniformity under the tested field conditions.
5. Discussion
This study examined the particle ejection mechanism of a novel reciprocating sweeping spreader and identified the main vane parameters affecting deposition uniformity. Optimizing vane width, spacing, and tilt angle reduced differences among deposition peaks and alleviated local particle accumulation. Inner compensation vanes were then added to address the central deposition deficit that remained after parameter optimization. Simulation and field tests showed that combining parameter optimization with this structural modification improved transverse deposition uniformity under the tested conditions.
In centrifugal spreaders, continuous rotation at a constant speed accelerates particles through contact with the disc and vanes. Under comparable feeding and contact conditions, similar particles can experience relatively consistent acceleration processes. In the reciprocating sweeping spreader studied here, both the disc speed and direction vary over time. Structural parameters can be adjusted to change release conditions and the number, speed, and direction of particle clusters. This provides opportunities to control particle landing positions and offers considerable potential for improving deposition uniformity. However, this variable-speed motion also complicates the relationship between particle contact and structural parameters. This makes optimization more challenging.
CV is commonly used to describe overall deposition uniformity. However, it alone cannot distinguish the location or form of uneven deposition. The evaluation criteria should match the research objectives. For example, Song et al. [13] developed an AHP-based comprehensive evaluation method that considered different performance requirements of UAV fertilizer spreaders. In this study, PC, IP, and RC were therefore introduced alongside overall CV to describe differences among deposition peaks, local peak intensity, and central filling, respectively. These parameters help identify local distribution problems and guide parameter adjustment and compensation-vane design, while CV is used to assess overall spreading uniformity.
The simulations and field tests demonstrated an overall improvement in spreading uniformity for the final design. However, a direct experimental comparison among the original disc, the parameter-optimized disc, and the dual-layer disc under the same operating conditions was not conducted. The contribution of each optimization stage was therefore not separately quantified experimentally. In addition, these findings are limited to the fertilizer, disc configuration, and operating conditions investigated. Further tests with other fertilizer types are needed to assess the broader applicability of the optimized structure.
UAV spreading can be divided into three stages: particle acceleration and release within the device, airborne transport, and ground deposition. The spreading structure directly affects particle release position, velocity, and direction, which provide the initial conditions for subsequent motion. This study focused on mechanical interactions between particles and vanes during the first stage. Structural effects were examined under consistent feeding and motion conditions, without explicitly modeling airflow. In practice, rotor downwash, ambient wind, and changes in flight parameters can affect airborne particle transport and final deposition. These effects warrant particular attention during low-altitude, high-speed operation of heavy-payload UAVs. Further work will combine CFD-DEM analysis with flight tests to examine the joint effects of particle release conditions and airflow. This will help match structural settings to operating conditions and improve spreading performance in practice.
6. Conclusions
This study optimized a reciprocating sweeping disc for agricultural UAV spreading to address uneven particle distribution, local accumulation, and insufficient deposition in the central region. Theoretical analysis, simulation-based optimization, and field tests were conducted. The main conclusions are as follows:
- (1)
- The particle dispersion and ejection characteristics of the reciprocating sweeping spreader were analyzed. The vanes mechanically divide the continuous particle stream into discrete particle clusters, while the high-frequency reciprocating motion produces a strip-like deposition pattern. Theoretical analysis showed that the particle ejection velocity at the instant of leaving the vane is determined by the relative velocity and transport velocity. Vane width, spacing, and tilt angle affect the particle–vane interaction and the initial ejection state, and consequently influence particle deposition.
- (2)
- The structural parameters of the sweeping disc were optimized, followed by further modification of the disc structure. PC and IP were set as minimization objectives in the response surface optimization based on a central composite design (CCD). The optimized widths of vane groups 1 and 2 were 38.2 mm and 36.9 mm, respectively. Their spacings were 27.1 mm and 26.5 mm, and the tilt angles were −0.5° and 1.8°. Insufficient deposition in the central region remained after parameter optimization. A dual-layer structure with outer main vanes and inner compensation vanes was therefore developed. The inner compensation vanes modified particle ejection velocity and deposition position and further improved the particle deposition distribution.
- (3)
- Field tests supportedd the effectiveness of the optimized design in improving deposition uniformity. The measured mean values of PC, IP, and RC were 26.91%, 1.195, and 0.470, with relative errors of 3.15%, 6.08%, and 8.51% compared with the simulation results. The CV decreased from 29.75% before optimization to 19.02% after optimization. The results show that the proposed structural optimization improved particle deposition uniformity for the tested compound fertilizer under the investigated operating conditions.
Author Contributions
Conceptualization, S.S. and L.T.; methodology, S.S. and M.Y.; software, L.T.; validation, L.T., Y.J. and Z.L.; formal analysis, M.Y. and X.X.; investigation, S.S. and S.D.; resources, X.X. and J.Q.; data curation, J.Q. and M.Y.; writing—original draft preparation, S.S.; writing—review and editing, X.X.; visualization, M.Y. and Z.L.; supervision, S.D. and Y.J.; project administration, S.D. and X.X.; funding acquisition, X.X. All authors have read and agreed to the published version of the manuscript.
Funding
This research was funded by: 1. National Key Research and Development Program of China (grant No. 2023YFD2000200). 2. Frontier Technologies R&D Program of Jiangsu (BF2025309). 3. China Agriculture Research System of MOF and MARA (No. CARS-12). 4. Modern Agricultural Machinery Equipment and Technology Promotion Project of Jiangsu Province (Industrialization Demonstration and Application Category) (No. NJ2025-19).
Data Availability Statement
The original contributions presented in this study are included in the article. Further inquiries can be directed to the corresponding author.
Conflicts of Interest
The authors declare no conflicts of interest.
Appendix A
Table A1.
The scheme and results for the comprehensive optimization test.
References
- Zhu, H.B.; Hu, Q.; Lu, X.Z.; Wen, W.; Xing, Z.; Gao, H.; Wei, H.; Zhang, H. Research progress in growth characteristics and key techniques for the high yield of unmanned aerial seeding rice. Trans. Chin. Soc. Agric. Eng. 2024, 40, 1–13. [Google Scholar] [CrossRef]
- Wang, G.B.; Zhang, T.S.; Lan, Y.B.; Xue, X.; Ding, S.; Ming, R.; Kong, L.; Song, C. Strip fertilization device of unmanned aerial vehicle using a variable-diameter grooved wheel. Trans. Chin. Soc. Agric. Eng. 2025, 41, 13–21. [Google Scholar] [CrossRef]
- Diamante, R.E.J. Evaluating the effectiveness of drone technology in fish feeding operations. Int. J. Adv. Sci. Comput. Eng. 2025, 7, 130–136. [Google Scholar] [CrossRef] [Scilit]
- Li, J.; Zhou, Z.; Lan, Y.; Hu, L.; Zang, Y.; Liu, A.; Luo, X.; Zhang, T. Distribution of Canopy Wind Field Produced by Rotor Unmanned Aerial Vehicle Pollination Operation. Trans. Chin. Soc. Agric. Eng. 2015, 31, 77–86. [Google Scholar] [CrossRef]
- Zhang, Q.; Zhang, K.; Liao, Q.; Liao, Y.; Wang, L.; Shu, C. Design and experiment of rapeseed aerial seeding device used for UAV. Trans. Chin. Soc. Agric. Eng. 2020, 36, 138–147. [Google Scholar] [CrossRef]
- Zhou, Q.; Zhang, S.; Huang, M.; Cai, C.; Zhang, H.; Jiao, Y.; Xue, X. Construction of a CFD Simulation and Prediction Model for Pesticide Droplet Drift in Agricultural UAV Spraying. Agronomy 2026, 16, 129. [Google Scholar] [CrossRef] [Scilit]
- He, Y.; Wang, Y.Y.; He, L.W.; Dai, F.; Zhu, J.; Tang, Y.; Fan, J.; Hou, B.; Wang, Y. Current status and prospects of low-altitude economy policies and technologies in agriculture and rural areas. Trans. Chin. Soc. Agric. Eng. 2025, 41, 1–16. [Google Scholar] [CrossRef]
- Lan, Y.B.; Bian, Z.H.; Qin, Y.D.; Chen, S. Application status and prospects of agricultural UAVs in multiple scenarios in China. Trans. Chin. Soc. Agric. Eng. 2026, 42, 611–627. [Google Scholar] [CrossRef]
- Zhao, C. State-of-the-art and recommended developmental strategic objectives of smart agriculture. Smart Agric. 2019, 1, 1–7. [Google Scholar] [CrossRef]
- Song, C.; Liu, L.; Wang, G.; Han, J.; Zhang, T.; Lan, Y. Particle deposition distribution of multi-rotor UAV-based fertilizer spreader under different height and speed parameters. Drones 2023, 7, 425. [Google Scholar] [CrossRef] [Scilit]
- Marzuki, O.F.; Teo, E.Y.L.; Rafie, A.S.M. The mechanism of drone seeding technology: A review. Malays. For. 2021, 84, 349–358. Available online: https://www.researchgate.net/publication/353192140_THE_MECHANISM_OF_DRONE_SEEDING_TECHNOLOGY_A_REVIEW.
- Si, S.; Tian, L.; Yu, M.; Qu, J.; Jin, Y.; Ding, S.; Xu, Y.; Xue, X. A review of key technologies in variable-rate spreading using unmanned aerial systems (UAS). Smart Agric. Technol. 2026, 14, 101770. [Google Scholar] [CrossRef] [Scilit]
- Song, C.; Zang, Y.; Zhou, Z.; Luo, X.; Zhao, L.; Ming, R.; Zi, L.; Zang, Y. Test and comprehensive evaluation for the performance of UAV-based fertilizer spreaders. IEEE Access 2020, 8, 202153–202163. [Google Scholar] [CrossRef] [Scilit]
- Deng, H. Design and Experiment Research of Rice Spreading Device Based on Unmanned Aerial Vehicle Wind Field. Master’s Thesis, Sichuan Agricultural University, Ya’an, China, 2022. [Google Scholar]
- Ren, W.J.; Wu, Z.Y.; Li, M.L.; Lei, X.; Zhu, S.; Chen, Y. Design and experiment of UAV fertilization spreader system for rice. Trans. Chin. Soc. Agric. Eng. 2021, 52, 88–98. [Google Scholar] [CrossRef]
- Dintwa, E.; Van Liedekerke, P.; Olieslagers, R.; Tijskens, E.; Ramon, H. Model for simulation of particle flow on a centrifugal fertiliser spreader. Biosyst. Eng. 2004, 87, 407–415. [Google Scholar] [CrossRef] [Scilit]
- Shi, Y.; Chen, M.; Wang, X.; Odhiambo, M.O.; Ding, W. Numerical simulation of spreading performance and distribution pattern of centrifugal variable-rate fertilizer applicator based on DEM software. Comput. Electron. Agric. 2018, 144, 249–259. [Google Scholar] [CrossRef] [Scilit]
- Li, J.; Lan, Y.; Zhou, Z.; Shan, Z.; Cong, H.; Yang, Z.; Zhu, Q. Design and test of operation parameters for rice air broadcasting by unmanned aerial vehicle. Int. J. Agric. Biol. Eng. 2016, 9, 24–32. [Google Scholar] [CrossRef]
- Peng, D.X. Study on a Rice Spreader Based on UAV. Master’s Thesis, Hunan Agricultural University, Changsha, China, 2018. [Google Scholar]
- Coetzee, C.; Lombard, S. Discrete element method modelling of a centrifugal fertiliser spreader. Biosyst. Eng. 2011, 109, 308–325. [Google Scholar] [CrossRef] [Scilit]
- Van Liedekerke, P.; Tijskens, E.; Dintwa, E.; Rioual, F.; Vangeyte, J.; Ramon, H. DEM simulations of the particle flow on a centrifugal fertilizer spreader. Powder Technol. 2009, 190, 348–360. [Google Scholar] [CrossRef] [Scilit]
- Wu, Z.; Li, M.; Lei, X.; Wu, Z.; Jiang, C.; Zhou, L.; Ma, R.; Chen, Y. Simulation and parameter optimization of a centrifugal rice seeding spreader for a UAV. Biosyst. Eng. 2020, 192, 275–293. [Google Scholar] [CrossRef] [Scilit]
- Gao, X.M.; You, Z.Y.; Wu, H.C.; Peng, B.; Wang, S.; Cao, M. Design and experiment of green manure seed broadcast sowing device based on unmanned aerial vehicle platform. Trans. Chin. Soc. Agric. Eng. 2022, 53, 76–85. [Google Scholar] [CrossRef]
- Li, M.L. Design and Test of Drone Centrifugal Rice Direct Seeding Device. Master’s Thesis, Sichuan Agricultural University, Ya’an, China, 2019. [Google Scholar]
- Wang, X.; Zhou, Z.; Chen, B.; Zhong, J.; Fan, X.; Andrew, H. Distribution uniformity improvement methods of a large discharge rate disc spreader for UAV fertilizer application. Comput. Electron. Agric. 2024, 220, 108928. [Google Scholar] [CrossRef] [Scilit]
- Wang, X.; Zhou, Z.; Chen, B.; Deng, K.; Lin, J. Modeling the impact of multi-rotor UAV downwash on granular fertilizer distribution in precision agriculture. Comput. Electron. Agric. 2026, 243, 111389. [Google Scholar] [CrossRef] [Scilit]
- Jiang, C.K. Simulation and Experimental Research of Drone Rice Sowing Device Based on EDEM-FLUENT Coupling. Master’s Thesis, Sichuan Agricultural University, Ya’an, China, 2021. [Google Scholar]
- Chen, X.; Zhou, B.; Liu, M.; Yu, J.; Zhang, F.; Li, J.; Zeng, Y.; Zhang, X.; Chen, Q.; Tu, T.; et al. Centrifugal Swing-Tube Seeding Unmanned Aerial Vehicle. CN207631497U, 13 May 2018. [Google Scholar]
- Zhu, Z.; Yu, G.; Chen, C.; Chen, X.; Cai, J.; Yu, J.; Liu, M.; Fang, P. Design and Test of a UAV-Based Oscillating-Tube Broadcasting Device. Agriculture 2026, 16, 1749. [Google Scholar] [CrossRef] [Scilit]
- Song, C.; Zhou, Z.; Jiang, R.; Luo, X.; He, X.; Ming, R. Design and Parameter Optimization of Pneumatic Rice-Seeding Device for Unmanned Aerial Vehicle. Trans. Chin. Soc. Agric. Eng. 2018, 34, 80–88. [Google Scholar] [CrossRef]
- XAG Co., Ltd. Spreading Disc Spreader, Spreading Device and Unmanned Aerial Vehicle. CN Patent 202311465781.7, 18 November 2025. Available online: https://patents.google.com/patent/CN117480925B/zh.
- XAG Co., Ltd. Spreading System and Unmanned Aerial Vehicle. CN Patent 202311465767.7, 29 May 2026. [Google Scholar]
- Li, M.S.; Wang, P.; Yan, Y.L.; Xie, S.; Liu, Z.; Liu, F.; Chen, X. Design and experiment of chain-spoon type maize precision seedmetering device. Trans. Chin. Soc. Agric. Eng. 2025, 41, 77–89. [Google Scholar] [CrossRef]
- Song, X.; Dai, F.; Zhang, F.; Wang, D.; Liu, Y. Calibration of DEM models for fertilizer particles based on numerical simulations and granular experiments. Comput. Electron. Agric. 2023, 204, 107507. [Google Scholar] [CrossRef] [Scilit]
- NY/T 3881-2021; Technical Specification for Quality Evaluation of Remote-Controlled Agricultural Aircraft Spreaders. China Agriculture Press: Beijing, China, 2021; pp. 1–2.
- ASABE S341.5; Procedure for Measuring Distribution Uniformity and Calibrating Granular Broadcast Spreaders. American Society of Agricultural and Biological Engineers: St. Joseph, MI, USA, 2017; pp. 1–5.
- Song, C.C.; Wang, G.B.; Zhao, J.; Wang, J.; Yan, Y.; Wang, M.; Zhou, Z.; Lan, Y. Research progress on the particle deposition and distribution characteristics of granular fertilizer application. Trans. Chin. Soc. Agric. Eng. 2022, 38, 59–70. [Google Scholar] [CrossRef]





Disclaimer/Publisher’s Note: The statements, opinions and data contained in all publications are solely those of the individual author(s) and contributor(s) and not of MDPI and/or the editor(s). MDPI and/or the editor(s) disclaim responsibility for any injury to people or property resulting from any ideas, methods, instructions or products referred to in the content. |
© 2026 by the authors. Licensee MDPI, Basel, Switzerland. This article is an open access article distributed under the terms and conditions of the Creative Commons Attribution (CC BY) license.