


Abstract
Fruit peel color is a key quality trait of pomegranate that influences consumer preference and market value. However, the pigmentation patterns and underlying molecular mechanisms in red- and green-skinned cultivars remain incompletely understood. This study aimed to elucidate the transcriptional basis of peel color variation between the red-skinned cultivar ‘Taishanhong’ (TSH) and the green-skinned cultivar ‘Linqing1’ (LQ1). Pigment contents were determined in fruit peels at three developmental stages, and RNA-seq was performed to identify key genes regulating peel coloration. The results show that anthocyanin content increased progressively during fruit development in both cultivars, whereas chlorophyll and carotenoid contents declined gradually. TSH accumulated significantly more anthocyanins but contained markedly lower levels of chlorophyll and carotenoids than LQ1. The S1_vs_S3 comparison yielded the largest number of differentially expressed genes (DEGs) in both cultivars, which were enriched in phenylalanine metabolism, flavonoid biosynthesis, photosynthesis, and carotenoid biosynthesis pathways. Twenty-four DEGs related to anthocyanin metabolism were identified, among which chalcone isomerase (PgCHI4), Flavonol synthase (PgFLS1), and UDP-glucose: flavonoid 3-O-glucosyltransferase (PgUFGT1) were strongly correlated with anthocyanin accumulation. Twenty-eight DEGs associated with carotenoid metabolism were detected; geranylgeranyl pyrophosphate synthase (PgGGPS1, PgGGPS2) and zeaxanthin epoxidase (PgZEP1) were closely linked to carotenoid biosynthesis, whereas carotenoid cleavage dioxygenase (PgCCD2) and 9-cis-epoxycarotenoid dioxygenase 2 (PgNCED2) were associated with carotenoid degradation. Chlorophyll metabolism was potentially regulated by multiple genes, including fructose-1,6-bisphosphate aldolase (PgFBA1), glyceraldehyde-3-phosphatedehydrogenase (PgGAPDH1, PgGAPDH4). Furthermore, 78 transcription factors from the MYB (myeloblastosis), ERF (ethylene response factor), bHLH (basic helix-loop-helix), NAC (NAM, ATAF1/2 and CUC2), ARF (auxin response factor) families were identified as candidate regulators of pigment metabolism. Collectively, this study delineates a cultivar-specific transcriptional program underlying peel color differentiation in pomegranate and identifies candidate structural genes and transcription factors that can serve as targets for functional validation and marker-assisted breeding of fruit color traits.
1. Introduction
Pomegranate (Punica granatum L.) is a prominent fruit tree, distinguished by its classification within the Lythraceae family [1]. Originating from Western and Central Asia territories like Iran and Afghanistan, it is presently cultivated in a multitude of subtropical and temperate regions worldwide [2]. Pomegranate fruit, recognized for its abundant bioactive constituents such as punicalagin, anthocyanins, and phenolic acids, provides significant nutritional and therapeutic benefits [3,4,5]. With a profound historical foundation, the cultivation of Chinese pomegranates is experiencing vigorous expansion, solidifying its importance within the overall fruit industry [6]. Fruit color and appearance are among the most important commercial characteristics of pomegranates, directly influencing consumer purchasing preferences and serving as key indicators for evaluating fruit quality, establishing ripeness, and performing market grading [7,8]. Consequently, exploring pomegranate fruit pigmentation mechanisms and refining color modulation strategies are of substantial practical value for elevating the quality and productivity of the pomegranate sector.
Fruit coloration is a complex physiological process that involves pigment synthesis and degradation, as well as metabolic regulation. It is mainly determined by the dynamic balance of pigments, such as anthocyanins, chlorophyll, and carotenoids, and is also comprehensively regulated by genotypes, fruit development processes, environmental factors, and cultivation measures [9,10]. Anthocyanins, a subclass of flavonoids, serve as the principal pigments responsible for red, blue, and purple coloration in fruits [11,12]. Furthermore, their antioxidant properties bolster plant defense mechanisms against environmental and biological adversities [13]. Phenylalanine is the precursor of anthocyanins, and many biosynthetic genes are involved in the anthocyanin synthesis pathway, such as phenylalanine ammonia-lyase (PAL), chalcone isomerase (CHI), and flavanone 3-hydroxylase (F3H), which are responsible for the initial steps in the production of common precursors. Flavonol synthase (FLS), leucoanthocyanidin reductase (LAR), anthocyanidin reductase (ANR), dihydroflavonol 4-reductase (DFR), anthocyanidin synthase (ANS), and UDP-glucose: flavonoid 3-O-glucosyltransferase (UFGT) catalyze the production of specific flavonoids [2,14]. The expression levels of these structural genes are regulated by transcription factors (TFs), such as MYB, bHLH, WD40, and bZIP, which promote or inhibit the biosynthesis of anthocyanins in plants [15,16].
Carotenoids, a subclass of terpenoids synthesized in plastids, are the main color components of fruits [17]. Carotenoid metabolism is regulated by phytoene synthase (PSY), phytoene desaturase (PDS), carotenoid isomerase (CRTISO), lycopene β-cyclase (LCYB), β-carotene hydroxylase (BCH), and zeaxanthin epoxidase (ZEP) [18]. Chlorophyll contributes to enhanced carbohydrate accumulation during fruit development, supporting photosynthetic efficiency. Genes involved in the chlorophyll metabolism pathway include chlorophyllide a oxygenase (CAO), chlorophyllase (CLH), pheophorbide a oxygenase (PAO), and red chlorophyll catabolite reductase (RCCR) [2]. Chlorophyll metabolism is regulated by MYB and NAC transcription factors in fruits [19,20,21]. The degradation of chlorophyll is beneficial for fruit coloring [22].
Transcriptomic analysis provides a powerful approach for identifying genes and regulatory networks associated with fruit coloration [23,24]. By comparing gene expression profiles among cultivars with different color phenotypes, it is possible to identify differentially expressed genes involved in pigment biosynthesis, transport, and regulation, as well as transcription factors and signaling pathways that modulate color development. Recent studies have shown that transcriptome profiling can reveal key structural genes and regulatory candidates controlling fruit pigmentation, such as apple [25], strawberry [26] and grape [27]. Therefore, transcriptomic analysis provides an effective strategy for dissecting the molecular basis of fruit coloration and identifying candidate genes for further functional validation.
The extensive presence of pomegranate germplasm in China, cultivated over a considerable period, has resulted in the development of a wide spectrum of varieties characterized by distinct fruit skin colors. Significant foundational research has been conducted on pomegranate fruit coloration, both domestically and internationally. The primary areas of investigation have encompassed the anthocyanin biosynthesis pathway, environmental and cultivation regulation [7,28,29]. Current research efforts have primarily concentrated on comparing anthocyanin metabolism across red-skinned and white-skinned types [30], as well as between two red-skinned types [31]. However, systematic transcriptomic analyses of fruit coloration during pomegranate development are still scarce, especially regarding carotenoid and chlorophyll metabolism. Currently, there is a lack of comparative studies elucidating the metabolic interplay of anthocyanins, carotenoids, and chlorophyll between red- and green-skinned pomegranate cultivars.
To address these gaps, this study comparatively analyzed transcriptomic profiles and pigment accumulation in the red-skinned cultivar ‘Taishanhong’ and the green-skinned cultivar ‘Luqing 1’ during fruit development. Our findings aim to identify key genes and regulatory networks underlying fruit coloration, thereby providing molecular markers and a theoretical basis for pomegranate quality improvement and breeding. Furthermore, this work enhances our understanding of the molecular mechanisms driving cultivar-specific pigmentation and offers potential targets for regulating fruit color in both production and postharvest management.
2. Materials and Methods
2.1. Plant Materials
The primary pomegranate cultivar ‘Taishanhong (TSH)’ and ‘Luqing1 (LQ1)’ were utilized as experimental material. TSH and LQ1 are superior pomegranate cultivars developed by Shandong Institute of Pomology. TSH is characterized by red peel and arils, sweet flavor profile, and high yield. LQ1 is a late-ripening cultivar characterized by green peel with some red blush at maturity, sweet flavor profile, and notable resistance to cracking. The two cultivars were cultivated at the pomegranate orchard in Taian City, Shandong Province, China, under natural environmental conditions.
Fruits were collected from 25 July (60 days after flowering), 24 August (90 days after flowering), and 23 September (120 days after flowering) in 2023, which were designated as S1, S2 and S3 period, respectively. Five fruits were collected from designated canopy positions across three trees per cultivar at each sampling interval, then immediately cooled and transported to the laboratory. Peel tissues were excised from the equatorial zone of each fruit. The heavily sun-exposed and completely shaded regions were excluded to minimize variation in red blush pigmentation. Peels were pooled and flash-frozen in liquid nitrogen for RNA extraction. All samples were stored at −80 °C until analysis.
2.2. Measurement of Anthocyanin, Chlorophyll and Carotenoid Contents
The anthocyanin content was determined using pH differential method [32]. The peels (0.1 g) were extracted with 1% (v/v) hydrochloric acid-methanol in the dark at 4 °C for 24 h, followed by centrifugation at 12,000 rpm for 15 min at 4 °C. After the supernatant has been carefully combined, it should be filtered via a 0.22-micron organic membrane. The concentration of anthocyanins was ascertained. Briefly, 0.5 mL of extract was mixed with 4.5 mL of pH 1.0 buffer (0.2 mol/L KCl) and pH 4.5 buffer (1 mol/L sodium acetate), respectively. After equilibration in the dark for 20 min, absorbance was measured at 520 nm and 700 nm using a ultraviolet-visible spectrophotometer (OPTIMA SP-3000DB, OPTIMA Inc., Tokyo, Japan).
Acetone colorimetry was used to determine the total chlorophyll and carotenoid contents [33]. The peels (0.1 g) were finely pulverized and subsequently macerated in 10 mL of 80% acetone. The resulting suspension was kept in a dark environment until the characteristic white coloration was observed. Absorbance readings at 652 nm and 470 nm were obtained for all samples using an ultraviolet-visible spectrophotometer (OPTIMA SP-3000DB, Tokyo, Japan), following baseline correction with 80% acetone. The values were determined through the application of relevant formulas.
Anthocyanin, chlorophyll, and carotenoid concentrations are expressed in mg·100 g−1 FW. Each sample was analyzed in three biological replicates, and the final results represent the calculated mean.
2.3. Transcriptome Sequencing and Analysis
Total RNA isolation was performed utilizing the RNAprep Pure Plant Kit (Polysaccharides & Polyphenolics-rich) from Tiangen (Beijing, China), adhering to the manufacturer’s instructions. The RNA concentration and purity were detected by 1% agarose gel electrophoresis and the Thermo Qubit® 3.0 nucleic acid quantification instrument (Thermo Scientific, Wilmington, DE, USA). The RNA integrity was examined using the Agilent 2100 bioanalyzer and the RNA Nano 6000 LabChip Kit (Agilent Technologies, Santa Clara, CA, USA). Paired-end sequencing was conducted using a read length of 150 bp.
RNA-seq was performed using the Illumina NovaSeq 6000 platform at GenePioneer Biotechnologies (Nanjing, China), and three independent biological replicates were used per sample. After sequencing, the clean reads were aligned to the reference genome of Punica granatum L. (NCBI Accession: ASM765513v2) using HISAT2 (v2.1.0) software. Gene assembly and quantification were performed using StringTie (v2.1.3b), and BAM files were processed using Samtools (v1.9). Gene function was predicted using GO enrichment analysis, and the frequency of functional class distribution was calculated. The expression level of genes is shown by the numerical value, which indicates the expected number of fragments per kb of transcript sequence per million base pairs sequenced (FPKM). Based on the FPKM values of all genes, Hiplot v0.1.2 was used for principal component analysis (PCA). The raw data of the RNA-seq were submitted to NCBI with the following ID number: PRJNA1134874.
Differential expression analysis was conducted using both DESeq2 (v1.26.0) and edgeR (v3.28.1) for genes with biological replicates. Genes with a |log2 fold change| exceeding 1 and a False Discovery Rate (FDR) below 0.05 were designated as differentially expressed genes (DEGs). The function of DEGs were annotated through mapping to the Gene Ontology database and subjected to pathway enrichment analysis via the KEGG resource. GO and KEGG pathway enrichment analyses of the DEGs were performed using the R package clusterProfiler v4.6.2 (Bioconductor 3.16), with an adjusted p value < 0.05 used as the threshold for significance. Transcription factors (TFs) were predicted and classified into families using iTAK (v1.7a). Expression clustering of TFs was performed using Hiplot (v0.1.2) based on the Mfuzz algorithm.
2.4. qRT-PCR Analysis
The extracted and qualified different types of RNA samples were subjected to cDNA reverse transcription. qRT-PCR was performed using a Bio-Rad IQ5 system (Bio-Rad Laboratories, Inc., Hercules, CA, USA). The PCR was performed using the SYBR Green Real-Time PCR Master Mix (Thermo Scientific). Pomegranate ACTIN (GenBank accession GU376750.1) was used as the endogenous control for normalization, and the relative expression levels were calculated using the 2−ΔΔCT method. The primer sequences utilized in the qRT-PCR analysis are comprehensively listed in Table S2. Each experiment featured three biological replicates, with three technical replicates per biological replicate.
2.5. Statistical Analysis
The experimental data were analyzed by variance analysis using IBM SPSS Statistics 26.0 software via one-way Analysis of Variance (ANOVA), and the mean values were separated by Tukey’s test for multiple comparisons. Duncan’s multiple range test was employed to establish the significance of variances (p < 0.05).
The correlation analysis of anthocyanin, chlorophyll, and carotenoid contents with gene expression was conducted using the online software Hiplot v0.1.2 to generate graphs based on the numerical data of three replicate samples. Pearson correlation analysis was conducted with two-tailed p values calculated via the cor.test function in R v4.3.1. Statistical significance was defined as p < 0.05. The strength of correlation was categorized as follows: |r| ≥ 0.7 indicates a strong correlation, 0.5 ≤ |r| < 0.7 indicates a moderate correlation, and |r| < 0.5 indicates a weak correlation. The bubble plot depicts correlation coefficients (r).
3. Results
3.1. Investigation of Peel Coloration and Pigment Levels in Two Pomegranate Cultivars During Fruit Development
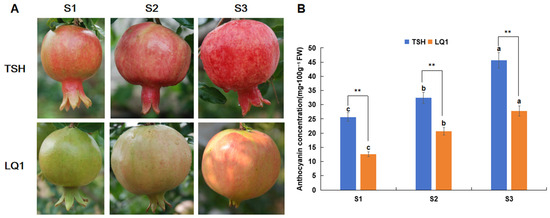
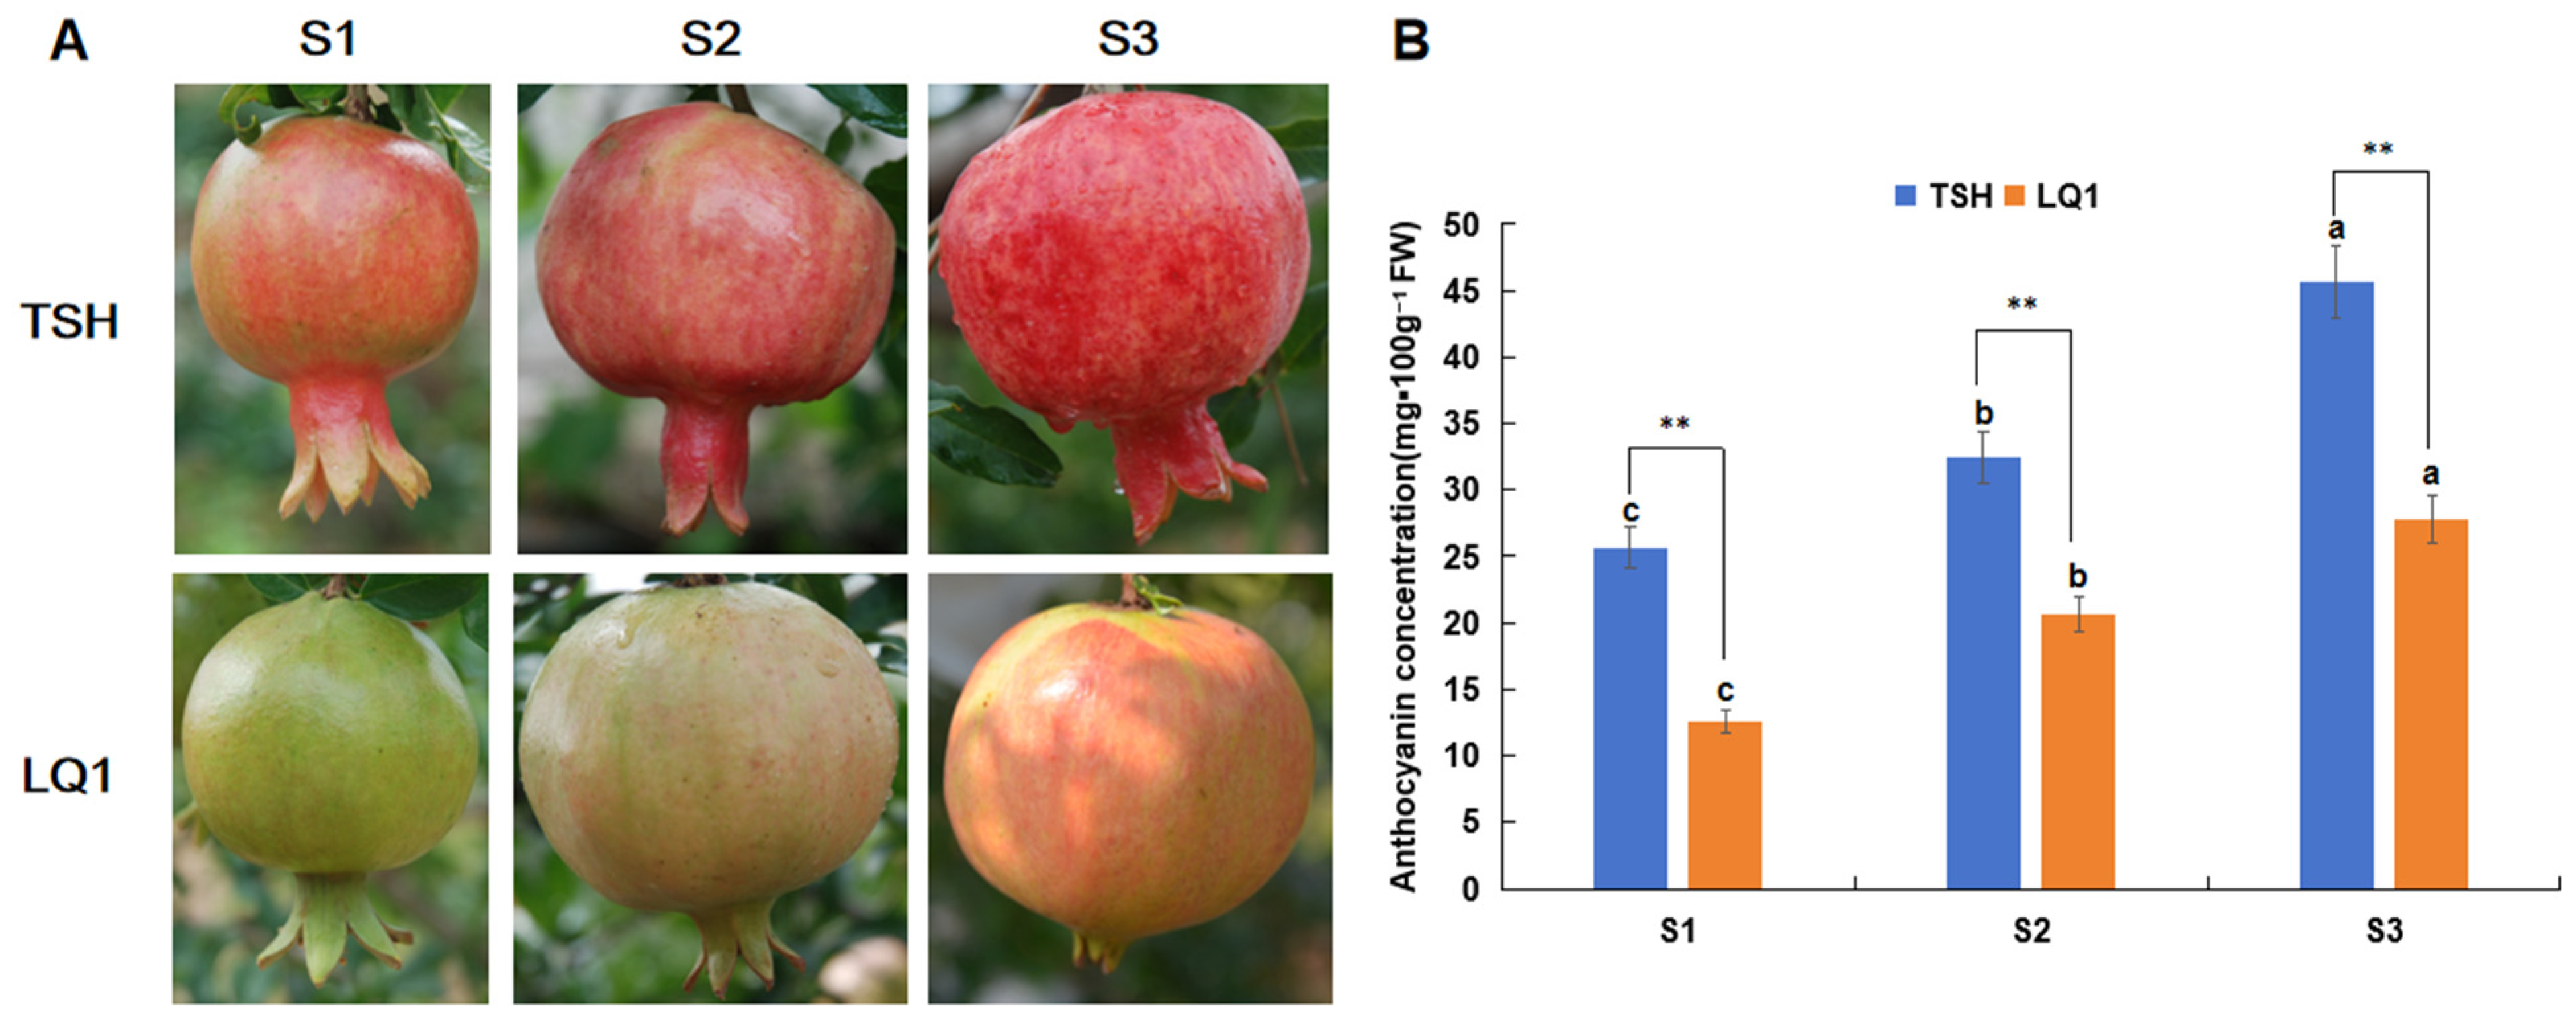
The progression of peel coloration in TSH and LQ1 pomegranates during fruit development is depicted in Figure 1A. The TSH peel was yellowish-green with initial reddish coloration at S1, turned entirely red at S2, and developed a deeper red shade at S3. In contrast, the LQ1 peel was green at S1, turned light red at S2, and exhibited extensive red blush at S3.
Figure 1.
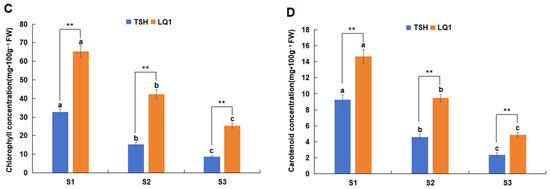
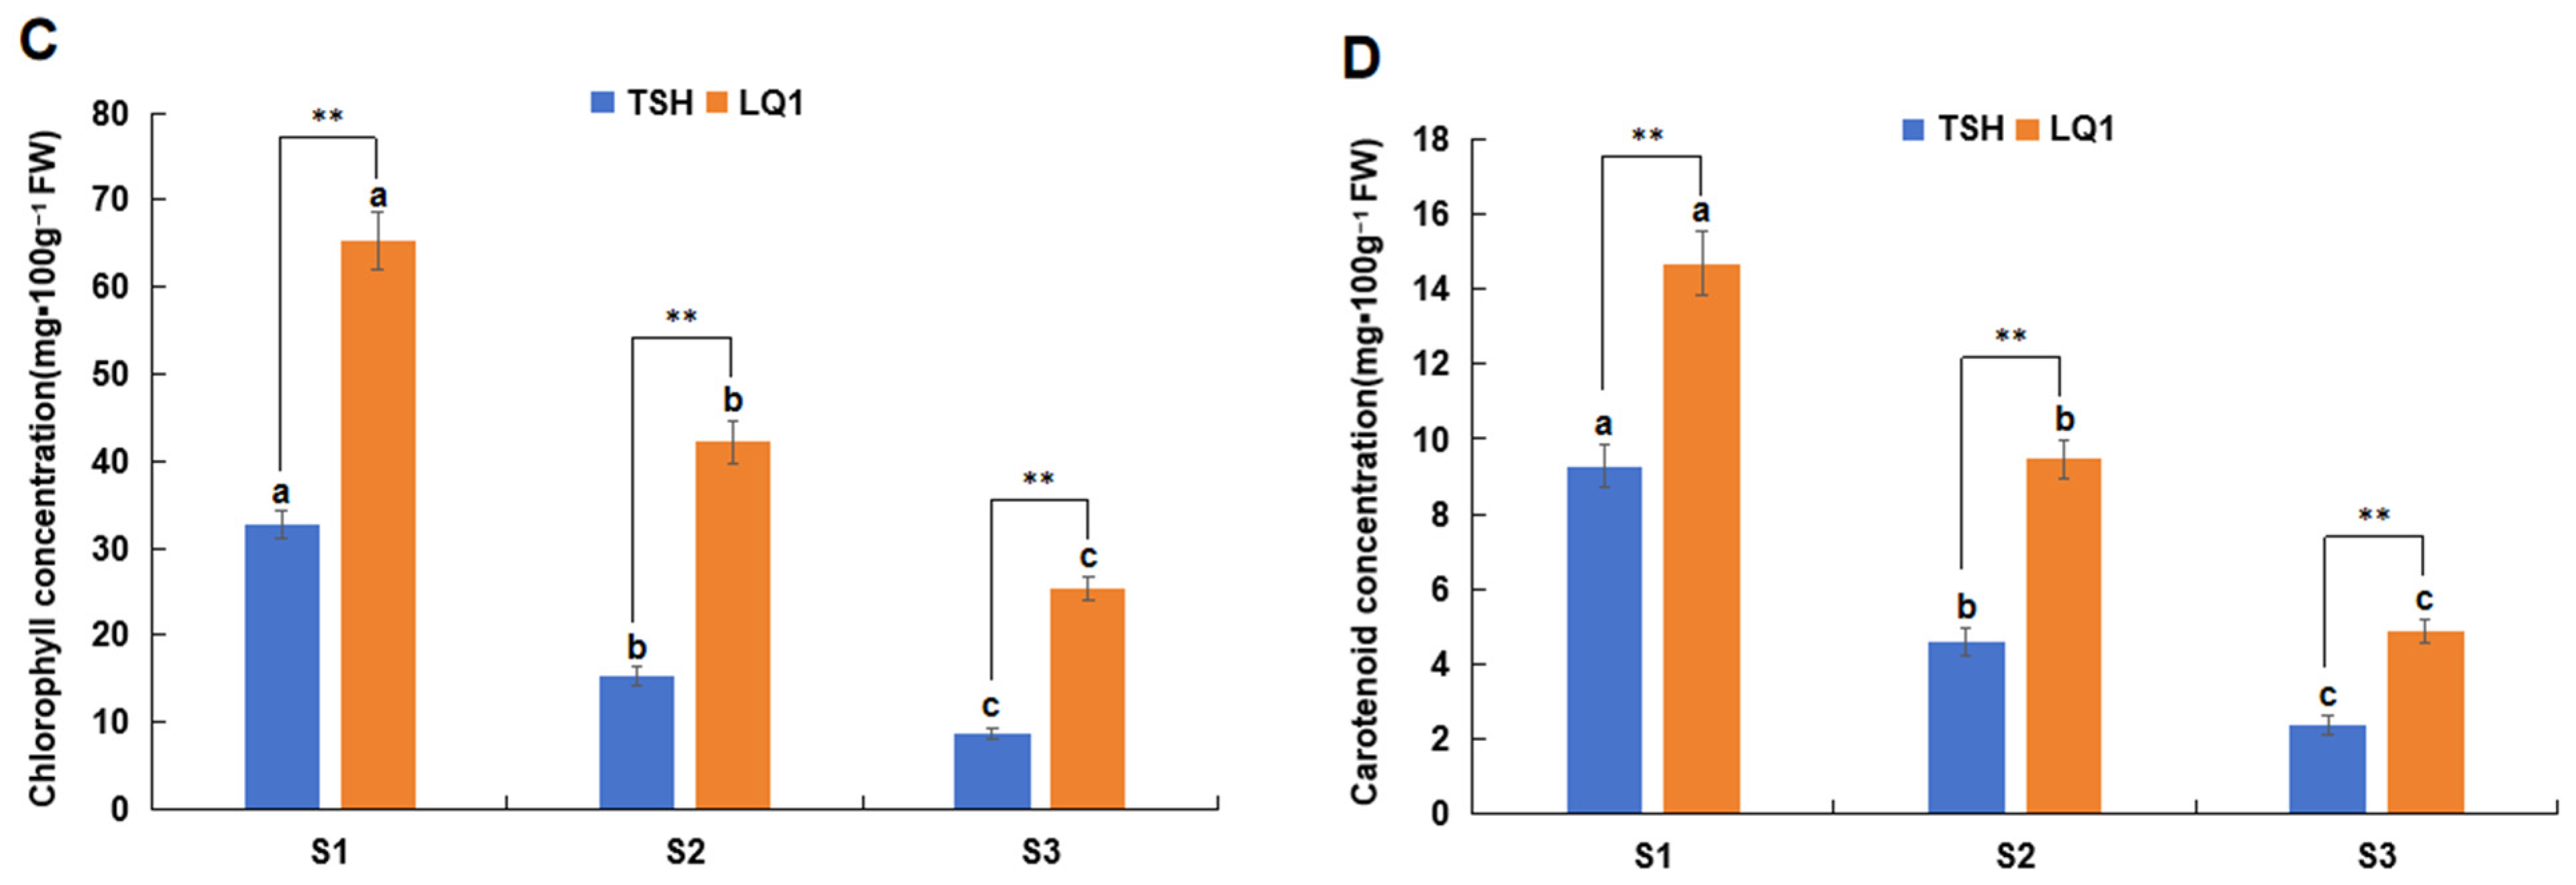
Variations in peel coloration and pigment contents during fruit development. (A) Visual representations of two cultivars fruits at developmental stages S1, S2, and S3. (B) Changes in anthocyanin content during fruit development in the two pomegranate cultivars. (C) Changes in chlorophyll contents during the development in the two pomegranate cultivars. (D) Changes in carotenoid contents during the development in the two pomegranate cultivars. Each value represents the mean ± standard deviation of three biological replicates. Different lowercase letters indicate significant differences (p < 0.05) between the same cultivar at different developmental stages. **: The two cultivars show extremely significant differences at the 0.01 level during the same growth stage.
The total contents of anthocyanins, chlorophylls, and carotenoids were quantified at each developmental stage in both cultivars. The numerical values are presented in Figure 1B–D, showing stage-specific changes in pigment accumulation that correspond to the contrasting peel color phenotypes of the two pomegranate cultivars. The total anthocyanin content in the peels of both cultivars gradually increased during fruit development (Figure 1B). Anthocyanin levels varied significantly across developmental stages within the same cultivar and were consistently higher in TSH than in LQ1, peaking at S3. Specifically, the anthocyanin content in TSH at S3 (45.63 mg·100g−1 FW) was 1.78 and 1.41 times higher than that at S1 (25.69 mg·100 g−1 FW) and S2 (32.47 mg·100 g−1 FW), respectively, with the maximum value being 1.64 times that of LQ1 (27.84 mg·100 g−1 FW). Conversely, the total chlorophyll and carotenoid contents in both cultivars gradually decreased, with the highest levels observed at S1 and being significantly higher than that at S3 (Figure 1C,D). The chlorophyll and carotenoid contents in the LQ1 peel were significantly higher than those in TSH. Chlorophyll and carotenoid contents were significantly higher in LQ1 peel than in TSH. The chlorophyll content in LQ1 at S1 (65.29 mg·100 g−1 FW) was 2.57 times that at S3 (25.36 mg·100 g−1 FW), while the carotenoid content at S1 (14.69 mg·100 g−1 FW) was 3.02 times that at S3 (64.87 mg·100 g−1 FW).
3.2. Transcriptome Sequencing and Differentially Expressed Genes (DEGs) Identification
RNA-seq analysis was conducted on the peels of the two cultivars at various developmental stages to elucidate the molecular mechanisms associated with the metabolic shifts. A total of 23.37–33.53 million clean reads were obtained by paired-end sequencing of 18 samples, resulting in a 7.01–10.06 G clean base (Table S1). The quality scores of 20 (Q20) and Q30 values ranged from 95.61% to 97.86% and 89.11% to 94.52%, respectively, and the GC content ranged from 49.19% to 51.47%. All quality control indicators of clean reads met the standard requirements, and the sequencing data were available for further analytical procedures.
Principal component analysis (PCA) was performed to assess the overall transcriptomic similarity among samples. PC1 and PC2 explained 43.90% and 26.45% of the total variance, respectively, with a cumulative explained variance of 70.35% (Figure S1). The two cultivars showed similar profiles at S1, whereas TSH separated from LQ1 along PC1 at S2 and S3. This separation coincided with the peel coloration differences observed in Figure 1 and was consistent with the differential expression of anthocyanin-related genes at later developmental stages. At the same time, the partial overlap among samples likely reflects biological similarity between the two cultivars at early stages and continuous transcriptional changes during peel development. Therefore, PCA was used as an exploratory overview of sample structure, while group differences were formally evaluated by differential expression analysis.
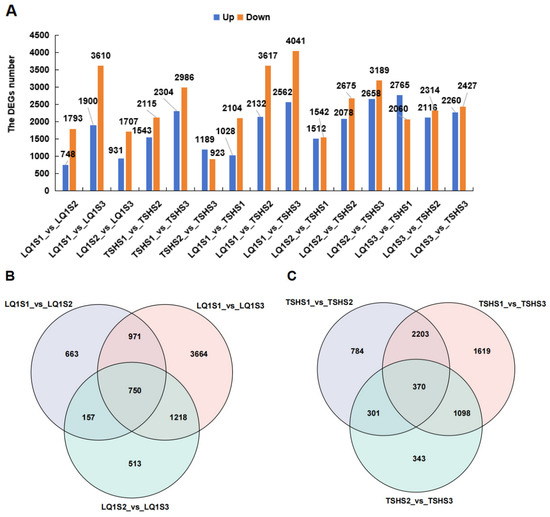
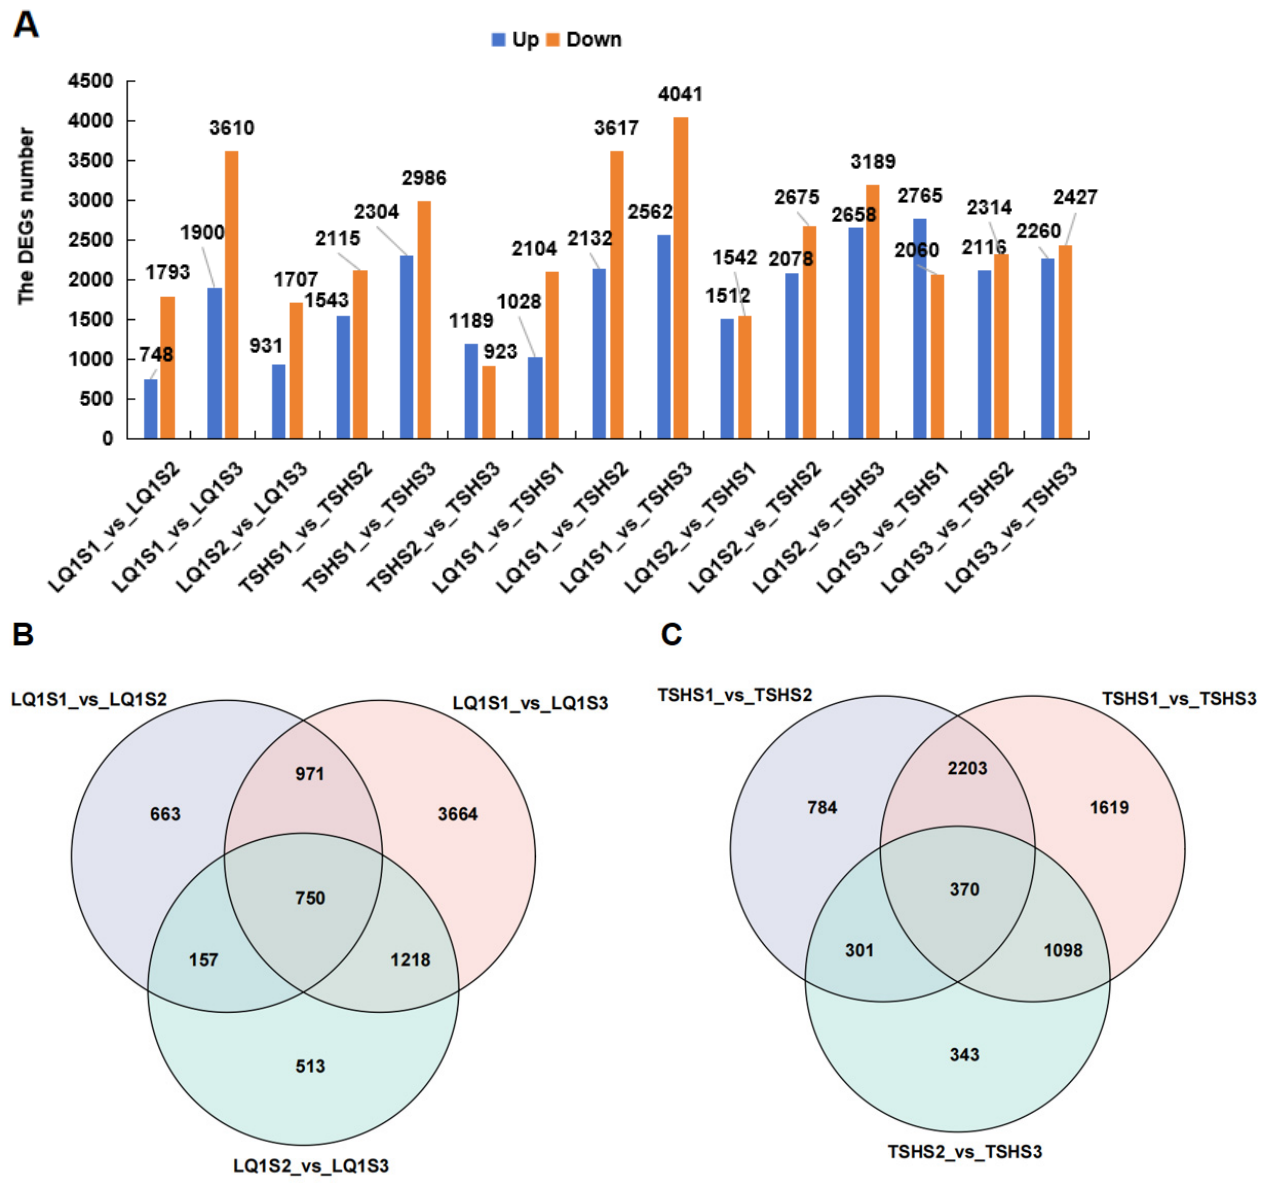
The number of differentially expressed genes (DEGs) identified among the 18 samples is shown in Figure 2A. The greatest number of DEGs was identified in LQ1S1_vs_LQ1S3 (5510) and TSHS1_vs_TSHS3 (5290) comparisons, among individuals of the same cultivars. Among the different cultivars, the LQ1S1_vs_TSHS3 comparison group had the largest number of DEGs (6603), with 2562 upregulated genes and 4041 downregulated genes. The LQ1S2_vs_TSHS3 comparison group revealed the second largest cohort of DEGs (5847), encompassing 2658 upregulated and 3189 downregulated genes. Venn diagram analysis of DEGs across different developmental stages within the same cultivar identified 750 DEGs in LQ1 and 370 in TSH (Figure 2B,C). The number of DEGs in LQ1 was substantially higher than that in TSH.
Figure 2.
Analysis of differentially expressed genes (DEGs) in TSH and LQ1. (A) The DEGs number identified in different comparison groups. (B) The DEGs identified in pairwise comparisons of LQ1. (C) The DEGs identified in pairwise comparisons of TSH. For the LQ1S1_vs_TSHS1 comparison, LQ1S1 serves as the control and TSHS1 as the treatment. Other treatments were the same.
3.3. KEGG Pathway and Gene Ontology (GO) Analyses of DEGs Identified in the Two Cultivars During the Same Period
The expression profiles of DEGs in the two cultivars showed substantial divergence within the same developmental stage, highlighting distinct cultivar-specific expression patterns (Figure S2). At S1, the number of highly expressed genes in LQ1 was higher than that in TSH (Figure S2A).
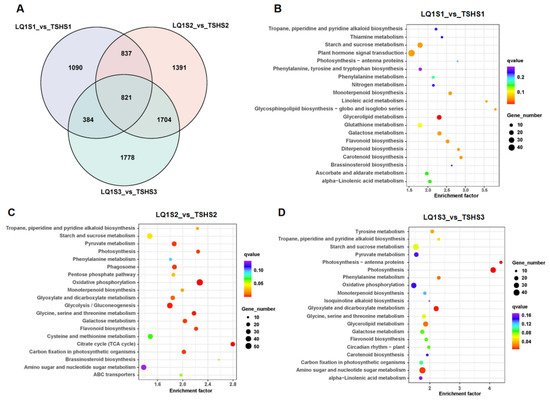
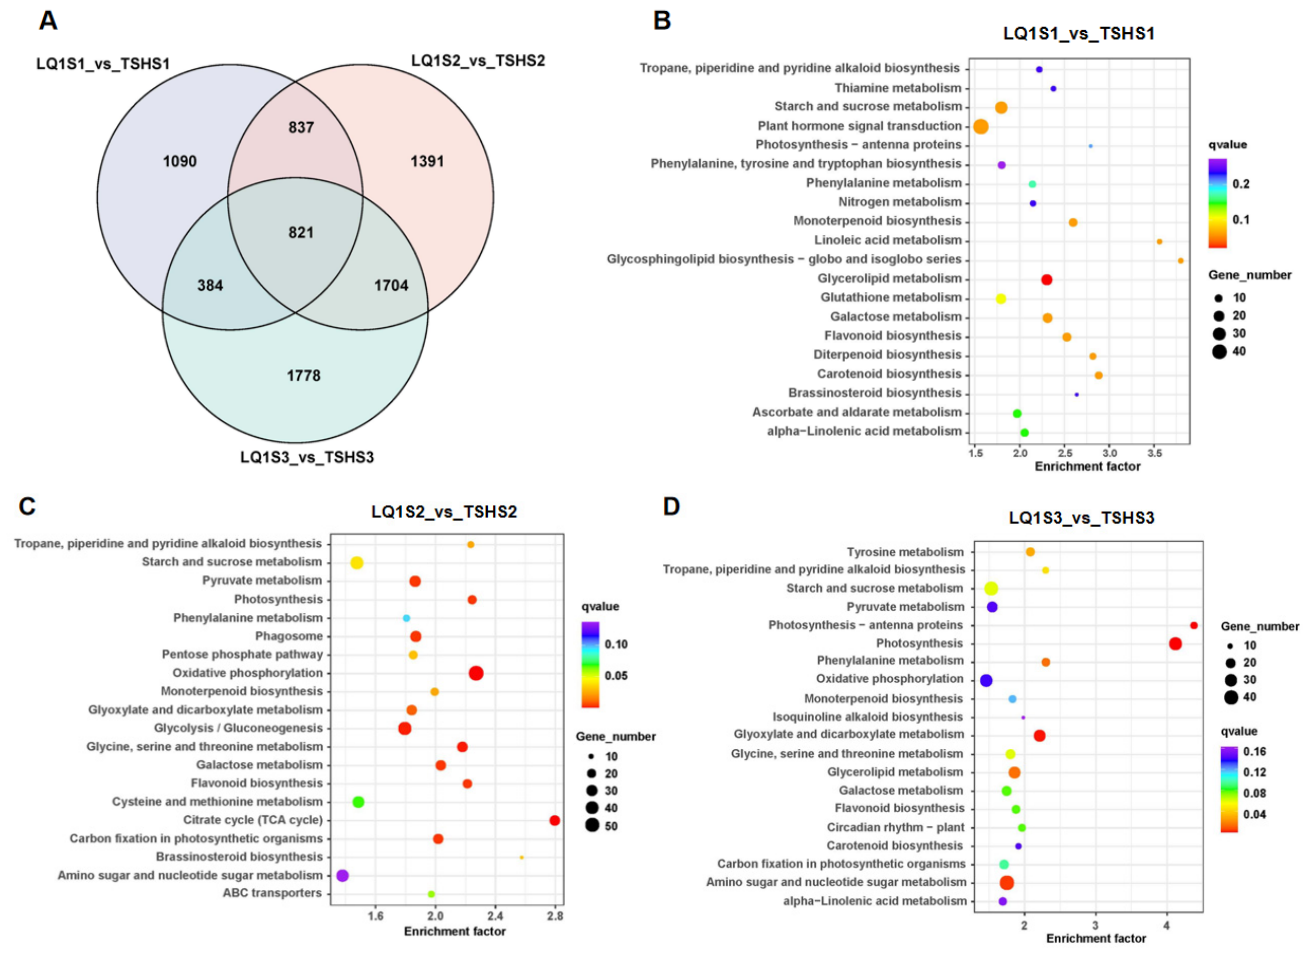
Venn diagram analysis identified 821 DEGs shared between the two cultivars at the same developmental stage (Figure 3A). KEGG pathway analysis showed that most DEGs were enriched in plant hormone signal transduction (45), starch and sucrose metabolism (27), and phenylpropanoid biosynthesis (26) in LQ1S1_vs_TSHS1 comparison (Figure 3B). In the comparison between LQ1S2 and TSHS2, the dominant functional categories enriched among DEGs were oxidative phosphorylation (54), Glycolysis/Gluconeogenesis (43), and starch and sucrose metabolism (41) (Figure 3C). Most DEGs were enriched in amino sugar and nucleotide sugar metabolism (42), starch and sucrose metabolism (38) and Photosynthesis (33) in LQ1S3_vs_TSHS3 comparison (Figure 3D).
Figure 3.
Differentially expressed genes (DEGs) identification and KEGG analysis in two varieties during the identical developmental stage. (A) Venn diagram analysis of DEGs. (B) Kyoto Encyclopedia of Genes and Genomes (KEGG) enrichment analysis during the LQ1S1_vs_TSHS1 period. (C) KEGG enrichment analysis during the LQ1S2_vs_TSHS2 period. (D) KEGG enrichment analysis during the LQ1S3_vs_TSHS3 period.
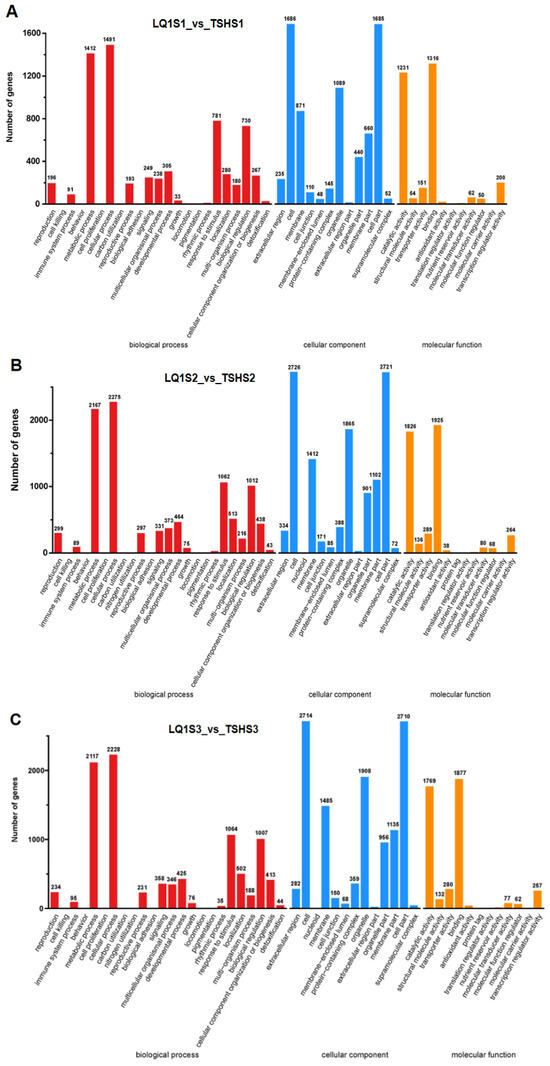
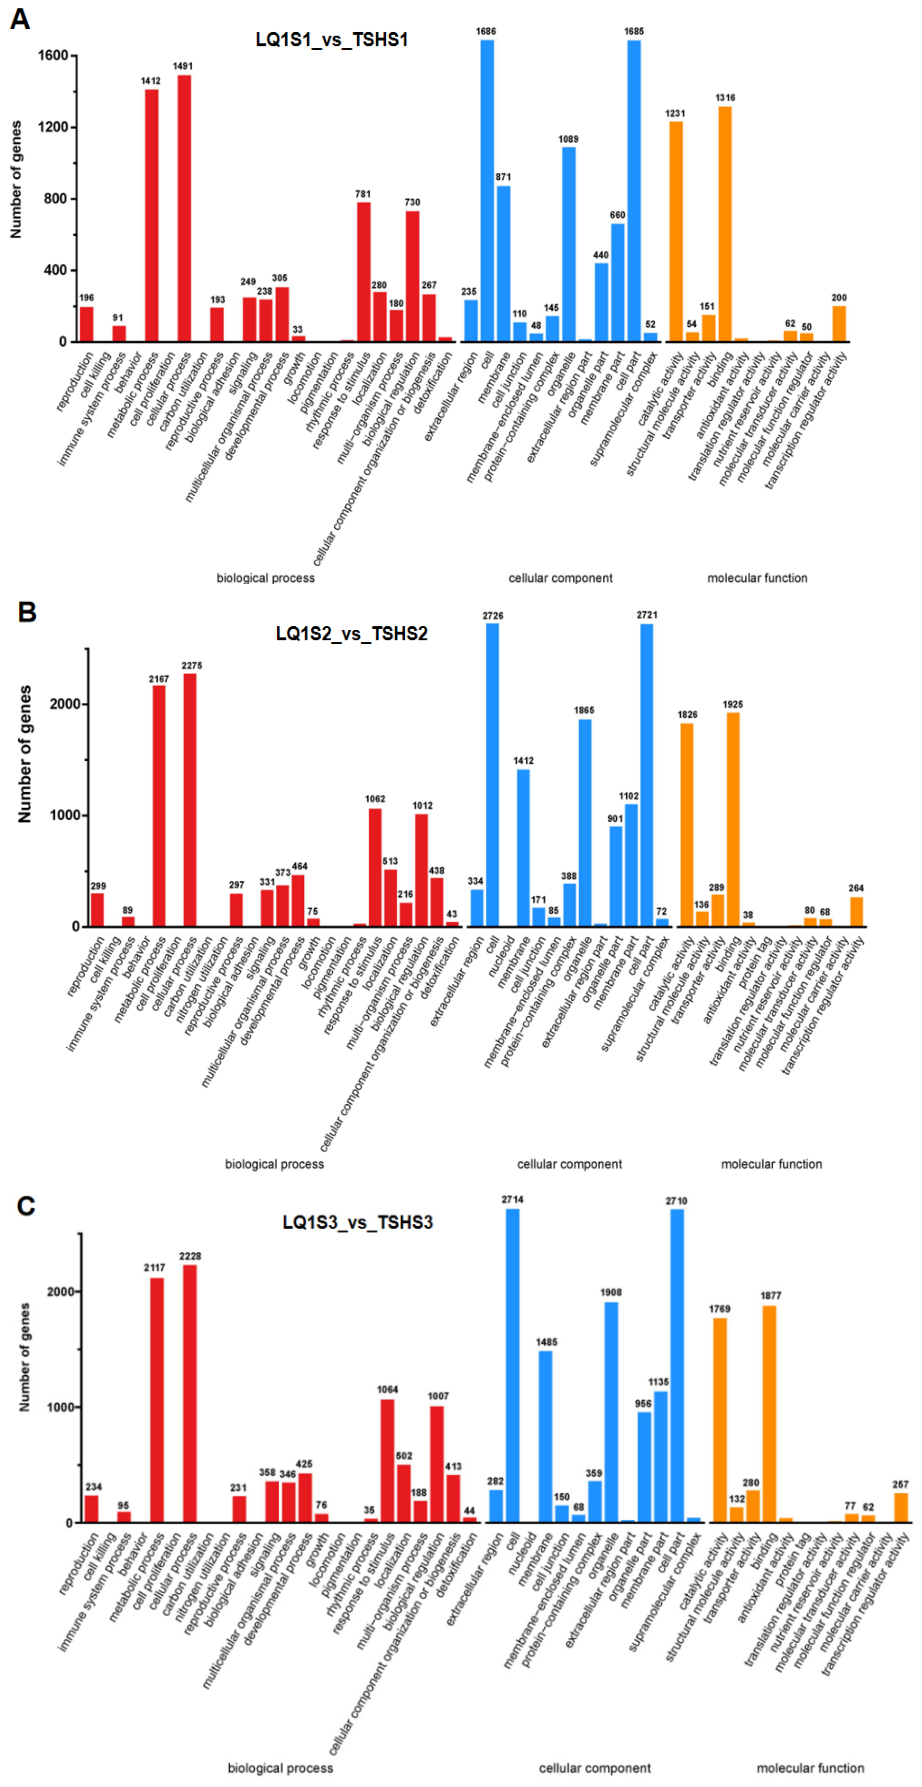
GO analysis showed that DEGs were primarily distributed across biological process, cellular component, and molecular function categories. (Figure 4). The largest number of DEGs were annotated to cellular process (1491) under biological process, cell (1686) under cellular component, and binding (1316) under molecular function in the LQ1S1_vs_TSHS1 comparison (Figure 4A). For the LQ1S2_vs_TSHS2 and LQ1S3_vs_TSHS3 comparisons, most DEGs were annotated to cellular process and metabolic process in biological process, cell and cell part in cellular component, and binding and catalytic activity in molecular function, respectively (Figure 4B,C). The LQ1S2_vs_TSHS2 comparison showed the greatest number of DEGs in the cellular (2275) and metabolic processes (2167), cell (2726) and cell part (2721), binding (1925), and catalytic activity (1826).
Figure 4.
GO enrichment analysis of differential expression gene (DEGs) in two varieties during the identical developmental stage. (A) GO enrichment analysis in the LQ1S1_vs_TSHS1 comparison. (B) GO enrichment analysis in the LQ1S2_vs_TSHS2 comparison. (C) GO enrichment analysis in the LQ1S3_vs_TSHS3 comparison.
3.4. DEGs Associated with Anthocyanin Metabolism in Two Cultivars During Fruit Development
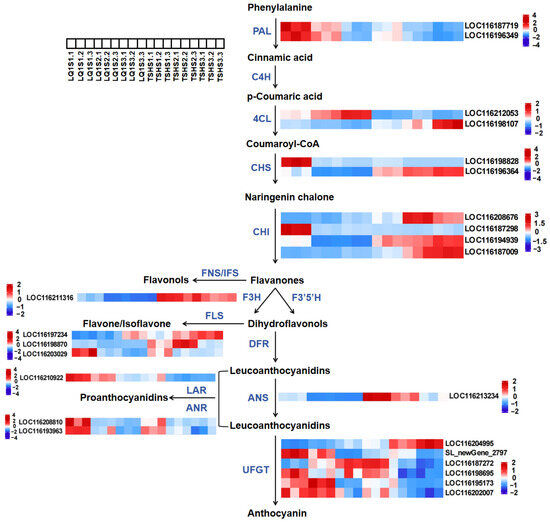
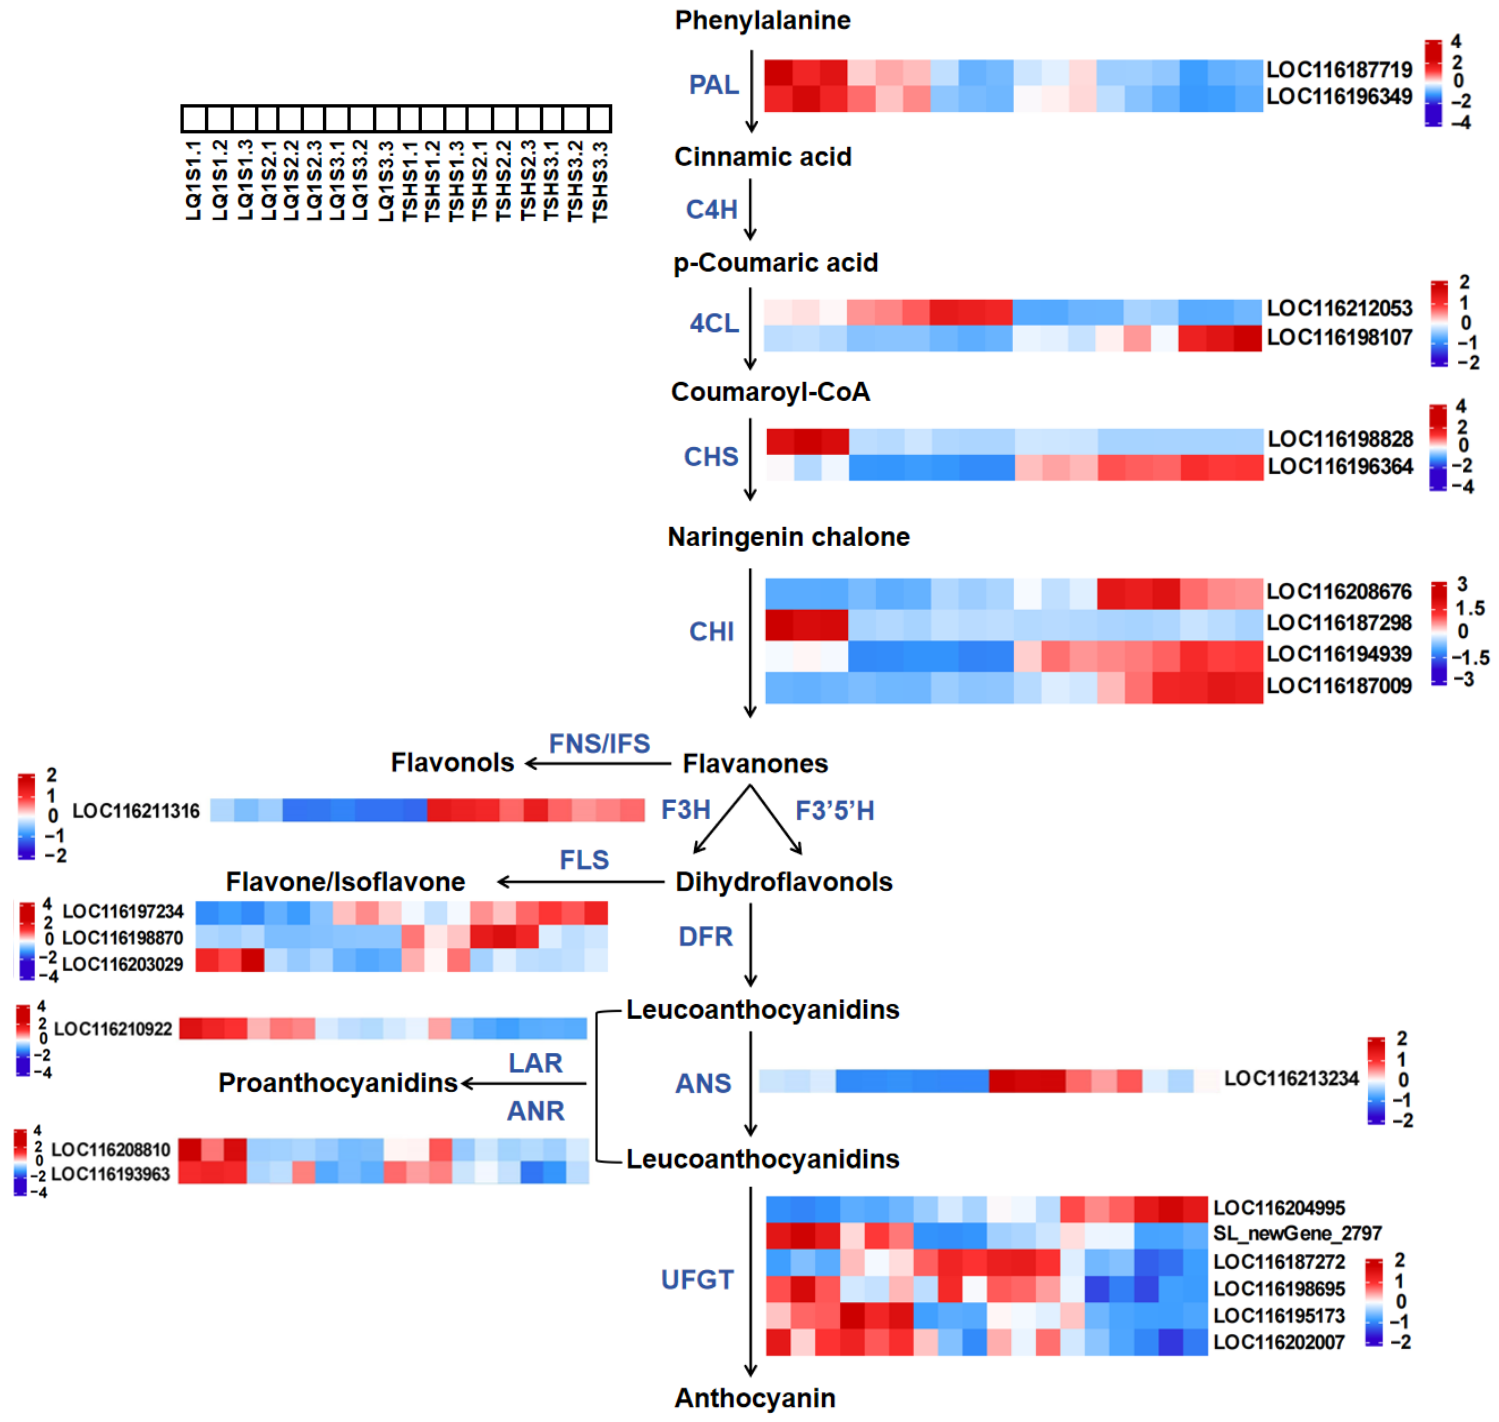
Twenty-four DEGs were found to be associated with anthocyanin metabolism (Figure 5). These included two members of the PAL gene family, as well as genes from the 4CL, CHS, and ANR families. The F3H, ANS, and LAR genes each had one member, while CHI, FLS, and UFGT comprised four, three, and six members, respectively. Expression levels of the two PAL genes, LOC116187719 and LOC116196349, in the peels of both cultivars exhibited a progressive decline throughout development, with peak expression observed at stage S1. Expression of the two PAL genes was significantly higher in LQ1 relative to TSH. LQ1 exhibited a substantial increase in the expression of both PAL genes when compared to TSH. The expression level of the 4CL gene LOC116212053 gradually increased in LQ1 and peaked during the S3 stage, which first increased and then decreased in TSH. The expression level of the 4CL gene LOC116198107 gradually decreased in LQ1 and reached its peak in the S1 period, and gradually increased in TSH and reached its peak in the S3 period. The 4CL gene LOC116212053 demonstrated heightened expression in LQ1 compared to TSH, while LOC116198107 exhibited superior expression in TSH relative to LQ1. The CHS gene LOC116198828 in LQ1 exhibited elevated expression compared to TSH, with maximal levels observed during the S1 period. Expression of the CHS gene LOC116196364 exhibited a progressive increase in TSH and a simultaneous decrease in LQ1, with the overall expression level in TSH being substantially greater than that in LQ1.
Figure 5.
Expression patterns of the DEGs involved in anthocyanins metabolism in pomegranate peel at S1, S2, and S3. The color scale from blue to red represents the FPKM values, from low to high.
The identification of four CHI genes involved in the regulation of anthocyanin metabolism had been achieved. Among them, LOC116208676 and LOC116187009 exhibited a progressive rise in LQ1, culminating in their maximal expression during the S3 period. The LOC116208676 gene showed a pattern of initial elevation and subsequent decrease, achieving maximum expression during the S2 period in TSH. The expression of LOC116194939 showed a progressive reduction in LQ1 and a gradual increase in TSH, with peak levels occurring at S1 and S3, respectively. The trend of LOC116187009 was consistent with an upward progression in both cultivars. The expression levels of LOC116208676, LOC116194939, and LOC116187009 were substantially higher in TSH than in LQ1.
The expression levels of the F3H (LOC116211316), ANS (LOC116213234) and FLS (LOC116203029) gene steadily decreased in both cultivars, following a similar trend. Their expression levels peaked at S1, with F3H and ANS showing higher peaks in TSH than in LQ1, whereas FLS exhibited a higher peak in LQ1 than in TSH. The expression level of the FLS gene LOC116197234 increased steadily in both cultivars, reaching highest point at the S3 stage, with TSH showing higher expression than LQ1. The FLS gene LOC116198870 showed a decrease first and then an increase in LQ1, and first an increase and then a decrease in TSH, with its peak occurring during the S1 and S2 periods respectively. The LAR gene LOC116210922 and the ANR genes LOC116208810 and LOC116193963 displayed a general declining pattern over the two cultivars, attaining their highest levels during the S1 period. The peak values of these three genes in LQ1 were higher than those of TSH. The expression of the UFGT gene LOC116204995 in the two cultivars increased gradually and peaked at the S3 stage. Generally, the TSH expression level was substantially higher than that of LQ1. For the genes SL_newGene_2797 and LOC116202007, which belong to the UFGT family, their expression levels showed a gradual decrease in LQ1. The former increased and then decreased in TSH, while the latter gradually decreased. The expression level of the UFGT gene LOC116187272 gradually increased in LQ1 and gradually decreased in TSH.
The correlation analysis of anthocyanin and its regulated DEGs indicated that the expression levels of Pg4CL2 (LOC116198107), PgCHI4 (LOC116187009), PgUFGT1 (LOC116204995), and PgFLS1 (LOC116197234) were strongly correlated with anthocyanin content (Figure S3A). The expression levels of PgCHI1 (LOC116208676), PgCHI3 (LOC116194939), PgCHS2 (LOC116196364) and PgF3H (LOC116211316) were also closely related to the content of anthocyanin.
3.5. DEGs Associated with Carotenoid Metabolism in Two Cultivars During Fruit Development
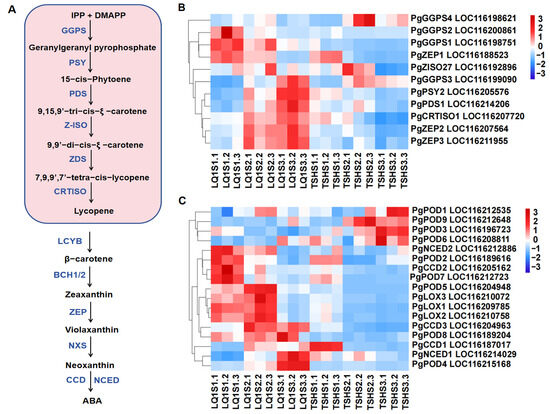
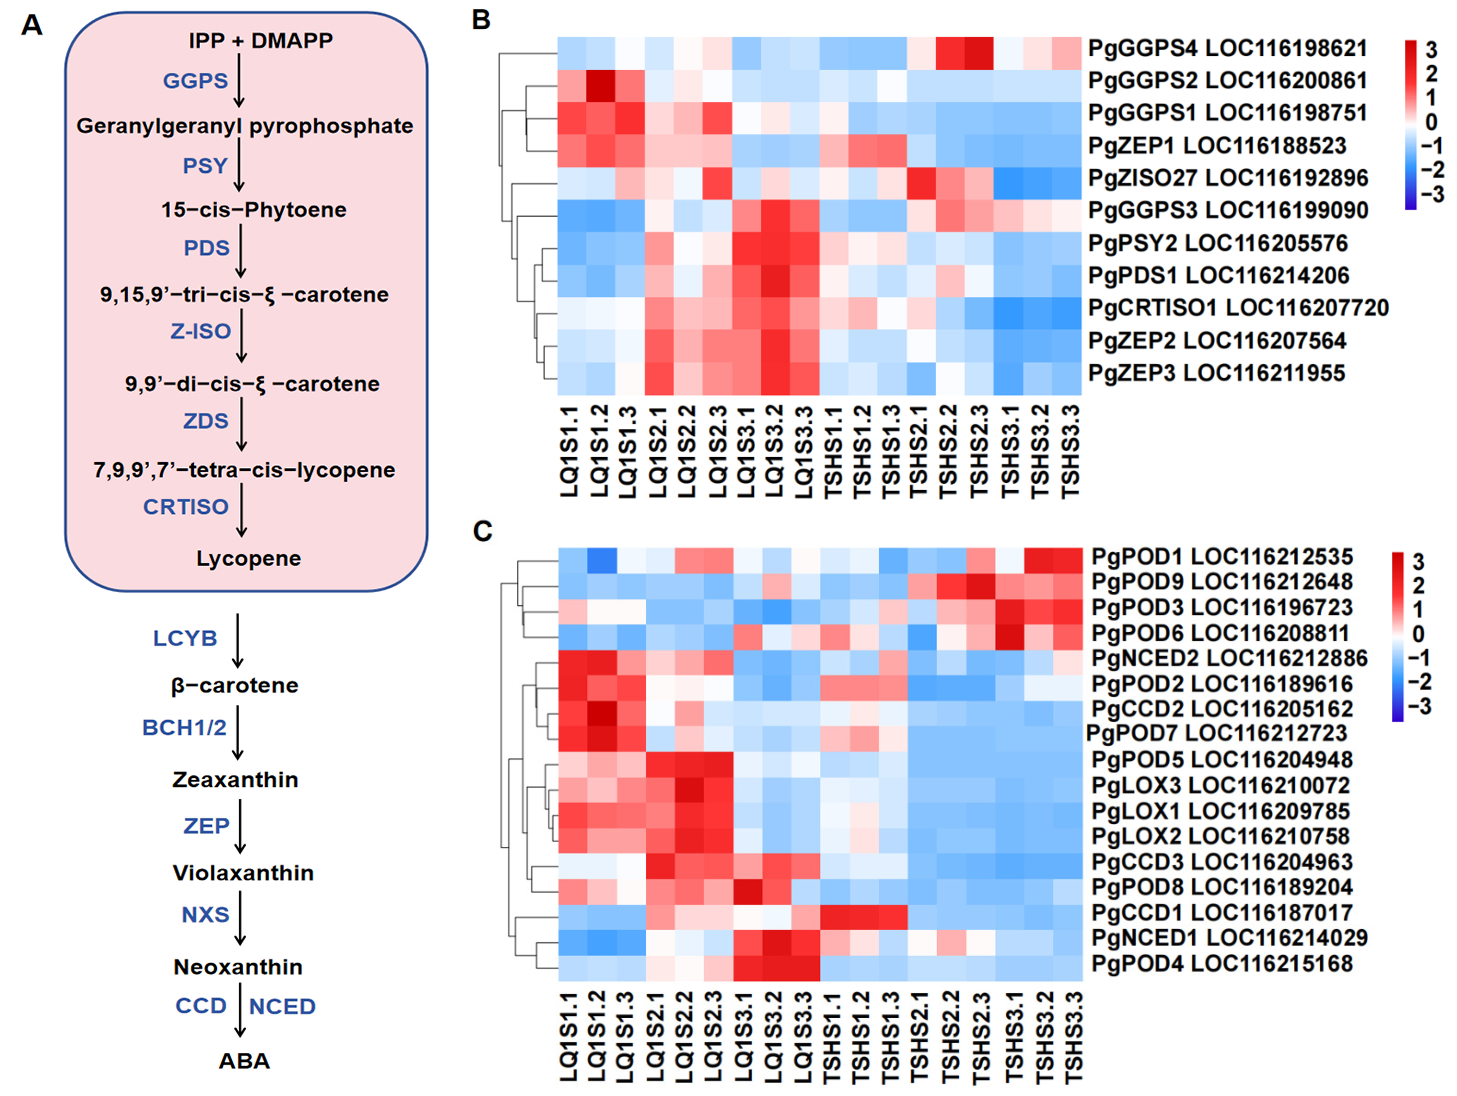
The metabolic pathways involved in carotenoid biosynthesis and degradation were illustrated in Figure 6A. Twenty-eight DEGs were identified involved in carotenoid biosynthesis, comprising 11 that promote synthesis and 17 that regulate degradation. The eleven synthetic genes comprised four GGPS, three ZEP, one PSY, one ZISO27, and one CRTISO1 each (Figure 6B). The expression levels of the PgGGPS1, PgGGPS2 and PgZEP1 genes gradually declined in both cultivars and reached their highest point during the S1 stage. The expression levels of the PgGGPS3, PgPSY2, PgPDS1, PgCRTISO1, PgZEP2 and PgZEP3 genes increased progressively during the LQ1 developmental phase, culminating in their highest point in the S3 stage. Expressions of PgGGPS3 and PgPDS1 genes first increased, then decreased, whereas those of PgCRTISO1, PgPSY2, PgZEP2 and PgZEP3 genes declined steadily. The expression levels of the PgGGPS4 and PgZISO27 genes elevated initially and then declined in the two cultivars, reaching their peak during the S2 stage.
Figure 6.
Expression patterns of the DEGs involved in carotenoid metabolism in pomegranate peel at S1, S2, and S3. The color scale from blue to red represents the FPKM values, from low to high. (A) The metabolic pathway of carotenoid. (B) Expression patterns of the DEGs involved in carotenoid synthesis. (C) Expression patterns of the DEGs involved in carotenoid degradation.
Genes associated with carotenoid degradation in pomegranate were identified, including CCD, NCED, LOX, and POD genes (Figure 6C). The number of these genes was 3, 2, 3 and 9, respectively. The expression levels of PgPOD1, PgPOD3, PgPOD6, and PgPOD9 in TSH peaked at S2 or S3 and were markedly higher than those in LQ1. In contrast, PgNCED2, PgPOD2, PgCCD2, and PgPOD7 reached their highest expression at the LQ1 S1 stage, substantially exceeding the levels observed in TSH. The expression levels of PgPOD5, PgLOX1, PgLOX2, and PgLOX3 were greater in LQ1 compared to TSH, with the maximum occurring during the S2 period. The expression amounts of PgCCD3 and PgPOD8 were greater in LQ1 during S2 and S3 stages, markedly higher compared to TSH. For LQ1, the expression levels of PgNCED1 and PgPOD4 were highest at stage S3, whereas PgCCD1 had the highest expression at stage S1 in TSH. The correlation analysis suggested that the content of carotenoids was closely associated with the expression levels of PgPOD5, PgLOX1, PgLOX2, PgLOX3, PgPOD2, PgZEP1, PgGGPS2, PgCCD2, PgPOD7, PgGGPS1, and PgNCED2 (Figure S3B).
3.6. DEGs Associated with Photosynthesis and Chlorophyll Metabolism in Two Cultivars During Fruit Development
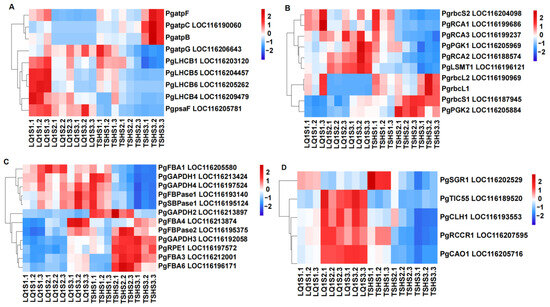
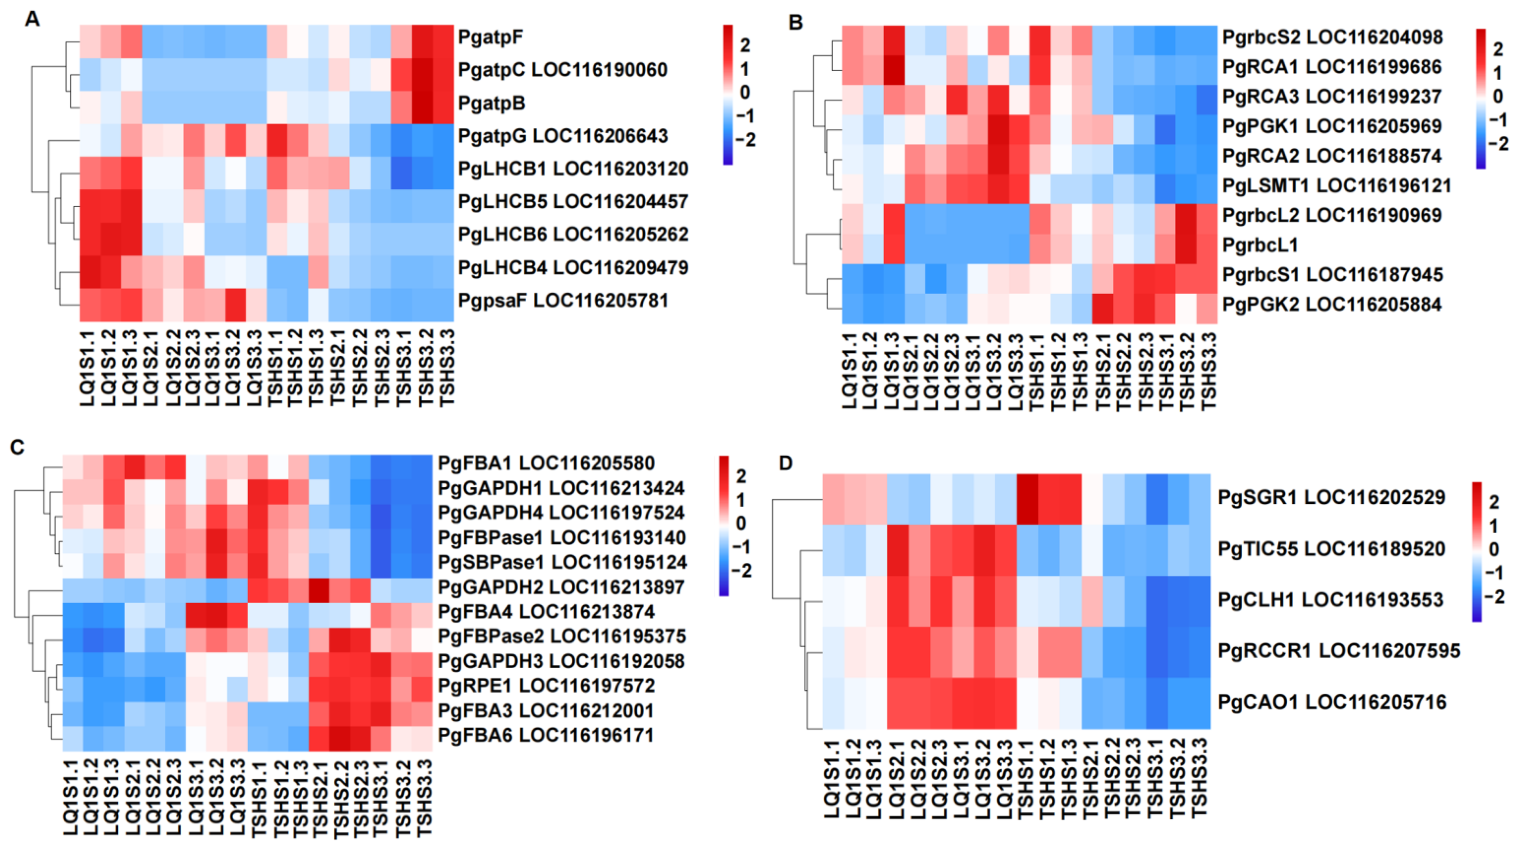
This investigation elucidated nine genes related to the light-dependent reactions of photosynthesis. Among them, the PgatpB, PgatpC, PgatpF and PgatpG genes encoded subunits of the chloroplast ATP synthase, which directly participated in the energy conversion of the photosynthetic process. The PgatpB, PgatpC, and PgatpF genes were found to be more highly expressed in TSH than in LQ1, reaching maximum expression during the S3 stages. The PgatpG gene gradually increased in LQ1 and gradually decreased in the TSH. Its expression level was highest during the TSH S1 period. The PgLHCB1, PgLHCB4, PgLHCB5, PgLHCB6, and PgpsaF exhibited a progressive decline across the developmental stages of both cultivars, with peak expression observed during the LQ1S1 period (Figure 7A). Twenty-two key rate-determining regulatory enzymes within the Calvin cycle were successfully identified. The expression level of PgRCA1 gradually decreased in both cultivars and reached its highest level during the S1 period in LQ1. The PgrbcS2 gene first decreased and then increased in LQ1, gradually decreased in TSH, and had the highest expression level during the S1 period in the LQ1 group (Figure 7B). The expression levels of PgRCA2, PgRCA3, PgPGK1, and PgLSMT1 gradually increased in the LQ1 group and gradually decreased in the TSH group. The peak occurred in LQ1 during the S3 period. The expression levels of PgrbcL2 and PgrbcL1 gradually decreased in the LQ1. They first decreased and then increased in TSH, with the highest levels observed during the S3 period. The expression levels of PgrbcS1 gradually increased in both cultivars, reaching their peak during the S3 period for TSH. PgPGK2 gradually increased in LQ1 and first rose, then decreased in TSH, reaching its highest level during the S2 period. The expression level of PgFBA1 first increased and then decreased in LQ1, gradually decreased in TSH, and peaked during the S2 period in LQ1 (Figure 7C). The expression levels of PgGAPDH1 gradually decreased in both cultivars. PgGAPDH4 decreased first and then increased in LQ1, and gradually decreased in TSH. All of these reached their highest levels of TSH during the S1 period. PgFBPase1 and PgSBPase1 gradually increased in LQ1 and gradually decreased in TSH, both reaching their peak during the S3 period in LQ1. The expression level of PgFBA4 gradually increased in both cultivars, reaching its peak in the S3 stage of LQ1. The expression levels of PgFBA3, PgFBA6, PgFBPase2, PgGAPDH2, PgGAPDH3, and PgRPE1 first increased and then decreased in TSH, reaching the highest level during the S2 period.
Figure 7.
Expression patterns of the DEGs involved in photosynthesis and chlorophyll metabolism in pomegranate peel at S1, S2, and S3. The color scale from blue to red represents the FPKM values, from low to high. (A) Expression patterns of the DEGs involved in photosynthesis. (B,C) Expression patterns of the DEGs involved in Calvin cycle. (D) Expression patterns of the DEGs involved in chlorophyll metabolism.
The PgSGR1, PgTIC55, PgCLH1, PgRCCR1, and PgCAO1 genes were closely related to chlorophyll metabolism (Figure 7D). The expression levels of PgSGR1 gradually decreased in both cultivars, peaking in TSH during the S1 period. The expression levels of PgCAO1 and PgTIC55 gradually increased in LQ1 and reached their peak during the S3 period. The former gradually decreased, whereas the latter first increased and then decreased in TSH. The expression levels of PgTIC55 and PgRCCR1 first increased and then decreased in LQ1, reaching their peak during the S2 period. The former first increased and then decreased, whereas the latter gradually decreased in TSH. Correlation analysis indicated that chlorophyll content was significantly correlated with the expression levels of the light reaction regulatory genes PgLHCB1, PgLHCB4, PgLHCB5, PgLHCB6, PgpsaF, PgRCA1, and PgrbcS2 (Figure S4A). Chlorophyll content was closely related to the expression levels of the regulatory genes PgFBA1, PgGAPDH1, and PgGAPDH4 (Figure S4B).
3.7. Identification of Major Transcription Factors (TFs) Regulating Pigment Metabolism in Pomegranate Peel During Fruit Development
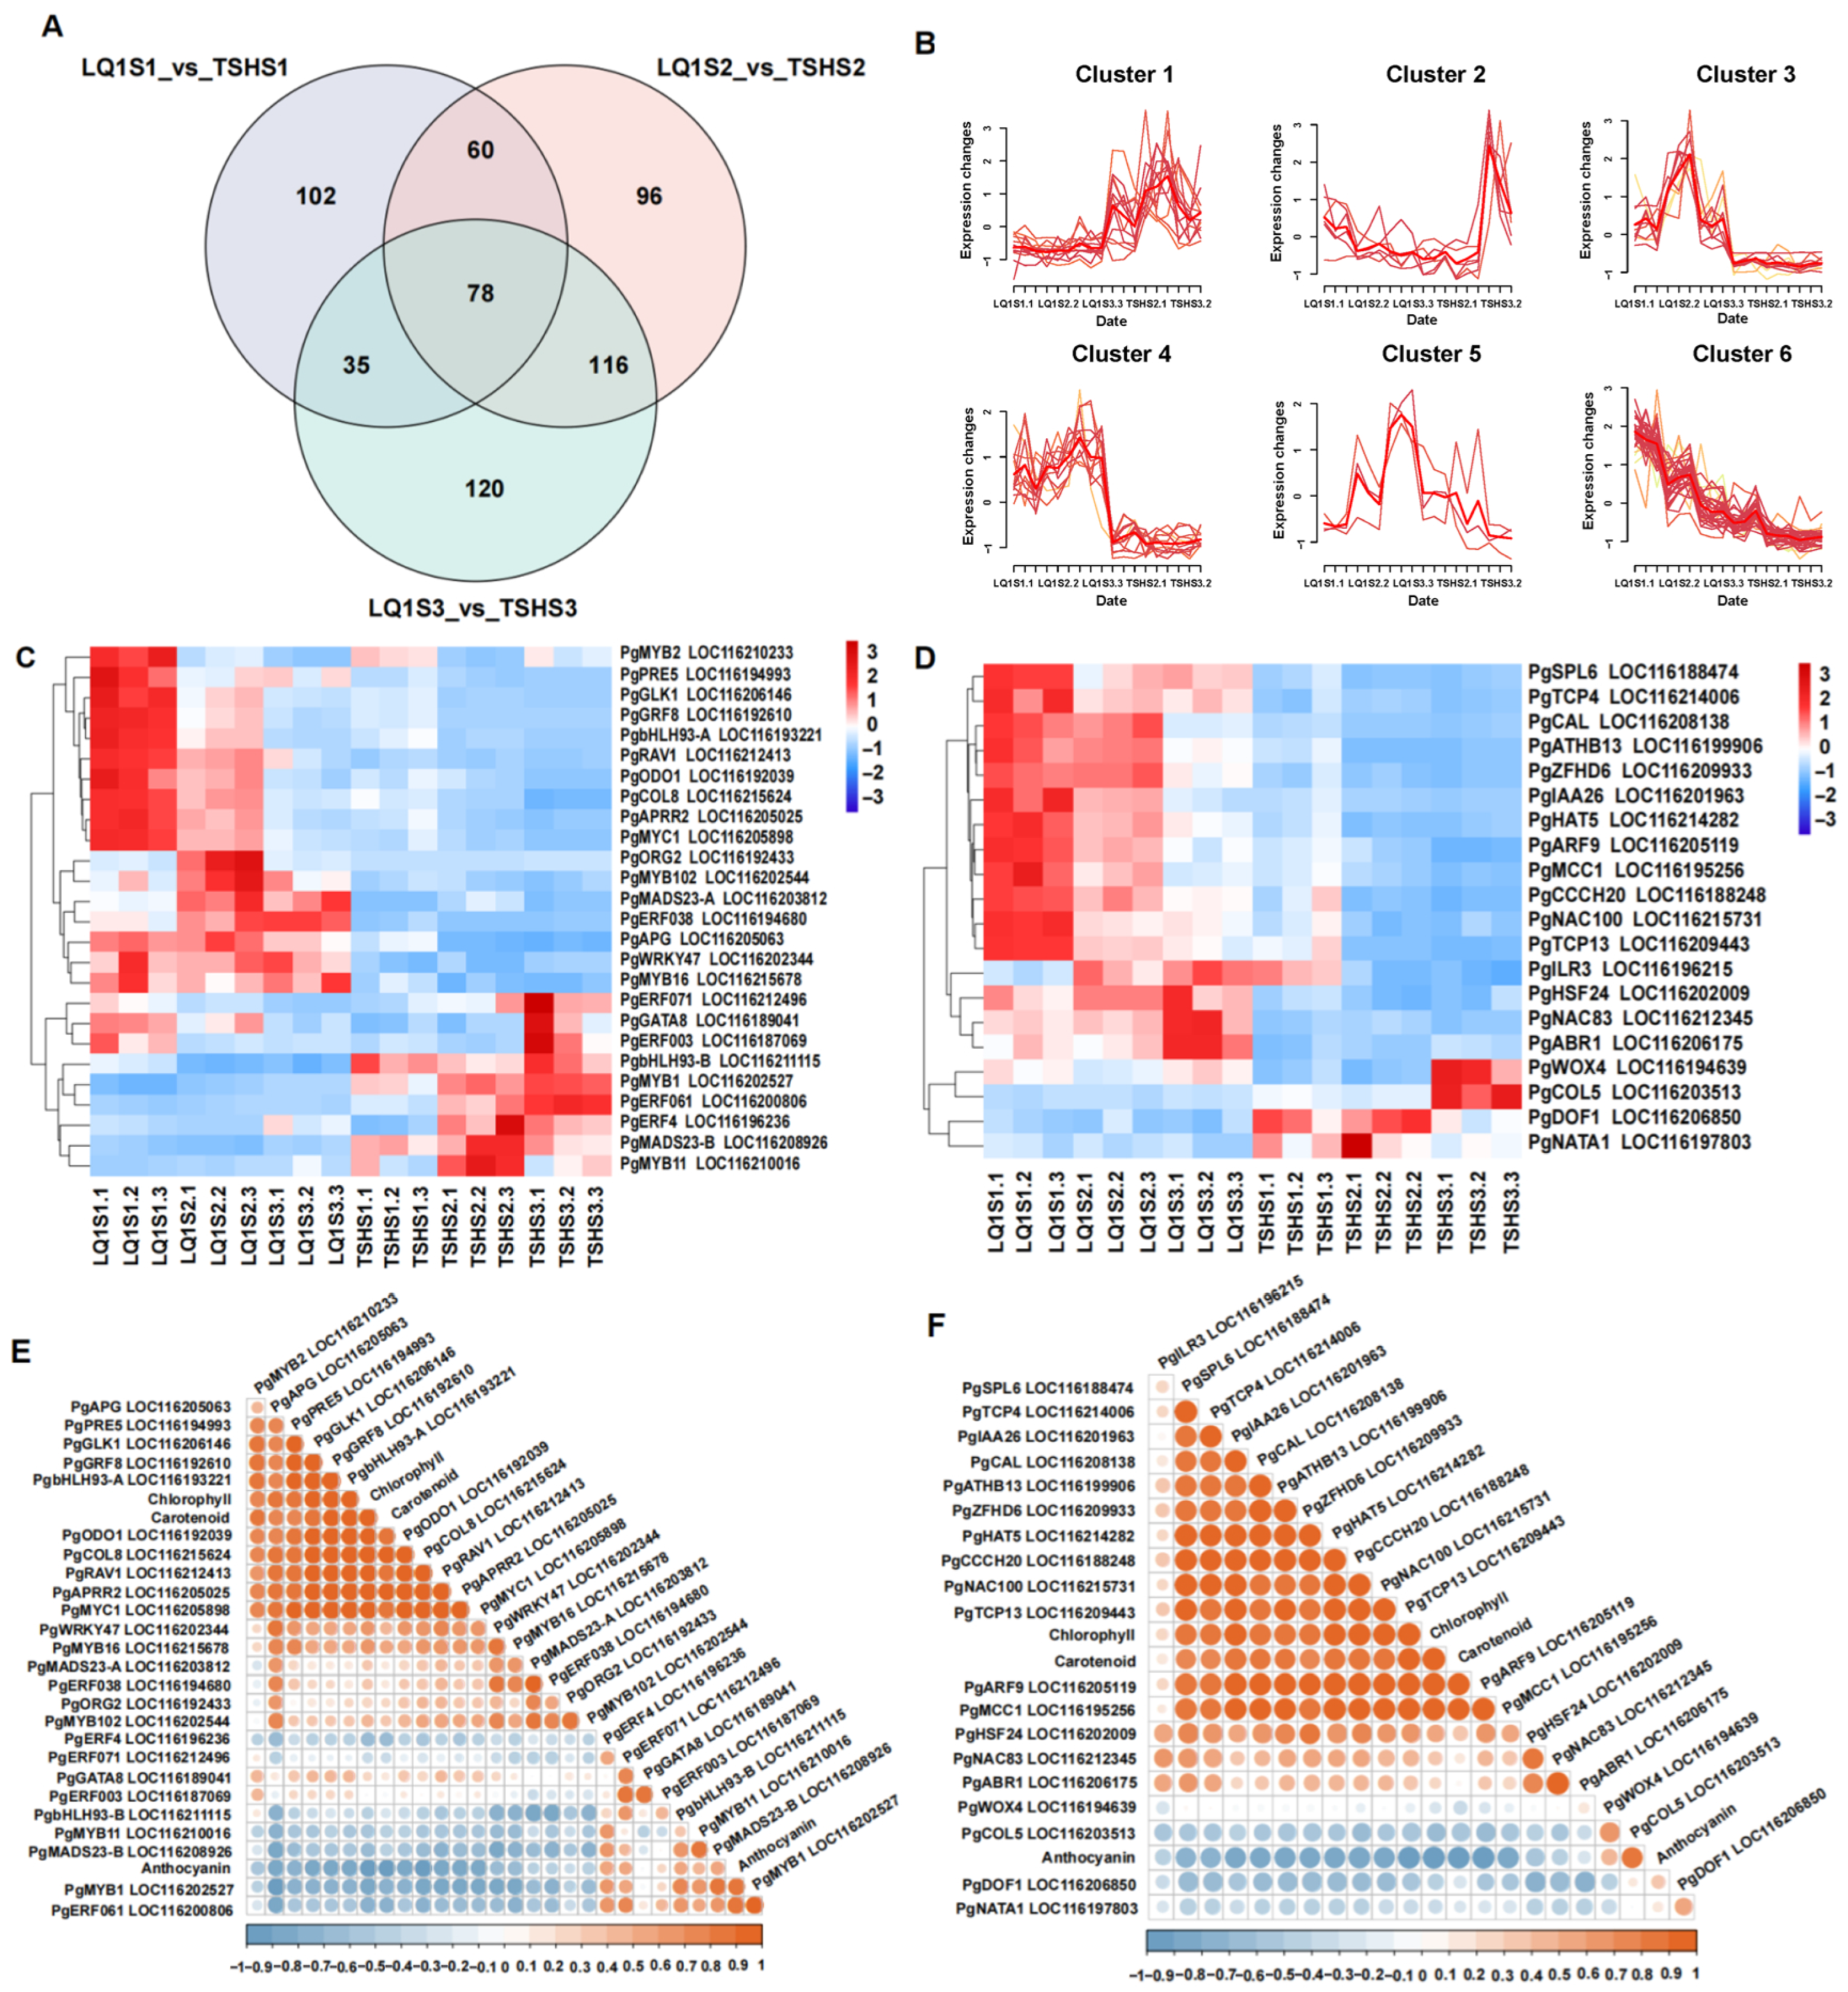
Venn diagram analysis indicated that 73 transcription factors exhibited co-expression across different time points in the LQ1 (Figure S5A), of which 20 were also found to be co-expressed in TSH (Figure S5B). The Venn diagram analysis of differential transcription factors between the two cultivars over the same temporal period revealed 78 common transcription factors (Figure 8A). The 78 identified transcription factors, representing both varieties, were successfully grouped into six major classifications (Figure 8B). The S1 period of LQ1 was characterized by the maximal relative expression of the PgAPRR2, PgbHLH93-A, PgCOL8, PgGLK1, PgMYB2, PgMYC1, PgODO1, PgPRE5, and PgRAV1 transcription factors (Figure 8C). Transcription factors PgbHLH93-B, PgERF003, PgERF061, PgERF071, PgGATA8 and PgMYB1 exhibited peak expression levels during the S3 period of TSH. The expression levels of the transcription factors PgERF4, PgMADS23-B, and PgMYB11 were highest during the S2 period of TSH. The maximum expression of the transcription factors PgCOL5 and PgWOX4 was observed in the S3 period of TSH (Figure 8D). Conversely, PgDOF1 and PgNATA1 achieved their highest expression levels during the S2 period. Twelve transcription factors, such as PgARF9, PgIAA26 and PgNAC100, displayed their highest expression during the S1 period of LQ1. A close relationship was established between the chlorophyll and carotenoid contents and the expression levels of PgAPG, PgAPRR2, PgARF9, PgATHB13, PgbHLH93-A, PgCAL, PgCCCH20, PgCOL8, PgGLK1, PgHAT5, PgIAA26, PgMCC1, PgMYB2, PgMYC1, PgNAC100, PgODO1, PgPRE5, PgRAV1, PgSPL6, PgTCP4, PgTCP13 and PgZFHD6 (Figure 8E,F). The anthocyanin contents demonstrated a significant correlation with the expression of PgCOL5, PgERF061, and PgMYB1, and exhibited certain associations with PgbHLH93-B, PgERF4, PgERF071, PgMADS23-B, and PgMYB11.
Figure 8.
Identification of transcription factors (TFs) regulating pigments metabolism in pomegranate peel during fruit development. (A) Venn diagram analysis of differential TFs. (B) Mfuzz analysis of 78 differential TFs. In each cluster, the thin lines represent the expression trajectories of individual genes, while the thick red line indicates the overall expression trend (cluster center) across the samples.(C) Expression patterns of major transcription factors. (D) Expression patterns of major transcription factors. (E) Correlation analysis of anthocyanin, chlorophyll and carotenoid contents with the expression of major transcription factors. (F) Correlation analysis of anthocyanin, chlorophyll and carotenoid contents with the expression of major transcription factors.
3.8. Validation of DEGs with Quantitative Real-Time Reverse Transcription Polymerase Chain Reaction (qRT-PCR)
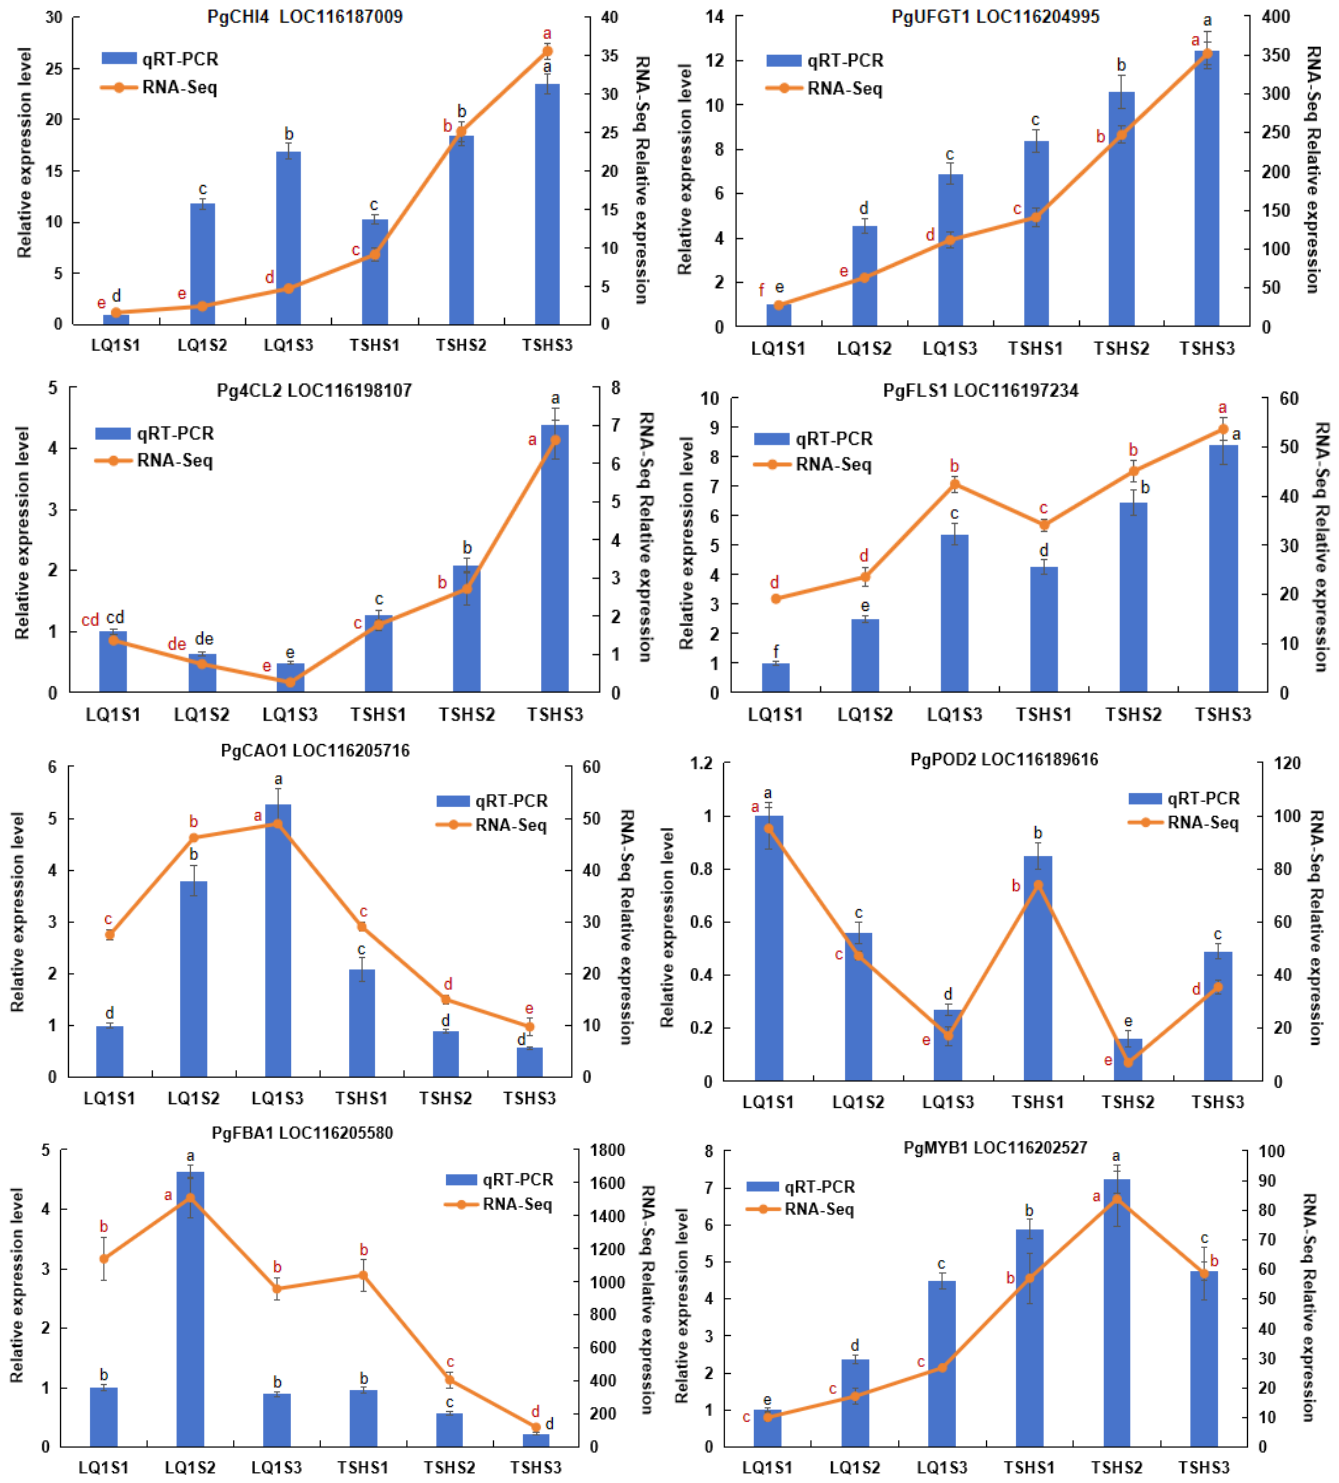
Following transcriptome analysis, eight differentially expressed genes (DEGs) were selected for validation by quantitative real-time reverse transcription polymerase chain reaction (qRT-PCR). The qRT-PCR results corroborated the RNA-sequencing data, demonstrating consistent expression trends for PgCHI4, PgUFGT1, Pg4CL2, PgFLS1, PgCAO1, PgPOD2, PgFBA1, and PgMYB1 across both cultivars throughout fruit development (Figure 9).
Figure 9.
qRT-PCR verification of the expression levels of 8 DEGs in the pomegranate peels at different developmental stages of two cultivars. The expression levels obtained by RNA-seq and qRT-PCR are shown with a line chart and histogram, respectively. Data are presented as the mean ± standard deviation of three biological replicates. Significant variations in gene expression levels (p < 0.05) are marked by different lowercase letters, where black signifies qRT-PCR and red signifies RNA-seq.
4. Discussion
4.1. Differences in Pigment Contents and DEGs Identification in the Two Pomegranate Cultivars
Coloration is the essential characteristic of fruit development, which is mainly regulated by the combined action of anthocyanins, chlorophyll, and carotenoids [17,34,35]. In the study, the anthocyanin content in the fruit peel gradually increased during the development process of the two pomegranate cultivars, whereas the carotenoid and chlorophyll contents gradually decreased. The trend of anthocyanin content in two cultivars was similar to that in ‘Danruo No. 1’ pomegranate [2], apple [36] and grape [37]. The reduction in carotenoid levels observed across both pomegranate cultivars during development aligns with findings previously reported for blueberry [38] and Coffea arabica [39]. Nevertheless, the increase in carotenoid content throughout the maturation of the ‘Danruo No.1’ pomegranate may be attributed to the cultivar’ s inherent biological characteristics [2]. The decrease in chlorophyll content in the two cultivars was similar to the results in litchi [21] and grape [40]. TSH exhibited a significantly higher anthocyanin concentration than LQ1, but notably lower levels of chlorophyll and carotenoids. These findings suggest that the red pigmentation in TSH is primarily driven by anthocyanin accumulation, whereas the coloration of LQ1 is mainly attributed to chlorophyll and carotenoid metabolism.
The S1_vs_S3 comparison group exhibited the highest number of differentially expressed genes (DEGs) in both TSH and LQ1. These within-cultivar comparisons primarily reflect transcriptional changes associated with developmental transitions between stages S1 and S3, rather than genotype effects. Genotype-specific differences in gene expression were therefore inferred from between-cultivar comparisons at the same developmental stage, such as LQ1S1_vs_TSHS1. GO enrichment analysis revealed that DEGs in the LQ1S2_vs_TSHS2 comparison were predominantly assigned to the biological process categories of cellular process and metabolic process and to the cellular component categories of cell and cell part. KEGG enrichment analysis demonstrated that these DEGs were enriched in the phenylalanine metabolism, flavonoid biosynthesis, photosynthesis, and carotenoid biosynthesis pathways (Figure 3), suggesting that these pathways are vital for fruit coloration in pomegranates [41].
4.2. Key Genes and Transcription Factors Related to Anthocyanin Metabolism in Two Cultivars
Extensive evidence confirms that the biosynthesis of phenylpropanoids and flavonoids is intrinsically linked to anthocyanin production in plants [42]. Phenylalanine is sequentially converted into 4-coumaroyl-CoA through the catalytic actions of PAL, C4H, and 4CL [43]. We identified two PAL and two 4CL genes in both TSH and LQ1. The expression of the PAL gene declined progressively throughout the developmental period in two cultivars. The 4CL genes exhibited different change patterns in TSH and LQ1, and Pg4CL2 (LOC116198107) was strongly correlated with anthocyanin content. Anthocyanin formation is mediated by the sequential catalytic action of key enzymes, specifically CHS, CHI, F3H, DFR, ANS, and UFGT [25]. It has been established that the structural genes encoding these enzymes are critical for the regulation of anthocyanin synthesis [8,44]. The complex gene interactions within this pathway suggest that isolated modifications may produce unintended repercussions throughout the entire pathway [45]. A total of 24 genes involved in anthocyanin metabolism were identified across the two pomegranate cultivars, encompassing CHS, CHI, F3H, FLS, ANS, LAR, ANR, and UFGT. These structural genes displayed notable differences in their expression patterns across the various developmental stages of TSH and LQ1. The expression levels of PgCHI4 (LOC116187009), PgFLS1 (LOC116197234), and PgUFGT1 (LOC116204995) gradually increased with the development stage and were higher in TSH than in LQ1. Their expression levels were strongly correlated with anthocyanin content. PgFLS1 showed a positive correlation with anthocyanin accumulation, which may appear counterintuitive because FLS and DFR typically compete for dihydroflavonol substrates [46]. However, no DFR gene was identified in the present dataset. The positive correlation may therefore reflect coordinated activation of the flavonoid pathway and/or copigmentation effects of flavonols, rather than direct competition limiting anthocyanin synthesis. This interpretation remains speculative and requires further functional validation.
PgCHI1 (LOC116208676), PgCHI3 (LOC116194939), PgCHS2 (LOC116196364) and PgF3H (LOC116211316) were also related to anthocyanin content. These findings were consistent with previously reported for Malus ‘Pinkspire’ [47], litchi [48] and octoploid strawberry [26]. Anthocyanin metabolic pathways are modulated at the transcriptional level by various transcription factors that activate or repress the expression of structural genes [14,15,17]. The expression of the transcription factors PgCOL5, PgERF061, and PgMYB1 was significantly correlated with anthocyanin content. PgCOL5, a CONSTANS-LIKE (COL) gene belonging to the B-box (BBX) transcription factor family, was differentially expressed between the two cultivars. Members of the BBX/COL family have been reported to promote light-induced anthocyanin accumulation in pomegranate fruit [29]. PgCOL5 showed higher expression in the red-peeled cultivar, we hypothesize that it may participate in anthocyanin regulation during fruit development. However, this interpretation is based on correlative evidence, and further functional validation will be required to confirm its role. Studies have been conducted on the process of PgMYB1 binding to the PgGSTF6 promoter in pomegranate, which promotes the accumulation of anthocyanins [49].
4.3. Key Genes and Transcription Factors Related to Carotenoid Metabolism in Two Cultivars
Extensive research has been conducted on the metabolism of carotenoids during the ripening stages of diverse plants, including blueberry [38], apple [50] and Capsicum annuum [51]. Geranylgeranyl pyrophosphate synthase (GGPS) serves as a critical enzyme in the terpenoid biosynthetic pathway, facilitating the production of geranylgeranyl pyrophosphate (GGPP), a fundamental precursor for carotenoid synthesis [52]. Analysis revealed 11 DEGs involved in carotenoid biosynthesis and 17 contributing to their degradation in two cultivars. The expression of PgGGPS1 (LOC116198751) and PgGGPS2 (LOC116200861) was found to be closely linked to carotenoid accumulation. Zeaxanthin was transformed into violaxanthin via antheraxanthin by zeaxanthin epoxidase (ZEP). The expression profile of PgZEP1 (LOC116188523) demonstrated a strong correlation with carotenoid accumulation, aligning with prior findings in papaya [53], loquat [54] and citrus [55]. The enzymatic degradation of carotenoids encompasses the hydroxylase, carotenoid cleavage dioxygenase (CCD), and lipoxygenase pathways [56]. The CCD gene family, which consisted of the CCD and NCED subfamilies, includes three CCD and two NCED genes in pomegranate. The expression of PgCCD2 (LOC116205162) and PgNCED2 (LOC116212886) was closely correlated with carotenoid degradation. These findings align with the research conducted in blueberry [38], Edgeworthia chrysantha [57] and peach [58]. The LOX and POD gene indirectly mediate carotenoid degradation via co-oxidation in cucumber [59]. The expression levels of PgLOX1, PgLOX2, PgLOX3, PgPOD2, PgPOD5, and PgPOD7 were closely correlated with carotenoid contents. However, the specific regulatory mechanisms require further investigation. Transcription factors, such as WRKYs, MYBs, and NACs, have been shown to play a role in transcriptional regulation during carotenoid metabolism [50,60]. The expression levels of the transcription factors PgMYB2, PgbHLH93-A, PgNAC100, PgARF9, PgAPRR2, PgGLK1 PgSPL6, and PgTCP4 were closely related to carotenoid metabolism in two pomegranate cultivars. DcRPGE1 (DcRPGE1W) interacts with the transcription factor DcAPRR2 to inhibit the expression of carotenoid biosynthesis genes DcPSY1, DcPSY2, and DcLCYE, effectively suppressing carotenoid production in wild carrots [61]. The PgAPRR2 was implicated in pomegranate carotenoid metabolism, the precise regulatory mechanisms involved remain to be elucidated. Nuclear-encoded GOLDEN2-LIKE (GLK) transcription factors are involved in the regulation of carotenoid biosynthesis, linking plastid maturation and pigment metabolism. Overexpression of the GLK1 gene (OsGLK1) leads to enhanced carotenoid production and increased grain yield in rice [62]. PgGLK1 appeared to be a key regulator of carotenoid metabolic processes in pomegranate, potentially influencing the differentiation and abundance of chloroplasts and chromoplasts.
4.4. Key Genes and Transcription Factors Related to Chlorophyll Metabolism in Two Cultivars
Chlorophyll serves as the primary photosynthetic pigment responsible for the characteristic green pigmentation in plants [63]. The LHCB gene family serves as an essential component of PSII in plant photosynthesis, primarily facilitating the capture and conversion of light energy [64,65]. Chlorophyll content was significantly correlated with the expression levels of PgLHCB1, PgLHCB4, PgLHCB5, and PgLHCB6 genes in pomegranate (Figure S4A). The key enzymes that have been confirmed to be involved in the Calvin cycle include RuBisCO activase (RCA), phosphoglycerate kinase (PGK), glyceraldehyde-3-phosphate dehydrogenase (GAPDH), fructose-1,6-bisphosphatase (FBPase), fructose-1,6-bisphosphate aldolase (FBA), and sedoheptulose-1,7-bisphosphatase (SBPase) [66]. The expression levels of PgpsaF, PgRCA1, PgrbcS2, PgFBA1, PgGAPDH1, and PgGAPDH4 genes were closely related to chlorophyll content in pomegranates. These processes may be controlled by a common regulatory network. When chlorophyll content is high, the ability to capture light energy is stronger, and the expression of related genes is upregulated, maintaining the efficiency of photosynthesis. The RCCR genes acted as pivotal regulators that accelerate chlorophyll degradation process in winter jujube [67]. The expression levels of PgRCCR1 had a certain correlation with chlorophyll content in the pomegranates. However, the specific regulatory mechanisms require further investigation. The transcription factor ARF9 directly activates the SGRa promoter to enhance its expression, playing a crucial role in chlorophyll degradation in bamboos [63]. The transcription factor PgARF9 in pomegranates was also closely related to chlorophyll content. CRMYB33 and NACs transcription factors regulate chlorophyll degradation during citrus [20] and litchi [21] fruit development. PgMYB2 and PgNAC100 were closely associated with chlorophyll degradation in pomegranate. Nevertheless, the exact regulatory mechanism remains to be further elucidated.
4.5. Internal and External Factors Regulating Pomegranate Peel Coloration
Fruit coloration is governed by the interplay between internal regulatory networks and external environmental factors, including fruit developmental stage, cultivation conditions, light intensity, temperature, abiotic stress of gene expression and enzymatic activity [68,69,70]. In this study, the two pomegranate cultivars were grown under identical field conditions, and fruit age was represented by defined developmental stages, thereby minimizing environmental variation. Peel color was selected as the primary phenotypic trait because it is the most visible quality attribute of pomegranate fruit and a key determinant of consumer preference, market value, and cultivar differentiation. The contrasting red and green peel phenotypes further provided a clear basis for identifying transcriptional changes associated with pigment accumulation. Our results indicate that the observed differences in peel coloration were primarily associated with cultivar-specific expression patterns of anthocyanin, carotenoid, chlorophyll metabolism and regulatory genes. Nevertheless, we acknowledge that microenvironmental conditions, cultivation practices, and enzymatic regulation may also contribute to fruit coloration. In future studies, comparative analyses of fruit coloration among different cultivars will help dissect the cultivar-specific regulatory network of anthocyanin accumulation. Combined with functional characterization of key transcription factors including MYB, bHLH, and NAC these efforts will facilitate the molecular breeding of new cultivars with improved color quality and stable pigmentation in pomegranate under variable environmental conditions.
5. Conclusions
Throughout the development of the ‘Taishanhong’ (red-skinned) and ‘Luqing 1’ (green-skinned) cultivars, there was a progressive accumulation of anthocyanins, coupled with a corresponding reduction in carotenoid and chlorophyll content in the study. TSH displayed a substantially higher anthocyanin concentration than LQ1, alongside significantly lower levels of chlorophyll and carotenoids. The S1_vs_S3 comparison group displayed the greatest quantity of DEGs in two cultivars. These DEGs were enriched in the phenylalanine metabolism, flavonoid biosynthesis, photosynthesis, and carotenoid biosynthesis pathways. Twenty-four genes related to anthocyanin metabolism were identified, among which PgCHI4, PgFLS1, and PgUFGT1 showed strong correlations with anthocyanin content. A total of 28 DEGs associated with carotenoid metabolism were identified in two cultivars. Of these, PgGGPS1, PgGGPS2 and PgZEP1 were tightly linked to carotenoid biosynthesis, while PgCCD2 and PgNCED2 were closely associated with carotenoid degradation. Chlorophyll metabolism was regulated by multiple genes, such as LHCB, FBA, psaF, RCA, GAPDH, and RCCR. A total of 78 transcription factors were identified, which potentially modulate anthocyanin, carotenoid, and chlorophyll metabolism. These TFs included members of the MYB, ERF, bHLH, and NAC, ARF families. The present study provides a theoretical basis for dissecting the molecular mechanisms responsible for peel color development in pomegranate fruit. Cultivar-specific expression of anthocyanin biosynthetic and regulatory genes primarily underlies peel color variation between the two pomegranate cultivars under controlled field conditions. Future studies integrating environmental and post-transcriptional data will further elucidate the joint regulation of fruit coloration by internal and external factors.
Supplementary Materials
The following supporting information can be downloaded at https://www.mdpi.com/article/10.3390/agronomy16212143/s1. Figure S1: Principal component and correlation analyses of 18 samples; Figure S2: Heatmap of differentially expressed genes (DEGs) clustering; Figure S3: Correlation analysis of anthocyanin and carotenoid contents and their regulatory genes; Figure S4: Correlation analysis of chlorophyll contents and their regulatory genes; Figure S5: Venn diagram of transcription factor differences between two varieties at different stages; Table S1: Quality statistics of sequencing data for different pomegranate samples; Table S2: Primers for qRT-PCR analysis of DEGs.
Author Contributions
L.F.: writing—review and editing, writing—original draft, methodology, formal analysis, data curation, conceptualization. C.W.: writing—review and editing, writing—original draft, formal analysis, data curation, conceptualization. C.J.: writing—review and editing, writing— methodology, data curation. Q.J.: writing—review and editing, writing—original draft, methodology, data curation. J.Y.: writing—review and editing, writing—original draft, data curation. J.Z.: writing—review and editing, data curation. Y.L.: writing—review and editing, resources, data curation. H.S.: writing—review and editing, writing—review and editing, resources, data curation. Z.Z.: writing—review and editing, writing—methodology, data curation. Y.Y.: writing—review and editing, writing—original draft, methodology, formal analysis, data curation, conceptualization, funding acquisition. All authors have read and agreed to the published version of the manuscript.
Funding
This work was supported the by Key R&D Program of Shandong Province, China (2024LZGC028, 2023TZXD072), the Agricultural Science & Technology Innovation Project of Shandong Academy of Agricultural Sciences (CXGC2026B16), the Technical System of Fruit Industry in Shandong Province (SDAIT-06-23), and the earmarked fund for China Agriculture Research System for Special Fruits (CARS-31).
Data Availability Statement
The original contributions presented in this study are included in the article/Supplementary Materials. Further inquiries can be directed to the corresponding author.
Conflicts of Interest
Authors Yongshuai Li, Huaping Sun and Zhenkai Zhang were employed by Zhongyi Agricultural Science and Technology Development (Shandong) Co., Ltd. The remaining authors declare that the research was conducted in the absence of any commercial or financial relationships that could be construed as a potential conflict of interest.
References
- Yan, M.; Zhao, X.; Zhou, J.; Huo, Y.; Ding, Y.; Yuan, Z. The complete chloroplast genomes of Punica granatum and a comparison with other species in Lythraceae. Int. J. Mol. Sci. 2019, 20, 2886. [Google Scholar] [CrossRef] [Scilit]
- Wang, X.; Yang, C.; Zhu, W.; Weng, Z.; Li, F.; Teng, Y.; Zhou, K.; Qian, M.; Deng, Q. Transcriptomic analysis reveals the mechanism of color formation in the peel of an evergreen pomegranate cultivar ‘Danruo No.1’ during fruit development. Plants 2024, 13, 2903. [Google Scholar] [CrossRef] [Scilit]
- Noreen, S.; Hashmi, B.; Aja, P.M.; Atoki, A.V. Phytochemicals and pharmacology of pomegranate (Punica granatum L.): Nutraceutical benefits and industrial applications: A review. Front. Nutr. 2025, 12, 1528897. [Google Scholar] [CrossRef] [Scilit]
- Zhang, M.; Tang, X.; Mao, B.; Zhang, Q.; Zhao, J.; Chen, W.; Cui, S. Pomegranate: A comprehensive review of functional components, health benefits, processing, food applications, and food safety. J. Agric. Food Chem. 2025, 73, 5649–5665. [Google Scholar] [CrossRef] [Scilit]
- He, C.; Zhang, D.; Mao, Y.; Mkunga, J.J.; Fei, L.; Chen, P.; Shan, C.; Yang, X.; Cai, W. Integrative analysis of metabolite changes and potential health effects in pomegranate juice fermentation. Food Biosci. 2025, 64, 105934. [Google Scholar] [CrossRef] [Scilit]
- Chen, Y.; Gao, H.; Wang, S.; Liu, X.; Hu, Q.; Jian, Z.; Wan, R.; Song, J.; Shi, J. Comprehensive evaluation of 20 pomegranate (Punica granatum L.) cultivars in China. J. Integr. Agric. 2022, 21, 434–445. [Google Scholar] [CrossRef] [Scilit]
- Bar-Ya’akov, I.; Tian, L.; Amir, R.; Holland, D. Primary metabolites, anthocyanins, and hydrolyzable tannins in the pomegranate fruit. Front. Plant Sci. 2019, 10, 620. [Google Scholar] [CrossRef] [Scilit]
- Shu, P.; Qing, Y.; Sheng, J.; Yao, X.; Zhang, Z.; Shen, L. Integrated analysis of metabolomics and transcriptomics reveals potential transcription factors regulating anthocyanin synthesis in pomegranate fruit. Sci. Hortic. 2026, 355, 114570. [Google Scholar] [CrossRef] [Scilit]
- Li, F.; Tahir, M.M.; Yang, C.; Weng, Z.; Zhu, W.; Zhang, Y.; Zhou, K.; Deng, Q.; Qian, M.; Wu, H. Postharvest UV-A treatment promotes mango fruit pigmentation and ripening in a dose-dependent manner. Postharvest Biol. Technol. 2025, 230, 113836. [Google Scholar] [CrossRef] [Scilit]
- Fu, X.; Cheng, S.; Liao, Y.; Huang, B.; Du, B.; Zeng, W.; Jiang, Y.; Duan, X.; Yang, Z. Comparative analysis of pigments in red and yellow banana fruit. Food Chem. 2018, 239, 1009–1018. [Google Scholar] [CrossRef] [Scilit]
- Zhao, Y.; Jiang, C.; Lu, J.; Sun, Y.; Cui, Y. Research progress of proanthocyanidins and anthocyanidins. Phytother. Res. 2023, 37, 2552–2577. [Google Scholar] [CrossRef] [Scilit]
- Tan, H.; Li, L.; Tie, M.; Lu, R.; Pan, S.; Tang, Y. Transcriptome analysis of green and purple fruited pepper providesinsight into novel regulatory genes in anthocyanin biosynthesis. Peer J. 2024, 12, e16792. [Google Scholar] [CrossRef] [Scilit]
- Espley, R.V.; Jaakola, L. The role of environmental stress in fruit pigmentation. Plant Cell Environ. 2023, 46, 3663–3679. [Google Scholar] [CrossRef] [Scilit]
- Yang, L.; Wang, G.; Liu, T.; Deng, S. The MYB transcription factor RtAN2 promotes anthocyanin accumulation over proanthocyanidin during the fruit ripening of rose myrtle berries. Ind. Crops Prod. 2025, 224, 120433. [Google Scholar] [CrossRef] [Scilit]
- Shi, Y.; Lu, T.; Lai, S.; Li, S.; Zhang, L.; Liu, R.; Ouyang, L.; Zhao, X.; Jiang, Y.; Yan, Z.; et al. Rosa rugosa R2R3-MYB transcription factors RrMYB12 and RrMYB111 regulate the accumulation of flavonols and anthocyanins. Front. Plant Sci. 2024, 15, 1477278. [Google Scholar] [CrossRef] [Scilit]
- Qi, M.; Tian, X.; Chen, Y.; Lu, Y.; Zhang, Y. WD40 proteins PaTTG1 interact with both bHLH and MYB to regulate trichome formation and anthocyanin biosynthesis in Platanus acerifolia. Plant Sci. 2025, 352, 112385. [Google Scholar] [CrossRef] [Scilit]
- Do, V.G.; Kim, S.; Lee, Y.; Yang, S.; Kim, J.H.; Win, N.M.; Kwon, Y.S.; Park, J.; Park, J.T. Differential coloration, pigment biosynthesis-related gene expression, and accumulation according to developmental stage in the ‘Enbu’ apple. Horticulturae 2023, 9, 1072. [Google Scholar] [CrossRef] [Scilit]
- Zhang, W.; Xie, Y.; Yuan, Y.; Long, Q.; Shao, Z.; Zheng, J.; Ru, X.; Luo, J.; Pan, G.; Babalola, O.O.; et al. Metabolism and regulation of chlorophyll and carotenoids in tomato fruits. Hortic. Res. 2026, 13, uhag084. [Google Scholar] [CrossRef] [Scilit]
- Wu, M.; Xu, X.; Hu, X.; Liu, Y.; Cao, H.; Chan, H.; Gong, Z.; Yuan, Y.; Luo, Y.; Feng, B.; et al. SlMYB72 regulates the Metabolism of Chlorophylls, Carotenoids, and Flavonoids in Tomato Fruit. Plant Physiol. 2020, 183, 854–868. [Google Scholar] [CrossRef] [Scilit]
- Tian, S.; Yang, Y.; Fang, B.; Uddin, S.; Liu, X. The CrMYB33 transcription factor positively coordinate the regulation of both carotenoid accumulation and chlorophyll degradation in the peel of citrus fruit. Plant Physiol. Biochem. 2024, 209, 108540. [Google Scholar] [CrossRef] [Scilit]
- Yang, Y.; Zhang, B.; Wang, D.; Chen, L.; Zhao, M.; Huang, Q.; Wang, M.; Zhang, Z.; Qin, Y.; Zhao, J.; et al. Molecular characterization and functional roles of NAC transcription factors in regulating chlorophyll degradation during litchi fruit ripening. Sci. Hortic. 2025, 341, 113975. [Google Scholar] [CrossRef] [Scilit]
- Lv, J.; Zhang, M.; Bai, L.; Han, X.; Ge, Y.; Wang, W.; Li, J. Effects of 1-methylcyclopropene (1-MCP) on the expression of genes involved in the chlorophyll degradation pathway of apple fruit during storage. Food Chem. 2020, 308, 125707. [Google Scholar] [CrossRef] [Scilit]
- Huang, G.; Zeng, Y.; Wei, L.; Yao, Y.; Dai, J.; Liu, G.; Gui, Z. Comparative transcriptome analysis of mulberry reveals anthocyanin biosynthesis mechanisms in black (Morus atropurpurea Roxb.) and white (Morus alba L.) fruit genotypes. BMC Plant Biol. 2020, 20, 279. [Google Scholar] [CrossRef] [Scilit]
- Cao, K.; Ding, T.; Mao, D.; Zhu, G.; Fang, W.; Chen, C.; Wang, X.; Wang, L. Transcriptome analysis reveals novel genes involved in anthocyanin biosynthesis in the flesh of peach. Plant Physiol. Biochem. 2018, 123, 94–102. [Google Scholar] [CrossRef] [Scilit]
- Keller-Przybylkowicz, S.; Oskiera, M.; Liu, X.; Song, L.; Zhao, L.; Du, X.; Kruczynska, D.; Walencik, A.; Kowara, N.; Bartoszewski, G. Transcriptome analysis of white- and red-fleshed apple fruits uncovered novel genes related to the regulation of anthocyanin biosynthesis. Int. J. Mol. Sci. 2024, 25, 1778. [Google Scholar] [CrossRef] [Scilit]
- Wang, B.; Zhang, C.; Li, J.; Li, X.; Mao, J.; Wang, Y.; Zhang, Z. Transcriptome analysis of fruit development and identification of key transcription factors related to anthocyanin pathway in cultivated octoploid strawberry. Acta Physiol. Plant. 2024, 46, 110. [Google Scholar] [CrossRef] [Scilit]
- Lin, H.; Mao, K.; Chai, S.; Lan, J.; Xiao, H.; Guo, Z.; Pan, T.; She, W. Transcriptomic analysis identifies VvMYB90 and VvNAC92 as key regulators mediating anthocyanin biosynthesis and fruit color differentiation in three grape cultivars. Plant Sci. 2026, 365, 113009. [Google Scholar] [CrossRef] [Scilit]
- Wang, S.; Zhang, X.; Li, B.; Zhao, X.; Shen, Y.; Yuan, Z. Genome-wide identification and characterization of bZIP gene family and cloning of candidate genes for anthocyanin biosynthesis in pomegranate (Punica granatum). BMC Plant Biol. 2022, 22, 170. [Google Scholar] [CrossRef] [Scilit]
- Liu, L.; Zheng, J. Identification and characterization of the BBX gene family in pomegranate (Punica granatum L.) and its potential role in anthocyanin accumulation during fruit ripening. Horticulturae 2025, 11, 507. [Google Scholar] [CrossRef] [Scilit]
- Zhao, X.; Yuan, Z.; Feng, L.; Fang, Y. Cloning and expression of anthocyanin biosynthetic genes in red and white pomegranate. J. Plant Res. 2015, 128, 687–696. [Google Scholar] [CrossRef] [Scilit]
- Zhao, X.; Feng, Y.; Ke, D.; Teng, Y.; Yuan, Z. Comparative transcriptomic and metabolomic profiles reveal fruit peel color variation in two red pomegranate cultivars. Plant Mol. Biol. 2024, 114, 51. [Google Scholar] [CrossRef] [Scilit]
- Mirsaeedghazi, H.; Emam-Djomeh, Z.; Ahmadkhaniha, R. Effect of frozen storage on the anthocyanins and phenolic components of pomegranate juice. J. Food Sci. Technol. 2014, 51, 382–386. [Google Scholar] [CrossRef] [Scilit]
- Wellburn, A.R. The spectral determination of chlorophylls a and b, as well as total carotenoids, using various solvents with spectrophotometers of different resolution. J. Plant Physiol. 1994, 144, 307–313. [Google Scholar] [CrossRef] [Scilit]
- Dai, J.; Xu, Z.; Fang, Z.; Zheng, X.; Cao, L.; Kang, T.; Xu, Y.; Zhang, X.; Zhan, Q.; Wang, H.; et al. NAC transcription factor PpNAP4 promotes chlorophyll degradation and anthocyanin synthesis in the skin of peach fruit. J. Agric. Food Chem. 2024, 72, 19826–19837. [Google Scholar] [CrossRef] [Scilit]
- Liu, M.; Li, T.; Deng, R.; Zhang, Z.; Zhou, Y.; Duan, X.; Jiang, Y.; Jiang, G. Transcription factor AcAGL9 and AcBEH1 synergistically regulate carotenoid biosynthesis during pineapple fruit ripening. Postharvest Biol. Technol. 2025, 222, 113385. [Google Scholar] [CrossRef] [Scilit]
- Ao, P.; Ma, Y.; Luo, K.; Ding, Y.; Zhang, H.; Xu, Y.; Yuan, S.; Zhang, M.; Guo, H.; Li, G.; et al. Transcriptomic and metabolic profiles of apple peels of different colors. Plants 2025, 14, 3304. [Google Scholar] [CrossRef] [Scilit]
- Qin, L.; Xie, H.; Xiang, N.; Wang, M.; Han, S.; Pan, M.; Guo, X.; Zhang, W. Dynamic changes in anthocyanin accumulation and cellular antioxidant activities in two varieties of grape berries during fruit maturation under different climates. Molecules 2022, 27, 384. [Google Scholar] [CrossRef] [Scilit]
- Li, X.; Zhang, D.; Pan, X.; Kakar, K.U.; Nawaz, Z. Regulation of carotenoid metabolism and ABA biosynthesis during blueberry fruit ripening. Plant Physiol. Biochem. 2024, 206, 108232. [Google Scholar] [CrossRef] [Scilit]
- Wang, Z.; Xie, C.; Wu, Y.; Liu, H.; Zhang, X.; Du, H.; Li, X.; Zhang, C. Integrated metabolomics and transcriptomics analyses reveal the regulatory mechanisms of anthocyanin and carotenoid accumulation in the peel of Coffea arabica. Int. J. Mol. Sci. 2024, 25, 10754. [Google Scholar] [CrossRef] [Scilit]
- Lu, S.; Zhang, M.; Zhuge, Y.; Fu, W.; Ouyang, Q.; Wang, W.; Ren, Y.; Pei, D.; Fang, J. VvERF17 mediates chlorophyll degradation by transcriptional activation of chlorophyll catabolic genes in grape berry skin. Environ. Exp. Bot. 2022, 193, 104678. [Google Scholar] [CrossRef] [Scilit]
- Luo, X.; Cao, D.; Li, H.; Zhao, D.; Xue, H.; Niu, J.; Chen, L.; Zhang, F.; Cao, S. Complementary iTRAQ-based proteomic and RNA sequencing-based transcriptomic analyses reveal a complex network regulating pomegranate (Punica granatum L.) fruit peel colour. Sci. Rep. 2018, 8, 12362. [Google Scholar] [CrossRef] [Scilit]
- Jia, D.; Yi, S.; Huang, Q.; Liu, Q.; He, Y.; Liao, G.; Huang, C.; Xu, X. Comprehensive analysis of a red-peel kiwi berry mutant reveals key genes are responsible for anthocyanin biosynthesis in fruit. Sci. Hortic. 2023, 309, 111682. [Google Scholar] [CrossRef] [Scilit]
- Wang, Y.; Zhang, M.; Bao, L.; Long, J.; Cui, X.; Zheng, Z.; Zhao, X.; Huang, Y.; Jiao, F.; Su, C.; et al. Metabolomic and transcriptomic analysis of flavonoids biosynthesis mechanisms in mulberry fruit (Hongguo 2) under exogenous hormone treatments. Plant Physiol. Biochem. 2024, 212, 108773. [Google Scholar] [CrossRef] [Scilit]
- Chen, S.; He, T.; Gu, W.; Li, R.; Qi, Y. Transcriptomic analyses reveal light-induced anthocyanin accumulation in Lycium ruthenicum murray. Horticulturae 2025, 11, 256. [Google Scholar] [CrossRef] [Scilit]
- Li, X.X.; Li, Z.Y.; Zhu, W.; Wang, Y.Q.; Liang, Y.R.; Wang, K.R.; Ye, J.H.; Lu, J.L.; Zheng, X.Q. Anthocyanin metabolism and its differential regulation in purple tea (Camellia sinensis). Plant Physiol. Biochem. 2023, 201, 107875. [Google Scholar] [CrossRef] [Scilit]
- Lei, T.; Huang, J.; Ruan, H.; Qian, W.; Fang, Z.; Gu, C.; Zhang, N.; Liang, Y.; Wang, Z.; Gao, L.; et al. Competition between FLS and DFR regulates the distribution of flavonols and proanthocyanidins in Rubus chingii Hu. Front. Plant Sci. 2023, 14, 1134993. [Google Scholar] [CrossRef] [Scilit]
- Chen, M.; Cao, X.; Huang, Y.; Zou, W.; Liang, X.; Yang, Y.; Wang, Y.; Wei, J.; Li, H. The bZIP transcription factor MpbZIP9 regulates anthocyanin biosynthesis in Malus ‘Pinkspire’ fruit. Plant Sci. 2024, 342, 112038. [Google Scholar] [CrossRef] [Scilit]
- Zhuo, M.G.; Wang, T.Y.; Huang, X.M.; Hu, G.B.; Zhou, B.Y.; Wang, H.C.; Abbas, F. ERF transcription factors govern anthocyanin biosynthesis in litchi pericarp by modulating the expression of anthocyanin biosynthesis genes. Sci. Hortic. 2024, 337, 113464. [Google Scholar] [CrossRef] [Scilit]
- Wang, Z.; Yang, X.; Wang, C.; Feng, L.; Yin, Y.; Li, J. PgMYB1 positively regulates anthocyanin accumulation by activating PgGSTF6 in pomegranate. Int. J. Mol. Sci. 2023, 24, 6366. [Google Scholar] [CrossRef] [Scilit]
- Wang, H.; Tian, Y.; Li, Y.; Wei, J.; Ma, F.; Liang, W.; Li, C. Analysis of carotenoids and gene expression in apple germplasm resources reveals the role of MdCRTISO and MdLCYE in the accumulation of carotenoids. J. Agric. Food Chem. 2023, 71, 15121–15131. [Google Scholar] [CrossRef] [Scilit]
- Song, Y.; Li, X.; Gao, Y.; Wang, Y.; Cheng, Q.; Shen, H.; Sun, L. CaNAC2 orchestrates Capsicum annuum fruit ripening by coordinated carotenoid and ABA metabolism under epigenetic control. Plant Physiol. 2025, 199, kiaf524. [Google Scholar] [CrossRef] [Scilit]
- Fu, C.; Li, W.; Chen, X.; Gao, S.; Jia, M.; Zhang, S.; Cui, J. Genome-wide identification of the potato GGPS gene family and analysis of its response to abiotic stress. Genes 2025, 16, 646. [Google Scholar] [CrossRef] [Scilit]
- Shen, Y.H.; Yang, F.Y.; Lu, B.G.; Zhao, W.W.; Jiang, T.; Feng, L.; Chen, X.J.; Ming, R. Exploring the differential mechanisms of carotenoid biosynthesis in the yellow peel and red flesh of papaya. BMC Genom. 2019, 20, 49. [Google Scholar] [CrossRef] [Scilit]
- Hadjipieri, M.; Georgiadou, E.C.; Marin, A.; Diaz-Mula, H.M.; Goulas, V.; Fotopoulos, V.; Tomás-Barberán, F.A.; Manganaris, G.A. Metabolic and transcriptional elucidation of the carotenoid biosynthesis pathway in peel and flesh tissue of loquat fruit during on-tree development. BMC Plant Biol. 2017, 17, 102. [Google Scholar] [CrossRef] [Scilit]
- Fujii, H.; Nonaka, K.; Minamikawa, M.F.; Endo, T.; Sugiyama, A.; Hamazaki, K.; Iwata, H.; Omura, M.; Shimada, T. Allelic composition of carotenoid metabolic genes in 13 founders influences carotenoid composition in juice sac tissues of fruits among Japanese citrus breeding population. PLoS ONE 2021, 16, e0246468. [Google Scholar] [CrossRef] [Scilit]
- Cheng, D.; Wang, Z.; Li, S.; Zhao, J.; Wei, C.; Zhang, Y. Genome-wide identification of CCD gene family in six Cucurbitaceae species and its expression profiles in Melon. Genes 2022, 13, 262. [Google Scholar] [CrossRef] [Scilit]
- Zhou, N.; Yan, Y.; Wen, Y.; Zhang, M.; Huang, Y. Integrated transcriptome and metabolome analysis unveils the mechanism of color-transition in Edgeworthia chrysantha tepals. BMC Plant Biol. 2023, 23, 567. [Google Scholar] [CrossRef] [Scilit]
- Zhu, M.; Fang, W.; Chen, C.; Wang, L.; Cao, K. Effects of shading by bagging on carotenoid accumulation in peach fruit flesh. J. Plant Growth Regul. 2021, 40, 1912–1921. [Google Scholar] [CrossRef] [Scilit]
- Ding, Y.; Yang, W.; Su, C.; Ma, H.; Pan, Y.; Zhang, X.; Li, J. Tandem 13-lipoxygenase genes in a cluster confers yellow-green leaf in cucumber. Int. J. Mol. Sci. 2019, 20, 3102. [Google Scholar] [CrossRef] [Scilit]
- Wang, Y.; Sun, Y.; Zhou, D.; Zhang, Q.; Pan, L.; Tu, K. Transcriptomics analysis provides insights into metabolisms of sugars and carotenoids of nectarine fruit subjected to different temperature storage. Sci. Hortic. 2022, 304, 111262. [Google Scholar] [CrossRef] [Scilit]
- Wang, Y.G.; Zhang, Y.M.; Wang, Y.H.; Zhang, K.; Ma, J.; Hang, J.X.; Su, Y.T.; Tan, S.S.; Liu, H.; Xiong, A.S.; et al. The Y locus encodes a REPRESSOR OF PHOTOSYNTHETIC GENES protein that represses carotenoid biosynthesis via interaction with APRR2 in carrot. Plant Cell 2024, 36, 2798–2817. [Google Scholar] [CrossRef] [Scilit]
- Li, Z.; Gao, J.; Wang, B.; Xu, J.; Fu, X.; Han, H.; Wang, L.; Zhang, W.; Deng, Y.; Wang, Y.; et al. Rice carotenoid biofortification and yield improvement conferred by endospermspecific overexpression of OsGLK1. Front. Plant Sci. 2022, 13, 951605. [Google Scholar] [CrossRef] [Scilit]
- Pei, J.; Wang, H.; Huang, Z.; Zhang, P.; Cao, Y.; Bu, J.; Lin, X.; Hou, D. Integrated metabolomic and transcriptomic analyses revealed culm color variation in Phyllostachys edulis f. luteosulcata driven by chlorophyll deficiency and flavonoid enrichment. Plant Physiol. Biochem. 2025, 229, 110624. [Google Scholar] [CrossRef] [Scilit]
- Zhang, H.; Wang, Y.; Song, X.; Yang, Y.; Li, Y.; Zhu, Z.; Hou, J.; Wang, W.; Wu, J.; Chen, G.; et al. BcLhcb2.1, a Light-harvesting chlorophyll a/b-binding protein from Wucai, plays a positive regulatory role in the response to Abiotic Stress. Sci. Hortic. 2025, 339, 113759. [Google Scholar] [CrossRef] [Scilit]
- Hu, Z.H.; Zhang, N.; Qin, Z.Y.; Li, J.W.; Tao, J.P.; Yang, N.; Chen, Y.; Kong, J.Y.; Luo, W.; Chen, X.; et al. Circadian rhythm response and its effect on photosynthetic characteristics of the Lhcb family genes in tea plant. BMC Plant Biol. 2024, 24, 333. [Google Scholar] [CrossRef] [Scilit]
- Chen, X.; Chen, B.; Jiang, Y.; Zhang, J.; Liu, M.; Yang, Q.; Liu, H. Melatonin improves salt tolerance in tomato seedlings by enhancing photosystem II functionality and Calvin Cycle activity. Plants 2025, 14, 1785. [Google Scholar] [CrossRef] [Scilit]
- Tan, W.; Yin, Q.; Zhao, H.; Wang, M.; Sun, X.; Cao, H.; Wang, D.; Li, Q. Disruption of chlorophyll metabolism and photosynthetic efficiency in winter jujube (Ziziphus jujuba) Induced by Apolygus lucorum infestation. Front. Plant Sci. 2025, 16, 1536534. [Google Scholar] [CrossRef] [Scilit]
- Fang, H.; Dong, Y.; Yue, X.; Chen, X.; He, N.; Hu, J.; Jiang, S.; Xu, H.; Wang, Y.; Su, M.; et al. MdCOL4 Interaction Mediates Crosstalk Between UV-B and High Temperature to Control Fruit Coloration in Apple. Plant Cell Physiol. 2019, 60, 1055–1066. [Google Scholar] [CrossRef] [Scilit]
- Muhammad, N.; Luo, Z.; Yang, M.; Liu, Z.; Liu, M. The underlying molecular mechanisms of external factors influencing fruit coloration in fruit trees. Sci. Hortic. 2023, 309, 111615. [Google Scholar] [CrossRef] [Scilit]
- Wang, B.; Zhang, L.; Zhang, T.; Ma, Y.; Song, L. Identification of ANS gene regulating fruit color in jujube (Ziziphus jujuba Mill. cv. Lingwuchangzao) and analysis of its expression under elevated temperature and drought stress. BMC Plant Biol. 2024, 24, 1156. [Google Scholar] [CrossRef] [Scilit]
Disclaimer/Publisher’s Note: The statements, opinions and data contained in all publications are solely those of the individual author(s) and contributor(s) and not of MDPI and/or the editor(s). MDPI and/or the editor(s) disclaim responsibility for any injury to people or property resulting from any ideas, methods, instructions or products referred to in the content. |
© 2026 by the authors. Licensee MDPI, Basel, Switzerland. This article is an open access article distributed under the terms and conditions of the Creative Commons Attribution (CC BY) license.