


Abstract
Single-copy genes are important components of plant genomes, but their evolutionary origins and biological functions in polyploid crops remain poorly understood. The objective of this study was to clarify the evolutionary origins of single-copy genes in allotetraploid Brassica napus and identify nutrient-responsive single-copy genes involved in root development. Here, we systematically identified single-copy genes across 16 representative plant species and investigated their evolution and potential functions in allotetraploid Brassica napus. A total of 167,219 single-copy genes were identified across the 16 species, including 5106 genes in the B. napus cultivar Zhongshuang 11 (ZS11). Comparative synteny analysis with B. rapa and B. oleracea classified 204 chromosome-anchored genes with unambiguous parental relationships into 38 inherited and 166 inferred loss-derived single-copy genes, indicating that post-polyploid duplicate loss is an important route for the re-establishment of single-copy states in B. napus. Integration of promoter and expression analyses identified 65 root- and nutrient-responsive candidates. Among them, BnaA09G0594900ZS, designated BnaNRA1, was induced by low-nitrogen and low-phosphorus treatments and encoded a predominantly nuclear-localized protein. Three independent bnanra1-edited lines showed no consistent root phenotype under nutrient-sufficient conditions but exhibited reduced lateral root formation under nitrogen and phosphorus deficiency, with a particularly consistent effect under phosphorus deficiency. Collectively, these findings indicate that post-polyploid duplicate loss contributes to the re-establishment of single-copy states in B. napus and identify BnaNRA1 as a nutrient-responsive single-copy gene contributing to lateral root development under nutrient limitation.
1. Introduction
Gene duplication is a major source of genetic material for evolutionary innovation in plants, since it generates additional gene copies that can subsequently diverge in function. Duplicated genes can arise through whole-genome duplication (WGD) or small-scale duplication events, including tandem, segmental, and transpositional duplications. Following duplication, individual gene copies may undergo functional conservation, subfunctionalization, neofunctionalization, pseudogenization, or complete loss [1,2,3,4]. WGD has occurred repeatedly during plant evolution, including ancestral duplication events shared by seed plants and angiosperms, and has contributed substantially to the expansion and diversification of plant gene families [5,6]. Nevertheless, duplicated genes are not retained uniformly, because their evolutionary fates are influenced by factors such as dosage sensitivity, functional constraint, expression patterns, network connectivity, and genomic context [7]. Genes encoding dosage-sensitive components of regulatory networks and protein complexes may be preferentially maintained because changes in their relative copy numbers disrupt stoichiometric balance [7,8]. By contrast, duplicated copies under weaker selective constraint may be more prone to pseudogenization or loss during post-WGD fractionation [4]. Extensive fractionation after WGD removes many duplicated copies, often asymmetrically between homoeologous genomic regions, and gradually restores a more diploid-like gene content [9]. Therefore, the present-day copy number of a plant gene reflects the combined effects of duplication, retention, functional divergence, and gene loss.
Single-copy genes are operationally defined as genes represented by only one detectable copy in a given genome. Their single-copy status does not necessarily indicate that they have never been duplicated. Some genes may have remained single-copy throughout their evolutionary history, whereas others may have returned to a single-copy state following the loss of duplicated copies. A comparative analysis of 20 flowering plants identified a group of gene families that were independently restored to single-copy status after multiple duplication events, indicating that the persistence of additional copies may be selectively disadvantageous for certain genes [10]. A subsequent survey of 29 angiosperm genomes revealed considerable interspecific variation in the abundance, functional composition, expression characteristics, and evolutionary rates of single-copy genes [11]. Single-copy genes are also widely used as orthologous markers in phylogenetic and comparative genomic studies because their copy-number status can reduce ambiguity in orthology assignment. However, most previous studies have focused either on broad comparisons among angiosperms or on general patterns of duplicate retention and loss. How single-copy gene repertoires change across major plant lineages, and how single-copy states are inherited or secondarily re-established following allopolyploidization, remain insufficiently characterized.
The classical U’s triangle provides a particularly suitable system for investigating single-copy gene evolution following allopolyploidization. It comprises three diploid species, B. rapa (AA), B. nigra (BB), and B. oleracea (CC), and three derived allotetraploid species, B. juncea (AABB), B. napus (AACC), and B. carinata (BBCC) [12]. The diploid Brassica genomes are themselves mesopolyploid and originated from a Brassiceae-specific whole-genome triplication followed by extensive chromosome rearrangement and gene loss [13,14]. Subsequent hybridization and chromosome doubling generated the three allotetraploid species and introduced another set of homoeologous gene copies [15,16,17]. Consequently, present-day Brassica genomes have been shaped by successive rounds of genome duplication, asymmetric fractionation, homoeologous recombination, and differential gene retention.
Brassica napus is a relatively recent allotetraploid derived from A- and C-genome progenitors related to B. rapa and B. oleracea, respectively [15]. The high-quality genome assembly of the semi-winter cultivar ZS11 provides an important reference for investigating the evolutionary relationships between its A and C subgenomes and their diploid progenitors [18]. ZS11 was selected as the reference genome in this study because of its well-resolved A- and C-subgenome structure and because all functional experiments were performed in the ZS11 genetic background, allowing direct integration of comparative genomic analyses with experimental validation. Comparative genomic studies have demonstrated that homoeologous exchanges can cause reciprocal gene copy-number changes and represent a major source of gene presence/absence variation in B. napus [19]. Analyses of multiple high-quality rapeseed genomes have further revealed extensive structural variation, gene-content variation, and ecotype differentiation that cannot be represented by a single reference genome [20]. These findings demonstrate that the B. napus genome remains evolutionarily dynamic. Nevertheless, the extent to which its present single-copy gene repertoire reflects direct inheritance from diploid progenitors or secondary formation through post-polyploid duplicate loss has not been systematically resolved.
In addition to their evolutionary origins, the biological functions and regulatory characteristics of single-copy genes require further investigation. The absence of closely related paralogs may limit genetic redundancy, but it does not necessarily imply constitutive expression or an exclusively housekeeping function. Single-copy genes may be integrated into tissue-specific or environmentally responsive regulatory networks. Mineral nutrient availability is one of the major environmental factors influencing plant development, particularly root system architecture. Nitrate-rich patches stimulate lateral root growth through regulatory components such as the MADS-box transcription factor ANR1, whereas the nitrate transporter and sensor NRT1.1 links nitrate perception with auxin transport to modulate lateral root development [21,22]. Phosphate availability also alters primary root elongation, lateral root formation, and the spatial distribution of roots [23,24]. In Arabidopsis, phosphate-dependent lateral root development is partly mediated by increased auxin sensitivity involving the TIR1 auxin receptor and ARF19 [25]. These studies demonstrate that nutrient sensing and developmental regulation are closely interconnected.
Root architectural plasticity is also important for nutrient acquisition in B. napus. Localized and systemic responses to phosphorus limitation involve coordinated changes in lateral root development and multiple signaling components, including phytohormones, sugars, and reactive oxygen species [26]. Root morphological traits are genetically associated with biomass accumulation and nitrogen uptake under contrasting nitrogen conditions [27], while genome-wide association analyses have identified candidate loci controlling root system architecture under low-phosphorus supply [28]. However, whether single-copy genes contribute to nutrient-dependent root remodeling in rapeseed remains largely unexplored. Identifying such genes may provide insight into how evolutionarily distinct copy-number states are connected with environmentally responsive developmental functions.
In this study, we systematically identified and compared single-copy genes across 16 representative plant species spanning major evolutionary lineages and further examined their abundance across the six species of the U’s triangle and the retention patterns of parental single-copy genes in the three derived allotetraploid species. Using syntenic relationships among ZS11, B. rapa, and B. oleracea, the classified single-copy genes in B. napus were divided into inherited single-copy genes and loss-derived single-copy genes to evaluate the relative contributions of parental inheritance and post-polyploid duplicate loss. Promoter cis-elements, potential transcription factor-binding sites, miRNA-target relationships, and tissue- and nutrient-responsive expression profiles were subsequently analyzed. Finally, the nutrient-responsive single-copy gene BnaA09G0594900ZS, designated BnaNRA1 (Nutrient-Responsive Root Architecture 1), was selected for functional characterization using CRISPR/Cas9-edited lines. This study establishes a comparative framework linking the evolutionary formation of single-copy genes with nutrient-dependent root development in allotetraploid rapeseed.
2. Materials and Methods
2.1. Genome Data Collection and Identification of Single-Copy Genes
Genome assemblies, gene annotation files, and predicted protein sequences of 16 representative plant species were obtained from Phytozome v13 [29], except for Picea abies, which was obtained from TreeGenes [30]. The genome assembly versions, annotation versions, data sources, genome sizes, annotated gene numbers, and available assembly statistics for all species analyzed in this study are provided in Supplementary Table S1. For genes with multiple transcripts, the transcript encoding the longest protein was selected as the representative transcript using the GXF Representative mRNA ID Select module in TBtools (v2.561) [31]. The corresponding representative protein sequences were extracted using the Fasta Extract module in TBtools. To identify single-copy genes, the representative protein sequences were subjected to an all-versus-all BLASTP analysis within each species using DIAMOND (v2.2.8) [32], with the E-value parameter set to 10 and all other parameters left at their default settings (Figure S1). For each query protein, the two highest-scoring BLASTP hits were retained. The highest-scoring hit corresponded to the query protein itself and was designated the self-hit, whereas the second-highest-scoring hit represented the best non-self hit. The ratio between the bitscore of the self-hit and that of the second-best hit was then calculated. A protein was classified as a single-copy protein when the self-hit/second-hit bitscore ratio was greater than 3 and the E-value of the second-best hit was greater than 0; otherwise, it was classified as a multi-copy protein. The same identification procedure and criteria were applied consistently to all 16 representative species and to the six Brassica species of U’s triangle.
2.2. Protein and Evolutionary Analyses
Protein sequences lacking an initial methionine or shorter than 50 amino acids were excluded, and the remaining 161,516 sequences were subjected to subcellular localization prediction using WoLF PSORT [33]. Orthologous gene groups among representative plant species were identified using OrthoFinder (version 3.2) [34]. Neighbor-joining phylogenetic trees were constructed in MEGA11 [35] using the p-distance model with 1000 bootstrap replicates. Gene structures were visualized using GSDS 2.0 [36], and intron insertion positions were determined by comparing genomic, coding, and protein sequences. Gene Ontology annotations were obtained using eggNOG-mapper (version 2.1.14) [37], GO enrichment analysis was performed using the clusterProfiler package in R version 4.4.0, and significantly enriched GO terms were visualized as bubble plots using ggplot2.
2.3. Comparative Genomic and Regulatory Analyses
Single-copy genes in the six U’s triangle species were identified using the same procedure described above. Pairwise synteny analyses between ZS11 and its diploid progenitors, B. rapa and B. oleracea, were performed using the MCScanX-superfast module implemented in TBtools (v2.561) [31,38]. A ZS11 single-copy gene was classified as an inherited single-copy gene when its corresponding collinear gene in the diploid progenitor was also single-copy. A ZS11 single-copy gene whose corresponding parental collinear gene belonged to a multi-copy group was classified as an inferred loss-derived single-copy gene. Only chromosome-anchored genes with unambiguous collinear relationships were included in the quantitative comparison of inherited and inferred loss-derived single-copy genes. The 1500-bp sequence upstream of each ZS11 single-copy gene was extracted as the putative promoter region. Cis-acting elements, transcription factor-binding sites, and miRNA–target relationships were predicted using PlantCARE [39], PlantRegMap [40], and psRNATarget [41], respectively. Regulatory networks were visualized using Cytoscape version 3.9.1 [42].
2.4. Expression Analysis and Candidate Gene Selection
Tissue- and developmental-stage expression data for ZS11 were obtained from the BnIR database [43]. In addition, transcriptome datasets of ZS11 leaves and roots under low-nitrogen, low-phosphorus, and low-potassium conditions were generated previously by our laboratory. Leaf and root tissues were collected after 1, 3, 5, 7, and 12 d of nutrient treatment, with three independent biological replicates for each condition. Total RNA was extracted using the FastPure Universal Plant Total RNA Isolation Kit (Vazyme, Nanjing, China), and RNA quality and concentration were assessed using a KAIAO K5800 microspectrophotometer (Beijing Kaiao Technology Development Co., Ltd., Beijing, China). High-quality RNA samples were subjected to transcriptome sequencing on an Illumina HiSeq 4000 platform (Illumina, Inc., San Diego, CA, USA). Gene expression levels were quantified as fragments per kilobase of transcript per million mapped reads (FPKM). Differentially expressed genes were identified using DESeq2, version 1.46.0, with thresholds of p < 0.05 and |log2(fold change)| > 1. Expression patterns were visualized using row-scaled heatmaps. Root-associated single-copy genes were intersected with the differentially expressed gene sets obtained under nutrient-deficiency treatments. BnaA09G0594900ZS was selected for functional analysis because it was preferentially expressed in roots and induced under both low-nitrogen and low-phosphorus conditions.
2.5. Plant Materials and Nutrient Treatments
All plant growth and experimental analyses were conducted at the Key Laboratory of Integrated Pest Management on Crops in Southwest, Ministry of Agriculture, Institute of Plant Protection, Sichuan Academy of Agricultural Science, Chengdu, Sichuan Province, China. The semi-winter B. napus cultivar ZS11 was used as the wild type, seeds of the semi-winter B. napus cultivar Zhongshuang 11 (ZS11) were maintained in our laboratory. Three independent CRISPR/Cas9-edited lines of BnaNRA1 were used: bnanra1-1 (original line 1271), bnanra1-2 (original line 1270), and bnanra1-3 (original line 1269). These materials were generated previously and maintained in our laboratory. Plants were grown under a 16-h light/8-h dark photoperiod at 22 °C and 20 °C, respectively. The light intensity was approximately 20,000 lx, and the relative humidity was maintained at approximately 70%. Seeds with similar size and apparent maturity and without visible mechanical damage or morphological abnormalities were selected for the experiments. The selected seeds were sterilized with 75% ethanol for 5 min, rinsed two to three times with sterile water, and subsequently treated with 50% (v/v) commercial bleach solution for 15 min. After thorough washing, the seeds were placed on solid full-nutrient, low-phosphorus, phosphorus-deficient, or nitrogen-deficient Hoagland media. The detailed compositions of the media are provided in Table S6. The plates were stratified at 4 °C in darkness for 2–3 d and then vertically cultivated under controlled growth conditions. Root phenotypes were recorded after 7 d. Each genotype × nutrient-treatment combination included three independent biological replicates, with 10 seedlings per biological replicate. The experiment was conducted using a completely randomized design.
2.6. RNA Extraction and Quantitative Real-Time PCR
Root samples were collected from ZS11 seedlings after 12 d of control, low-nitrogen, and low-phosphorus treatments. Total RNA was extracted using the FastPure Plant Total RNA Isolation Kit (Polysaccharides & Polyphenolics-rich; RC401, Vazyme, Nanjing, China). First-strand cDNA was synthesized from 1 μg of total RNA using HiScript III RT SuperMix for qPCR (+gDNA wiper; R323, Vazyme). Quantitative real-time PCR was performed using ChamQ Universal SYBR qPCR Master Mix (Q711, Vazyme) on a CFX96 Touch Real-Time PCR Detection System (Bio-Rad, Hercules, CA, USA). Relative transcript levels were calculated using the 2−ΔΔCt method, with BnaACTIN7 (BnaC02G0037200ZS) as the internal reference gene. Three independent biological replicates were analyzed, and each biological sample was measured using three technical replicates. Primer sequences are listed in Table S7.
2.7. Generation, Identification, and Phenotyping of BnaNRA1-Edited Lines
The CRISPR/Cas9 system was used to generate loss-of-function mutants of BnaNRA1. The genomic sequence of BnaNRA1 was obtained from the ZS11 reference genome, and candidate single-guide RNA (sgRNA) target sites were designed using CRISPR-P 2.0. Candidate sgRNAs were evaluated based on predicted on-target efficiency and potential off-target effects, and an sgRNA targeting the second exon of BnaNRA1 was selected for genome editing. The selected sgRNA sequence was introduced into the pKSE401 CRISPR/Cas9 vector. The resulting construct was introduced into Agrobacterium tumefaciens strain GV3101 and subsequently transformed into ZS11 using an Agrobacterium-mediated hypocotyl transformation method. Independent regenerated plants were screened for the presence of the CRISPR/Cas9 construct by PCR. Genomic DNA was extracted from candidate edited plants, and the genomic region flanking the CRISPR/Cas9 target site was amplified using gene-specific primers. The PCR products were subjected to Sanger sequencing, and the resulting sequences were aligned with the wild-type ZS11 sequence to identify insertions or deletions at the target site. Three independent edited lines, designated bnanra1-1 (line 1271), bnanra1-2 (line 1270), and bnanra1-3 (line 1269), were selected for subsequent analysis. The three edited alleles contained distinct mutations that caused frameshifts and premature translation termination. T2-generation plants of the confirmed edited lines were used for phenotypic analysis. Primer sequences used for mutant identification are listed in Table S7. Seedlings were photographed after 7 d of growth, and five seedlings with normal growth and similar developmental status were selected from each treatment group as representative individuals. Lateral roots were counted manually, and primary root lengths were measured from the root–shoot junction to the root tip using ImageJ (version 1.54r) [44].
2.8. Subcellular Localization of BnaNRA1
The full-length coding sequence of BnaNRA1 without the stop codon was amplified using gene-specific primers and inserted in frame into the pCAMBIA1300-GFP vector to generate the 35S::BnaNRA1-GFP construct. The recombinant construct was confirmed by sequencing and introduced into Agrobacterium tumefaciens strain GV3101. The 35S::BnaNRA1-GFP construct and the empty GFP vector were transiently expressed in leaves of transgenic Nicotiana benthamiana plants constitutively expressing a nuclear-localized red fluorescent marker. Fluorescence signals were observed using a Zeiss LSM 880 confocal laser-scanning microscope (Carl Zeiss Microscopy GmbH, Jena, Germany) at 48 h after infiltration. GFP fluorescence was excited at 488 nm, and the nuclear red fluorescence was excited at 561 nm. The experiment was independently repeated at least three times.
2.9. Statistical Analysis
Data are presented as the mean ± standard deviation (SD) of three biological replicates. Statistical analyses were performed using GraphPad Prism 10. Differences among ZS11 and the three edited lines within each nutrient treatment were evaluated using one-way analysis of variance (ANOVA), followed by Tukey’s multiple-comparison test. Differences were considered statistically significant at p < 0.05. Different lowercase letters indicate statistically significant differences among genotypes within the same treatment, whereas values sharing the same letter are not significantly different.
3. Results
3.1. Genome-Wide Identification and Evolutionary Characterization of Single-Copy Genes Across Representative Plant Species
To characterize the distribution and general features of single-copy genes across plant lineages, we analyzed 16 representative species spanning major evolutionary lineages, including green algae, bryophytes, lycophytes, gymnosperms, monocots, and eudicots (Table 1; Figure 1A). The genome assembly versions, annotation versions, and data sources of these species are provided in Table S1. The number and proportion of single-copy genes varied substantially among species. The number of identified single-copy genes ranged from 5225 in soybean (Glycine max) to 18,389 in Norway spruce (Picea abies), whereas their proportions relative to the total number of annotated genes ranged from 9.32% in G. max to 80.40% in Volvox carteri (Table 1; Figure 1C). The two green algal species, Chlamydomonas reinhardtii and V. carteri, contained relatively high proportions of single-copy genes, accounting for 70.35% and 80.40% of their annotated genes, respectively. By contrast, several angiosperm species showed lower proportions, with G. max exhibiting the lowest value among the species examined. These differences indicate substantial lineage-specific variation in single-copy gene abundance, likely reflecting differences in genome duplication, gene-family expansion, duplicate retention, and gene loss histories.
Table 1.
Summary of single-copy genes identified in 16 representative plant species.
Figure 1.
Identification and basic characterization of single-copy genes across 16 representative plant species. (A) Phylogenetic relationships of the 16 representative plant species analyzed in this study. (B) Protein length distributions of single-copy and multiple-copy genes in each species. Blue and orange boxes indicate single-copy and multiple-copy genes, respectively. Asterisks indicate significant differences between the two gene categories. (C) Number of single-copy genes identified in each species. (D) Predicted subcellular localization of single-copy genes. Bubble size and color represent the number of genes assigned to each subcellular compartment. nucl, nucleus; chlo, chloroplast; cyto, cytoplasm; plas, plasma membrane; mito, mitochondrion; extr, extracellular region; vacu, vacuole; ER, endoplasmic reticulum; pero, peroxisome; golg, Golgi apparatus; cysk, cytoskeleton. ** indicates p < 0.01.
The phylogenetic framework shown in Figure 1A illustrates the evolutionary relationships among the 16 representative species and provides a comparative context for evaluating variation in single-copy gene abundance across major plant lineages. We next compared the protein-length distributions of single-copy and multi-copy genes across the 16 species (Figure 1B). Except for the two algal species, C. reinhardtii and V. carteri, proteins encoded by single-copy genes were generally shorter than those encoded by multi-copy genes. This consistent difference suggests that the two gene categories possess distinct structural characteristics, although the evolutionary and functional basis of this pattern requires further investigation.
To characterize the potential cellular distribution of single-copy gene products, subcellular localization was predicted using WoLF PSORT (Figure 1D). Of the 167,219 single-copy proteins identified across the 16 species, 5703 sequences that either lacked an initial methionine residue or were shorter than 50 amino acids were excluded. The remaining 161,516 protein sequences were subjected to subcellular localization prediction. Across the 16 species, single-copy proteins were predominantly predicted to localize to the nucleus and chloroplasts, followed by the cytoplasm. These results suggest that many single-copy proteins may be associated with nuclear and organelle-related cellular processes.
Collectively, these results reveal substantial interspecific variation in the abundance, protein-length distribution, and predicted subcellular localization of single-copy genes. This comparative analysis provides a basis for further investigating the origin and functional characteristics of single-copy genes in the allotetraploid crop Brassica napus.
3.2. Identification, Retention Patterns, and Functional Enrichment of Single-Copy Genes in Brassica U’s Triangle Species
The six Brassica species of the classical U’s triangle comprise three diploid species, B. rapa (AA), B. nigra (BB), and B. oleracea (CC), and three allotetraploid species, B. juncea (AABB), B. carinata (BBCC), and B. napus (AACC) (Figure 2A). The number and proportion of single-copy genes differed markedly among the six species (Table 2; Figure 2B). In the three diploid species, 5270, 8510, and 6105 single-copy genes were identified in B. rapa, B. nigra, and B. oleracea, accounting for 13.01%, 14.22%, and 17.25% of their annotated genes, respectively. By comparison, 4138, 5904, and 5106 single-copy genes were identified in B. juncea, B. carinata, and B. napus, corresponding to 5.20%, 6.08%, and 5.06% of their annotated genes, respectively. Thus, the allotetraploid species consistently contained lower proportions of single-copy genes than their diploid progenitors, which is consistent with the increased abundance of duplicated gene copies following allopolyploidization.
Figure 2.
Single-copy gene composition, parental retention, and functional differentiation in the six Brassica species of U’s Triangle. (A) Schematic representation of U’s Triangle, showing the relationships among the three diploid species, B. rapa (AA), B. nigra (BB), and B. oleracea (CC), and the three derived allotetraploid species, B. juncea (AABB), B. napus (AACC), and B. carinata (BBCC). (B) Numbers and proportions of single-copy genes identified in the six Brassica species. Bars indicate the number of single-copy genes according to the left y-axis, whereas the black line indicates their proportion among all annotated genes according to the right y-axis. (C) Proportions of single-copy genes from the diploid progenitors that remained single-copy in the corresponding A, B, or C subgenomes of the allotetraploid species. (D–F) Gene Ontology enrichment analyses of inherited single-copy genes in the A, B, and C subgenomes, respectively. (G–I) Gene Ontology enrichment analyses of inferred loss-derived single-copy genes in the A, B, and C subgenomes, respectively. GO terms are grouped into biological process (BP), cellular component (CC), and molecular function (MF). The horizontal axis represents the enrichment ratio, dot size indicates the number of genes assigned to each term, and dot color represents −log10 (p value). Representative enriched GO terms are highlighted in red.
Table 2.
Identification of single-copy genes in U’s Triangle species.
We next evaluated the retention of parental single-copy genes in the corresponding allotetraploid species (Figure 2C). A-genome-derived single-copy genes showed retention rates of 13.95% in B. napus and 12.95% in B. juncea. B-genome-derived single-copy genes displayed retention rates of 18.83% in B. juncea and 20.40% in B. carinata. In contrast, C-genome-derived single-copy genes exhibited substantially higher retention rates, reaching 44.39% in B. napus and 36.31% in B. carinata. These results indicate that the retention of parental single-copy genes differed among the A, B, and C genomes, with C-genome-derived genes showing the highest retention in their corresponding allotetraploid descendants.
Gene Ontology enrichment analysis revealed distinct functional characteristics among parentally inherited single-copy genes derived from the three ancestral genomes (Figure 2D–F). A-genome-derived inherited single-copy genes were mainly associated with intracellular structures and organelle-related compartments (Figure 2D). B-genome-derived inherited single-copy genes were enriched in processes related to the cell cycle, meiotic cell cycle, mRNA processing, vesicle-mediated transport, and protein binding (Figure 2E). By comparison, C-genome-derived inherited single-copy genes were predominantly associated with cellular stress responses, negative regulation of gene expression, RNA processing, transcription-related processes, nuclear protein-containing complexes, and enzyme binding (Figure 2F).
The inferred loss-derived single-copy genes also exhibited distinct functional enrichment patterns among the three subgenomes (Figure 2G–I). In the A subgenome, loss-derived single-copy genes were mainly enriched in the positive regulation of cellular processes, cellular component assembly, RNA processing, ncRNA metabolic processes, and ncRNA processing (Figure 2G). In the B subgenome, these genes were associated with the regulation of cellular processes, responses to alcohol, abscisic acid, and acidic chemicals, as well as protein kinase activity (Figure 2H). In the C subgenome, loss-derived single-copy genes were primarily enriched in multicellular organism development, macromolecule and protein modification, tissue development, plant organ morphogenesis, and hydrolase activity (Figure 2I). These results indicate that inferred loss-derived single-copy genes exhibit distinct functional characteristics among the A, B, and C subgenomes.
Collectively, these results demonstrate that allopolyploid Brassica species possess lower proportions of single-copy genes than their diploid progenitors and that parental single-copy genes exhibit genome-dependent retention patterns. The relatively high retention of C-genome-derived single-copy genes, together with the distinct functional enrichment patterns of A-, B-, and C-genome-derived genes, provides a basis for further investigating the parental origin and evolutionary fate of single-copy genes in B. napus.
3.3. Evolutionary Origins and Chromosomal Distribution of Single-Copy Genes in Brassica napus
To investigate the evolutionary origins of single-copy genes in B. napus, genome-wide syntenic relationships were analyzed among B. rapa, B. napus, and B. oleracea (Figure 3). Extensive collinear relationships were detected between the A subgenome of B. napus and the B. rapa genome, as well as between the C subgenome of B. napus and the B. oleracea genome, consistent with the parental origins of the two B. napus subgenomes.
Figure 3.
Genome-wide syntenic relationships between Brassica napus and its diploid progenitors B. rapa and B. oleracea. Chromosomes of B. oleracea, B. napus, and B. rapa are shown from top to bottom, respectively. The nine chromosomes of B. oleracea represent the C genome, whereas the ten chromosomes of B. rapa represent the A genome. The chromosomes of allotetraploid B. napus comprise the A and C subgenomes. Blue lines connect syntenic gene pairs between B. napus and the corresponding diploid progenitors, illustrating the extensive conservation of collinear genomic regions following allopolyploidization. Chromosome identifiers are indicated above or within the corresponding chromosome blocks.
Based on their syntenic relationships with the diploid progenitors, single-copy genes in B. napus were divided into two evolutionary categories. Inherited single-copy genes (IGs) were defined as genes that existed as single copies in the diploid progenitors and retained their single-copy status in B. napus. Loss-derived single-copy genes (LGs) were inferred to have originated through the loss of one duplicated homolog following allopolyploidization. This classification distinguished single-copy genes directly inherited from the diploid progenitors from those secondarily formed through post-polyploid gene loss.
The genomic distribution of IGs and LGs was subsequently examined across the A and C subgenomes of B. napus (Figure 4). Both gene categories were distributed across the 19 assembled chromosomes and several unanchored scaffolds, although their abundance varied among genomic regions. Overall, LGs were more abundant than IGs on most chromosomes, suggesting that the loss of duplicated homologous copies contributed substantially to the formation of the current single-copy gene repertoire in B. napus.
Figure 4.
Genomic distribution of inherited and inferred loss-derived single-copy genes in Brassica napus. The physical positions of single-copy genes are shown along the A- and C-subgenome scaffolds of the B. napus cultivar ZS11. Scaffolds belonging to the C subgenome are displayed in the upper panel, whereas those belonging to the A subgenome are shown in the lower panel. Gene identifiers shown in black represent inherited single-copy genes whose corresponding genes in the diploid progenitors were also single-copy. Gene identifiers shown in red represent inferred loss-derived single-copy genes whose corresponding parental genes belonged to multi-copy groups. Gene positions are indicated according to their physical coordinates on the respective scaffolds.
To further quantify these distribution patterns, the numbers and relative proportions of chromosome-anchored IGs and LGs were compared (Figure 5, Table S2). A total of 38 IGs and 166 LGs were located on the 19 chromosomes. The A subgenome contained 20 IGs and 52 LGs, whereas the C subgenome contained 18 IGs and 114 LGs. The numbers of both gene categories differed considerably among chromosomes (Figure 5). A01 contained the largest number of IGs, with seven genes, whereas no IGs were detected on A05 or A07. In contrast, LGs were identified on all chromosomes. C03 contained the largest number of LGs, with 24 genes, followed by C04 and C02, which contained 19 and 17 LGs, respectively.
Figure 5.
Chromosomal distribution of inherited and inferred loss-derived single-copy genes in Brassica napus. Numbers of inherited single-copy genes (IGs) and inferred loss-derived single-copy genes (LGs) on the 19 chromosomes of the B. napus cultivar Zhongshuang 11 (ZS11). Blue squares and circles represent the numbers of IGs and LGs, respectively. A01–A10 and C01–C09 correspond to the A and C subgenomes, respectively.
The relative proportions of the two categories further demonstrated the predominance of LGs across the B. napus genome (Figure 5). LGs accounted for at least 50% of the analyzed single-copy genes on each chromosome. Equal proportions of IGs and LGs were observed on A08, whereas all single-copy genes detected on A05 and A07 were classified as LGs. Within the C subgenome, the proportion of LGs ranged from 60% on C07 to 95% on C04. Moreover, the C subgenome contained substantially more LGs than the A subgenome, indicating that the extent of post-polyploid gene loss differed between the two subgenomes.
Collectively, the synteny and chromosomal distribution analyses identified two evolutionary origins among the confidently classified chromosome-anchored single-copy genes in B. napus: direct inheritance from the diploid progenitors and secondary formation through duplicate loss after allopolyploidization. The predominance of LGs within this subset suggests that post-polyploid duplicate loss was an important route for the re-establishment of single-copy states, particularly in the C subgenome.
3.4. Predicted Transcriptional and Post-Transcriptional Regulation of Single-Copy Genes in ZS11
To characterize the potential regulatory architecture of the 5106 single-copy genes identified in ZS11, cis-acting elements were predicted within the 1500-bp upstream region of each gene. In total, 979,316 cis-acting elements representing 143 element types were detected (Table S3). Among these, 36 representative element types were selected and grouped into five functional categories: core promoter elements, phytohormone-responsive elements, stress-responsive elements, protein-binding-related elements, and tissue-specific expression elements (Figure 6A).
Figure 6.
Predicted transcriptional and post-transcriptional regulatory features of single-copy genes in Brassica napus. (A) Distribution of 36 representative cis-acting elements identified in the 1500-bp putative promoter regions of 5106 single-copy genes in the B. napus cultivar Zhongshuang 11 (ZS11). The elements were grouped into five functional categories: core promoter elements, phytohormone-responsive elements, protein-binding elements, stress-responsive elements, and tissue- or development-related elements. Numbers above the bars indicate the total occurrence of each element. (B) Distribution of 60,884 predicted transcription factor-binding sites among 36 transcription factor families, involving 3618 single-copy genes. The inset shows a representative transcription factor–target gene interaction network. (C) Predicted miRNA–target regulatory network comprising 6117 interactions between 92 miRNAs and 2091 single-copy genes. Blue nodes represent miRNAs, light-colored internal nodes represent predicted target genes, and connecting lines indicate predicted miRNA–target relationships. Representative miRNAs with relatively high connectivity are labeled. All regulatory relationships shown in (B,C) are computational predictions.
Core promoter elements were the most abundant category. A total of 237,153 TATA-boxes and 188,710 CAAT-boxes were identified, together accounting for approximately 43.5% of all predicted cis-acting elements. In addition, 39,661 phytohormone-responsive elements, 39,077 stress-responsive elements, 8439 protein-binding-related elements, and 5359 tissue-specific expression elements were detected. The phytohormone-responsive elements included ABRE, CGTCA motifs, TGACG motifs, TGA elements, P-boxes, and several other elements associated with abscisic acid, methyl jasmonate, auxin, and gibberellin responses. The stress-responsive elements mainly included ARE, LTR, MBS, TC-rich repeats, and WUN motifs, which are associated with anaerobic induction, low-temperature responses, drought responses, defense responses, and wounding, respectively. These results indicate that the promoters of ZS11 single-copy genes contain diverse cis-regulatory elements potentially involved in the integration of hormonal, environmental, and developmental signals.
Potential transcription factor-binding sites within the 1500-bp upstream regions were subsequently predicted using PlantRegMap, and a transcription factor–target gene network was constructed (Figure 6B). A total of 60,884 putative transcription factor-binding sites were identified in the promoters of 3618 single-copy genes, involving 36 transcription factor families. No transcription factor-binding sites were predicted for the remaining 1488 genes under the applied criteria. Based on the number of predicted binding sites, the ERF, BBR-BPC, and MIKC_MADS families were the most abundant, with 23,313, 10,151, and 4582 sites, respectively. Except for the SBP family, which was predicted to target only one gene, BnaA09G0001900ZS, the other 35 transcription factor families were associated with multiple single-copy genes, with the number of predicted target genes ranging from 2 to 1285. The ERF, MIKC_MADS, BBR-BPC, and Dof families showed the largest numbers of predicted target genes, targeting 1285, 851, 819, and 725 single-copy genes, respectively. These results suggest that a substantial proportion of ZS11 single-copy genes may be subject to transcriptional regulation by multiple transcription factor families.
To assess the potential post-transcriptional regulation of single-copy genes, miRNA–target relationships were predicted using psRNATarget (Figure 6C). A total of 6117 putative regulatory relationships were identified between 92 miRNAs and 2091 single-copy genes. The predicted miRNAs were assigned to 33 families, among which miR156, miR395, and miR169 formed the largest numbers of miRNA–target pairs, with 899, 702, and 678 predicted interactions, respectively. Individual miRNA families were predicted to target between 7 and 237 single-copy genes. The miR156, miR395, and miR172 families showed the largest numbers of predicted target genes, targeting 237, 157, and 141 genes, respectively. Based on the number of targeted genes, 3015 single-copy genes, accounting for approximately 59.0% of the total, had no predicted miRNA targets under the criteria used in this analysis. Thus, miRNA-mediated post-transcriptional regulation may affect a specific subset of the ZS11 single-copy gene repertoire.
Collectively, the integrated analyses of promoter cis-acting elements, transcription factor-binding sites, and miRNA–target relationships reveal a multilayered potential regulatory landscape for single-copy genes in ZS11. These genes may be regulated through the combined effects of promoter-associated cis-elements, transcription factors, and miRNA-mediated post-transcriptional mechanisms.
3.5. Expression Patterns and Nutrient-Deficiency Responses of Single-Copy Genes in ZS11
To explore the potential biological functions of single-copy genes in ZS11, their expression profiles were examined across vegetative tissues, reproductive tissues, and different stages of seed development (Figure 7A). A total of 2202 single-copy genes with detectable expression were classified into five clusters based on their row-scaled expression patterns (Table S4). Cluster C3 contained 533 genes (24.2%) and showed preferential expression in leaves, particularly at the bolting and flowering stages. Cluster C5 comprised 463 genes (21.0%) and was mainly associated with roots and other vegetative tissues, with generally lower relative expression during seed development. Cluster C4 included 388 genes (17.6%) and exhibited increased expression during early seed development, particularly at 3–7 days after pollination (DAP). By contrast, the 481 genes in C1 (21.8%) were preferentially expressed during the middle stages of seed development, with relatively high expression from approximately 14 to 35 DAP. Cluster C2 contained 337 genes (15.3%) and displayed the most pronounced relative expression during late seed development, particularly from 35 to 49 DAP. These results reveal a clear partitioning of single-copy genes between vegetative tissues and distinct stages of seed development.
Figure 7.
Tissue-specific expression patterns and nutrient-deficiency responses of single-copy genes in ZS11. (A) Row-scaled expression heatmap of 2202 single-copy genes across vegetative and reproductive tissues and different stages of seed development. From top to bottom, the five clusters are C3 (n = 533), C5 (n = 463), C4 (n = 388), C1 (n = 481), and C2 (n = 337). The line plots show the mean standardized expression profile of the genes in each cluster. S, seedling stage; B, bolting stage; F, flowering stage; r, root; st, stem; l, leaf; f, flower; si, silique; se, seed; DAP, days after pollination. (B) Row-scaled expression heatmap of 4988 single-copy genes in leaves and roots under low-nitrogen, low-phosphorus, and low-potassium conditions at different treatment durations. From top to bottom, the four clusters are C1 (n = 824), C3 (n = 1386), C4 (n = 1425), and C2 (n = 1353). The line plots show the mean standardized expression profile of each cluster. L, leaf; R, root; LN, low nitrogen; LP, low phosphorus; LK, low potassium; 1d, 3d, 5d, 7d, and 12d indicate the treatment durations. (C) Venn diagram showing the overlap among root-associated single-copy genes and differentially expressed genes under low-nitrogen, low-phosphorus, and low-potassium conditions. (D) Normalized expression patterns of six representative single-copy genes in roots under control and nutrient-deficiency treatments. In (A,B), colors represent row-scaled Z-scores, with red and blue indicating relatively high and low expression within each gene, respectively. The red lines indicate the boundaries between different treatment groups.
We further examined the expression responses of single-copy genes in leaves and roots under low-nitrogen, low-phosphorus, and low-potassium conditions at different treatment durations (Figure 7B). A total of 4988 genes were grouped into four major clusters. Cluster C1 contained 824 genes (16.5%) and showed limited responses to low nitrogen and low phosphorus but a marked induction in roots during the later stages of low-potassium treatment, particularly at 12 d. Cluster C3, comprising 1386 genes (27.8%), exhibited relatively strong responses to low nitrogen in both leaves and roots, especially during the early and intermediate treatment stages. Cluster C4 was the largest group, containing 1425 genes (28.6%), and showed preferential induction in leaves under low-phosphorus conditions, particularly during the intermediate and later treatment stages, whereas its relative expression was generally lower in roots. Cluster C2 contained 1353 genes (27.1%) and displayed an early root-associated response to low phosphorus, together with broader induction in both leaves and roots under low-potassium conditions. These distinct expression patterns demonstrate that ZS11 single-copy genes exhibit nutrient-, tissue-, and duration-dependent transcriptional responses.
To identify single-copy genes potentially involved in multiple nutrient-deficiency responses, a Venn analysis was performed using root-associated genes and differentially expressed genes identified under low-nitrogen, low-phosphorus, and low-potassium conditions (Figure 7C). A total of 65 genes were shared among all four datasets. In addition, 583, 221, and 189 genes were specifically associated with the low-nitrogen, low-phosphorus, and low-potassium treatments, respectively, whereas 150 genes were unique to the root-associated gene set. These results reveal both shared and nutrient-specific components of the single-copy gene response to mineral nutrient deficiency.
Based on the overlapping relationships and expression patterns, six representative single-copy genes were selected for further expression profiling in roots under the three nutrient-deficiency treatments (Figure 7D, Table S5). These genes, including BnaC02G0396500ZS, BnaC06G0268000ZS, BnaC04G0560600ZS, BnaA03G0196000ZS, BnaA07G0019300ZS, and BnaA09G0594900ZS, displayed distinct treatment- and time-dependent expression patterns. The differential responses of these genes to nitrogen, phosphorus, and potassium deficiencies suggest that they may participate in different nutrient-acquisition or nutrient-stress-response pathways.
Collectively, these transcriptomic analyses demonstrate that ZS11 single-copy genes exhibit substantial tissue specificity, developmental-stage dependence, and dynamic responses to mineral nutrient deficiencies. The shared and nutrient-specific expression patterns provide a set of candidate single-copy genes for further functional investigation of nutrient-deficiency responses in B. napus.
3.6. Functional Characterization of BnaNRA1 in Nutrient-Deficiency-Induced Root Architecture Remodeling
The transcriptomic analyses described above identified a subset of single-copy genes that were expressed in roots and differentially regulated under nitrogen-, phosphorus-, and potassium-deficient conditions (Figure 7B,C). Based on their nutrient-responsive expression patterns, six representative single-copy genes were selected for further comparison (Figure 7D). Among these candidates, BnaA09G0594900ZS exhibited a clear response to nutrient limitation, with relatively low transcript abundance under control conditions but marked induction in roots following nitrogen- and phosphorus-deficiency treatments. Given this nutrient-responsive expression pattern and its subsequent effects on root development under nutrient-deficient conditions, BnaA09G0594900ZS was designated BnaNRA1 (Nutrient-Responsive Root Architecture 1) and selected for further functional characterization. BnaNRA1 is located on chromosome A09 of the A subgenome. However, it was not included among the 204 single-copy genes with unambiguous parental collinear relationships and therefore could not be confidently classified as either an inherited or an inferred loss-derived single-copy gene.
Quantitative real-time PCR analysis confirmed the nutrient-responsive expression pattern of BnaNRA1. Compared with the control, the transcript abundance of BnaNRA1 was significantly increased under both low-nitrogen and low-phosphorus conditions (Figure 8A), confirming its nutrient-responsive expression pattern. To investigate the biological function of BnaNRA1, three previously generated independent CRISPR/Cas9-edited lines, designated bnanra1-1, bnanra1-2, and bnanra1-3, were characterized. These lines corresponded to the original lines 1271, 1270, and 1269, respectively. BnaNRA1 contains two exons, and the CRISPR/Cas9 target site was located within the second exon (Figure 8B). Sequence analysis revealed distinct insertions or deletions around the target site in the three edited lines. All three mutations caused frameshifts, altered the predicted C-terminal amino acid sequences of BnaNRA1, and resulted in premature translation termination (Figure S2C).
Figure 8.
Functional characterization of BnaNRA1 in nutrient-responsive root development in Brassica napus. (A) Relative expression levels of BnaNRA1 in ZS11 roots under control (CK), low-nitrogen (LN), and low-phosphorus (LP) conditions. (B) Gene structure of BnaNRA1 and sequence characterization of three independent CRISPR/Cas9-edited lines. Black boxes represent exons, the connecting line represents the intron, and the red vertical line indicates the CRISPR/Cas9 target site. Sequence insertions or deletions in lines 1271, 1270, and 1269 are highlighted in red or indicated by dashes. (C) Subcellular localization of BnaNRA1-GFP in leaves of transgenic Nicotiana benthamiana constitutively expressing a nuclear-localized red fluorescent marker. GFP, red fluorescence, bright-field, and merged images are shown. (D) Representative root phenotypes of ZS11 and the three edited lines, bnanra1-1 (1271), bnanra1-2 (1270), and bnanra1-3 (1269)-grown under control (CK), low-phosphorus (LP), nitrogen-deficient (-N), and phosphorus-deficient (-P) conditions. (E,F) Quantification of lateral root number (E) and primary root length (F) under the indicated nutrient conditions, with 10 seedlings per replicate. Data are presented as the mean ± SD of three independent biological replicates. Different lowercase letters indicate significant differences among genotypes within the same treatment according to one-way ANOVA followed by Tukey’s multiple-comparison test (p < 0.05).
BnaNRA1 encodes a protein of 175 amino acids, and its predicted three-dimensional structure is shown in Figure S2A. Subcellular localization prediction suggested that BnaNRA1 is localized to the nucleus (Figure S2B). Consistent with this prediction, transient expression analysis showed that the BnaNRA1 fusion protein was predominantly localized in the nucleus (Figure 8C).
The root phenotypes of ZS11 and the three edited lines were subsequently evaluated under control and nutrient-deficient conditions (Figure 8D). Under nutrient-sufficient conditions, no significant differences in lateral root number or primary root length were detected between ZS11 and the bnanra1 lines (Figure 8E,F). Under nitrogen deficiency, the edited lines generally produced fewer lateral roots than ZS11, although the statistical significance of this reduction differed among alleles. Under phosphorus deficiency, all three bnanra1 lines exhibited significantly reduced lateral root numbers compared with ZS11. Primary root length showed treatment- and allele-dependent variation, but no consistent difference was observed between ZS11 and the edited lines under nitrogen- or phosphorus-deficient conditions. These results indicate that BnaNRA1 positively contributes to lateral root formation under nutrient deficiency, with a particularly consistent effect under phosphorus-deficient conditions.
Collectively, the transcriptomic screening, qRT-PCR validation, subcellular localization, and mutant phenotype analyses indicate that BnaNRA1 is a nuclear-localized, nutrient-responsive single-copy gene involved in root architecture remodeling. The absence of an obvious phenotype under nutrient-sufficient conditions, together with the reduction in lateral root formation in the edited lines under nitrogen and phosphorus limitation, suggests that BnaNRA1 positively contributes to lateral root development specifically during nutrient deficiency.
4. Discussion
4.1. Evolutionary Variation in Plant Single-Copy Genes
The copy number of a gene is dynamically shaped by duplication, differential retention, pseudogenization, and gene loss. Therefore, genes currently present as single copies may either have remained unduplicated or have returned to a single-copy state after the loss of redundant copies. Previous studies showed that some gene families repeatedly return to single-copy status following independent genome-duplication events, suggesting that additional copies may be selectively disadvantageous for particular genes [10]. The substantial variation in single-copy gene proportions among the 16 species examined here is therefore consistent with lineage-specific differences in polyploidization, gene-family expansion, duplicate retention, and subsequent diploidization [5,6,11,45].
Single-copy proteins were generally shorter than multi-copy proteins in most species. This difference may reflect variation in the functional and structural composition of the two gene groups, rather than a direct effect of copy number on protein length. Consequently, shorter protein length should not be interpreted as evidence of simpler structure or greater transcriptional efficiency. Likewise, the predicted prevalence of single-copy proteins in the nucleus and chloroplast suggests possible enrichment in regulatory and organelle-associated functions, but experimental validation and comparisons with functionally matched multi-copy genes are required.
4.2. Polyploidization and Duplicate Loss Reshape Single-Copy Genes in Brassica
The U’s triangle provides a useful system for assessing how allopolyploidization affects single-copy gene abundance. The three allotetraploid species contained lower proportions of single-copy genes than their diploid relatives, which is expected because the merger of two parental genomes initially generates homoeologous gene pairs. However, present-day Brassica genomes were shaped by both the ancient Brassiceae-specific whole-genome triplication and more recent allopolyploidization, followed by extensive genome rearrangement and fractionation [13,14,15,16,17,46,47,48].
Parental single-copy genes showed unequal retention among the A, B, and C genomes. The relatively high retention of C-genome-derived genes indicates that genes from different parental genomes did not experience identical evolutionary fates. Such variation may be associated with genomic context, gene dosage, functional constraint, expression level, or structural rearrangement [48]. Nevertheless, higher retention should not be interpreted directly as evidence of general C-subgenome dominance, because gene retention and expression dominance are distinct genomic properties.
The synteny-based classification further showed that loss-derived single-copy genes were considerably more abundant than inherited single-copy genes. Among the 204 chromosome-anchored genes that could be confidently classified, 166 were LGs and 38 were IGs, indicating that LGs accounted for approximately 81.4% of this subset. This result supports post-polyploid duplicate loss as an important route through which single-copy states are re-established during diploidization [10,49].
Duplicate loss may sometimes have functional significance. In B. napus, reduction of MSH4 copy number suppresses undesirable homoeologous crossovers without disrupting normal homologous recombination, demonstrating that copy-number reduction can contribute to polyploid genome stabilization [50]. However, not all LGs are necessarily adaptive. Some may result from neutral fractionation, homoeologous exchange, or accession-specific structural variation. Homoeologous exchanges are widespread in B. napus and can simultaneously cause gene loss in one subgenome and copy gain in the other [19,51]. Moreover, pangenome studies have revealed extensive presence/absence variation in both B. oleracea and B. napus [20,52]. Because the present analysis is based on a single B. napus reference genome, the exact number and identity of single-copy genes identified here should be interpreted primarily in the context of ZS11. Structural variation, homoeologous exchange, and gene presence/absence variation among cultivars may alter copy-number states at individual loci. Therefore, comparisons with additional high-quality genomes are required to determine whether individual LGs represent fixed evolutionary losses or ZS11-specific variants.
4.3. Single-Copy Genes Exhibit Diverse Regulatory and Expression Patterns
The promoter analysis identified numerous core, hormone-responsive, stress-responsive, and tissue-associated cis-elements, suggesting that ZS11 single-copy genes may participate in diverse regulatory processes. However, the high abundance of TATA-boxes and CAAT-boxes should not be interpreted as evidence of a simple or stable regulatory architecture, because these motifs are common components of plant promoters.
The predicted transcription factor-binding and miRNA-target networks further indicate potential transcriptional and post-transcriptional regulation. Several prominent miRNA families identified here have known roles in nutrient responses [53]. miR169 participates in nitrogen-starvation responses [54], miR156 is involved in phosphate-deficiency signaling [55], and miR395 regulates sulfur assimilation and allocation [56]. Nevertheless, the predicted regulatory relationships remain computational hypotheses and require experimental validation.
The expression profiles revealed substantial heterogeneity among single-copy genes, including tissue-, developmental stage-, nutrient-, and treatment-duration-dependent patterns. These results indicate that at least a subset of single-copy genes may perform specialized functions under specific developmental or environmental conditions. Whether the absence of closely related paralogs imposes distinct regulatory constraints on these genes remains to be experimentally determined.
4.4. BnaNRA1 Contributes to Nutrient-Dependent Lateral Root Development
Integration of root expression profiles with nutrient-deficiency transcriptomes led to the selection of BnaNRA1 for functional characterization. Its expression was induced by both nitrogen and phosphorus deficiency. Under nutrient-sufficient conditions, disruption of BnaNRA1 did not cause a consistent root phenotype, whereas the edited lines showed reduced lateral root formation under nutrient-deficient conditions. These results suggest that BnaNRA1 is not essential for basal root development but contributes to root architectural plasticity when nutrient availability is limited.
Root-system remodeling is an important strategy for nutrient foraging [57,58,59]. Nitrate regulates lateral root development through nutrient-sensing and auxin-related pathways involving ANR1 and NRT1.1 [21,22], whereas phosphorus deficiency alters primary root growth, lateral root formation, root hair development, and broader root system architecture through coordinated local and systemic signaling [23,24,25,58,60,61,62]. In B. napus, both local and systemic signals participate in root responses to low phosphorus [26], and root morphological traits are genetically associated with nitrogen uptake and biomass accumulation [27]. Therefore, the nutrient-dependent phenotype of the bnanra1 lines is consistent with the established importance of lateral root plasticity in nutrient adaptation.
BnaNRA1 was predominantly localized in the nucleus, suggesting a potential regulatory role. However, nuclear localization alone does not demonstrate that BnaNRA1 functions as a transcription factor. It may participate in protein complexes, chromatin-associated processes, or other nuclear regulatory mechanisms. All three edited alleles caused frameshifts and premature translation termination, supporting an association between BnaNRA1 disruption and the observed phenotype. Further experiments are still required to establish its molecular mechanism. Genetic complementation would confirm the causal relationship between BnaNRA1 disruption and reduced lateral root formation. Transcriptome and protein-interaction analyses could identify downstream pathways or interacting partners, while measurements of nitrogen and phosphorus uptake, tissue nutrient content, and plant biomass would determine whether the root phenotype affects nutrient-acquisition efficiency. Although BnaNRA1 resides in the A subgenome, its parental evolutionary origin could not be unambiguously resolved by the present synteny analysis. Therefore, its functional phenotype should not be interpreted as evidence specifically supporting either the inherited or loss-derived class.
Overall, the present study shows that both parental inheritance and post-polyploid duplicate loss contributed to the formation of the confidently classified single-copy genes in B. napus. The functional characterization of BnaNRA1 further demonstrates that single-copy genes can participate in environmentally responsive developmental processes rather than merely representing residual products of genome fractionation.
5. Conclusions
This study provides a comparative framework for understanding the evolutionary formation and functional significance of single-copy genes in allotetraploid Brassica napus. The results support both parental inheritance and post-polyploid duplicate loss as sources of present-day single-copy states, with duplicate loss representing an important route for their re-establishment after allopolyploidization. Functional characterization further identifies BnaNRA1 as a nutrient-responsive single-copy gene associated with lateral root development under nutrient limitation. Together, these findings connect the evolutionary dynamics of gene copy number with environmentally responsive root development in B. napus and provide a basis for further investigating the roles of single-copy genes in nutrient adaptation.
Supplementary Materials
The following supporting information can be downloaded at https://www.mdpi.com/article/10.3390/agronomy16212138/s1, Figure S1: Workflow for single-copy gene identification and evolutionary classification; Figure S2: Predicted structural features of BnaNRA1 and sequence characterization of the bnanra1-edited alleles; Table S1: Genome assemblies, annotation versions, data sources, and assembly statistics of the plant species analyzed in this study; Table S2: List of inherited and inferred loss-derived single-copy genes in Brassica napus ZS11; Table S3. Numbers of predicted cis-acting regulatory elements in the promoter regions of 5106 single-copy genes in Brassica napus ZS11; Table S4: Expression profiles and cluster assignments of single-copy genes across different tissues and developmental stages in Brassica napus ZS11; Table S5: Expression profiles of six selected single-copy genes in roots of Brassica napus ZS11 under low-nitrogen, low-phosphorus, and low-potassium conditions at different treatment durations; Table S6: Composition of full-nutrient, low-phosphorus, phosphorus-deficient, and nitrogen-deficient Hoagland media used for root phenotyping in Brassica napus ZS11; Table S7: Primers used in this study.
Author Contributions
Conceptualization, J.Z. and H.Z.; methodology, J.Z.; formal analysis, J.Z., S.L., X.Z., P.P. and J.H.; investigation, J.Z., S.L., X.Z., P.P. and J.H.; data curation, J.Z. and S.L.; writing—original draft, J.Z. and S.L.; writing—review and editing, H.Z.; supervision, H.Z.; project administration, H.Z.; funding acquisition, H.Z. All authors have read and agreed to the published version of the manuscript.
Funding
This research was funded by the “10+9” Independent Innovation and Expansion Research Plan of Sichuan Academy of Agricultural Sciences (Grant No. “10+9” ZZCX-27), and the Sichuan Innovation Team Project under the National Modern Agricultural Industry Technology System (Grant No. SCCXTD-2026-2).
Data Availability Statement
The original contributions presented in this study are included in the article/Supplementary Material. Further inquiries can be directed to the corresponding author.
Conflicts of Interest
The authors declare that they have no competing interests.
References
- Lynch, M.; Conery, J.S. The Evolutionary Fate and Consequences of Duplicate Genes. Science 2000, 290, 1151–1155. [Google Scholar] [CrossRef] [Scilit]
- Force, A.; Lynch, M.; Pickett, F.B.; Amores, A.; Yan, Y.-l.; Postlethwait, J. Preservation of Duplicate Genes by Complementary, Degenerative Mutations. Genetics 1999, 151, 1531–1545. [Google Scholar] [CrossRef] [Scilit]
- Maere, S.; De Bodt, S.; Raes, J.; Casneuf, T.; Van Montagu, M.; Kuiper, M.; Van de Peer, Y. Modeling gene and genome duplications in eukaryotes. Proc. Natl. Acad. Sci. USA 2005, 102, 5454–5459. [Google Scholar] [CrossRef] [Scilit]
- Birchler, J.A.; Yang, H. The multiple fates of gene duplications: Deletion, hypofunctionalization, subfunctionalization, neofunctionalization, dosage balance constraints, and neutral variation. Plant Cell 2022, 34, 2466–2474. [Google Scholar] [CrossRef] [Scilit]
- Jiao, Y.; Wickett, N.J.; Ayyampalayam, S.; Chanderbali, A.S.; Landherr, L.; Ralph, P.E.; Tomsho, L.P.; Hu, Y.; Liang, H.; Soltis, P.S.; et al. Ancestral polyploidy in seed plants and angiosperms. Nature 2011, 473, 97–100. [Google Scholar] [CrossRef] [Scilit]
- Van de Peer, Y.; Mizrachi, E.; Marchal, K. The evolutionary significance of polyploidy. Nat. Rev. Genet. 2017, 18, 411–424. [Google Scholar] [CrossRef] [Scilit]
- Shi, T.; Gao, Z.; Chen, J.; Van de Peer, Y. Dosage sensitivity shapes balanced expression and gene longevity of homoeologs after whole-genome duplications in angiosperms. Plant Cell 2024, 36, 4323–4337. [Google Scholar] [CrossRef] [Scilit]
- Birchler, J.A.; Veitia, R.A. Gene balance hypothesis: Connecting issues of dosage sensitivity across biological disciplines. Proc. Natl. Acad. Sci. USA 2012, 109, 14746–14753. [Google Scholar] [CrossRef] [Scilit]
- Thomas, B.C.; Pedersen, B.; Freeling, M. Following tetraploidy in an Arabidopsis ancestor, genes were removed preferentially from one homeolog leaving clusters enriched in dose-sensitive genes. Genome Res. 2006, 16, 934–946. [Google Scholar] [CrossRef] [Scilit]
- De Smet, R.; Adams, K.L.; Vandepoele, K.; Van Montagu, M.C.E.; Maere, S.; Van de Peer, Y. Convergent gene loss following gene and genome duplications creates single-copy families in flowering plants. Proc. Natl. Acad. Sci. USA 2013, 110, 2898–2903. [Google Scholar] [CrossRef] [Scilit]
- Han, F.; Peng, Y.; Xu, L.; Xiao, P. Identification, characterization, and utilization of single copy genes in 29 angiosperm genomes. BMC Genom. 2014, 15, 504. [Google Scholar] [CrossRef] [Scilit]
- Kim, C.-K.; Seol, Y.-J.; Perumal, S.; Lee, J.; Waminal, N.E.; Jayakodi, M.; Lee, S.-C.; Jin, S.; Choi, B.-S.; Yu, Y.; et al. Re-exploration of U’s Triangle Brassica Species Based on Chloroplast Genomes and 45S nrDNA Sequences. Sci. Rep. 2018, 8, 7353. [Google Scholar] [CrossRef] [Scilit]
- Wang, X.; Wang, H.; Wang, J.; Sun, R.; Wu, J.; Liu, S.; Bai, Y.; Mun, J.-H.; Bancroft, I.; Cheng, F.; et al. The genome of the mesopolyploid crop species Brassica rapa. Nat. Genet. 2011, 43, 1035–1039. [Google Scholar] [CrossRef] [Scilit]
- Liu, S.; Liu, Y.; Yang, X.; Tong, C.; Edwards, D.; Parkin, I.A.P.; Zhao, M.; Ma, J.; Yu, J.; Huang, S.; et al. The Brassica oleracea genome reveals the asymmetrical evolution of polyploid genomes. Nat. Commun. 2014, 5, 3930. [Google Scholar] [CrossRef] [Scilit]
- Chalhoub, B.; Denoeud, F.; Liu, S.; Parkin, I.A.P.; Tang, H.; Wang, X.; Chiquet, J.; Belcram, H.; Tong, C.; Samans, B.; et al. Early allopolyploid evolution in the post-Neolithic Brassica napus oilseed genome. Science 2014, 345, 950–953. [Google Scholar] [CrossRef] [Scilit]
- Yang, J.; Liu, D.; Wang, X.; Ji, C.; Cheng, F.; Liu, B.; Hu, Z.; Chen, S.; Pental, D.; Ju, Y.; et al. The genome sequence of allopolyploid Brassica juncea and analysis of differential homoeolog gene expression influencing selection. Nat. Genet. 2016, 48, 1225–1232, Correction in Nat. Genet. 2018, 50, 1616. [Google Scholar] [CrossRef] [Scilit]
- Song, X.; Wei, Y.; Xiao, D.; Gong, K.; Sun, P.; Ren, Y.; Yuan, J.; Wu, T.; Yang, Q.; Li, X.; et al. Brassica carinata genome characterization clarifies U’s triangle model of evolution and polyploidy in Brassica. Plant Physiol. 2021, 186, 388–406. [Google Scholar] [CrossRef] [Scilit]
- Sun, F.; Fan, G.; Hu, Q.; Zhou, Y.; Guan, M.; Tong, C.; Li, J.; Du, D.; Qi, C.; Jiang, L.; et al. The high-quality genome of Brassica napus cultivar ‘ZS11’ reveals the introgression history in semi-winter morphotype. Plant J. 2017, 92, 452–468. [Google Scholar] [CrossRef] [Scilit]
- Hurgobin, B.; Golicz, A.A.; Bayer, P.E.; Chan, C.K.; Tirnaz, S.; Dolatabadian, A.; Schiessl, S.V.; Samans, B.; Montenegro, J.D.; Parkin, I.A.P.; et al. Homoeologous exchange is a major cause of gene presence/absence variation in the amphidiploid Brassica napus. Plant Biotechnol. J. 2018, 16, 1265–1274. [Google Scholar] [CrossRef] [Scilit]
- Song, J.-M.; Guan, Z.; Hu, J.; Guo, C.; Yang, Z.; Wang, S.; Liu, D.; Wang, B.; Lu, S.; Zhou, R.; et al. Eight high-quality genomes reveal pan-genome architecture and ecotype differentiation of Brassica napus. Nat. Plants 2020, 6, 34–45. [Google Scholar] [CrossRef] [Scilit]
- Zhang, H.; Forde, B.G. An Arabidopsis MADS box gene that controls nutrient-induced changes in root architecture. Science 1998, 279, 407–409. [Google Scholar] [CrossRef] [Scilit]
- Krouk, G.; Lacombe, B.; Bielach, A.; Perrine-Walker, F.; Malinska, K.; Mounier, E.; Hoyerova, K.; Tillard, P.; Leon, S.; Ljung, K.; et al. Nitrate-regulated auxin transport by NRT1.1 defines a mechanism for nutrient sensing in plants. Dev. Cell 2010, 18, 927–937. [Google Scholar] [CrossRef] [Scilit]
- Williamson, L.C.; Ribrioux, S.P.; Fitter, A.H.; Leyser, H.M. Phosphate availability regulates root system architecture in Arabidopsis. Plant Physiol. 2001, 126, 875–882. [Google Scholar] [CrossRef] [Scilit]
- Linkohr, B.I.; Williamson, L.C.; Fitter, A.H.; Leyser, H.M. Nitrate and phosphate availability and distribution have different effects on root system architecture of Arabidopsis. Plant J. 2002, 29, 751–760. [Google Scholar] [CrossRef] [Scilit]
- Pérez-Torres, C.A.; López-Bucio, J.; Cruz-Ramírez, A.; Ibarra-Laclette, E.; Dharmasiri, S.; Estelle, M.; Herrera-Estrella, L. Phosphate availability alters lateral root development in Arabidopsis by modulating auxin sensitivity via a mechanism involving the TIR1 auxin receptor. Plant Cell 2008, 20, 3258–3272. [Google Scholar] [CrossRef] [Scilit]
- Li, Y.; Yang, X.; Liu, H.; Wang, W.; Wang, C.; Ding, G.; Xu, F.; Wang, S.; Cai, H.; Hammond, J.P.; et al. Local and systemic responses conferring acclimation of Brassica napus roots to low phosphorus conditions. J. Exp. Bot. 2022, 73, 4753–4777. [Google Scholar] [CrossRef] [Scilit]
- Wang, J.; Dun, X.; Shi, J.; Wang, X.; Liu, G.; Wang, H. Genetic dissection of root morphological traits related to nitrogen use efficiency in Brassica napus L. under two contrasting nitrogen conditions. Front. Plant Sci. 2017, 8, 1709. [Google Scholar] [CrossRef] [Scilit]
- Yuan, P.; Liu, H.; Wang, X.; Hammond, J.P.; Shi, L. Genome-wide association study reveals candidate genes controlling root system architecture under low phosphorus supply at seedling stage in Brassica napus. Mol. Breed. 2023, 43, 63. [Google Scholar] [CrossRef] [Scilit]
- Goodstein, D.M.; Shu, S.; Howson, R.; Neupane, R.; Hayes, R.D.; Fazo, J.; Mitros, T.; Dirks, W.; Hellsten, U.; Putnam, N.; et al. Phytozome: A comparative platform for green plant genomics. Nucleic. Acids Res. 2012, 40, 1178–1186. [Google Scholar] [CrossRef] [Scilit]
- Falk, T.; Herndon, N.; Grau, E.; Buehler, S.; Richter, P.; Zaman, S.; Baker, E.M.; Ramnath, R.; Ficklin, S.; Staton, M.; et al. Growing and cultivating the forest genomics database, TreeGenes. Database 2018, 2018, bay084, Correction in Database 2019, 2019, baz043. [Google Scholar] [CrossRef] [Scilit]
- Chen, C.; Chen, H.; Zhang, Y.; Thomas, H.R.; Frank, M.H.; He, Y.; Xia, R. TBtools: An Integrative Toolkit Developed for Interactive Analyses of Big Biological Data. Mol. Plant 2020, 13, 1194–1202. [Google Scholar] [CrossRef] [Scilit]
- Buchfink, B.; Xie, C.; Huson, D.H. Fast and sensitive protein alignment using DIAMOND. Nat. Methods 2015, 12, 59–60. [Google Scholar] [CrossRef] [Scilit]
- Horton, P.; Park, K.J.; Obayashi, T.; Fujita, N.; Harada, H.; Adams-Collier, C.J.; Nakai, K. WoLF PSORT: Protein localization predictor. Nucleic. Acids Res. 2007, 35, 585–587. [Google Scholar] [CrossRef] [Scilit]
- Emms, D.M.; Kelly, S. OrthoFinder: Phylogenetic orthology inference for comparative genomics. Genome Biol. 2019, 20, 238. [Google Scholar] [CrossRef] [Scilit]
- Tamura, K.; Stecher, G.; Kumar, S. MEGA11: Molecular Evolutionary Genetics Analysis Version 11. Mol. Biol. Evol. 2021, 38, 3022–3027. [Google Scholar] [CrossRef] [Scilit]
- Hu, B.; Jin, J.; Guo, A.Y.; Zhang, H.; Luo, J.; Gao, G. GSDS 2.0: An upgraded gene feature visualization server. Bioinformatics 2015, 31, 1296–1297. [Google Scholar] [CrossRef] [Scilit]
- Cantalapiedra, C.P.; Hernández-Plaza, A.; Letunic, I.; Bork, P.; Huerta-Cepas, J. eggNOG-mapper v2: Functional Annotation, Orthology Assignments, and Domain Prediction at the Metagenomic Scale. Mol. Biol. Evol. 2021, 38, 5825–5829. [Google Scholar] [CrossRef] [Scilit]
- Wang, Y.; Tang, H.; Debarry, J.D.; Tan, X.; Li, J.; Wang, X.; Lee, T.H.; Jin, H.; Marler, B.; Guo, H.; et al. MCScanX: A toolkit for detection and evolutionary analysis of gene synteny and collinearity. Nucleic. Acids Res. 2012, 40, e49. [Google Scholar] [CrossRef] [Scilit]
- Lescot, M.; Déhais, P.; Thijs, G.; Marchal, K.; Moreau, Y.; Van de Peer, Y.; Rouzé, P.; Rombauts, S. PlantCARE, a database of plant cis-acting regulatory elements and a portal to tools for in silico analysis of promoter sequences. Nucleic. Acids Res. 2002, 30, 325–327. [Google Scholar] [CrossRef] [Scilit]
- Tian, F.; Yang, D.C.; Meng, Y.Q.; Jin, J.; Gao, G. PlantRegMap: Charting functional regulatory maps in plants. Nucleic. Acids Res. 2020, 48, 1104–1113. [Google Scholar] [CrossRef] [Scilit]
- Dai, X.; Zhuang, Z.; Zhao, P.X. psRNATarget: A plant small RNA target analysis server (2017 release). Nucleic. Acids Res. 2018, 46, 49–54. [Google Scholar] [CrossRef] [Scilit]
- Shannon, P.; Markiel, A.; Ozier, O.; Baliga, N.S.; Wang, J.T.; Ramage, D.; Amin, N.; Schwikowski, B.; Ideker, T. Cytoscape: A software environment for integrated models of biomolecular interaction networks. Genome Res. 2003, 13, 2498–2504. [Google Scholar] [CrossRef] [Scilit]
- Yang, Z.; Wang, S.; Wei, L.; Huang, Y.; Liu, D.; Jia, Y.; Luo, C.; Lin, Y.; Liang, C.; Hu, Y.; et al. BnIR: A multi-omics database with various tools for Brassica napus research and breeding. Mol. Plant 2023, 16, 775–789. [Google Scholar] [CrossRef] [Scilit]
- Schneider, C.A.; Rasband, W.S.; Eliceiri, K.W. NIH Image to ImageJ: 25 years of image analysis. Nat. Methods 2012, 9, 671–675. [Google Scholar] [CrossRef] [Scilit]
- Adams, K.L.; Wendel, J.F. Polyploidy and genome evolution in plants. Curr. Opin. Plant Biol. 2005, 8, 135–141. [Google Scholar] [CrossRef] [Scilit]
- Mun, J.H.; Kwon, S.J.; Yang, T.J.; Seol, Y.J.; Jin, M.; Kim, J.A.; Lim, M.H.; Kim, J.S.; Baek, S.; Choi, B.S.; et al. Genome-wide comparative analysis of the Brassica rapa gene space reveals genome shrinkage and differential loss of duplicated genes after whole genome triplication. Genome Biol. 2009, 10, R111. [Google Scholar] [CrossRef] [Scilit]
- Town, C.D.; Cheung, F.; Maiti, R.; Crabtree, J.; Haas, B.J.; Wortman, J.R.; Hine, E.E.; Althoff, R.; Arbogast, T.S.; Tallon, L.J.; et al. Comparative genomics of Brassica oleracea and Arabidopsis thaliana reveal gene loss, fragmentation, and dispersal after polyploidy. Plant Cell 2006, 18, 1348–1359. [Google Scholar] [CrossRef] [Scilit]
- Parkin, I.A.; Koh, C.; Tang, H.; Robinson, S.J.; Kagale, S.; Clarke, W.E.; Town, C.D.; Nixon, J.; Krishnakumar, V.; Bidwell, S.L.; et al. Transcriptome and methylome profiling reveals relics of genome dominance in the mesopolyploid Brassica oleracea. Genome Biol. 2014, 15, R77. [Google Scholar] [CrossRef] [Scilit]
- Soltis, P.S.; Marchant, D.B.; Van de Peer, Y.; Soltis, D.E. Polyploidy and genome evolution in plants. Curr. Opin. Genet. Dev. 2015, 35, 119–125. [Google Scholar] [CrossRef] [Scilit]
- Gonzalo, A.; Lucas, M.O.; Charpentier, C.; Sandmann, G.; Lloyd, A.; Jenczewski, E. Reducing MSH4 copy number prevents meiotic crossovers between non-homologous chromosomes in Brassica napus. Nat. Commun. 2019, 10, 2354. [Google Scholar] [CrossRef] [Scilit]
- Stein, A.; Coriton, O.; Rousseau-Gueutin, M.; Samans, B.; Schiessl, S.V.; Obermeier, C.; Parkin, I.A.P.; Chèvre, A.M.; Snowdon, R.J. Mapping of homoeologous chromosome exchanges influencing quantitative trait variation in Brassica napus. Plant Biotechnol. J. 2017, 15, 1478–1489. [Google Scholar] [CrossRef] [Scilit]
- Golicz, A.A.; Bayer, P.E.; Barker, G.C.; Edger, P.P.; Kim, H.; Martinez, P.A.; Chan, C.K.; Severn-Ellis, A.; McCombie, W.R.; Parkin, I.A.; et al. The pangenome of an agronomically important crop plant Brassica oleracea. Nat. Commun. 2016, 7, 13390. [Google Scholar] [CrossRef] [Scilit]
- Pant, B.D.; Musialak-Lange, M.; Nuc, P.; May, P.; Buhtz, A.; Kehr, J.; Walther, D.; Scheible, W.R. Identification of nutrient-responsive Arabidopsis and rapeseed microRNAs by comprehensive real-time polymerase chain reaction profiling and small RNA sequencing. Plant Physiol. 2009, 150, 1541–1555. [Google Scholar] [CrossRef] [Scilit]
- Zhao, M.; Ding, H.; Zhu, J.K.; Zhang, F.; Li, W.X. Involvement of miR169 in the nitrogen-starvation responses in Arabidopsis. New Phytol. 2011, 190, 906–915. [Google Scholar] [CrossRef] [Scilit]
- Lei, K.J.; Lin, Y.M.; Ren, J.; Bai, L.; Miao, Y.C.; An, G.Y.; Song, C.P. Modulation of the Phosphate-Deficient Responses by MicroRNA156 and its Targeted SQUAMOSA PROMOTER BINDING PROTEIN-LIKE 3 in Arabidopsis. Plant Cell Physiol. 2016, 57, 192–203. [Google Scholar] [CrossRef] [Scilit]
- Liang, G.; Yang, F.; Yu, D. MicroRNA395 mediates regulation of sulfate accumulation and allocation in Arabidopsis thaliana. Plant J. 2010, 62, 1046–1057. [Google Scholar] [CrossRef] [Scilit]
- Giehl, R.F.; von Wirén, N. Root nutrient foraging. Plant Physiol. 2014, 166, 509–517. [Google Scholar] [CrossRef] [Scilit]
- Gruber, B.D.; Giehl, R.F.; Friedel, S.; von Wirén, N. Plasticity of the Arabidopsis root system under nutrient deficiencies. Plant Physiol. 2013, 163, 161–179. [Google Scholar] [CrossRef] [Scilit]
- Fujii, K. Plant strategy of root system architecture and exudates for acquiring soil nutrients. Ecol. Res. 2024, 39, 623–633. [Google Scholar] [CrossRef] [Scilit]
- Péret, B.; Clément, M.; Nussaume, L.; Desnos, T. Root developmental adaptation to phosphate starvation: Better safe than sorry. Trends Plant Sci. 2011, 16, 442–450. [Google Scholar] [CrossRef] [Scilit]
- Puga, M.I.; Poza-Carrión, C.; Martinez-Hevia, I.; Perez-Liens, L.; Paz-Ares, J. Recent advances in research on phosphate starvation signaling in plants. J. Plant Res. 2024, 137, 315–330. [Google Scholar] [CrossRef] [Scilit]
- Lu, H.; Ren, M.; Lin, R.; Jin, K.; Mao, C. Developmental responses of roots to limited phosphate availability: Research progress and application in cereals. Plant Physiol. 2024, 196, 2162–2174. [Google Scholar] [CrossRef] [Scilit]
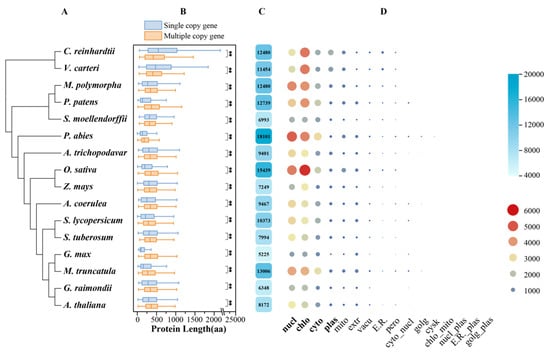
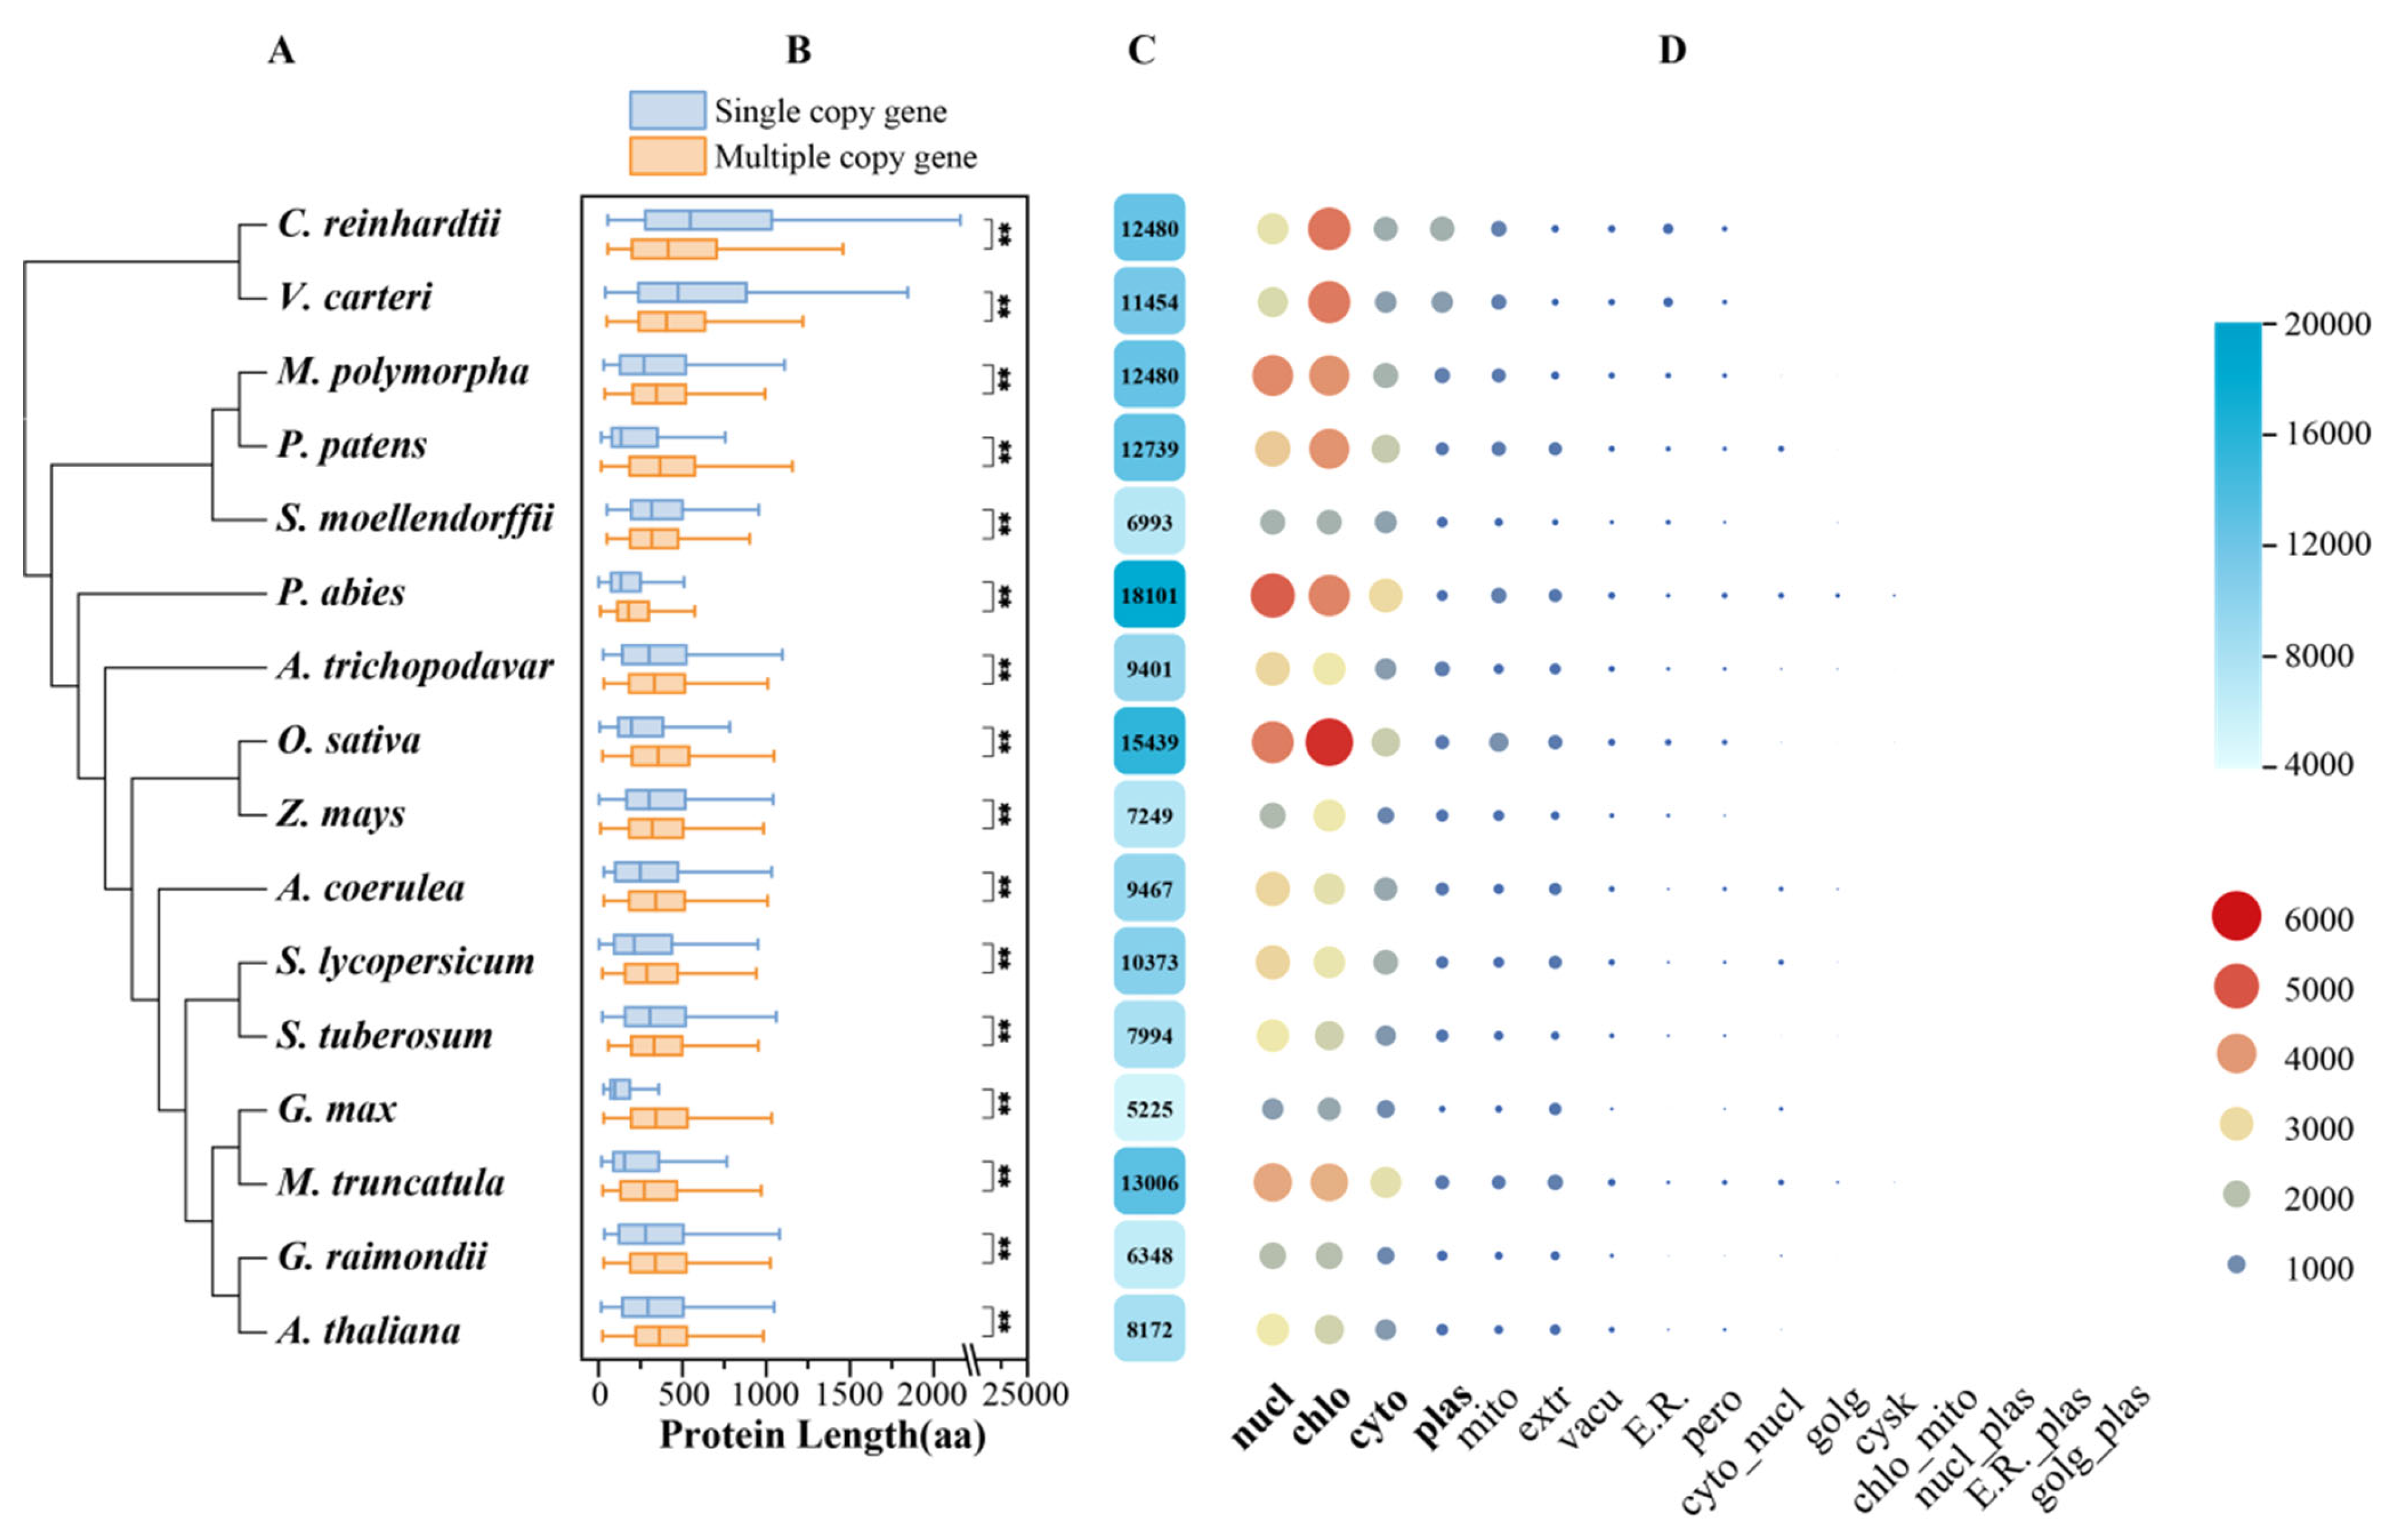
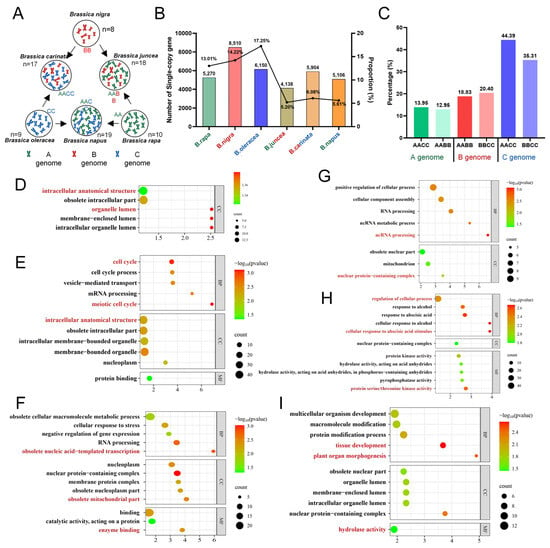
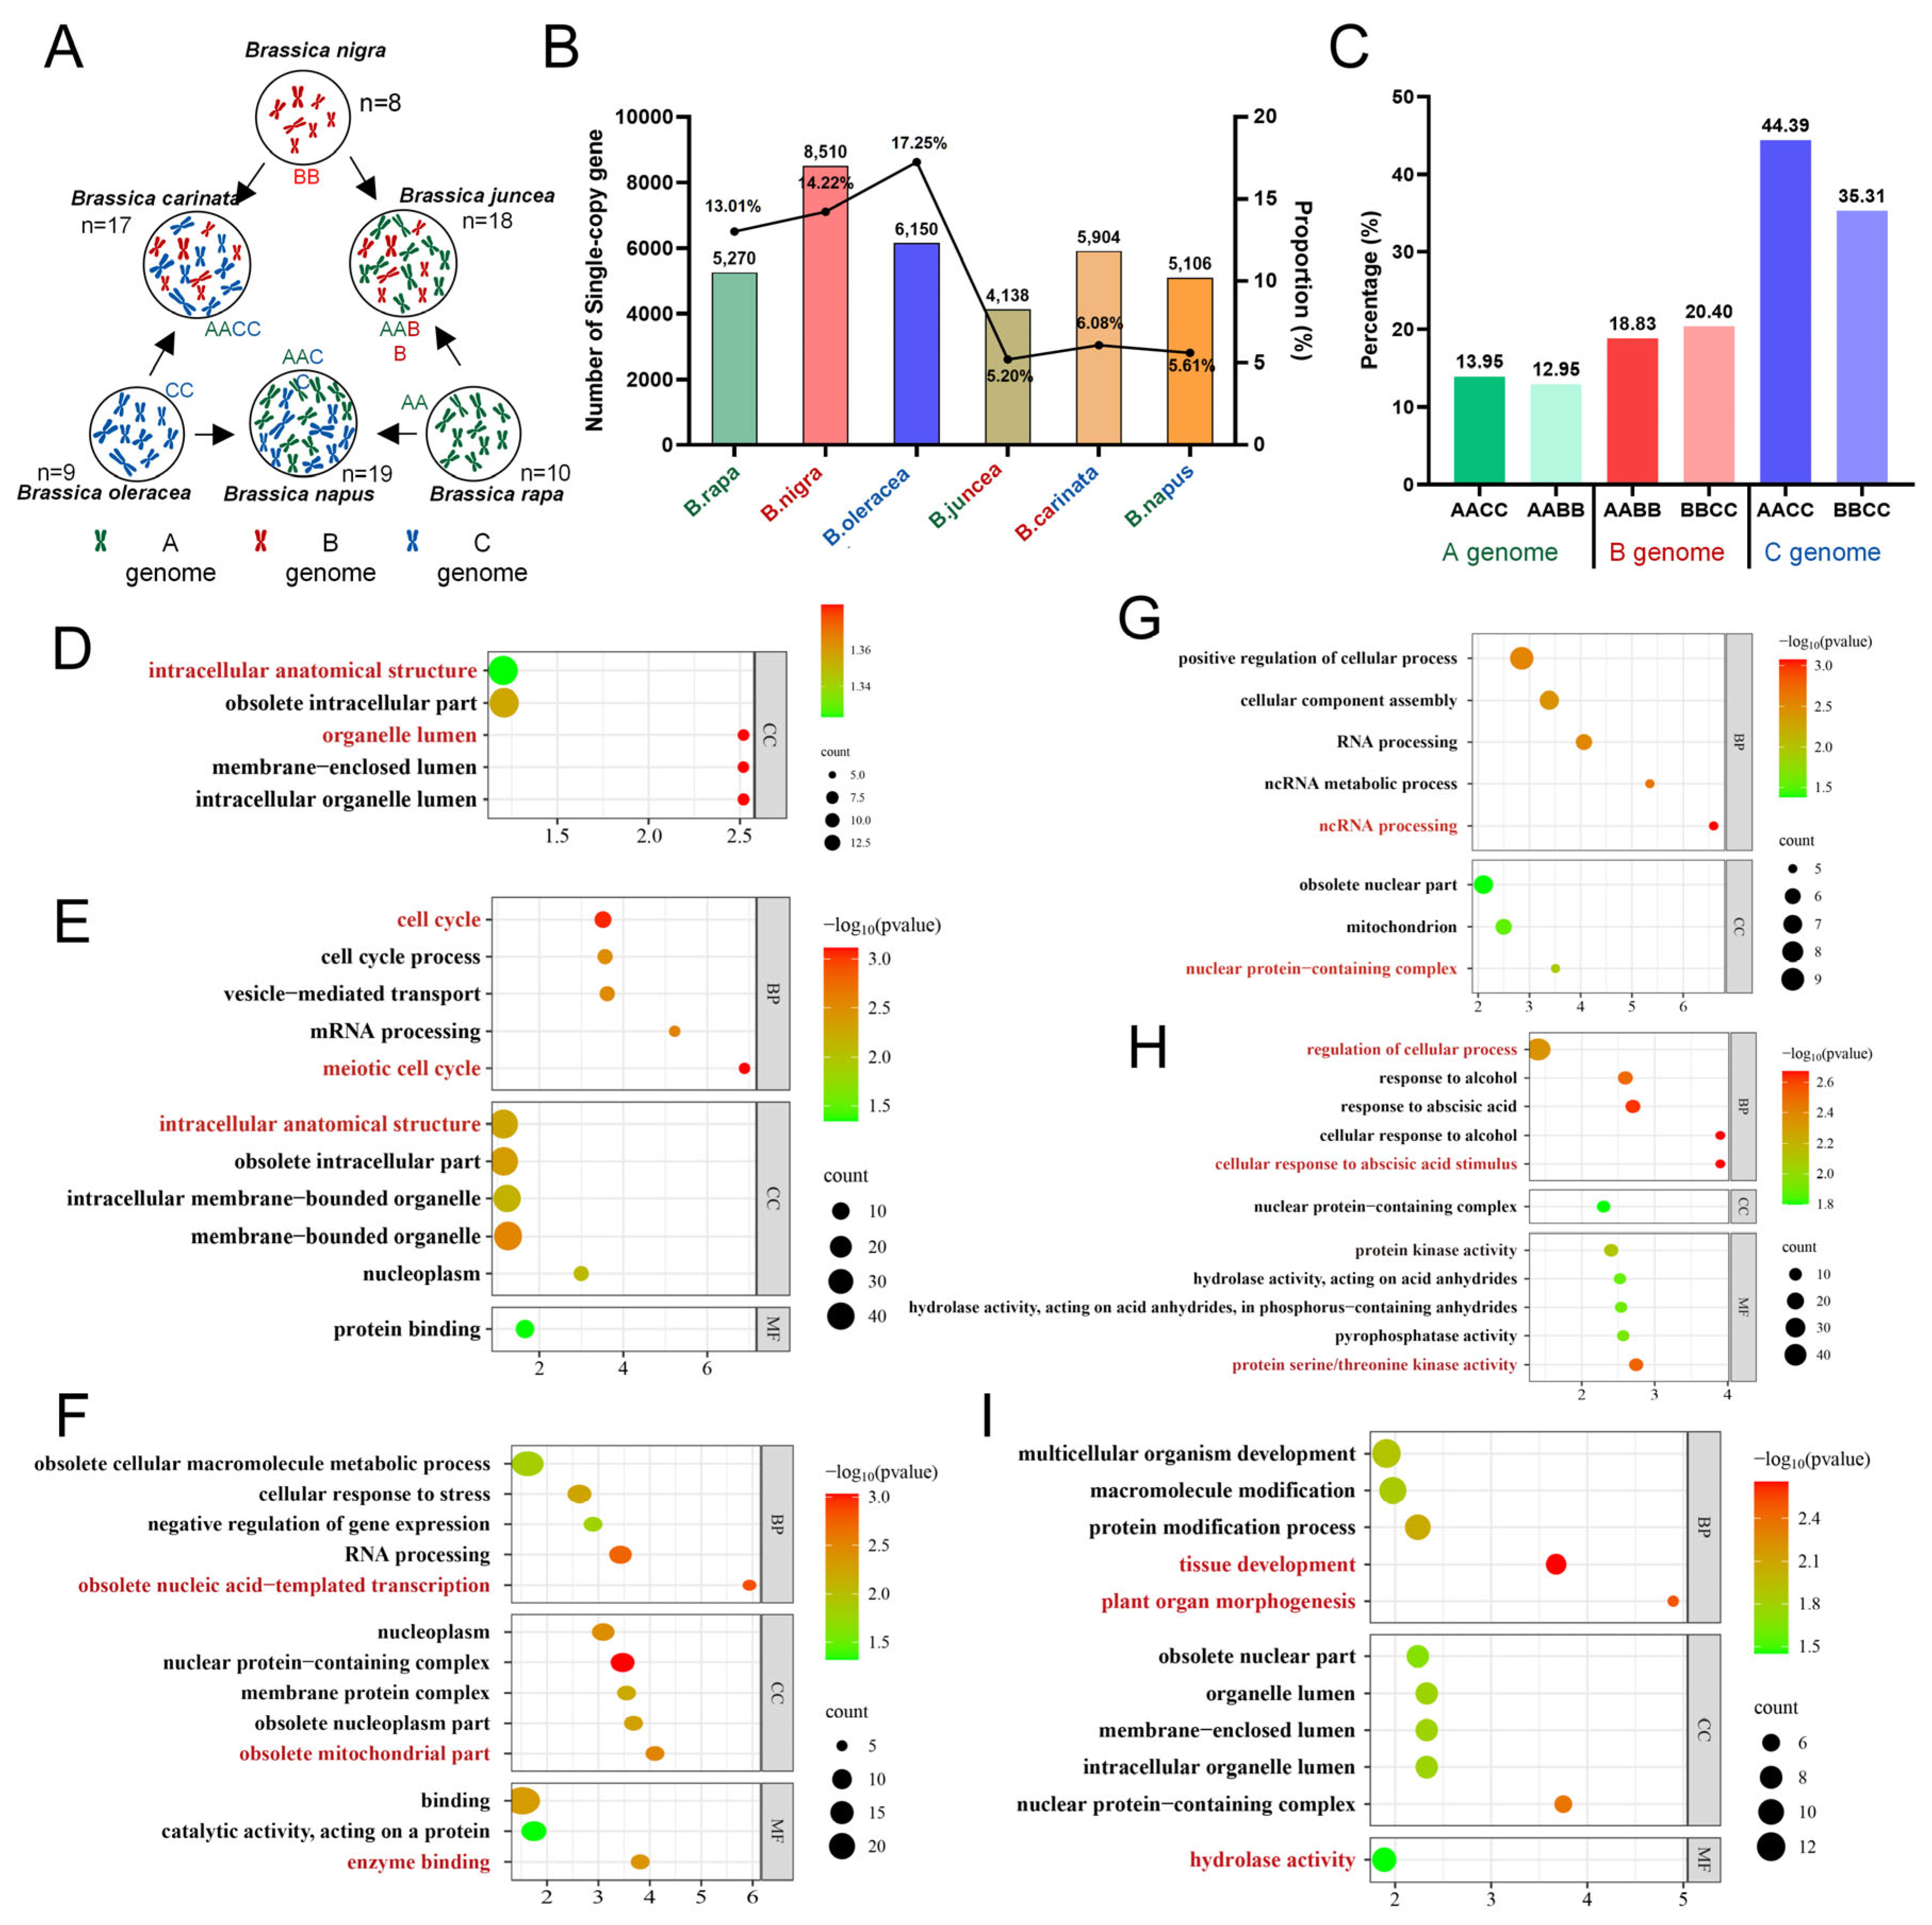


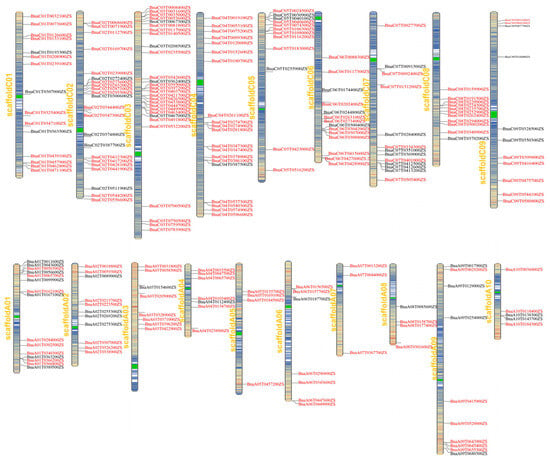
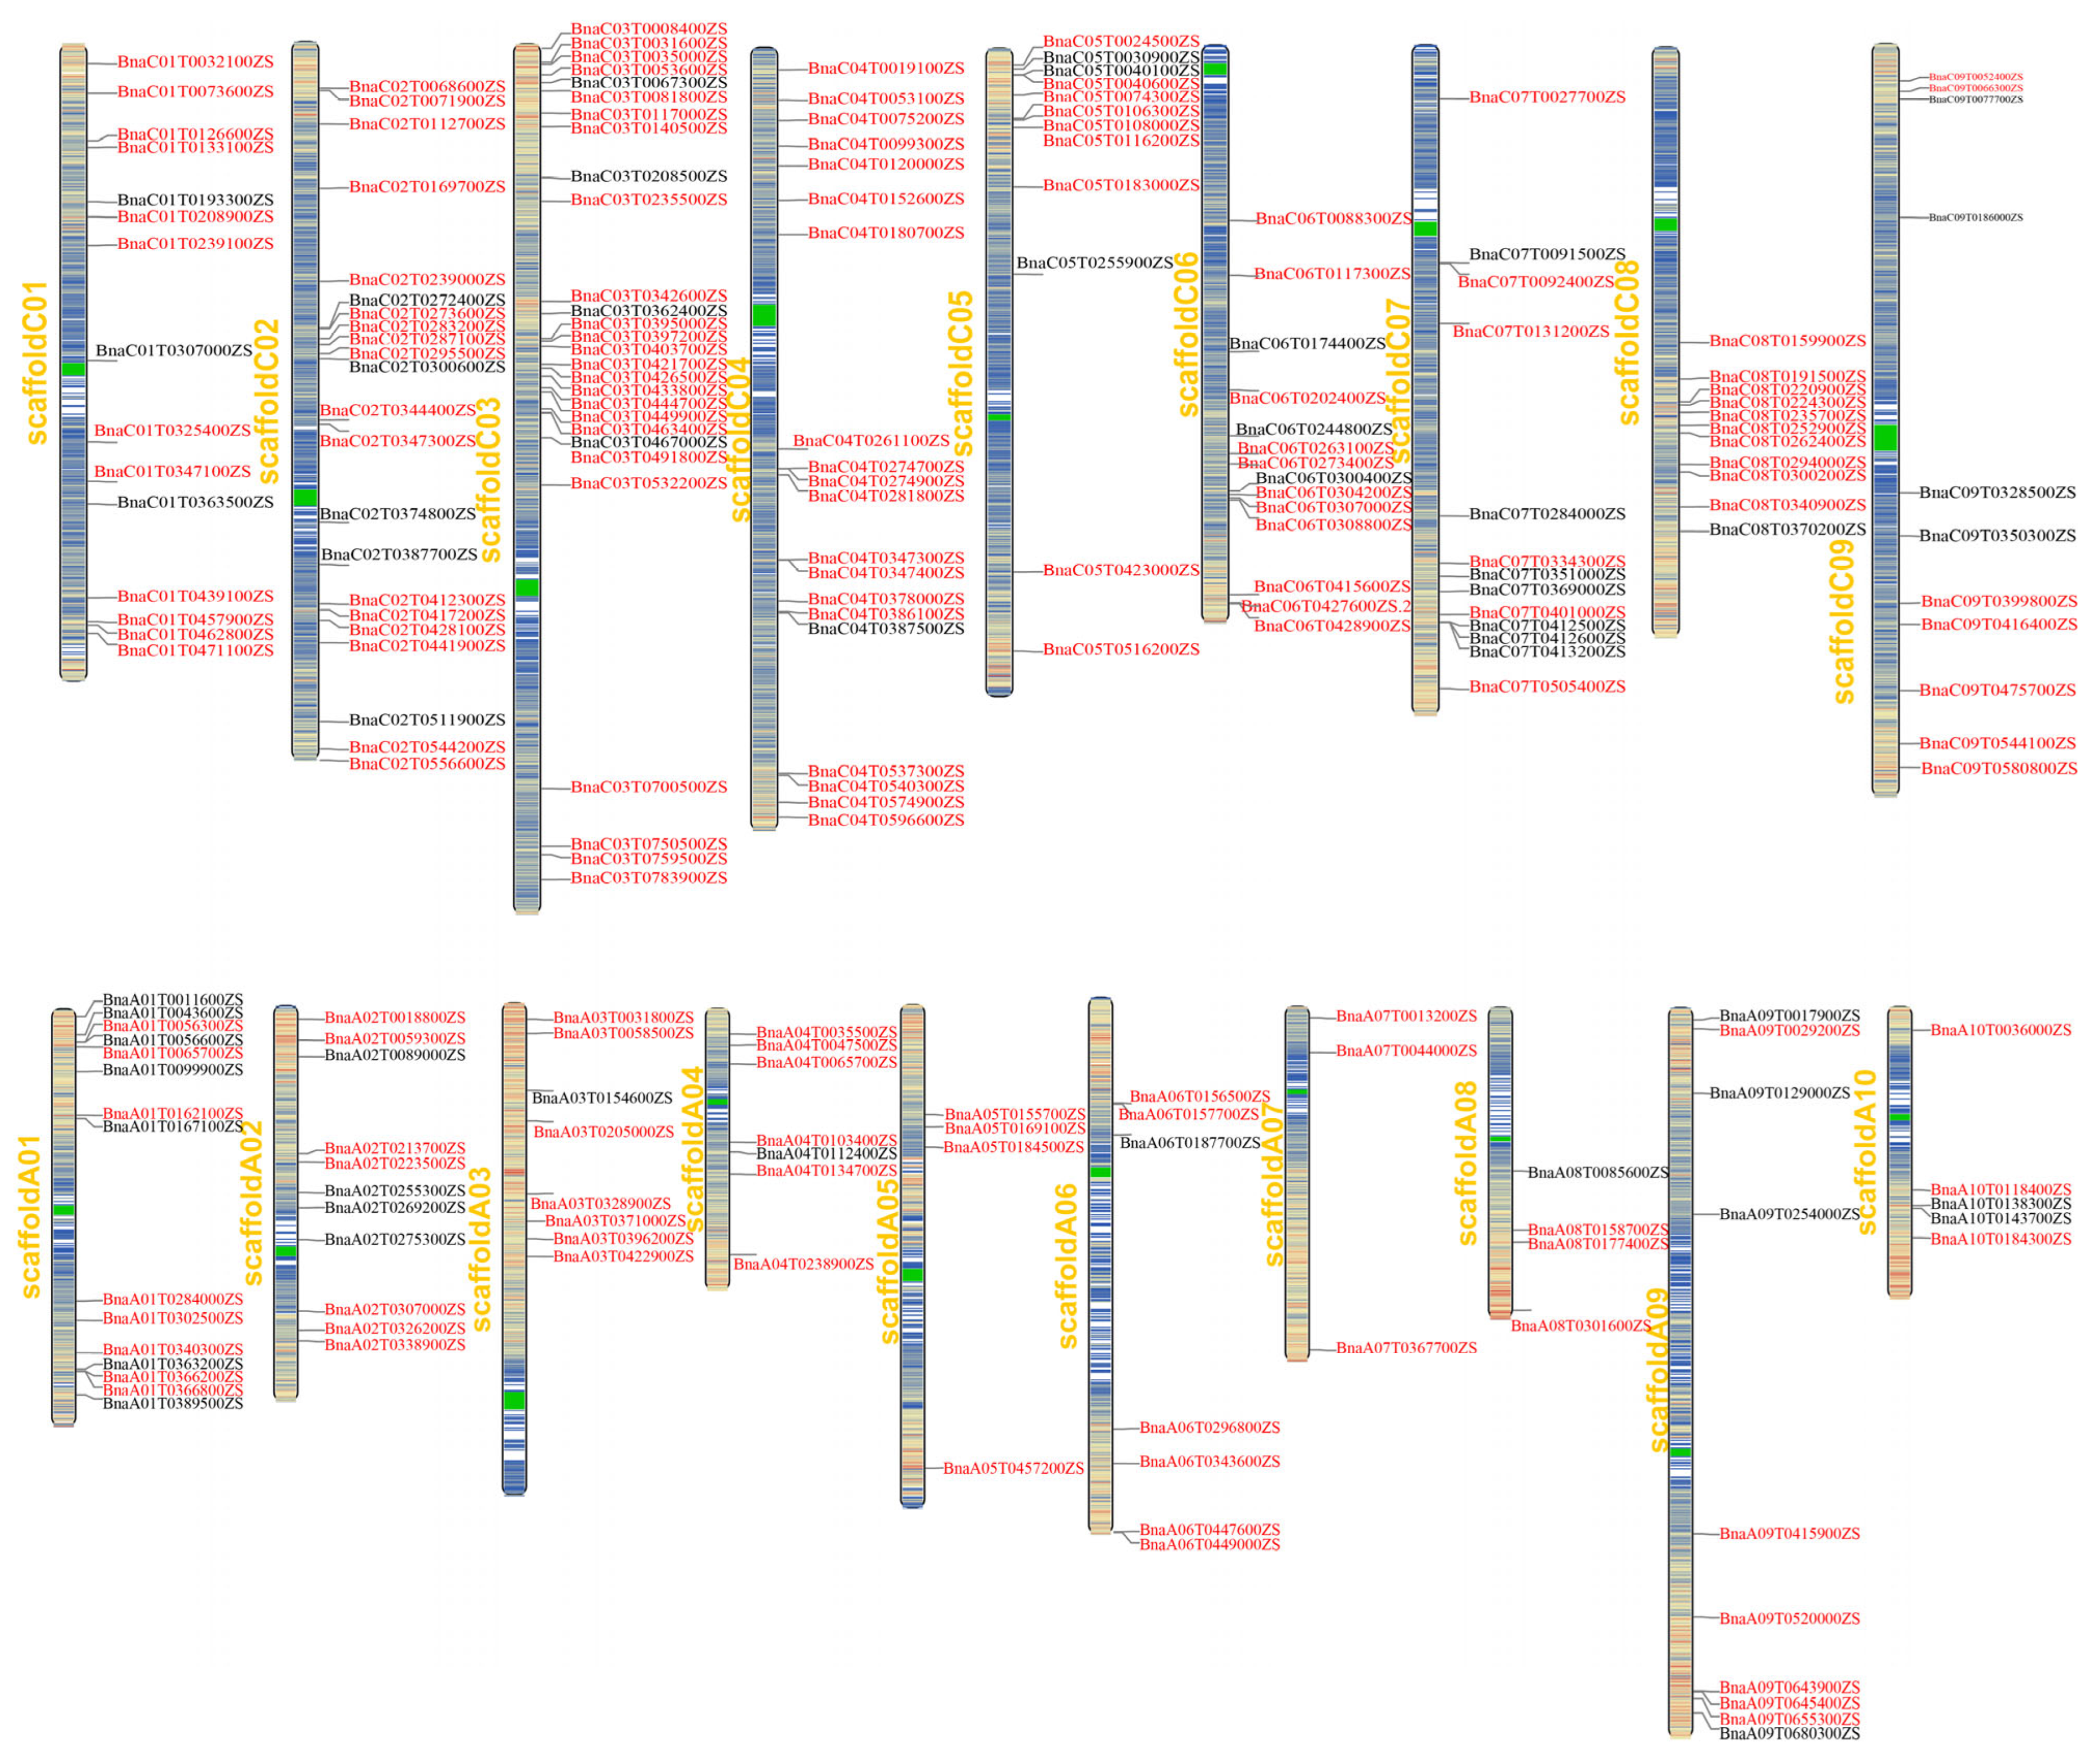
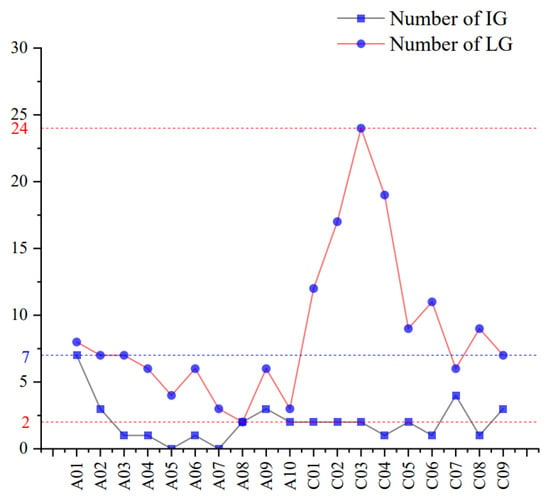
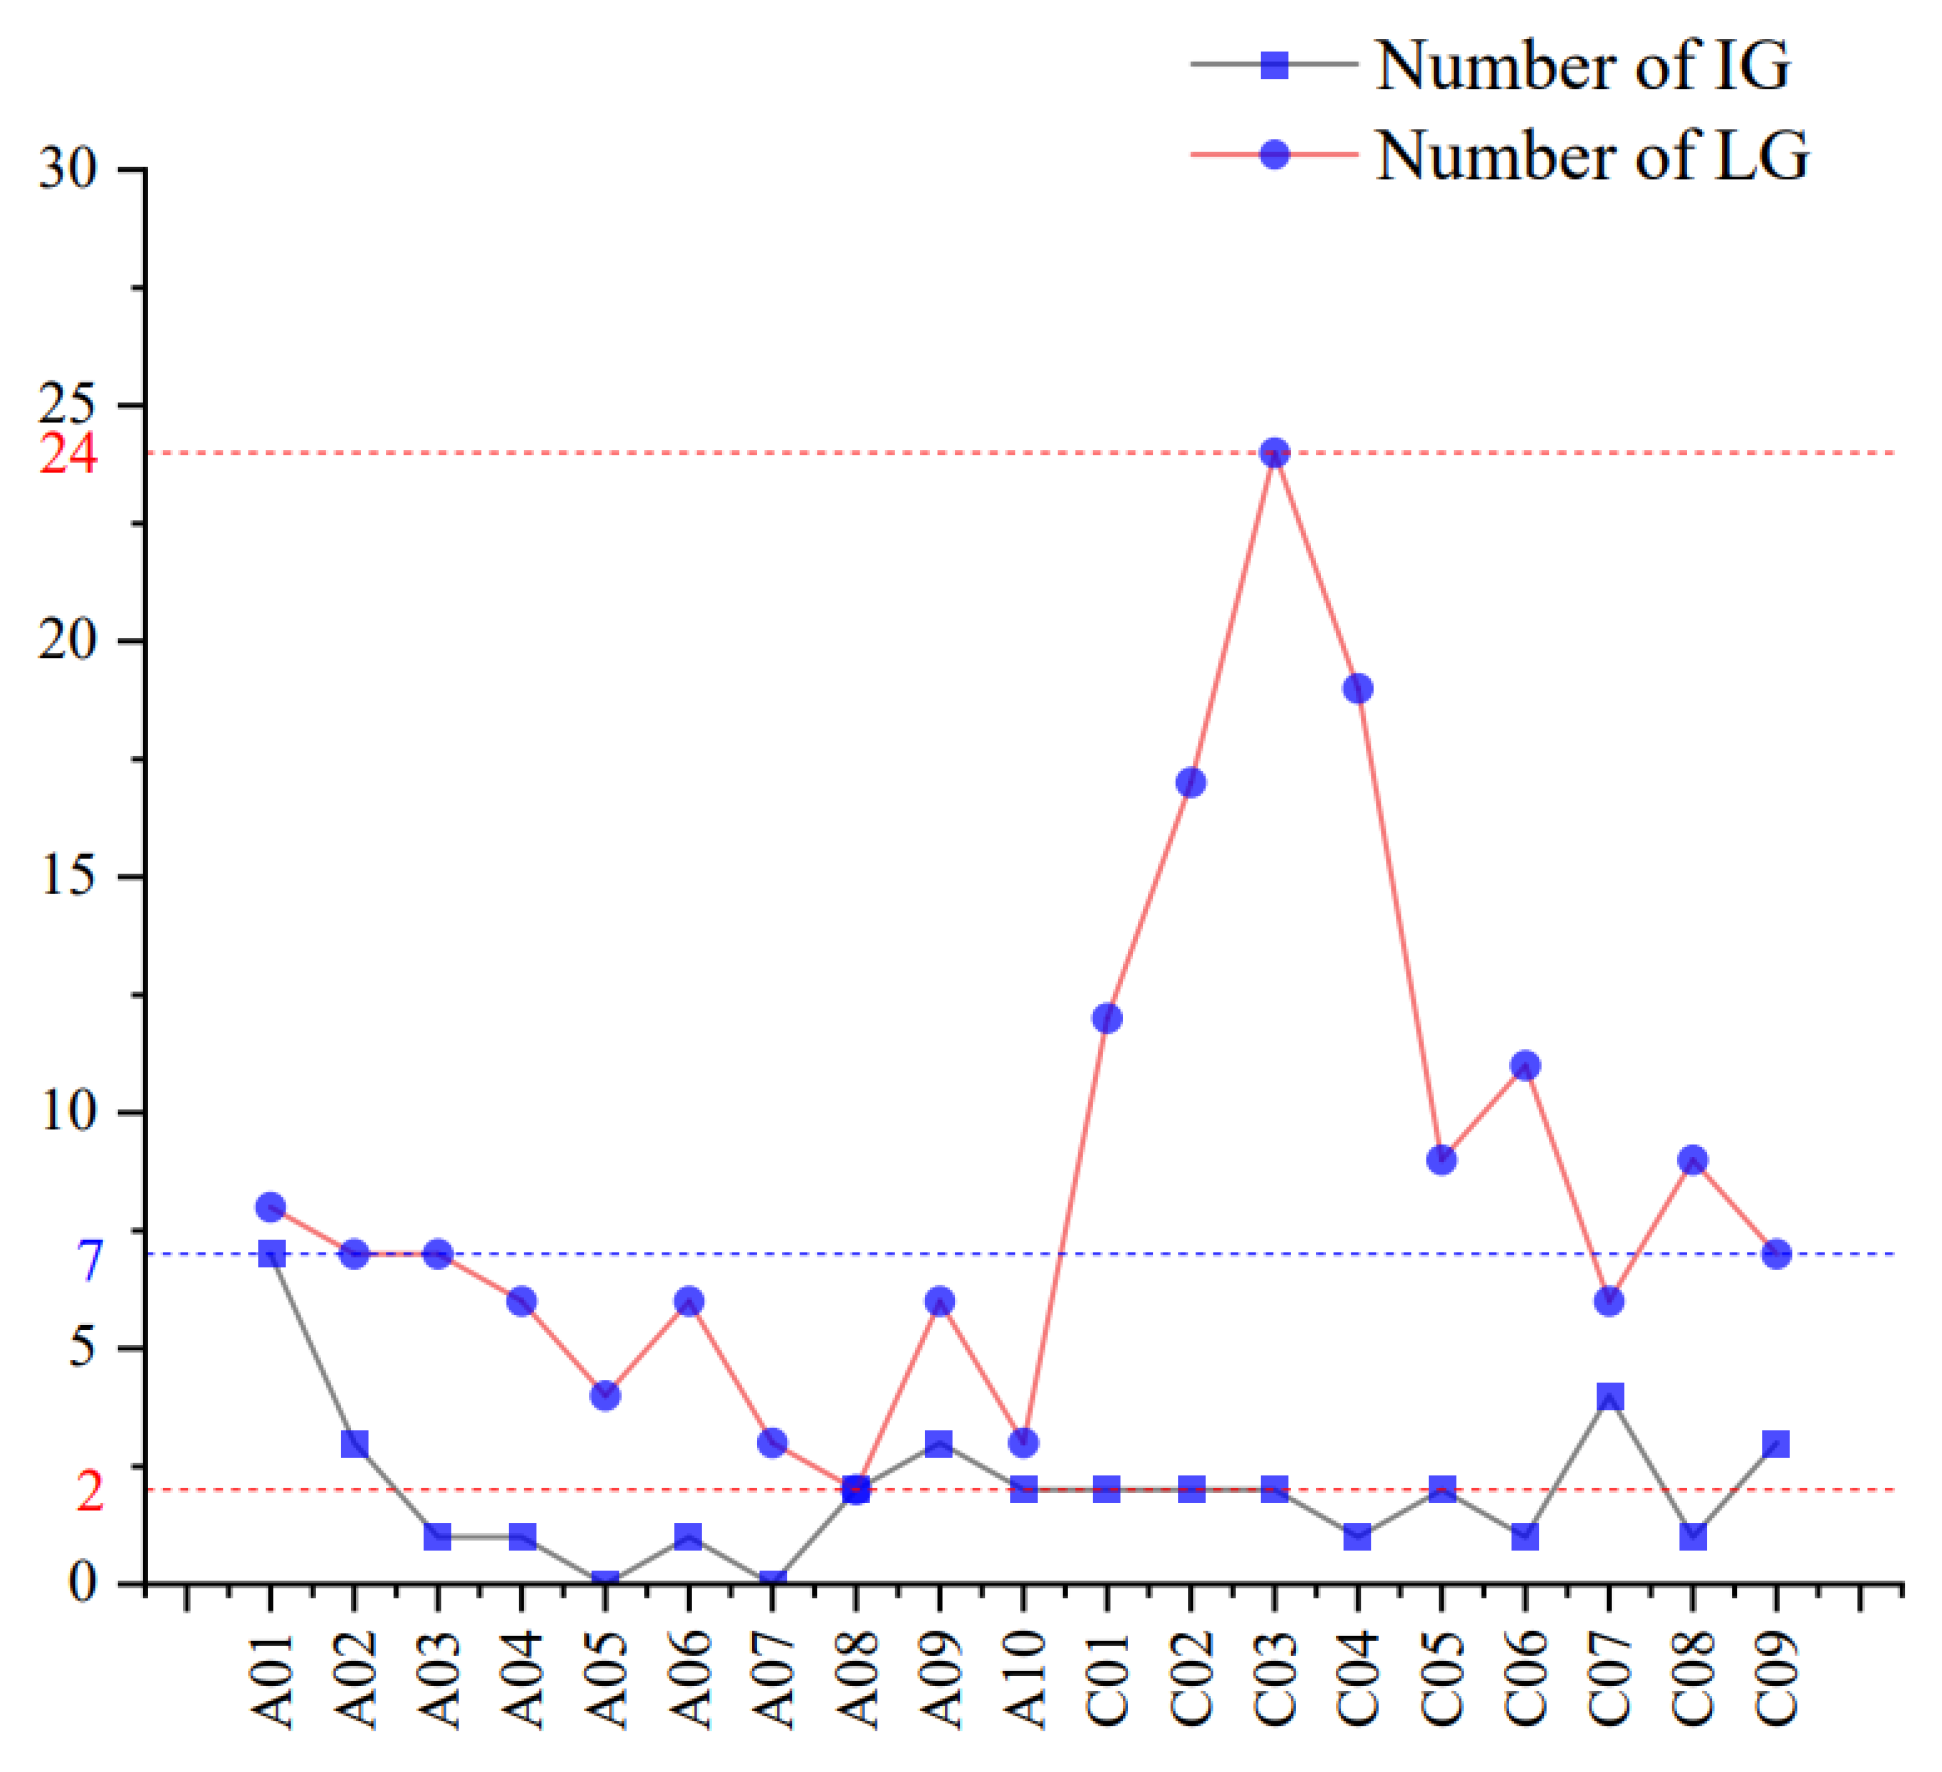
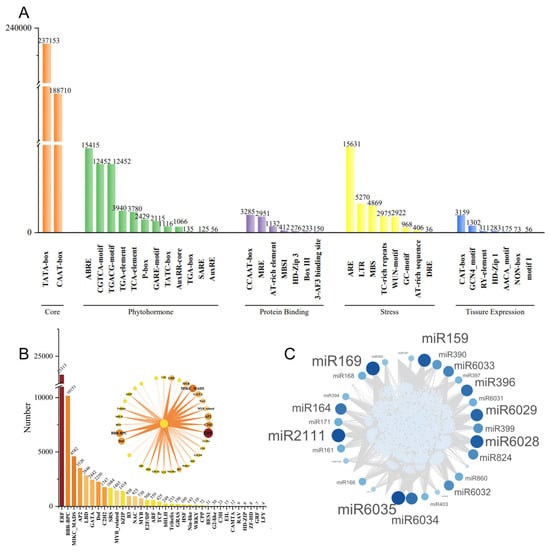
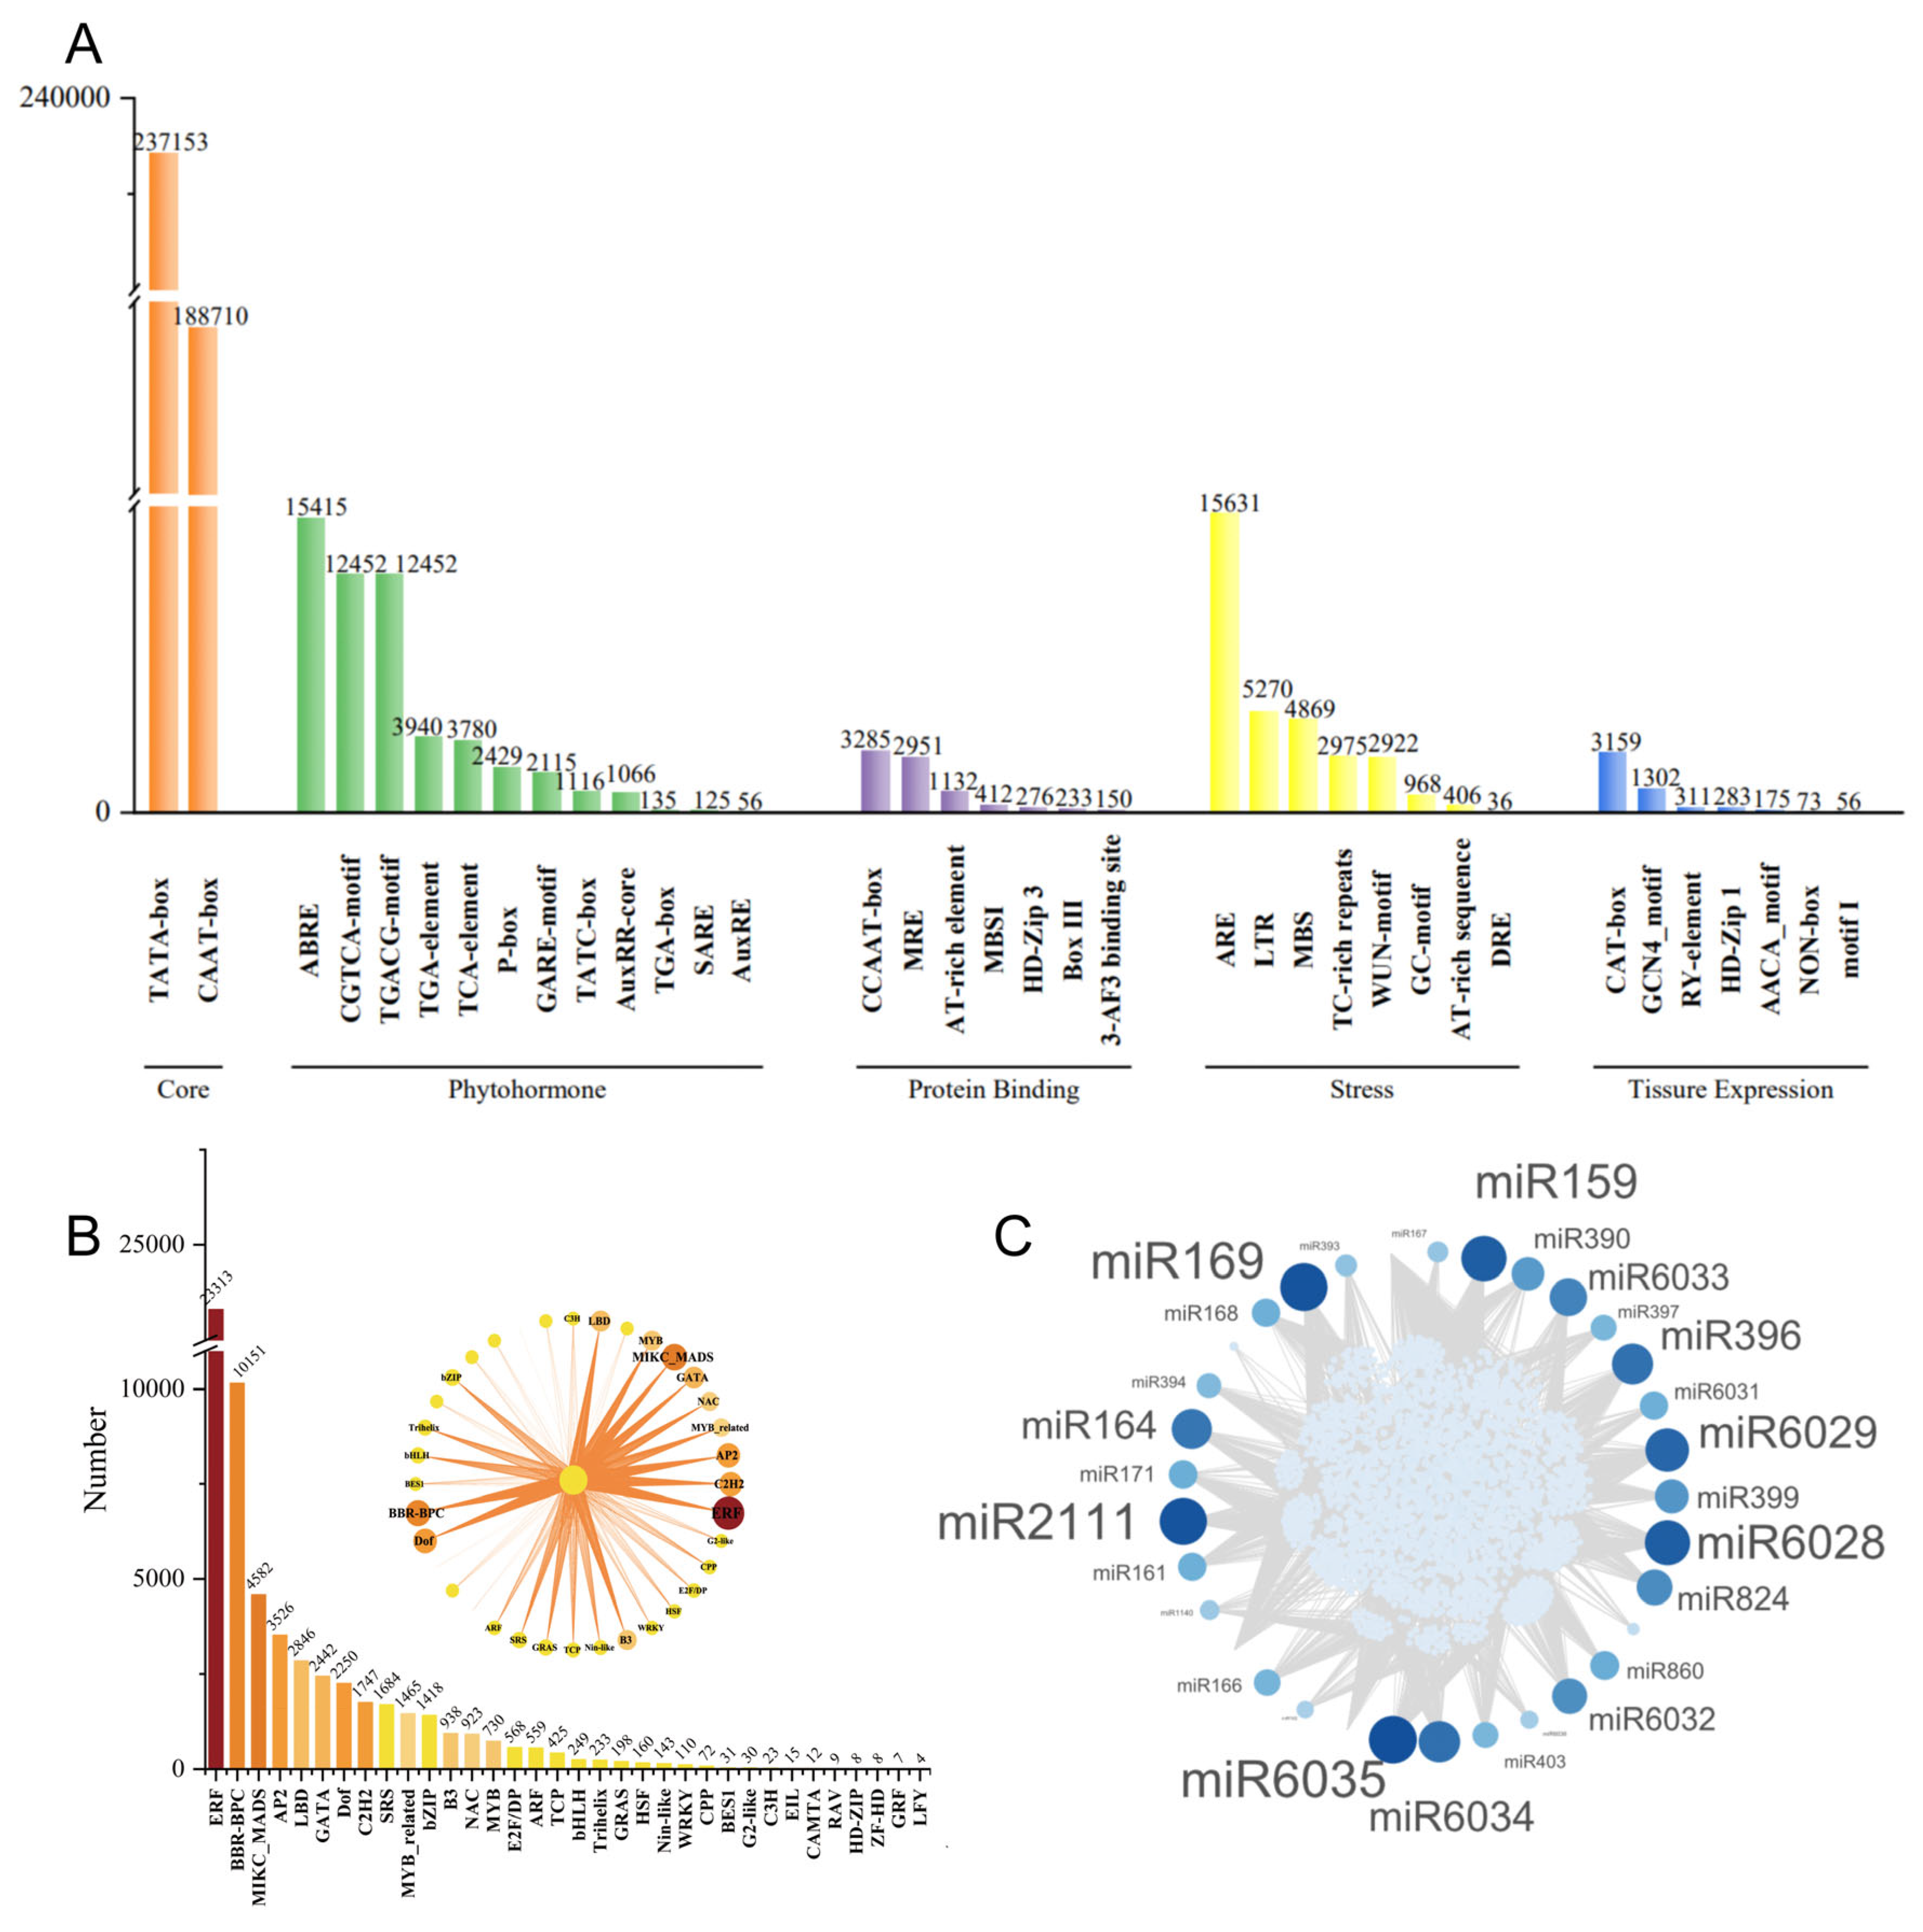
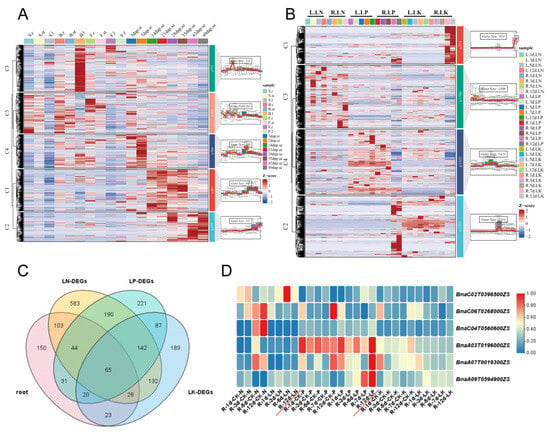
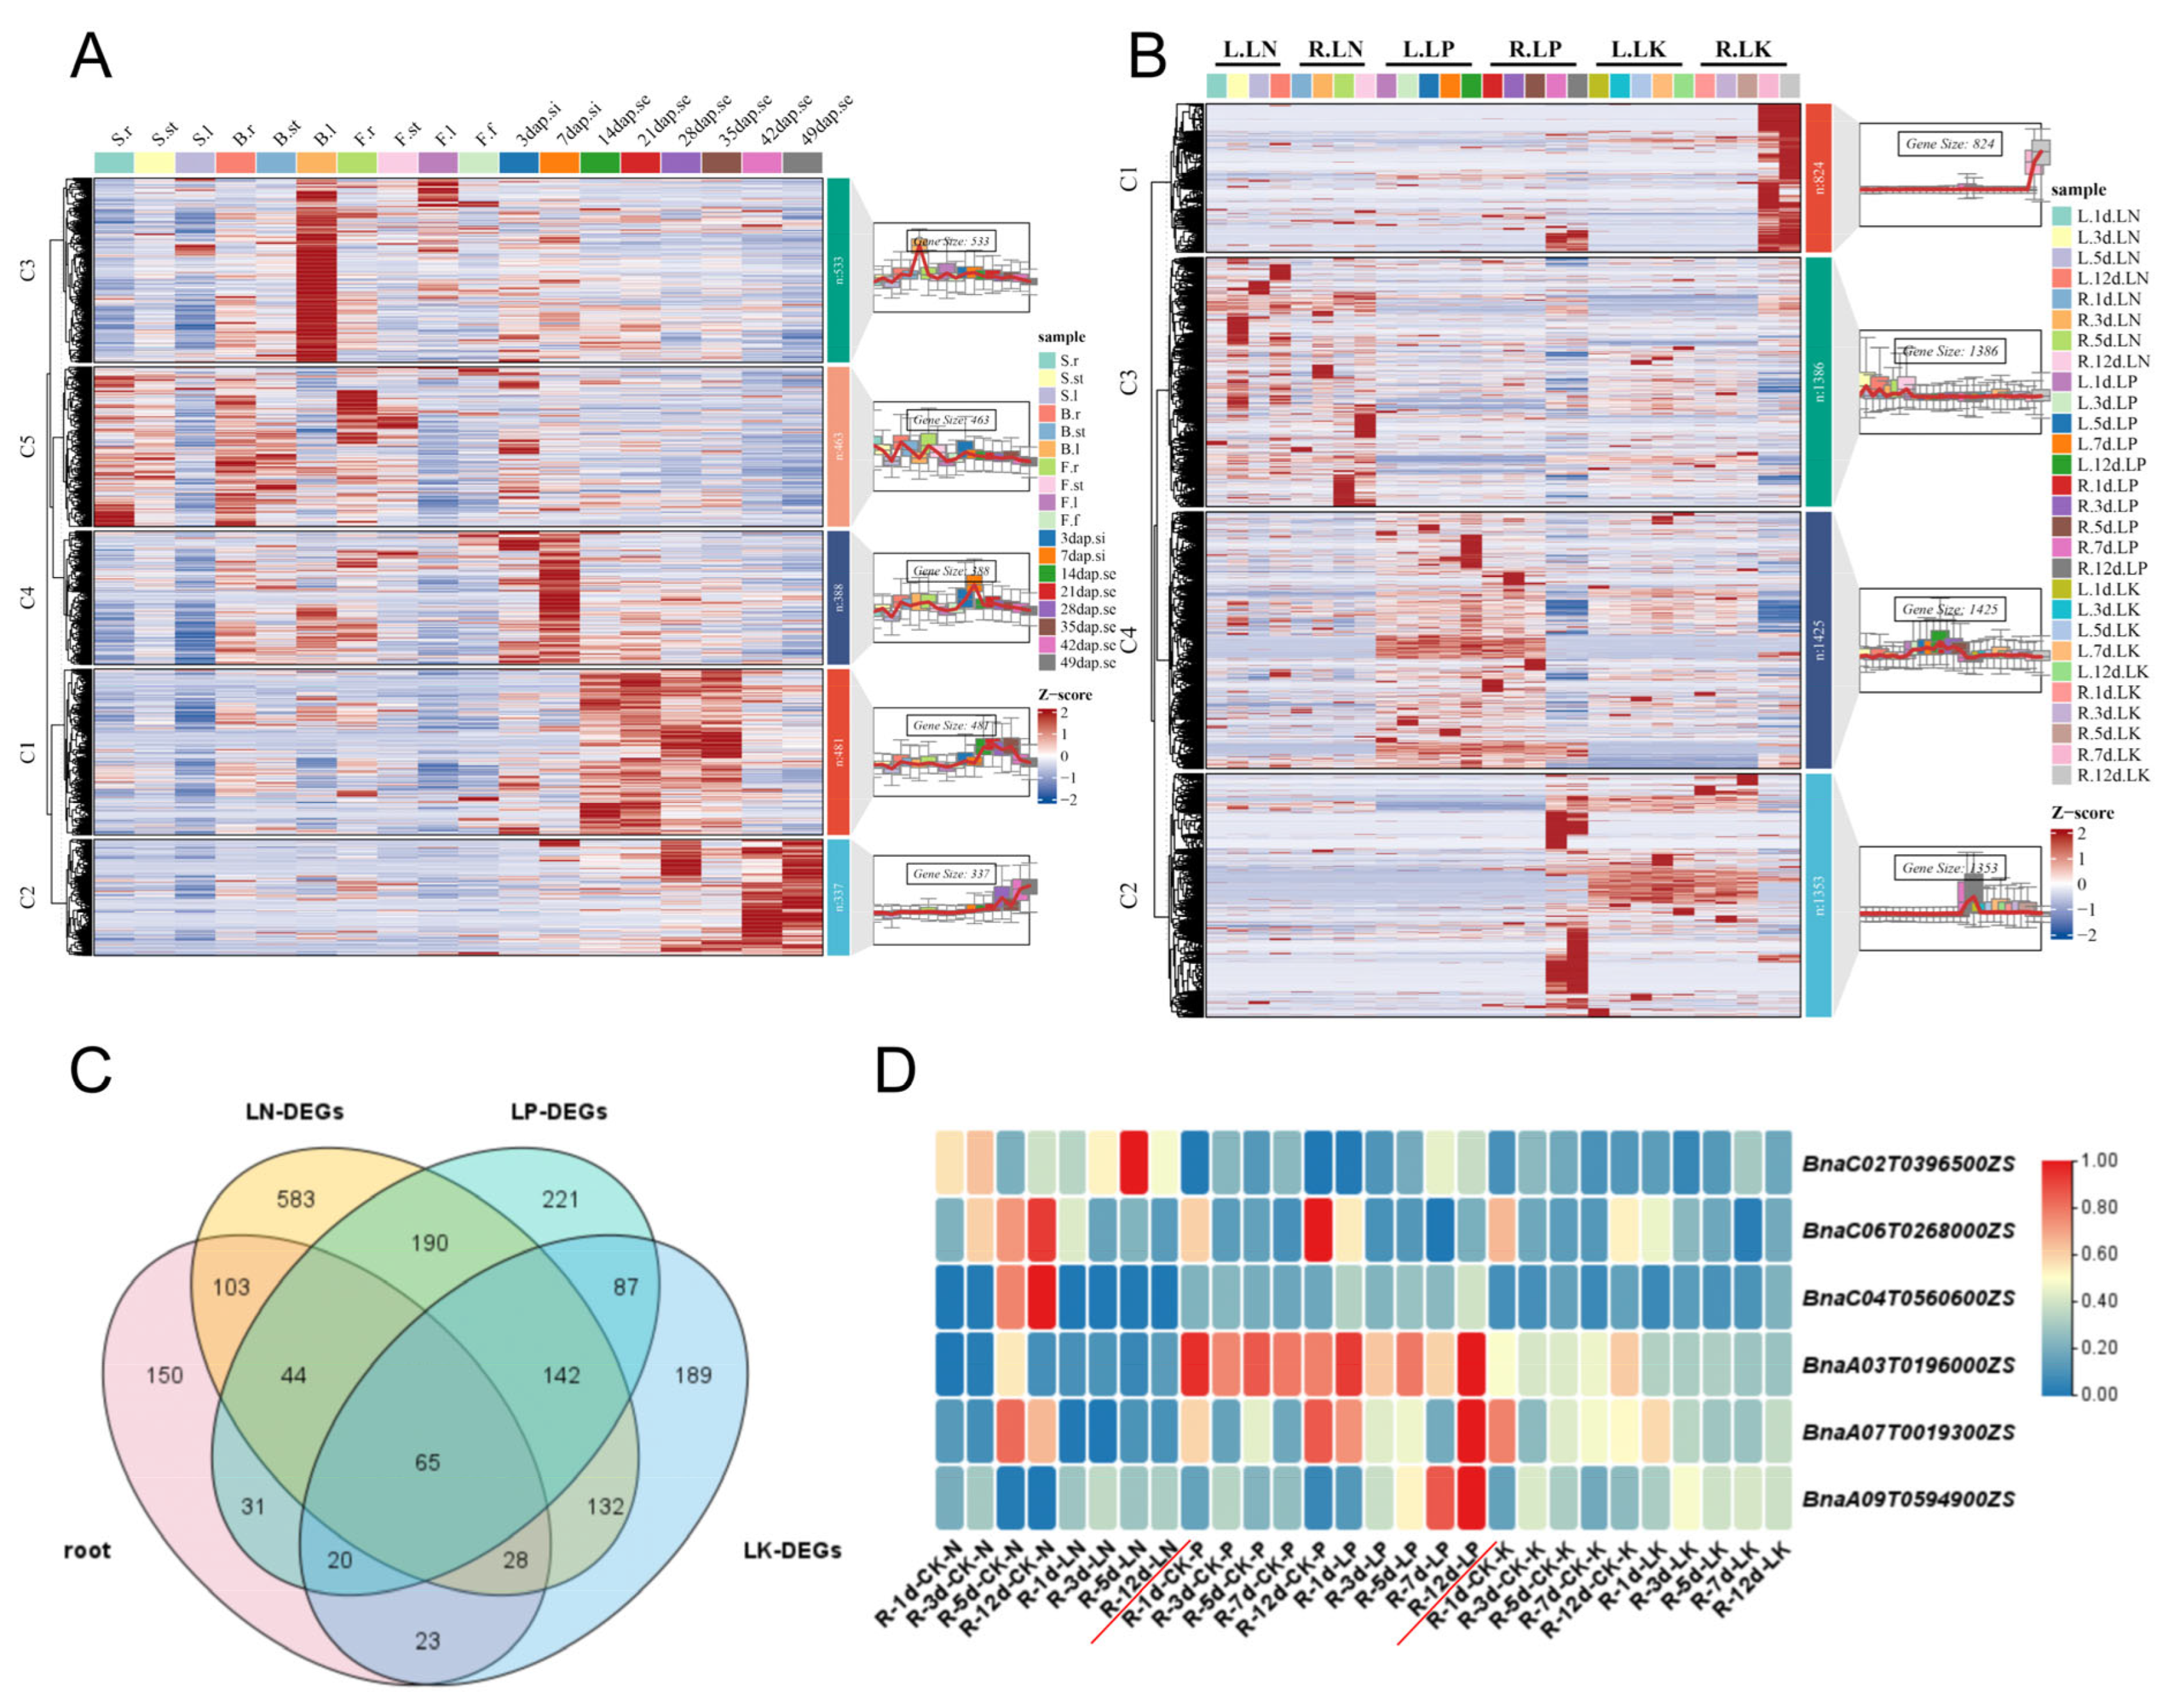
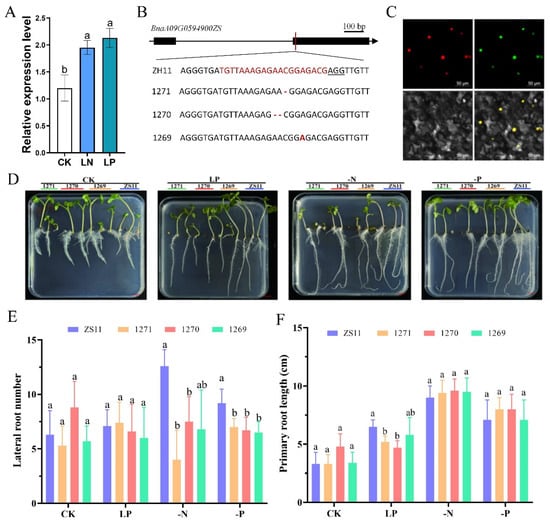
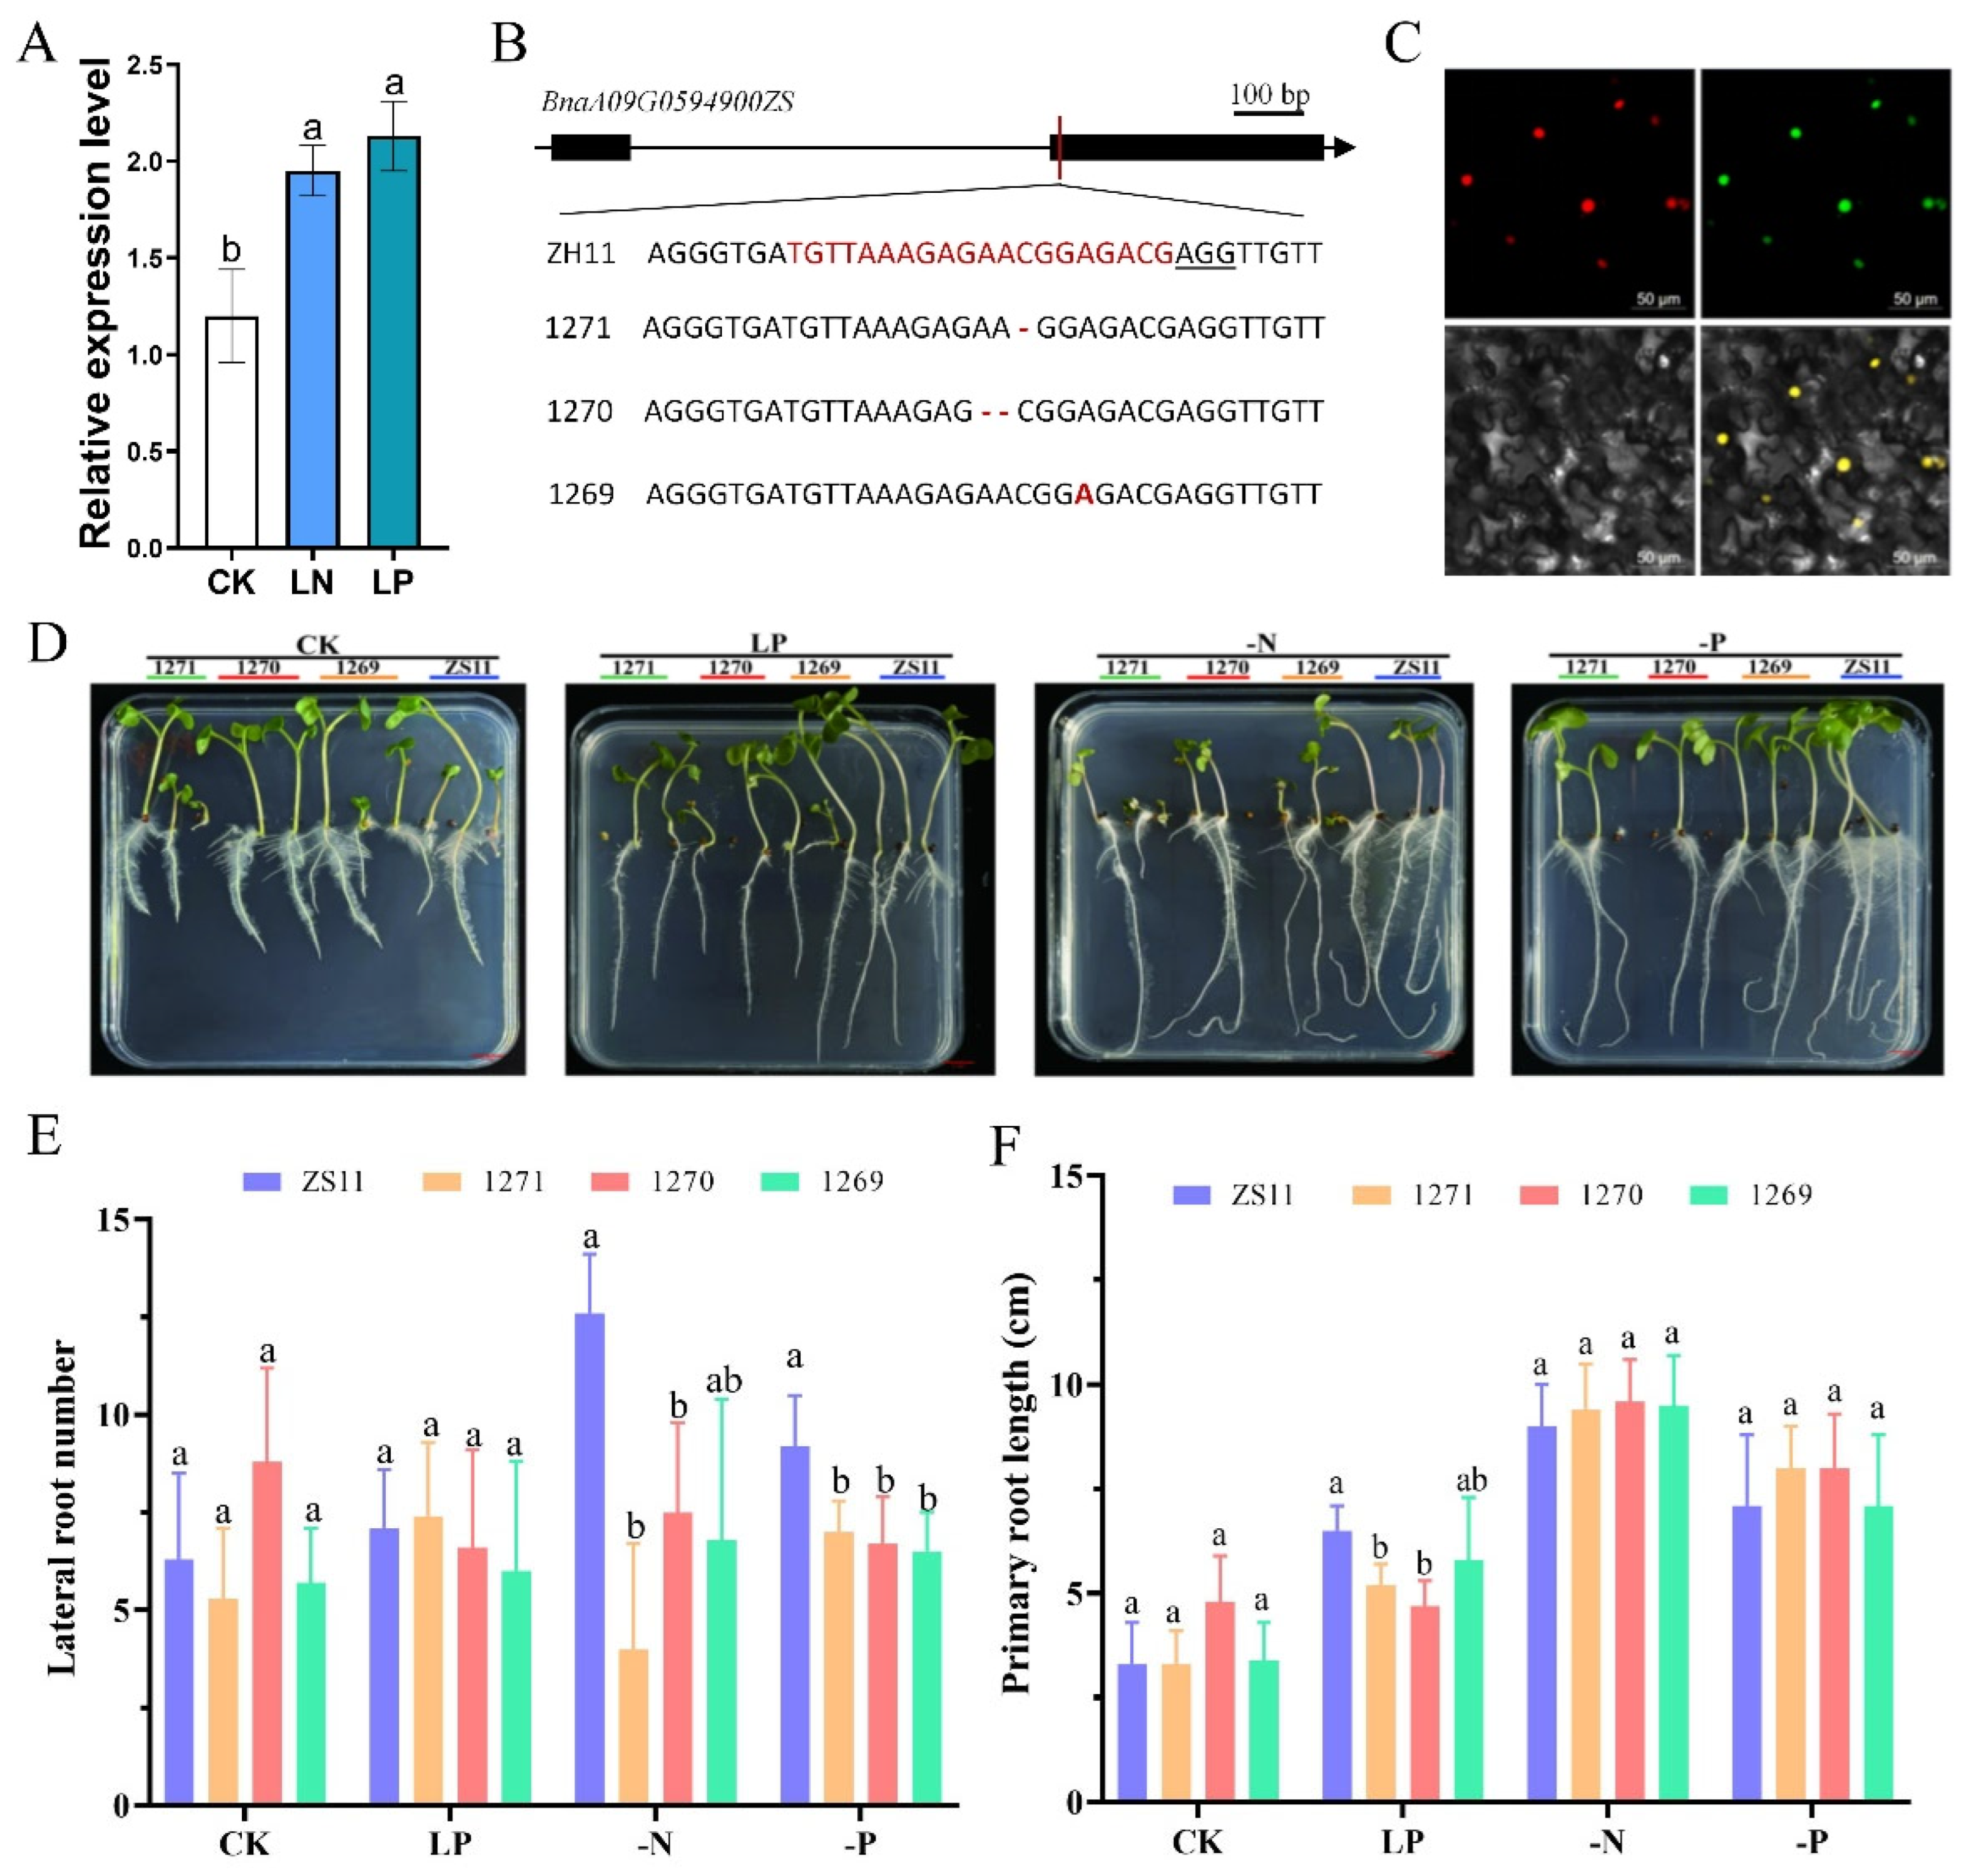

Disclaimer/Publisher’s Note: The statements, opinions and data contained in all publications are solely those of the individual author(s) and contributor(s) and not of MDPI and/or the editor(s). MDPI and/or the editor(s) disclaim responsibility for any injury to people or property resulting from any ideas, methods, instructions or products referred to in the content. |
© 2026 by the authors. Licensee MDPI, Basel, Switzerland. This article is an open access article distributed under the terms and conditions of the Creative Commons Attribution (CC BY) license.