


Abstract
Ill-timed harvest-aid spraying can reduce cotton yield and fiber quality. However, determining optimal spraying times is challenging when air temperature fluctuates strongly. Here, we analyzed whether cultivar type and planting pattern alleviate the adverse effects of improper spraying time. We conducted a three-factor field experiment in Xinjiang, China, during 2024–2025 with two cotton cultivars, three planting patterns (H76, H66, and L76), and three spraying times (T1, T2, and T3), plus an untreated control, then compared the defoliation rate (DR), boll opening rate (BOR), yield, and fiber quality among groups. We also determined the net contributions of harvest aids to DR and BOR by subtracting the natural (control) values (NDR and NBOR, respectively). Spraying time significantly affected DR, BOR, yield, and fiber quality. DR and BOR were highest at T2; lower values at T1 and T3 were attributed to physiological immaturity and lower temperatures, respectively. Yield losses and reductions in fiber length and strength of upper-canopy bolls increased with earlier spraying. Across the T1–T2 and T2–T3 intervals, the mean seed cotton yield loss decreased from 15.18% to 8.15%, and its average daily rate of change decreased from 0.95% to 0.36%. In contrast, the mean fiber length loss decreased from 8.44% to 3.81%, whereas its average daily rate of change increased from 0.36% to 0.53%. The moderating effects of cultivar on DR, BOR, and yield losses were susceptible to external environmental factors. Conversely, planting pattern had no significant effect on fiber length and fiber strength losses but had significant independent main effects on DR, BOR, and yield losses by altering NDR and NBOR: NDR and NBOR generally decreased in the order L76 > H66 > H76, whereas yield losses increased in the order L76 < H66 < H76. Therefore, when optimal spraying time is difficult to determine, we recommend reducing plant density or optimizing row configuration, rather than changing cultivar, to improve the efficacy of harvest aids.
1. Introduction
Xinjiang is the largest cotton-producing region in China with the most developed machine-harvesting technology [1]. Harvest aids provide key support for mechanical harvesting by accelerating leaf abscission, preventing fiber contamination and staining caused by leaf fragments mixed into the harvested cotton [2], and promoting boll opening prior to harvesting [3]. Optimizing harvest-aid application is crucial for producing high-quality machine-harvested cotton; however, the efficacy of harvest aids is impacted by multiple factors, including spraying time, cultivar selection, and planting pattern.
Spraying time is a key factor affecting harvest-aid efficacy. The main active ingredients of harvest aids, thidiazuron and ethephon, are sensitive to ambient temperature and plant status [2,4]. Spraying too early reduces cotton yield and quality, causing economic losses, whereas spraying too late impedes defoliation and boll opening, reducing the efficiency of machine harvesting [2,5,6]. Moreover, Xinjiang has a temperate continental arid climate characterized by rapid fluctuations and declines in air temperature during the cotton harvest season, which increases the sensitivity of harvest aids to spraying time. Many studies have attempted to optimize harvest-aid application for various cotton-producing areas in Xinjiang [2,3,7,8,9]. However, under climate change, the onset and rate of autumn cooling in Xinjiang are showing increasingly pronounced interannual variations [10], which impedes our ability to accurately determine optimal spraying times. Therefore, identifying cultivation practices that mitigate the adverse effects of inappropriate spraying time has substantial value for cotton production [11,12].
Cotton cultivars with different maturity levels differ in leaf senescence, boll development, and fiber quality formation, as well as their responses to harvest aids [5,13]. As harvest aids disturb the endogenous hormone balance of cotton plants and accelerate functional leaf senescence and abscission layer formation [14], cultivars that are sensitive to defoliation will exhibit a higher defoliation rate (DR) because they respond faster to chemical-induced hormone signaling that initiates the expression of abscission-related genes [15]. Cultivars also differ in boll maturation timing and sensitivity to harvest-aid chemicals, resulting in cultivar-dependent yields and fiber quality, regardless of spraying time. Seed cotton yield loss and fiber quality changes after defoliant application also vary among cultivars; therefore, the appropriate spraying time is often determined according to cultivar sensitivity [13,16,17]. However, most previous studies have focused on the mechanisms underlying cultivar responses to harvest aids, without simultaneously examining the interaction between cultivar and spraying time in terms of defoliation, boll opening, yield, and fiber quality. Accordingly, the moderating role of cultivar selection in the effects of harvest-aid spraying time remains unclear.
Finally, adjusting the planting density and row-spacing configuration of machine-harvested cotton reshapes the distribution of light and temperature within the canopy [18,19], and consequently affects canopy growth, yield, and quality [20,21,22]. Wang et al. showed that, compared with the conventional wide–narrow row pattern, a high-density, wide-row pattern with equal row spacing increased the pre-harvest DR by 3.45% and reduced leaf trash content by 32.43%, maintained high and stable yields without reducing fiber quality, and promoted earlier boll maturity and better defoliation [23]. This indicates that optimizing the planting pattern can improve harvest-aid efficacy. However, few studies have systematically investigated whether planting patterns can mitigate the adverse effects of suboptimal spraying times and, if so, whether these effects arise from an interaction with spraying time or from an independent main effect on planting pattern.
Therefore, we conducted a three-factor field experiment in Xinjiang, China, to analyze the effects of harvest-aid spraying time, cultivar, and planting pattern on the efficacy of harvest aids in terms of the DR, boll opening rate (BOR), yield, and fiber quality of machine-harvested cotton. The aim of this study is to determine whether cultivar and planting pattern alleviate the adverse effects of improper spraying time. The results of this study provide theoretical and technical support for optimizing harvest-aid efficacy in the machine-harvested cotton region of Xinjiang.
2. Materials and Methods
2.1. Experimental Site
The field experiment was conducted at the Second Company of the Agricultural Experimental Station of Shihezi University (44°19′ N, 85°59′ E), Xinjiang, China. The study area has a typical temperate continental arid climate. The initial soil properties of the experimental field were as follows: organic carbon 14.30 g·kg−1, total nitrogen 0.98 g·kg−1, available potassium 385.56 mg·kg−1, and available phosphorus 35.94 mg·kg−1. The experimental area was 2250 m2 (45 m in length × 50 m in width).
2.2. Experimental Design
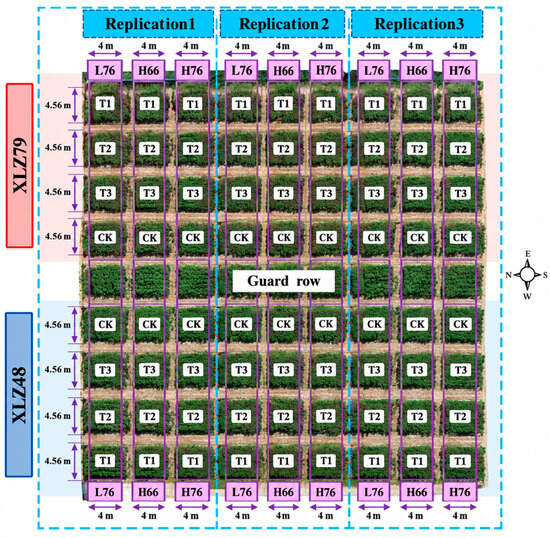
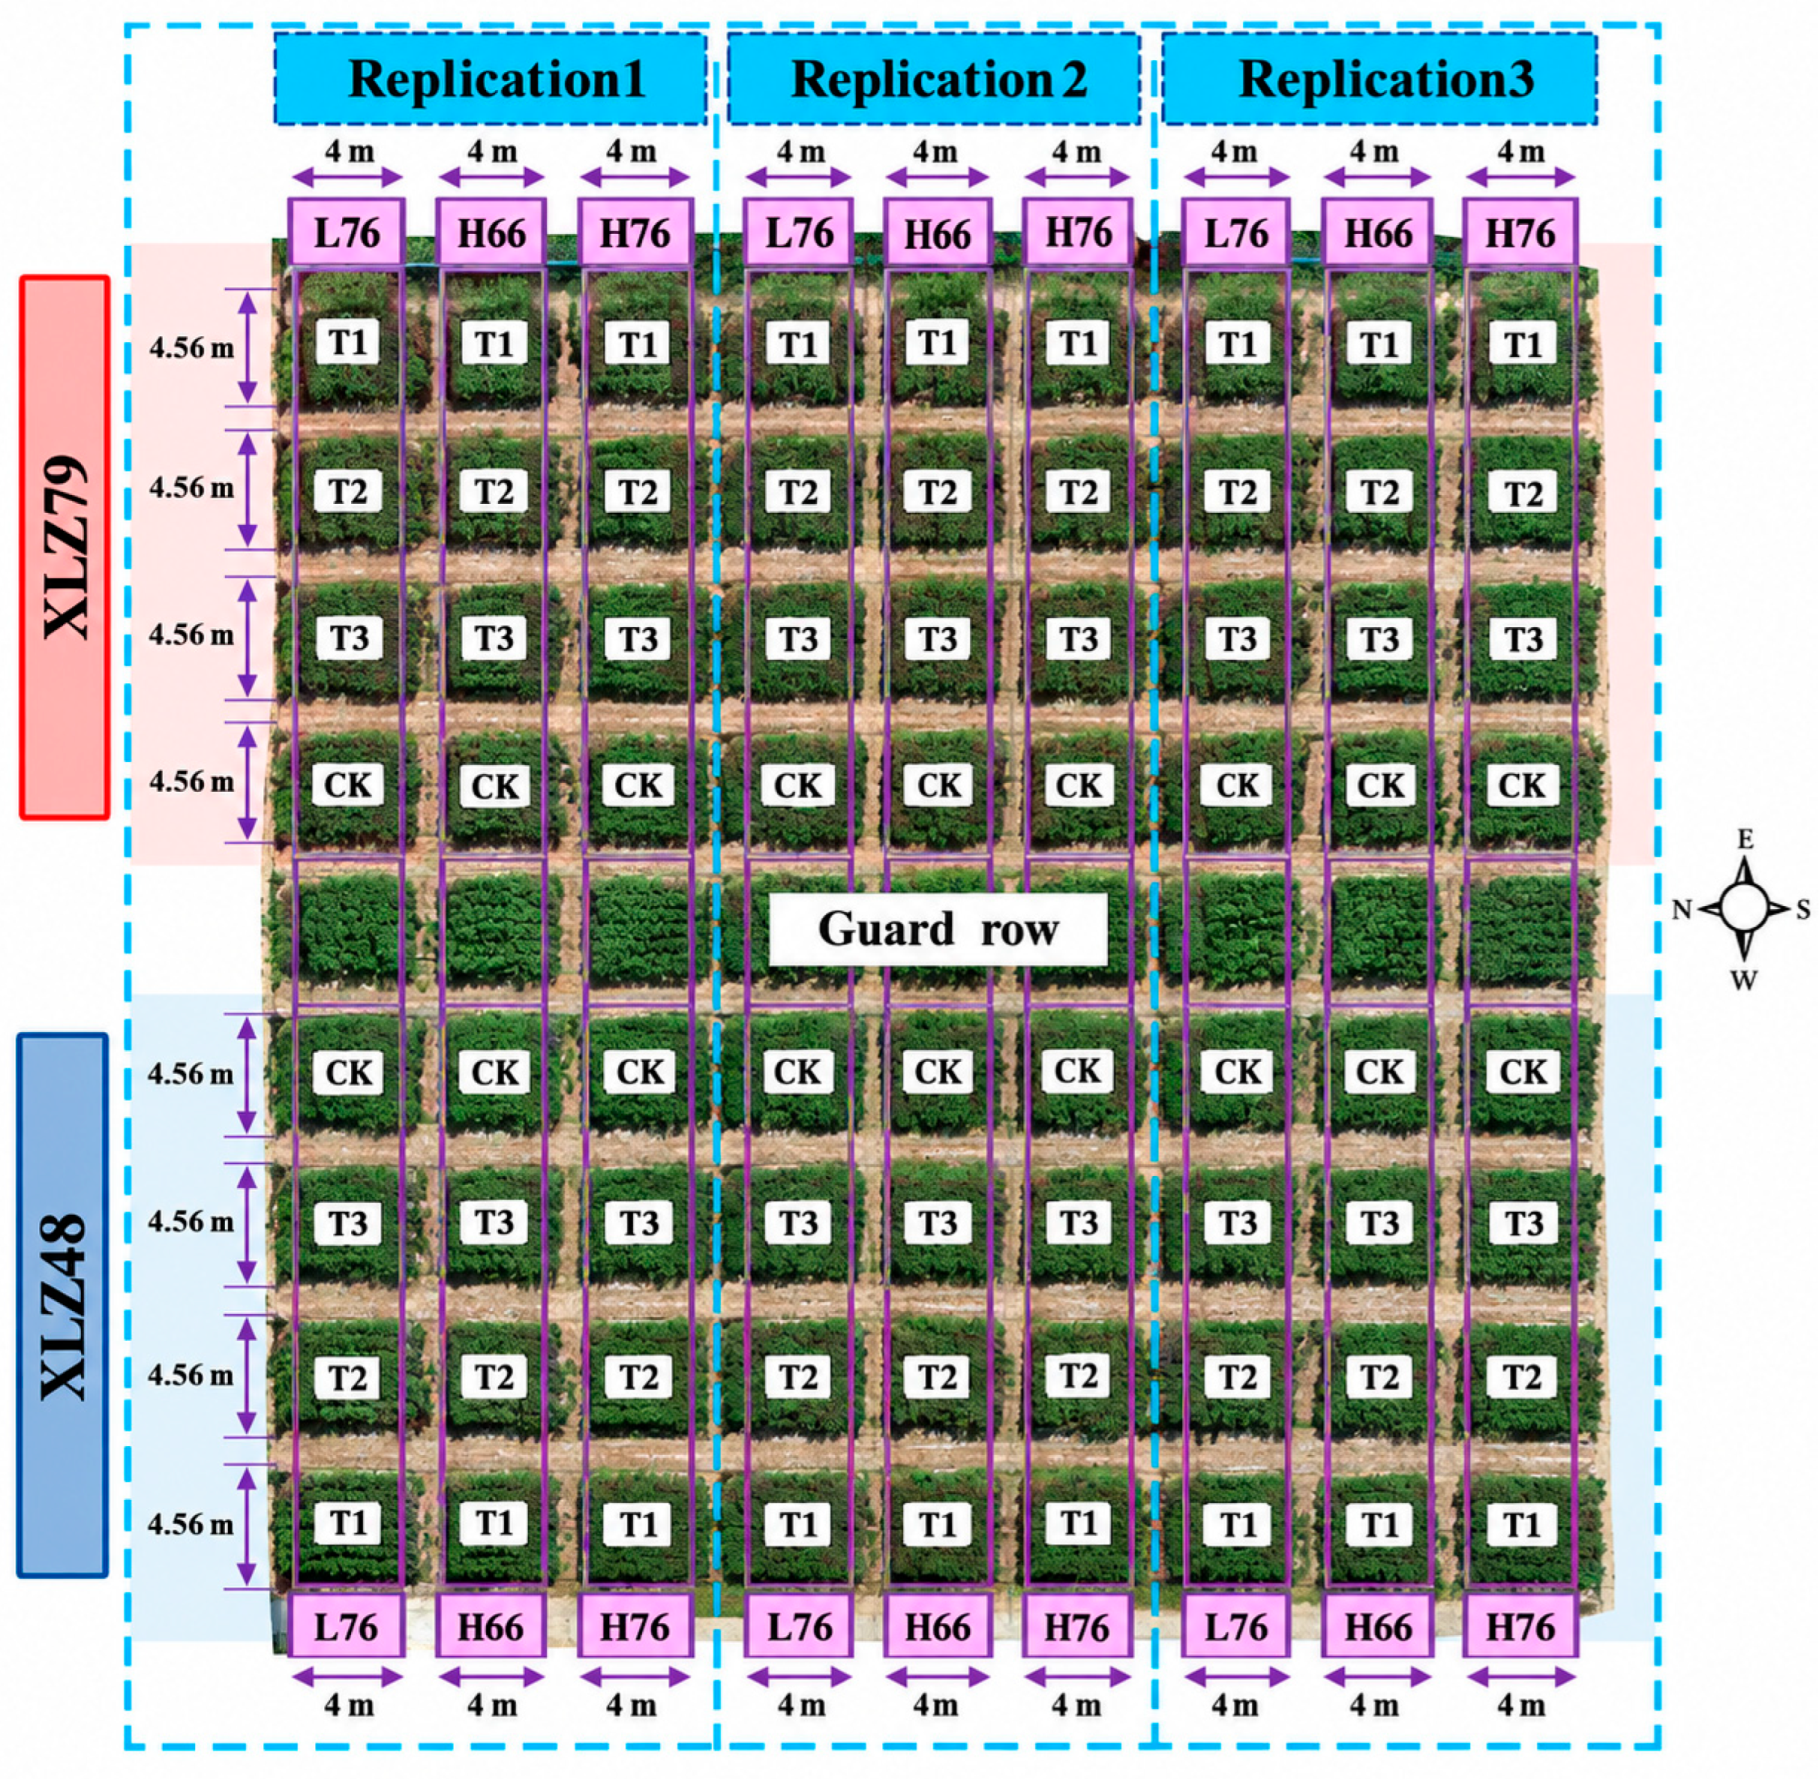
Field experiments were conducted in 2024 and 2025. Cotton was sown on 22 April 2024 and 23 April 2025. Throughout the growing season, crop management practices were applied uniformly according to the high-yield cultivation practices for machine-harvested cotton adopted in Xinjiang. The seasonal total irrigation amount was 4965 m3 ha−1. Total seasonal fertilizer inputs were 317.55 kg ha−1 of N, 121.50 kg ha−1 of P, and 128.70 kg ha−1 of K. A hierarchical field arrangement was used, with systematic treatment allocation within each year and partial changes in treatment positions between years (Figure 1). Cultivar was the main-plot factor, planting patterns was the subplot factor, and spraying treatment was the sub-subplot factor. Two upland cotton cultivars widely grown in Xinjiang were tested: Xinluzao 48 (XLZ48) and Xinluzao 79 (XLZ79). Three planting patterns were evaluated: low-density planting with one film and three equally spaced rows (L76; row spacing of 76 cm and plant spacing of 10 cm); high-density planting with one film and six wide–narrow rows (H66; row spacing of 66 cm + 10 cm and plant spacing of 10 cm); and high-density planting with one film and three equally spaced rows (H76; row spacing of 76 cm and plant spacing of 5 cm). Three harvest-aid application times were tested: 25 August (T1), 5 September (T2), and 15 September (T3), together with an untreated control (CK). To accommodate mechanized sowing, cultivar positions were kept consistent across the three replications within each year but exchanged between 2024 and 2025. The planting patterns were arranged in the order L76, H76, and H66 in 2024 and L76, H66, and H76 in 2025. Because the spraying treatments were applied on different dates, randomly interspersing them could increase the risk of spray drift from plots treated earlier to adjacent plots scheduled for later treatment or to the corresponding CK plots. Such drift could cause cross-contamination and introduce additional experimental error. To facilitate spraying operations and minimize this risk, the spraying treatments were arranged in the fixed order CK, T3, T2, and T1, moving away from the central guard row on both sides and resulting in a mirrored arrangement between the two cultivar main plots. This arrangement also facilitated comparisons with the corresponding CK plots. Consequently, treatment positions were constrained by field operations rather than independently randomized within each replication. Two days before spraying, cotton plants between plots were removed to provide sufficient buffer zones and further minimize the risk of spray drift between adjacent plots. Each plot was at least 4 m long (north–south) and 4.56 m wide (east–west). Each treatment combination was replicated three times. Each replication therefore comprised 24 sub-subplots, with the main plot, subplot, and sub-subplot serving as the experimental units for cultivar, planting pattern, and spraying time, respectively.
Figure 1.
Field layout of the experimental plots in 2025. The three replications are labelled at the top. Within each replication, the corresponding upper (XLZ79) and lower (XLZ48) main plots are separated by the central guard row. The red and blue shaded rectangles indicate the XLZ79 and XLZ48 cultivar main plots, respectively, and the light-blue dashed outlines indicate the three field replications. Each main plot contains three planting-pattern subplots arranged from north to south in the fixed order L76, H66, and H76. Each subplot contains four spraying-treatment sub-subplots arranged in the order CK, T3, T2, and T1 moving away from the guard row. These arrangements are identical across the three replications, and treatment allocation was systematic rather than randomized at all three levels. CK denotes the untreated control (water only). The base map is a UAV orthophoto acquired on August 14, 2025. Dimension lines indicate plot dimensions, and the compass indicates field orientation.
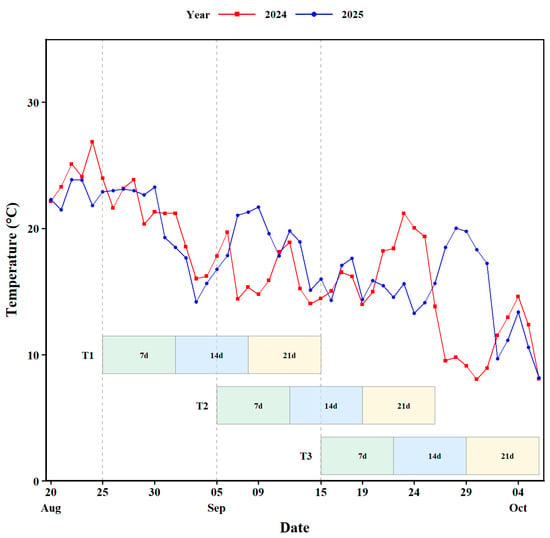
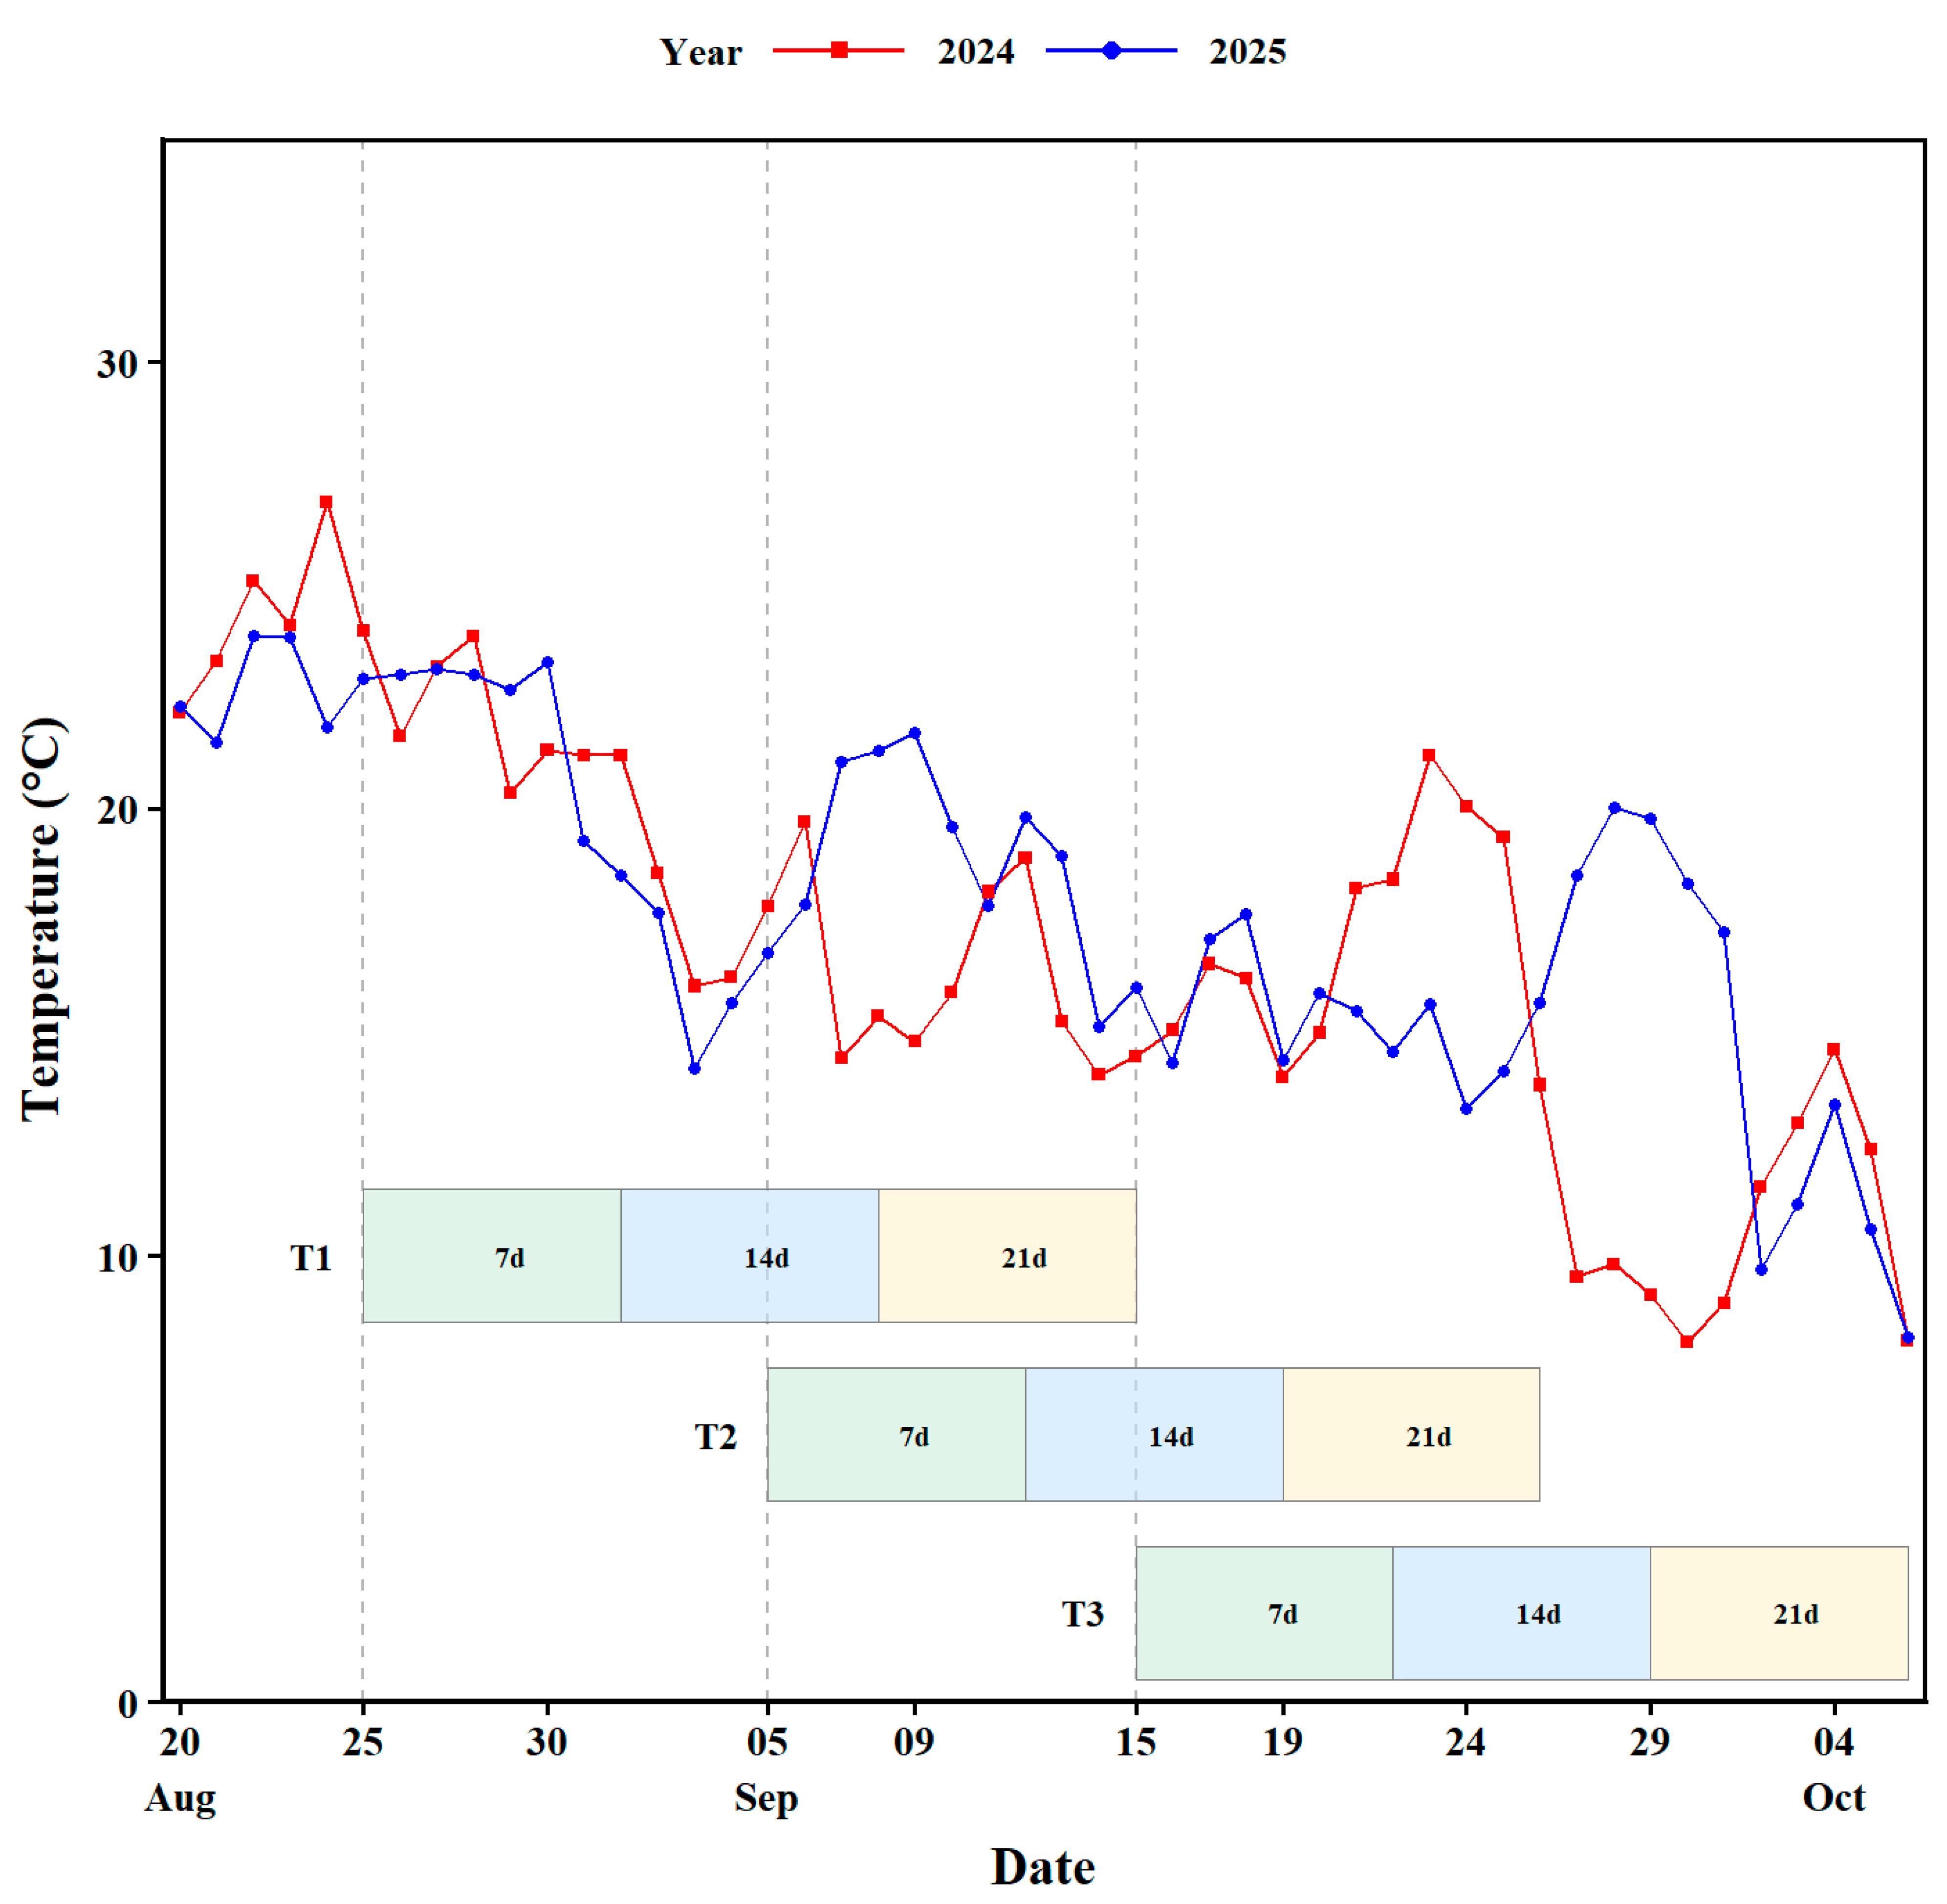
The harvest-aid treatment comprised a defoliant, a specialized synergist, and an ethephon-based boll opening agent, which were applied using a manual knapsack sprayer. The defoliant was a 540 g·L−1 thidiazuron·diuron suspension concentrate containing 360 g·L−1 thidiazuron and 180 g·L−1 diuron (Bayer Crop Science China Co., Ltd., Hangzhou, China), applied at 300 mL·hm−2. The specialized synergist was a 280 g·L−1 alkyl ethyl sulfonate formulation (Bayer Crop Science China Co., Ltd.), applied at 1200 mL·hm−2. The boll opening agent was a 40% ethephon aqueous solution (Adama Anpon Jiangsu Co., Ltd., Huai’an, China), applied at 600 mL·hm−2. Air temperature throughout the experimental period was recorded automatically by a weather station at 5 min intervals, and daily mean temperatures were calculated (Figure 2).
Figure 2.
Daily mean temperature in Xinjiang, China, during the experimental period in 2024 and 2025. Dashed lines indicate harvest-aid application times (T1, August 25; T2, September 5; T3, September 15). Sampling times (7, 14, and 21 days after application) are marked below the temperature curves.
2.3. Defoliation Rate and Boll Opening Rate
Before harvest-aid application, 10 representative cotton plants were selected and tagged in the central area of each plot. The total number of leaves, total number of bolls, and number of opened bolls of each tagged plant were recorded manually one day before spraying and at 7, 14, and 21 days after spraying. The same tagged plants were monitored throughout the observation period. To quantify DR and BOR at the plot level, the DR and BOR of replicate at sampling time were denoted as and , respectively, and calculated from the 10 tagged plants as follows:
and
where denotes the tagged plant (), denotes the field replicate (), and denotes the sampling time after spraying ( or d). is the total number of leaves of tagged plant in replicate one day before spraying, and is the number of remaining leaves of the same plant at sampling time . is the total number of bolls of tagged plant in replicate one day before spraying, and is the number of opened bolls of the same plant at sampling time . Thus, and represent the plot-level DR and BOR, respectively, for replicate at sampling time .
Similarly, the natural DR (NDR) and natural BOR (NBOR) were calculated from the corresponding water-sprayed CK plots. The NDR and NBOR of replicate at sampling time were denoted as and , respectively, and calculated as follows:
and
where is the total number of leaves of tagged plant in the corresponding CK plot of replicate one day before spraying, and is the number of remaining leaves of the same plant at sampling time . is the total number of bolls of tagged plant in the corresponding CK plot one day before spraying, and is the number of opened bolls of the same plant at sampling time . and therefore represent the plot-level NDR and NBOR, respectively, for replicate at sampling time .
To quantify the contribution of harvest aids to DR and BOR, the harvest-aid-induced DR and BOR ( and , respectively) were calculated by subtracting the corresponding CK values from the harvest-aid-treated values:
and
where and represent the harvest-aid-induced DR and BOR, respectively, for replicate at sampling time . For each harvest-aid treatment, and were obtained from the corresponding CK plot with the same year, cultivar, planting pattern, and field replicate, using the CK observation recorded on the calendar date corresponding to sampling time after each respective spraying treatment.
2.4. Yield and Fiber Quality
Harvesting began on 5 October and continued for approximately 2–3 days, with the T3 plots harvested last after completion of the assessment conducted 21 days after the T3 spraying treatment. At harvest, we divided the cotton canopy at the third fruiting branch from the top and defined the portions above and below this point as the upper canopy and middle–lower canopy, respectively. For yield determination, a 2.28 × 1 m2 sampling area was selected from the central portion of each experimental plot. Cotton within this area was manually harvested and weighed after ginning to determine the lint yield. For fiber-quality determination, a subsample of the lint obtained after ginning the cotton harvested from each canopy portion in each field replicate was used for fiber-quality testing. Thus, three independent lint samples, corresponding to the three field replicates, were obtained for each treatment and canopy position. After ginning, the lint samples were conditioned at 20.0 ± 2.0 °C and 65.0 ± 3.0% relative humidity and tested under standard atmosphere conditions using the USTER® HVI 1000 high-volume fiber testing instrument (Uster Technologies AG, Uster, Switzerland) in accordance with GB/T 20392—2023 [24]. The measured indicators included fiber length, fiber strength, and micronaire value.
To quantify the effect of harvest-aid application on yield, we calculated the yield loss () of each harvest-aid treatment relative to CK:
where is the measured value of indicator i under CK, is the measured value of indicator i under harvest-aid treatment, and i denotes the seed cotton yield, lint yield, and boll weight.
To quantify the effect of harvest-aid application on fiber quality, we calculated the quality loss (QRi) of each harvest-aid treatment relative to CK:
where is the measured value of indicator i under CK, is the measured value of indicator i under harvest-aid treatment, and i denotes the fiber length or fiber strength.
To quantify the rate of change in yield and fiber quality loss rates with delay in spraying time, we calculated the average daily rate of change (DT) between two consecutive spraying times:
where and are the yield or fiber quality loss rates at two consecutive spraying times and (i < j), respectively, and is the number of days between the two spraying times. The resulting average daily rates of change represent the average changes in loss rates over the intervals between consecutive spraying dates.
2.5. Statistical Analysis
Statistical analyses were performed using R version 4.5.1. Multivariate analysis of variance (MANOVA) and analysis of variance (ANOVA) were used to analyze plot-level defoliation and boll opening responses separately at 7, 14, and 21 days after spraying. The across-year analysis included year, cultivar, planting pattern, spraying time, and all interactions among these factors as fixed effects. Random effects included replication nested within year, cultivar main plots nested within replication and year, and planting-pattern subplots nested within cultivar main plots. Year-specific analyses excluded year and its interactions. Year was tested against the replication error; cultivar and year × cultivar interaction were tested against the main-plot error (replication × cultivar within year); effects involving planting pattern but not spraying time were tested against the subplot error (replication × cultivar × planting pattern within year); and effects involving spraying time were tested against the sub-subplot error. Changes in cultivar positions and planting-pattern order between years were not modeled as independent spatial effects.
MANOVA was used to jointly analyze NDR and ΔDR or NBOR and ΔBOR, with Wilks’ λ as the test statistic, whereas ANOVA was used to analyze each response separately. Cultivar simple effects were evaluated using replication-level means averaged across planting patterns, with paired t-tests for individual responses and paired multivariate tests for joint responses. Spraying-time effects within each cultivar were tested using the spraying-treatment error from the year-specific analysis. An additional sensitivity analysis using within-replication treatment contrasts was conducted to assess the robustness of selected comparisons to dependence arising from the shared CK control. Pairwise comparisons of planting-pattern and spraying-time means were performed using Tukey-adjusted tests based on the corresponding error terms.
Seed cotton yield, lint yield, boll weight, their corresponding loss rates, and fiber-quality traits (micronaire, fiber length, and fiber strength) were analyzed using ANOVA according to the treatment factors and canopy positions examined. For yield traits and their loss rates, analyses were conducted separately by year and canopy position, with cultivar, spraying time, planting pattern, and their interactions tested using the corresponding hierarchical error terms described above; CK was excluded from the loss-rate analyses. For fiber-quality traits under CK, analyses were conducted across years separately by canopy position, with year, cultivar, planting pattern, and their interactions tested using the replication-within-year, main-plot, and subplot errors, as appropriate. Multiple comparisons were performed using Tukey’s honestly significant difference (HSD) test. Statistical significance was set at p < 0.05.
3. Results
3.1. Defoliation Rate
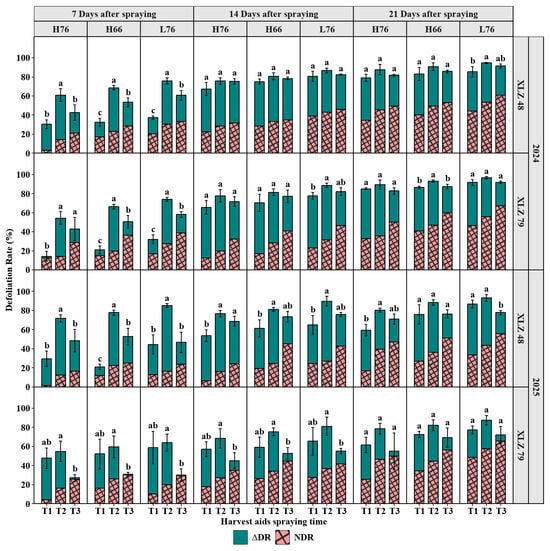
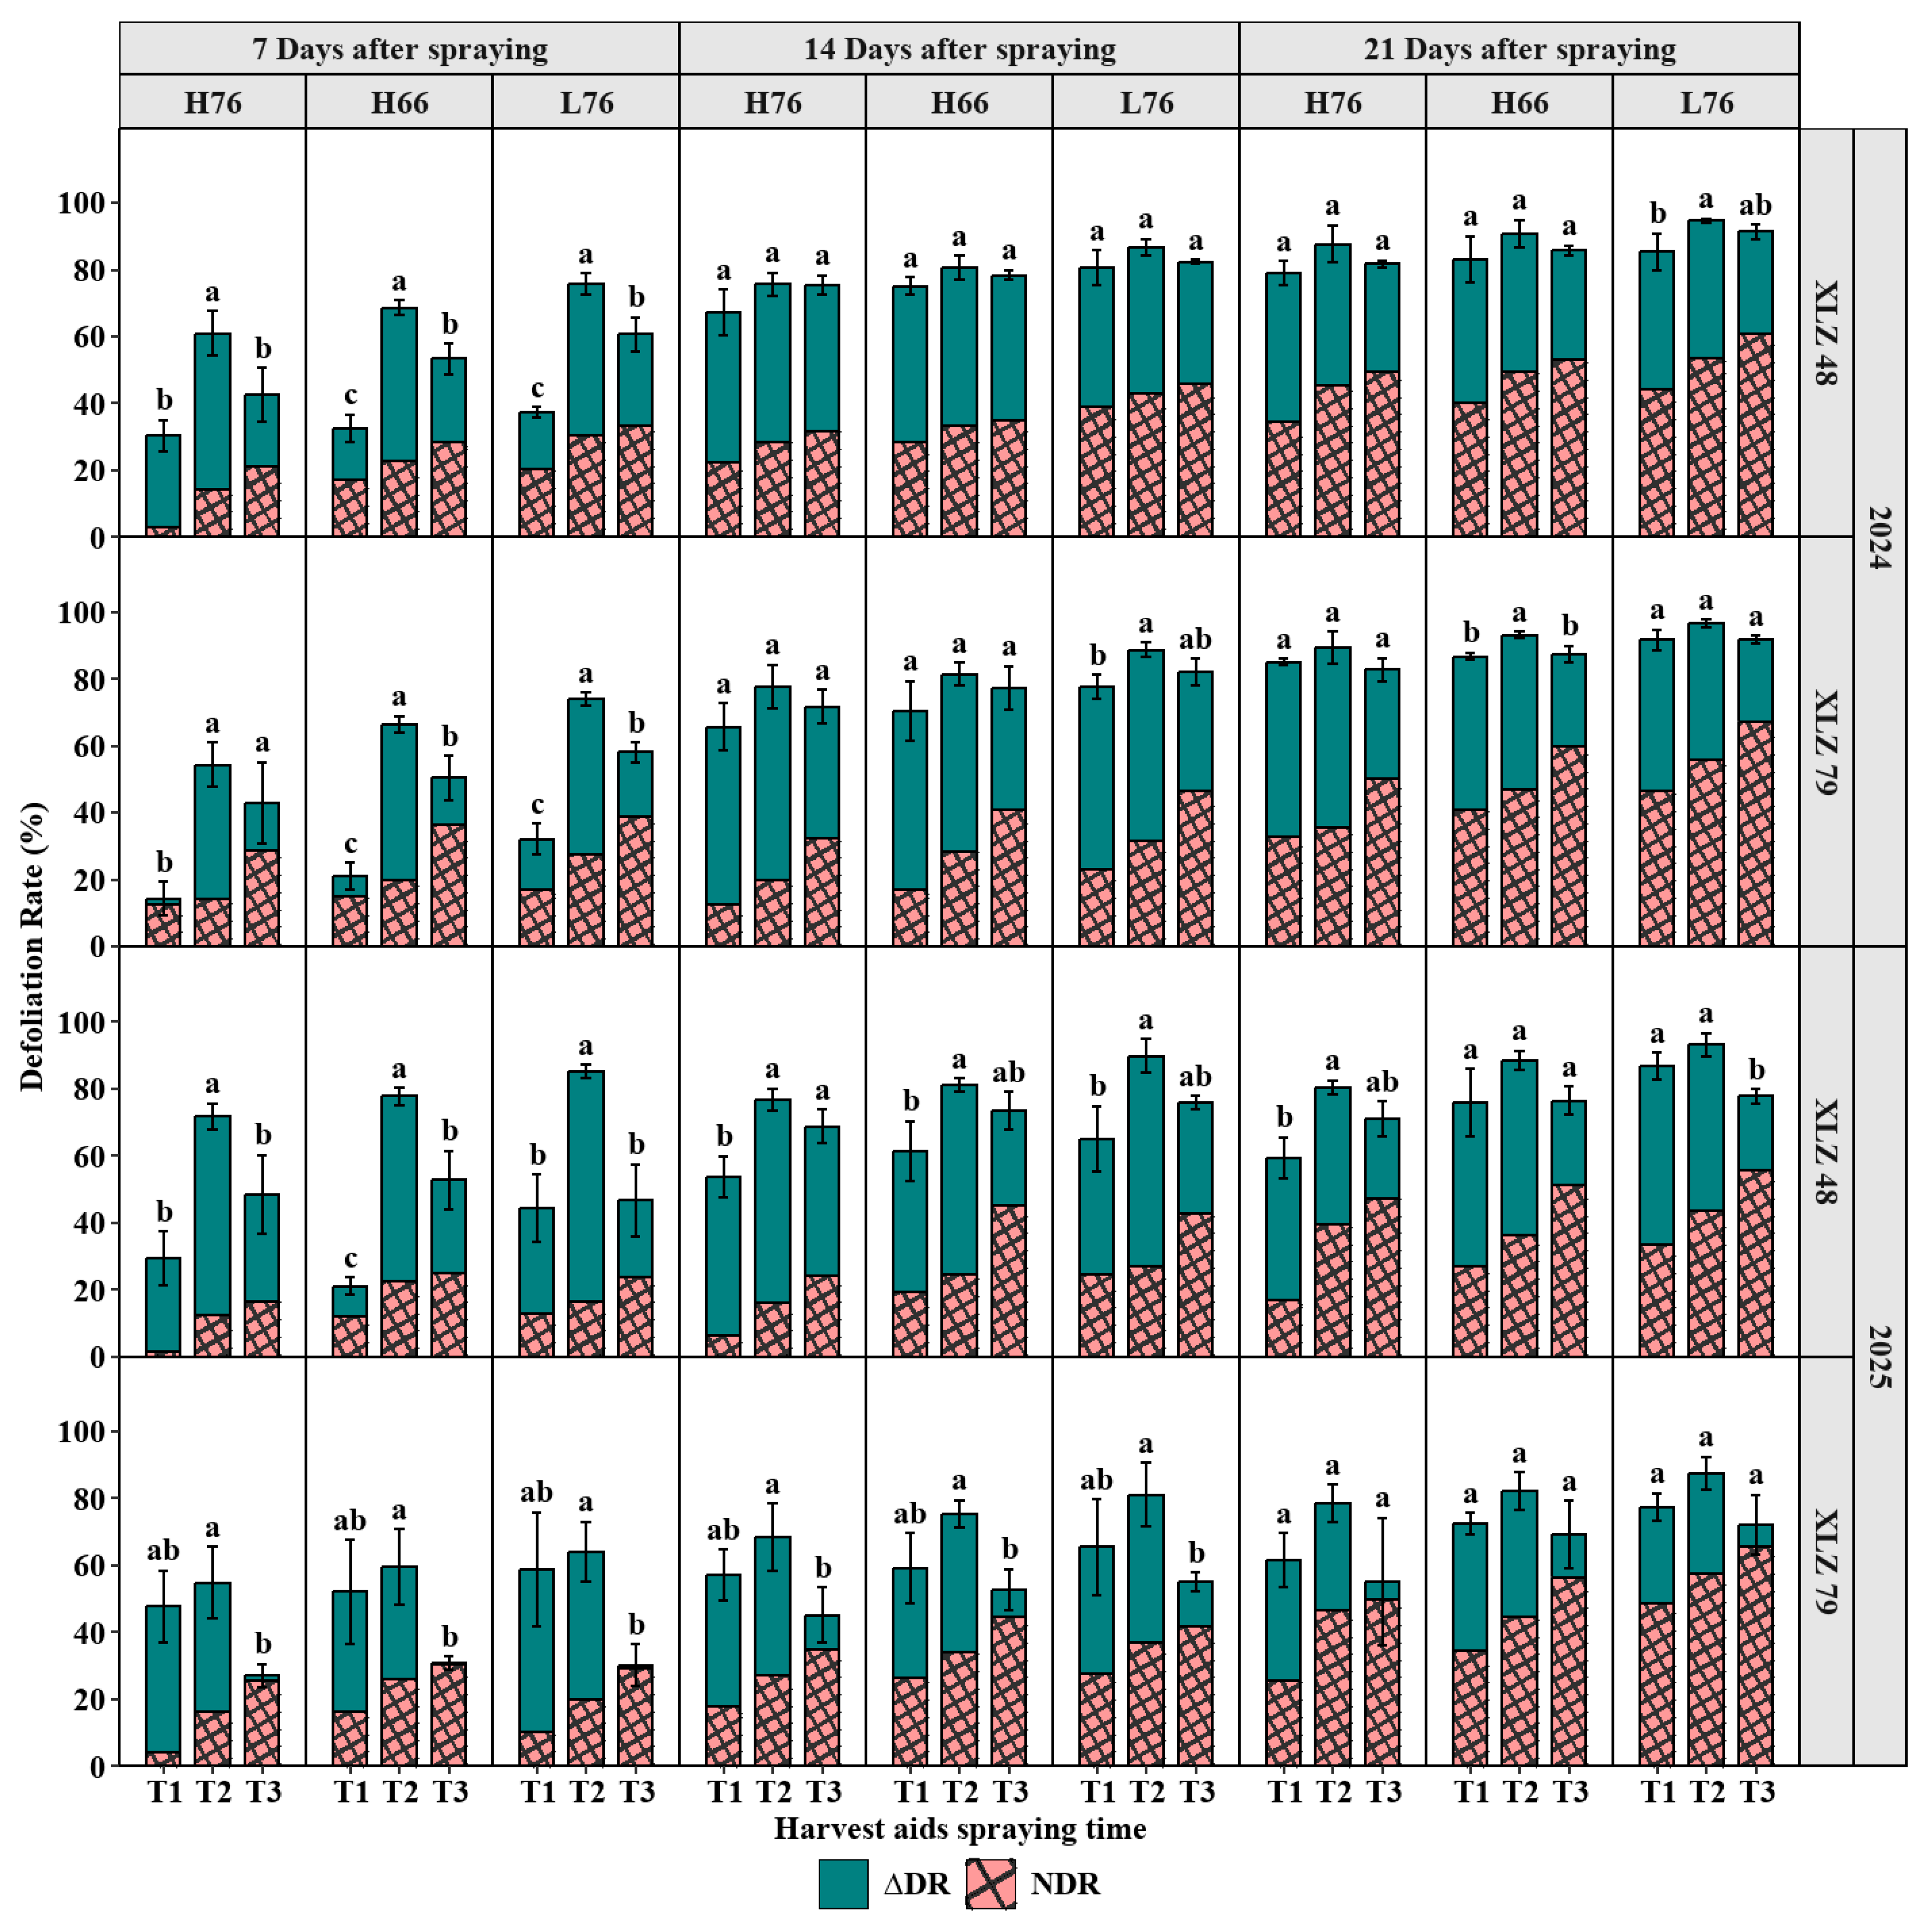
For NDR and ΔDR at 7, 14, and 21 days after spraying, the four-factor interaction (year × spraying time × cultivar × planting pattern) was not significant (Table 1). However, the year × spraying time × cultivar interaction was significant for ΔDR at 7 days after spraying and NDR at 14 days after spraying (Table 1). Therefore, simple two-way effect analyses were conducted separately by year for spraying time and cultivar, and the results showed that spraying time had a highly significant simple main effect (Table 2). At 7, 14, and 21 days after spraying, as spraying time was delayed from T1 to T3 (Figure 3), DR first increased then decreased, peaking at T2; NDR increased progressively; and ΔDR first increased then decreased (at 7 and 14 days after spraying) or decreased progressively (at 21 days after spraying). Differences between the two cultivars were highly dynamic and fluctuated markedly with year, spraying time, and sampling time (Table 2).
Table 1.
Across-year MANOVA and ANOVA results for the natural and harvest-aid-induced components of cotton defoliation and boll opening rates.
Table 2.
Year-specific main effects, interaction effects, and simple effects of cultivar and harvest-aid spraying time on the natural and harvest-aid-induced components of cotton defoliation and boll opening rates.
Figure 3.
Effect of harvest-aid spraying time on the natural and harvest-aid-induced cotton defoliation rate (NDR and ΔDR, respectively). Different lowercase letters indicate significant differences by Tukey’s HSD test at p < 0.05.
Planting pattern had a significant main effect on NDR (Table 1), which decreased in the order L76 > H66 > H76 at 7, 14, and 21 days after spraying (Figure 3). Differences in NDR among planting patterns also decreased progressively with sampling time. The NDR of H66 was higher than that of H76 by 60.63%, 37.97%, and 14.32% at the three sampling times, respectively, whereas the NDR of L76 was higher than that of H76 by 65.35%, 57.26%, and 33.78%, respectively (Figure 3). For ΔDR, planting pattern had a significant effect only at 7 days after spraying (Table 1).
3.2. Boll Opening Rate
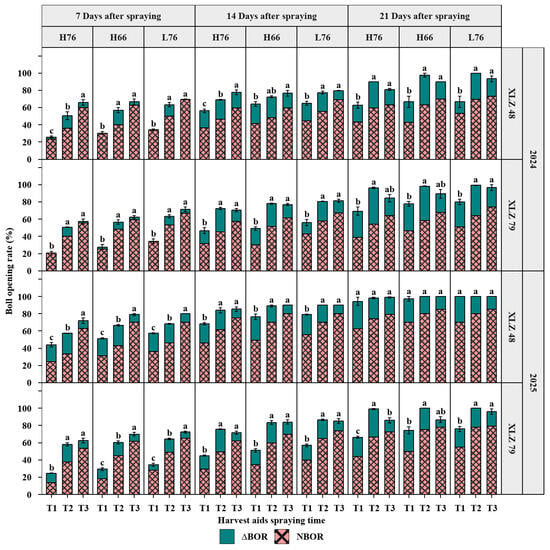
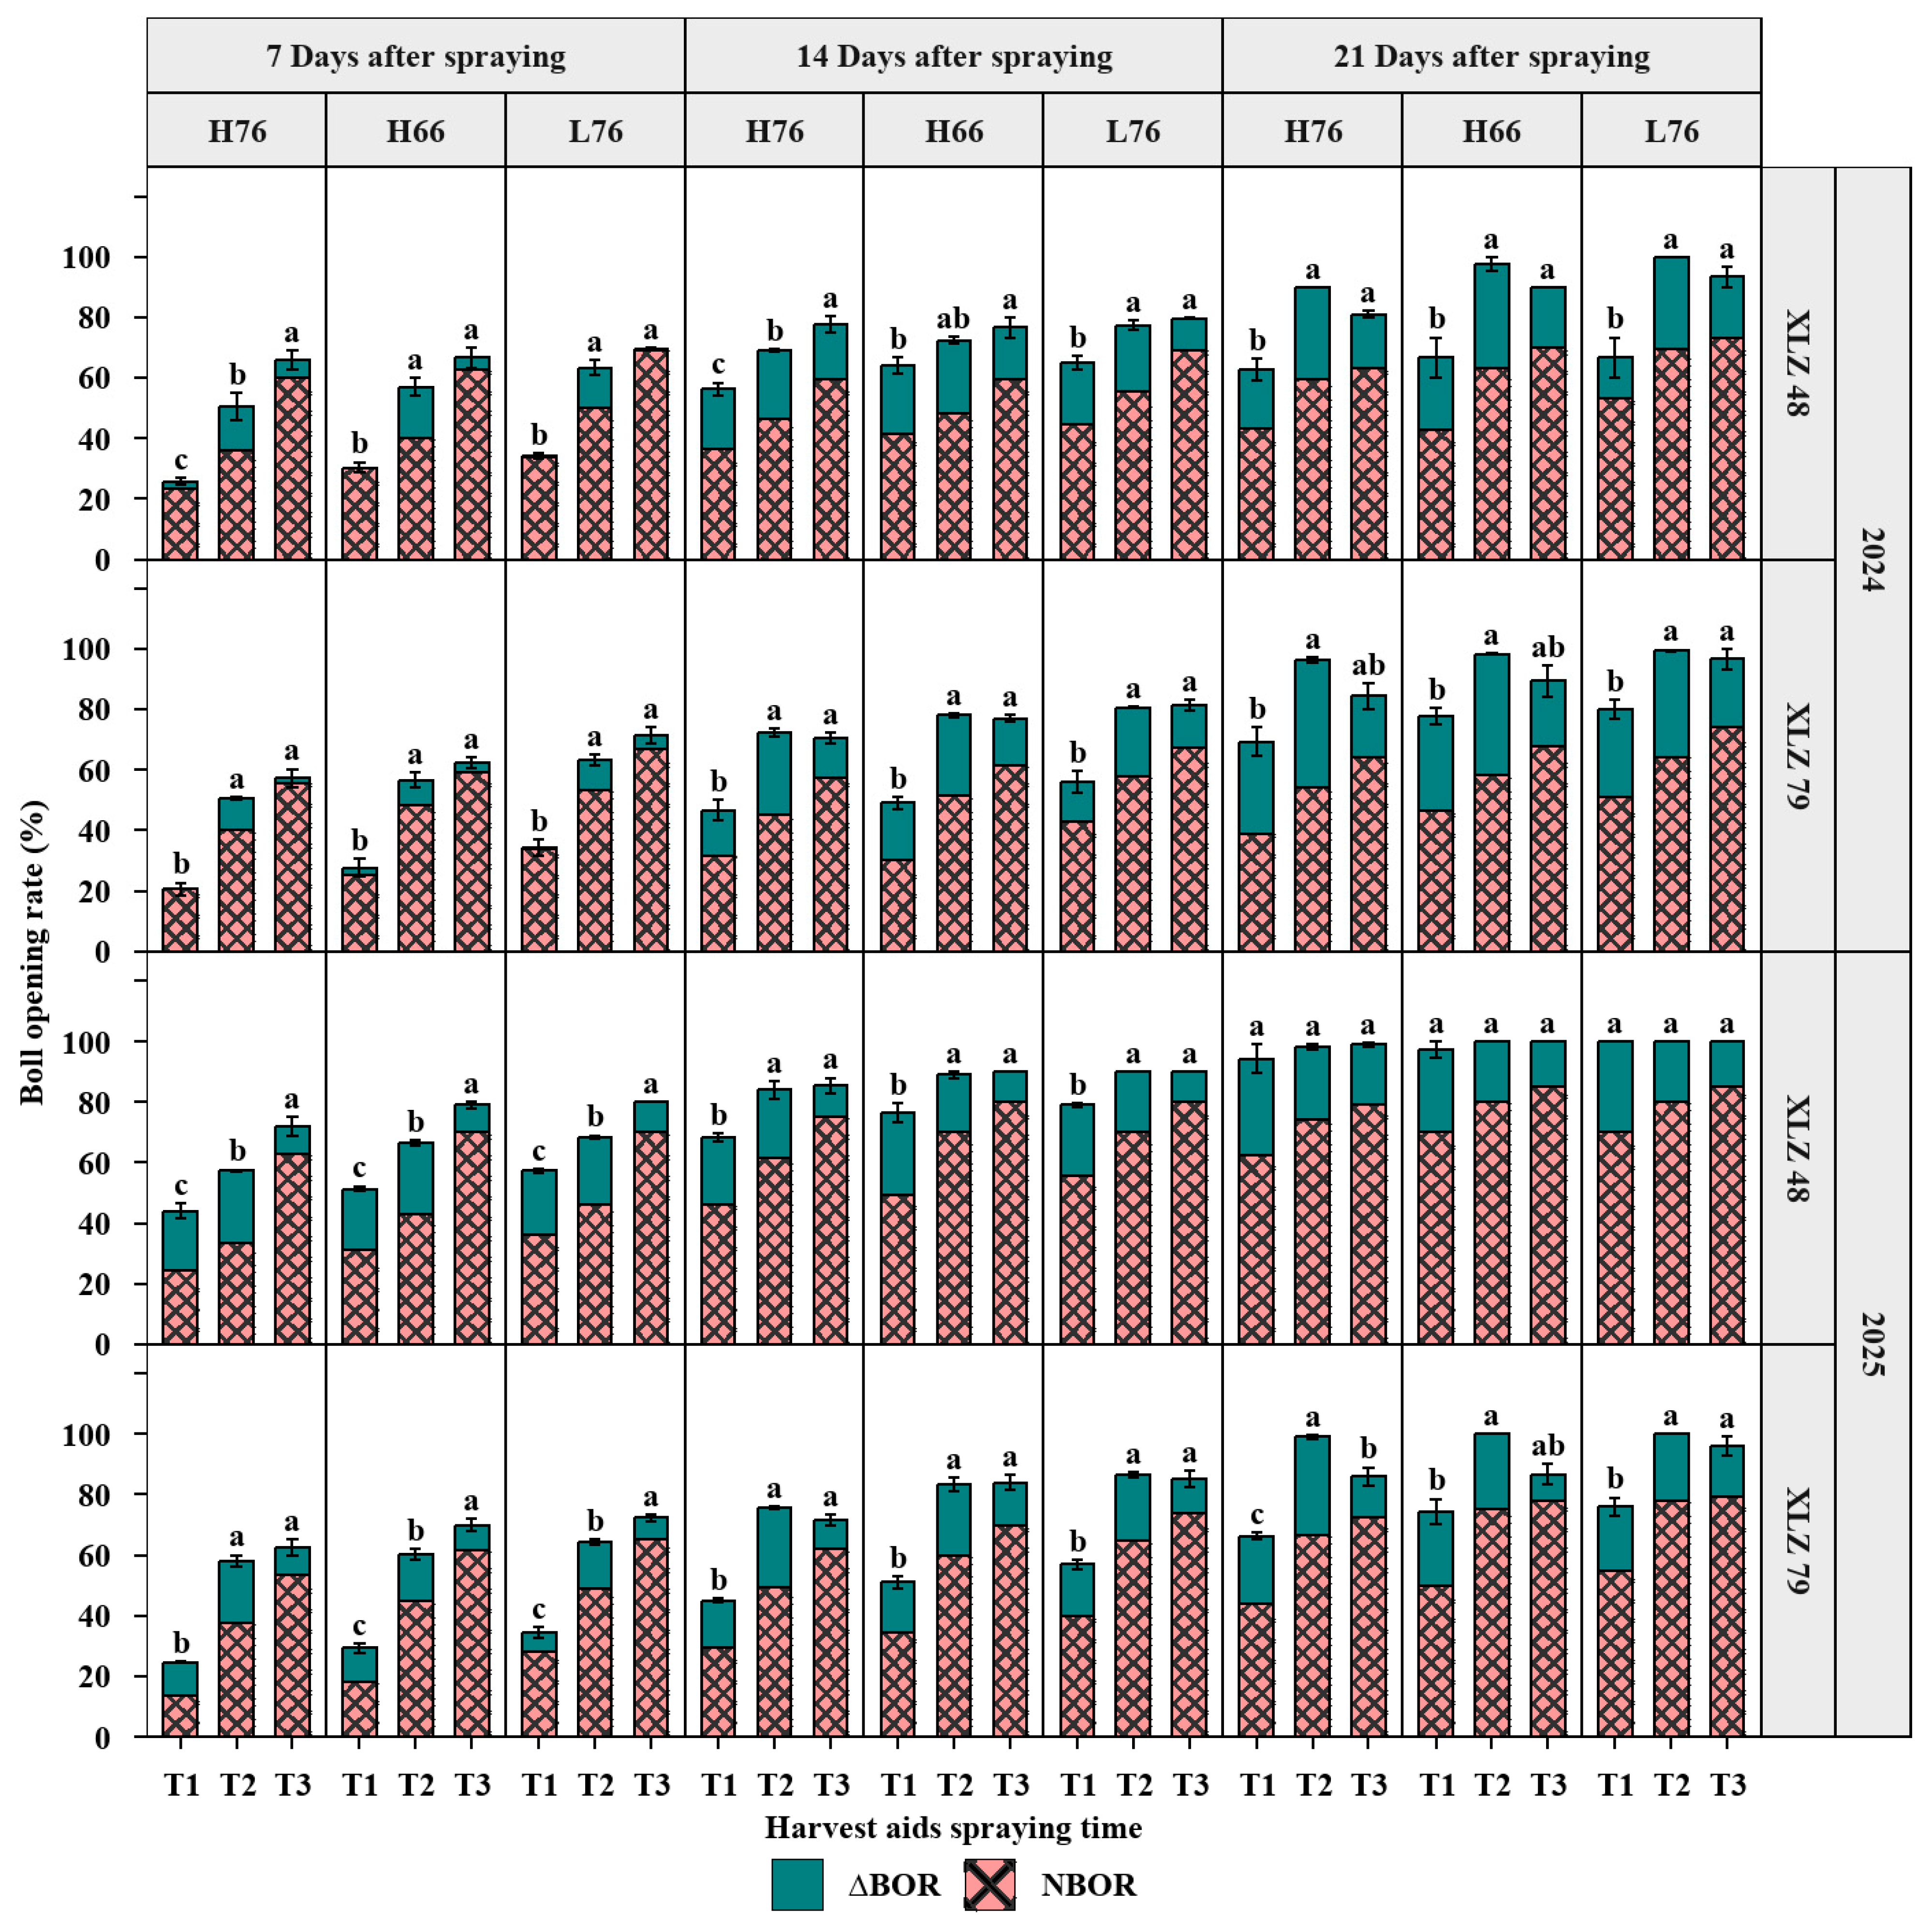
For NBOR and ΔBOR at 7, 14, and 21 days after spraying, the four-factor interaction was not significant (Table 1). However, the year × spraying time × cultivar interaction was significant for ΔBOR at 7 days after spraying and NBOR and ΔBOR at 21 days after spraying (Table 1). Therefore, simple two-way effect analyses were conducted separately by year for spraying time and cultivar, and the results showed that spraying time had a highly significant simple main effect (Table 2). As spraying time was delayed from T1 to T3, NBOR increased progressively, whereas ΔBOR first increased then decreased (Figure 4). However, the differences between the two cultivars fluctuated markedly with spraying time and year (Table 2).
Figure 4.
Effect of harvest-aid spraying time on the natural and harvest-aid-induced cotton boll opening rate (NBOR and ΔBOR, respectively). Different lowercase letters indicate significant differences by Tukey’s HSD test at p < 0.05.
Planting pattern had a highly significant main effect on NBOR, which decreased in the order L76 > H66 > H76 at 7, 14, and 21 days after spraying (Figure 4). NBOR values for H66 and L76 were higher than those for H76 by 15.90%, 9.21%, and 8.95%, and by 30.35%, 19.97%, and 15.23% at the three sampling times, respectively. For ΔBOR, the main effect of planting pattern was significant only at 21 days after spraying (p < 0.05), and the maximum difference in ΔBOR among planting patterns did not exceed 13.00% (Figure 4).
3.3. Yield Loss
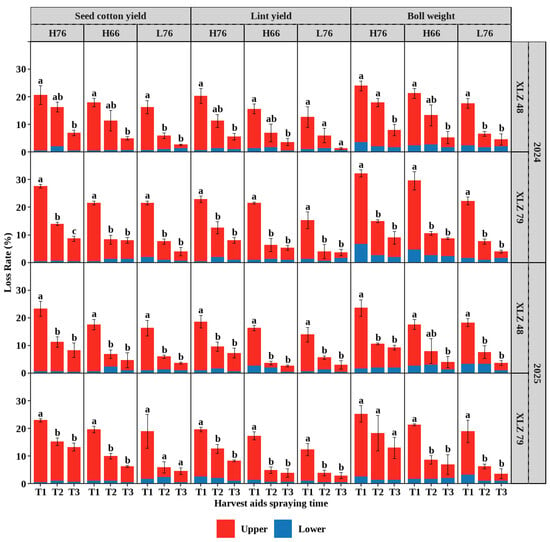
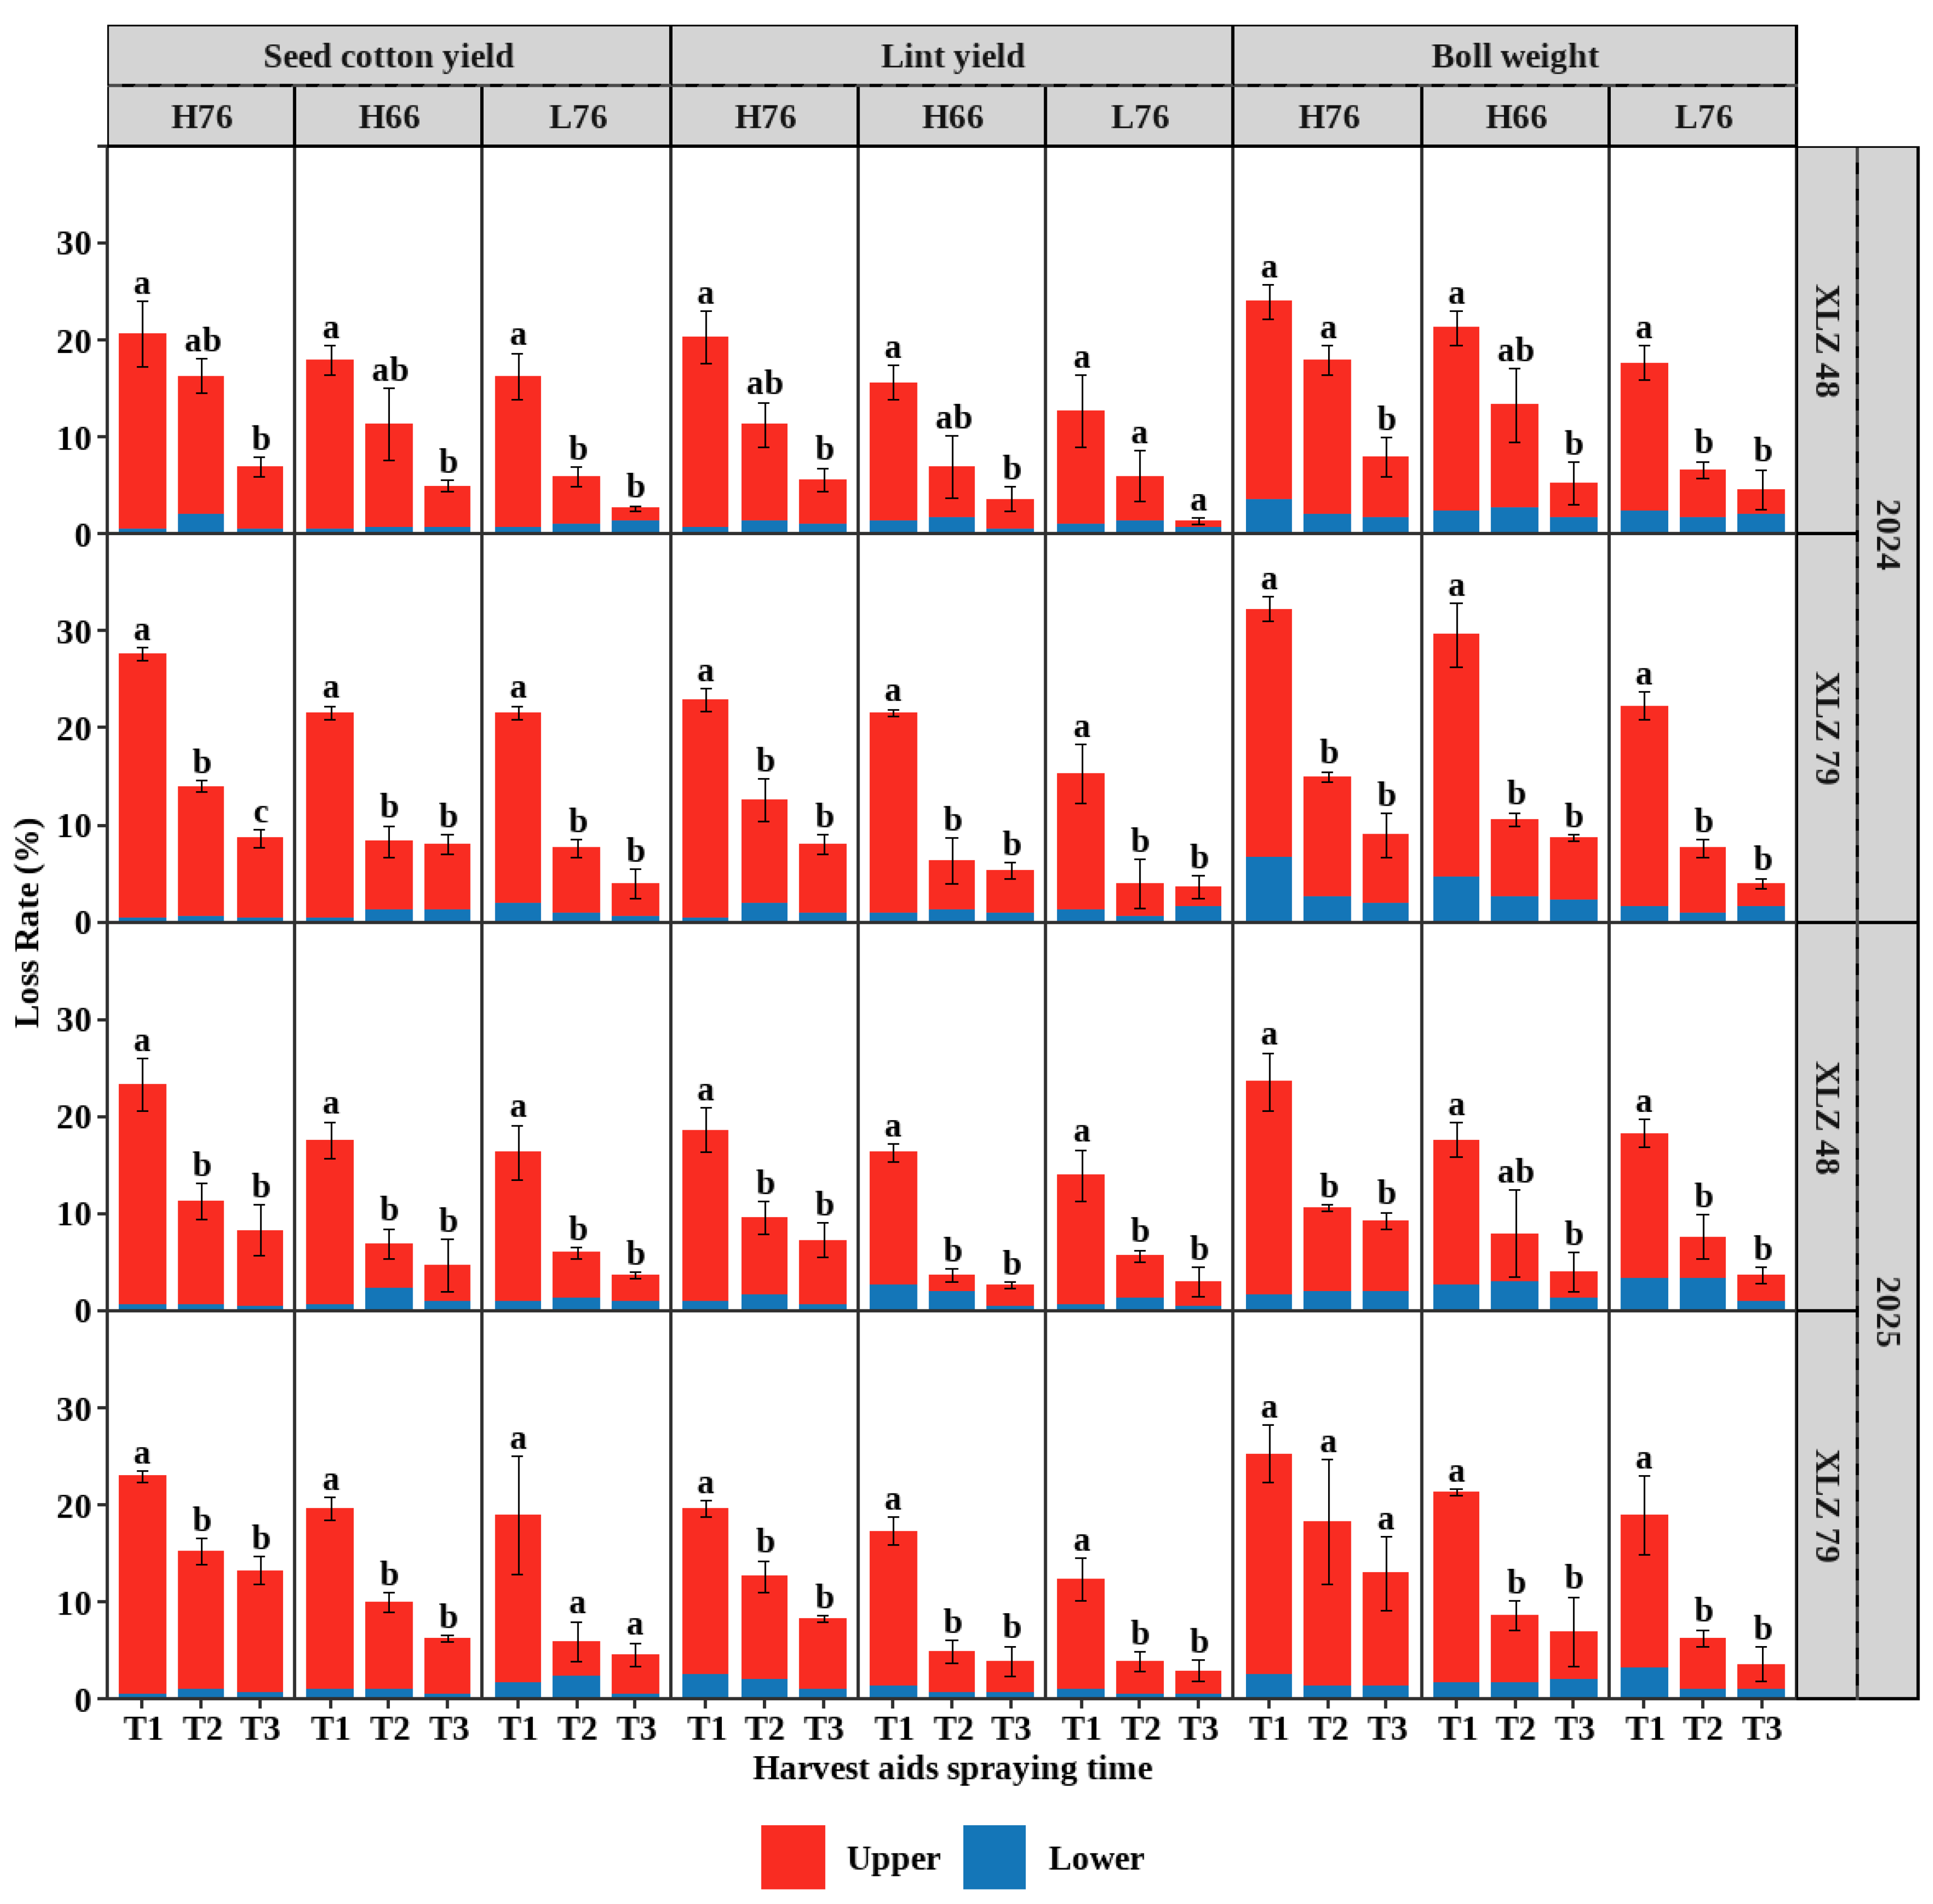
Harvest-aid application significantly reduced seed cotton yield, lint yield, and boll weight (Table 3). The loss rates of all three yield components decreased progressively with delay in harvest-aid spraying time (Figure 5).
Table 3.
Seed cotton yield, lint yield, and boll weight in upper and middle–lower canopy portions according to cultivar, spraying time, and planting pattern.
Figure 5.
Loss rates of seed cotton yield, lint yield, and boll weight in upper and middle–lower canopy portions under different spraying times. Different lowercase letters indicate significant differences by Tukey’s HSD test at p < 0.05.
3.3.1. Seed Cotton Yield Loss
The seed cotton yield loss rates under T1, T2, and T3 treatments were 20.42%, 9.94%, and 6.36%, respectively; those for upper-canopy bolls were 19.69%, 8.67%, and 5.72%, respectively, and the maximum value for middle–lower-canopy bolls was 5.10% (Figure 5). Planting pattern significantly affected seed cotton yield loss (p < 0.01). Upper-canopy boll loss rates decreased in the order H76 > H66 > L76 (Figure 5). For H76, upper-canopy boll loss rates under T1, T2, and T3 treatments were 23.42%, 13.17%, and 9.00%, respectively, which were 4.75, 5.33, and 3.83 percentage points higher than those for H66, and 6.42, 8.17, and 6.00 percentage points higher than those for L76, respectively. Middle–lower-canopy boll loss rates increased in order H76 < H66 < L76, although the differences between planting patterns did not exceed 0.60 percentage points. Differences in seed cotton yield loss among cultivars were not significant (p > 0.05). The mean loss rate and daily mean loss rate varied with spraying time, from 15.18% and 0.95% in the T1–T2 period to 8.15% and 0.36% in the T2–T3 period, respectively.
3.3.2. Lint Yield Loss
Lint yield loss rates under T1, T2, and T3 treatments were 17.25%, 7.33%, and 4.67%, respectively; those for upper-canopy bolls were 16.03%, 6.00%, and 4.00%, respectively, and the maximum value for middle–lower-canopy bolls was 4.40%. Planting pattern significantly affected lint yield loss (p < 0.01). Upper-canopy loss rates decreased in the order H76 > H66 > L76. For H76, upper-canopy loss rates under T1, T2, and T3 treatments were 19.33%, 9.83%, and 6.42%, respectively, which were 3.17, 5.75, and 3.00 percentage points higher than those for H66, and 6.75, 5.75, and 4.25 percentage points higher than those for L76, respectively. Differences in loss rates among planting patterns in the middle–lower canopy did not exceed 0.40 percentage points. Differences in lint yield loss among cultivars were not significant (p > 0.05). The mean loss rate and daily mean loss rate of lint yield varied with spraying time, from 12.29% and 0.90% in the T1–T2 period to 6.00% and 0.27% in the T2–T3 period, respectively.
3.3.3. Boll Weight Loss
Boll weight loss rates under T1, T2, and T3 treatments were 22.72%, 10.92%, and 6.69%, respectively; those for upper-canopy bolls were 19.67%, 8.83%, and 5.03%, respectively, and the maximum value for middle–lower-canopy bolls was 10.40%. Planting pattern significantly affected boll weight loss (p < 0.01). Upper-canopy loss rates decreased in the order H76 > H66 > L76. For H76, upper-canopy loss rates under T1, T2, and T3 treatments were 22.67%, 13.50%, and 8.08%, respectively, which were 3.00, 5.83, and 3.67 percentage points higher than those for H66, and 6.00, 8.17, and 5.50 percentage points higher than those for L76, respectively. Differences in loss rates among planting patterns in the middle–lower canopy did not exceed 0.60 percentage points. Differences in boll weight loss among cultivars were not significant (p > 0.05). The mean loss rate and daily mean loss rate of boll weight varied with spraying time, from 16.82% and 1.07% in the T1–T2 period to 8.81% and 0.42% in the T2–T3 period, respectively.
3.4. Fiber Quality
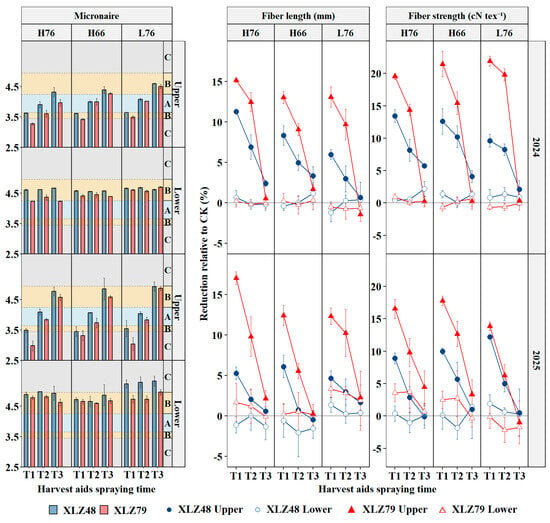
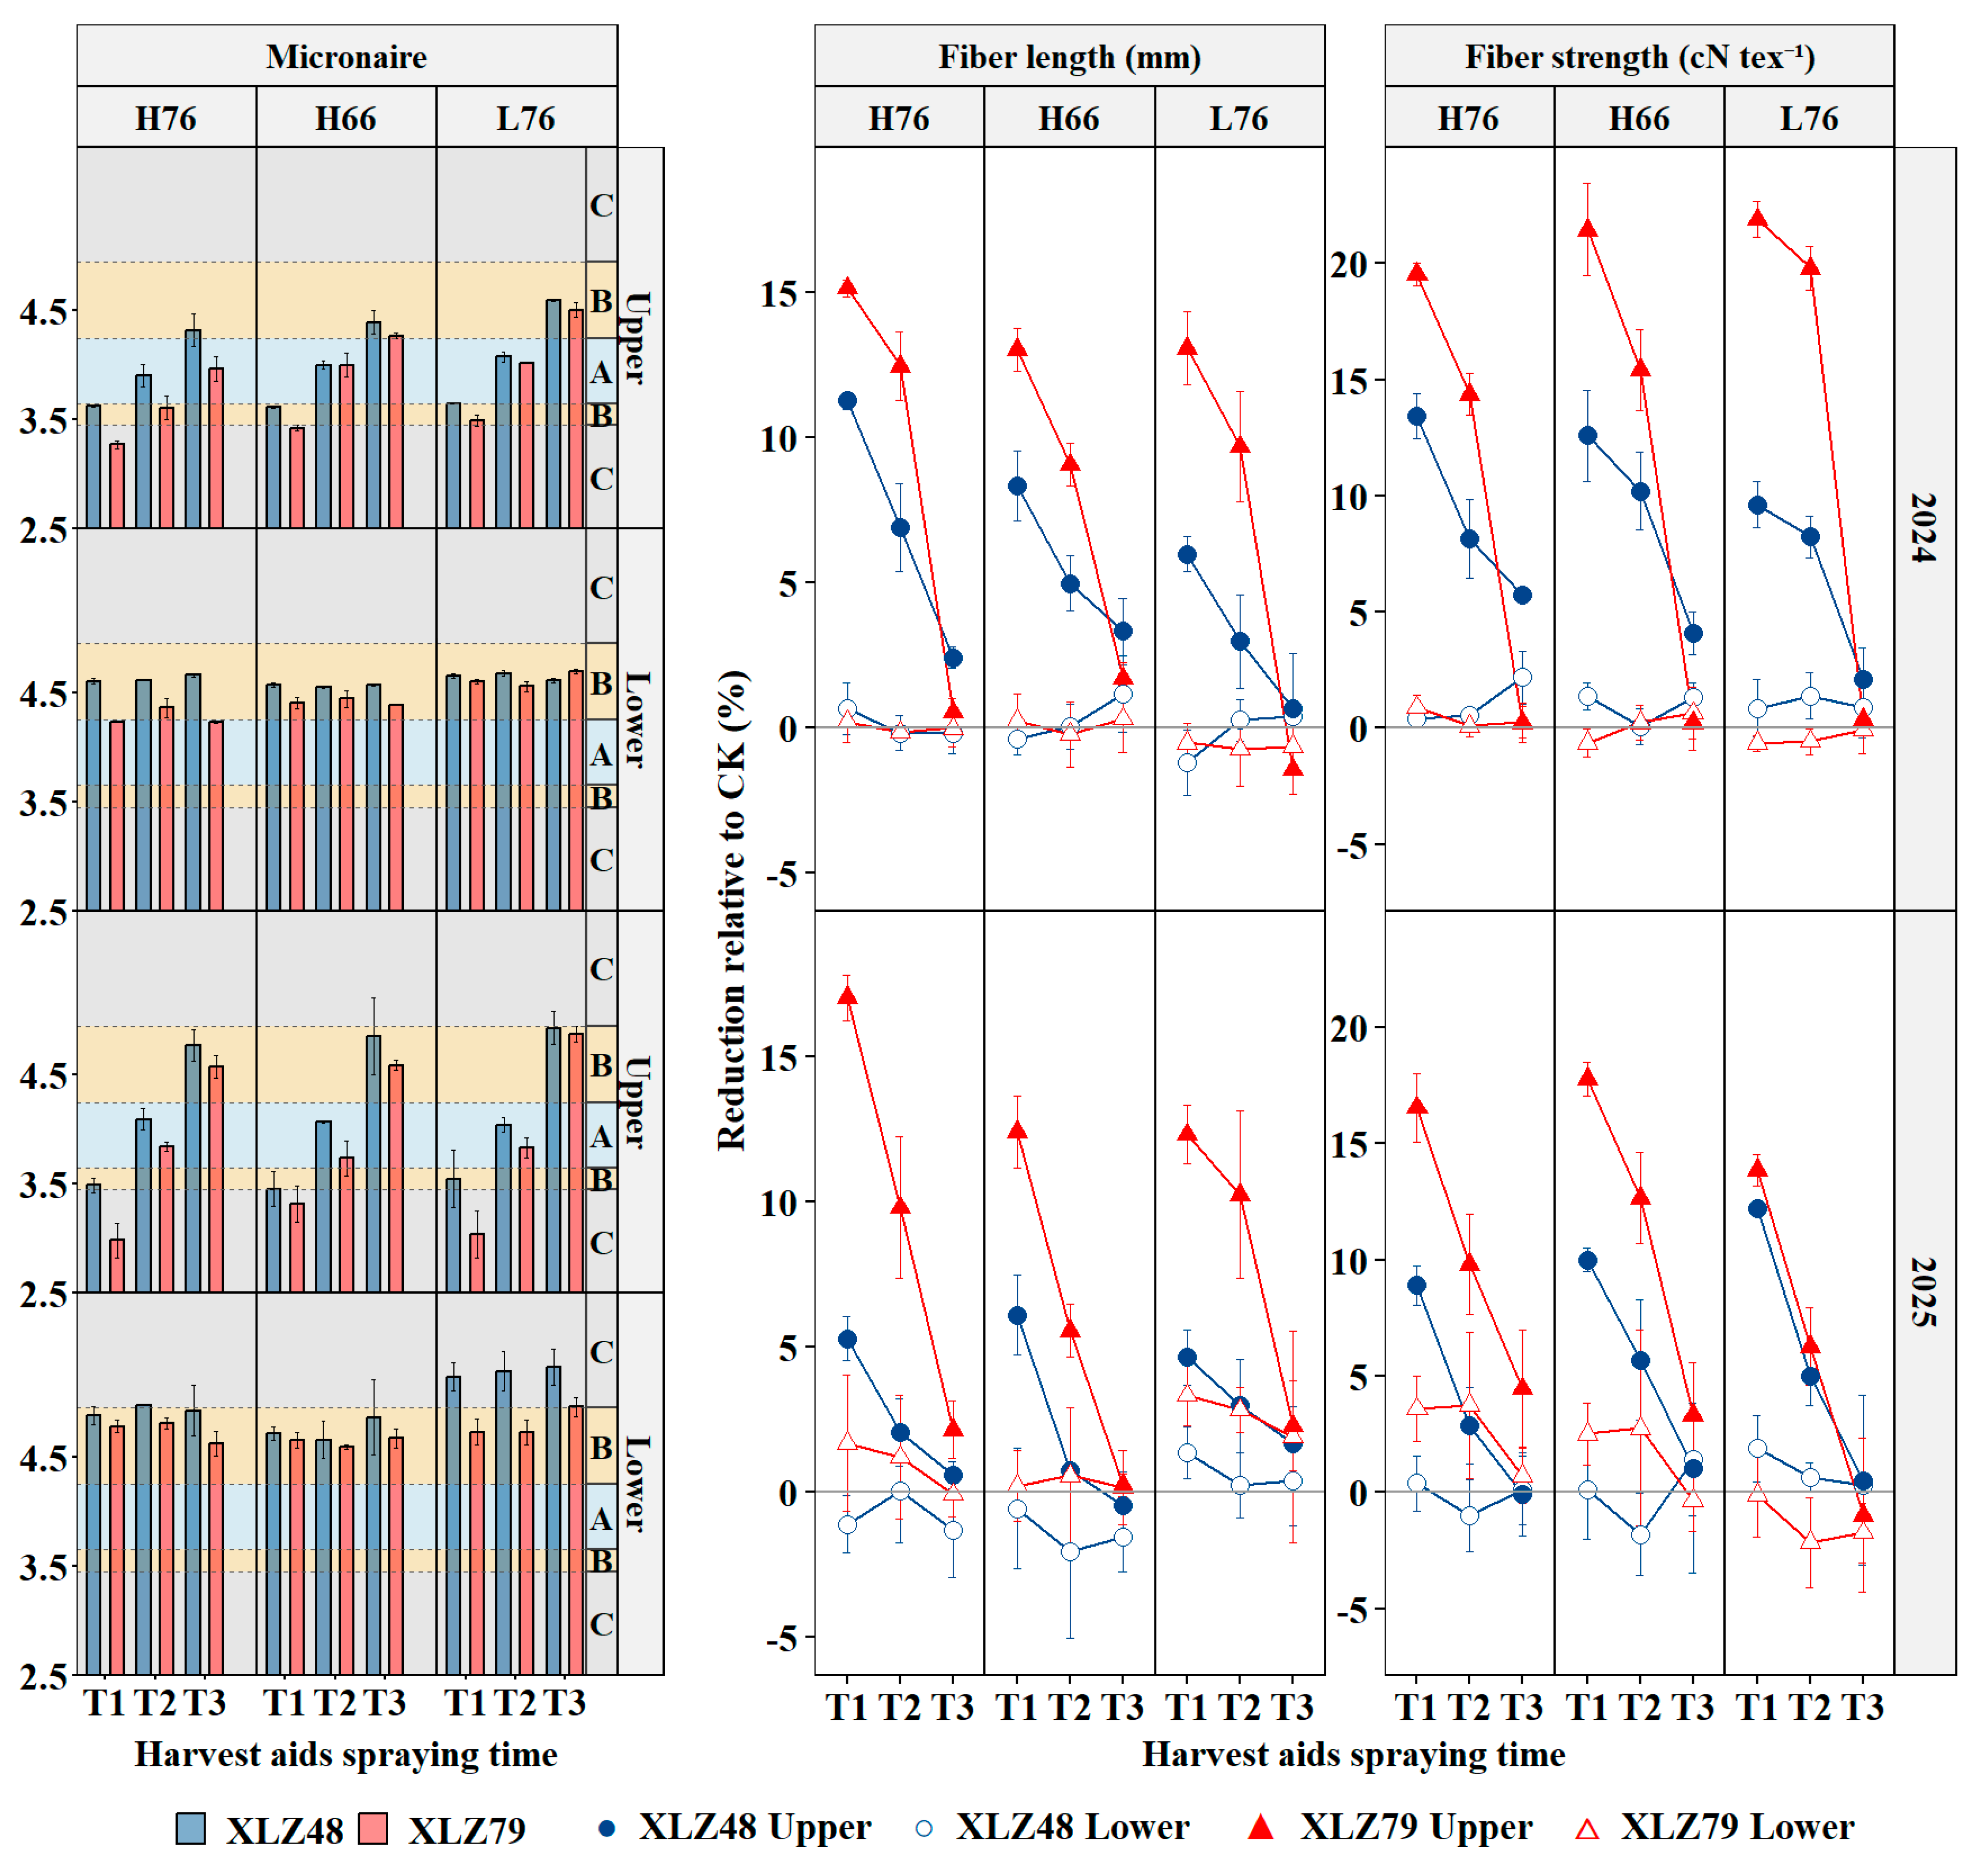
Harvest-aid application significantly reduced the fiber quality of upper-canopy bolls (p < 0.01, Figure 6), but had no significant effect on the fiber quality of middle–lower-canopy bolls (p > 0.05, Figure 6).
Figure 6.
Micronaire value, fiber length, and fiber strength of bolls from the upper and lower canopy portions of machine-harvested cotton in response to harvest-aid spraying time, cultivar, and planting pattern in 2024 and 2025. Fiber length and fiber strength are expressed as reductions relative to the water-sprayed control (CK), whereas micronaire is presented as the measured value, with background shading indicating micronaire grade zones: A (3.7–4.2), B (3.5–3.6 and 4.3–4.9), and C (≤3.4 and ≥5.0). T1, T2, and T3 denote spraying on August 25, September 5, and September 15, respectively; H76, H66, and L76 denote the three planting patterns.
3.4.1. Micronaire Value
In the CK, cultivar and planting pattern showed a significant interaction effect on the boll micronaire value (Table 4). In the same planting pattern, XLZ79 generally exhibited a more favorable micronaire grade than XLZ48. For XLZ79, micronaire values generally followed the order L76 > H66 > H76. Compared with H76, the higher micronaire values under L76 resulted in a one-grade deterioration in micronaire classification, from grade A to B in 2024 and from grade B to C in 2025. For XLZ48, micronaire values generally followed the order L76 > H76 > H66. Compared with CK, harvest-aid application significantly reduced the micronaire value of upper-canopy bolls (p < 0.01). The magnitude of this reduction increased progressively with earlier spraying (Figure 6). At T2, the micronaire of upper-canopy bolls was classified as grade A, whereas at T1 or T3, it fell to grade B or C (Figure 6). The effects of harvest aids on upper-canopy micronaire values did not differ significantly between the two cultivars or among the three planting patterns (p > 0.05).
Table 4.
Fiber length, fiber strength, and micronaire value of cotton in upper and middle–lower canopy portions under the CK treatment according to year, cultivar, and planting pattern.
3.4.2. Fiber Length
Fiber length differed significantly between the two cultivars under the CK treatment (p < 0.05), and was 6.14% and 7.24% lower for XLZ48 than for XLZ79 in the upper and middle–lower canopies, respectively (Table 4). Compared with the CK treatment, harvest-aid application significantly reduced the fiber length of upper-canopy bolls (p < 0.01); this reduction became progressively smaller with delay in spraying time (Figure 6). The fiber length of XLZ48 and XLZ79 at T1 was reduced by 6.96% and 13.86%, respectively, whereas that at T2 was reduced by 3.46% and 9.48%, respectively (Figure 6). Because fiber length reductions differed significantly between the two cultivars, the fiber length of upper-canopy bolls no longer differed significantly between the two cultivars after harvest-aid treatment at T1 and T2 (p > 0.05). At T3, the fiber length reductions for upper-canopy bolls were only 1.39% (XLZ48) and 0.93% (XLZ79), and did not differ significantly between the two cultivars (p > 0.05). The effects of harvest aids on fiber length did not differ significantly among the three planting patterns (p > 0.05, Figure 6). The mean loss and daily mean loss of fiber length varied with spraying time, from 8.44% and 0.36% in the T1–T2 period to 3.81% and 0.53% in the T2–T3 period, respectively.
3.4.3. Fiber Strength
Fiber strength was significantly higher for XLZ79 than for XLZ48 under the CK treatment, by 6.72% and 7.34% in upper- and middle–lower-canopy bolls, respectively (Table 4). Compared with the CK treatment, harvest-aid application reduced the fiber strength of upper-canopy bolls; this reduction became progressively smaller with delay in spraying time (Figure 6). At T1, the fiber strength of both cultivars was significantly decreased (p < 0.01), by 11.16% (XLZ48) and 18.59% (XLZ79); thus, the fiber strength of upper-canopy bolls was 2.21% lower for XLZ79 than for XLZ48 (p < 0.05). At T2, XLZ48 and XLZ79 decreased by 6.73% and 13.18%, respectively (p < 0.01), and the fiber strength of upper-canopy bolls no longer differed significantly between the two cultivars (p > 0.05). At T3, the fiber strength of upper-canopy bolls decreased by only 2.27% (XLZ48) and 1.27% (XLZ79) (p > 0.05). The effects of harvest aids on fiber strength did not differ significantly among the three planting patterns (p > 0.05, Figure 6). The mean loss and daily mean loss of fiber strength varied with spraying time, from 12.41% and 0.45% in the T1–T2 period to 5.86% and 0.82% in the T2–T3 period, respectively.
4. Discussion
In mechanical cotton harvesting, optimizing harvest-aid spraying time is vital for balancing defoliation and boll opening efficacy against yield and fiber length and fiber strength losses [25,26]. In this study, we systematically examined the effects of spraying time on these four aspects, as well as the moderating effects of cultivar selection and planting pattern.
4.1. Effect of Harvest-Aid Spraying Time on the Defoliation Rate of Machine-Harvested Cotton
Spraying at the appropriate time significantly increased the DR of machine-harvested cotton (Table 1 and Figure 3), which is consistent with previous findings [27]. Partitioning the DR into natural and harvest-aid-induced DRs revealed that spraying too early and too late reduced the DR through different mechanisms (Figure 3). At T1, although the ambient temperature was within the optimal range required for defoliant activity (20–30 °C), which favored an increase in ΔDR (Figure 2), the cotton leaves were still in their functional stage, and natural senescence and abscission had not yet begun; thus, the lower NDR resulted in a lower DR than at T2 (Figure 3). At T3, NDR increased to 28.06% but ΔDR decreased to 17.22%; therefore, the DR remained lower than that at T2 (Figure 3). This decrease in ΔDR was attributed to two mechanisms. First, air temperature decreased rapidly after the delay in spraying (Figure 2), which significantly inhibited the activity of thidiazuron and other components of the harvest aids [4]. Second, at the late stage of natural senescence, the physiological metabolism of leaves is weakened and their sensitivity to exogenous chemical signals decreased, resulting in slower abscission layer formation [28]. Therefore, appropriate harvest-aid spraying time selection should be based on leaf physiological status and ambient temperature to ensure rapid defoliation [29].
4.2. Effect of Harvest-Aid Spraying Time on the Boll Opening Rate of Machine-Harvested Cotton
Spraying harvest aids at an appropriate time significantly increased the BOR of machine-harvested cotton (Table 2 and Figure 4), which is consistent with previous findings [13]. Partitioning the BOR into natural and harvest-aid-induced BORs elucidated the mechanisms underlying these differences (Figure 4). When spraying was advanced to T1, because the bolls had not yet reached physiological maturity, natural boll opening decreased and rapid boll opening was difficult to achieve under exogenous stimulation [30]. The combined decrease in NBOR and ΔBOR resulted in a lower BOR at T1 than at T2 (Figure 4). When spraying was delayed to T3, the bolls were more mature and NBOR increased; however, ΔBOR decreased, possibly because the daily mean temperature declined sharply from late September to early October (Figure 2), weakening the physiological response of plants to the chemicals and inhibiting the efficacy of boll opening agents such as ethephon, limiting any promotion of boll opening [31].
4.3. Effects of Harvest-Aid Spraying Time on Yield and Fiber Quality of Cotton
Harvest-aid application accelerates leaf abscission and prematurely terminates the supply of photoassimilates to developing bolls, interrupting normal boll development and significantly reducing boll weight [13,32]. The effects of harvest aids on boll weight and fiber quality differed between canopy positions (Figure 5 and Figure 6). This is because middle–lower-canopy bolls develop earlier and are more mature, whereas upper-canopy bolls develop later [33]; therefore, reductions in boll weight and fiber quality were significantly greater in the upper canopy [27].
With delayed spraying time, both yield and quality losses decreased in a stepwise manner (Figure 5 and Figure 6). Therefore, appropriately delaying the spraying time can extend the physiological window for boll development, allowing immature bolls to continue dry matter accumulation and effectively reducing the impact of forced ripening on the yield and quality of machine-harvested cotton [34,35]. Our results further showed that yield and quality losses differed in their sensitivity to spraying time (Figure 5 and Figure 6). When spraying time changed from the T1–T2 period to the T2–T3 period, the daily change in seed cotton yield loss decreased from 0.95% to 0.36% (Figure 5), whereas the daily change in fiber length loss increased from 0.36% to 0.53% (Figure 6). These interval-averaged rates suggest that yield and fiber-quality losses responded differently to spraying time across the two intervals. Once boll weight and yield formation gradually stabilized, the fibers of upper-canopy bolls may still have been in the quality formation stage, and delaying spraying may have preserved a longer period of normal fiber development, further reducing quality loss. Recent studies have shown that, after harvest-aid application, fiber cellulose accumulation and fiber strength formation are maintained through the remobilization of non-structural carbohydrates from the boll shell, further indicating that fiber quality formation does not terminate immediately upon spraying [36]. This result has practical value for balancing the effects of harvest-aid spraying time on cotton yield and quality.
4.4. Effects of Cultivar on Harvest-Aid Spraying Time and Efficacy
For defoliation and BORs, the interaction between cultivar and spraying time varied with year and sampling time (Table 2), indicating that differences in defoliation and boll opening among cultivars are susceptible to external environmental factors and are not stable [37]. Crop productivity responses to cultivation practices and operation timing may vary considerably between growing seasons owing to differences in weather conditions [38]. Therefore, poor defoliation and boll opening efficacy caused by inappropriate spraying time cannot be easily mitigated through cultivar selection, and neither of the two cultivars used in this study changed the pattern of spraying time effects on defoliation and BORs (Figure 3 and Figure 4). Defoliation responses are regulated by signaling pathways such as ethylene and cytokinin [15,39]; thus, cultivar differences in these responses may originate from genotypic differences in signaling sensitivity [40]. Boll opening is likewise regulated by hormonal signals such as ethylene, and exogenous ethylene and boll opening agents such as ethephon accelerate boll dehiscence by releasing ethylene [30,41,42]. Cultivar differences in boll opening progression may be related to maturation stage, with early-maturing cultivars developing faster and exhibiting earlier and more concentrated boll opening; such earliness-related traits show significant genetic variation among cultivars and are affected by environmental conditions [5,43]. However, the interaction mechanisms between the regulatory pathways of boll opening, defoliation, and environmental factors require further research.
Regarding fiber quality, the micronaire grade, fiber length, and fiber strength of XLZ79 were significantly better than those of XLZ48 under control conditions (Table 4). Most interaction terms involving cultivar were not significant, suggesting that cultivar differences were generally consistent across years and planting patterns. However, the significance of some interaction terms indicates that cultivar effects were not entirely independent of year and planting pattern. Genetic background may therefore contribute to the observed differences in fiber quality between cultivars [44]. Nevertheless, the expression of some fiber traits may also be modified by year and planting pattern. After harvest-aid application (Figure 6), cultivar selection did not have a significant effect on micronaire value (p > 0.05), but had highly significant effects on fiber length and strength (p < 0.01). When spraying time was advanced to T1, the adverse effects of harvest aids on the fiber length and strength of upper-canopy bolls were significantly greater in XLZ79 than in XLZ48 (p < 0.01, Figure 6). However, when spraying time was delayed to T3, these adverse effects decreased to within 2.3% for both cultivars (p > 0.05, Figure 6). This may be because fibers of higher quality require a longer physiological development period [2,13,45]; therefore, selecting an appropriate spraying time may be more important for such cultivars.
4.5. Effects of Planting Pattern on Harvest-Aid Spraying Time and Efficacy
Planting pattern showed a significant independent main effect on DR and BOR by modifying NDR and NBOR (Table 1), with an overall trend of L76 > H66 > H76 (Figure 3 and Figure 4). This indicates that optimizing the row-spacing configuration (H66 vs. H76) or reducing planting density (L76 vs. H76) can effectively improve canopy defoliation and boll opening, which is inconsistent with the results of Wang et al. [23]. Our results further demonstrated that the effects of planting pattern on defoliation and boll opening were mainly attributed to changes in canopy NDR and NBOR. This may be because reducing the planting density (L76) or optimizing the row-spacing configuration (H66) improves ventilation, temperature, and light within the canopy, which favors normal growth and development [46,47] and timely senescence and maturation [48,49] among middle- and upper-canopy leaves and bolls, facilitating natural leaf abscission and boll opening. For the same reason, losses of upper-canopy seed cotton yield, lint yield, and boll weight after harvest-aid application followed an overall trend of L76 < H66 < H76 (Figure 5). However, planting pattern did not show a similar regulatory effect on fiber quality (Figure 6), which further confirms that the yield and quality of upper-canopy bolls respond asynchronously to harvest aids (Figure 5 and Figure 6).
The interaction between planting pattern and spraying time was generally not significant (Table 1), suggesting that the effects of planting pattern should be interpreted primarily as an independent main effect. These independent effects suggest that planting-pattern adjustment may help improve defoliation, boll opening, and upper-canopy yield performance when spraying time is suboptimal; however, they do not establish that it offsets the adverse effects of spraying time. For example, overall defoliation and BORs first increased then decreased as spraying time was delayed (Figure 3 and Figure 4). Under the H76 pattern, advancing the spraying time from T2 to T1 (by 11 days) decreased the DR and BOR from 83.92% to 71.17% and from 95.92% to 73.17%, respectively. However, under the L76 pattern, even when spraying time was advanced to T1, the DR and BOR still reached 85.25% and 80.67%. Similarly, when spraying time was delayed from T2 to T3 (by 10 days), the DR and BOR of H76 decreased to 72.58% and 87.58%, respectively, whereas those of L76 still reached 83.17% and 96.50% (Figure 3 and Figure 4). Overall, yield loss increased with earlier spraying time (Figure 5). Localized modification of soil conditions can influence plant development and yield formation and therefore should be considered when evaluating agronomic responses [50]. Advancing the spraying time from T2 to T1 (by 11 days) increased the yield loss from 14.25% to 23.67% under the H76 pattern, but only to 18.33% under the L76 pattern (Figure 5). Wang et al. showed that adjusting the row spacing and reasonably reducing planting density can optimize the planting pattern of machine-harvested cotton, improving defoliation and promoting early boll opening while maintaining stable yield without reducing fiber quality [23]. Our results further demonstrate that planting pattern had independent effects on cotton defoliation, boll opening, and yield performance across the tested spraying times and under the conditions and cultivars tested, providing an additional option for agronomic management when optimal harvest-aid spraying time is difficult to achieve. However, treatment allocation was systematic rather than randomized, meaning that treatment effects could not be fully separated from spatial variation within the field. Although cultivar positions were exchanged and planting-pattern positions were partially changed between years, this limitation could not be eliminated. The hierarchical analysis accounted for variation among experimental levels but did not remove potential confounding between treatment and field position. The findings should therefore be interpreted in the context of the experimental conditions and field arrangement used in this study.
5. Conclusions
Spraying time was a key determinant of harvest-aid efficacy in machine-harvested cotton, significantly affecting DR, BOR, yield, and fiber quality. Both early and late spraying reduced DR and BOR. At T1, the lower rates were associated with lower natural defoliation and boll opening (NDR and NBOR), whereas at T3, they were associated with lower harvest-aid-induced components (ΔDR and ΔBOR). Earlier spraying resulted in greater yield losses and greater reductions in fiber length and strength in upper-canopy bolls. Micronaire values also varied with spraying time, with grade A observed at T2 and grades B or C at T1 and T3, indicating that yield and fiber-quality traits responded differently to spraying time. For defoliation and BOR, the cultivar × spraying-time interaction varied by year and sampling time, suggesting that cultivar differences were influenced by environmental conditions and were not consistent across years. Cultivar had no significant effect on yield losses caused by harvest-aid application but significantly affected fiber length and strength losses. Thus, cultivar selection alone may not reliably mitigate poor defoliation and boll opening efficacy resulting from suboptimal spraying times. In contrast, planting pattern had significant independent main effects on defoliation, boll opening, and upper-canopy yield by modifying natural defoliation and boll opening. The planting pattern × spraying time interaction was generally not significant, supporting the interpretation that planting-pattern effects were primarily independent of spraying time. Under the conditions of this two-year field experiment in Xinjiang, reducing planting density or modifying row-spacing configuration may therefore offer practical options for improving DR and BOR and reducing upper-canopy yield losses when the optimal harvest-aid spraying time is difficult to determine.
Author Contributions
Conceptualization, S.L. (Saisai Liu), T.H. (Tingli Hao) and T.H. (Tongyu Hou); Methodology, S.L. (Saisai Liu), T.H. (Tingli Hao) and T.H. (Tongyu Hou); Software, S.L. (Saisai Liu); Validation, S.L. (Saisai Liu); Formal analysis, S.L. (Saisai Liu) and T.H. (Tongyu Hou); Investigation, S.L. (Saisai Liu), X.M., S.L. (Shihao Liu), J.L. and S.Z.; Resources, S.L. (Saisai Liu); Data curation, S.L. (Saisai Liu); Writing—original draft, S.L. (Saisai Liu), T.H. (Tingli Hao) and T.H. (Tongyu Hou); Writing—review & editing, S.L. (Saisai Liu), T.H. (Tingli Hao) and T.H. (Tongyu Hou); Visualization, S.L. (Saisai Liu); Supervision, T.H. (Tingli Hao) and T.H. (Tongyu Hou); Project administration, T.H. (Tingli Hao) and T.H. (Tongyu Hou); Funding acquisition, T.H. (Tingli Hao) and T.H. (Tongyu Hou). All authors have read and agreed to the published version of the manuscript.
Funding
This research was funded by National Natural Science Foundation of China (32301696, 32160419), Tianshan Talent Training Program (2024TSYCCX0122), Young innovative talent program of Shihezi University (CXBJ202308), and Youth science and technology innovation backbone talent program of 8th Shi (2024RC04).
Data Availability Statement
The raw data supporting the conclusions of this article will be made available by the authors on request.
Conflicts of Interest
The authors declare no conflicts of interest.
References
- Zhou, Y.; Li, F.; Xin, Q.; Li, Y.; Lin, Z. Historical Variability of Cotton Yield and Response to Climate and Agronomic Management in Xinjiang, China. Sci. Total Environ. 2024, 912, 169327. [Google Scholar] [CrossRef] [Scilit]
- Zhang, Q.; Sun, Y.; Luo, D.; Li, P.; Liu, T.; Xiang, D.; Zhang, Y.; Yang, M.; Gou, L.; Tian, J.; et al. Harvest Aids Applied at Appropriate Time Could Reduce the Damage to Cotton Yield and Fiber Quality. Agronomy 2023, 13, 664–678. [Google Scholar] [CrossRef] [Scilit]
- Meng, L.; Zhang, L.; Qi, H.; Du, M.; Zuo, Y.; Zhang, M.; Tian, X.; Li, Z. Optimizing the Application of a Novel Harvest Aid to Improve the Quality of Mechanically Harvested Cotton in the North China Plain. J. Integr. Agric. 2021, 20, 2892–2899. [Google Scholar] [CrossRef] [Scilit]
- Shu, H.; Sun, S.; Wang, X.; Yang, C.; Zhang, G.; Meng, Y.; Wang, Y.; Hu, W.; Liu, R. Low Temperature Inhibits the Defoliation Efficiency of Thidiazuron in Cotton by Regulating Plant Hormone Synthesis and the Signaling Pathway. Int. J. Mol. Sci. 2022, 23, 14208. [Google Scholar] [CrossRef] [Scilit]
- Gwathmey, C.O.; Bange, M.P.; Brodrick, R. Cotton Crop Maturity: A Compendium of Measures and Predictors. Field Crops Res. 2016, 191, 41–53. [Google Scholar] [CrossRef] [Scilit]
- Bange, M.P.; Long, R.L. Optimizing Timing of Chemical Harvest Aid Application in Cotton by Predicting Its Influence on Fiber Quality. Agron. J. 2011, 103, 390–395. [Google Scholar] [CrossRef] [Scilit]
- Su, N.; Chen, M.; Yin, C.; Wang, K.; Chen, S.; Wang, Z.; Liu, L.; Zhao, Y.; Tang, Q. Cotton Boll Extraction and Boll Number Estimation from UAV RGB Imagery Before and After Defoliation. Agronomy 2026, 16, 617. [Google Scholar] [CrossRef] [Scilit]
- Chen, Y.; Evers, J.B.; Yang, M.; Wang, X.; Zhang, Z.; Sun, S.; Zhang, Y.; Wang, S.; Ji, F.; Xiang, D.; et al. Cotton Crop Transpiration Reveals Opportunities to Reduce Yield Loss When Applying Defoliants for Efficient Mechanical Harvesting. Field Crops Res. 2024, 309, 109304. [Google Scholar] [CrossRef] [Scilit]
- Wang, Y.; Xiao, C.; Li, K.; Meng, L.; Song, X.; Qi, H.; Wang, Y.; Zhang, Z.; Yu, X.; Li, F.; et al. Quantifying the Influencing Factors and Predictive Analysis of Cotton Defoliation and Maturation Based on Machine Learning. Comput. Electron. Agric. 2025, 237, 110555. [Google Scholar] [CrossRef] [Scilit]
- Jiang, F.; Hu, R.; Zhang, Y.; Li, X.; Tong, L. Variations and Trends of Onset, Cessation and Length of Climatic Growing Season over Xinjiang, NW China. Theor. Appl. Climatol. 2011, 106, 449–458. [Google Scholar] [CrossRef] [Scilit]
- Li, N.; Lin, H.; Wang, T.; Li, Y.; Liu, Y.; Chen, X.; Hu, X. Impact of Climate Change on Cotton Growth and Yields in Xinjiang, China. Field Crops Res. 2020, 247, 107590. [Google Scholar] [CrossRef] [Scilit]
- Zhang, Z.; Wang, Y.; Yu, X.; Yu, K.; Hou, H.; Liao, Q.; Li, K.; Shi, Z.; Dong, J.; Chen, G.; et al. Optimizing Harvest Aid Applications for Mechanical Cotton Harvesting: A Meta-Analysis of Defoliation–Yield Trade-Offs Driven by Crop Physiology and Environmental Factors. Field Crops Res. 2026, 336, 110214. [Google Scholar] [CrossRef] [Scilit]
- Wang, L.; Deng, Y.; Kong, F.; Duan, B.; Saeed, M.; Xin, M.; Wang, X.; Gao, L.; Shen, G.; Wang, J.; et al. Evaluating the Effects of Defoliant Spraying Time on Fibre Yield and Quality of Different Cotton Cultivars. J. Agric. Sci. 2023, 161, 205–216. [Google Scholar] [CrossRef] [Scilit]
- Li, F.; Wu, Q.; Liao, B.; Yu, K.; Huo, Y.; Meng, L.; Wang, S.; Wang, B.; Du, M.; Tian, X.; et al. Thidiazuron Promotes Leaf Abscission by Regulating the Crosstalk Complexities between Ethylene, Auxin, and Cytokinin in Cotton. Int. J. Mol. Sci. 2022, 23, 2696. [Google Scholar] [CrossRef] [Scilit]
- Xu, J.; Chen, L.; Sun, H.; Wusiman, N.; Sun, W.; Li, B.; Gao, Y.; Kong, J.; Zhang, D.; Zhang, X.; et al. Crosstalk between Cytokinin and Ethylene Signaling Pathways Regulates Leaf Abscission in Cotton in Response to Chemical Defoliants. J. Exp. Bot. 2019, 70, 1525–1538. [Google Scholar] [CrossRef] [Scilit]
- Orgaz, F.; Mateos, L.; Fereres, E. Season Length and Cultivar Determine the Optimum Evapotranspiration Deficit in Cotton. Agron. J. 1992, 84, 700–706. [Google Scholar] [CrossRef] [Scilit]
- Bange, M.P.; Long, R.L.; Constable, G.A.; Gordon, S.G. Minimizing Immature Fiber and Neps in Upland Cotton. Agron. J. 2010, 102, 781–789. [Google Scholar] [CrossRef] [Scilit]
- Yang, G.; Luo, X.; Nie, Y.; Zhang, X. Effects of Plant Density on Yield and Canopy Micro Environment in Hybrid Cotton. J. Integr. Agric. 2014, 13, 2154–2163. [Google Scholar] [CrossRef] [Scilit]
- Marois, J.J.; Wright, D.L.; Wiatrak, P.J.; Vargas, M.A. Effect of Row Width and Nitrogen on Cotton Morphology and Canopy Microclimate. Crop Sci. 2004, 44, 870–877. [Google Scholar] [CrossRef] [Scilit]
- Dai, J.; Li, W.; Tang, W.; Zhang, D.; Li, Z.; Lu, H.; Eneji, A.E.; Dong, H. Manipulation of Dry Matter Accumulation and Partitioning with Plant Density in Relation to Yield Stability of Cotton under Intensive Management. Field Crops Res. 2015, 180, 207–215. [Google Scholar] [CrossRef] [Scilit]
- Zhang, D.; Luo, Z.; Liu, S.; Li, W.; Tang, W.; Dong, H. Effects of Deficit Irrigation and Plant Density on the Growth, Yield and Fiber Quality of Irrigated Cotton. Field Crops Res. 2016, 197, 1–9. [Google Scholar] [CrossRef] [Scilit]
- Bednarz, C.W.; Shurley, W.D.; Anthony, W.S.; Nichols, R.L. Yield, Quality, and Profitability of Cotton Produced at Varying Plant Densities. Agron. J. 2005, 97, 235–240. [Google Scholar] [CrossRef] [Scilit]
- Wang, F.; Han, H.; Lin, H.; Chen, B.; Kong, X.; Ning, X.; Wang, X.; Yu, Y.; Liu, J. Effects of Planting Patterns on Yield, Quality, and Defoliation in Machine-Harvested Cotton. J. Integr. Agric. 2019, 18, 2019–2028. [Google Scholar] [CrossRef] [Scilit]
- Standard’s GB/T 20392-2023; Test Method for Physical Properties of Cotton Fibers—High Volume Instruments Method. China Standards Press: Beijing, China, 2023.
- Song, X.; Zhang, L.; Zhao, W.; Xu, D.; Eneji, A.E.; Zhang, X.; Han, H.; Cao, L.; Zhang, W.; Lu, Z.; et al. The Relationship between Boll Retention and Defoliation of Cotton at the Fruiting Site Level. Crop Sci. 2022, 62, 1333–1347. [Google Scholar] [CrossRef] [Scilit]
- Xie, Z.; Rong, Z.; Qin, Y.; Liu, A.; Wang, Q. Optimizing Defoliant Application Timing to Improve Boll Opening, Fiber Quality, and Yield in Summer-Sown Short-Season Cotton in Hunan, China. Agriculture 2026, 16, 388. [Google Scholar] [CrossRef] [Scilit]
- Sriram, J.; Kannan, S.V.; Ragavan, T.; Sheeba, S.; Sivasankari, B. Mechanization in Cotton Farming: Addressing Labor Shortages and Enhancing Productivity in India. J. Sci. Res. Rep. 2024, 30, 617–630. [Google Scholar] [CrossRef] [Scilit]
- Shu, H.; Sun, S.; Wang, X.; Chen, J.; Yang, C.; Zhang, G.; Han, H.; Li, Z.; Liang, T.; Liu, R. Thidiazuron Combined with Cyclanilide Modulates Hormone Pathways and ROS Systems in Cotton, Increasing Defoliation at Low Temperatures. Front. Plant Sci. 2024, 15, 1333816. [Google Scholar] [CrossRef] [Scilit]
- Xie, Z.; Xie, X.; Qin, Y.; Yang, D.; Zhou, Z.; Wang, Q.; Liu, A.; Tu, X. Advances in Cotton Harvesting Aids. Front. Plant Sci. 2025, 16, 1570251. [Google Scholar] [CrossRef] [Scilit]
- Zhao, G.; Guo, D.; Sui, Z.; Guo, Y.; Zheng, H. Functional Regulation by Ethylene throughout the Cotton Life Cycle. Plant Sci. 2026, 364, 112922. [Google Scholar] [CrossRef] [Scilit]
- Huang, J.; Zhao, X.; Bürger, M.; Chory, J.; Wang, X. The Role of Ethylene in Plant Temperature Stress Response. Trends Plant Sci. 2023, 28, 808–824. [Google Scholar] [CrossRef] [Scilit]
- Zhang, Q.; Luo, D.; Sun, Y.; Li, P.; Xiang, D.; Zhang, Y.; Yang, M.; Gou, L.; Tian, J.; Zhang, W. Cotton Harvest Aids Promote the Translocation of Bur-Stored Photoassimilates to Enhance Single Boll Weight. Ind. Crops Prod. 2023, 195, 116375. [Google Scholar] [CrossRef] [Scilit]
- Pabuayon, I.L.B.; Kelly, B.R.; Mitchell-McCallister, D.; Coldren, C.L.; Ritchie, G.L. Cotton Boll Distribution: A Review. Agron. J. 2021, 113, 956–970. [Google Scholar] [CrossRef] [Scilit]
- Abuduaini, M.; Cheng, H.; Song, X.; Wu, G.; Li, X.; Tian, Y.; Zhang, J.; Wang, W.; Yang, S.; Meng, Z.; et al. Effect of Fungicide Application in Combination with Different Growth Regulators on Cotton Boll Quality and Yield in the Northwest Inland of China. Agronomy 2025, 15, 394. [Google Scholar] [CrossRef] [Scilit]
- Chen, Y.; Xie, C.; Dong, S.; Zhang, X.; Chen, D.; Liu, Z. Optimized Canopy Photosynthetic Capacity Increases Sink/Source Ratio and Yield of High Density Cotton Sowed after Wheat Harvest. Ind. Crops Prod. 2025, 234, 121568. [Google Scholar] [CrossRef] [Scilit]
- Zhang, Q.; Liu, T.; Tang, C.; Zhou, J.; Zhang, Y.; Du, M.; Yang, M.; Gou, L.; Tian, J.; Zhang, W. The Remobilization of Non-Structural Carbohydrates Stored in the Capsule Wall Can Mitigate Cotton Fiber Strength Damage Caused by Harvest Aids. Plant Physiol. Biochem. 2025, 223, 109867. [Google Scholar] [CrossRef] [Scilit]
- Campbell, B.T.; Jones, M.A. Assessment of Genotype × Environment Interactions for Yield and Fiber Quality in Cotton Performance Trials. Euphytica 2005, 144, 69–78. [Google Scholar] [CrossRef] [Scilit]
- Syromyatnikov, Y.; Semenenko, I.; Orekhovskaya, A.; Troyanovskaya, I.; Bedenko, I.; Sakhapov, R. Influence of Cultivation Technology on the Yield of Winter Wheat. E3S Web Conf. 2023, 443, 02001. [Google Scholar] [CrossRef] [Scilit]
- Stewart, A.M.; Edmisten, K.L.; Wells, R. Boll Openers in Cotton: Effectiveness and Environmental Influences. Field Crops Res. 2000, 67, 83–90. [Google Scholar] [CrossRef] [Scilit]
- Jin, D.; Xu, Y.; Gui, H.; Zhang, H.; Dong, Q.; Sikder, R.K.; Wang, X.; Yang, G.; Song, M. Evaluation of Cotton (Gossypium Hirsutum L.) Leaf Abscission Sensitivity Triggered by Thidiazuron through Membership Function Value. Plants 2020, 10, 49. [Google Scholar] [CrossRef] [Scilit]
- Wang, S.; Sun, H.; Zhu, L.; Zhang, K.; Zhang, Y.; Zhang, H.; Zhu, J.; Liu, X.; Bai, Z.; Li, A.; et al. Effects of Spraying with Ethephon and Early Topping on the Growth, Yield, and Earliness of Cotton under Late-Sowing and High-Density Cultivation Modes. Agronomy 2023, 13, 1244. [Google Scholar] [CrossRef] [Scilit]
- Lipe, J.A.; Morgan, P.W. Ethylene: Role in Fruit Abscission and Dehiscence Processes. Plant Physiol. 1972, 50, 759–764. [Google Scholar] [CrossRef] [Scilit]
- Su, J.; Pang, C.; Wei, H.; Li, L.; Liang, B.; Wang, C.; Song, M.; Wang, H.; Zhao, S.; Jia, X.; et al. Identification of Favorable SNP Alleles and Candidate Genes for Traits Related to Early Maturity via GWAS in Upland Cotton. BMC Genom. 2016, 17, 687. [Google Scholar] [CrossRef] [Scilit]
- Fang, L.; Wang, Q.; Hu, Y.; Jia, Y.; Chen, J.; Liu, B.; Zhang, Z.; Guan, X.; Chen, S.; Zhou, B.; et al. Genomic Analyses in Cotton Identify Signatures of Selection and Loci Associated with Fiber Quality and Yield Traits. Nat. Genet. 2017, 49, 1089–1098. [Google Scholar] [CrossRef] [Scilit]
- Wang, Y.; Xiao, C.; Wang, Y.; Li, K.; Yu, K.; Geng, J.; Li, Q.; Yang, J.; Zhang, J.; Zhang, M.; et al. Monitoring of Cotton Boll Opening Rate Based on UAV Multispectral Data. Remote Sens. 2023, 16, 132. [Google Scholar] [CrossRef] [Scilit]
- Hu, L.; Pan, X.; Wang, X.; Hu, Q.; Wang, X.; Zhang, H.; Xue, Q.; Song, M. Cotton Photosynthetic Productivity Enhancement through Uniform Row-spacing with Optimal Plant Density in Xinjiang, China. Crop Sci. 2021, 61, 2745–2758. [Google Scholar] [CrossRef] [Scilit]
- Zhang, N.; Tian, L.; Feng, L.; Xu, W.; Li, Y.; Xing, F.; Fan, Z.; Xiong, S.; Tang, J.; Li, C.; et al. Boll Characteristics and Yield of Cotton in Relation to the Canopy Microclimate under Varying Plant Densities in an Arid Area. PeerJ 2021, 9, e12111. [Google Scholar] [CrossRef] [Scilit]
- Zuo, W.; Wu, B.; Wang, Y.; Xu, S.; Chen, M.; Liang, F.; Tian, J.; Zhang, W. Optimal Row Spacing Configuration to Improve Cotton Yield or Quality Is Regulated by Plant Density and Irrigation Rate. Field Crops Res. 2024, 305, 109187. [Google Scholar] [CrossRef] [Scilit]
- Dong, H.; Li, W.; Eneji, A.E.; Zhang, D. Nitrogen Rate and Plant Density Effects on Yield and Late-Season Leaf Senescence of Cotton Raised on a Saline Field. Field Crops Res. 2012, 126, 137–144. [Google Scholar] [CrossRef] [Scilit]
- Pashchenko, V.F.; Syromyatnikov, Y.U.N.; Hramov, N.S.; Vojnash, S.A. The Influence of Local Loosening of the Soil on Soybean Productivity. Tract. Agric. Mach. 2019, 86, 79–86. [Google Scholar] [CrossRef] [Scilit]

Disclaimer/Publisher’s Note: The statements, opinions and data contained in all publications are solely those of the individual author(s) and contributor(s) and not of MDPI and/or the editor(s). MDPI and/or the editor(s) disclaim responsibility for any injury to people or property resulting from any ideas, methods, instructions or products referred to in the content. |
© 2026 by the authors. Licensee MDPI, Basel, Switzerland. This article is an open access article distributed under the terms and conditions of the Creative Commons Attribution (CC BY) license.